1
V JORNADAS IBEROAMERICANAS DE FINANCIAMIENTO LOCAL
A subnational resource curse? Revenue Windfalls and the
Quality of Public Spending in Colombian municipalities
Martín Ardanaz Nuria Tolsá Caballero
Santiago de Compostela, octubre de 2016
1
Contents Introduction .................................................................................................................................................. 3
1. Background ........................................................................................................................................... 5
2. Data ........................................................................................................................................................... 9
3. Evidence .................................................................................................................................................. 10
3.1. The impact of fiscal windfalls on revenue and expenditure patterns ............................................. 11
3.2 Efficiency of local public good provision ........................................................................................... 12
3.2.1 Determinants of public spending efficiency at the local level ................................................... 13
3.2.2 Robustness checks ..................................................................................................................... 15
3.3. Revenue windfalls and corruption ................................................................................................... 18
Conclusions ................................................................................................................................................. 21
Appendices .................................................................................................................................................. 23
APPENDIX A. methodology for the distribution of royalty payments from the FNR .............................. 23
APPENDIX B. The New System (2012 on) ................................................................................................ 23
Appendix C. The determinants of expenditure efficiency using DEA (IV 2SLS with coal as instrument) 25
References .................................................................................................................................................. 28
Figures Figure 1- Production of oil and coal .............................................................................................................. 6
Figure 2- Evolution of royalty payments and shares across SNGs ................................................................ 7
Figure 3-Evolution of international prices of oil and coal ............................................................................. 8
Figure 4- Royalty Payments .......................................................................................................................... 9
Figure 5-Distribution of municipal efficiency scores, by department ........................................................ 13
Figure 6-Marginal effect of royalties on spending efficiency, with 95% confidence intervals ................... 15
Figure 7-Quantile regression coefficients ................................................................................................... 18
Figure 8 - Marginal effects of royalties on incidence of corruption, with 95% confidence intervals ......... 20
Tables Table 1-The effects of royalty payments on municipal revenues and expenditures (fixed effects) .......... 11
Table 2-The determinants of expenditure efficiency using DEA (Tobit regressions) ................................. 14
Table 3- The determinants of expenditure efficiency using DEA (IV 2SLS) ................................................. 16
Table 4 - The determinants of expenditure efficiency using FDH (Tobit regressions)................................ 17
Table 5 - Determinants of the incidence and size of irregularities (Tobit and OLS regressions) ................ 19
Maps Map 1 - Distribution of royalty payments in Colombia (average 2004-2011) ........................................... 27
2
A subnational resource curse? Revenue Windfalls and the
Quality of Public Spending in Colombian municipalities
Martin Ardanaz**
Inter-American Development Bank
Nuria Tolsa Caballero***
Inter-American Development Bank
Abstract
This paper explores the impact of revenue windfalls from oil and mineral resources on the
quality of public expenditures across Colombian local level governments during the latest
commodity price cycle. Exploiting subnational variation induced by the allocation rules of
natural resource transfers, we estimate the effects of receiving additional revenue windfalls on
three outcomes of interest: composition and level of public spending, efficiency of government
expenditures in the water & sanitation and health sectors, and the extent of corruption. Based on
a dataset comprising more than 1000 municipalities between 2004 and 2011, this paper finds that
while revenue windfalls are accompanied by expenditure increases across all types of sectors, a
non-monotonic relationship emerges between the efficiency of spending, the extent of corruption
and the level of natural resource transfers: municipalities that were extremely favored by the
commodity boom where more inefficient and more likely to engage in corrupt behavior whereas
those benefited with modest transfers were more efficient and less corrupt.
**
Corresponding author: Inter-American Development Bank, Boulevard Jean Paul Genie, Managua,
Nicaragua. E-mail: [email protected] ***
Inter-American Development Bank, 1300 New York Avenue, N.W., Washington, DC 20577, USA. E-
mail: [email protected]
3
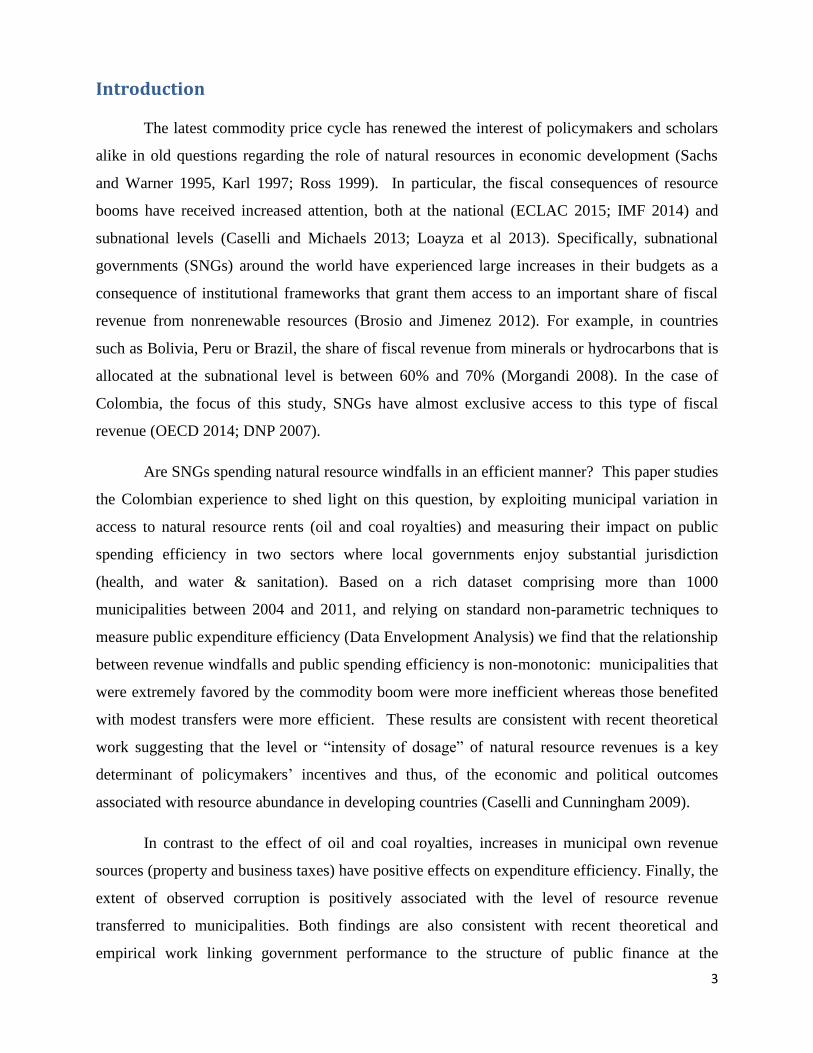
Introduction
The latest commodity price cycle has renewed the interest of policymakers and scholars
alike in old questions regarding the role of natural resources in economic development (Sachs
and Warner 1995, Karl 1997; Ross 1999). In particular, the fiscal consequences of resource
booms have received increased attention, both at the national (ECLAC 2015; IMF 2014) and
subnational levels (Caselli and Michaels 2013; Loayza et al 2013). Specifically, subnational
governments (SNGs) around the world have experienced large increases in their budgets as a
consequence of institutional frameworks that grant them access to an important share of fiscal
revenue from nonrenewable resources (Brosio and Jimenez 2012). For example, in countries
such as Bolivia, Peru or Brazil, the share of fiscal revenue from minerals or hydrocarbons that is
allocated at the subnational level is between 60% and 70% (Morgandi 2008). In the case of
Colombia, the focus of this study, SNGs have almost exclusive access to this type of fiscal
revenue (OECD 2014; DNP 2007).
Are SNGs spending natural resource windfalls in an efficient manner? This paper studies
the Colombian experience to shed light on this question, by exploiting municipal variation in
access to natural resource rents (oil and coal royalties) and measuring their impact on public
spending efficiency in two sectors where local governments enjoy substantial jurisdiction
(health, and water & sanitation). Based on a rich dataset comprising more than 1000
municipalities between 2004 and 2011, and relying on standard non-parametric techniques to
measure public expenditure efficiency (Data Envelopment Analysis) we find that the relationship
between revenue windfalls and public spending efficiency is non-monotonic: municipalities that
were extremely favored by the commodity boom were more inefficient whereas those benefited
with modest transfers were more efficient. These results are consistent with recent theoretical
work suggesting that the level or “intensity of dosage” of natural resource revenues is a key
determinant of policymakers’ incentives and thus, of the economic and political outcomes
associated with resource abundance in developing countries (Caselli and Cunningham 2009).
In contrast to the effect of oil and coal royalties, increases in municipal own revenue
sources (property and business taxes) have positive effects on expenditure efficiency. Finally, the
extent of observed corruption is positively associated with the level of resource revenue
transferred to municipalities. Both findings are also consistent with recent theoretical and
empirical work linking government performance to the structure of public finance at the
4
subnational level (Gadenne 2013; Ramirez 2014). According to this literature, it is crucial to
focus on how natural resource transfers and taxation affect politicians’ incentives and behavior.
In particular, access to large amounts of windfall revenue has the potential of: i) exacerbating the
political agency problem, both in terms of moral hazard and selection effects1 (Brollo et al. 2013;
Monteiro and Ferraz 2012); and ii) changing the degree or nature of political competition2
(Caselli and Cuninghman 2009; Acemoglu et al. 2006), thus affecting governments’ incentives to
provide public goods efficiently. While exploring in depth such mechanisms is beyond the scope
of this paper, we provide reduced form evidence suggesting a relationship between different
sources of government revenue and public policy outcomes (public spending efficiency, and
levels of corruption), which is an important first step in the direction of understanding the
linkages between different public finance structures and government performance.
This paper is organized as follows. Section 1 presents stylized facts about Colombian
local governments’ revenue sources, spending responsibilities, as well as the rules regarding the
distribution of oil and mineral wealth across and within the different government tiers. After
briefly describing the data sources to be used in the empirical analysis in Section 2, Section 3,
the core of the paper, contains three different but related empirical exercises. In particular, the
section analyzes the effect of additional revenue windfalls on a) the size and composition of local
budgets; b) the (technical) efficiency of local public spending in water & sanitation and health
sectors, and c) the incidence of corruption. Conclusions follow.
1 Specifically, revenue windfalls increase budget size, providing extra room for politicians to tilt the allocation of
spending toward goods that benefit the incumbent (perks, rents) at the expense of voters. Since rents are more
valuable for political candidates of lower quality, a larger budget induces a decline in the average ability of the pool
of candidates (Brollo et al. 2013). 2 The effect of windfalls on political competition is theoretically ambiguous: on the one hand, it may increase the
likelihood of a political challenge, but it could also lead to an incumbency advantage effect in which electoral
competition is reduced by the use of patronage or clientelistic strategies (Caselli and Cuningham 2009).
5
1. Background
Fiscal federalism and local public finance. Colombia is a unitary but highly decentralized
country consisting of 1100 municipalities distributed among 32 departments.3 Subnational
governments are responsible for a wide range of competences, including education, health,
domiciliary public services, water and sanitation, among others. Although departments are
responsible for co-financing some municipal expenditures, municipalities are accountable for a
wider range of responsibilities than departments, representing around 65 percent of total
subnational expenditure. In total, expenditures from subnational governments (SNGs) account
for a third of non-financial public sector spending (i.e. around a 9.6 percent of GDP), of which
health and education represent more than 50 percent.
This high degree of decentralization on expenditures contrasts with the low level of own
revenues raised by SNGs, leading to high vertical fiscal imbalances. SNGs have basically four
sources of revenues: own revenues (tax and non-tax revenues), transfers from the SGP4, royalty
payments and other transfers. Subnational revenues account for around 9-10 percent of GDP,
almost paired with expenditures, but the lion’s share of subnational revenues (65%) are transfers
and royalty payments, of which 46 percent are transfers from SGP, 8 percent royalty payments,
and 11 percent transfers from other sources. This means that whereas transfers and royalty
payments finance around 65 percent of expenditures, own revenues just finance around 35
percent. Furthermore, most of the social, infrastructure, and other public services expenditures
are financed with earmarked resources, which gives little room for flexibility. For example,
around 95 percent of SGP transfers are earmarked for education, health, school meals, water and
sanitation (World Bank 2009).
Royalty payments and the boom of oil and coal production in Colombia. Although the
beginning of oil and mineral exploitation in Colombia dates back to colonial times, it was not
until the 1980s that production boomed. Since the mid-1970s, successive legal reforms leading to
the decrease of red tape in the exploitation of oil and the substitution of concessions by
association contracts led to the discovery of new oil fields and boosted production. Likewise,
with the determination to reach international markets and the beginning of coal exports from El
3 Departments and municipalities are respectively headed by governors and mayors , directly elected for a period of
4 years, without the possibility of immediate reelection. 4 Sistema General de Participaciones (SGP). It is the main intergovernmental system of transfers from the State to
subnational entities in Colombia.
6
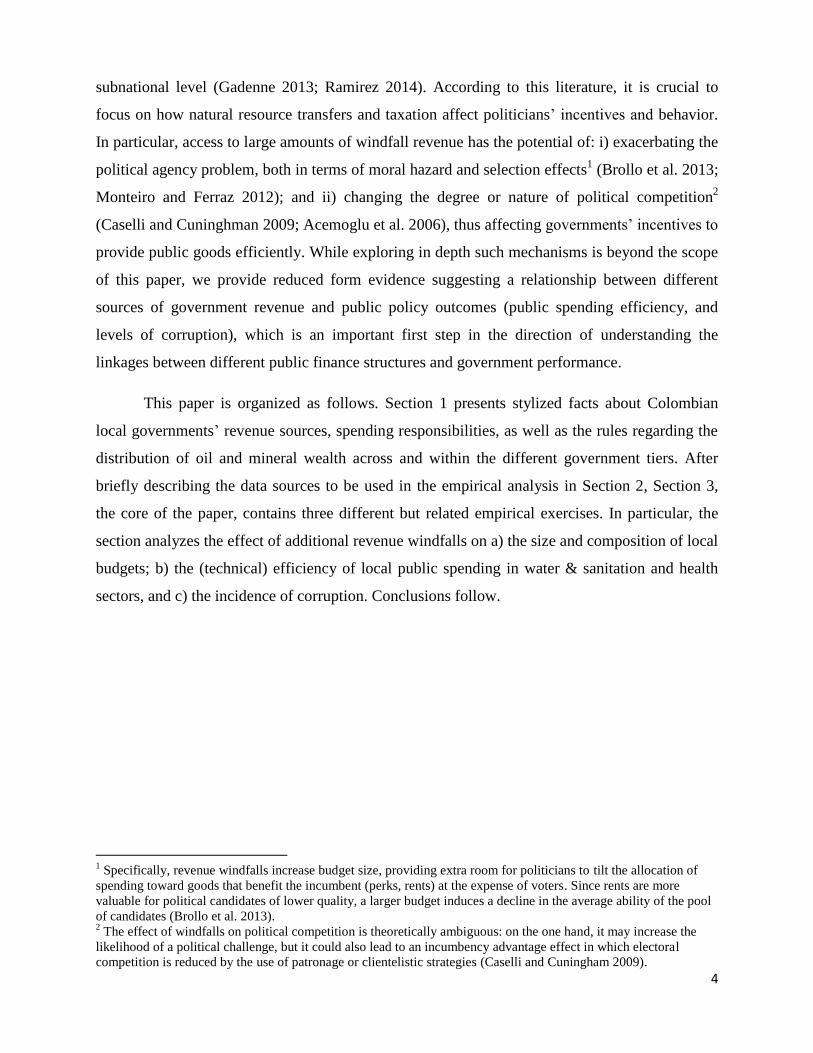
Cerrejon in the 1980s, coal production boomed. Indeed, while average oil production in the
period 2000-2010 almost quadrupled with respect to 1970-1980, average coal production
increased by a factor of more than 17 (Figure 1). While Colombia produces other minerals such
as niquel, iron, copper, gold and other precious metals, the bulk of mineral exports proceed from
oil, followed by coal. Together, oil and coal accounted for 85 percent of total mineral and oil
exports, of which 70 percent were oil and its derivatives.
Figure 1- Production of oil and coal
The increase of oil and mineral production in the 1980s was accompanied by the
decentralization of Colombia’s governance model, which up till 1991 was highly centralized,
with mayors and governors directly appointed by the President. The Constitutional reform of
1991 devolved competences to SNGs, introduced democratic elections of governors and
established the main principles of the participation of SNGs in the revenues generated by
extractive activities. Under this legal framework complimented by Law 141 of 1994, the State
would be the owner of the subsoil and of the non-renewable natural resources (Art 332
Constitution), and would charge royalties for the production of these goods, with SNGs being the
main beneficiaries and receiving around 97 percent of total royalty payments. However, there
were substantive differences across the amount received by the different municipalities, most of
these explained by allocation rules favoring producing regions (Perry y Olivera 2009). Indeed,
those territories involved in the exploration, exploitation or logistics of transportation of non-
7
renewable natural resources (hereinafter, “producers”), would be the main beneficiaries of
royalty payments (i.e. direct royalty payments), receiving around 80 percent of the total.5
The bulk of royalty payments (“regalias directas”) were to be earmarked for investment
in contributions to the National Pension Fund (Fondo Nacional de Pensiones en las Entidades
Territoriales, FONPET), and the following sectors: education, health (infant mortality and
health-for-the-poor projects), and water supply and sewerage. The remaining resources (“regalías
indirectas”) -about 20% of total- were allocated to the National Royalties Fund (FNR), as a
mechanism of interregional redistribution: while both producing and non-producing
municipalities were eligible for payments under the FNR, in practice producing regions were
favored the most (Ministerio de Hacienda y Credito Publico 2011). Considering total royalty
payments paid to SNGs, departments have historically been the major beneficiaries, receiving a
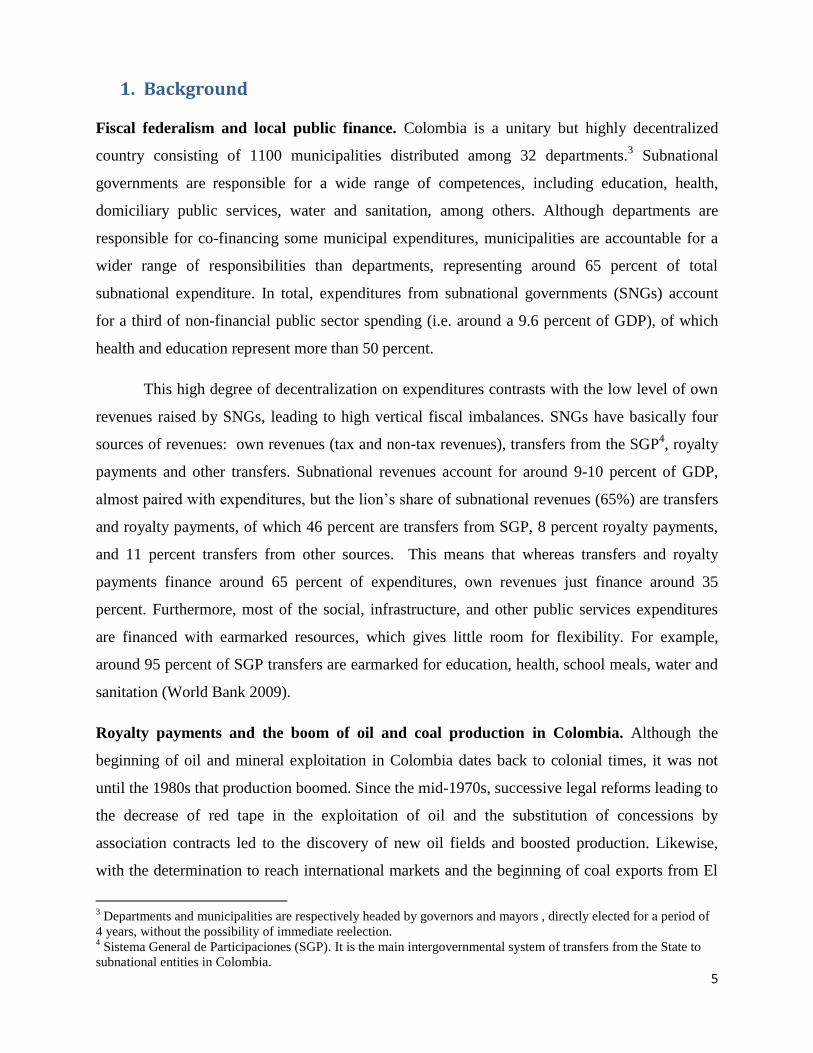
share between a 55% and a 65%, and municipalities the remaining 35% -45%.6 Royalties
distributed to SNGs almost doubled in the last decade, from 0.57% of GDP in 2000 to 0.96% of
GDP in 2011, with oil and coal accounting for 67 percent and 19 percent of total royalty
payments respectively accruing to municipalities (Figure 2). 7
Figure 2- Evolution of royalty payments and shares across SNGs
5 The amount to be received by producer districts was determined according to a formula depending on the volume
of oil/minerals produced, the price of the mineral set by the Ministry of Mines and Energy for the payment of
royalties, and a tax rate set for each mineral or oil, which stands between 8 and 25 percent for oil and between 5 and
10 percent for coal, depending on the volume produced.
6 The new system has been designed in order to further increase the department’s participation in the system. The
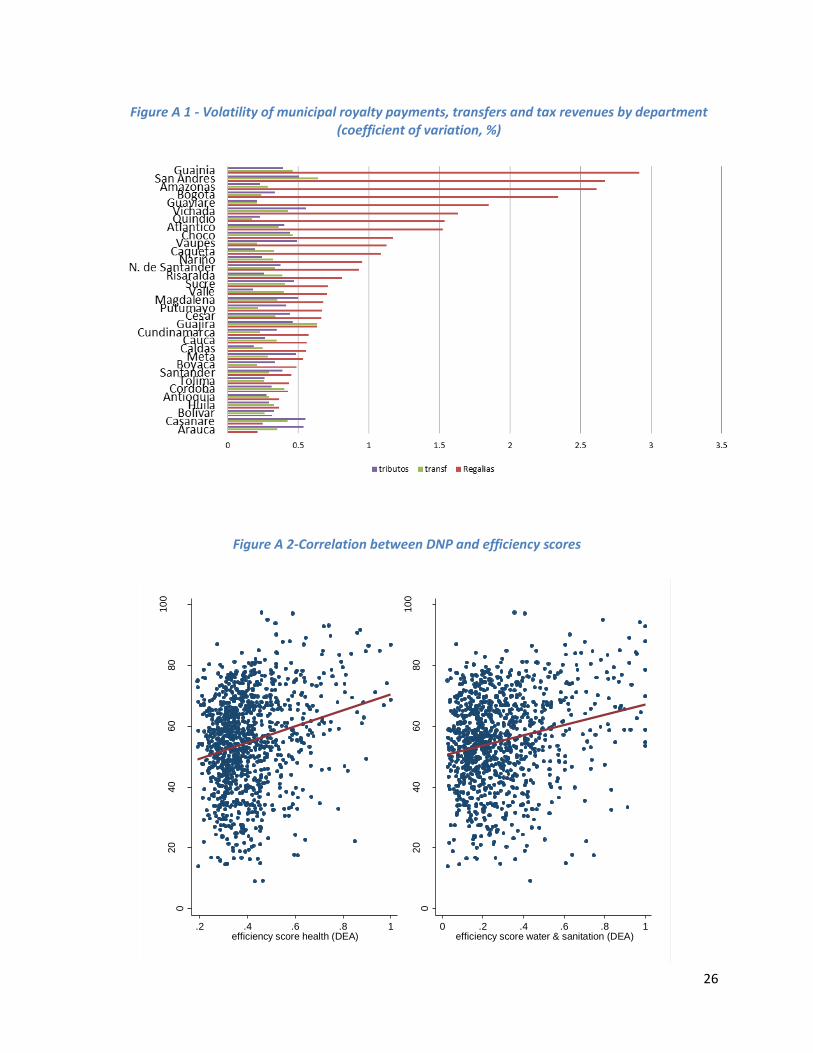
budgets for 2012 and 2013-2014 foresee a 75% share and a 77% share respectively. 7 As shown in Figure A1, royalties are significantly more volatile than other kind of revenues sources.
8
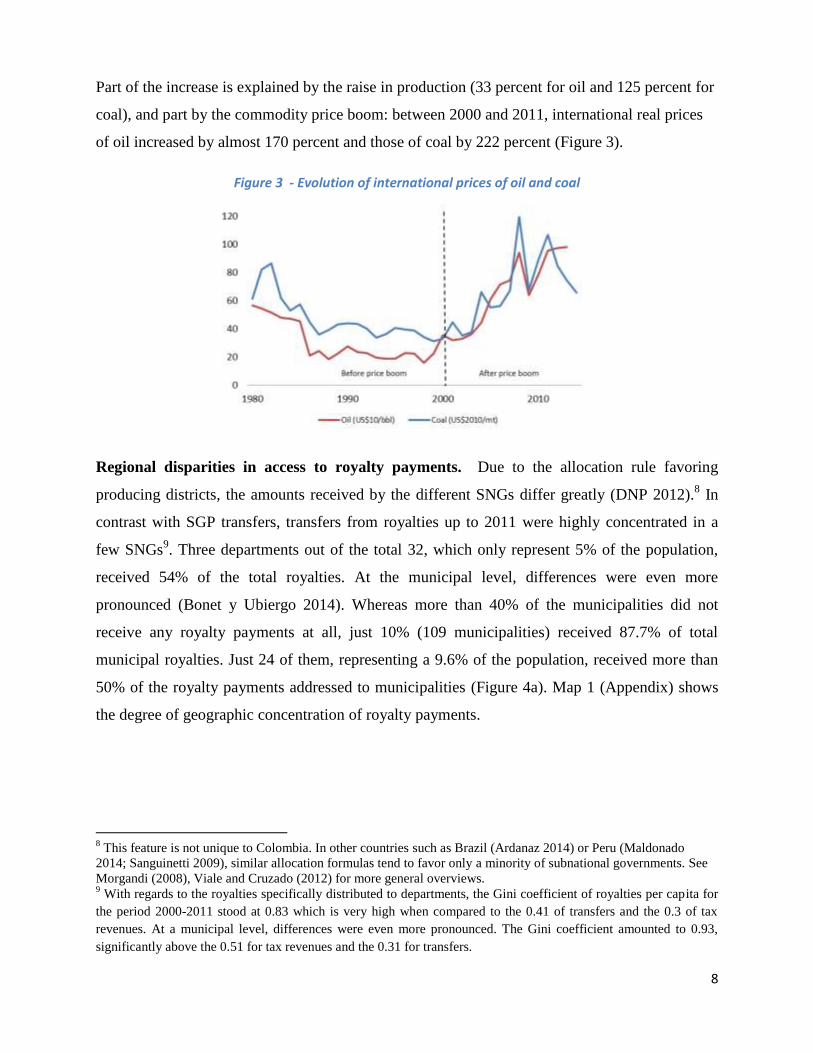
Part of the increase is explained by the raise in production (33 percent for oil and 125 percent for
coal), and part by the commodity price boom: between 2000 and 2011, international real prices
of oil increased by almost 170 percent and those of coal by 222 percent (Figure 3).
Figure 3 - Evolution of international prices of oil and coal
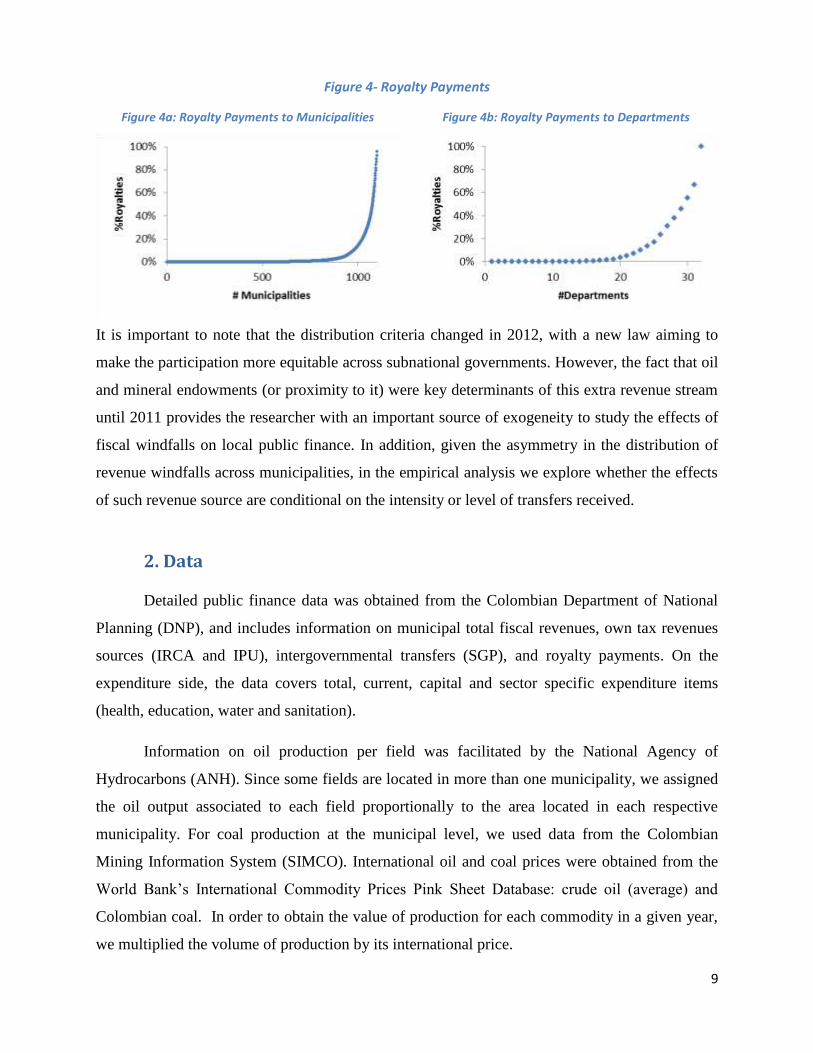
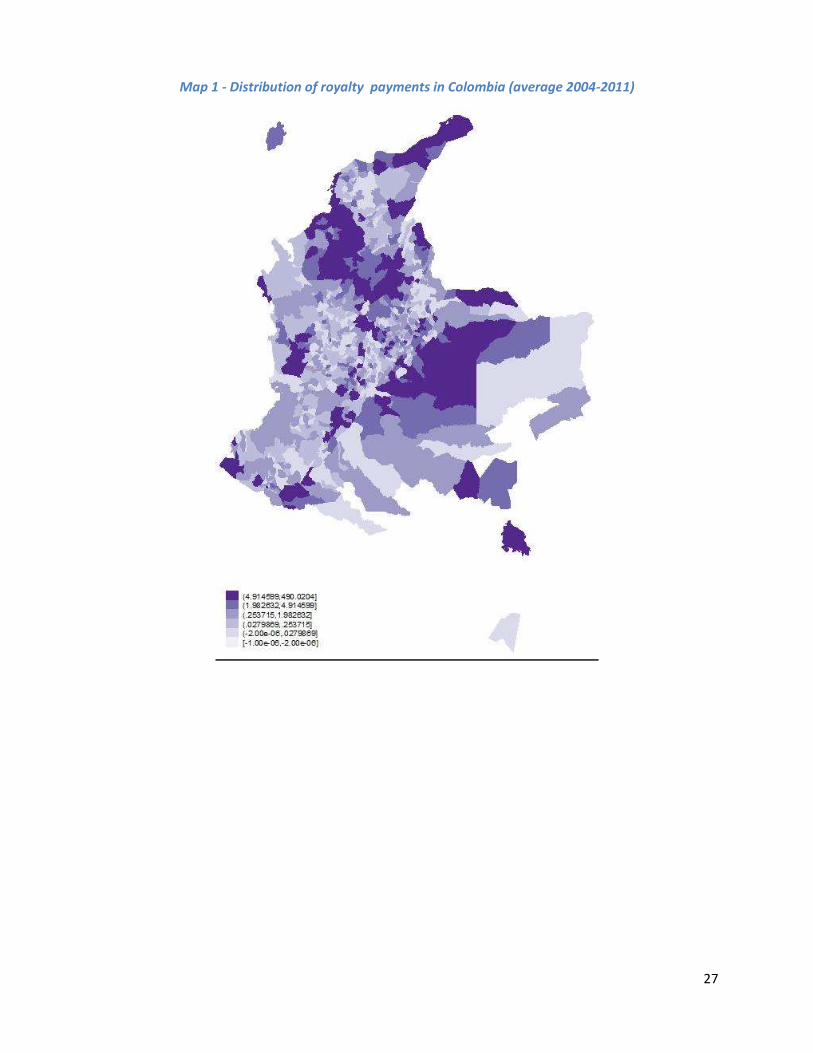
Regional disparities in access to royalty payments. Due to the allocation rule favoring
producing districts, the amounts received by the different SNGs differ greatly (DNP 2012).8 In
contrast with SGP transfers, transfers from royalties up to 2011 were highly concentrated in a
few SNGs9. Three departments out of the total 32, which only represent 5% of the population,
received 54% of the total royalties. At the municipal level, differences were even more
pronounced (Bonet y Ubiergo 2014). Whereas more than 40% of the municipalities did not
receive any royalty payments at all, just 10% (109 municipalities) received 87.7% of total
municipal royalties. Just 24 of them, representing a 9.6% of the population, received more than
50% of the royalty payments addressed to municipalities (Figure 4a). Map 1 (Appendix) shows
the degree of geographic concentration of royalty payments.
8 This feature is not unique to Colombia. In other countries such as Brazil (Ardanaz 2014) or Peru (Maldonado
2014; Sanguinetti 2009), similar allocation formulas tend to favor only a minority of subnational governments. See
Morgandi (2008), Viale and Cruzado (2012) for more general overviews. 9 With regards to the royalties specifically distributed to departments, the Gini coefficient of royalties per capita for
the period 2000-2011 stood at 0.83 which is very high when compared to the 0.41 of transfers and the 0.3 of tax
revenues. At a municipal level, differences were even more pronounced. The Gini coefficient amounted to 0.93,
significantly above the 0.51 for tax revenues and the 0.31 for transfers.
9
Figure 4- Royalty Payments
Figure 4a: Royalty Payments to Municipalities Figure 4b: Royalty Payments to Departments
It is important to note that the distribution criteria changed in 2012, with a new law aiming to
make the participation more equitable across subnational governments. However, the fact that oil
and mineral endowments (or proximity to it) were key determinants of this extra revenue stream
until 2011 provides the researcher with an important source of exogeneity to study the effects of
fiscal windfalls on local public finance. In addition, given the asymmetry in the distribution of
revenue windfalls across municipalities, in the empirical analysis we explore whether the effects
of such revenue source are conditional on the intensity or level of transfers received.
2. Data
Detailed public finance data was obtained from the Colombian Department of National
Planning (DNP), and includes information on municipal total fiscal revenues, own tax revenues
sources (IRCA and IPU), intergovernmental transfers (SGP), and royalty payments. On the
expenditure side, the data covers total, current, capital and sector specific expenditure items
(health, education, water and sanitation).
Information on oil production per field was facilitated by the National Agency of
Hydrocarbons (ANH). Since some fields are located in more than one municipality, we assigned
the oil output associated to each field proportionally to the area located in each respective
municipality. For coal production at the municipal level, we used data from the Colombian
Mining Information System (SIMCO). International oil and coal prices were obtained from the
World Bank’s International Commodity Prices Pink Sheet Database: crude oil (average) and
Colombian coal. In order to obtain the value of production for each commodity in a given year,
we multiplied the volume of production by its international price.
10
For the efficiency analysis, we collected data on inputs (expenditures in the health and
water & sanitation sectors) with corresponding outcome measures: the mortality infant rate
(TMI), which measures the number of deceases in children less than one year old, for each 1,000
children born alive, and the Index of Risk of Water Quality for Human Consumption (IRCA), an
index ranking from 0 to 100 that measures the risk of diseases related for the non-fulfillment of
the chemical, physical and microbiological characteristics required for human consumption.10
Since public spending produces benefits only with some lag, we take average expenditures
between 2004 and 2011 and measure outcomes in subsequent periods: 2011 (TMI) or 2010-2012
(IRCA).11
Thus, this analysis is based on cross-sectional level data.
Thirdly, for the corruption analysis, we used information regarding irregularities in the
use of royalty payments from the DNP. In particular, we used two variables: 1) the percentage of
the value of contracts financed with direct royalties subject to irregularities between 2009 and
2011; 2) Number of irregularities in contracts financed with direct royalties between 2009 and
2011. Finally, standard economic control variables such as the Basic Needs Index (“NBI”) and
“percentage of urban population” were obtained from the National Institute of Statistic (DANE),
and political variables such as “margin of electoral victory”, defined as the difference in vote
shares between the elected candidate and the runner up in mayoral elections, come from the
Colombian national elections council: Registraduría Nacional del Estado Civil.
3. Evidence
In this section, we conduct three empirical exercises: we first analyze how windfall revenues
impact multiple items of the fiscal accounts. We then estimate the impact of royalty payments on
the efficiency of government spending in the water & sanitation and health sectors. Finally, we
test the hypothesis that higher fiscal windfalls, in the form of royalty payments, are associated
with higher incidence of corruption.
10
If the index is between 0 and 5, there is risk. If it is between 5.1 and 14, the risk is low. If it is between 14.1 and
35, the risk is medium. If the index is between 35.1 and 70 the risk is high. Finally, if the index is between 70.1 and
100 the risk is unviable. 11
In a future version of the paper, we plan to present results from the education sector as well.
11
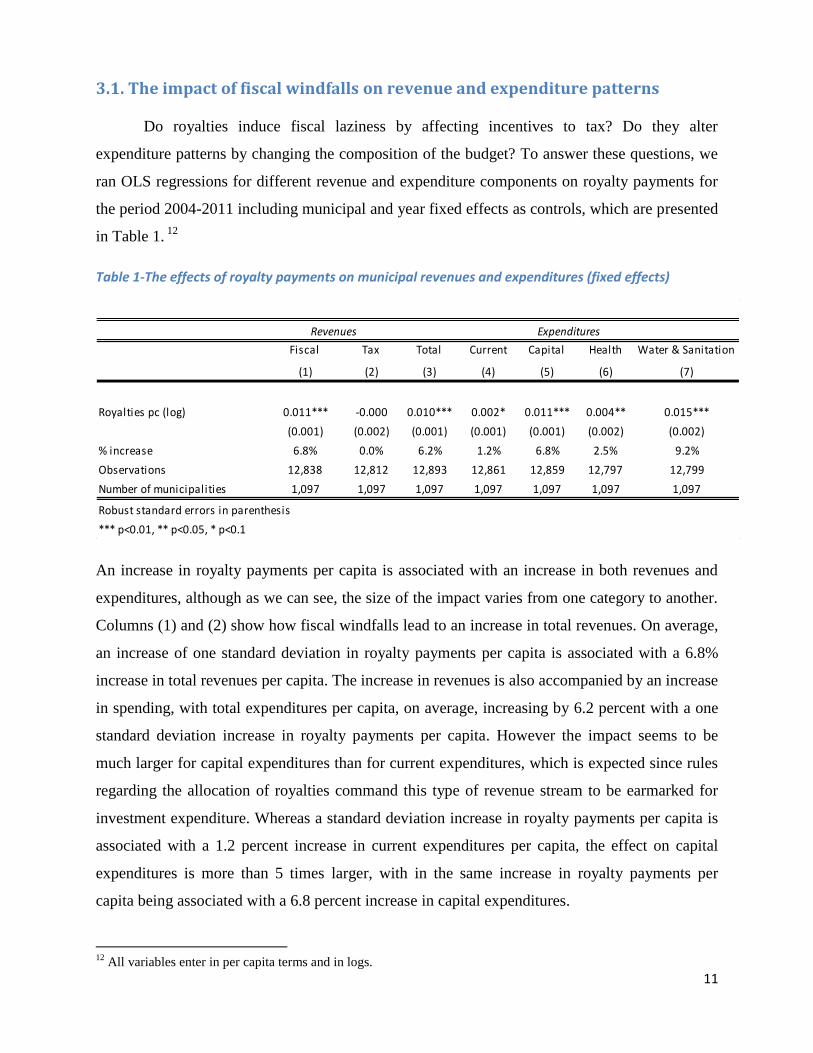
3.1. The impact of fiscal windfalls on revenue and expenditure patterns
Do royalties induce fiscal laziness by affecting incentives to tax? Do they alter
expenditure patterns by changing the composition of the budget? To answer these questions, we
ran OLS regressions for different revenue and expenditure components on royalty payments for
the period 2004-2011 including municipal and year fixed effects as controls, which are presented
in Table 1. 12
Table 1-The effects of royalty payments on municipal revenues and expenditures (fixed effects)
An increase in royalty payments per capita is associated with an increase in both revenues and
expenditures, although as we can see, the size of the impact varies from one category to another.
Columns (1) and (2) show how fiscal windfalls lead to an increase in total revenues. On average,
an increase of one standard deviation in royalty payments per capita is associated with a 6.8%
increase in total revenues per capita. The increase in revenues is also accompanied by an increase
in spending, with total expenditures per capita, on average, increasing by 6.2 percent with a one
standard deviation increase in royalty payments per capita. However the impact seems to be
much larger for capital expenditures than for current expenditures, which is expected since rules
regarding the allocation of royalties command this type of revenue stream to be earmarked for
investment expenditure. Whereas a standard deviation increase in royalty payments per capita is
associated with a 1.2 percent increase in current expenditures per capita, the effect on capital
expenditures is more than 5 times larger, with in the same increase in royalty payments per
capita being associated with a 6.8 percent increase in capital expenditures.
12
All variables enter in per capita terms and in logs.
Fiscal Tax Total Current Capital Health Water & Sanitation
(1) (2) (3) (4) (5) (6) (7)
Royalties pc (log) 0.011*** -0.000 0.010*** 0.002* 0.011*** 0.004** 0.015***
(0.001) (0.002) (0.001) (0.001) (0.001) (0.002) (0.002)
% increase 6.8% 0.0% 6.2% 1.2% 6.8% 2.5% 9.2%
Observations 12,838 12,812 12,893 12,861 12,859 12,797 12,799
Number of municipalities 1,097 1,097 1,097 1,097 1,097 1,097 1,097
Revenues Expenditures
Robust standard errors in parenthesis
*** p<0.01, ** p<0.05, * p<0.1
12
With respect to the impact on the levels of spending on the different sectors, the impact
was statistically significant in both the water & sanitation and health sectors. However, the
impact was considerably larger in the first: whereas a standard deviation increase in royalty
payments per capita is associated with a 9.2 percent increase in per capita spending in the water
& sanitation sector, the same increase is associated with just a 2.5 percent increase in per capita
spending in the health sector.
3.2 Efficiency of local public good provision
The previous section highlights how an increase in revenues from royalty payments leads to
public spending increases of different categories. How efficiently are municipalities using these
resources? Although public spending efficiency can by analyzed from two perspectives,
allocative and technical, we focus on the latter dimension, using a standard non-parametric
methodology: Data Envelopment Analysis (DEA).13
The DEA technique takes a given
municipality and compares it with the best performer(s) of peer municipal governments in the
sample. This leads to an empirical approximation of a production possibility frontier, defined as
the maximum attainable outcome by a SNG for a given input-level (input-oriented approach) or
as the minimum required input to attain a given outcome-level (output-oriented approach).
Inefficiency is defined as the distance from the observed input-output combinations to the
efficiency frontier. Municipalities on the frontier will exhibit scores of 1, and less efficient
governments will show scores between 0 and 1. As inputs for the water & sanitation and health
sectors, we used average public spending per capita for the period 2004-11 in each respective
sector. As outcomes, we used the water quality index (IRCA)14
for the water & sanitation sector
and the infant mortality rate15
for the health sector, both described in section II.
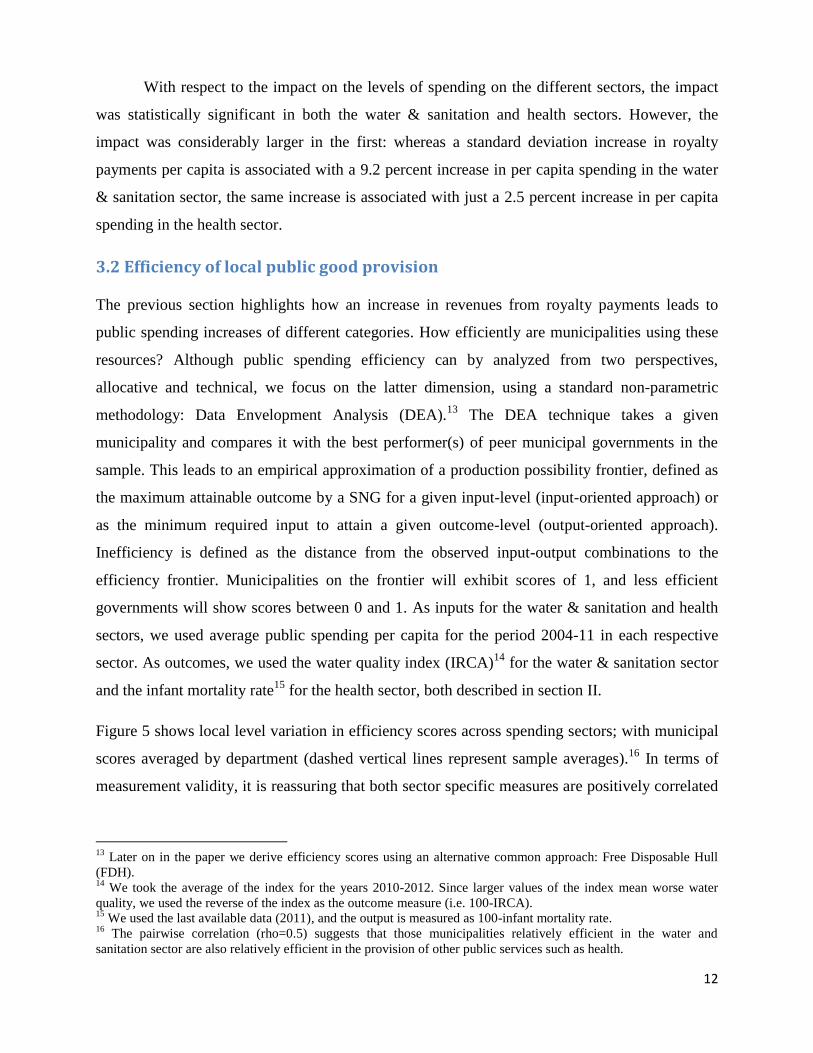
Figure 5 shows local level variation in efficiency scores across spending sectors; with municipal
scores averaged by department (dashed vertical lines represent sample averages).16
In terms of
measurement validity, it is reassuring that both sector specific measures are positively correlated
13
Later on in the paper we derive efficiency scores using an alternative common approach: Free Disposable Hull
(FDH). 14
We took the average of the index for the years 2010-2012. Since larger values of the index mean worse water
quality, we used the reverse of the index as the outcome measure (i.e. 100-IRCA). 15
We used the last available data (2011), and the output is measured as 100-infant mortality rate. 16
The pairwise correlation (rho=0.5) suggests that those municipalities relatively efficient in the water and
sanitation sector are also relatively efficient in the provision of other public services such as health.
13
with a broader efficiency ranking periodically generated by the DNP (Figures A1 and A2,
Appendix).17
Figure 5 - Distribution of municipal efficiency scores, by department
3.2.1 Determinants of public spending efficiency at the local level
Table 2 presents results from Tobit models in which efficiency scores are regressed against
royalty payments per capita and a series of control variables: total public expenditures per capita,
intergovernmental transfers per capita, own tax revenues per capita, percentage of urban
population, a measure of poverty (NBI), and the margin of victory in mayoral elections.18
Since
we are interested in testing whether the impact of natural resource windfalls on efficiency is
conditional on its level, we include a quadratic term (royalties^2) across all specifications.
17
DNP’s efficiency score is a component of the Municipal Comprehensive Performance Assessment Index. The
aforementioned efficiency score is the average of six different efficiency scores on the education, health and water&
sanitation sectors (two per sector), which are calculated using the DEA methodology as well (see DNP 2014). 18
ROYALTIES, ROYALTIES^2, EXPENDITURES, TRANSFERS AND TAX REVENUES enter the model in
logs. All the variables are averages for the period 2004-2011.
AMAZONAS
ANTIOQUIA
ARAUCA
ATLANTICO
BOLIVAR
BOYACA
CALDAS
CAQUETA
CASANARE
CAUCA
CESAR
CHOCO
CORDOBA
CUNDINAMARCA
GUAVIARE
HUILA
LA GUAJIRA
MAGDALENA
META
NARIÐO
NARIÑO
NORTE DE SANTANDER
PUTUMAYO
QUINDIO
RISARALDA
SANTANDER
SUCRE
TOLIMA
VALLE DEL CAUCA
VAUPES
VICHADA
0 .2 .4 .6 .8
+/-1SD mean
Water & Sanitation
AMAZONAS
ANTIOQUIA
ARAUCA
ATLANTICO
BOLIVAR
BOYACA
CALDAS
CAQUETA
CASANARE
CAUCA
CESAR
CHOCO
CORDOBA
CUNDINAMARCA
GUAVIARE
HUILA
LA GUAJIRA
MAGDALENA
META
NARIÐO
NARIÑO
NORTE DE SANTANDER
PUTUMAYO
QUINDIO
RISARALDA
SANTANDER
SUCRE
TOLIMA
VALLE DEL CAUCA
VAUPES
VICHADA
0 .2 .4 .6 .8
+/-1SD mean
Health
14
Table 2 - The determinants of expenditure efficiency using DEA (Tobit regressions)
Columns four and eight present results from our preferred specification in which in
addition to standard fiscal and socioeconomic controls, department fixed effects are included.
While the relationship between the level of royalty payments and efficiency is positive, the
square term is negative and significant. Since the average amount of royalties per capita is
59,874.45 pesos (circa US$30), this implies that the efficiency score is negatively associated
with natural resource transfers for the typical municipality. In fact, the combined effect of the
parameters is negative for the range of royalty payments found in the vast majority of
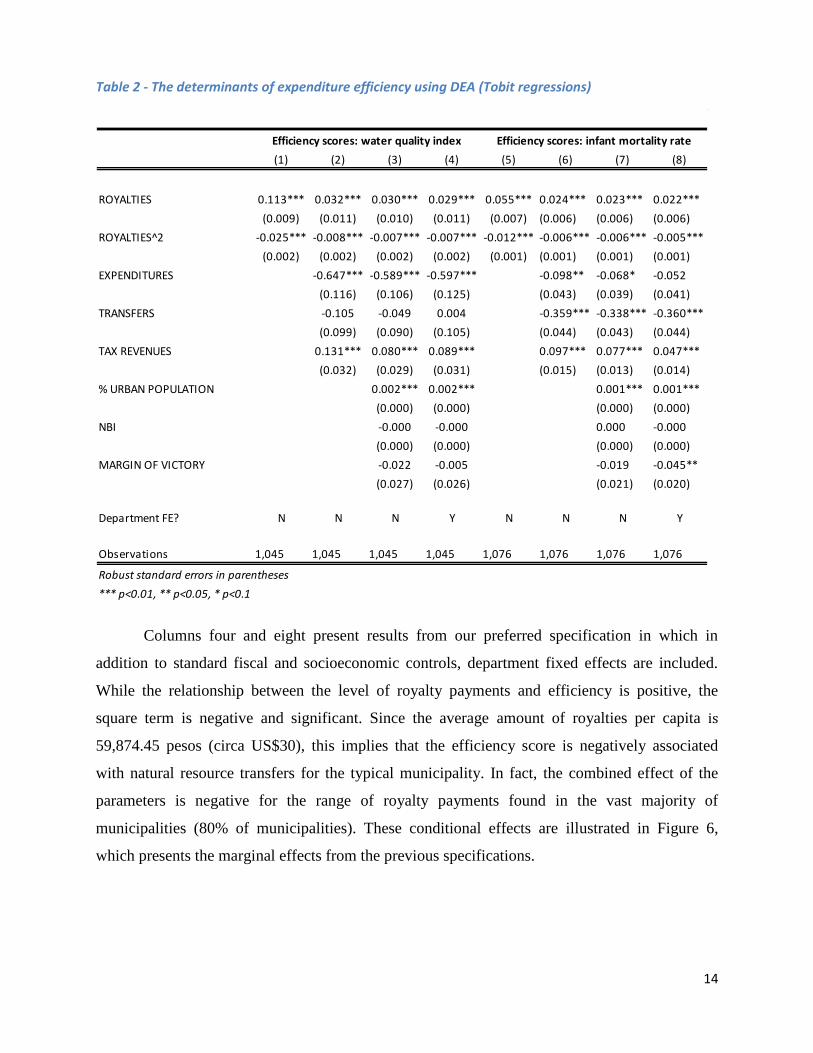
municipalities (80% of municipalities). These conditional effects are illustrated in Figure 6,
which presents the marginal effects from the previous specifications.
(1) (2) (3) (4) (5) (6) (7) (8)
ROYALTIES 0.113*** 0.032*** 0.030*** 0.029*** 0.055*** 0.024*** 0.023*** 0.022***
(0.009) (0.011) (0.010) (0.011) (0.007) (0.006) (0.006) (0.006)
ROYALTIES^2 -0.025*** -0.008*** -0.007*** -0.007*** -0.012*** -0.006*** -0.006*** -0.005***
(0.002) (0.002) (0.002) (0.002) (0.001) (0.001) (0.001) (0.001)
EXPENDITURES -0.647*** -0.589*** -0.597*** -0.098** -0.068* -0.052
(0.116) (0.106) (0.125) (0.043) (0.039) (0.041)
TRANSFERS -0.105 -0.049 0.004 -0.359*** -0.338*** -0.360***
(0.099) (0.090) (0.105) (0.044) (0.043) (0.044)
TAX REVENUES 0.131*** 0.080*** 0.089*** 0.097*** 0.077*** 0.047***
(0.032) (0.029) (0.031) (0.015) (0.013) (0.014)
% URBAN POPULATION 0.002*** 0.002*** 0.001*** 0.001***
(0.000) (0.000) (0.000) (0.000)
NBI -0.000 -0.000 0.000 -0.000
(0.000) (0.000) (0.000) (0.000)
MARGIN OF VICTORY -0.022 -0.005 -0.019 -0.045**
(0.027) (0.026) (0.021) (0.020)
Department FE? N N N Y N N N Y
Observations 1,045 1,045 1,045 1,045 1,076 1,076 1,076 1,076
Efficiency scores: infant mortality rate
*** p<0.01, ** p<0.05, * p<0.1
Efficiency scores: water quality index
Robust standard errors in parentheses
15
Figure 6 - Marginal effect of royalties on spending efficiency, with 95% confidence intervals
The economic significance of these coefficients is important: a standard deviation
increase in royalties per capita is associated with 10.9 percent and 5.4 percent decreases in
efficiency for the water & sanitation and health sectors respectively, relative to the average
efficiency scores. An increase in SGP transfers seems to decrease efficiency in the health sector
as well, with a standard deviation increase in transfers per capita being associated with a
decrease of 16.5 percent with respect to the average efficiency score. In contrast, an increase in
local tax revenues would lead to gains in public spending efficiency in both the water &
sanitation and health sectors. Indeed, a standard deviation increase in own revenues per capita is
associated with efficiency gains of 10.3 percent in the water & sanitation sector and 3.9 percent
in the health sector, with respect to their respective average efficiency scores. Note that the
impact is almost of the same size as the increase in royalty payments but in the exact opposite
direction: whereas royalty payments decrease public spending efficiency, tax revenues seem to
lead to efficiency gains.
3.2.2 Robustness checks
A. Identification
The analysis so far has assumed that royalty payments are exogenous to local characteristics.
However, as discussed in section 1, allocation of natural resource transfers is directly linked to
-.1
-.05
0
.05
d(ef
ficie
ncy
W&
S)/
d(ro
yalti
es p
er c
apita
)
0 1 2 3 4 5 6 7Royalties per capita (log)
Water & Sanitation
-.1
-.05
0
.05
d(ef
ficie
ncy
Hea
lth)/
d(ro
yalti
es p
er c
apita
)
0 1 2 3 4 5 6 7Royalties per capita (log)
Health
16
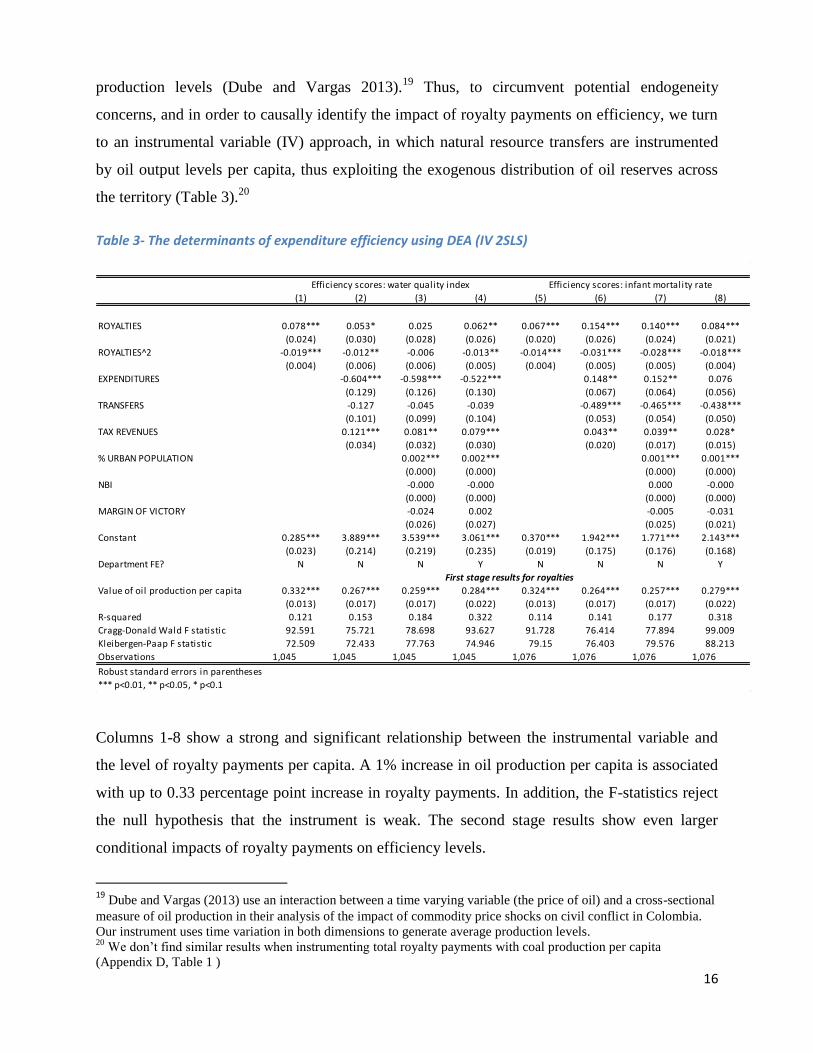
production levels (Dube and Vargas 2013).19
Thus, to circumvent potential endogeneity
concerns, and in order to causally identify the impact of royalty payments on efficiency, we turn
to an instrumental variable (IV) approach, in which natural resource transfers are instrumented
by oil output levels per capita, thus exploiting the exogenous distribution of oil reserves across
the territory (Table 3).20
Table 3- The determinants of expenditure efficiency using DEA (IV 2SLS)
Columns 1-8 show a strong and significant relationship between the instrumental variable and
the level of royalty payments per capita. A 1% increase in oil production per capita is associated
with up to 0.33 percentage point increase in royalty payments. In addition, the F-statistics reject
the null hypothesis that the instrument is weak. The second stage results show even larger
conditional impacts of royalty payments on efficiency levels.
19 Dube and Vargas (2013) use an interaction between a time varying variable (the price of oil) and a cross-sectional
measure of oil production in their analysis of the impact of commodity price shocks on civil conflict in Colombia.
Our instrument uses time variation in both dimensions to generate average production levels. 20
We don’t find similar results when instrumenting total royalty payments with coal production per capita
(Appendix D, Table 1 )
(1) (2) (3) (4) (5) (6) (7) (8)
ROYALTIES 0.078*** 0.053* 0.025 0.062** 0.067*** 0.154*** 0.140*** 0.084***
(0.024) (0.030) (0.028) (0.026) (0.020) (0.026) (0.024) (0.021)
ROYALTIES^2 -0.019*** -0.012** -0.006 -0.013** -0.014*** -0.031*** -0.028*** -0.018***
(0.004) (0.006) (0.006) (0.005) (0.004) (0.005) (0.005) (0.004)
EXPENDITURES -0.604*** -0.598*** -0.522*** 0.148** 0.152** 0.076
(0.129) (0.126) (0.130) (0.067) (0.064) (0.056)
TRANSFERS -0.127 -0.045 -0.039 -0.489*** -0.465*** -0.438***
(0.101) (0.099) (0.104) (0.053) (0.054) (0.050)
TAX REVENUES 0.121*** 0.081** 0.079*** 0.043** 0.039** 0.028*
(0.034) (0.032) (0.030) (0.020) (0.017) (0.015)
% URBAN POPULATION 0.002*** 0.002*** 0.001*** 0.001***
(0.000) (0.000) (0.000) (0.000)
NBI -0.000 -0.000 0.000 -0.000
(0.000) (0.000) (0.000) (0.000)
MARGIN OF VICTORY -0.024 0.002 -0.005 -0.031
(0.026) (0.027) (0.025) (0.021)
Constant 0.285*** 3.889*** 3.539*** 3.061*** 0.370*** 1.942*** 1.771*** 2.143***
(0.023) (0.214) (0.219) (0.235) (0.019) (0.175) (0.176) (0.168)
Department FE? N N N Y N N N Y
Value of oil production per capita 0.332*** 0.267*** 0.259*** 0.284*** 0.324*** 0.264*** 0.257*** 0.279***
(0.013) (0.017) (0.017) (0.022) (0.013) (0.017) (0.017) (0.022)
R-squared 0.121 0.153 0.184 0.322 0.114 0.141 0.177 0.318
Cragg-Donald Wald F statistic 92.591 75.721 78.698 93.627 91.728 76.414 77.894 99.009
Kleibergen-Paap F statistic 72.509 72.433 77.763 74.946 79.15 76.403 79.576 88.213
Observations 1,045 1,045 1,045 1,045 1,076 1,076 1,076 1,076
Robust standard errors in parentheses
*** p<0.01, ** p<0.05, * p<0.1
Efficiency scores: water quality index Efficiency scores: infant mortality rate
First stage results for royalties
17
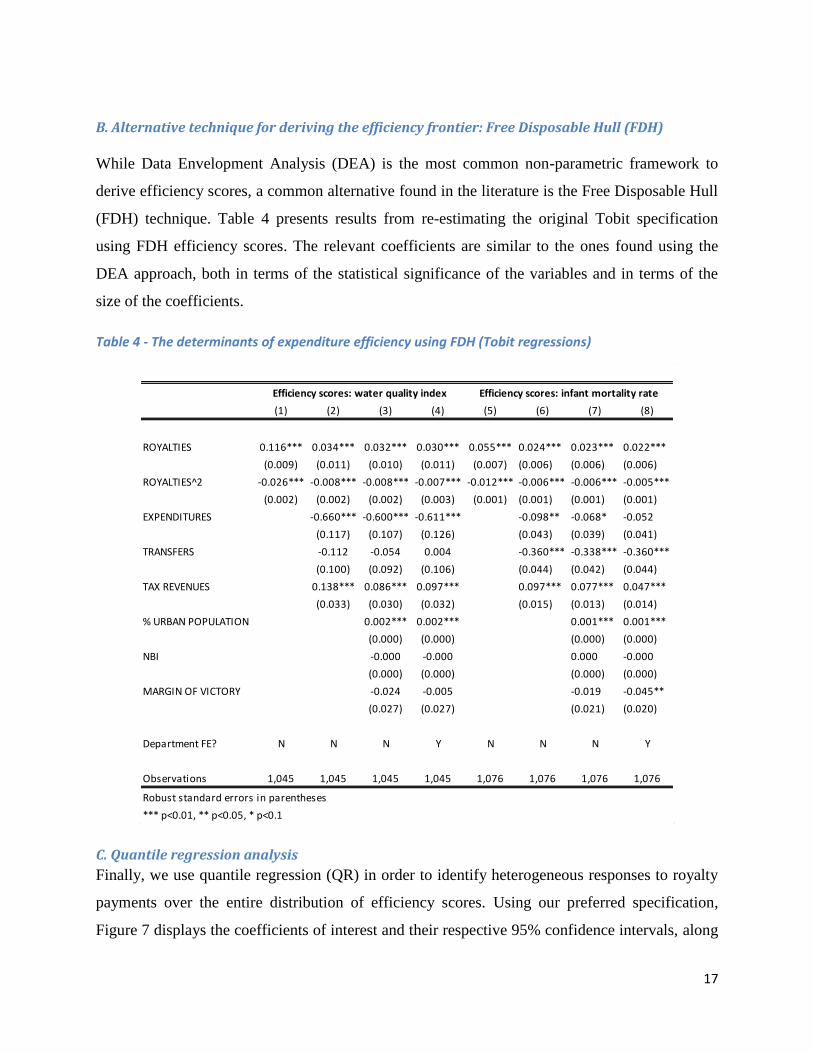
B. Alternative technique for deriving the efficiency frontier: Free Disposable Hull (FDH)
While Data Envelopment Analysis (DEA) is the most common non-parametric framework to
derive efficiency scores, a common alternative found in the literature is the Free Disposable Hull
(FDH) technique. Table 4 presents results from re-estimating the original Tobit specification
using FDH efficiency scores. The relevant coefficients are similar to the ones found using the
DEA approach, both in terms of the statistical significance of the variables and in terms of the
size of the coefficients.
Table 4 - The determinants of expenditure efficiency using FDH (Tobit regressions)
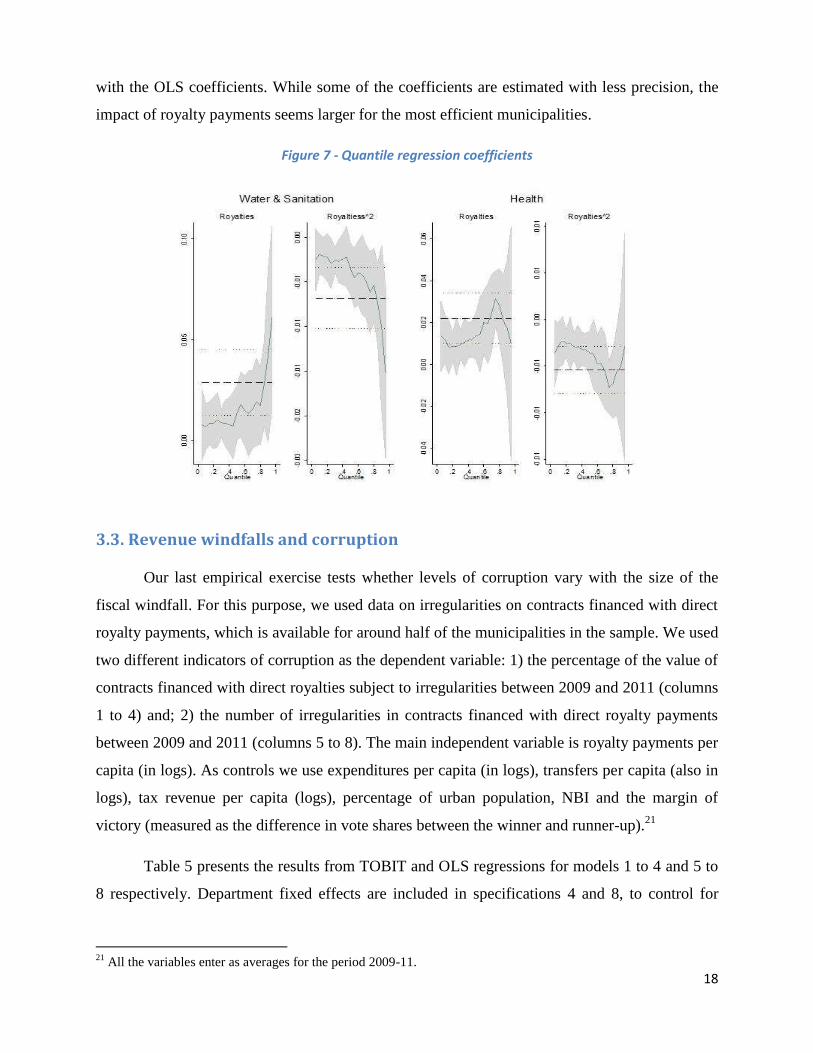
C. Quantile regression analysis
Finally, we use quantile regression (QR) in order to identify heterogeneous responses to royalty
payments over the entire distribution of efficiency scores. Using our preferred specification,
Figure 7 displays the coefficients of interest and their respective 95% confidence intervals, along
(1) (2) (3) (4) (5) (6) (7) (8)
ROYALTIES 0.116*** 0.034*** 0.032*** 0.030*** 0.055*** 0.024*** 0.023*** 0.022***
(0.009) (0.011) (0.010) (0.011) (0.007) (0.006) (0.006) (0.006)
ROYALTIES^2 -0.026*** -0.008*** -0.008*** -0.007*** -0.012*** -0.006*** -0.006*** -0.005***
(0.002) (0.002) (0.002) (0.003) (0.001) (0.001) (0.001) (0.001)
EXPENDITURES -0.660*** -0.600*** -0.611*** -0.098** -0.068* -0.052
(0.117) (0.107) (0.126) (0.043) (0.039) (0.041)
TRANSFERS -0.112 -0.054 0.004 -0.360*** -0.338*** -0.360***
(0.100) (0.092) (0.106) (0.044) (0.042) (0.044)
TAX REVENUES 0.138*** 0.086*** 0.097*** 0.097*** 0.077*** 0.047***
(0.033) (0.030) (0.032) (0.015) (0.013) (0.014)
% URBAN POPULATION 0.002*** 0.002*** 0.001*** 0.001***
(0.000) (0.000) (0.000) (0.000)
NBI -0.000 -0.000 0.000 -0.000
(0.000) (0.000) (0.000) (0.000)
MARGIN OF VICTORY -0.024 -0.005 -0.019 -0.045**
(0.027) (0.027) (0.021) (0.020)
Department FE? N N N Y N N N Y
Observations 1,045 1,045 1,045 1,045 1,076 1,076 1,076 1,076
Efficiency scores: water quality index Efficiency scores: infant mortality rate
Robust standard errors in parentheses
*** p<0.01, ** p<0.05, * p<0.1
18
with the OLS coefficients. While some of the coefficients are estimated with less precision, the
impact of royalty payments seems larger for the most efficient municipalities.
Figure 7 - Quantile regression coefficients
3.3. Revenue windfalls and corruption
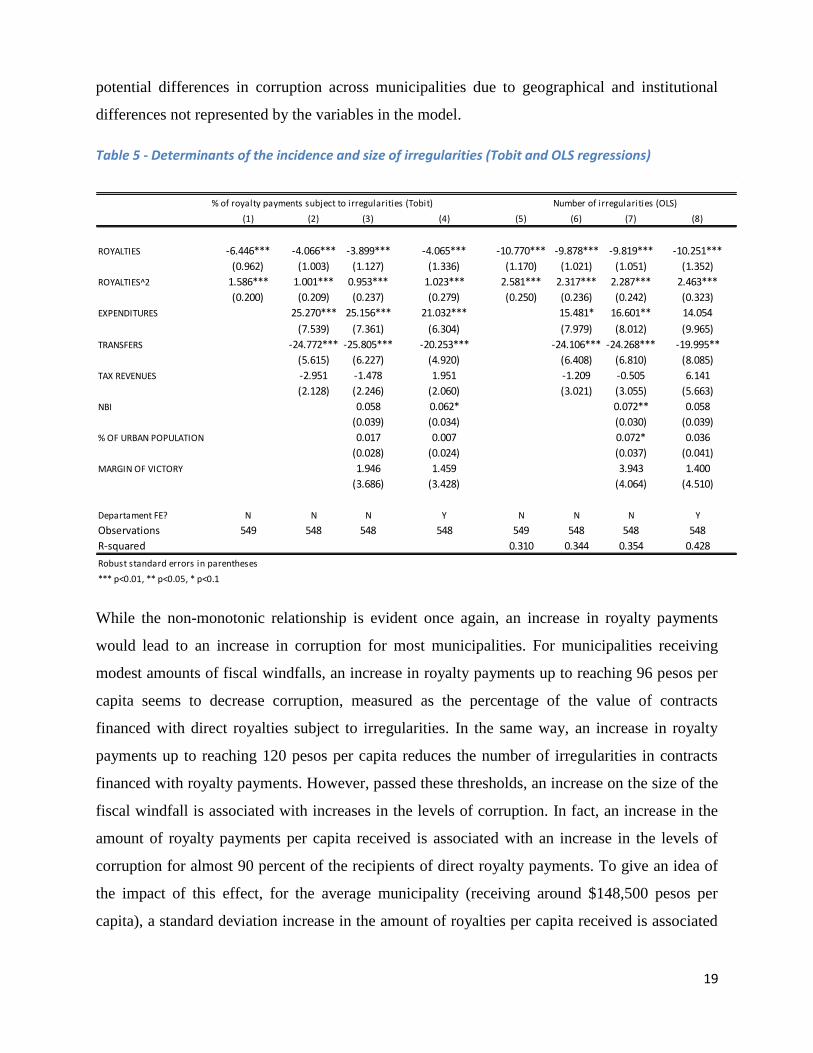
Our last empirical exercise tests whether levels of corruption vary with the size of the
fiscal windfall. For this purpose, we used data on irregularities on contracts financed with direct
royalty payments, which is available for around half of the municipalities in the sample. We used
two different indicators of corruption as the dependent variable: 1) the percentage of the value of
contracts financed with direct royalties subject to irregularities between 2009 and 2011 (columns
1 to 4) and; 2) the number of irregularities in contracts financed with direct royalty payments
between 2009 and 2011 (columns 5 to 8). The main independent variable is royalty payments per
capita (in logs). As controls we use expenditures per capita (in logs), transfers per capita (also in
logs), tax revenue per capita (logs), percentage of urban population, NBI and the margin of
victory (measured as the difference in vote shares between the winner and runner-up).21
Table 5 presents the results from TOBIT and OLS regressions for models 1 to 4 and 5 to
8 respectively. Department fixed effects are included in specifications 4 and 8, to control for
21
All the variables enter as averages for the period 2009-11.
19
potential differences in corruption across municipalities due to geographical and institutional
differences not represented by the variables in the model.
Table 5 - Determinants of the incidence and size of irregularities (Tobit and OLS regressions)
While the non-monotonic relationship is evident once again, an increase in royalty payments
would lead to an increase in corruption for most municipalities. For municipalities receiving
modest amounts of fiscal windfalls, an increase in royalty payments up to reaching 96 pesos per
capita seems to decrease corruption, measured as the percentage of the value of contracts
financed with direct royalties subject to irregularities. In the same way, an increase in royalty
payments up to reaching 120 pesos per capita reduces the number of irregularities in contracts
financed with royalty payments. However, passed these thresholds, an increase on the size of the
fiscal windfall is associated with increases in the levels of corruption. In fact, an increase in the
amount of royalty payments per capita received is associated with an increase in the levels of
corruption for almost 90 percent of the recipients of direct royalty payments. To give an idea of
the impact of this effect, for the average municipality (receiving around $148,500 pesos per
capita), a standard deviation increase in the amount of royalties per capita received is associated
(1) (2) (3) (4) (5) (6) (7) (8)
ROYALTIES -6.446*** -4.066*** -3.899*** -4.065*** -10.770*** -9.878*** -9.819*** -10.251***
(0.962) (1.003) (1.127) (1.336) (1.170) (1.021) (1.051) (1.352)
ROYALTIES^2 1.586*** 1.001*** 0.953*** 1.023*** 2.581*** 2.317*** 2.287*** 2.463***
(0.200) (0.209) (0.237) (0.279) (0.250) (0.236) (0.242) (0.323)
EXPENDITURES 25.270*** 25.156*** 21.032*** 15.481* 16.601** 14.054
(7.539) (7.361) (6.304) (7.979) (8.012) (9.965)
TRANSFERS -24.772*** -25.805*** -20.253*** -24.106*** -24.268*** -19.995**
(5.615) (6.227) (4.920) (6.408) (6.810) (8.085)
TAX REVENUES -2.951 -1.478 1.951 -1.209 -0.505 6.141
(2.128) (2.246) (2.060) (3.021) (3.055) (5.663)
NBI 0.058 0.062* 0.072** 0.058
(0.039) (0.034) (0.030) (0.039)
% OF URBAN POPULATION 0.017 0.007 0.072* 0.036
(0.028) (0.024) (0.037) (0.041)
MARGIN OF VICTORY 1.946 1.459 3.943 1.400
(3.686) (3.428) (4.064) (4.510)
Departament FE? N N N Y N N N Y
Observations 549 548 548 548 549 548 548 548
R-squared 0.310 0.344 0.354 0.428
% of royalty payments subject to irregularities (Tobit) Number of irregularities (OLS)
Robust standard errors in parentheses
*** p<0.01, ** p<0.05, * p<0.1
20
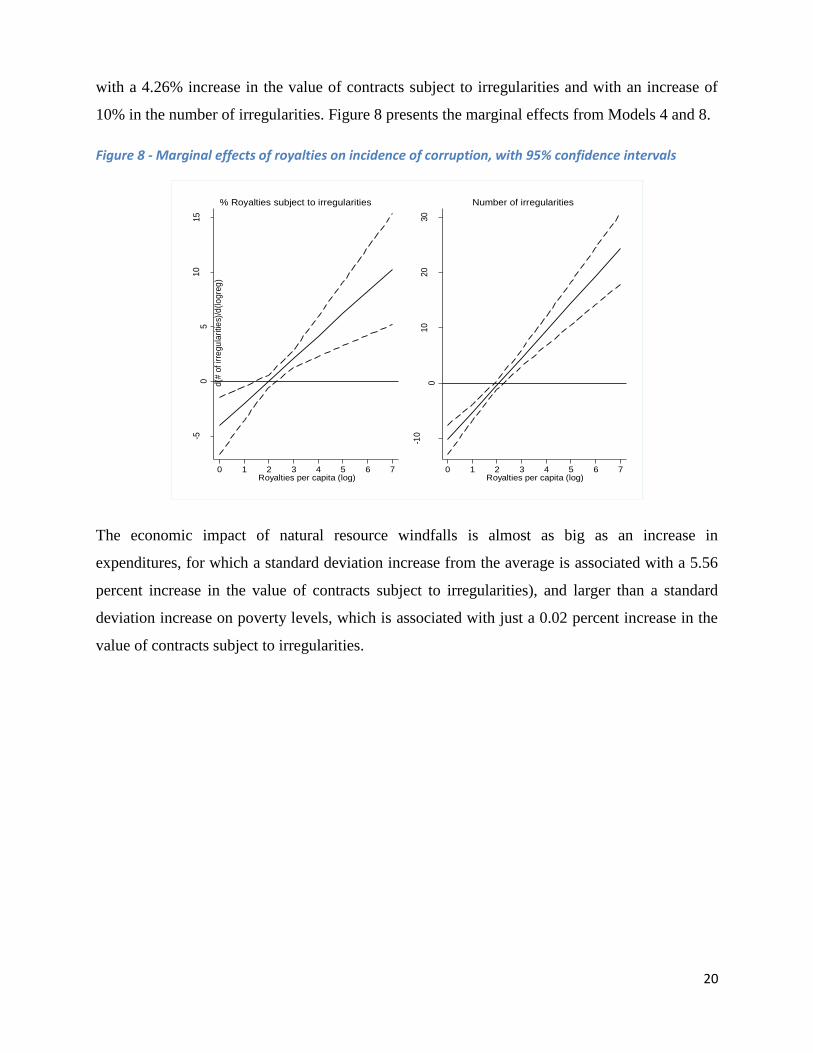
with a 4.26% increase in the value of contracts subject to irregularities and with an increase of
10% in the number of irregularities. Figure 8 presents the marginal effects from Models 4 and 8.
Figure 8 - Marginal effects of royalties on incidence of corruption, with 95% confidence intervals
The economic impact of natural resource windfalls is almost as big as an increase in
expenditures, for which a standard deviation increase from the average is associated with a 5.56
percent increase in the value of contracts subject to irregularities), and larger than a standard
deviation increase on poverty levels, which is associated with just a 0.02 percent increase in the
value of contracts subject to irregularities.
-50
510
15
d(%
ro
yalti
es
st ir
regu
lari
ties)
/d(lo
gre
g)
0 1 2 3 4 5 6 7Royalties per capita (log)
% Royalties subject to irregularities
-10
010
20
30
d(#
of ir
regu
lari
ties)
/d(lo
gre
g)
0 1 2 3 4 5 6 7Royalties per capita (log)
Number of irregularities
21
Conclusions
Taking advantage of a dramatic increase in oil and coal royalty payments transferred to some
Colombian municipalities during the 2000s, and using disaggregated public finance data, this
paper looks at the impact of revenue windfalls on the size and composition of local budgets, the
efficiency of public good provision, and the incidence of corruption. We find that while fiscal
windfalls boost government expenditures across the board, the efficiency of public spending at
the local level tends to decrease with the size of the windfall shock, although in a non-monotonic
fashion. In contrast, municipal own tax revenue sources are associated with higher efficiency
scores. Moreover, an increase in windfall revenue raises the incidence of local corruption.
Overall, our empirical findings point to the existence of a subnational resource curse, that is, a
negative impact of windfall revenue on government performance (efficiency, corruption),
paralleling subnational level evidence from other countries in Latin America such as Brazil
(Brollo et al 2013; Caselli and Michaels 2013; Ferraz and Monteiro 2012) and Peru (Maldonado
2014; Arreaza and Reuter 2012).
In general, we find that using fiscal windfalls in an efficient and clean manner cannot be
taken for granted at the local level. Thus, future research should provide a more detailed analysis
of the impact of resource booms on local political behavior and its implications in terms of
service delivery, the quality of public spending, and the probity of elected officials. In particular,
it would be useful to consider the effects of revenue windfall shocks on reelection outcomes,
political selection, and the instruments politicians use to affect these outcomes, such as service
delivery and the provision of public (vs. particularistic/clientelistic) goods.22
Along these lines, it
remains crucial to uncover particular conditions under which politicians will have incentives to
use windfall revenues efficiently, such as levels of electoral competition, or the presence of
institutional constraints that limit discretion over its use. The identification of these conditional
relationships or mechanisms is a necessary first step to understand variation in outcomes, detect
differential behavior, and thus, provide sound policy advice.
Finally, it is important to note that the New General System of Royalties (Sistema
General de Regalías-SGR) launched in 2012 is intended to overcome some of the problems
addressed in this paper (in particular, inefficiency and incidence of corruption). The new
governance structure redistributes royalty transfers among a wider set of subnational
22
Recent analysis along these lines includes Ferraz and Monteiro (2012) and Maldonado (2013).

22
governments, addresses territorial equity concerns by allocating the SGR budget based on
criteria such as population and relative poverty, and puts in place institutional mechanisms that
are supposed to enhance the quality of public investments funded through the SGR at the
subnational level. Thus, evaluating the extent to which the intended policy objectives of the SGR
have been achieved is an important area for future research.
23
Appendices
Appendix A. methodology for the distribution of royalty payments from the
FNR
Appendix B. The New System (2012 on)
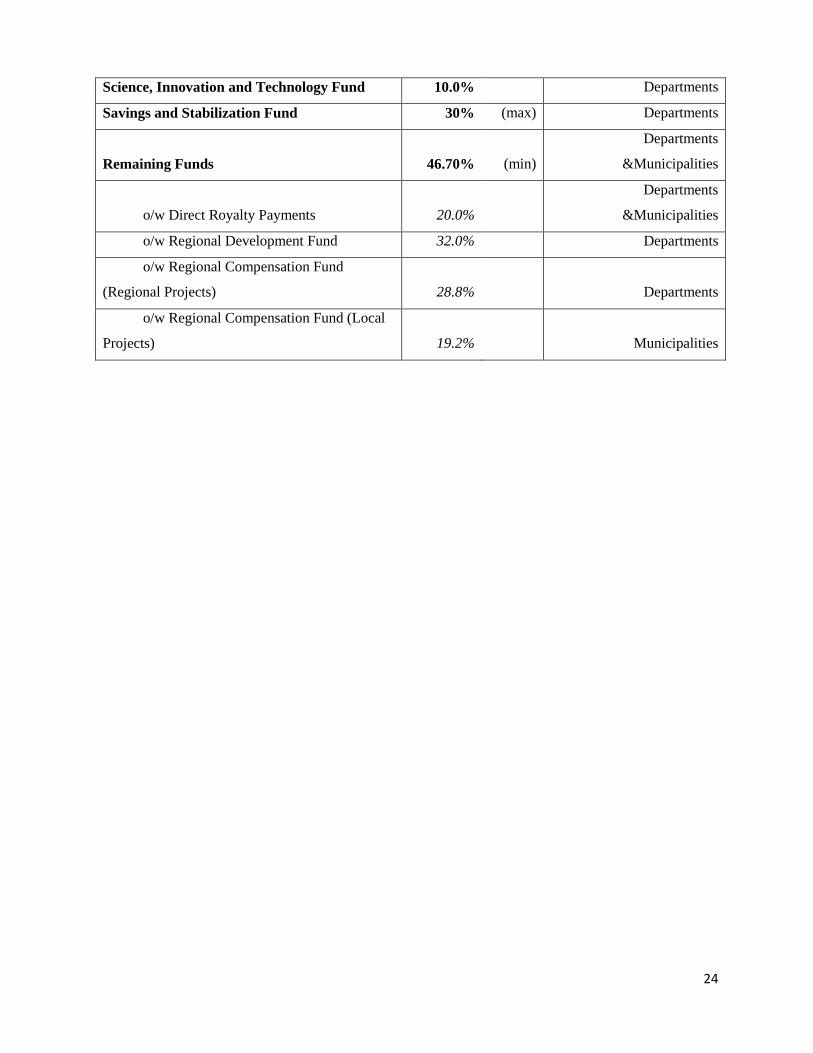
Under the new system (called Royalties General System, SGR), resources from royalties are distributed to
municipalities and departments through several separate funds. A maximum of 15.34% of the total SGR
are directly distributed to “producer” subnationals (with a transitory regime which allocated a 34.50% in
2012, and a 22% for the period 2013-2014).
In particular, the distribution of resources from royalties is as follows:
Allocation of Funds Share Beneficiaries
Oil Oversight and Mapping 2.0% n/a
SGR Operational Costs 1.3% n/a
Territorial Pension Funds (FONPET) 10.0%
Departments
&Municipalities
Criteria % Criteria % Criteria %
NBI
Economic capacity
Population density Population density 20%
Population
adjusted by
dispersion
30%
Harmonic
development
according to National
Development Plan
Population projections 20%
Amount of specific
allocations from
FNR
30%
Environmental, social
and economic impact
of the project
Balance from
resources from
production in
excess
10%
Participation of the
Regional Corporation
of Economic and
Social Planification
(CORPES)
Having been a FNR
beneficiary during
tha period or the
previous one.
-10%
Direct Royalties
received
Relationship between
direct royalties and total
revenues
20%
Project presented
by two or more
subnational
entities
10%
Article 13, Decree 1747 of 1995CONPES 3170 OF 2002/Resolution 419
of 2005
CONPES 3523 of
2008/Resolution 757 of 2008
30%Composite Index of
Development
Relationship between
royalties of FNR
specifically allocated and
total revenues
NBI
No
percentages
assigned
20%
20%
24
Science, Innovation and Technology Fund 10.0% Departments
Savings and Stabilization Fund 30% (max) Departments
Remaining Funds 46.70% (min)
Departments
&Municipalities
o/w Direct Royalty Payments 20.0%
Departments
&Municipalities
o/w Regional Development Fund 32.0% Departments
o/w Regional Compensation Fund
(Regional Projects) 28.8% Departments
o/w Regional Compensation Fund (Local
Projects) 19.2% Municipalities
25
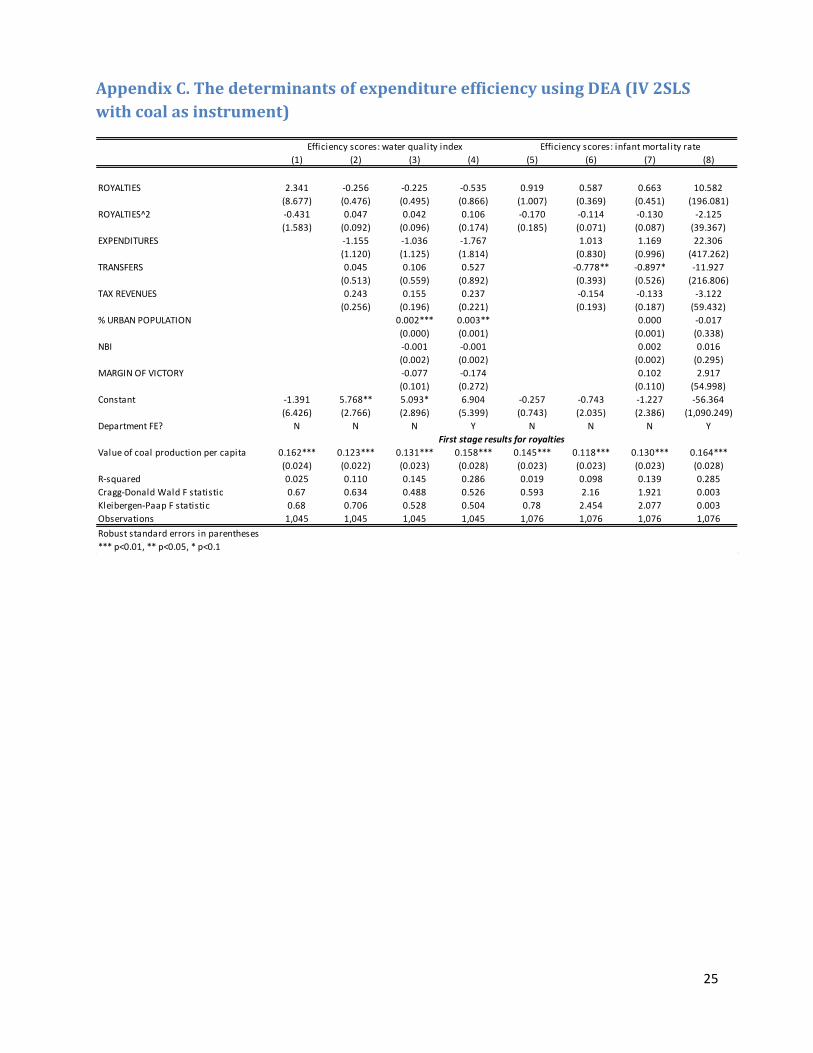
Appendix C. The determinants of expenditure efficiency using DEA (IV 2SLS
with coal as instrument)
(1) (2) (3) (4) (5) (6) (7) (8)
ROYALTIES 2.341 -0.256 -0.225 -0.535 0.919 0.587 0.663 10.582
(8.677) (0.476) (0.495) (0.866) (1.007) (0.369) (0.451) (196.081)
ROYALTIES^2 -0.431 0.047 0.042 0.106 -0.170 -0.114 -0.130 -2.125
(1.583) (0.092) (0.096) (0.174) (0.185) (0.071) (0.087) (39.367)
EXPENDITURES -1.155 -1.036 -1.767 1.013 1.169 22.306
(1.120) (1.125) (1.814) (0.830) (0.996) (417.262)
TRANSFERS 0.045 0.106 0.527 -0.778** -0.897* -11.927
(0.513) (0.559) (0.892) (0.393) (0.526) (216.806)
TAX REVENUES 0.243 0.155 0.237 -0.154 -0.133 -3.122
(0.256) (0.196) (0.221) (0.193) (0.187) (59.432)
% URBAN POPULATION 0.002*** 0.003** 0.000 -0.017
(0.000) (0.001) (0.001) (0.338)
NBI -0.001 -0.001 0.002 0.016
(0.002) (0.002) (0.002) (0.295)
MARGIN OF VICTORY -0.077 -0.174 0.102 2.917
(0.101) (0.272) (0.110) (54.998)
Constant -1.391 5.768** 5.093* 6.904 -0.257 -0.743 -1.227 -56.364
(6.426) (2.766) (2.896) (5.399) (0.743) (2.035) (2.386) (1,090.249)
Department FE? N N N Y N N N Y
Value of coal production per capita 0.162*** 0.123*** 0.131*** 0.158*** 0.145*** 0.118*** 0.130*** 0.164***
(0.024) (0.022) (0.023) (0.028) (0.023) (0.023) (0.023) (0.028)
R-squared 0.025 0.110 0.145 0.286 0.019 0.098 0.139 0.285
Cragg-Donald Wald F statistic 0.67 0.634 0.488 0.526 0.593 2.16 1.921 0.003
Kleibergen-Paap F statistic 0.68 0.706 0.528 0.504 0.78 2.454 2.077 0.003
Observations 1,045 1,045 1,045 1,045 1,076 1,076 1,076 1,076
Robust standard errors in parentheses
*** p<0.01, ** p<0.05, * p<0.1
Efficiency scores: water quality index Efficiency scores: infant mortality rate
First stage results for royalties
26
Figure A 1 - Volatility of municipal royalty payments, transfers and tax revenues by department (coefficient of variation, %)
Figure A 2-Correlation between DNP and efficiency scores
020
40
60
80
10
0
effic
ien
cy s
co
re D
NP
.2 .4 .6 .8 1efficiency score health (DEA)
020
40
60
80
10
0
0 .2 .4 .6 .8 1efficiency score water & sanitation (DEA)
27
Map 1 - Distribution of royalty payments in Colombia (average 2004-2011)
28
References
Ardanaz, M. 2014. Fiscal Windfalls, transparency, and the efficiency of public good provision:
evidence from Brazilian local governments. In Transparent Governance in an Age of
Abundance: Experiences from the Extractive Industries in Latin America and the Caribbean.
J.C. Vieyra and M. Masson (editors). Inter-American Development Bank
Arreaza, A., and A. Reuter. 2012. Can a Mining Windfall Improve Welfare? Evidence from Perú
with municipal level data, CAF.
Bonet, J. y J. Urrego (2014) El Sistema General de Regalías: ¿mejoró, empeoró o quedó igual?
Documentos de trabajo sobre economía regional, Cartagena: Banco de la República
Brollo, F., T. Nannicini, R. Perotti, and G. Tabellini. 2013. The political resource curse.
American Economic Review
Brosio, G., and J.P. Jimenez. 2012. The intergovernmental allocation of revenue from natural
resources: finding a balance between centripetal and centrifugal pressure. In Decentralization
and Reform in Latin America. Edward Elgar.
Caselli, F. and G. Micheals. 2013. “Do oil windfalls improve living standards? Evidence from
Brazil.” American Economic Journal: Applied Economics, 5, 208-238.
Caselli, F. and T. Cunningham. 2009. “Leader behavior and the natural resource curse”. Oxford
Economic Papers, 61, 628-650.
DNP (2014) Evaluación del desempeño integral de los municipios y distritos, Vigencia 2013.
Bogotá.
DNP (2012): “Una evaluación del impacto de las regalías directas y fondo nacional de regalías”,
Departamento Nacional de Planeación.
DNP (2007) “Las Regalías en Colombia” (Actualización de la Cartilla). Dirección General de
Regalías-DNP. November 2007.
Dube, O. and J. Vargas. 2013. “Commodity price shocks and civil conflict: Evidence from
Colombia. Review of Economic Studies
ECLAC (2015) El impacto fiscal de los recursos naturales no renovables en los paises de
America Latina. En Panorama fiscal de America Latina y el Caribe
Ferraz, C. and J. Monteiro. 2012. Does oil make leader unaccountable? Evidence from Brazil's
offshore oil boom, PUC RIO. Mimeo.
Gadenne, L. 2013. Tax Me, But Spend Wisely : The Political Economy of Taxes, Theory and
Evidence from Brazilian Local Governments. Paris School of Economics. Mimeo.
IMF (2014) 'Macroeconomic Policy Frameworks for Resource-Rich Developing Countries',
29
International Monetary Fund.
Karl, T. 1997. The Paradox of Plenty: Oil Booms and Petro States. University of California
Press. Berkeley.
Loayza, N., A. Mier y Teran, J. Rigolini. 2013. Poverty, Inequality, and the Local Natural
Resource Curse. World Bank.
Maldonado, S. 2014. The political effects of resource abundance: evidence from Perú. University
of California, Berkeley. Mimeo.
Martinez, L. (2014) “Sources of Revenue and Government Performance: Theory and Evidence
from Colombia. LSE.
Morgandi, Matteo. 2008. Extractive Industries Revenues Distribution at the Sub-National Level.
Revenue Watch Institute. Mimeo.
Perry, G., y M. Olivera (2009). El impacto del petróleo y la minería en el desarrollo regional y
local en Colombia.
OECD. 2014. Territorial Reviews: Colombia. OECD. Paris.
Robinson, J.A., Torvik, R., and Verdier, T. (2006) Political foundations of the resource
curse, Journal of Development Economics, 79, 447–68.
Ross, M. 1999. “The political economy of the resource curse.” World Politics, 53, 325-361.
Sachs, J. and A. Warner. 1995. “Natural resource abundance and economic growth.”
Unpublished manuscript. Harvard University.
Sanguinetti, P. 2012. Canon minero y decisiones fiscales subnacionales en el Perú. (CAF
Working Paper N°2010/01). Caracas: CAF.
Viale, C. y E. Cruzado. 2012. La distribucion de la renta de las Industrias Extractivas a los
Gobiernos Subnacionales en Ame rica Latina. Revenue Watch, Mimeo.
World Bank (2009) Colombia Decentralization. Options and Incentives for Efficiency. Volumes
I & II. The World Bank. August 2009.


