Completion Report
Project Numbers: 41116-013 and 41116-043
MFF Number: 0012
Loan Number: 3132
June 2021
India: Jammu and Kashmir Urban Sector Development Investment Program (Project 3 and Multitranche Financing Facility)
This document is being disclosed to the public in accordance with ADB’s Access to Information Policy.
CURRENCY EQUIVALENTS
Currency unit – Indian rupee/s (₹)
At Appraisal At Project Completion
16 February 2007 2 November 2017 ₹1.00 = $0.0236 $0.0154 $1.00 = ₹42.375 ₹64.935
ABBREVIATIONS
ADB – Asian Development Bank AEFS APFS CAGR
– – –
audited entity financial statement audited project financial statement compound annual growth rate
DMF – design and monitoring framework DSC – design and supervision consultant EIRR – economic internal rate of return
ERA – Economic Reconstruction Agency GAP – gender action plan HUDD – Housing and Urban Development Department IEE – initial environmental examination km – kilometer lpcd – liters per capita per day MFF – multitranche financing facility m mld NRW
– – –
meter million liters per day nonrevenue water
O&M – operation and maintenance PHED – Public Health Engineering Department PIU – project implementation unit PMC – program management consultant PMU – project management unit PWD – Public Works Department STP – sewage treatment plant SWM TA
– –
solid waste management technical assistance
ULB – urban local body
WTP – water treatment plant
NOTES
(i) The fiscal year (FY) of the Government of India ends on 31 March. “FY” before a calendar year denotes the year in which the fiscal year ends, e.g., FY2021 ends on 31 March 2021.
(ii) In this report, “$” refers to United States dollars.
Vice-President Shixin Chen, Operations 1
Director General Kenichi Yokoyama, South Asia Department (SARD)
Director Norio Saito, Urban Development and Water Division (SAUW), SARD
Team leader Momoko Tada, Urban Development Specialist, SAUW, SARD
Team members Deepa Ahluwalia, Senior Social Development Officer (Gender), India Resident Mission (INRM), SARD
Saswati Belliappa, Safeguards Specialist, SAUW, SARD Bhawna Kulshreshtha, Executive Assistant, INRM, SARD Pradeep Kumar Pandey, Associate Operations Analyst, INRM, SARD Girish Mahajan, Senior Environment Officer, INRM, SARD Rodellyn Manalac, Operations Assistant, SAUW, SARD Suhail Mircha, Safeguard Officer, INRM, SARD
In preparing any country program or strategy, financing any project, or by making any designation of or reference to a particular territory or geographic area in this document, the Asian Development Bank does not intend to make any judgments as to the legal or other status of any territory or area.
CONTENTS Page
BASIC DATA i
I. PROJECT DESCRIPTION 1
II. DESIGN AND IMPLEMENTATION 2
A. Project Design and Formulation 2
B. Facility and Project Outputs 4
C. Project Costs and Financing 6
D. Disbursements 7
E. Project 3 and Facility Schedule 7
F. Implementation Arrangements 8
G. Technical Assistance 8
H. Consultant Recruitment and Procurement 8
I. Gender Equity 9
J. Safeguards 10
K. Monitoring and Reporting 10
III. EVALUATION OF PERFORMANCE 11
A. Relevance 11
B. Effectiveness 12
C. Efficiency 13
D. Sustainability 14
E. Development Impact 15
F. Performance of the Borrower and the Executing Agency 16
G. Performance of the Asian Development Bank 17
H. Overall Assessment 17
IV. ISSUES, LESSONS, AND RECOMMENDATIONS 17
A. Issues and Lessons 17
B. Recommendations 18 APPENDIXES
1-1. Design and Monitoring Framework for Multitranche Financing Facility 19
1-2. Design and Monitoring Framework for Project 3 27
2. Status of Actual Plan for Institutional Reform Programs 31
3-1. Multitranche Financing Facility Project Cost at Appraisal and Actual 34
3-2. Project 3 Project Cost at Appraisal and Actual 35
4-1. Multitranche Financing Facility Project Cost at Appraisal and at Completion
by Financier 36
4-2. Project 3 Project Cost at Appraisal and at Completion by Financier 37
5. Disbursement of ADB Loan Proceeds 38
6. Contract Awards of ADB Loan Proceeds 39
7. Chronology of Main Events 40
8. Summary of Contract Details 41
9-1. Status of Compliance with Representation and Warranties 42
9-2. Status of Compliance with Loan Covenants 43
10. Implementation of Gender Action Plan and Achievements 56
11. Safeguards Assessments 68
12. Economic and Financial Analysis 72
13. Contribution of the Project 3 to Strategy 2030 Operational Priorities 92
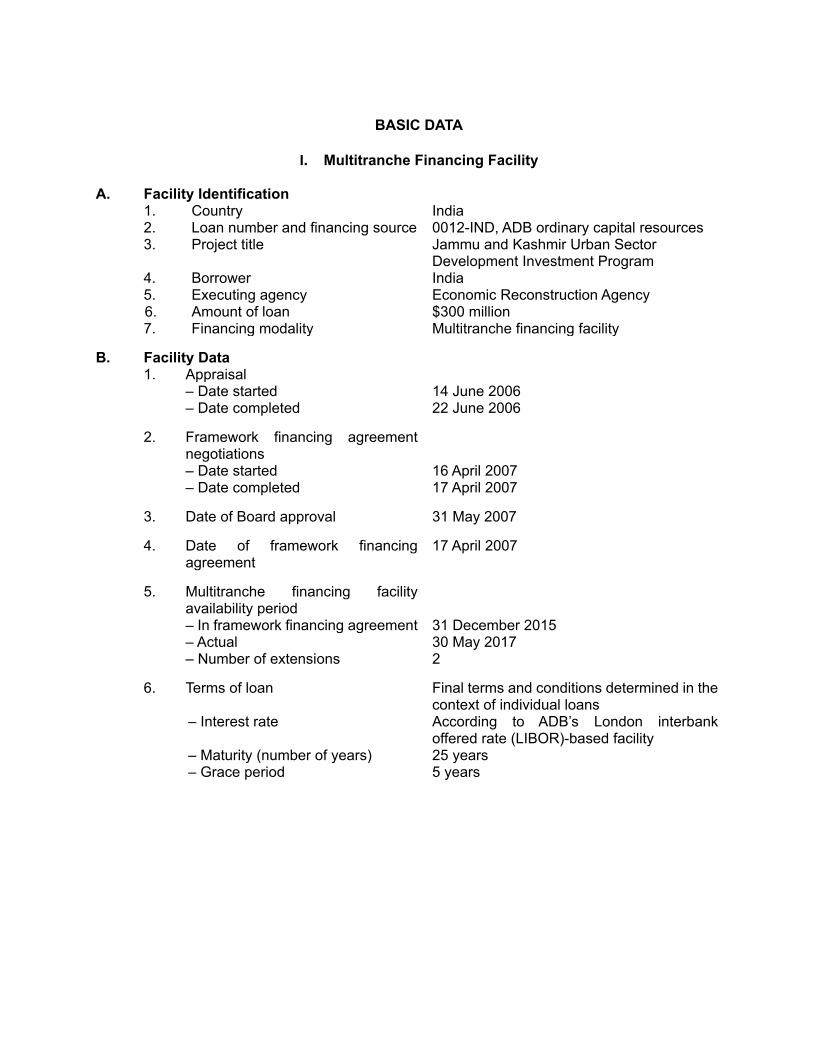
BASIC DATA
I. Multitranche Financing Facility
A. Facility Identification 1. Country 2. Loan number and financing source 3. Project title 4. Borrower 5. Executing agency
6. Amount of loan 7. Financing modality
India 0012-IND, ADB ordinary capital resources Jammu and Kashmir Urban Sector Development Investment Program India Economic Reconstruction Agency $300 million Multitranche financing facility
B. Facility Data 1. Appraisal – Date started – Date completed
2. Framework financing agreement negotiations
– Date started – Date completed
3. Date of Board approval
4. Date of framework financing agreement
5. Multitranche financing facility availability period
– In framework financing agreement – Actual – Number of extensions
6. Terms of loan – Interest rate – Maturity (number of years) – Grace period
14 June 2006 22 June 2006
16 April 2007 17 April 2007
31 May 2007
17 April 2007
31 December 2015 30 May 2017 2
Final terms and conditions determined in the context of individual loans According to ADB’s London interbank offered rate (LIBOR)-based facility 25 years 5 years
ii
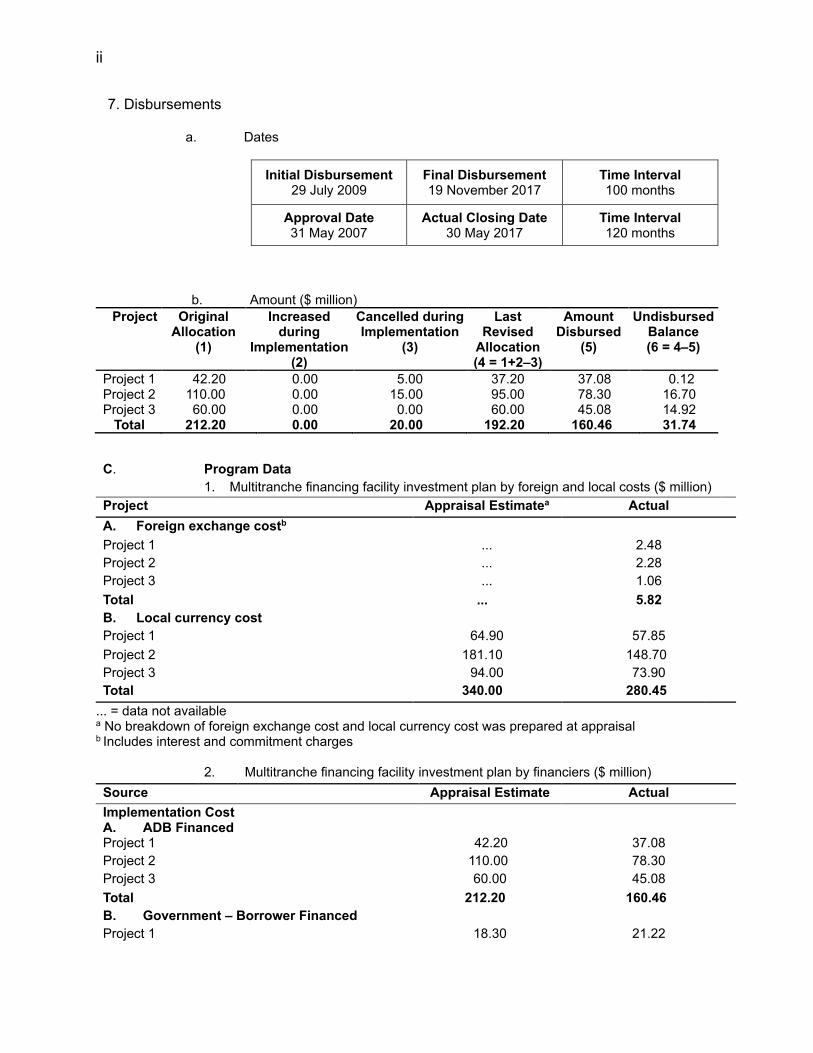
7. Disbursements
a. Dates
Initial Disbursement
29 July 2009
Final Disbursement 19 November 2017
Time Interval 100 months
Approval Date 31 May 2007
Actual Closing Date 30 May 2017
Time Interval 120 months
b. Amount ($ million)
Project Original Allocation
(1)
Increased during
Implementation (2)
Cancelled during Implementation
(3)
Last Revised
Allocation (4 = 1+2–3)
Amount Disbursed
(5)
Undisbursed Balance (6 = 4–5)
Project 1 42.20 0.00 5.00 37.20 37.08 0.12 Project 2 110.00 0.00 15.00 95.00 78.30 16.70 Project 3 60.00 0.00 0.00 60.00 45.08 14.92 Total 212.20 0.00 20.00 192.20 160.46 31.74
C. Program Data
1. Multitranche financing facility investment plan by foreign and local costs ($ million)
Project Appraisal Estimatea Actual
A. Foreign exchange costb
Project 1 ... 2.48
Project 2 ... 2.28
Project 3 ... 1.06
Total ... 5.82
B. Local currency cost
Project 1 64.90 57.85
Project 2 181.10 148.70
Project 3 94.00 73.90
Total 340.00 280.45
... = data not available a No breakdown of foreign exchange cost and local currency cost was prepared at appraisal b Includes interest and commitment charges
2. Multitranche financing facility investment plan by financiers ($ million)
Source Appraisal Estimate Actual
Implementation Cost A. ADB Financed
Project 1 42.20 37.08
Project 2 110.00 78.30
Project 3 60.00 45.08
Total 212.20 160.46
B. Government – Borrower Financed
Project 1 18.30 21.22
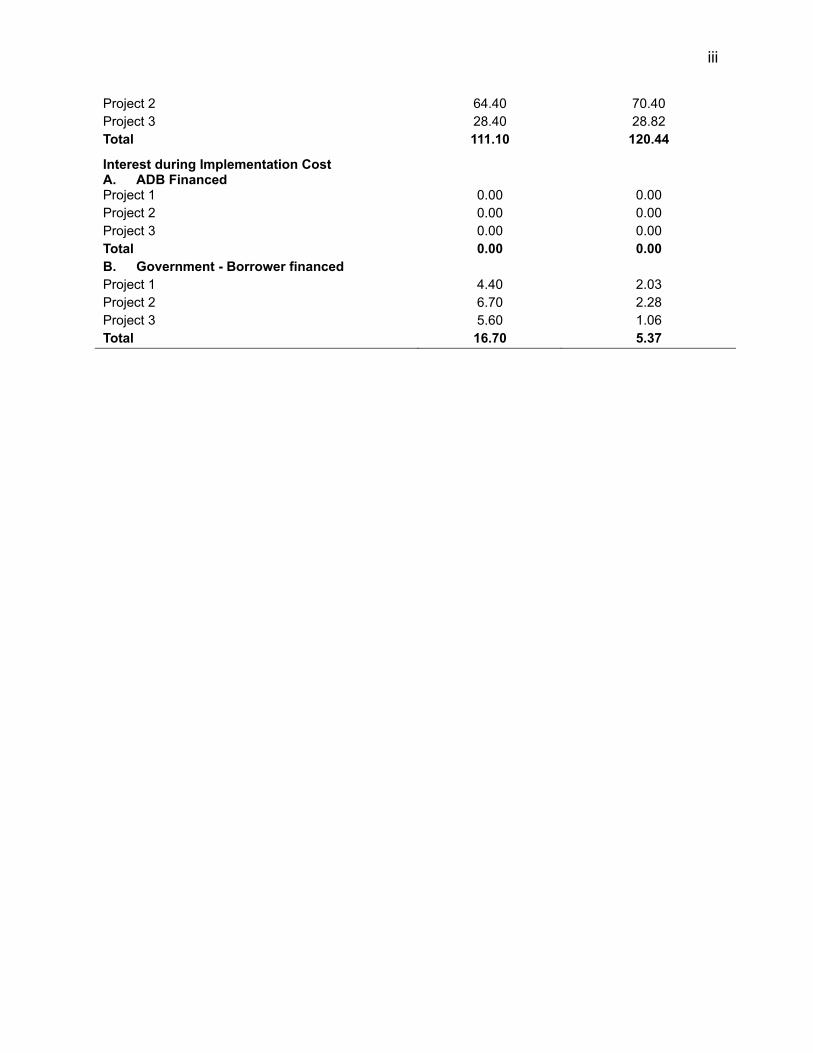
iii
Project 2 64.40 70.40
Project 3 28.40 28.82
Total 111.10 120.44
Interest during Implementation Cost A. ADB Financed
Project 1 0.00 0.00
Project 2 0.00 0.00
Project 3 0.00 0.00
Total 0.00 0.00
B. Government - Borrower financed
Project 1 4.40 2.03
Project 2 6.70 2.28
Project 3 5.60 1.06
Total 16.70 5.37
iv
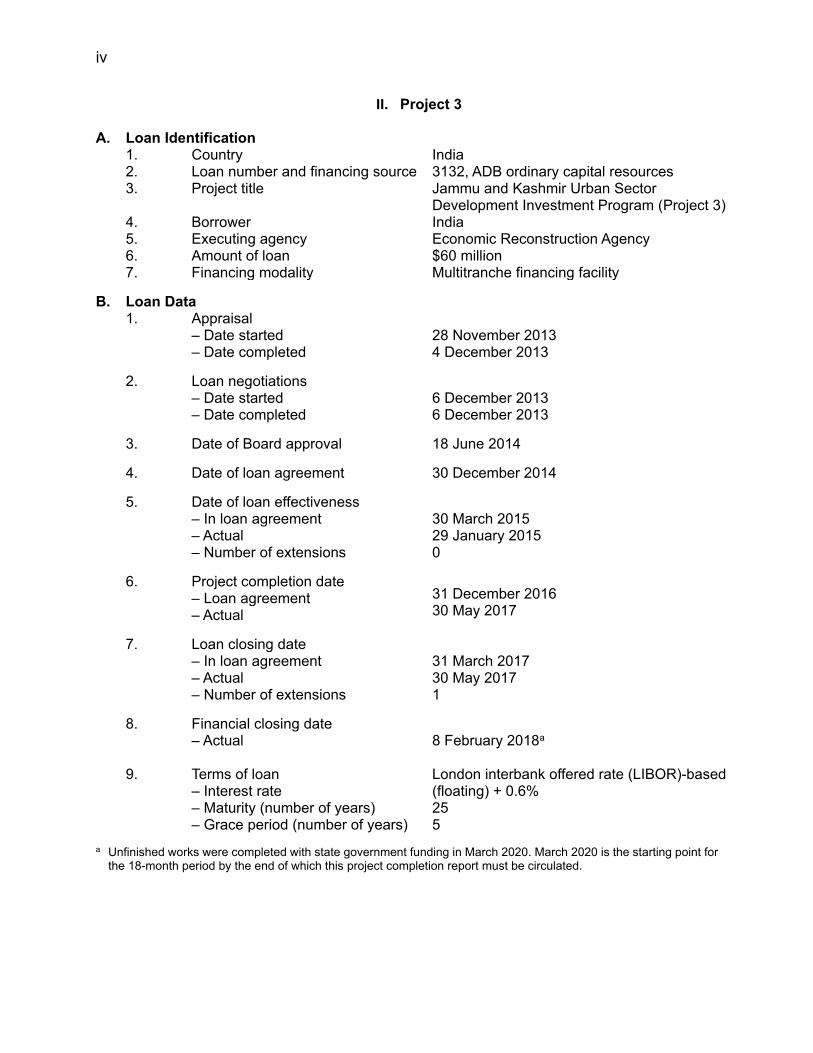
II. Project 3 A. Loan Identification 1. Country 2. Loan number and financing source 3. Project title 4. Borrower 5. Executing agency
6. Amount of loan 7. Financing modality
India 3132, ADB ordinary capital resources Jammu and Kashmir Urban Sector Development Investment Program (Project 3) India Economic Reconstruction Agency $60 million Multitranche financing facility
B. Loan Data 1. Appraisal – Date started – Date completed
2. Loan negotiations – Date started – Date completed
3. Date of Board approval
4. Date of loan agreement
5. Date of loan effectiveness – In loan agreement – Actual – Number of extensions
6. Project completion date – Loan agreement – Actual
7. Loan closing date – In loan agreement
– Actual – Number of extensions
8. Financial closing date – Actual 9. Terms of loan – Interest rate – Maturity (number of years) – Grace period (number of years)
28 November 2013 4 December 2013
6 December 2013 6 December 2013
18 June 2014
30 December 2014
30 March 2015 29 January 2015 0
31 December 2016 30 May 2017 31 March 2017 30 May 2017 1
8 February 2018a London interbank offered rate (LIBOR)-based (floating) + 0.6% 25 5
a Unfinished works were completed with state government funding in March 2020. March 2020 is the starting point for the 18-month period by the end of which this project completion report must be circulated.
v
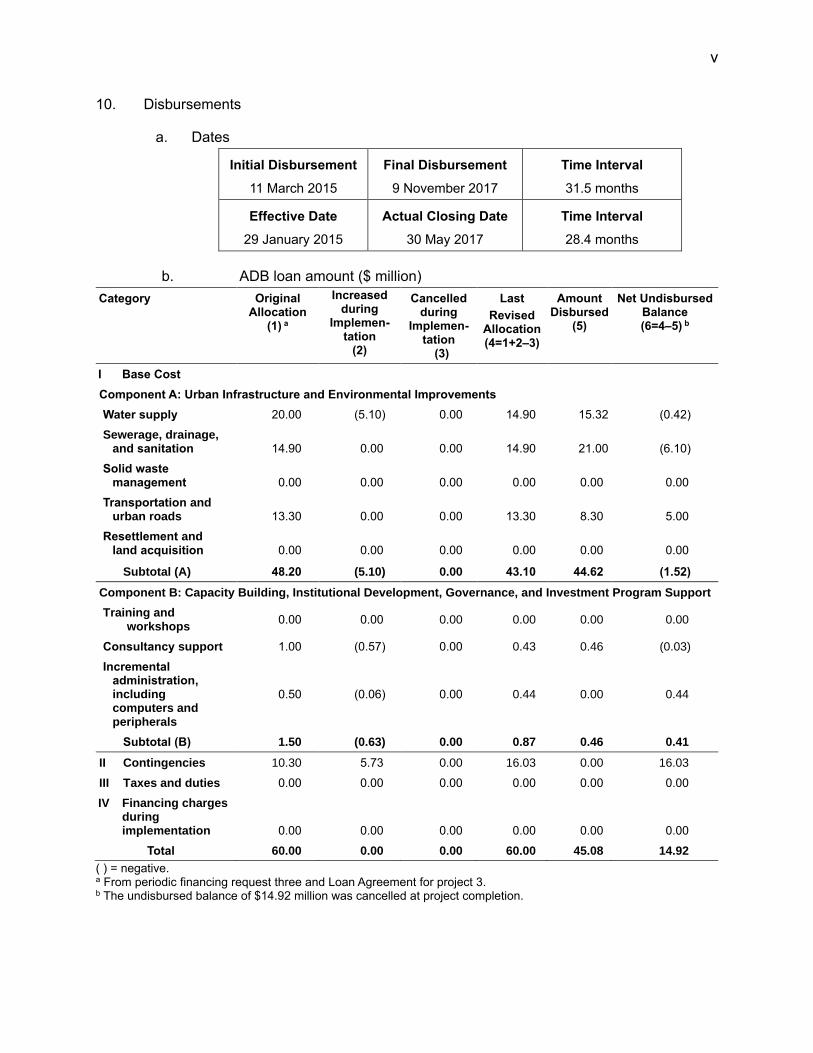
10. Disbursements
a. Dates
Initial Disbursement
11 March 2015
Final Disbursement
9 November 2017
Time Interval
31.5 months
Effective Date
29 January 2015
Actual Closing Date
30 May 2017
Time Interval
28.4 months
b. ADB loan amount ($ million)
Category Original Allocation
(1) a
Increased during
Implemen- tation
(2)
Cancelled during
Implemen- tation (3)
Last
Revised Allocation (4=1+2–3)
Amount Disbursed
(5)
Net Undisbursed Balance (6=4–5) b
I Base Cost
Component A: Urban Infrastructure and Environmental Improvements
Water supply 20.00 (5.10) 0.00 14.90 15.32 (0.42)
Sewerage, drainage, and sanitation 14.90 0.00 0.00 14.90 21.00 (6.10)
Solid waste management 0.00 0.00 0.00 0.00 0.00 0.00
Transportation and urban roads 13.30 0.00 0.00 13.30 8.30 5.00
Resettlement and land acquisition 0.00 0.00 0.00 0.00 0.00 0.00
Subtotal (A) 48.20 (5.10) 0.00 43.10 44.62 (1.52)
Component B: Capacity Building, Institutional Development, Governance, and Investment Program Support
Training and workshops
0.00 0.00 0.00 0.00 0.00 0.00
Consultancy support 1.00 (0.57) 0.00 0.43 0.46 (0.03)
Incremental administration, including computers and peripherals
0.50 (0.06) 0.00 0.44 0.00 0.44
Subtotal (B) 1.50 (0.63) 0.00 0.87 0.46 0.41
II Contingencies 10.30 5.73 0.00 16.03 0.00 16.03
III Taxes and duties 0.00 0.00 0.00 0.00 0.00 0.00
IV Financing charges during implementation 0.00 0.00 0.00 0.00 0.00 0.00
Total 60.00 0.00 0.00 60.00 45.08 14.92
( ) = negative. a From periodic financing request three and Loan Agreement for project 3. b The undisbursed balance of $14.92 million was cancelled at project completion.
vi
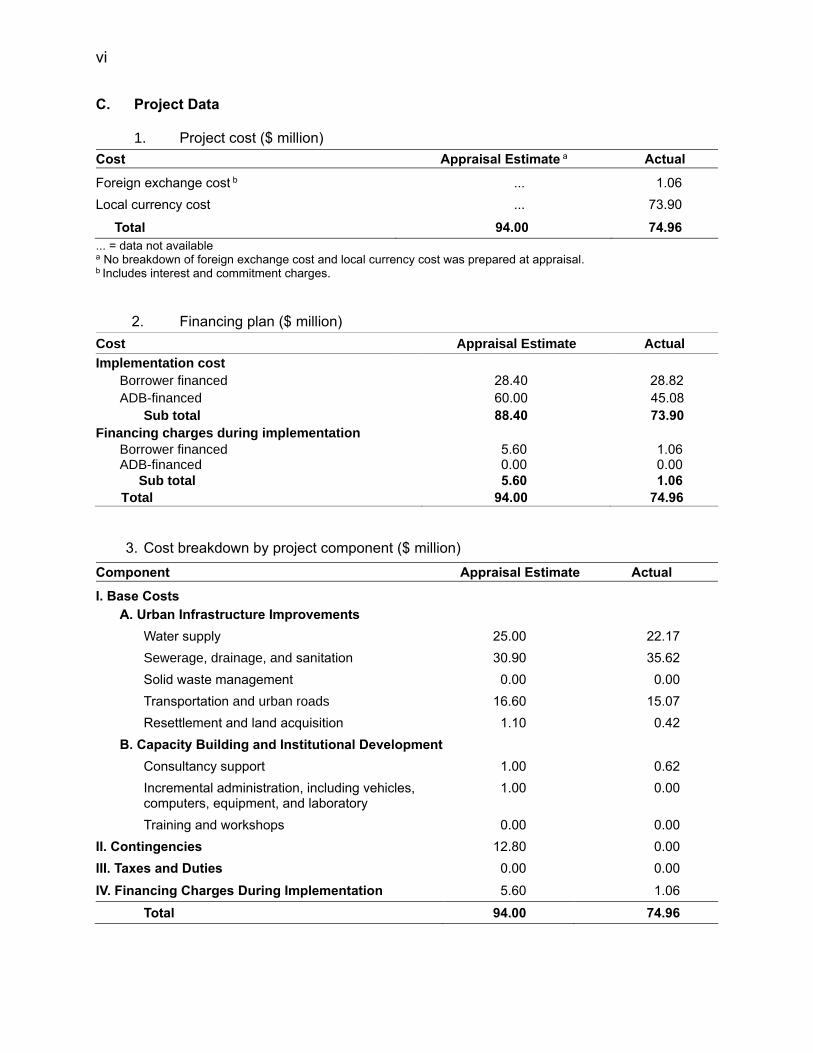
C. Project Data
1. Project cost ($ million)
Cost Appraisal Estimate a Actual
Foreign exchange cost b ... 1.06
Local currency cost ... 73.90
Total 94.00 74.96
... = data not available a No breakdown of foreign exchange cost and local currency cost was prepared at appraisal. b Includes interest and commitment charges.
2. Financing plan ($ million)
Cost Appraisal Estimate Actual
Implementation cost
Borrower financed 28.40 28.82
ADB-financed 60.00 45.08
Sub total 88.40 73.90
Financing charges during implementation
Borrower financed ADB-financed
5.60 0.00
1.06 0.00
Sub total 5.60 1.06
Total 94.00 74.96
3. Cost breakdown by project component ($ million)
Component Appraisal Estimate Actual
I. Base Costs
A. Urban Infrastructure Improvements
Water supply 25.00 22.17
Sewerage, drainage, and sanitation 30.90 35.62
Solid waste management 0.00 0.00
Transportation and urban roads 16.60 15.07
Resettlement and land acquisition 1.10 0.42
B. Capacity Building and Institutional Development
Consultancy support 1.00 0.62
Incremental administration, including vehicles, computers, equipment, and laboratory
1.00 0.00
Training and workshops 0.00 0.00
II. Contingencies 12.80 0.00
III. Taxes and Duties 0.00 0.00
IV. Financing Charges During Implementation 5.60 1.06
Total 94.00 74.96
vii
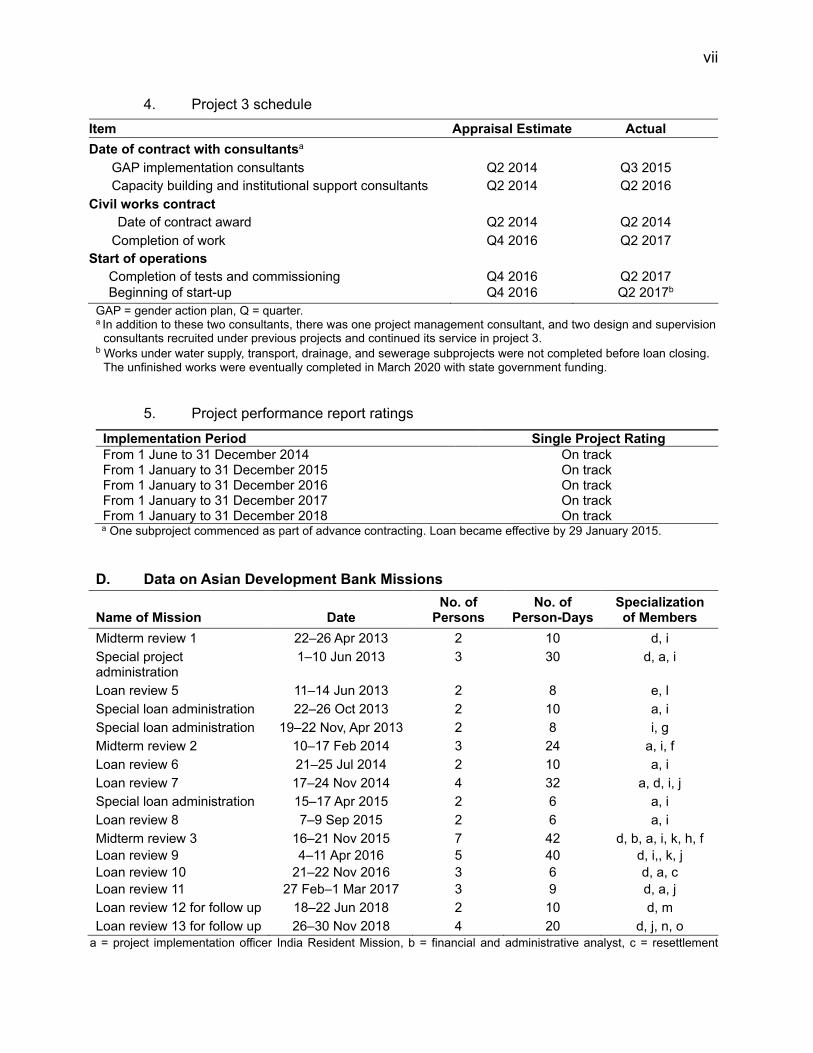
4. Project 3 schedule
Item Appraisal Estimate Actual
Date of contract with consultantsa
GAP implementation consultants Q2 2014 Q3 2015
Capacity building and institutional support consultants Q2 2014 Q2 2016
Civil works contract
Date of contract award Q2 2014 Q2 2014
Completion of work Q4 2016 Q2 2017
Start of operations
Completion of tests and commissioning Q4 2016 Q2 2017
Beginning of start-up Q4 2016 Q2 2017b
GAP = gender action plan, Q = quarter. a In addition to these two consultants, there was one project management consultant, and two design and supervision
consultants recruited under previous projects and continued its service in project 3. b Works under water supply, transport, drainage, and sewerage subprojects were not completed before loan closing.
The unfinished works were eventually completed in March 2020 with state government funding.
5. Project performance report ratings
Implementation Period Single Project Rating
From 1 June to 31 December 2014 On track From 1 January to 31 December 2015 On track From 1 January to 31 December 2016 On track From 1 January to 31 December 2017 On track From 1 January to 31 December 2018 On track a One subproject commenced as part of advance contracting. Loan became effective by 29 January 2015.
D. Data on Asian Development Bank Missions
Name of Mission Date No. of
Persons No. of
Person-Days Specialization of Members
Midterm review 1 22–26 Apr 2013 2 10 d, i
Special project administration
1–10 Jun 2013 3 30 d, a, i
Loan review 5 11–14 Jun 2013 2 8 e, l
Special loan administration 22–26 Oct 2013 2 10 a, i
Special loan administration 19–22 Nov, Apr 2013 2 8 i, g
Midterm review 2 10–17 Feb 2014 3 24 a, i, f
Loan review 6 21–25 Jul 2014 2 10 a, i
Loan review 7 17–24 Nov 2014 4 32 a, d, i, j
Special loan administration 15–17 Apr 2015 2 6 a, i
Loan review 8 7–9 Sep 2015 2 6 a, i
Midterm review 3
Loan review 9
Loan review 10
Loan review 11
16–21 Nov 2015
4–11 Apr 2016
21–22 Nov 2016
27 Feb–1 Mar 2017
7
5
3
3
42
40
6
9
d, b, a, i, k, h, f
d, i,, k, j
d, a, c
d, a, j
Loan review 12 for follow up 18–22 Jun 2018 2 10 d, m
Loan review 13 for follow up 26–30 Nov 2018 4 20 d, j, n, o
a = project implementation officer India Resident Mission, b = financial and administrative analyst, c = resettlement

viii
specialist, d = urban development specialist South Asia Urban Development Division, e = urban economist South Asia Urban Development Division, f = project analyst India Resident Mission, g = safeguard specialist, h = environmental specialist, i = associate project analyst, r = project counsel, j = consultant project specialist, k = gender consultant, l = transport specialist, m = country director India Resident Mission, n = principal portfolio management specialist, o = urban specialist India Resident Mission. Source: Asian Development Bank.
I. PROJECT DESCRIPTION 1. The Jammu and Kashmir Urban Sector Development Investment Program was designed to expand and upgrade urban services and strengthen institutional capacity in the major urban areas of the state to Indian national and state standards. The focus was on providing an improved living environment to the population including the poor and other low-income segments. The program aimed to enhance public access to water supply, sanitation, drainage, and road facilities for more than 2.4 million people living in the state’s two main cities of Srinagar and Jammu (the target towns) and other selected towns.1 It also aimed to modernize and streamline the planning, operation and maintenance (O&M), and administrative functions of the responsible departments.2 2. The Asian Development Bank (ADB) approved the program as a multitranche financing facility (MFF) on 31 May 2007 at an estimated cost of $485 million. 3 The ADB loan was $300 million, and the government contribution was $185 million. The MFF had three projects: (i) project 1 of $42 million (loan 2331-IND); (ii) project 2 of $110 million (Loan 2925-IND); and (iii) project 3 of $60 million (loan 3132-IND).4 Project 3 was approved on 18 June 2014 for project cost of $94 million including a government contribution of $34 million. It was signed on 30 December 2014 and declared effective on 29 August 2015.5 3. The MFF including project 3 aimed to achieve the expected impact and outcomes through the following outputs:
(i) Part A: Urban infrastructure improved through investments in water supply, sewerage systems, drainage, solid waste management (SWM), and urban transport. Project 3 supported water supply, drainage, and urban transport which are essential to meeting the overall objectives of the investment program.
(ii) Part B: Capacity development and institutions developed 6 through (a) establishment of semi-autonomous entities responsible for water supply, sewerage, and drainage operations; (b) establishment of e-governance system; (c) improved financial performance inclusive of tariff revisions for municipal corporation services; (d) improved accounting and financial management systems, and (e) knowledge management and capacity building.
4. At appraisal, the MFF was expected to benefit (i) 2.2 million people with access to municipal water supply; (ii) 1.0 million people with access to proper sanitation, either through sewerage or onsite facilities; (iii) 2.0 million people served by a properly functioning drainage system; (iv) 2.0 million people receiving solid waste collection services; and (v) 2.4 million people
1 During implementation, the other selected towns had to be dropped for security reasons. 2 Responsibility for basic urban services was shared among government entities as follows: capital works were
planned, designed, and implemented by the state Economic Reconstruction Agency (ERA) on behalf of the ULBs. O&M responsibility was as follows: (i) water supply systems under the state’s Public Health Engineering Department (PHED), (ii) sewerage systems were under the state Housing and Urban Development Department (HUDD), and (iii) solid waste facilities and transportation were under the ULBs. Billing and fee collection are operated by the respective entities but revenues are passed to the state. The complexity of the arrangements made capacity building essential to ensure close cooperation between the ERA and these entities.
3 ADB. 2007. Report and Recommendation of the President to the Board of Directors: Proposed Multitranche Financing Facility to India for the Jammu and Kashmir Urban Sector Development Investment Project. Manila.
4 The periodic financing requests for projects 1, 2, and 3 were; ADB. 2007, 2012, and 2014. Periodic Financing Request Report. Jammu and Kashmir Urban Sector Development Investment Program. Manila. Due to implementation delay including from local unrest, it was assessed that utilizing full $300 million was not feasible.
5 ADB. 2014. Jammu and Kashmir Urban Sector Development Investment Program - Tranche 3. Project Data Sheet. 6 Included subcomponents were continued through earlier projects and loans for the duration of the MFF.
2
having access to better road facilities.7 For institutional reforms, the MFF aimed to (i) put sector reforms in place, (ii) mainstream capacity building as part of the state urban development budget, (iii) demonstrate capacities of agencies in effective O&M, and (iv) increase public-private partnership delivery.
II. DESIGN AND IMPLEMENTATION A. Project Design and Formulation 5. The MFF and project 3 were designed in accordance with government and ADB sector strategies at appraisal. They were consistent with India’s Tenth, Eleventh, and Twelfth Five-Year Plans (2002–2017), which emphasized improvement in and augmentation of economic and social infrastructure and provision of improved municipal services in urban areas.8 They were also consistent with the state government approaches and strategies to enhance the quality of life by narrowing poverty and regional disparities, improving basic services, and developing infrastructure.9 The MFF and project 3 were also aligned with the ADB country partnership strategy and program, 2003–2006, and country partnership strategy for 2009–2012 and 2013–2017 for India aimed to support faster, more inclusive, and sustainable growth as envisaged in the 5-year plans by emphasizing infrastructure development, job creation, and environmental sustainability.10 Although the MFF and project 3 predated ADB Strategy 2030, they contributed to the following operational priorities (OPs): (i) making cities more livable (OP4); (ii) strengthening governance and institutional capacity (OP6); (iii) addressing remaining poverty and reducing inequalities (OP1); and (iv) accelerating progress in gender equality (OP2).11 6. Learnings from the first ADB loan in the state that preceded the MFF, and from other ADB projects in India had shown that project sustainability depends on three main imperatives:12 (i) subprojects are selected through extensive consultation with a wide range of stakeholders and following a demand-driven approach, (ii) institutional development is undertaken to ensure that adequate O&M funds are mobilized from internal resources and there are gradual transfers from the state to responsible institutions, and (iii) capacity building in service delivery institutions is undertaken to adopt corporatized or commercially oriented operations that include user. These imperatives guided selection of subprojects under the MFF based on public consultations, as well as subsector masterplans. Also in line with these imperatives, investments under the MFF were linked with incremental reforms and substantive support to build institutional capacity and ensure
7 All interventions under the MFF were in Srinagar and Jammu. Water supply, drainage and transport improvements
were carried out in both the towns. SWM was implemented only in Srinagar and sewerage works were only in Jammu. Institutional capacity development was implemented in both the towns.
8 Government of India Planning Commission. 2002. Tenth Five-Year Plan, 2002–2007. New Delhi; Government of India Planning Commission. 2007. Eleventh Five-Year Plan, 2007–2012. New Delhi; and Government of India Planning Commission. 2013. Twelfth Five-Year Plan, 2013-2017. New Delhi.
9 State government. 2007. Eleventh Five-Year Plan (2007–2012); and State government Planning and Development Department. 2013. Twelfth Five Year Plan (2013-2017). At appraisal, the MFF was also consistent with the state’s sector road map in conjunction with the Jawaharlal Nehru National Urban Renewal Mission (JNNURM), through which the Government of India fast-tracks reform-driven development in 63 major towns of India.
10 ADB. 2003. India: Country Strategy and Program, 2003-2006. Manila; 2009. India Country Partnership Strategy, 2009-2012. Manila; and 2013. India Country Partnership Strategy 2013–2017. Manila.
11 ADB. 2018. Strategy 2030: Achieving a Prosperous, Inclusive, Resilient, and Sustainable Asia and the Pacific. Manila.
12 ADB. 2004. Report and Recommendation of the President to the Board of Directors on a Proposed Loan to India for the Multisector Project for Infrastructure Rehabilitation in Jammu and Kashmir. Manila. Being the first project in the sector in the state, this project was able to address only a small part of the large medium-term requirements. The MFF aimed to address the remaining priority development needs. Learnings from other ADB projects are summarized in ADB. 2006. Special Evaluation Study on Urban Sector Strategy and Operations. Manila.
3
financially sustainable operations after project completion. Project 3 continued to address the infrastructure gaps and build the capacity of the responsible agencies. Based on the delays in institutional reforms under projects 1 and 2, the state introduced a more systematic and gradual approach under project 3 to develop consensus for reforms through a consultation. 7. The MFF modality was an appropriate and effective approach to facilitate a long-term relationship between the Economic Reconstruction Agency (ERA), the executing agency, and ADB. The modality also suited the nature of the complex works in urban areas, which required flexibility in scope and longer implementation period necessary to coordinate multiple stakeholders, and enabled the government entities to develop capacity. Further, it allowed adjustments in ADB support to the program given the severe winters and frequent flooding conditions. A design and monitoring framework (DMF) was prepared for the entire MFF and for each project.13 The DMF of the MFF had some weaknesses such as lack of baselines and targets, and very broad indicators. It had ambitious reform targets, such as recovery of O&M cost for water supply, that required legislative decisions which were beyond the projects’ control (para. 18). Also, more applicable impact indicators could have been selected. Nevertheless, the selected subprojects and output indicators were appropriate to achieve the intended outcomes. The DMF of the MFF was revised during the midterm review in 2015.14 As the corresponding approval memo was not prepared, the achievements in this report are assessed against the original DMF targets at MFF approval in 2007. Achievements are detailed in Appendix 1-1.15 8. For project 3, five minor changes in design were made during implementation to address realities on the ground and the urgent needs following the disastrous flood in 2014.16 First, the target for water supply distribution pipelines was reduced from 287 kilometers (km) to 155 km because (i) the pipe material was changed to a more resilient and costlier type after the 2014 floods, and (ii) the rehabilitation of the remaining 132 km was found to be less urgent abased on detailed assessment. The Public Health and Engineering Department (PHED) instead rehabilitated the balance of pipelines using other fund sources (para. 11).17 Second, loan savings from the reduced water supply subproject were partly reallocated to increase the much-needed drains after the floods in 2014 from 26 km to 42 km to mitigate future flood risk (para. 15). Third, the superstructure material of a bridge was changed from prestressed concrete to steel composite after the floods in 2014 as it would result in a stronger structure (para. 17). Fourth, because of the cost increase in the change in bridge superstructure, the construction of one grade separator was dropped (para. 17). Fifth, the other grade separator was changed from the original plan of both directions to one direction, but with an additional limb for decongestion (para. 17).18 Project 3 also supported a part of the balance work of sewerage subproject originally planned under project 1. In December 2016, to support the ERA in optimizing the utilization for project 3, reallocation of loan proceeds was approved (para. 22).
9. While the design of projects 1–3 at appraisal was appropriate to achieve the expected outcomes and outputs, it could have considered incorporating comprehensive end-to-end
13 A separate DMF for project 1 was not included when the MFF was approved. In 2011, a DMF for project 1 was
formulated as part of the retrofitting of projects in eOps for all ongoing ADB projects. For both project 2 and 3, separate DMFs were prepared during loan processing. Impact indicators for projects 2 and 3 were set as the same as the outcome indicators of the MFF in line with DMF guidelines at appraisal.
14 The main changes were (i) deletion of target towns other than the two capital towns due to security reasons and (ii) revision in outcome and output targets to reflect the scope changes.
15 After the floods in 2014, the priority of the state shifted to reconstruction efforts of damages. 16 Corresponding approval memo was not prepared for these changes. In this report, achievements are assessed
against the targets in the original DMF in the periodic financing report of project 3. 17 There were multiple investment projects implemented in parallel with project 3, including those funded by the state. 18 The subproject cost increased from $6.44 million to $8.56 million.
4
solutions such as 24/7 water supply with O&M arrangements built in construction contracts and integrated SWM with source segregation, and sewerage with reuse of wastewater. While all the subprojects planned at appraisal except for tourism were implemented, the five target towns had to be dropped because of security reasons.19 Also, during implementation, the state capacity was found more constrained than assessed at appraisal, leading to delays in capacity building and the reform program.20 Nonetheless, the program remained relevant at completion as development needs for basic urban services in the project areas should be addressed. The MFF design remained consistent with the road map and policy framework prepared by the state at appraisal for basic urban services as per national standard. There were no overlaps in intervention with other development partners.21
B. Facility and Project Outputs 10. Out of 23 MFF outputs, 15 were achieved, four were partly achieved, and four were not achieved. Of 10 project 3 outputs, five were achieved or exceeded and five were partly achieved. (Appendixes 1-1 and 1-2).22
1. Part A: Urban Infrastructure Improvements 11. Water supply. Under project 3, the total target of 287 km new and rehabilitated pipelines to benefit 54,000 households was partially achieved with 155 km for 30,000 households (para. 8). Construction of 18 km of new pipelines to increase transmission capacity by 13.45 million liters per day (mld) was completed in March 2020 using state funds. Piloting of a nonrevenue water (NRW) reduction program in an area of 3,000 consumers was achieved by replacing 16 km of pipelines and water meter installations.23 12. All of the five MFF output targets for water supply were achieved although with some delay: (i) average supply level was increased from 80 liters per capita per day (lpcd) to 135 lpcd with delay; (ii) the minimum supply hours increased from 2 hours to 8 hours;24 (iii) 80% of assessed properties were connected to the water supply system by providing 16,351 house connections;25 (iv) unaccounted-for water was reduced by rehabilitating pipelines, leading to 15% NRW ratio;26 and (v) water meters were installed with more than 10,000 meters.27 13. Sewerage. While there is no output target for sewerage in the DMF for project 3, the balance of work from project 1 was executed under project 3. A total of 27 km sewer network was
19 The five target towns were deleted at the mid-term review mission in 2015 although without approval memo. The
tourism subproject was planned to be implemented only in the five target towns. The deletion was because of the elevated security situation, which were not anticipated during MFF appraisal.
20 While the government’s capacity constraint was gradually mitigated by capacity building activities throughout the program’s duration, it did not fully achieve the intended targets.
21 The MFF was consistent with the sector road map developed by the state in conjunction with the JNNURM. 22 The details of the targets achieved with delay are in para. 23. The delays were due to combination of local unrest,
floods, and weak contractor performance. 23 Additionally, a separate package for bulk meters on tube wells, pumping stations and water treatment plant (WTP),
including automation of tube wells, a supervisory control and data acquisition system was also executed under the NRW reduction component. Under project 3, 171 km (155 km plus 16 km) of water pipeline was laid.
24 These were achieved through interventions under projects 1–3, including 19 tube wells, 148 pumps, eight overhead tanks, rehabilitating 212 km of distribution pipelines and laying 23 km of transmission pipes, and reducing NRW. Works were completed in March 2020.
25 ‘Assessed properties’ is not defined in the approved DMF. As water connection was supported only under project 3, the target is assumed to be the same as 1,000 connection which is the corresponding DMF target of project 3.
26 15% is a normal level of NRW ratio at commissioning. 27 About 8,000 water meters were installed under project 2, and another 2,000 were installed under project 3.
5
laid with 13,500 house connections, of which around 3,400 were connected under state fund after project completion. This contributed to the commissioning of the overall sewer system.
14. The achievements of MFF output targets for sewerage are mixed. The connection of at least 60% of assessed properties to the sewer system was achieved, although with delay in March 2019 by the state funds after MFF completion. For the target of improving wastewater treatment capacity from 17 mld to 260 mld, only 47 mld of treatment capacity was achieved, as the fund allocation to sewerage was shifted to more urgent reconstruction and development of drainage infrastructure after the 2014 floods.28 The target of establishing an appropriate O&M systems was partly achieved through introducing a municipal management information system for water supply and sewerage, but the O&M cost was not fully recovered as planned (para. 43).
15. Drainage. Under project 3, the output target to construct 26 km of drains for 30,000 people was exceeded with 42 km of drains constructed with delay in May 2019 with the state fund, benefitting 55,000 people.29 The increased scope utilized the loan savings from the water supply subproject to address flooding risk (para. 8). The other output target of constructing three new pumping stations was achieved as planned. There is no MFF output target for drainage. 16. Solid waste management. SWM was mainly supported under project 1 and was supplemented under project 2, but not under project 3. The MFF output target of at least 95% of waste generated being collected and transported for treatment and disposal was achieved by improving and expanding landfill capacity to 380 tons per day under project 1. Two other landfill sites with increased daily capacity of 243 tons and 335 tons were also supported under project 1.30 The MFF output target of increased efficiency of solid waste collection and transport was achieved through provision of collection equipment and development of access road to landfill site.31 However, the target of separating hazardous bio-medical waste from municipal waste was not achieved as it was implemented only on a pilot basis due to limited contractor availability. 17. Urban transport. For project 3, one output target was achieved and the other was partially achieved. The construction of a 120 meters (m) long bridge was implemented as planned, although the material of the superstructure was changed to steel for improved reinforcement after the 2014 floods, leading to cost increase (para. 8). A 640 m grade separator, instead of the original proposal of 340 m, was constructed after project completion with the state fund. The other proposed 408 m grade separator was dropped due to the cost increase in the bridge. Instead, 240 meters upward ramp was constructed to connect the 640 m grade separator for smoother traffic flow. This output is assessed as substantially achieved as the design changes were justified through the benefit of the strengthened bridge to address future flood risks. The other output to construct multistory semi-automatic parking facilities to accommodate 720 cars was partly achieved to accommodate 352 vehicles and 164 two-wheelers. The detail design during project implementation concluded that the output target to construct a parking with the planned capacity was
28 Development of a sewerage treatment plant (STP) was also dropped from project 2. 29 In the original DMF in PRF of project 3, the planned target beneficiary of drainage subproject was set as 30,000
households. This was meant as 30,000 people. In this report, achievement is assessed against 30,000 people. 30 Loan savings from other subprojects, including shifting transport to subsequent projects, were reallocated to the
SWM subproject to add more scope than planned at appraisal. This component also introduced weighing scales at entry and exit points, waste segregation equipment, and other facility and equipment which greatly reduced pollution loads in the surrounding streams. Biodegradable waste is collected and treated by composting at the landfill site.
31 Procured equipment consisted of (i) four rear-end loader compactors with 300 bins, (ii) 34 small, motorized waste collectors, (iii) 10 dumper placer vehicles with 100 bins, (iv) two hook loaders and 10 containers, and (v) 1,000 hand carts and 300 cycle rickshaws.
6
not technically feasible.32 The MFF output targets for urban transport on improved travel time on key corridors and reduction in road accidents were achieved with delay through construction of two flyovers, one bridge, and one grade separator under projects 2 and 3.33 Improvement in traffic management capacities was partly achieved with relevant training conducted to limited police personnel.
2. Part B: Capacity Building and Institutional Development 18. The capacity building and institutional development under project 3 was a continuation from the preceding projects. The output target to adopt organizational development plans for the two urban local bodies (ULBs) was partly achieved, e.g., a new water tariff and property tax was introduced and approved, while other plans, including establishment of the semi-autonomous body for water supply and sewerage service, are yet to be decided at the state legislature.34 The other output target to establish systems to generate annual financial statements for the ULBs was achieved by the introduction of double-entry accounting systems along with adoption of the State Municipal Accounting Manual. Building on these, annual financial statements were prepared up to 2016–2017 at both the ULBs.35
19. For the MFF, out of the nine targets for capacity building and institutional development, five were achieved including updating the database on the ULBs’ services, introducing online billing and collection for water tariffs, creating a geographic information system, establishing municipal management information system at the Housing and Urban Development Department (HUDD), and training staff and demonstrating abilities to perform management and service delivery functions.36 The following outputs were partly achieved: (i) recovery of O&M cost of water supply, which is still largely dependent on state budget allocation although there was an increase in water tariffs and improved collection; (ii) levy of property tax by the ULBs which is approved but implementation is yet to start. Both outputs require political approval at the state legislature which is the decision-making authority; and (iii) publication of balance sheet from FY2008–2009 for the ULBs as the publishment was limited in FY2010–2011. The target of formation of a water supply and sewerage and drainage board was not achieved as the state government decision is still pending as of now. Details of the institutional reform action plan are in Appendix 2.
C. Project Costs and Financing 20. The estimated cost for project 3 at appraisal was $94.0 million, with $60.0 million of ADB loan financing and $34.0 million of government funding. Project cost at completion was $74.96 million, consisting of $45.08 million from ADB and $29.88 million from the government. A total of $14.92 million was unutilized from the loan A total of $14.92 million was unutilized from the loan and was cancelled at loan closing. The main reasons for the reduced ADB loan amount were the Indian rupee depreciation from that at the time of appraisal, and slow physical work progress by the loan closing, with no contingency disbursement required. Project costs at appraisal and
32 The parking includes separate toilets for men and women, closed-circuit television system and full lightening as
planned at every level, with 24/7 security personnel to provide safety and security for all users including women. 33 End line survey was not conducted by ERA as PMU and consultants were downsized after MFF closure and also
due to impact of coronavirus disease (COVID-19). Alternatively, the achievement was confirmed by the community through selected interviews Given the constraints, further information would be provided during this PCR's validation.
34 Also, proposed institutional strengthening of the line departments such as recovery of O&M cost is not fully achieved as planned. Total 20 relevant trainings were conducted by the municipal support consultants.
35 The annual financial statement was not prepared after consultancy support ended in 2017. 36 The tariff for water usage has been approved up to 2020–2021 by the State Water Resources Regularity Authority.
The geographic information system was later used for property tax registers and billing and collection systems. Contractors provided hands-on trainings for better O&M of new and improved facilities.
7
completion are in Appendixes 3-1–3-2 and are summarized by financier in Appendixes 4-1–4-2.
21. The MFF design was built on a plan based on an assessed investment needs for $485.0 million, with an ADB loan component of $300.0 million and state contribution of $185.0 million. Because of currency depreciation, $20.0 million was cancelled from the ADB loan ($5.0 million from project 1 and $15.0 million from project 2). Disbursement was also affected by implementation delays (para 23). At completion, $160.5 million of ADB funds were disbursed with a state contribution of $125.7 million.37
D. Disbursements
22. In the early stages of implementation of project 3, disbursement was slow because of the delays in loan signing after the 2014 floods, late mobilization of contractors, and physical work progress. Disbursement commenced in March 2015 and $9.7 million was disbursed in the same year. In 2016, disbursement picked up considerably reaching more than $14 million. In 2017, disbursement further increased to $21.2 million, but the project was not able to make up for the initial delays. Poor contractor performance, especially in three contracts (water supply pipeline, storm water drainage, and one grade separator), hindered implementation progress.38 At the MFF financial closing in February 2018, the total disbursement was 76% of the loan amount. In 2016, a reallocation of ADB loan proceeds was approved to support the ERA in optimizing the utilization of the loan amounts under project 3 and to reduce the anticipated state financial burden for spillover works.39 The change was retroactively applied to past claims.40 The disbursement projection at project effectiveness was rather optimistic given the limited contractor interest in working in the state due to increasing local unrest. All withdrawal applications were submitted to ADB through the controller of aid accounts and audit of the Ministry of Finance of the Government of India. The project used the mechanism for disbursement through statements of expenditure, direct payment and reimbursement based on documented claims.41 All disbursement-related qualifications raised by the auditors were duly addressed. Appendix 5 presents projected and actual loan disbursements.
E. Project 3 and Facility Schedule 23. The original loan closing of project 3 in March 2017 was extended once to May 2017. The spillover works financed by the state were completed by March 2020 (para. 27).42 The delays were because of the persistent slow progress of civil works and procurement caused by limited interest from contractors, combined with security reasons throughout projects 1–3. Project 3 was also affected by the historic 100-year flooding in September 2014, which delayed the loan signing until December 2014,43 and local unrest from time to time, which were factors external to the project. After the 2014 floods, the project required additional time to shift the focus of intervention to asset rehabilitation and works related to flood control. The ERA and state staff were also overloaded with multiple large projects, and an overlap period with projects 1 and 2. Based on experience in delays in projects 1 and 2, the ERA introduced contractual incentives with bonuses
37 Also, some projects were taken up under other project with state funds. The ratio of ADB loan to the state contribution
at MFF completion was reduced from 64:36 at appraisal to 60:40 at completion. 38 Delays were persistent although ERA closely monitored the works progress to resolve any implementation issues. 39 Approved memo dated 20 December 2016. The ADB financing share in civil work increased from 80% to 82%. The
change was made within the allowable cost sharing ratio of 80:20 between ADB and the Government of India. 40 Retroactively applying the changes to past claims led to an additional $5.6 million being utilized in the project 3 loan. 41 The project used a simplified process for statements of expenditure, not requiring supporting documents for
individual payments up to $100,000. 42 Water supply, drainage, sewerage, and transport subprojects were completed through the state funding. The water
supply subproject was the last to be completed in March 2020. 43 The ADB Board approved project 3 in June 2014.
8
for on-time completion with a more stringent monitoring system. Despite this, contractor performance did not improve. The availability period of the MFF was extended twice, from 31 December 2015 to 31 March 2017 and then from March 2017 to May 2017, to (i) optimize loan utilization, (ii) enable the completion of ongoing works to maximize project outcomes, and (iii) reduce the state’s financial burden for spillover works (para. 22).44 A chronology of main events is in Appendix 7.
F. Implementation Arrangements 24. The implementation arrangements for the MFF and projects 1–3 were consistent with the design at appraisal, and were appropriate to achieve the envisaged outputs. The executing agency was the ERA, guided by state inter-ministerial and city committees and a works finalization committee chaired by the division commissioner. The ERA established a dedicated project management unit (PMU) and project implementation units (PIUs) in the target cities. The PMU and PIUs were assisted by a project management consultant (PMC) and design and supervision consultants (DSCs). The PMC and DSCs supported the preparation of detailed designs and bidding documents, the bidding process, and construction supervision. The following consultancies were also engaged under project 3: (i) capacity building and institutional support for the two ULBs and the PHED, (ii) implementation support of the gender action plan (GAP), and (iii) support for the preparation of a NRW reduction action plan under projects 2 and 3. Safeguard consultants were mobilized for environmental and social aspects. G. Technical Assistance 25. The preceding ADB-funded project (footnote 12) was accompanied by a $0.5 million project preparatory technical assistance (TA) to prepare a comprehensive investment plan.45 The TA supported the preparation of the program design as an MFF. Sector plans and policies to promote cost recovery through tariff reform were also prepared under the same TA, which became part of institutional strengthening under the MFF. To further support the ERA in project implementation, ADB approved $0.4 million of advisory TA in 2006.46 The advisory TA supported the ERA—especially at early stages of the MFF until the TA closure in March 2009—to (i) improve its functionality, (ii) build its project management and implementation capacity, (iii) expedite contract award and execution by providing guidance to the ERA on procurement-related issues, and (iv) assist in setting and achieving yearly targets for contract award and disbursement. H. Consultant Recruitment and Procurement 26. Consultants were recruited under the MFF in accordance with the ADB Guidelines on the Use of Consultants.47 Project 3 followed the Guidelines on the Use of Consultants (2013, as amended from time to time). The ERA followed the quality- and cost-based selection procedure to select the PMC and two DSCs. Only one local engineering firm qualified for the large consulting contracts for storm water drainage.
44 The second extension of MFF was up to the maximum allowable availability period of 10 years, and subsequently
projects were extended. The two extensions were approved by ADB on 14 August 2012 and 2 February 2017. 45 ADB. 2004. Technical Assistance for Preparation of the Jammu and Kashmir Urban Infrastructure Development
Project. Manila (TA 4515-IND, approved on 21 December 2004). 46 ADB. 2006. Technical Assistance to India for Strengthening Urban Project Management in Jammu and Kashmir.
Manila (TA 4888-IND, approved on 2 December 2006). ADB. 2010. Technical Assistance Completion Report for Strengthening Urban Project Management in Jammu and Kashmir. Manila (rated highly successful).
47 ADB. 2013. Guidelines on the Use of Consultants by Asian Development Bank and its Borrowers. Manila was followed in project 1 and project 2.
9
27. Overall consultant performance in the MFF including project 3 is rated generally satisfactory.48 The original PMC and one of the DSCs from the preceding projects had difficulty fielding and retaining experienced staff, and thus was replaced on contract completion. The new PMC, mobilized in May 2013 and the new DSC, mobilized in July 2014, performed substantially better. However, implementation of their services was delayed because of site constraints, design changes, and consequent delay in finalizing drawings. The contracts with the PMC and DSCs were retained after MFF completion to supervise the spillover works, but their inputs were gradually scaled back, leading to delays in full completion under the state funding. The end-line surveys to assess the achievements of some of the DMF targets were not conducted. The performance of the capacity building and institutional support and GAP consultants were generally satisfactory as per the required outputs. 28. Procurement was generally carried out as planned although with delays because of limited contractor interest and state capacity. The original contract award projection was rather optimistic in this regard. Procurement of all civil works contracts followed ADB Procurement Guidelines (2013, as amended from time to time). All civil work packages under project 3 estimated to cost less than $17 million were procured through national competitive bidding using single-stage, two-envelope bidding procedures. All contracts were bills of quantity based on item rates. Preparation of standard bidding documents, bid evaluations, and contract awards were per ADB guidelines. Review of all stages as per the Procurement Guidelines was conducted by ADB prior to contract award. The projected and actual contract awards are in Appendix 6. 29. The performance of contractors was unsatisfactory as the eight major contract packages were delayed and were completed using state funding (para. 23). The PMU and PIUs, assisted by the PMC and DSCs, held regular meetings with contractors to resolve hindrances and execution issues. Despite this support, three of the eight contracts proceeded especially slowly, and low personnel deployment was persistent.49 A summary of contract details is in Appendix 8. I. Gender Equity 30. Project 3 was categorized effective gender mainstreaming.50 A GAP was prepared to create equal opportunities for women to participate in and benefit from the project. The GAP focused on providing urban services for low income and households headed by women; providing for the needs, safety, and privacy of women and girls on public transport; and promoting improved health and hygiene-related practices among female household members living in the zones of influence of drainage construction works. The other GAP features were raising the awareness of people, including low-income households and households headed by women, on (i) gender issues and behavior change initiatives in water conservation; (ii) links between the maintenance of storm water drains and personal and community hygiene, health, and sanitation; and (iii) reducing, reusing, and recycling waste. The GAP also included the capacity development of the ULB and the municipal and project staff on gender concepts; the different roles of women in managing water, sanitation, hygiene, and health; and good practices in gender-inclusive urban development.
31. The project made efficient arrangements for GAP implementation, monitoring, and reporting (para. 7 of Appendix 10). The ERA’s social and resettlement experts supervised GAP implementation with the support of the social and resettlement consultant. ULBs and other line
48 In case of project 1, consultant performance is rated less than satisfactory and the original PMC and one of the DSCs
were replaced upon contract completion. 49 The three contracts with slow progress were one each in water supply, drainage, and transport subprojects. 50 Project 1 was categorized no gender elements.
10
departments were actively involved in awareness raising, community mobilization, and capacity development activities. The project converged with the ULBs and other line departments to support awareness-raising, community mobilization, and capacity development activities on gender equality aspects. The budget for GAP was adequately allocated and helped recruit a consulting firm led by a gender specialist for the timely and effective implementation of the GAP. The project collected sex-disaggregated data and submitted the progress reports on GAP implementation regularly (para. 40).
J. Safeguards
32. Project 1 of the MFF was classified as B sensitive for environment while projects 2 and 3 were category B. For involuntary resettlement, projects 1 and 3 were category B,51 while project 2 was category A. For indigenous peoples, the MFF and all its tranches were classified as category C. An environmental assessment and review framework, resettlement framework, and indigenous peoples planning framework were prepared for the MFF facility and revised during loan processing to be consistent with ADB’ Safeguard Policy Statement (2009).52 Under project 3, five initial environmental examinations (IEEs) and three resettlement plans were prepared reviewed, cleared, and disclosed by ADB and ERA on their websites in accordance with ADB and government requirements (Appendix 11). No significant environmental or resettlement impacts were observed during project 3. No indigenous peoples were affected during implementation of all three projects. While safeguard management in terms of institutional arrangements, information disclosure, consultations, project staff capacity building, and regular submission of semiannual safeguard monitoring reports—was generally satisfactory, there is an outstanding issue of pending compensation payments for one drainage subproject under project 2, as land ownership could not be established. A corrective action related to pending compensation payments under project 2 was discussed and agreed with ADB, with payment to be accomplished by July 2021. The PMU also confirmed that the decision of the High Court is awaited regarding the amount escrowed (₹21.08 million) towards payments to landowners requesting higher compensation rates for the landfill site under project 1. Safeguards compliance under projects 1 and 3 is rated effective, while with the pending required corrective action, safeguards compliance for project 2 is rated less than effective. K. Monitoring and Reporting 33. All MFF assurances and project 3 covenants were complied with, except for the eight partial compliance mainly for institutional reforms that have not yet fully achieved, and three noncompliances related to financial management. Financial empowerment of the municipalities was partially complied with, with some notable achievements such as introduction of an accrual-based accounting system. Infrastructure development or urban development taxes are being levied, albeit at low levels. Thus, the levy of a sustainable user tariff is also partially complied. Safeguard covenants were complied with, but compensation payments to the affected people in the drainage subproject under project 2 are yet to be completed (para. 32). The covenants related to procurement were partially complied with because of poor contractor performance and implementation delay, especially in the transport subproject. 34. Separate project financial accounts were maintained and audited by statutory auditors.
51 At appraisal, project 1 was classified category A for involuntary resettlement and a full resettlement plan was
prepared for the BC Road Flyover subproject. The subproject was dropped from project 1 and moved to project 2. 52 For project 1, the applicable policies were: (i) ADB. 2002. Environment Policy. Manila. (ii) ADB. 1995. Involuntary
Resettlement. Manila. and (iii) ADB. 1998. The Bank’s Policy on Indigenous Peoples. Manila. For projects 2 and 3, the policy applicable is ADB. 2009. Safeguards Policy Statement. Manila.
11
Except for fiscal year (FY) 2018, audited project financial statements (APFSs) were received, albeit with delays of 0.6–3.8 months from due dates, within the grace period of 6.0 months.53 For FY2008, no APFSs or audited entity financial statements (AEFSs) were submitted. The APFSs for FY2018 were rejected as they included a combined audit report for all three projects despite separate reports and opinions being required. Also, AEFSs for FY 2017 and prior years were combined with APFSs. These constituted non-compliances. Of 61 loan covenants of project 3, 50 were complied with, eight were partly complied with, and three were not complied with. Appendixes 9-1–9-2 detail the status of compliance with assurances and loan covenants.
III. EVALUATION OF PERFORMANCE A. Relevance 35. The investment program and project 3 is assessed relevant to government development objectives and ADB country and sector strategies, both at appraisal and completion (para. 5). Though the project predated ADB’s Strategy 2030, it aligns with its operational priorities, especially on building livable cities and providing safe and effective water and sanitation services. At completion, the project remained in line with the ADB policy focus for India on inclusive growth, infrastructure, and environmental sustainability. The project aligned with the government’s successive 5-year plans; the National Institution for Transforming India Aayog’s 3-year action agenda, FY2018–FY2020;54 and the state’s Eleventh and Twelfth Five-Year Plans, FY2007–FY2018, which prioritized potable water supply in urban areas, wastewater management, and urban poverty alleviation.55 The project currently aligns with state priorities for poverty reduction through improved access to potable water and sanitation, good governance, and private participation. The MFF did not overlap with other development partner’s initiatives. As the target towns have a relatively lower rate of participation and representation of women in community activities, the program design also included targets for participation of women in awareness-raising and capacity building activities. The program’s gender strategy ensured equal benefit for women from the water supply services, public transport, drainage improvement, which strengthened the program’s relevance. 36. The MFF modality was appropriate considering the complexity of the design, as it provided the flexibility to move outputs to other projects without affecting the facility outcome (para. 7). It also made it possible to respond to urgent development needs such as rehabilitation of damaged infrastructure after the floods which also contributed to the facility outcome. While some weaknesses in the DMF were observed (para. 7), outputs were appropriate to achieve the target outcome indicators. 56 Implementation of the program was significantly affected by external factors particularly major flooding and security issues, which were not anticipated during appraisal but necessitated adjustments in the design and scope of the projects. While there were mitigating measures, limited contractor interest and state capacity constraints also posed challenges during the implementation. Nonetheless, the state demonstrated strong ownership and commitment by completing all the remaining works using its own funds which shows that the program
53 Reports delayed by 0.8 months for FY2010, 0.7 months for FY2011, 3.8 months for FY2012, and 0.6 months for
FY2015. 54 The National Institution for Transforming India Aayog is a Government of India policy think tank that provides
directional and policy inputs, designs strategic and long-term policies and programs, and provides technical advice to the central and state governments.
55 Government of India National Institution for Transforming India Aayog. 2017. India Three-Year Action Agenda, 2017–2018 to 2019–2020. Delhi; State government, Planning Department. 2012. Eleventh and Twelfth Five-Year Plans, 2007–2018. Delhi.
56 There were efforts to adjust the DMF of the MFF at the mid-term review mission in 2015 considering the circumstances at that time, however corresponding approval memo was not processed (para. 7).
12
interventions and objectives are critical for the state. The GAP responded to gender issues identified during the project design phase, such as lower rate of participation and representation of women in community activities. The project’s gender strategy ensured equal benefit for women from the water supply services, public transport, drainage improvement.
37. Changes in scope of project 3 (para. 8) were necessary to better address emerging realities, and to mitigate the risks of flooding in the project areas. In particular, adjustments were made to strengthen the structure of the 120 m bridge and works for the drainage component were increased, both to reduce future risks from flooding. While the original targets in the DMF remain because formal changes in scope were not done, these adjustments done on the ground increased the relevance of the project. B. Effectiveness
38. Project 3 is rated effective.57 Using weights based on the actual cost of each subproject, the overall achievement of outcomes and outputs was assessed as 90% and 106%, respectively (Table A1.3).58 Urban services in the target towns improved as evidenced by: (i) increased water supply in one target town to the national standard of 135 lpcd for 200,000 people (47% female) against a target of 185,000; (ii) increased water supply to 135 lpcd for 168,000 people (47% female) in another target town against target of 282,000 people;59 (iii) reduced incidence of water logging to 0.3 hours for 1 day in a year resulting from improving drainages in one target town; and (iv) reduced average travel time from Dal gate to Lal Chow from 30 to 15 minutes due to the constructed grade separator, and parking facility.60 39. The MFF is rated less than effective.61 Using the same weighting methodology based on actual cost of each subproject, the overall achievement of outcomes and outputs was assessed as 62% and 68%, respectively (Table A1.2).62 The MFF achieved or substantially achieved the following outcome targets: (i) reduction in the volume of wastewater discharged to storm drains resulting from the constructed sewerage facilities; (ii) service to 1.63 million people with functioning drainage against a target of 2.0 million; and (iii) increase in public private partnership in service delivery through the parking facility and the collection of SWM charges. The facility partly achieved the following outcome targets: (i) 1.52 million people against the target of 2.2 million people given access to municipal water system through tube wells, overhead tanks, pipelines, and NRW reduction;63 (ii) 1.1 million people against a target of 2.0 million benefitted from improved solid waste facilities such as new and improved landfill sites served to accommodate large quantity of debris and municipal waste after the 2014 floods, which
57 Three of the six outcomes and five of the 10 outputs were achieved, including one outcome and one output exceeding
the targets. The other outcomes and outputs were all partly achieved. 58 The weighted output is more than 100% because of the exceeded achievements in the drainage output target. 59 The partial achievement of beneficiaries is due to reduced water supply pipelines (para. 8). 60 For (iii) and (iv), end-line surveys were not conducted as the PMU was downsized at the completion after MFF
closure. Based on interviews with selected residents, the targets are assessed as achieved. It is assumed that the construction of the parking facility resulted in partly reduced travel time because of less street parking although this was not up to the planned level because of a lower vehicle capacity.
61 Three out of 10 outcomes and 16 out of 24 outputs were achieved. Six outcomes and five outputs were partly achieved, and one outcome and three outputs were not achieved. At appraisal, five district towns with a total population of 0.4 million were included in the target towns. These were dropped for security reasons, leading to fewer beneficiaries in all subprojects.
62 Other municipal/urban infrastructure subproject for the five towns was not implemented due to security reason. This subproject is not considered in the overall weighted outcome of the MFF.
63 The partial achievement was largely due to reduced water supply pipelines (para. 8).
13
contributed to the town’s early recovery, and prevented disease outbreaks;64 (iii) 1.8 million people against a target of 2.4 million people given access to better road facilities such as flyovers, bridge, and grade separators;65 (iv) sector reforms such as preparation of economic opportunity development plans, establishment of e-procurement, adoption of accrual based accounting system initiated and online billing and collection for water supply service introduced, which are currently is being functional and used; (v) capacity of relevant agencies developed using state budget; and (vi) capacities of agencies in O&M of assets improved through training, increased tariff and revenue base, and efficiency in water tariff collection. The target on providing 1.0 million with access to sanitation was not achieved as only 0.2 million people benefited due to the reduced scope under projects 2 and 3 (para. 14).66 For capacity building and institutional development, creation of a semi-autonomous water board is awaiting state’s political decision. Recovery of O&M cost of water supply has also been delayed. 40. The overall safeguards compliance under projects 1 and 3 is rated satisfactory, but because the required corrective action is pending for project 2, the safeguards compliance for that project is rated less than satisfactory (para. 32). The overall implementation of gender mainstreaming supported by GAPs in projects 2 and 3 was successful. It sought to address gender and development challenges highlighted at appraisal. In summary, project 2 completed 9 of 10 (90%) activities and achieved 13 of 14 (93%) quantitative targets.67 41. Project 3 completed all 10 of 10 GAP activities (100%), and achieved 16 of 19 (84%) combined quantitative targets of the GAP and DMF (Appendix 10). The MFF, including project 3, achieved substantial strategic and practical gender benefits. The strategic gender benefits include (i) incorporation of women’s needs and priorities in project planning, design and management; (ii) a better understanding of the interrelationship between gender and transport; and (iii) enabling institutional environment and institutional capacity in gender mainstreaming. increased spaces for women to participate in the planning, designing, and management of urban infrastructure and services. The practical gender benefits are (i) reduced women’s time poverty with increased access to quality water and sanitation services, which has enabled them to spend more time for socializing with neighbors, and learning new skills; (ii) increased ability to manage household water and sanitation needs after attending awareness campaigns, behavior change workshops, and community meetings, where 60% of the participants were women; and (iii) safety and convenience in public places. The 30,000 households that benefited from the laying and rehabilitation of water pipelines and approximately 55,000 persons who benefited from the construction of the drains, include 8% households headed by women; and an estimate of 47% of the beneficiaries are women. The gender mainstreaming elements supported by projects 2 and 3 proved effective in establishing models to replicate gender equality and women’s empowerment in urban development. C. Efficiency 42. Overall, the MFF and project 3 are rated efficient as all subprojects, assessed under each of the individual projects achieved a higher economic internal rate of return (EIRR) on investment at completion against the economic opportunity cost of capital of 12% threshold, set at appraisal except one sewerage (in projects 1 and 3 combined), one water supply (in project 2), and one drainage package (in project 2). The overall EIRR for project 3, while not assessed at appraisal,
64 The SWM intervention did not expand in projects 2 and 3 except for collection equipment due to non-availability of
land. 65 The partial achievement was due to reduced scope for grade separator due to stronger and costlier material of bridge. 66 A 30 mld STP was dropped from project 2. 67 Project 1 was categorized as no gender elements.
14
was assessed at completion at 14.8%. The EIRR at completion of project 3 for the three water supply packages were assessed at 26.1%, 12.9% and 20.1% as compared to the appraisal estimates of 35.3%, 22.2%, and 15.7%, respectively.68 For the drainage package, the EIRR at completion were assessed at 15.4% as compared to the appraisal estimates of 16.5%.69 For the transport package including a bridge and a grade separator, the EIRR at completion was assessed at 17.0% as compared to the appraisal estimates of 26.0%. 70 For the delayed sewerage package, the EIRR at completion was assessed as 8.7% as compared to the appraisal estimates of 32.7%.71 For the multilevel parking facility package, the EIRR at completion was assessed at 13.2% as compared to the appraisal estimates of 15.4%.72 Except for the sewerage package, all packages’ EIRR are higher than the benchmark value of 12% at completion, justifying project investments. The EIRR of the sewerage package was below the threshold for economic viability at appraisal because of implementation delays. The overall EIRR for project 3, while not assessed at appraisal, was assessed at completion at 14.8%. The implementation delays (para. 23) were mostly attributed to frequent local unrest and the historic flood that are beyond project’s control.73 The low contractor performance also hindered the works progress especially in the sewerage subproject. However, the ERA had taken corrective action to replace the contractor and achieved 86% of physical progress at MFF completion. 74 The ADB financing share was reallocated up to the allowable 80% of the project cost, which was applied retroactively to maximize the project 3 outcome and reduce the financial burden on the state. Institutional efficiencies and grievance redress mechanisms developed by the ERA reduced transaction costs in process and time and improved transparency and accountability while significantly augmenting its administrative capacity. The MFF is rated efficient, with an overall EIRR of 15.8%. The EIRR of the sector subprojects under all the projects estimated at 21.6% for water supply; 14.5% for the sewerage, drainage, and solid waste management; and 14.8% for the urban transport. Details of the economic and financial analysis are in Appendix 12. D. Sustainability 43. Overall, the MFF and project 3 are rated likely sustainable. The Constitution of India mandates that the state allocate to ULBs the funds required to maintain their functions and sustain service delivery.75 Since the operating institutions did not achieve recovery of the O&M costs as envisaged at appraisal, the standard approach of financial internal rate of return at appraisal was not considered appropriate at completion of project 3. However, a financial sustainability analysis
68 Field missions to update the willingness-to-pay survey were not possible because of local unrest and travel
restrictions because of the coronavirus disease. For all three subprojects, projected benefits were realized. For one subproject, the EIRR at completion is higher than at appraisal because of reduced costs. For two out of three subprojects, there were implementation delay of 1–2 years.
69 For the drainage subproject, an additional 23,400 people benefitted because of increase in the length of drains constructed (42 km as compared to the 26 km envisaged at appraisal). Although there was an increase in beneficiaries, the EIRR at completion is slightly lower than at appraisal because of cost increases and implementation delay by 2 years.
70 For the transport subproject, the EIRR at completion is lower than at appraisal because of cost increase of reinforcing the bridge structure and an implementation delay of 2 years.
71 For the sewerage subproject, the EIRR at completion is lower than the EIRR at appraisal, mainly because of implementation delays of about 7 years.
72 The main reason for the EIRR at completion being lower than the appraisal EIRR is the reduced number of parking spaces for cars; there was no implementation delay. Against the original plan of 720 vehicles, the facility accommodates 352 vehicles, with targets for two-wheelers and other vehicles remaining the same.
73 For example, the contractor of transport subproject had to abandon the sites. Also, the security situation made it difficult to secure skilled engineers from other states to be deployed in the target towns.
74 The achieved sewerage beneficiaries were limited to 20% of the target. The reasons include the exclusion of the five divisional towns, that were originally planned as target towns for sewerage subproject, due to the security reason.
75 Article 243 X and Schedule XII.
15
of the operating institutions was carried out to evaluate the capacity to meet the O&M costs required to manage the project 3 assets. The PHED is responsible for O&M of water supply facilities, the Public Works Department (PWD) is responsible for flyovers, the HUDD is responsible for drainage and sewerage facilities, and ULBs are responsible for solid waste facilities and parking facilities. Their responsibilities include billing and fee collections of these services, but the revenue is remitted to the state government, which is responsible for financially managing these assets and services. For the ULBs, finances are structured through fiscal transfers from the state in the form of compensation grants and transfers from the Central Finance Commission and state finance commissions.76 As the project was not designed for capital cost recovery, the operating ratios of the state government were calculated to assess the sustainability.77 They averaged 0.94, meaning that the operating receipts are enough to meet the O&M expenses.78 Similar review of the overall finances of the PHED, PWD, HUDD, and the ULBs indicates their ability to meet the O&M cost of their assets through state budget allocations.79 The analysis assumed consistency in the timely transfer of the requisite O&M funds by the state government to the PHED, PWD, HUDD, and the ULBs, as provision of these urban services is a fundamental responsibility of the state government.80 The details of the financial re-evaluation are in Appendix 12. 44. Institutional capacities of the ULBs of the target towns and state bodies were strengthened under the MFF as part of the ongoing reforms. While the PHED, PWD, and HUDD have sufficient human resources and technical institutional capacities for O&M, the ULBs will continue augmenting human resources and institutional capacities for better asset management and governance.81 Gender mainstreaming elements supported by projects 2 and 3 proved effective in building the ERA’s capacity and establishing models to replicate gender equality and women’s empowerment in urban development. 45. The MFF, including project 3, is assessed to be environmentally sustainable as it contributes to water pollution abatement, and so reduces vector-borne diseases, thus improving quality of life and the urban environment. Social sustainability of the MFF, including project 3, is ensured by the improved access to continuous, reliable, and affordable basic urban services, thereby improving access to economic opportunities. E. Development Impact 46. The MFF is rated satisfactory, and project 3 is rated less than satisfactory in terms of development impact. Under project 3, impact achievements include the following: (i) 0.45 million people provided with access to water supply, (ii) 0.23 million people served with proper functioning drainage system, and (iii) 0.4 million people provided with access to reasonable-standard road facilities. Project 3 did not significantly contribute to the three impact indicators. In terms of the
76 The Central Finance Commission transfers accounts for about 30%–-40% of ULB finances, of which up to 90% may
be used for O&M of municipal assets. 77 The ratio of operating receipts to operating expenditures. The cost recovery calculation does not include asset
depreciation. 78 The state finance commission allocates a percentage of net proceeds of tax (about 7% of net state tax revenue) or
the general pool (as in the case of the Government of India) to local governments to support financially weaker local bodies (categories II–IV).
79 For water supply, O&M costs are not fully recovered without dependence on state support for operating expenses. The tariff increased by 10% annually during 2011–2019.
80 The sustainability of transfer from the central government is expected to continue (para 24, Appendix 12). ERA confirmed that the fund transfer has been made in a timely manner in the past.
81 For the parking facility, the private operating agency is collecting car parking charges of ₹30 per hour, SUV parking charges for ₹50 per hour, and scooter parking charges for ₹10 per hour. This has been contributing to the recovery of O&M costs.

16
MFF DMF, impact achievements include the following: (i) real income per capita in the state rose by 162.46% from 2007 to 2017, for a compounded annual growth rate (CAGR) of 10.13%; (ii) income outside the primary sector in districts encompassing project cities grew by 225.06% (CAGR 13.85%), with investment in industry and trade increasing by 100.45% (CAGR 7.20%). Tourist inflow grew by 22.60% (CAGR 2.06%). However, it is recognized that these impact indicators are too high-level to directly establish the influence of the MFF. Nonetheless, the contributions of the three projects of the MFF to other development impacts are apparent such as an increased access of people to economic activities and improved quality of life, particularly for women and the poor. Water supply interventions ensured increased access to potable water with quantity at national standards. It contributed to increase in population benefitting from potable water supply in the target towns from 1.26 million in 2007 to 2.37 million in 2017.82 Sewerage outputs supported promotion of proper sanitation and led to overall public health improvements, particularly the poor with reduced burden of diseases. Improved SWM reduced pollution loads, enhancing environment quality and public health. Establishment of drainage infrastructure has significantly reduced flooding in areas near rivers, thus ensuring the safety of people and protecting livelihoods and properties. Transport interventions have reduced traffic congestion and travel time, thus contributing to improved urban living environment and increased access to economic activities and social services. Contributions to ADB Strategy 2030 are in Appendix 13. 47. Project environmental impacts are as assessed in para. 32 and Appendix 11. The MFF including project 3 achieved important practical and strategic gender benefits. These include reduced women’s time poverty, safety risks, and health hazards with their increased access to quality water supply and sanitation services; improved ability of women to manage their households’ water and sanitation needs; and women’s safety and convenience in a car parking facility at City Chowk. The project also brought urban planners and service providers to acknowledge the rights and roles of women in urban transport and urban development, which is expected to create positive spillover effects on related endeavors. F. Performance of the Borrower and the Executing Agency 48. The performance of the borrower and executing agency throughout the MFF including project 3 is rated satisfactory. The borrower, represented by the Indian Department of Economic Affairs, provided timely guidance and decisions to the state government and undertook regular tripartite review meetings with ADB, the state government, and the ERA. This helped identify bottlenecks, resolve issues, and monitor progress. The state government provided the ERA with strong support, including timely counterpart funding to complete all works after loan closing. 49. The PMU continued its overall project management and implementation structure and arrangements from project 1. The PMU increased staff allocation in the PIUs based on the additional monitoring requirements of project 3. These arrangements facilitated interagency coordination, monitoring, and progress reporting from the field, as well as information flow to the ERA and ADB. The major flood in 2014 hampered overall investment program implementation including project 3, but the ERA and PMU worked efficiently to restore and repair the ongoing works. The PMU handled safeguard compliance and monitoring requirements well and submitted timely environmental reports to ADB. APFSs and AEFSs for FY2008 were not submitted. APFSs for FY2018 were rejected for having a combined audit report for all three projects. This was noncompliant with loan covenants and indicates that the ERA’s financial management was less than satisfactory. All loan covenants were complied with except for institutional empowerment.
82 State Government. 2020. Digest of Statistics, 2017–18. Jammu.
17
G. Performance of the Asian Development Bank 50. ADB’s performance during the MFF implementation is rated satisfactory. ADB missions for regular review, midterm review, and special project administration were undertaken to assess progress, provide advice for resolving outstanding issues, and facilitate minor changes in scope and reallocation of loan proceeds. ADB monitoring, capacity building, and guidance through 22 missions and 10 tripartite reviews throughout the project cycle helped define processes, address issues through time-bound actions and targets, and expedite project implementation. ADB provided training to support adherence to procurement guidelines, proper disbursement, and safeguards. The project implementation schedule at MFF appraisal proved to be ambitious and should have more realistically considered the local context. ADB needs to more closely monitor compliance with APFS and AEFS requirements. H. Overall Assessment 51. The MFF and project 3 are rated successful. The MFF, including project 3, was relevant to government development objectives and ADB policies at appraisal and continued to be relevant upon completion. The MFF is rated less than effective as the weighted achievement of outcomes and outputs was less than 80%, while project 3 is rated effective. The MFF, including project 3 is rated efficient as all subproject EIRRs, except for the sewerage subproject, are close to or more than the benchmark value of 12% at completion, justifying project investments. The overall EIRR of project 3 at completion was assessed as 14.8%. The estimated EIRR of the MFF is 15.8%. The MFF and project 3 are likely sustainable, as O&M costs for project assets are met through statutory transfers from state and central government, municipal taxes, and user charges.83 Overall ratings are summarized in Table 1.
Table 1: Multitranche Financing Facility and Project Overall Ratings
Criterion Project 1 Project 2 Project 3 MFF
Relevance Relevant Relevant Relevant Relevant Effectiveness Effective Effective Effective Less than effective Efficiency Efficient Efficient Efficient Efficient Sustainability Likely sustainable Likely sustainable Likely sustainable Likely sustainable Overall assessment Successful Successful Successful Successful Development impact Satisfactory Satisfactory Less than satisfactory Satisfactory Borrower and executing agency
Satisfactory Satisfactory Satisfactory Satisfactory
Performance of ADB Satisfactory Satisfactory Satisfactory Satisfactory ADB = Asian Development Bank, MFF = multitranche financing facility. Source: Asian Development Bank.
IV. ISSUES, LESSONS, AND RECOMMENDATIONS A. Issues and Lessons 52. The following important lessons emerged from the project: first, enhancing readiness at loan approval, including early preparation of quality detailed designs, would help deliver projects
83 There was also progress in institutional reform to contribute to sustainability such as introduction of online billing and
collection for water supply services and a geographic information system for property tax registers.
18
in a timely manner.84 Second, establishing land acquisition collector office within the PMU proves to be extremely beneficial in managing involuntary resettlement. Third, MFFs impose a burden on executing and implementing agencies in the initial years as they prepare subsequent projects while also implementing ongoing projects, requiring sufficient implementation support. Fourth, local context and the state’s capacity should be carefully assessed in designing an ambitious reform agenda. Fifth, continued budget transfers for O&M of assets to the line departments from the state is necessary for sustainability. Sixth, a realistic project schedule should be ensured on consultant recruitment, detailed design development, and contract periods. Seventh, water supply subproject should include comprehensive end-to-end solutions to maximize benefits, such as 24/7 water supply and 5–10 years of O&M by contractors, subject to capacity of the asset operator. Eighth, ADB needs to follow up more closely on compliance with submission requirements for APFSs and AEFSs. Finally, GAP targets that proved to be unrealistic during project implementation should be corrected during mid-term review mission. B. Recommendations 53. Specific recommendations for project implementation are as follows: First, at appraisal, robust assessment is needed on achievability of institutional reforms including capacity of the government agencies and the local context (para. 19). Second, ADB should communicate frequently with executing agencies and monitor them closely when they prepare audited financial reports to ensure compliance with ADB requirements (para. 34).85 Finally, including a financial management specialist to monitor and support the project team and the executing and implementing agencies, including in missions as necessary, is key to improving financial management performance and ensuring that reports are properly prepared. 54. General recommendations for MFF and project preparation are as follows. First, greater readiness at approval, including advance action for detailed planning, designs, and coordination for utility shifting prior to contract award, would help deliver projects in a timely, responsive, and efficient manner.86 Second, more support from ADB is needed during the early years of MFF implementation for executing and implementing agencies that are less experienced with ADB projects. Such agencies may need TA for preparing succeeding tranches. Third, the project scope and implementation period should be realistic, considering executing agency’s capacity and the local context. Fourth, robust project management system should be established by extending e-procurement, contract performance database, and e-project accounting system for billing and payments. Finally, the gender-inclusive features established in the MFF is expected to continue and be operationalized in urban projects. The progress of achievement of the GAP performance indicators and targets needs regular monitoring—such as through the participation of ADB gender officer or consultant in review missions—to identify unrealistic targets and provide corrective actions during the mid-term review mission. 55. For further follow up, the ERA is expected to pay compensation to all affected people who were impacted by the Gangyal drainage subproject under project 2 by July 2021.
84 Land was identified for construction of the two rehabilitation complexes prior to loan approval. ADB funding for the
construction may have been explored for better monitoring and faster completion of the facilities. 85 While ADB communicated officially through letters and faxes to the implementing agency for every annual financial
report received, it is important to also monitor and follow up regularly, either by email or during missions, the implementing agency’s response, comments, and actions taken to the letters to confirm that these are understood and relayed to the appropriate units preparing the reports including the auditors to avoid recurrent issues in subsequent reports.
86 ADB now requires a high degree of readiness in many projects prior to loan approval, including completion of contract awards for 30% or more of the first project loan.
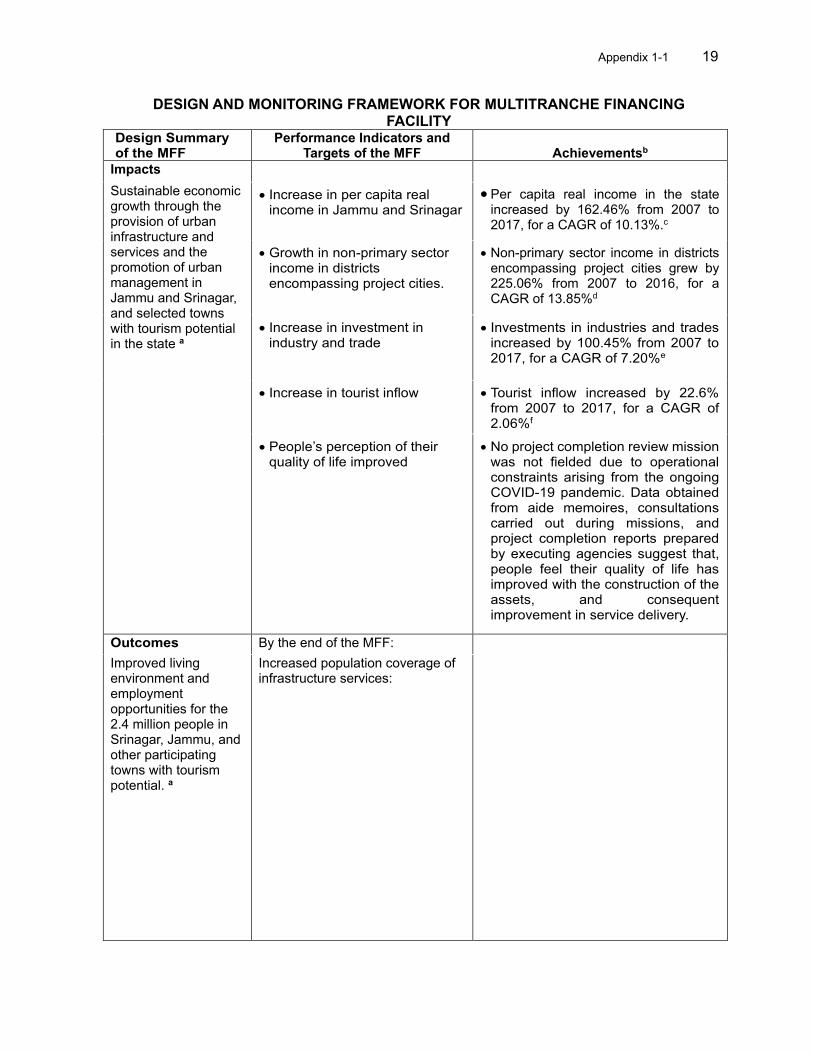
Appendix 1-1 19
DESIGN AND MONITORING FRAMEWORK FOR MULTITRANCHE FINANCING FACILITY
Design Summary of the MFF
Performance Indicators and Targets of the MFF Achievementsb
Impacts
Sustainable economic growth through the provision of urban infrastructure and services and the promotion of urban management in Jammu and Srinagar, and selected towns with tourism potential in the state a
• Increase in per capita real income in Jammu and Srinagar
• Per capita real income in the state increased by 162.46% from 2007 to 2017, for a CAGR of 10.13%.c
• Growth in non-primary sector income in districts encompassing project cities.
• Non-primary sector income in districts encompassing project cities grew by 225.06% from 2007 to 2016, for a CAGR of 13.85%d
• Increase in investment in industry and trade
• Investments in industries and trades increased by 100.45% from 2007 to 2017, for a CAGR of 7.20%e
• Increase in tourist inflow • Tourist inflow increased by 22.6% from 2007 to 2017, for a CAGR of 2.06%f
• People’s perception of their quality of life improved
• No project completion review mission was not fielded due to operational constraints arising from the ongoing COVID-19 pandemic. Data obtained from aide memoires, consultations carried out during missions, and project completion reports prepared by executing agencies suggest that, people feel their quality of life has improved with the construction of the assets, and consequent improvement in service delivery.
Outcomes By the end of the MFF:
Improved living environment and employment opportunities for the 2.4 million people in Srinagar, Jammu, and other participating towns with tourism potential. a
Increased population coverage of infrastructure services:
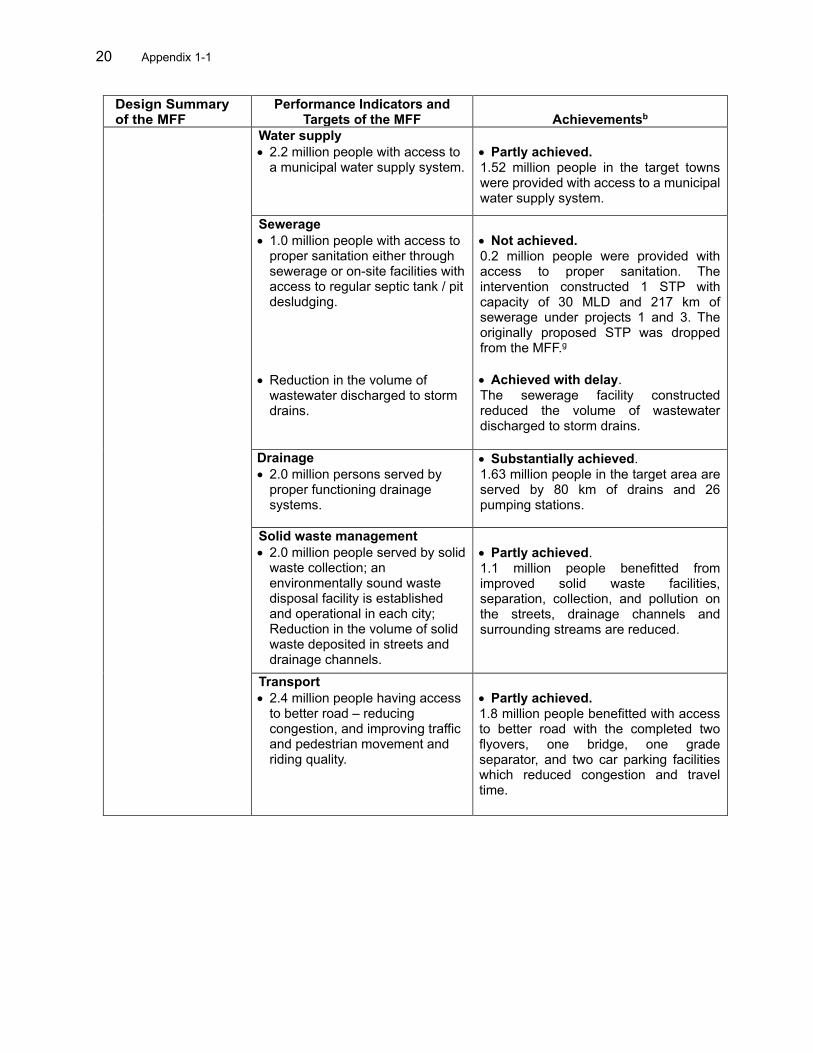
20 Appendix 1-1
Design Summary of the MFF
Performance Indicators and Targets of the MFF Achievementsb
Water supply
• 2.2 million people with access to a municipal water supply system.
• Partly achieved. 1.52 million people in the target towns were provided with access to a municipal water supply system.
Sewerage
• 1.0 million people with access to proper sanitation either through sewerage or on-site facilities with access to regular septic tank / pit desludging.
• Reduction in the volume of wastewater discharged to storm drains.
• Not achieved. 0.2 million people were provided with access to proper sanitation. The intervention constructed 1 STP with capacity of 30 MLD and 217 km of sewerage under projects 1 and 3. The originally proposed STP was dropped from the MFF.g
• Achieved with delay. The sewerage facility constructed reduced the volume of wastewater discharged to storm drains.
Drainage
• 2.0 million persons served by proper functioning drainage systems.
• Substantially achieved. 1.63 million people in the target area are served by 80 km of drains and 26 pumping stations.
Solid waste management
• 2.0 million people served by solid waste collection; an environmentally sound waste disposal facility is established and operational in each city; Reduction in the volume of solid waste deposited in streets and drainage channels.
• Partly achieved. 1.1 million people benefitted from improved solid waste facilities, separation, collection, and pollution on the streets, drainage channels and surrounding streams are reduced.
Transport
• 2.4 million people having access to better road – reducing congestion, and improving traffic and pedestrian movement and riding quality.
• Partly achieved. 1.8 million people benefitted with access to better road with the completed two flyovers, one bridge, one grade separator, and two car parking facilities which reduced congestion and travel time.
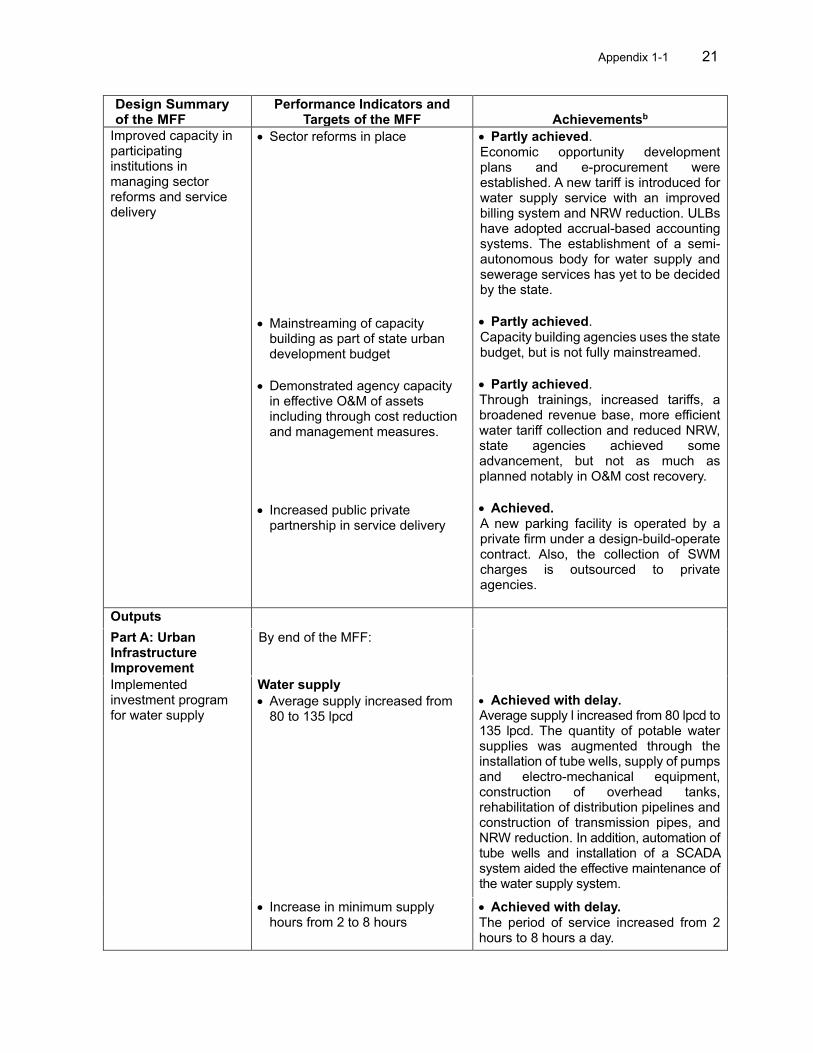
Appendix 1-1 21
Design Summary of the MFF
Performance Indicators and Targets of the MFF Achievementsb
Improved capacity in participating institutions in managing sector reforms and service delivery
• Sector reforms in place
• Mainstreaming of capacity building as part of state urban development budget
• Demonstrated agency capacity in effective O&M of assets including through cost reduction and management measures.
• Increased public private partnership in service delivery
• Partly achieved. Economic opportunity development plans and e-procurement were established. A new tariff is introduced for water supply service with an improved billing system and NRW reduction. ULBs have adopted accrual-based accounting systems. The establishment of a semi-autonomous body for water supply and sewerage services has yet to be decided by the state.
• Partly achieved. Capacity building agencies uses the state budget, but is not fully mainstreamed.
• Partly achieved. Through trainings, increased tariffs, a broadened revenue base, more efficient water tariff collection and reduced NRW, state agencies achieved some advancement, but not as much as planned notably in O&M cost recovery.
• Achieved. A new parking facility is operated by a private firm under a design-build-operate contract. Also, the collection of SWM charges is outsourced to private agencies.
Outputs
Part A: Urban Infrastructure Improvement
By end of the MFF:
Implemented investment program for water supply
Water supply
• Average supply increased from 80 to 135 lpcd
• Achieved with delay.
Average supply l increased from 80 lpcd to 135 lpcd. The quantity of potable water supplies was augmented through the installation of tube wells, supply of pumps and electro-mechanical equipment, construction of overhead tanks, rehabilitation of distribution pipelines and construction of transmission pipes, and NRW reduction. In addition, automation of tube wells and installation of a SCADA system aided the effective maintenance of the water supply system.
• Increase in minimum supply hours from 2 to 8 hours
• Achieved with delay. The period of service increased from 2 hours to 8 hours a day.
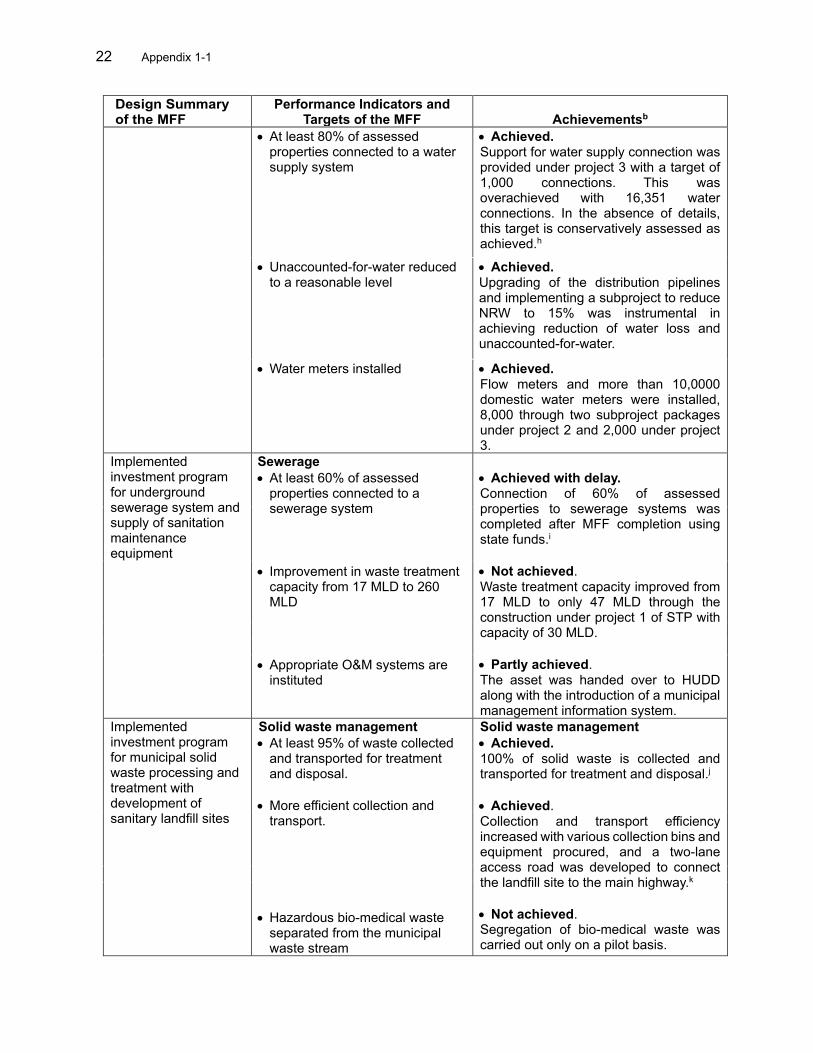
22 Appendix 1-1
Design Summary of the MFF
Performance Indicators and Targets of the MFF Achievementsb
• At least 80% of assessed properties connected to a water supply system
• Achieved. Support for water supply connection was provided under project 3 with a target of 1,000 connections. This was overachieved with 16,351 water connections. In the absence of details, this target is conservatively assessed as achieved.h
• Unaccounted-for-water reduced to a reasonable level
• Achieved. Upgrading of the distribution pipelines and implementing a subproject to reduce NRW to 15% was instrumental in achieving reduction of water loss and unaccounted-for-water.
• Water meters installed • Achieved. Flow meters and more than 10,0000 domestic water meters were installed, 8,000 through two subproject packages under project 2 and 2,000 under project 3.
Implemented investment program for underground sewerage system and supply of sanitation maintenance equipment
Sewerage
• At least 60% of assessed properties connected to a sewerage system
• Improvement in waste treatment capacity from 17 MLD to 260 MLD
• Appropriate O&M systems are instituted
• Achieved with delay. Connection of 60% of assessed properties to sewerage systems was completed after MFF completion using state funds.i
• Not achieved. Waste treatment capacity improved from 17 MLD to only 47 MLD through the construction under project 1 of STP with capacity of 30 MLD.
• Partly achieved. The asset was handed over to HUDD along with the introduction of a municipal management information system.
Implemented investment program for municipal solid waste processing and treatment with development of sanitary landfill sites
Solid waste management
• At least 95% of waste collected and transported for treatment and disposal.
• More efficient collection and transport.
• Hazardous bio-medical waste separated from the municipal waste stream
Solid waste management
• Achieved. 100% of solid waste is collected and transported for treatment and disposal.j
• Achieved. Collection and transport efficiency increased with various collection bins and equipment procured, and a two-lane access road was developed to connect the landfill site to the main highway.k
• Not achieved. Segregation of bio-medical waste was carried out only on a pilot basis.
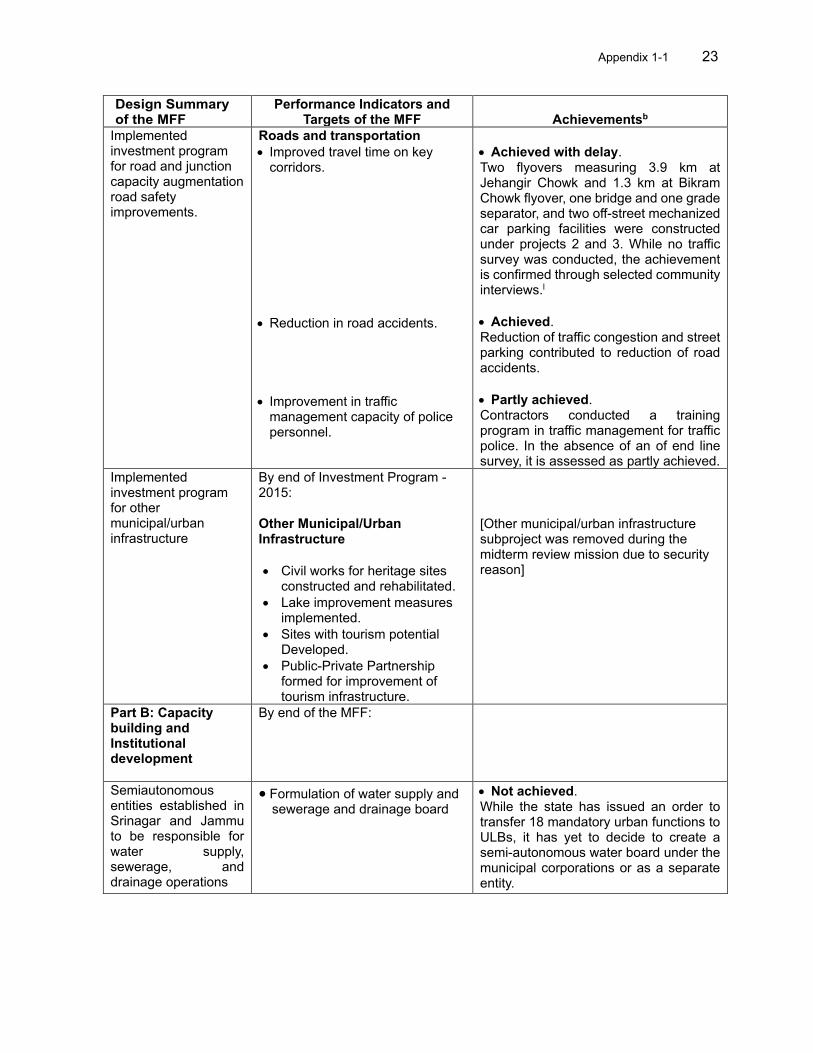
Appendix 1-1 23
Design Summary of the MFF
Performance Indicators and Targets of the MFF Achievementsb
Implemented investment program for road and junction capacity augmentation road safety improvements.
Roads and transportation
• Improved travel time on key corridors.
• Reduction in road accidents.
• Improvement in traffic management capacity of police personnel.
• Achieved with delay. Two flyovers measuring 3.9 km at Jehangir Chowk and 1.3 km at Bikram Chowk flyover, one bridge and one grade separator, and two off-street mechanized car parking facilities were constructed under projects 2 and 3. While no traffic survey was conducted, the achievement is confirmed through selected community interviews.l
• Achieved. Reduction of traffic congestion and street parking contributed to reduction of road accidents.
• Partly achieved. Contractors conducted a training program in traffic management for traffic police. In the absence of an of end line survey, it is assessed as partly achieved.
Implemented investment program for other municipal/urban infrastructure
By end of Investment Program - 2015: Other Municipal/Urban Infrastructure
• Civil works for heritage sites constructed and rehabilitated.
• Lake improvement measures implemented.
• Sites with tourism potential Developed.
• Public-Private Partnership formed for improvement of tourism infrastructure.
[Other municipal/urban infrastructure subproject was removed during the midterm review mission due to security reason]
Part B: Capacity building and Institutional development
By end of the MFF:
Semiautonomous entities established in Srinagar and Jammu to be responsible for water supply, sewerage, and drainage operations
• Formulation of water supply and sewerage and drainage board
• Not achieved. While the state has issued an order to transfer 18 mandatory urban functions to ULBs, it has yet to decide to create a semi-autonomous water board under the municipal corporations or as a separate entity.
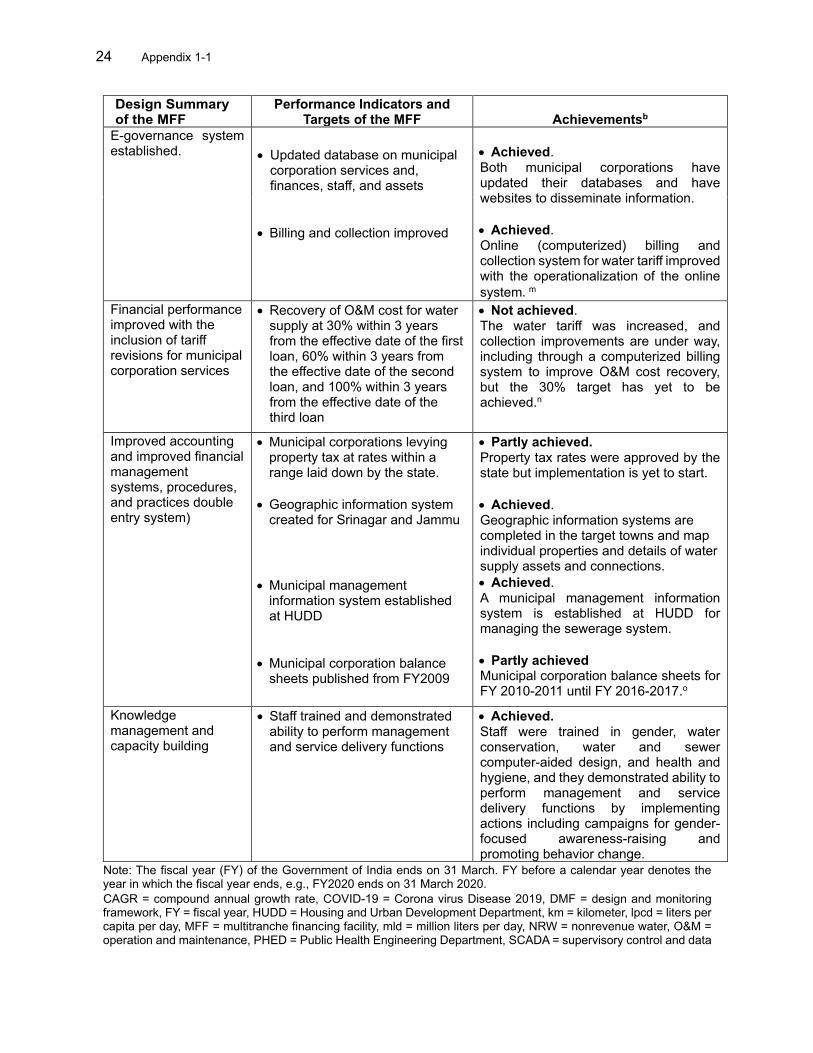
24 Appendix 1-1
Design Summary of the MFF
Performance Indicators and Targets of the MFF Achievementsb
E-governance system established.
• Updated database on municipal
corporation services and, finances, staff, and assets
• Billing and collection improved
• Achieved. Both municipal corporations have updated their databases and have websites to disseminate information.
• Achieved. Online (computerized) billing and collection system for water tariff improved with the operationalization of the online
system.m
Financial performance improved with the inclusion of tariff revisions for municipal corporation services
• Recovery of O&M cost for water supply at 30% within 3 years from the effective date of the first loan, 60% within 3 years from the effective date of the second loan, and 100% within 3 years from the effective date of the third loan
• Not achieved. The water tariff was increased, and collection improvements are under way, including through a computerized billing system to improve O&M cost recovery, but the 30% target has yet to be achieved.n
Improved accounting and improved financial management systems, procedures, and practices double entry system)
• Municipal corporations levying property tax at rates within a range laid down by the state.
• Geographic information system created for Srinagar and Jammu
• Municipal management information system established at HUDD
• Municipal corporation balance sheets published from FY2009
• Partly achieved. Property tax rates were approved by the state but implementation is yet to start.
• Achieved. Geographic information systems are completed in the target towns and map individual properties and details of water supply assets and connections.
• Achieved. A municipal management information system is established at HUDD for managing the sewerage system.
• Partly achieved Municipal corporation balance sheets for FY 2010-2011 until FY 2016-2017.o
Knowledge management and capacity building
• Staff trained and demonstrated ability to perform management and service delivery functions
• Achieved. Staff were trained in gender, water conservation, water and sewer computer-aided design, and health and hygiene, and they demonstrated ability to perform management and service delivery functions by implementing actions including campaigns for gender-focused awareness-raising and promoting behavior change.
Note: The fiscal year (FY) of the Government of India ends on 31 March. FY before a calendar year denotes the year in which the fiscal year ends, e.g., FY2020 ends on 31 March 2020.
CAGR = compound annual growth rate, COVID-19 = Corona virus Disease 2019, DMF = design and monitoring framework, FY = fiscal year, HUDD = Housing and Urban Development Department, km = kilometer, lpcd = liters per capita per day, MFF = multitranche financing facility, mld = million liters per day, NRW = nonrevenue water, O&M = operation and maintenance, PHED = Public Health Engineering Department, SCADA = supervisory control and data
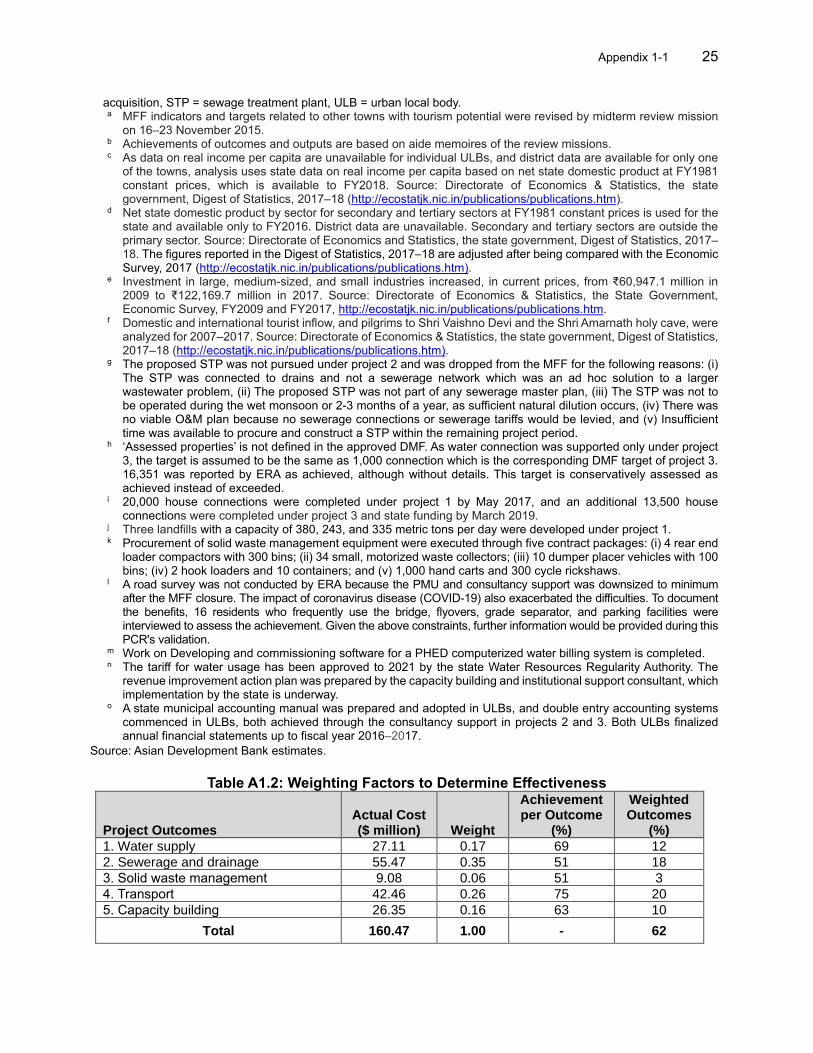
Appendix 1-1 25
acquisition, STP = sewage treatment plant, ULB = urban local body. a MFF indicators and targets related to other towns with tourism potential were revised by midterm review mission
on 16–23 November 2015. b Achievements of outcomes and outputs are based on aide memoires of the review missions. c As data on real income per capita are unavailable for individual ULBs, and district data are available for only one
of the towns, analysis uses state data on real income per capita based on net state domestic product at FY1981 constant prices, which is available to FY2018. Source: Directorate of Economics & Statistics, the state government, Digest of Statistics, 2017–18 (http://ecostatjk.nic.in/publications/publications.htm).
d Net state domestic product by sector for secondary and tertiary sectors at FY1981 constant prices is used for the state and available only to FY2016. District data are unavailable. Secondary and tertiary sectors are outside the primary sector. Source: Directorate of Economics and Statistics, the state government, Digest of Statistics, 2017–18. The figures reported in the Digest of Statistics, 2017–18 are adjusted after being compared with the Economic Survey, 2017 (http://ecostatjk.nic.in/publications/publications.htm).
e Investment in large, medium-sized, and small industries increased, in current prices, from ₹60,947.1 million in 2009 to ₹122,169.7 million in 2017. Source: Directorate of Economics & Statistics, the State Government, Economic Survey, FY2009 and FY2017, http://ecostatjk.nic.in/publications/publications.htm.
f Domestic and international tourist inflow, and pilgrims to Shri Vaishno Devi and the Shri Amarnath holy cave, were analyzed for 2007–2017. Source: Directorate of Economics & Statistics, the state government, Digest of Statistics, 2017–18 (http://ecostatjk.nic.in/publications/publications.htm).
g The proposed STP was not pursued under project 2 and was dropped from the MFF for the following reasons: (i) The STP was connected to drains and not a sewerage network which was an ad hoc solution to a larger wastewater problem, (ii) The proposed STP was not part of any sewerage master plan, (iii) The STP was not to be operated during the wet monsoon or 2-3 months of a year, as sufficient natural dilution occurs, (iv) There was no viable O&M plan because no sewerage connections or sewerage tariffs would be levied, and (v) Insufficient time was available to procure and construct a STP within the remaining project period.
h ‘Assessed properties’ is not defined in the approved DMF. As water connection was supported only under project 3, the target is assumed to be the same as 1,000 connection which is the corresponding DMF target of project 3. 16,351 was reported by ERA as achieved, although without details. This target is conservatively assessed as achieved instead of exceeded.
i 20,000 house connections were completed under project 1 by May 2017, and an additional 13,500 house connections were completed under project 3 and state funding by March 2019.
j Three landfills with a capacity of 380, 243, and 335 metric tons per day were developed under project 1. k Procurement of solid waste management equipment were executed through five contract packages: (i) 4 rear end
loader compactors with 300 bins; (ii) 34 small, motorized waste collectors; (iii) 10 dumper placer vehicles with 100 bins; (iv) 2 hook loaders and 10 containers; and (v) 1,000 hand carts and 300 cycle rickshaws.
l A road survey was not conducted by ERA because the PMU and consultancy support was downsized to minimum after the MFF closure. The impact of coronavirus disease (COVID-19) also exacerbated the difficulties. To document the benefits, 16 residents who frequently use the bridge, flyovers, grade separator, and parking facilities were interviewed to assess the achievement. Given the above constraints, further information would be provided during this PCR's validation.
m Work on Developing and commissioning software for a PHED computerized water billing system is completed. n The tariff for water usage has been approved to 2021 by the state Water Resources Regularity Authority. The
revenue improvement action plan was prepared by the capacity building and institutional support consultant, which implementation by the state is underway.
o A state municipal accounting manual was prepared and adopted in ULBs, and double entry accounting systems commenced in ULBs, both achieved through the consultancy support in projects 2 and 3. Both ULBs finalized annual financial statements up to fiscal year 2016–2017.
Source: Asian Development Bank estimates.
Table A1.2: Weighting Factors to Determine Effectiveness
Project Outcomes Actual Cost ($ million) Weight
Achievement per Outcome
(%)
Weighted Outcomes
(%)
1. Water supply 27.11 0.17 69 12
2. Sewerage and drainage 55.47 0.35 51 18
3. Solid waste management 9.08 0.06 51 3
4. Transport 42.46 0.26 75 20
5. Capacity building 26.35 0.16 63 10
Total 160.47 1.00 - 62
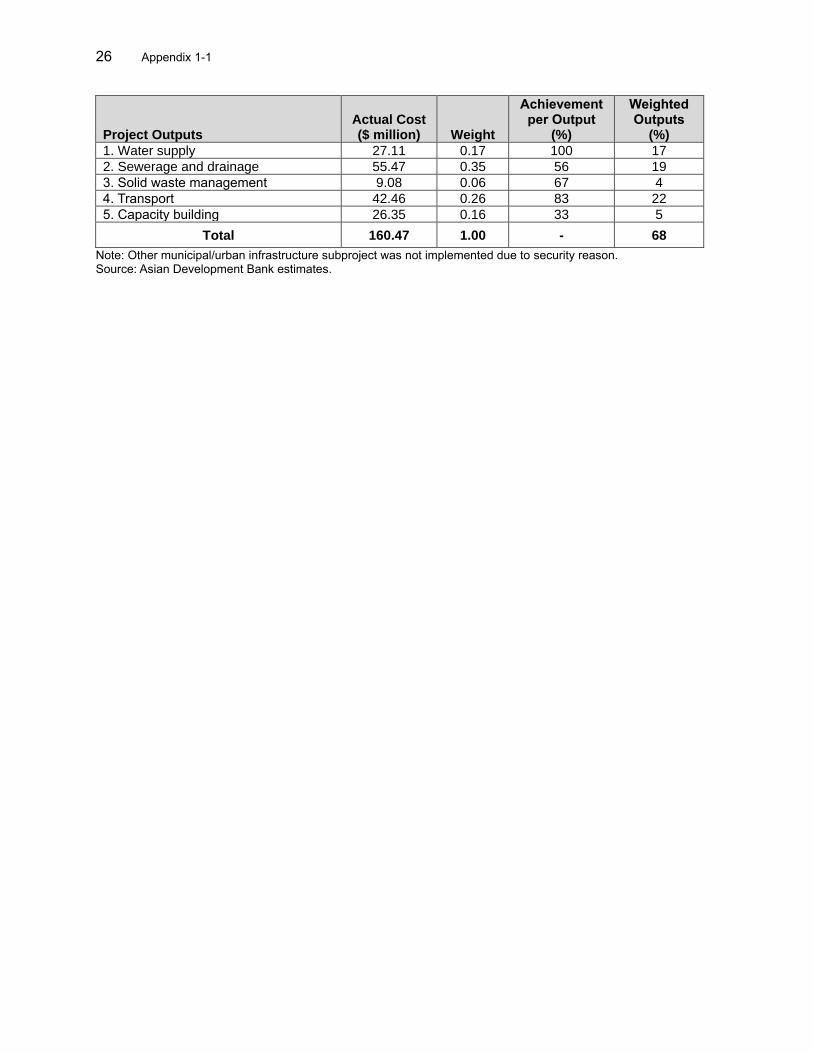
26 Appendix 1-1
Project Outputs Actual Cost ($ million) Weight
Achievement per Output
(%)
Weighted Outputs
(%)
1. Water supply 27.11 0.17 100 17
2. Sewerage and drainage 55.47 0.35 56 19
3. Solid waste management 9.08 0.06 67 4
4. Transport 42.46 0.26 83 22
5. Capacity building 26.35 0.16 33 5
Total 160.47 1.00 - 68
Note: Other municipal/urban infrastructure subproject was not implemented due to security reason. Source: Asian Development Bank estimates.
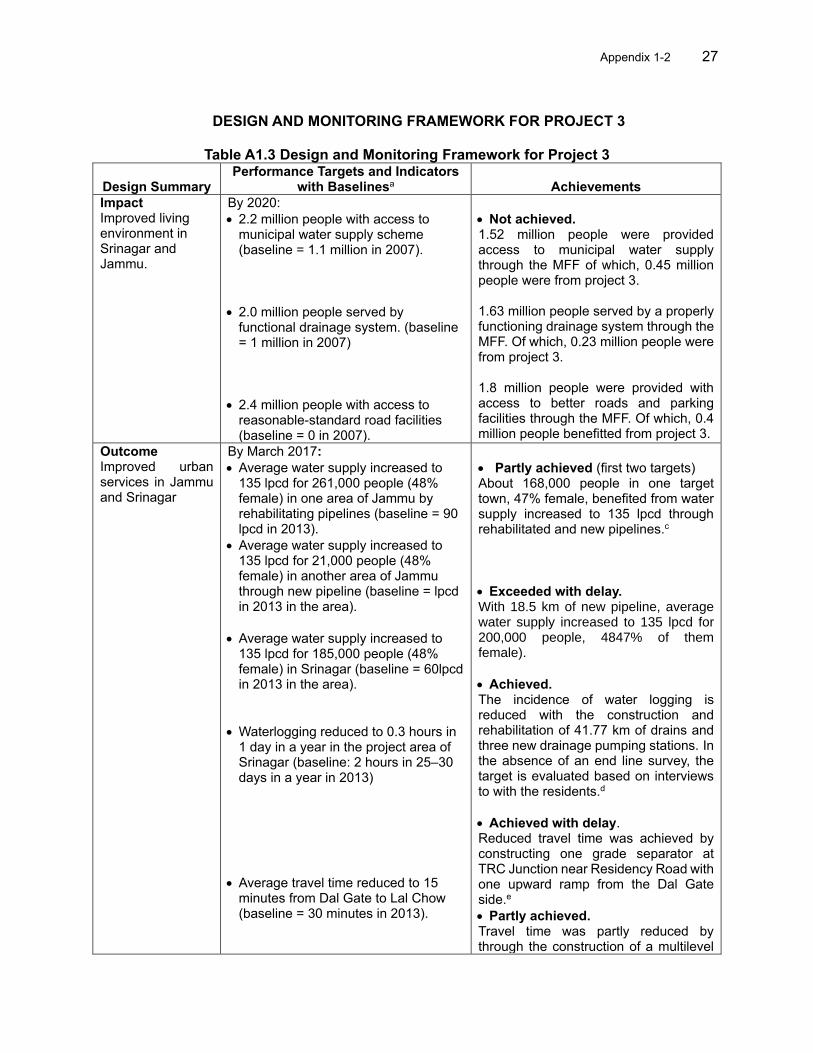
Appendix 1-2 27
DESIGN AND MONITORING FRAMEWORK FOR PROJECT 3
Table A1.3 Design and Monitoring Framework for Project 3
Design Summary Performance Targets and Indicators
with Baselinesa Achievements
Impact By 2020: Improved living environment in Srinagar and Jammu.
• 2.2 million people with access to municipal water supply scheme (baseline = 1.1 million in 2007).
• 2.0 million people served by functional drainage system. (baseline = 1 million in 2007)
• 2.4 million people with access to reasonable-standard road facilities (baseline = 0 in 2007).
• Not achieved. 1.52 million people were provided access to municipal water supply through the MFF of which, 0.45 million people were from project 3.
1.63 million people served by a properly functioning drainage system through the MFF. Of which, 0.23 million people were from project 3. 1.8 million people were provided with access to better roads and parking facilities through the MFF. Of which, 0.4 million people benefitted from project 3.
Outcome Improved urban services in Jammu and Srinagar
By March 2017:
• Average water supply increased to 135 lpcd for 261,000 people (48% female) in one area of Jammu by rehabilitating pipelines (baseline = 90 lpcd in 2013).
• Average water supply increased to 135 lpcd for 21,000 people (48% female) in another area of Jammu through new pipeline (baseline = lpcd in 2013 in the area).
• Average water supply increased to 135 lpcd for 185,000 people (48% female) in Srinagar (baseline = 60lpcd in 2013 in the area).
• Waterlogging reduced to 0.3 hours in 1 day in a year in the project area of Srinagar (baseline: 2 hours in 25–30 days in a year in 2013)
• Average travel time reduced to 15 minutes from Dal Gate to Lal Chow (baseline = 30 minutes in 2013).
• Partly achieved (first two targets) About 168,000 people in one target town, 47% female, benefited from water supply increased to 135 lpcd through rehabilitated and new pipelines.c
• Exceeded with delay. With 18.5 km of new pipeline, average water supply increased to 135 lpcd for 200,000 people, 4847% of them female).
• Achieved. The incidence of water logging is reduced with the construction and rehabilitation of 41.77 km of drains and three new drainage pumping stations. In the absence of an end line survey, the target is evaluated based on interviews to with the residents.d
• Achieved with delay. Reduced travel time was achieved by constructing one grade separator at TRC Junction near Residency Road with one upward ramp from the Dal Gate side.e
• Partly achieved. Travel time was partly reduced by through the construction of a multilevel
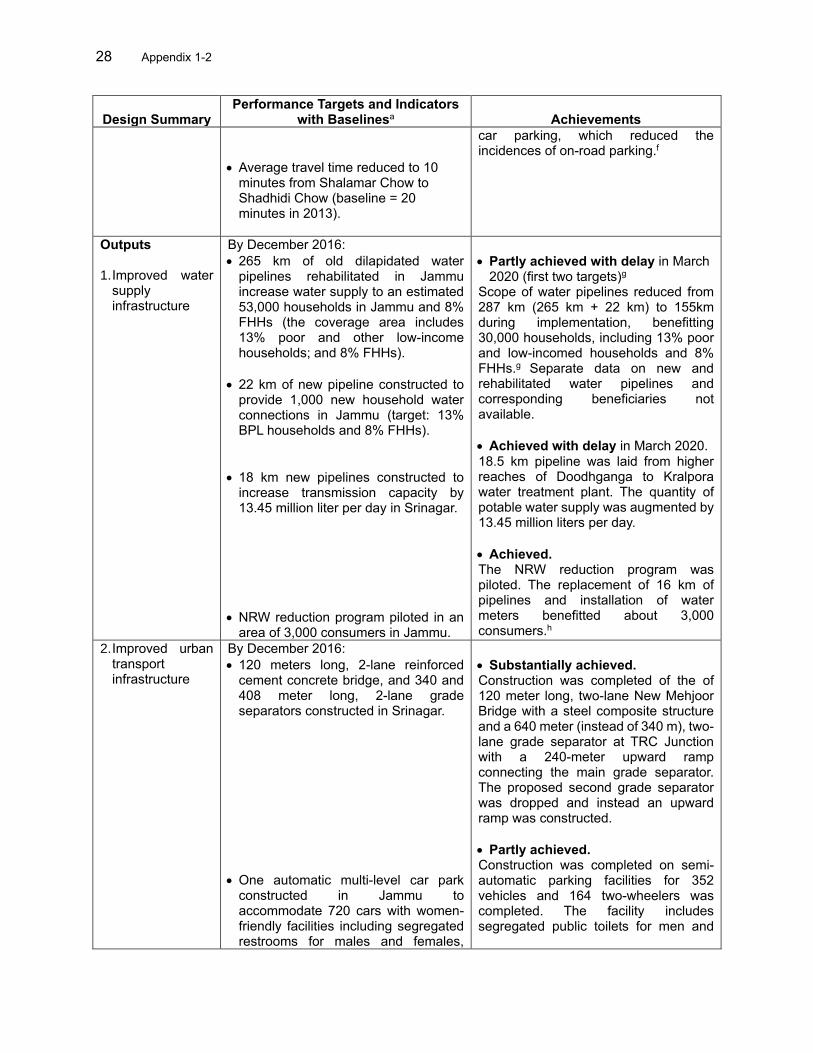
28 Appendix 1-2
Design Summary Performance Targets and Indicators
with Baselinesa Achievements
• Average travel time reduced to 10 minutes from Shalamar Chow to Shadhidi Chow (baseline = 20 minutes in 2013).
car parking, which reduced the incidences of on-road parking.f
Outputs 1. Improved water
supply infrastructure
By December 2016:
• 265 km of old dilapidated water pipelines rehabilitated in Jammu increase water supply to an estimated 53,000 households in Jammu and 8% FHHs (the coverage area includes 13% poor and other low-income households; and 8% FHHs).
• 22 km of new pipeline constructed to provide 1,000 new household water connections in Jammu (target: 13% BPL households and 8% FHHs).
• 18 km new pipelines constructed to increase transmission capacity by 13.45 million liter per day in Srinagar.
• NRW reduction program piloted in an area of 3,000 consumers in Jammu.
• Partly achieved with delay in March 2020 (first two targets)g
Scope of water pipelines reduced from 287 km (265 km + 22 km) to 155km during implementation, benefitting 30,000 households, including 13% poor and low-incomed households and 8% FHHs.g Separate data on new and rehabilitated water pipelines and corresponding beneficiaries not available.
• Achieved with delay in March 2020. 18.5 km pipeline was laid from higher reaches of Doodhganga to Kralpora water treatment plant. The quantity of potable water supply was augmented by 13.45 million liters per day.
• Achieved. The NRW reduction program was piloted. The replacement of 16 km of pipelines and installation of water meters benefitted about 3,000 consumers.h
2. Improved urban transport infrastructure
By December 2016:
• 120 meters long, 2-lane reinforced cement concrete bridge, and 340 and 408 meter long, 2-lane grade separators constructed in Srinagar.
• One automatic multi-level car park constructed in Jammu to accommodate 720 cars with women-friendly facilities including segregated restrooms for males and females,
• Substantially achieved. Construction was completed of the of 120 meter long, two-lane New Mehjoor Bridge with a steel composite structure and a 640 meter (instead of 340 m), two-lane grade separator at TRC Junction with a 240-meter upward ramp connecting the main grade separator. The proposed second grade separator was dropped and instead an upward ramp was constructed.
• Partly achieved. Construction was completed on semi-automatic parking facilities for 352 vehicles and 164 two-wheelers was completed. The facility includes segregated public toilets for men and
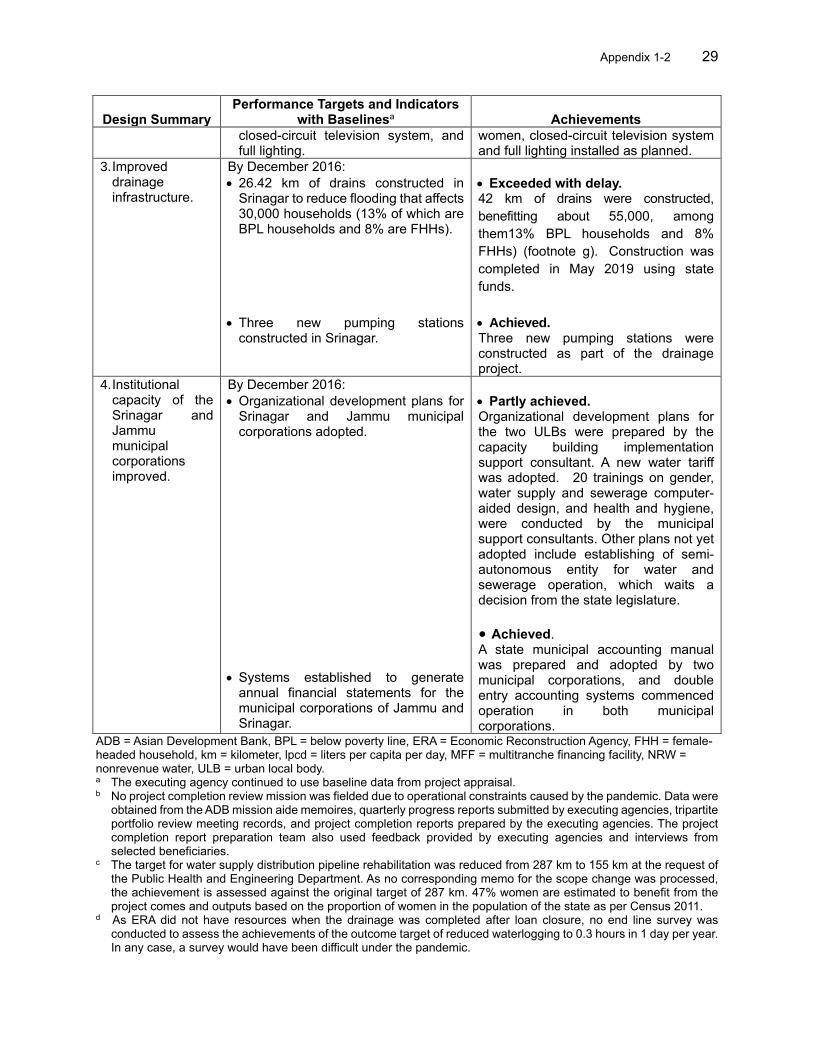
Appendix 1-2 29
Design Summary Performance Targets and Indicators
with Baselinesa Achievements
closed-circuit television system, and full lighting.
women, closed-circuit television system and full lighting installed as planned.
3. Improved drainage infrastructure.
By December 2016:
• 26.42 km of drains constructed in Srinagar to reduce flooding that affects 30,000 households (13% of which are BPL households and 8% are FHHs).
• Three new pumping stations constructed in Srinagar.
• Exceeded with delay. 42 km of drains were constructed,
benefitting about 55,000, among
them13% BPL households and 8%
FHHs) (footnote g). Construction was
completed in May 2019 using state
funds.
• Achieved. Three new pumping stations were constructed as part of the drainage project.
4. Institutional capacity of the Srinagar and Jammu municipal corporations improved.
By December 2016:
• Organizational development plans for Srinagar and Jammu municipal corporations adopted.
• Systems established to generate annual financial statements for the municipal corporations of Jammu and Srinagar.
• Partly achieved. Organizational development plans for the two ULBs were prepared by the capacity building implementation support consultant. A new water tariff was adopted. 20 trainings on gender, water supply and sewerage computer-aided design, and health and hygiene, were conducted by the municipal support consultants. Other plans not yet adopted include establishing of semi-autonomous entity for water and sewerage operation, which waits a decision from the state legislature.
• Achieved. A state municipal accounting manual was prepared and adopted by two municipal corporations, and double entry accounting systems commenced operation in both municipal corporations.
ADB = Asian Development Bank, BPL = below poverty line, ERA = Economic Reconstruction Agency, FHH = female-headed household, km = kilometer, lpcd = liters per capita per day, MFF = multitranche financing facility, NRW = nonrevenue water, ULB = urban local body. a The executing agency continued to use baseline data from project appraisal. b No project completion review mission was fielded due to operational constraints caused by the pandemic. Data were
obtained from the ADB mission aide memoires, quarterly progress reports submitted by executing agencies, tripartite portfolio review meeting records, and project completion reports prepared by the executing agencies. The project completion report preparation team also used feedback provided by executing agencies and interviews from selected beneficiaries.
c The target for water supply distribution pipeline rehabilitation was reduced from 287 km to 155 km at the request of the Public Health and Engineering Department. As no corresponding memo for the scope change was processed, the achievement is assessed against the original target of 287 km. 47% women are estimated to benefit from the project comes and outputs based on the proportion of women in the population of the state as per Census 2011.
d As ERA did not have resources when the drainage was completed after loan closure, no end line survey was conducted to assess the achievements of the outcome target of reduced waterlogging to 0.3 hours in 1 day per year. In any case, a survey would have been difficult under the pandemic.
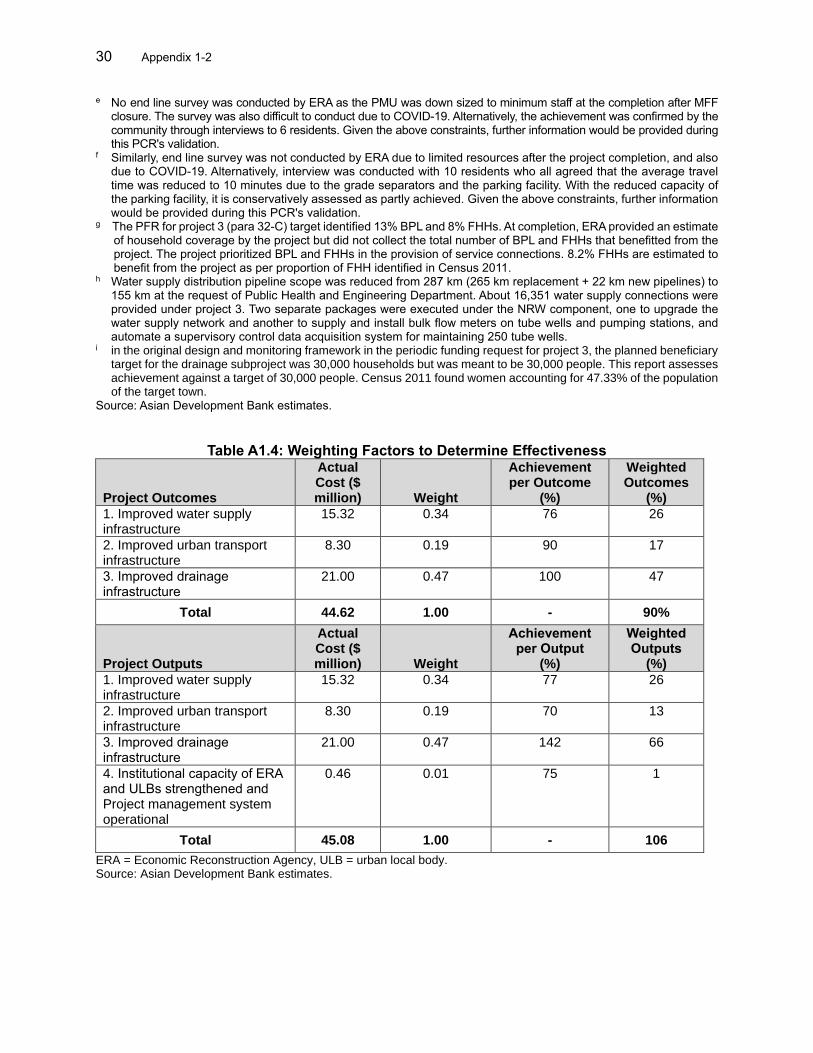
30 Appendix 1-2
e No end line survey was conducted by ERA as the PMU was down sized to minimum staff at the completion after MFF closure. The survey was also difficult to conduct due to COVID-19. Alternatively, the achievement was confirmed by the community through interviews to 6 residents. Given the above constraints, further information would be provided during this PCR's validation.
f Similarly, end line survey was not conducted by ERA due to limited resources after the project completion, and also due to COVID-19. Alternatively, interview was conducted with 10 residents who all agreed that the average travel time was reduced to 10 minutes due to the grade separators and the parking facility. With the reduced capacity of the parking facility, it is conservatively assessed as partly achieved. Given the above constraints, further information would be provided during this PCR's validation.
g The PFR for project 3 (para 32-C) target identified 13% BPL and 8% FHHs. At completion, ERA provided an estimate of household coverage by the project but did not collect the total number of BPL and FHHs that benefitted from the project. The project prioritized BPL and FHHs in the provision of service connections. 8.2% FHHs are estimated to benefit from the project as per proportion of FHH identified in Census 2011.
h Water supply distribution pipeline scope was reduced from 287 km (265 km replacement + 22 km new pipelines) to 155 km at the request of Public Health and Engineering Department. About 16,351 water supply connections were provided under project 3. Two separate packages were executed under the NRW component, one to upgrade the water supply network and another to supply and install bulk flow meters on tube wells and pumping stations, and automate a supervisory control data acquisition system for maintaining 250 tube wells.
i in the original design and monitoring framework in the periodic funding request for project 3, the planned beneficiary target for the drainage subproject was 30,000 households but was meant to be 30,000 people. This report assesses achievement against a target of 30,000 people. Census 2011 found women accounting for 47.33% of the population of the target town.
Source: Asian Development Bank estimates.
Table A1.4: Weighting Factors to Determine Effectiveness
Project Outcomes
Actual Cost ($ million) Weight
Achievement per Outcome
(%)
Weighted Outcomes
(%)
1. Improved water supply infrastructure
15.32 0.34 76 26
2. Improved urban transport infrastructure
8.30 0.19 90 17
3. Improved drainage infrastructure
21.00 0.47 100 47
Total 44.62 1.00 - 90%
Project Outputs
Actual Cost ($ million) Weight
Achievement per Output
(%)
Weighted Outputs
(%)
1. Improved water supply infrastructure
15.32 0.34 77 26
2. Improved urban transport infrastructure
8.30 0.19 70 13
3. Improved drainage infrastructure
21.00 0.47 142 66
4. Institutional capacity of ERA and ULBs strengthened and Project management system operational
0.46 0.01 75 1
Total 45.08 1.00 - 106
ERA = Economic Reconstruction Agency, ULB = urban local body. Source: Asian Development Bank estimates.
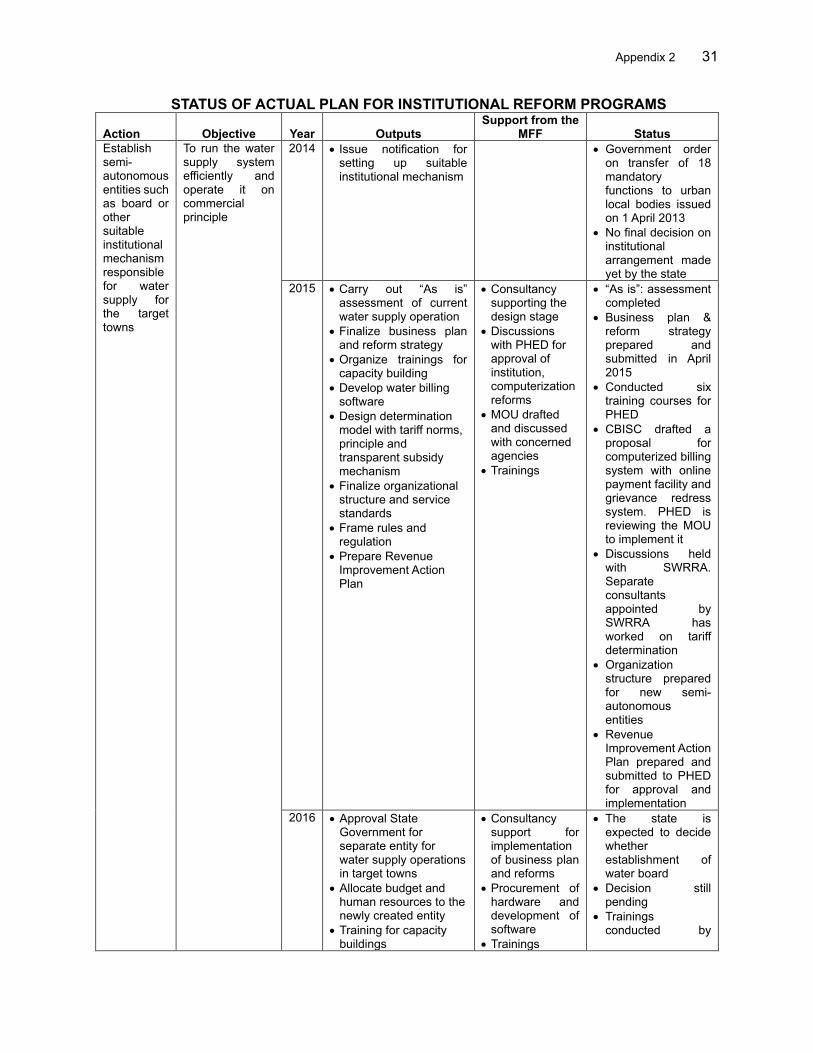
Appendix 2 31
STATUS OF ACTUAL PLAN FOR INSTITUTIONAL REFORM PROGRAMS
Action Objective Year Outputs Support from the
MFF Status
Establish semi-autonomous entities such as board or other suitable institutional mechanism responsible for water supply for the target towns
To run the water supply system efficiently and operate it on commercial principle
2014 • Issue notification for setting up suitable institutional mechanism
• Government order on transfer of 18 mandatory functions to urban local bodies issued on 1 April 2013
• No final decision on institutional arrangement made yet by the state
2015 • Carry out “As is” assessment of current water supply operation
• Finalize business plan and reform strategy
• Organize trainings for capacity building
• Develop water billing software
• Design determination model with tariff norms, principle and transparent subsidy mechanism
• Finalize organizational structure and service standards
• Frame rules and regulation
• Prepare Revenue Improvement Action Plan
• Consultancy supporting the design stage
• Discussions with PHED for approval of institution, computerization reforms
• MOU drafted and discussed with concerned agencies
• Trainings
• “As is”: assessment completed
• Business plan & reform strategy prepared and submitted in April 2015
• Conducted six training courses for PHED
• CBISC drafted a proposal for computerized billing system with online payment facility and grievance redress system. PHED is reviewing the MOU to implement it
• Discussions held with SWRRA. Separate consultants appointed by SWRRA has worked on tariff determination
• Organization structure prepared for new semi-autonomous entities
• Revenue Improvement Action Plan prepared and submitted to PHED for approval and implementation
2016 • Approval State Government for separate entity for water supply operations in target towns
• Allocate budget and human resources to the newly created entity
• Training for capacity buildings
• Consultancy support for implementation of business plan and reforms
• Procurement of hardware and development of software
• Trainings
• The state is expected to decide whether establishment of water board
• Decision still pending
• Trainings conducted by
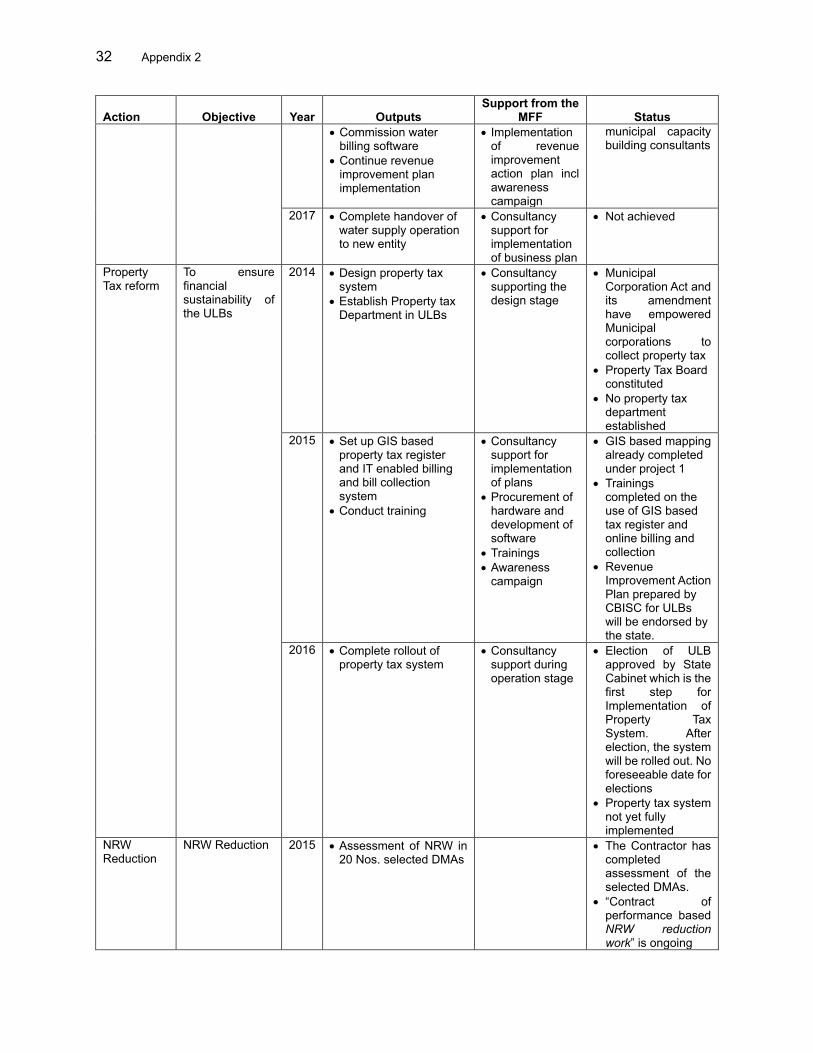
32 Appendix 2
Action Objective Year Outputs Support from the
MFF Status
• Commission water billing software
• Continue revenue improvement plan implementation
• Implementation of revenue improvement action plan incl awareness campaign
municipal capacity building consultants
2017 • Complete handover of water supply operation to new entity
• Consultancy support for implementation of business plan
• Not achieved
Property Tax reform
To ensure financial sustainability of the ULBs
2014 • Design property tax system
• Establish Property tax Department in ULBs
• Consultancy supporting the design stage
• Municipal Corporation Act and its amendment have empowered Municipal corporations to collect property tax
• Property Tax Board constituted
• No property tax department established
2015 • Set up GIS based property tax register and IT enabled billing and bill collection system
• Conduct training
• Consultancy support for implementation of plans
• Procurement of hardware and development of software
• Trainings
• Awareness campaign
• GIS based mapping already completed under project 1
• Trainings completed on the use of GIS based tax register and online billing and collection
• Revenue Improvement Action Plan prepared by CBISC for ULBs will be endorsed by the state.
2016 • Complete rollout of property tax system
• Consultancy support during operation stage
• Election of ULB approved by State Cabinet which is the first step for Implementation of Property Tax System. After election, the system will be rolled out. No foreseeable date for elections
• Property tax system not yet fully implemented
NRW Reduction
NRW Reduction 2015 • Assessment of NRW in 20 Nos. selected DMAs
• The Contractor has completed assessment of the selected DMAs.
• “Contract of performance based NRW reduction work” is ongoing
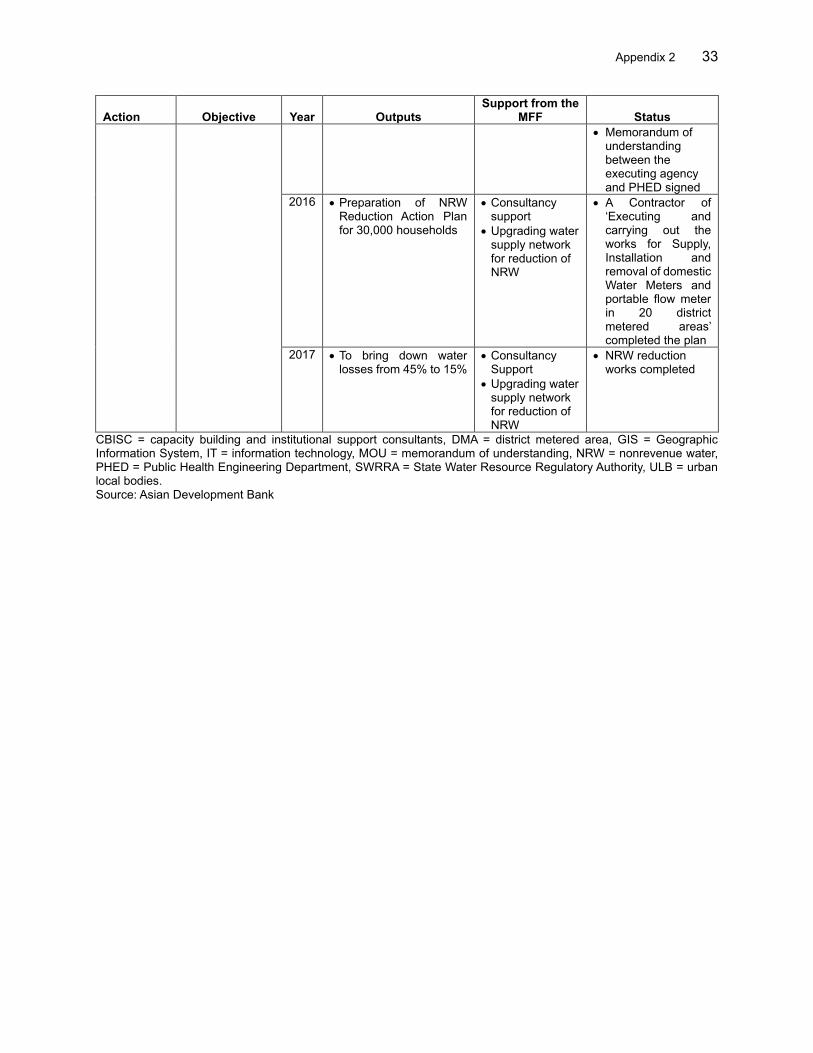
Appendix 2 33
Action Objective Year Outputs Support from the
MFF Status
• Memorandum of understanding between the executing agency and PHED signed
2016 • Preparation of NRW Reduction Action Plan for 30,000 households
• Consultancy support
• Upgrading water supply network for reduction of NRW
• A Contractor of ‘Executing and carrying out the works for Supply, Installation and removal of domestic Water Meters and portable flow meter in 20 district metered areas’ completed the plan
2017 • To bring down water losses from 45% to 15%
• Consultancy Support
• Upgrading water supply network for reduction of NRW
• NRW reduction works completed
CBISC = capacity building and institutional support consultants, DMA = district metered area, GIS = Geographic Information System, IT = information technology, MOU = memorandum of understanding, NRW = nonrevenue water, PHED = Public Health Engineering Department, SWRRA = State Water Resource Regulatory Authority, ULB = urban local bodies. Source: Asian Development Bank
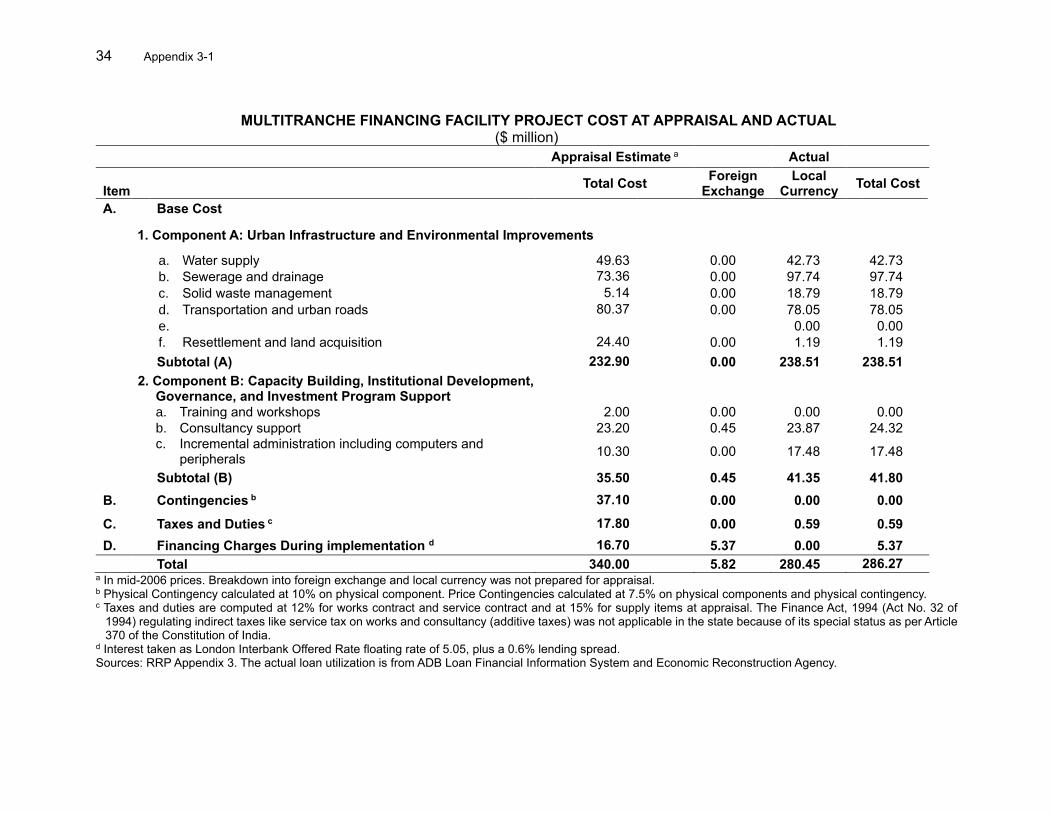
34 Appendix 3-1
MULTITRANCHE FINANCING FACILITY PROJECT COST AT APPRAISAL AND ACTUAL
($ million) Appraisal Estimate a
Actual
Item
Total Cost Foreign
Exchange Local
Currency Total Cost
A. Base Cost
1. Component A: Urban Infrastructure and Environmental Improvements
a. Water supply 49.63 0.00 42.73 42.73
b. Sewerage and drainage 73.36 0.00 97.74 97.74
c. Solid waste management 5.14 0.00 18.79 18.79
d. Transportation and urban roads 80.37 0.00 78.05 78.05
e. 0.00 0.00
f. Resettlement and land acquisition 24.40 0.00 1.19 1.19 Subtotal (A) 232.90 0.00 238.51 238.51
2. Component B: Capacity Building, Institutional Development, Governance, and Investment Program Support
a. Training and workshops 2.00 0.00 0.00 0.00
b. Consultancy support 23.20 0.45 23.87 24.32
c. Incremental administration including computers and peripherals
10.30 0.00 17.48 17.48
Subtotal (B) 35.50 0.45 41.35 41.80
B. Contingencies b 37.10 0.00 0.00 0.00
C. Taxes and Duties c 17.80 0.00 0.59 0.59
D. Financing Charges During implementation d 16.70 5.37 0.00 5.37
Total 340.00 5.82 280.45 286.27 a In mid-2006 prices. Breakdown into foreign exchange and local currency was not prepared for appraisal. b Physical Contingency calculated at 10% on physical component. Price Contingencies calculated at 7.5% on physical components and physical contingency. c Taxes and duties are computed at 12% for works contract and service contract and at 15% for supply items at appraisal. The Finance Act, 1994 (Act No. 32 of
1994) regulating indirect taxes like service tax on works and consultancy (additive taxes) was not applicable in the state because of its special status as per Article 370 of the Constitution of India.
d Interest taken as London Interbank Offered Rate floating rate of 5.05, plus a 0.6% lending spread. Sources: RRP Appendix 3. The actual loan utilization is from ADB Loan Financial Information System and Economic Reconstruction Agency.
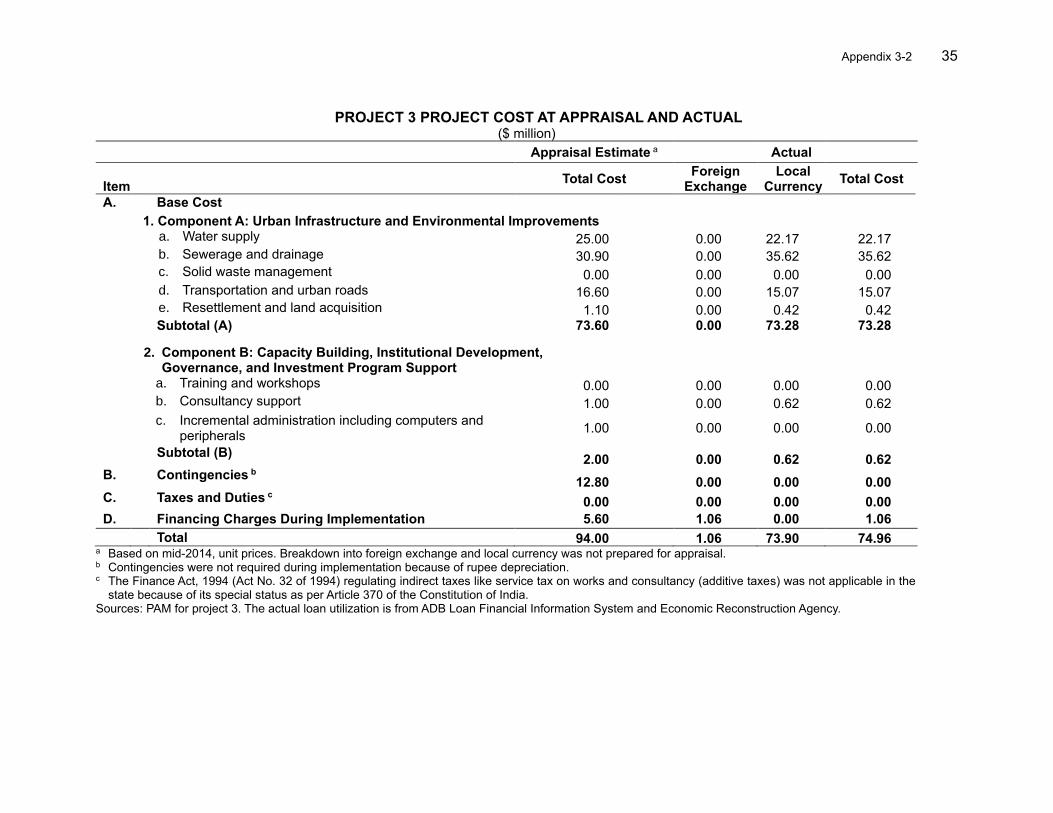
Appendix 3-2 35
PROJECT 3 PROJECT COST AT APPRAISAL AND ACTUAL ($ million) Appraisal Estimate a
Actual
Item
Total Cost Foreign
Exchange Local
Currency Total Cost
A. Base Cost 1. Component A: Urban Infrastructure and Environmental Improvements
a. Water supply 25.00 0.00 22.17 22.17
b. Sewerage and drainage 30.90 0.00 35.62 35.62
c. Solid waste management 0.00 0.00 0.00 0.00
d. Transportation and urban roads 16.60 0.00 15.07 15.07
e. Resettlement and land acquisition 1.10 0.00 0.42 0.42 Subtotal (A) 73.60 0.00 73.28 73.28
2. Component B: Capacity Building, Institutional Development, Governance, and Investment Program Support
a. Training and workshops 0.00 0.00 0.00 0.00
b. Consultancy support 1.00 0.00 0.62 0.62
c. Incremental administration including computers and peripherals
1.00 0.00 0.00 0.00
Subtotal (B) 2.00 0.00 0.62 0.62
B.
Contingencies b 12.80 0.00 0.00 0.00
C.
Taxes and Duties c 0.00 0.00 0.00 0.00
D. Financing Charges During Implementation 5.60 1.06 0.00 1.06
Total 94.00 1.06 73.90 74.96 a Based on mid-2014, unit prices. Breakdown into foreign exchange and local currency was not prepared for appraisal. b Contingencies were not required during implementation because of rupee depreciation. c The Finance Act, 1994 (Act No. 32 of 1994) regulating indirect taxes like service tax on works and consultancy (additive taxes) was not applicable in the
state because of its special status as per Article 370 of the Constitution of India. Sources: PAM for project 3. The actual loan utilization is from ADB Loan Financial Information System and Economic Reconstruction Agency.
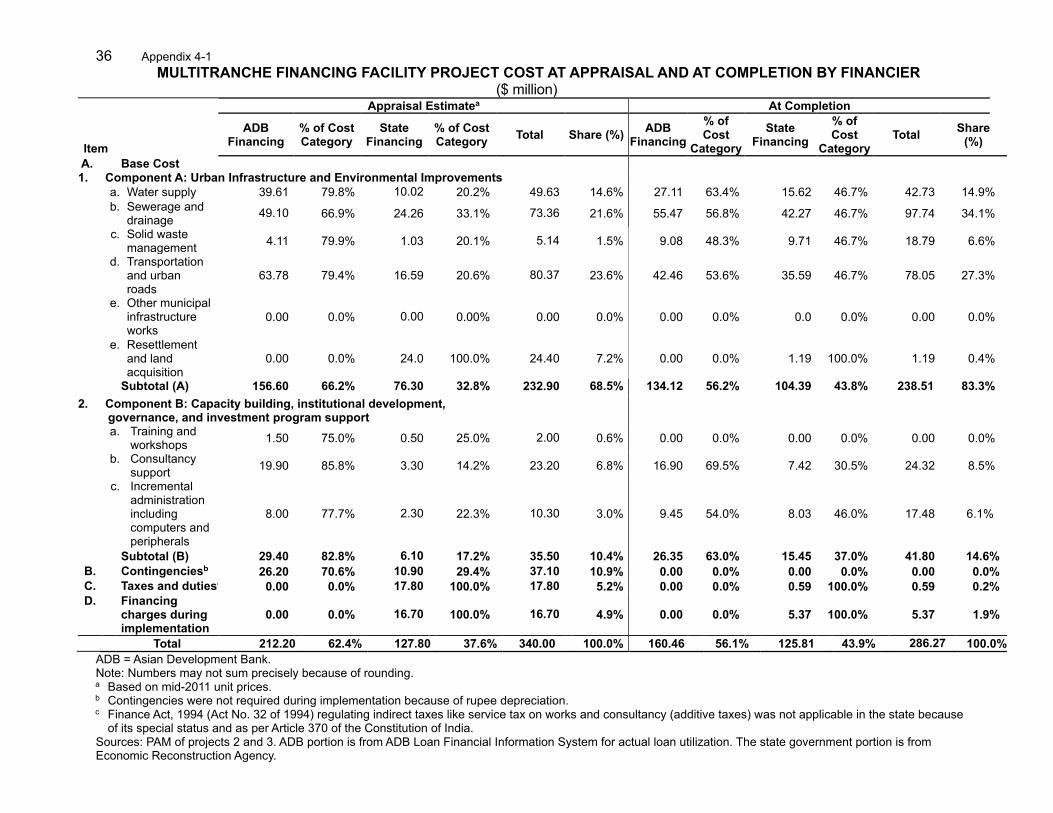
36 Appendix 4-1
MULTITRANCHE FINANCING FACILITY PROJECT COST AT APPRAISAL AND AT COMPLETION BY FINANCIER ($ million)
Item
Appraisal Estimatea At Completion
ADB Financing
% of Cost Category
State Financing
% of Cost Category
Total Share (%) ADB
Financing
% of Cost
Category
State Financing
% of Cost
Category Total
Share (%)
A.
Base Cost
1. Component A: Urban Infrastructure and Environmental Improvements
a. Water supply 39.61 79.8% 10.02 20.2% 49.63 14.6% 27.11 63.4% 15.62 46.7% 42.73 14.9% b. Sewerage and
drainage 49.10 66.9% 24.26 33.1% 73.36 21.6% 55.47 56.8% 42.27 46.7% 97.74 34.1%
c. Solid waste
management 4.11 79.9% 1.03 20.1% 5.14 1.5% 9.08 48.3% 9.71 46.7% 18.79 6.6%
d. Transportation
and urban roads
63.78 79.4% 16.59 20.6% 80.37 23.6% 42.46 53.6% 35.59 46.7% 78.05 27.3%
e. Other municipal infrastructure works
0.00 0.0% 0.00 0.00% 0.00 0.0% 0.00 0.0% 0.0 0.0% 0.00 0.0%
e. Resettlement
and land acquisition
0.00 0.0% 24.0 100.0% 24.40 7.2% 0.00 0.0% 1.19 100.0% 1.19 0.4%
Subtotal (A) 156.60 66.2% 76.30 32.8% 232.90 68.5% 134.12 56.2% 104.39 43.8% 238.51 83.3%
2. Component B: Capacity building, institutional development, governance, and investment program support
a. Training and
workshops 1.50 75.0% 0.50 25.0% 2.00 0.6% 0.00 0.0% 0.00 0.0% 0.00 0.0%
b. Consultancy support
19.90 85.8% 3.30 14.2% 23.20 6.8% 16.90 69.5% 7.42 30.5% 24.32 8.5%
c. Incremental administration including computers and peripherals
8.00 77.7% 2.30 22.3% 10.30 3.0% 9.45 54.0% 8.03 46.0% 17.48 6.1%
Subtotal (B) 29.40 82.8% 6.10 17.2% 35.50 10.4% 26.35 63.0% 15.45 37.0% 41.80 14.6%
B.
Contingenciesb 26.20 70.6% 10.90 29.4% 37.10 10.9% 0.00 0.0% 0.00 0.0% 0.00 0.0%
C.
Taxes and dutiesc 0.00 0.0% 17.80 100.0% 17.80 5.2% 0.00 0.0% 0.59 100.0% 0.59 0.2%
D. Financing charges during implementation
0.00 0.0% 16.70 100.0% 16.70 4.9% 0.00 0.0% 5.37 100.0% 5.37 1.9%
Total 212.20 62.4% 127.80 37.6% 340.00 100.0% 160.46 56.1% 125.81 43.9% 286.27 100.0%
ADB = Asian Development Bank. Note: Numbers may not sum precisely because of rounding. a Based on mid-2011 unit prices. b Contingencies were not required during implementation because of rupee depreciation. c Finance Act, 1994 (Act No. 32 of 1994) regulating indirect taxes like service tax on works and consultancy (additive taxes) was not applicable in the state because
of its special status and as per Article 370 of the Constitution of India. Sources: PAM of projects 2 and 3. ADB portion is from ADB Loan Financial Information System for actual loan utilization. The state government portion is from Economic Reconstruction Agency.
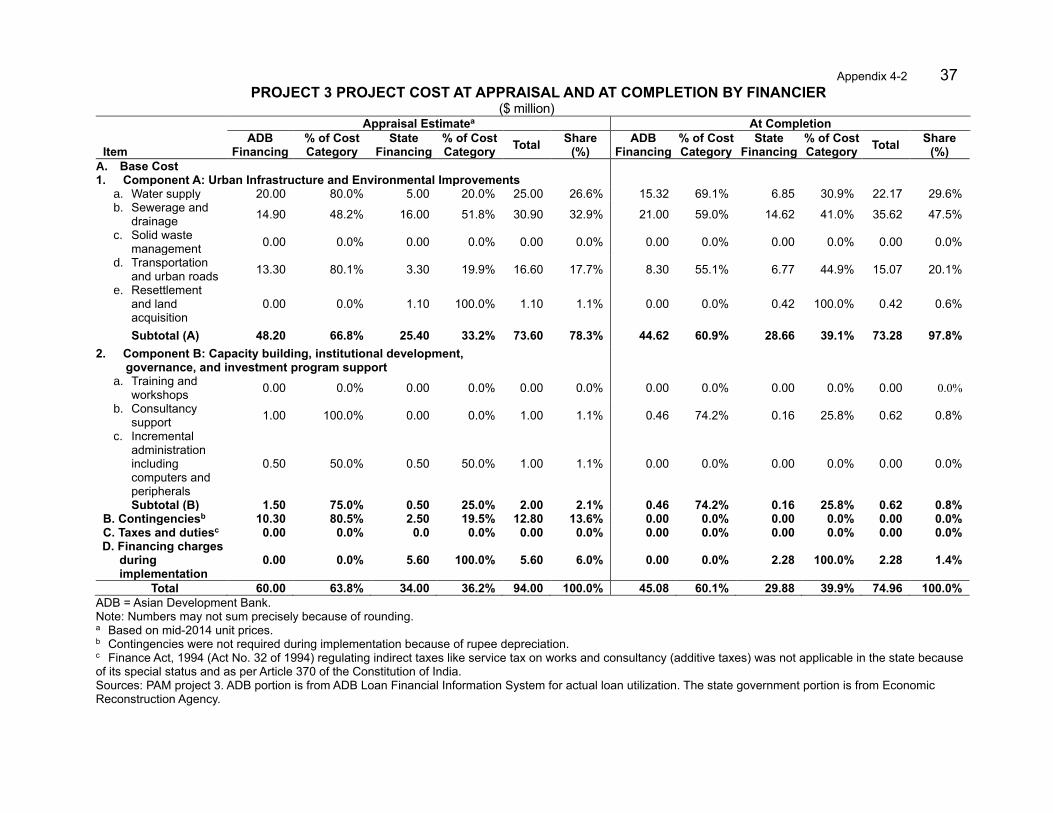
Appendix 4-2 37
PROJECT 3 PROJECT COST AT APPRAISAL AND AT COMPLETION BY FINANCIER ($ million)
Appraisal Estimatea At Completion
Item ADB
Financing
% of Cost Category
State Financing
% of Cost Category
Total Share
(%) ADB
Financing
% of Cost Category
State Financing
% of Cost Category
Total Share
(%)
A. Base Cost
1. Component A: Urban Infrastructure and Environmental Improvements
a. Water supply 20.00 80.0% 5.00 20.0% 25.00 26.6% 15.32 69.1% 6.85 30.9% 22.17 29.6%
b. Sewerage and drainage
14.90 48.2% 16.00 51.8% 30.90 32.9% 21.00 59.0% 14.62 41.0% 35.62 47.5%
c. Solid waste management
0.00 0.0% 0.00 0.0% 0.00 0.0% 0.00 0.0% 0.00 0.0% 0.00 0.0%
d. Transportation and urban roads
13.30 80.1% 3.30 19.9% 16.60 17.7% 8.30 55.1% 6.77 44.9% 15.07 20.1%
e. Resettlement and land acquisition
0.00 0.0% 1.10 100.0% 1.10 1.1% 0.00 0.0% 0.42 100.0% 0.42 0.6%
Subtotal (A) 48.20 66.8% 25.40 33.2% 73.60 78.3% 44.62 60.9% 28.66 39.1% 73.28 97.8%
2. Component B: Capacity building, institutional development, governance, and investment program support
a. Training and workshops
0.00 0.0% 0.00 0.0% 0.00 0.0% 0.00 0.0% 0.00 0.0% 0.00 0.0%
b. Consultancy support
1.00 100.0% 0.00 0.0% 1.00 1.1% 0.46 74.2% 0.16 25.8% 0.62 0.8%
c. Incremental administration including computers and peripherals
0.50 50.0% 0.50 50.0% 1.00 1.1% 0.00 0.0% 0.00 0.0% 0.00 0.0%
Subtotal (B) 1.50 75.0% 0.50 25.0% 2.00 2.1% 0.46 74.2% 0.16 25.8% 0.62 0.8%
B. Contingenciesb 10.30 80.5% 2.50 19.5% 12.80 13.6% 0.00 0.0% 0.00 0.0% 0.00 0.0%
C. Taxes and dutiesc 0.00 0.0% 0.0 0.0% 0.00 0.0% 0.00 0.0% 0.00 0.0% 0.00 0.0%
D. Financing charges during implementation
0.00 0.0% 5.60 100.0% 5.60 6.0% 0.00 0.0% 2.28 100.0% 2.28 1.4%
Total 60.00 63.8% 34.00 36.2% 94.00 100.0% 45.08 60.1% 29.88 39.9% 74.96 100.0%
ADB = Asian Development Bank. Note: Numbers may not sum precisely because of rounding.
a Based on mid-2014 unit prices. b Contingencies were not required during implementation because of rupee depreciation. c Finance Act, 1994 (Act No. 32 of 1994) regulating indirect taxes like service tax on works and consultancy (additive taxes) was not applicable in the state because of its special status and as per Article 370 of the Constitution of India. Sources: PAM project 3. ADB portion is from ADB Loan Financial Information System for actual loan utilization. The state government portion is from Economic Reconstruction Agency.
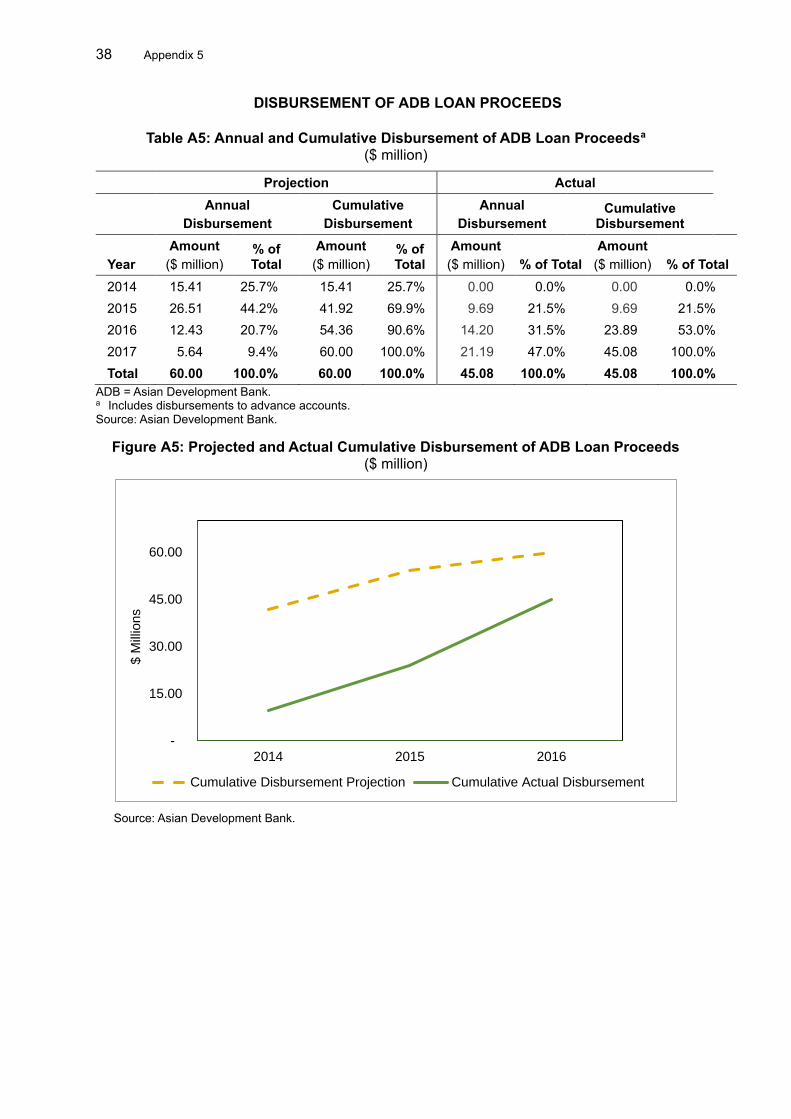
38 Appendix 5
DISBURSEMENT OF ADB LOAN PROCEEDS
Table A5: Annual and Cumulative Disbursement of ADB Loan Proceedsa
($ million)
Projection Actual
Annual
Disbursement
Cumulative
Disbursement
Annual
Disbursement Cumulative
Disbursement
Year
Amount
($ million) % of Total
Amount
($ million) % of Total
Amount
($ million) % of Total
Amount
($ million) % of Total
2014 15.41 25.7% 15.41 25.7% 0.00 0.0% 0.00 0.0%
2015 26.51 44.2% 41.92 69.9% 9.69 21.5% 9.69 21.5%
2016 12.43 20.7% 54.36 90.6% 14.20 31.5% 23.89 53.0%
2017 5.64 9.4% 60.00 100.0% 21.19 47.0% 45.08 100.0%
Total 60.00 100.0% 60.00 100.0% 45.08 100.0% 45.08 100.0%
ADB = Asian Development Bank. a Includes disbursements to advance accounts. Source: Asian Development Bank.
Figure A5: Projected and Actual Cumulative Disbursement of ADB Loan Proceeds ($ million)
Source: Asian Development Bank.
-
15.00
30.00
45.00
60.00
2014 2015 2016
$ M
illio
ns
Cumulative Disbursement Projection Cumulative Actual Disbursement
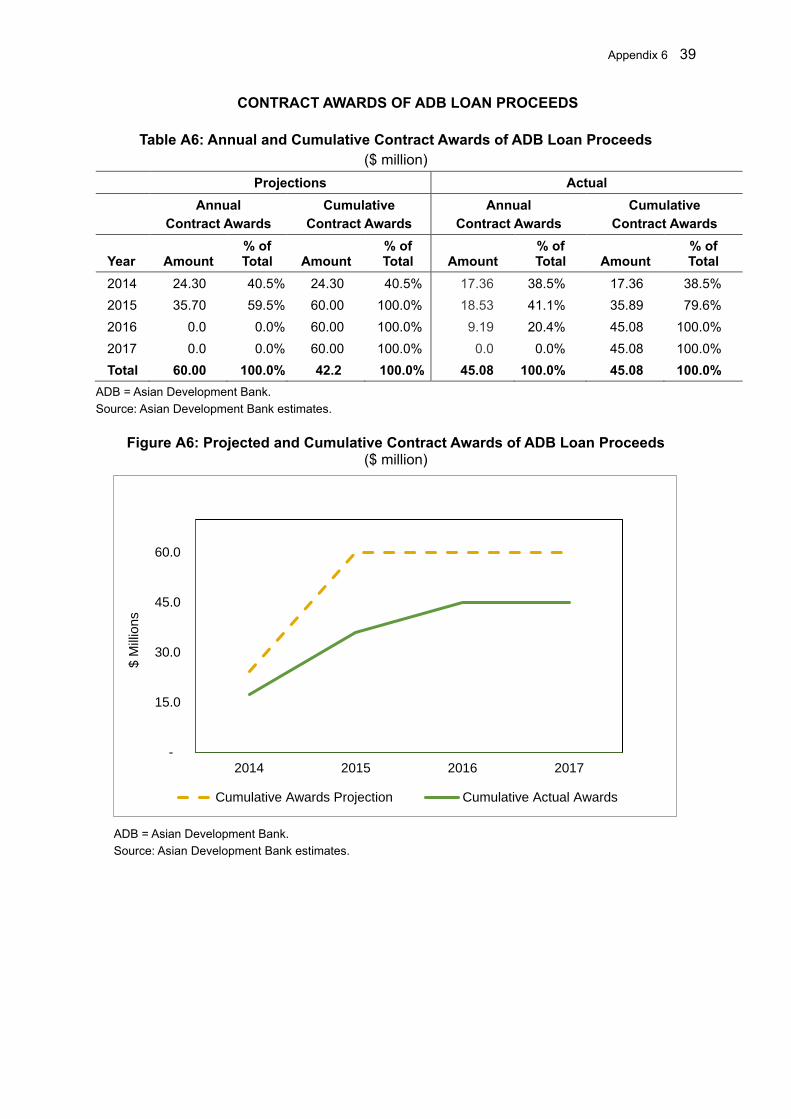
Appendix 6 39
CONTRACT AWARDS OF ADB LOAN PROCEEDS
Table A6: Annual and Cumulative Contract Awards of ADB Loan Proceeds
($ million)
Projections Actual
Annual
Contract Awards
Cumulative
Contract Awards
Annual
Contract Awards
Cumulative
Contract Awards
Year Amount % of Total Amount
% of Total Amount
% of Total Amount
% of Total
2014 24.30 40.5% 24.30 40.5% 17.36 38.5% 17.36 38.5%
2015 35.70 59.5% 60.00 100.0% 18.53 41.1% 35.89 79.6%
2016 0.0 0.0% 60.00 100.0% 9.19 20.4% 45.08 100.0%
2017 0.0 0.0% 60.00 100.0% 0.0 0.0% 45.08 100.0%
Total 60.00 100.0% 42.2 100.0% 45.08 100.0% 45.08 100.0%
ADB = Asian Development Bank.
Source: Asian Development Bank estimates.
Figure A6: Projected and Cumulative Contract Awards of ADB Loan Proceeds ($ million)
ADB = Asian Development Bank.
Source: Asian Development Bank estimates.
-
15.0
30.0
45.0
60.0
2014 2015 2016 2017
$ M
illio
ns
Cumulative Awards Projection Cumulative Actual Awards
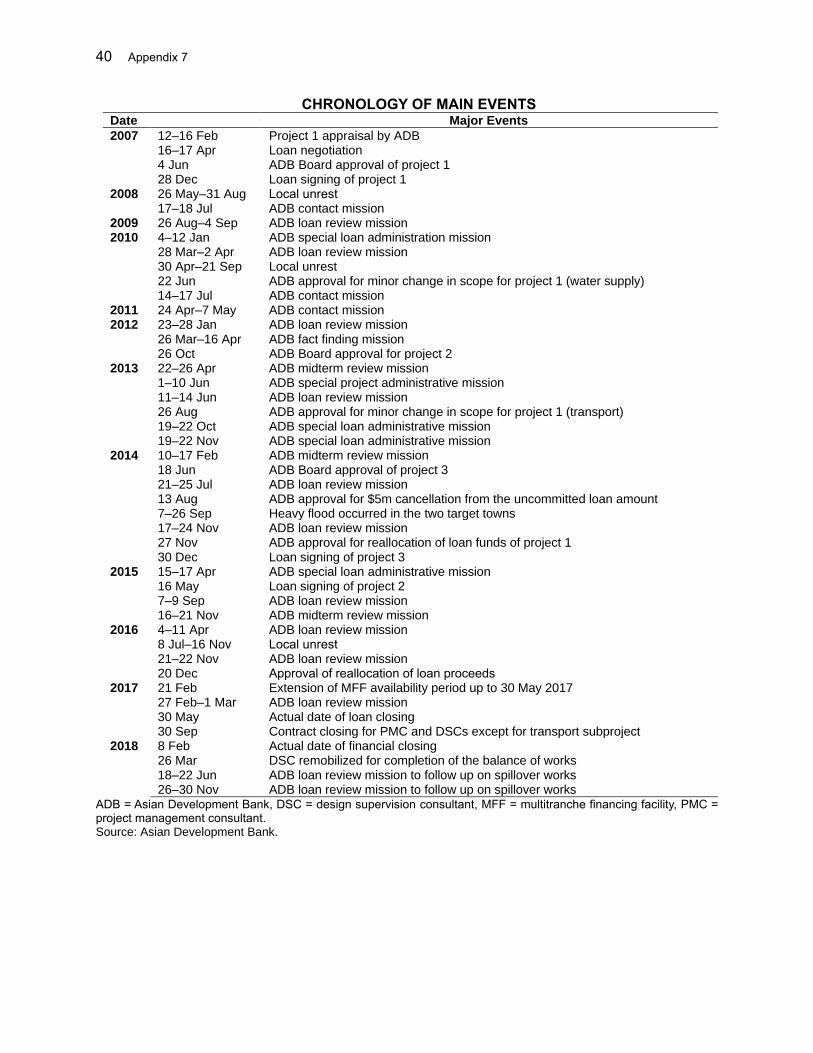
40 Appendix 7
CHRONOLOGY OF MAIN EVENTS Date Major Events
2007 12–16 Feb Project 1 appraisal by ADB
16–17 Apr Loan negotiation 4 Jun ADB Board approval of project 1 28 Dec Loan signing of project 1
2008 2009 2010
26 May–31 Aug Local unrest 17–18 Jul ADB contact mission 26 Aug–4 Sep ADB loan review mission 4–12 Jan 28 Mar–2 Apr
ADB special loan administration mission ADB loan review mission
30 Apr–21 Sep Local unrest 22 Jun 14–17 Jul
ADB approval for minor change in scope for project 1 (water supply) ADB contact mission
2011 2012 2013
24 Apr–7 May ADB contact mission
23–28 Jan 26 Mar–16 Apr
ADB loan review mission ADB fact finding mission
26 Oct ADB Board approval for project 2
22–26 Apr ADB midterm review mission
2014
1–10 Jun ADB special project administrative mission 11–14 Jun ADB loan review mission 26 Aug 19–22 Oct
ADB approval for minor change in scope for project 1 (transport) ADB special loan administrative mission
19–22 Nov ADB special loan administrative mission 10–17 Feb ADB midterm review mission
18 Jun 21–25 Jul
ADB Board approval of project 3 ADB loan review mission
13 Aug ADB approval for $5m cancellation from the uncommitted loan amount 2015
7–26 Sep Heavy flood occurred in the two target towns 17–24 Nov ADB loan review mission 27 Nov 30 Dec 15–17 Apr
ADB approval for reallocation of loan funds of project 1 Loan signing of project 3 ADB special loan administrative mission
2016
16 May 7–9 Sep
Loan signing of project 2 ADB loan review mission
16–21 Nov ADB midterm review mission 4–11 Apr ADB loan review mission 8 Jul–16 Nov Local unrest 21–22 Nov 20 Dec
ADB loan review mission Approval of reallocation of loan proceeds
2017 2018
21 Feb 27 Feb–1 Mar
Extension of MFF availability period up to 30 May 2017 ADB loan review mission
30 May Actual date of loan closing 30 Sep Contract closing for PMC and DSCs except for transport subproject 8 Feb 26 Mar 18–22 Jun 26–30 Nov
Actual date of financial closing DSC remobilized for completion of the balance of works ADB loan review mission to follow up on spillover works ADB loan review mission to follow up on spillover works
ADB = Asian Development Bank, DSC = design supervision consultant, MFF = multitranche financing facility, PMC = project management consultant. Source: Asian Development Bank.
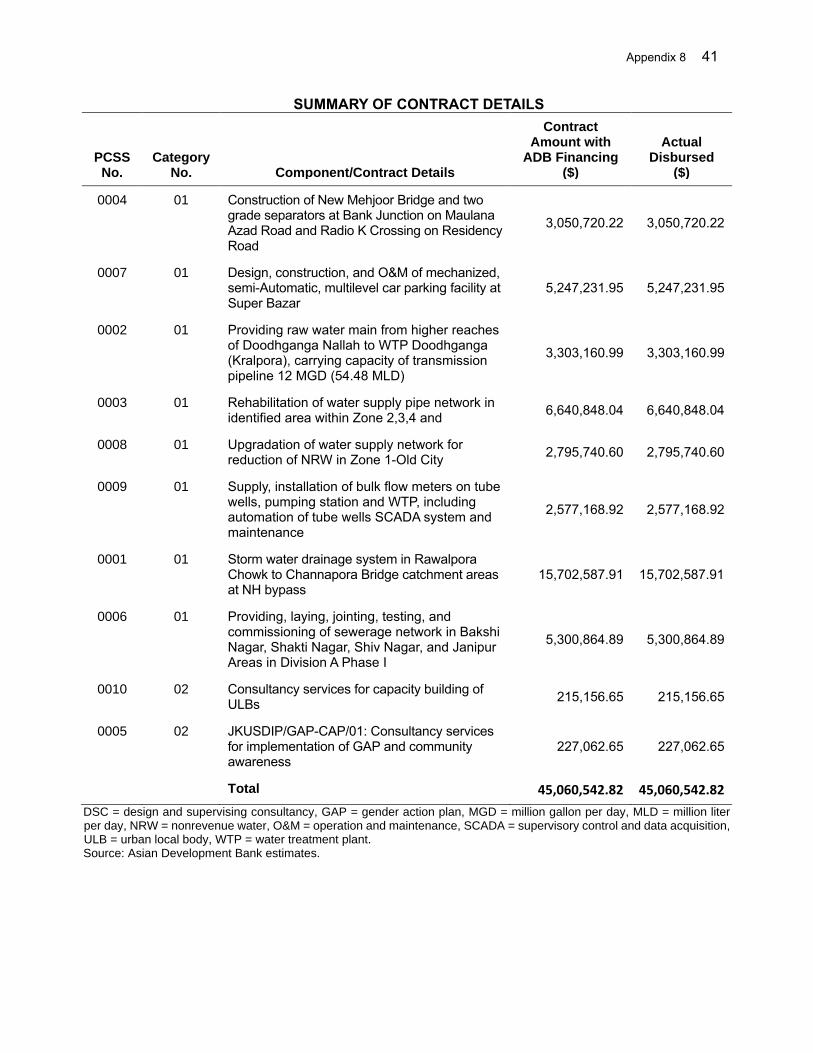
Appendix 8 41
SUMMARY OF CONTRACT DETAILS
PCSS No.
Category No. Component/Contract Details
Contract Amount with
ADB Financing ($)
Actual Disbursed
($)
0004 01 Construction of New Mehjoor Bridge and two grade separators at Bank Junction on Maulana Azad Road and Radio K Crossing on Residency Road
3,050,720.22 3,050,720.22
0007 01 Design, construction, and O&M of mechanized, semi-Automatic, multilevel car parking facility at Super Bazar
5,247,231.95 5,247,231.95
0002 01 Providing raw water main from higher reaches of Doodhganga Nallah to WTP Doodhganga (Kralpora), carrying capacity of transmission pipeline 12 MGD (54.48 MLD)
3,303,160.99 3,303,160.99
0003 01 Rehabilitation of water supply pipe network in identified area within Zone 2,3,4 and
6,640,848.04 6,640,848.04
0008 01 Upgradation of water supply network for reduction of NRW in Zone 1-Old City
2,795,740.60 2,795,740.60
0009 01 Supply, installation of bulk flow meters on tube wells, pumping station and WTP, including automation of tube wells SCADA system and maintenance
2,577,168.92 2,577,168.92
0001 01 Storm water drainage system in Rawalpora Chowk to Channapora Bridge catchment areas at NH bypass
15,702,587.91 15,702,587.91
0006 01 Providing, laying, jointing, testing, and commissioning of sewerage network in Bakshi Nagar, Shakti Nagar, Shiv Nagar, and Janipur Areas in Division A Phase I
5,300,864.89 5,300,864.89
0010 02 Consultancy services for capacity building of ULBs
215,156.65 215,156.65
0005 02 JKUSDIP/GAP-CAP/01: Consultancy services for implementation of GAP and community awareness
227,062.65 227,062.65
Total 45,060,542.82 45,060,542.82
DSC = design and supervising consultancy, GAP = gender action plan, MGD = million gallon per day, MLD = million liter per day, NRW = nonrevenue water, O&M = operation and maintenance, SCADA = supervisory control and data acquisition, ULB = urban local body, WTP = water treatment plant. Source: Asian Development Bank estimates.
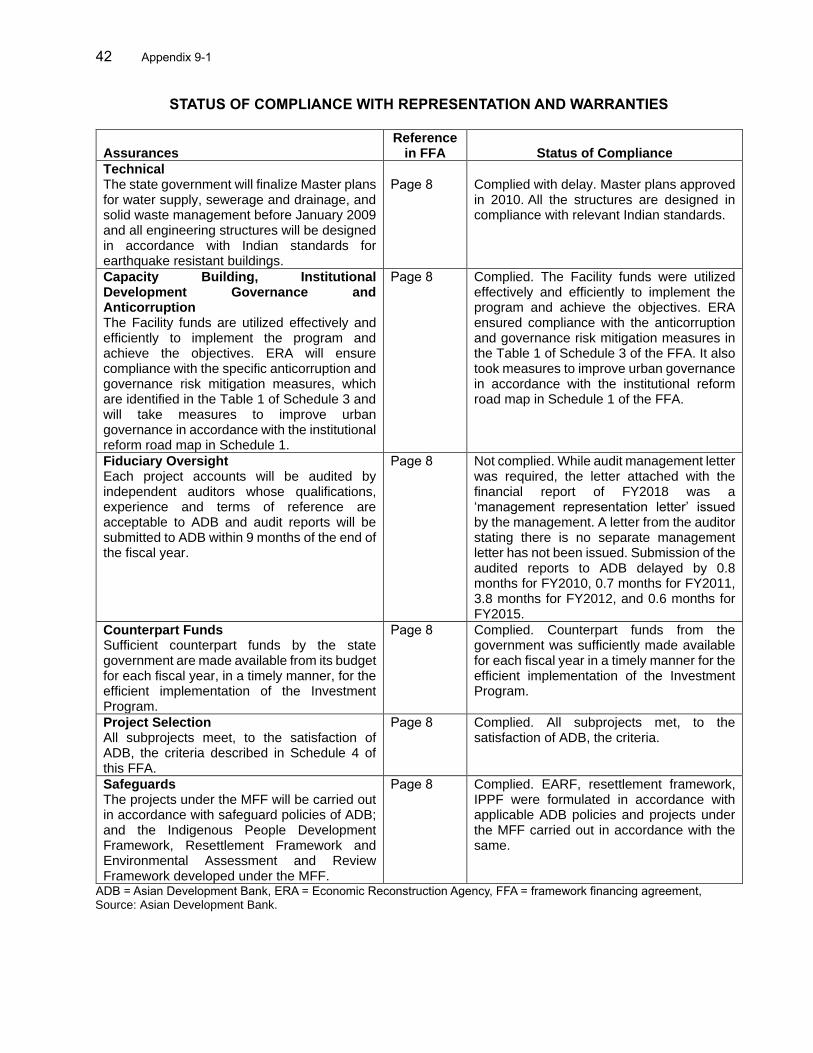
42 Appendix 9-1
STATUS OF COMPLIANCE WITH REPRESENTATION AND WARRANTIES
Assurances Reference
in FFA Status of Compliance
Technical The state government will finalize Master plans for water supply, sewerage and drainage, and solid waste management before January 2009 and all engineering structures will be designed in accordance with Indian standards for earthquake resistant buildings.
Page 8
Complied with delay. Master plans approved in 2010. All the structures are designed in compliance with relevant Indian standards.
Capacity Building, Institutional Development Governance and Anticorruption The Facility funds are utilized effectively and efficiently to implement the program and achieve the objectives. ERA will ensure compliance with the specific anticorruption and governance risk mitigation measures, which are identified in the Table 1 of Schedule 3 and will take measures to improve urban governance in accordance with the institutional reform road map in Schedule 1.
Page 8 Complied. The Facility funds were utilized effectively and efficiently to implement the program and achieve the objectives. ERA ensured compliance with the anticorruption and governance risk mitigation measures in the Table 1 of Schedule 3 of the FFA. It also took measures to improve urban governance in accordance with the institutional reform road map in Schedule 1 of the FFA.
Fiduciary Oversight Each project accounts will be audited by independent auditors whose qualifications, experience and terms of reference are acceptable to ADB and audit reports will be submitted to ADB within 9 months of the end of the fiscal year.
Page 8 Not complied. While audit management letter was required, the letter attached with the financial report of FY2018 was a ‘management representation letter’ issued by the management. A letter from the auditor stating there is no separate management letter has not been issued. Submission of the audited reports to ADB delayed by 0.8 months for FY2010, 0.7 months for FY2011, 3.8 months for FY2012, and 0.6 months for FY2015.
Counterpart Funds Sufficient counterpart funds by the state government are made available from its budget for each fiscal year, in a timely manner, for the efficient implementation of the Investment Program.
Page 8 Complied. Counterpart funds from the government was sufficiently made available for each fiscal year in a timely manner for the efficient implementation of the Investment Program.
Project Selection All subprojects meet, to the satisfaction of ADB, the criteria described in Schedule 4 of this FFA.
Page 8 Complied. All subprojects met, to the satisfaction of ADB, the criteria.
Safeguards The projects under the MFF will be carried out in accordance with safeguard policies of ADB; and the Indigenous People Development Framework, Resettlement Framework and Environmental Assessment and Review Framework developed under the MFF.
Page 8 Complied. EARF, resettlement framework, IPPF were formulated in accordance with applicable ADB policies and projects under the MFF carried out in accordance with the same.
ADB = Asian Development Bank, ERA = Economic Reconstruction Agency, FFA = framework financing agreement, Source: Asian Development Bank.
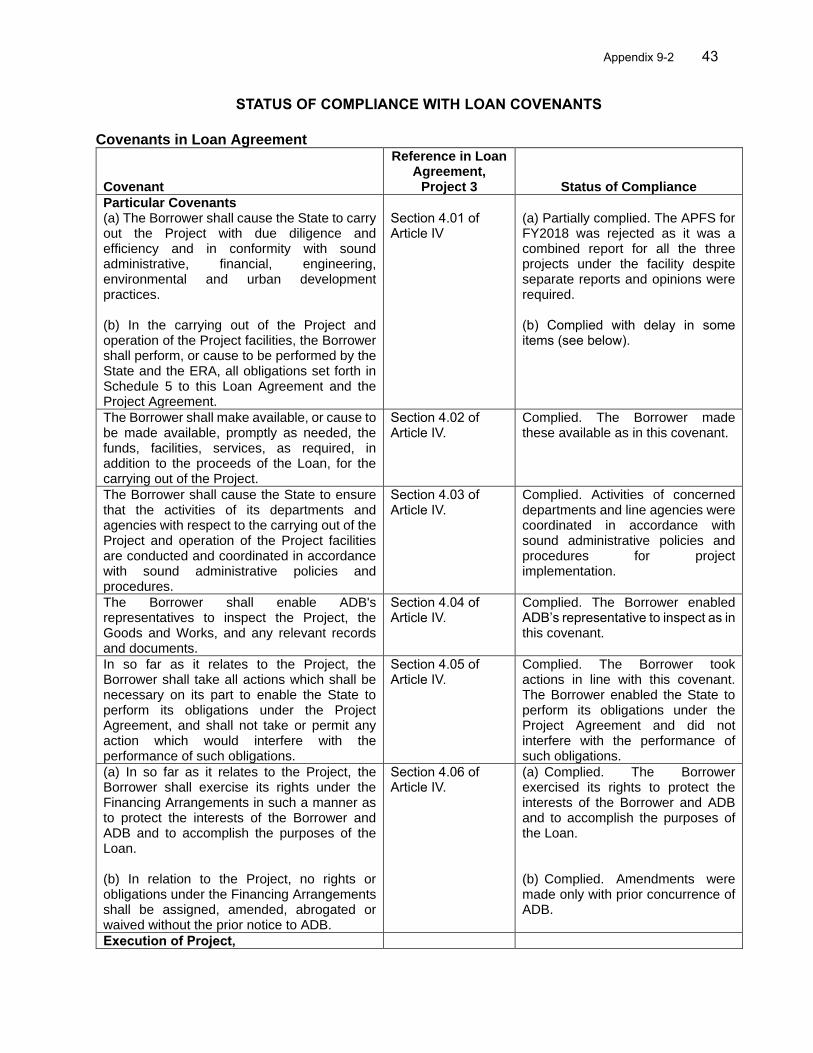
Appendix 9-2 43
STATUS OF COMPLIANCE WITH LOAN COVENANTS
Covenants in Loan Agreement
Covenant
Reference in Loan Agreement,
Project 3 Status of Compliance
Particular Covenants (a) The Borrower shall cause the State to carry out the Project with due diligence and efficiency and in conformity with sound administrative, financial, engineering, environmental and urban development practices. (b) In the carrying out of the Project and operation of the Project facilities, the Borrower shall perform, or cause to be performed by the State and the ERA, all obligations set forth in Schedule 5 to this Loan Agreement and the Project Agreement.
Section 4.01 of Article IV
(a) Partially complied. The APFS for FY2018 was rejected as it was a combined report for all the three projects under the facility despite separate reports and opinions were required. (b) Complied with delay in some items (see below).
The Borrower shall make available, or cause to be made available, promptly as needed, the funds, facilities, services, as required, in addition to the proceeds of the Loan, for the carrying out of the Project.
Section 4.02 of Article IV.
Complied. The Borrower made these available as in this covenant.
The Borrower shall cause the State to ensure that the activities of its departments and agencies with respect to the carrying out of the Project and operation of the Project facilities are conducted and coordinated in accordance with sound administrative policies and procedures.
Section 4.03 of Article IV.
Complied. Activities of concerned departments and line agencies were coordinated in accordance with sound administrative policies and procedures for project implementation.
The Borrower shall enable ADB's representatives to inspect the Project, the Goods and Works, and any relevant records and documents.
Section 4.04 of Article IV.
Complied. The Borrower enabled ADB’s representative to inspect as in this covenant.
In so far as it relates to the Project, the Borrower shall take all actions which shall be necessary on its part to enable the State to perform its obligations under the Project Agreement, and shall not take or permit any action which would interfere with the performance of such obligations.
Section 4.05 of Article IV.
Complied. The Borrower took actions in line with this covenant. The Borrower enabled the State to perform its obligations under the Project Agreement and did not interfere with the performance of such obligations.
(a) In so far as it relates to the Project, the Borrower shall exercise its rights under the Financing Arrangements in such a manner as to protect the interests of the Borrower and ADB and to accomplish the purposes of the Loan. (b) In relation to the Project, no rights or obligations under the Financing Arrangements shall be assigned, amended, abrogated or waived without the prior notice to ADB.
Section 4.06 of Article IV.
(a) Complied. The Borrower exercised its rights to protect the interests of the Borrower and ADB and to accomplish the purposes of the Loan. (b) Complied. Amendments were made only with prior concurrence of ADB.
Execution of Project,
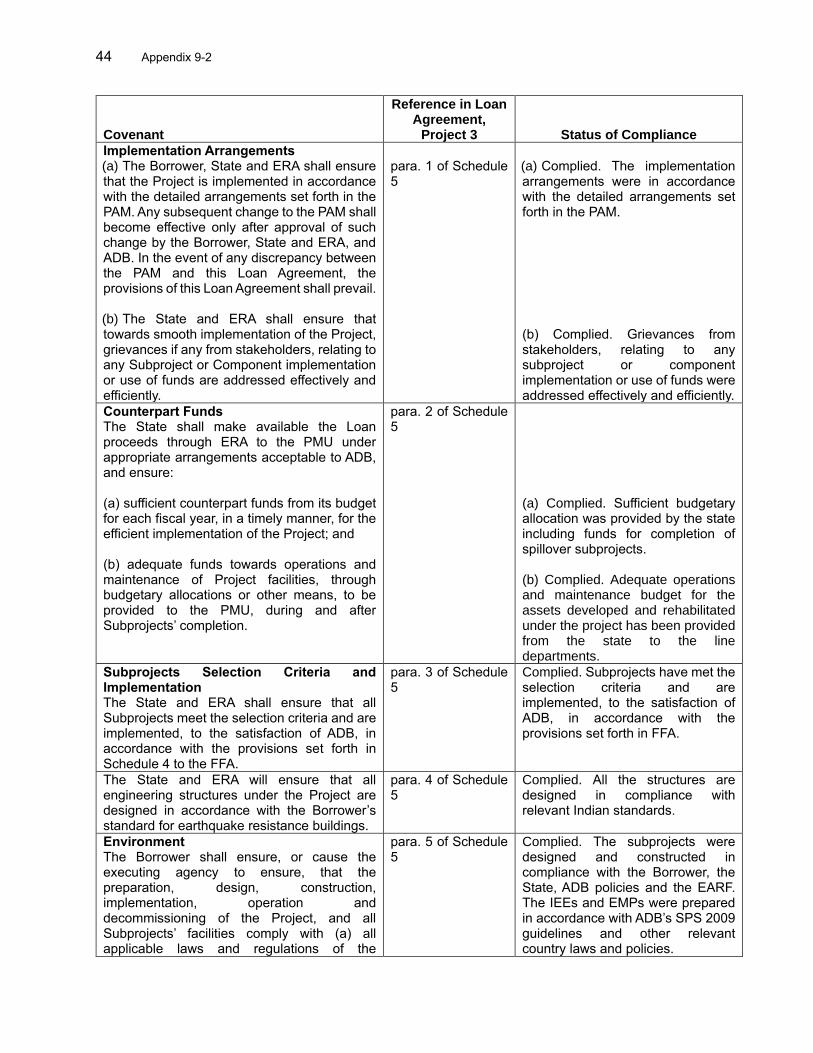
44 Appendix 9-2
Covenant
Reference in Loan Agreement,
Project 3 Status of Compliance
Implementation Arrangements (a) The Borrower, State and ERA shall ensure that the Project is implemented in accordance with the detailed arrangements set forth in the PAM. Any subsequent change to the PAM shall become effective only after approval of such change by the Borrower, State and ERA, and ADB. In the event of any discrepancy between the PAM and this Loan Agreement, the provisions of this Loan Agreement shall prevail. (b) The State and ERA shall ensure that towards smooth implementation of the Project, grievances if any from stakeholders, relating to any Subproject or Component implementation or use of funds are addressed effectively and efficiently.
para. 1 of Schedule 5
(a) Complied. The implementation arrangements were in accordance with the detailed arrangements set forth in the PAM. (b) Complied. Grievances from stakeholders, relating to any subproject or component implementation or use of funds were addressed effectively and efficiently.
Counterpart Funds The State shall make available the Loan proceeds through ERA to the PMU under appropriate arrangements acceptable to ADB, and ensure: (a) sufficient counterpart funds from its budget for each fiscal year, in a timely manner, for the efficient implementation of the Project; and (b) adequate funds towards operations and maintenance of Project facilities, through budgetary allocations or other means, to be provided to the PMU, during and after Subprojects’ completion.
para. 2 of Schedule 5
(a) Complied. Sufficient budgetary allocation was provided by the state including funds for completion of spillover subprojects. (b) Complied. Adequate operations and maintenance budget for the assets developed and rehabilitated under the project has been provided from the state to the line departments.
Subprojects Selection Criteria and Implementation The State and ERA shall ensure that all Subprojects meet the selection criteria and are implemented, to the satisfaction of ADB, in accordance with the provisions set forth in Schedule 4 to the FFA.
para. 3 of Schedule 5
Complied. Subprojects have met the selection criteria and are implemented, to the satisfaction of ADB, in accordance with the provisions set forth in FFA.
The State and ERA will ensure that all engineering structures under the Project are designed in accordance with the Borrower’s standard for earthquake resistance buildings.
para. 4 of Schedule 5
Complied. All the structures are designed in compliance with relevant Indian standards.
Environment The Borrower shall ensure, or cause the executing agency to ensure, that the preparation, design, construction, implementation, operation and decommissioning of the Project, and all Subprojects’ facilities comply with (a) all applicable laws and regulations of the
para. 5 of Schedule 5
Complied. The subprojects were designed and constructed in compliance with the Borrower, the State, ADB policies and the EARF. The IEEs and EMPs were prepared in accordance with ADB’s SPS 2009 guidelines and other relevant country laws and policies.
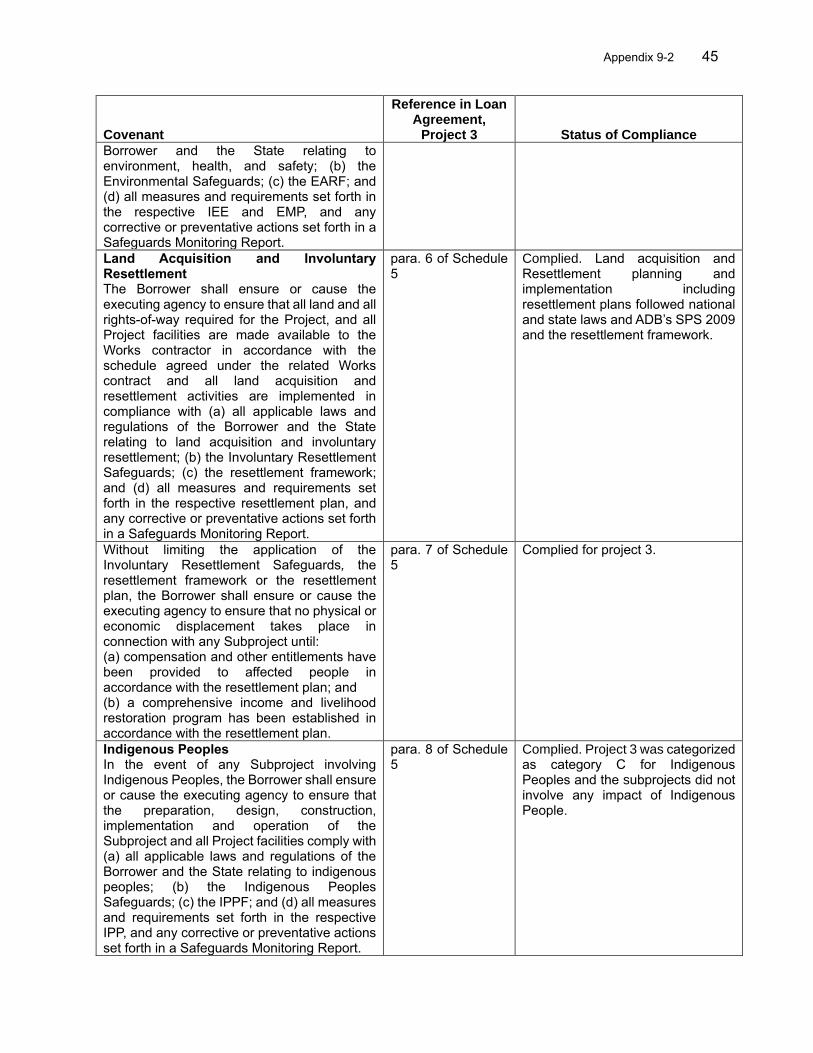
Appendix 9-2 45
Covenant
Reference in Loan Agreement,
Project 3 Status of Compliance
Borrower and the State relating to environment, health, and safety; (b) the Environmental Safeguards; (c) the EARF; and (d) all measures and requirements set forth in the respective IEE and EMP, and any corrective or preventative actions set forth in a Safeguards Monitoring Report.
Land Acquisition and Involuntary Resettlement The Borrower shall ensure or cause the executing agency to ensure that all land and all rights-of-way required for the Project, and all Project facilities are made available to the Works contractor in accordance with the schedule agreed under the related Works contract and all land acquisition and resettlement activities are implemented in compliance with (a) all applicable laws and regulations of the Borrower and the State relating to land acquisition and involuntary resettlement; (b) the Involuntary Resettlement Safeguards; (c) the resettlement framework; and (d) all measures and requirements set forth in the respective resettlement plan, and any corrective or preventative actions set forth in a Safeguards Monitoring Report.
para. 6 of Schedule 5
Complied. Land acquisition and Resettlement planning and implementation including resettlement plans followed national and state laws and ADB’s SPS 2009 and the resettlement framework.
Without limiting the application of the Involuntary Resettlement Safeguards, the resettlement framework or the resettlement plan, the Borrower shall ensure or cause the executing agency to ensure that no physical or economic displacement takes place in connection with any Subproject until: (a) compensation and other entitlements have been provided to affected people in accordance with the resettlement plan; and (b) a comprehensive income and livelihood restoration program has been established in accordance with the resettlement plan.
para. 7 of Schedule 5
Complied for project 3.
Indigenous Peoples In the event of any Subproject involving Indigenous Peoples, the Borrower shall ensure or cause the executing agency to ensure that the preparation, design, construction, implementation and operation of the Subproject and all Project facilities comply with (a) all applicable laws and regulations of the Borrower and the State relating to indigenous peoples; (b) the Indigenous Peoples Safeguards; (c) the IPPF; and (d) all measures and requirements set forth in the respective IPP, and any corrective or preventative actions set forth in a Safeguards Monitoring Report.
para. 8 of Schedule 5
Complied. Project 3 was categorized as category C for Indigenous Peoples and the subprojects did not involve any impact of Indigenous People.
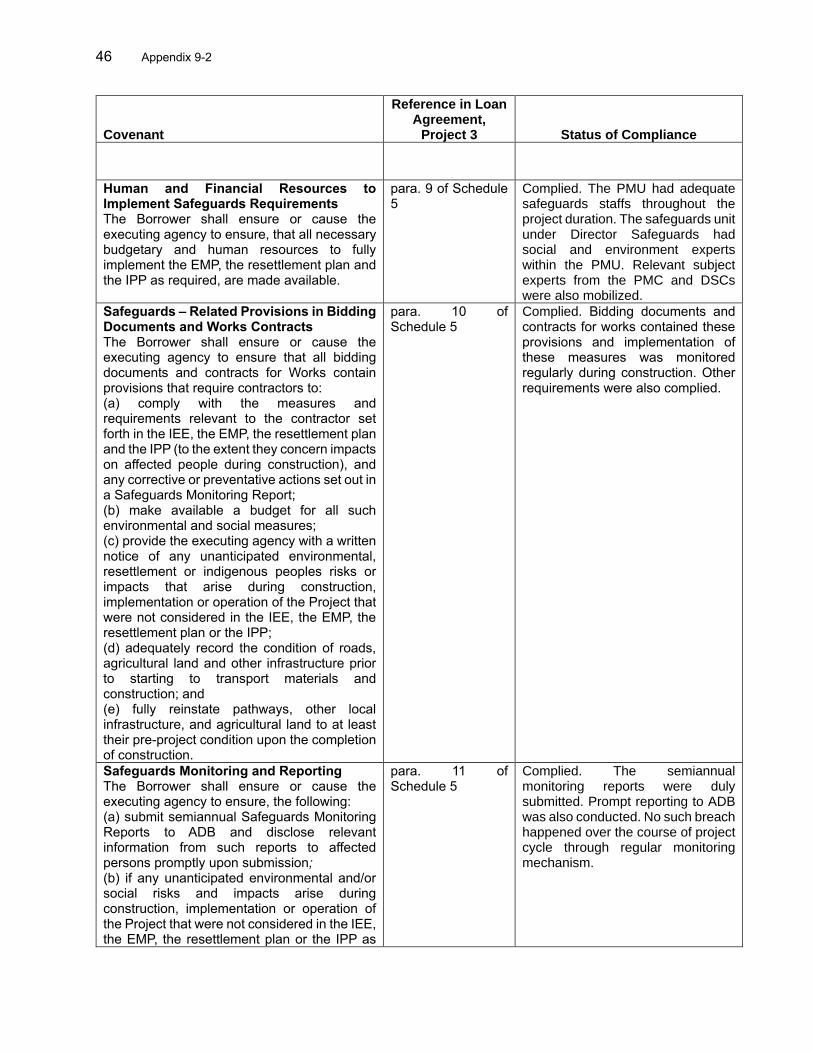
46 Appendix 9-2
Covenant
Reference in Loan Agreement,
Project 3 Status of Compliance
Human and Financial Resources to Implement Safeguards Requirements The Borrower shall ensure or cause the executing agency to ensure, that all necessary budgetary and human resources to fully implement the EMP, the resettlement plan and the IPP as required, are made available.
para. 9 of Schedule 5
Complied. The PMU had adequate safeguards staffs throughout the project duration. The safeguards unit under Director Safeguards had social and environment experts within the PMU. Relevant subject experts from the PMC and DSCs were also mobilized.
Safeguards – Related Provisions in Bidding Documents and Works Contracts The Borrower shall ensure or cause the executing agency to ensure that all bidding documents and contracts for Works contain provisions that require contractors to: (a) comply with the measures and requirements relevant to the contractor set forth in the IEE, the EMP, the resettlement plan and the IPP (to the extent they concern impacts on affected people during construction), and any corrective or preventative actions set out in a Safeguards Monitoring Report; (b) make available a budget for all such environmental and social measures; (c) provide the executing agency with a written notice of any unanticipated environmental, resettlement or indigenous peoples risks or impacts that arise during construction, implementation or operation of the Project that were not considered in the IEE, the EMP, the resettlement plan or the IPP; (d) adequately record the condition of roads, agricultural land and other infrastructure prior to starting to transport materials and construction; and (e) fully reinstate pathways, other local infrastructure, and agricultural land to at least their pre-project condition upon the completion of construction.
para. 10 of Schedule 5
Complied. Bidding documents and contracts for works contained these provisions and implementation of these measures was monitored regularly during construction. Other requirements were also complied.
Safeguards Monitoring and Reporting The Borrower shall ensure or cause the executing agency to ensure, the following: (a) submit semiannual Safeguards Monitoring Reports to ADB and disclose relevant information from such reports to affected persons promptly upon submission; (b) if any unanticipated environmental and/or social risks and impacts arise during construction, implementation or operation of the Project that were not considered in the IEE, the EMP, the resettlement plan or the IPP as
para. 11 of Schedule 5
Complied. The semiannual monitoring reports were duly submitted. Prompt reporting to ADB was also conducted. No such breach happened over the course of project cycle through regular monitoring mechanism.
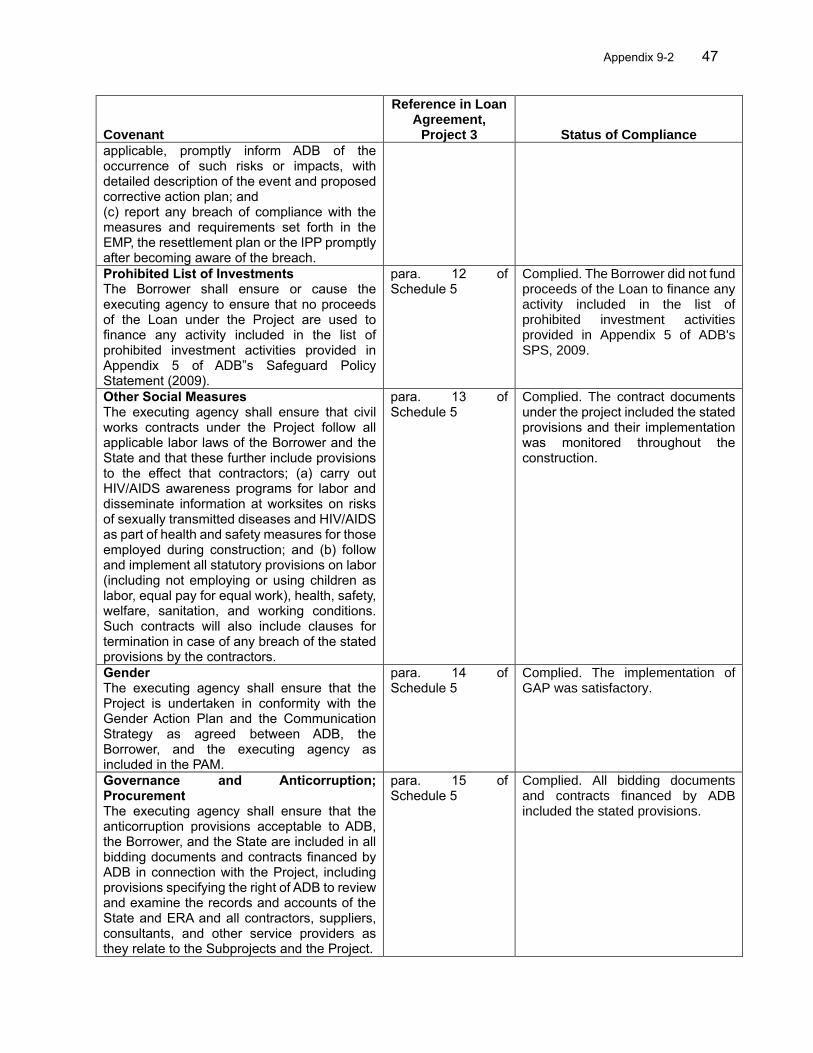
Appendix 9-2 47
Covenant
Reference in Loan Agreement,
Project 3 Status of Compliance
applicable, promptly inform ADB of the occurrence of such risks or impacts, with detailed description of the event and proposed corrective action plan; and (c) report any breach of compliance with the measures and requirements set forth in the EMP, the resettlement plan or the IPP promptly after becoming aware of the breach.
Prohibited List of Investments The Borrower shall ensure or cause the executing agency to ensure that no proceeds of the Loan under the Project are used to finance any activity included in the list of prohibited investment activities provided in Appendix 5 of ADB‟s Safeguard Policy Statement (2009).
para. 12 of Schedule 5
Complied. The Borrower did not fund proceeds of the Loan to finance any activity included in the list of prohibited investment activities provided in Appendix 5 of ADB's SPS, 2009.
Other Social Measures The executing agency shall ensure that civil works contracts under the Project follow all applicable labor laws of the Borrower and the State and that these further include provisions to the effect that contractors; (a) carry out HIV/AIDS awareness programs for labor and disseminate information at worksites on risks of sexually transmitted diseases and HIV/AIDS as part of health and safety measures for those employed during construction; and (b) follow and implement all statutory provisions on labor (including not employing or using children as labor, equal pay for equal work), health, safety, welfare, sanitation, and working conditions. Such contracts will also include clauses for termination in case of any breach of the stated provisions by the contractors.
para. 13 of Schedule 5
Complied. The contract documents under the project included the stated provisions and their implementation was monitored throughout the construction.
Gender The executing agency shall ensure that the Project is undertaken in conformity with the Gender Action Plan and the Communication Strategy as agreed between ADB, the Borrower, and the executing agency as included in the PAM.
para. 14 of Schedule 5
Complied. The implementation of GAP was satisfactory.
Governance and Anticorruption; Procurement The executing agency shall ensure that the anticorruption provisions acceptable to ADB, the Borrower, and the State are included in all bidding documents and contracts financed by ADB in connection with the Project, including provisions specifying the right of ADB to review and examine the records and accounts of the State and ERA and all contractors, suppliers, consultants, and other service providers as they relate to the Subprojects and the Project.
para. 15 of Schedule 5
Complied. All bidding documents and contracts financed by ADB included the stated provisions.
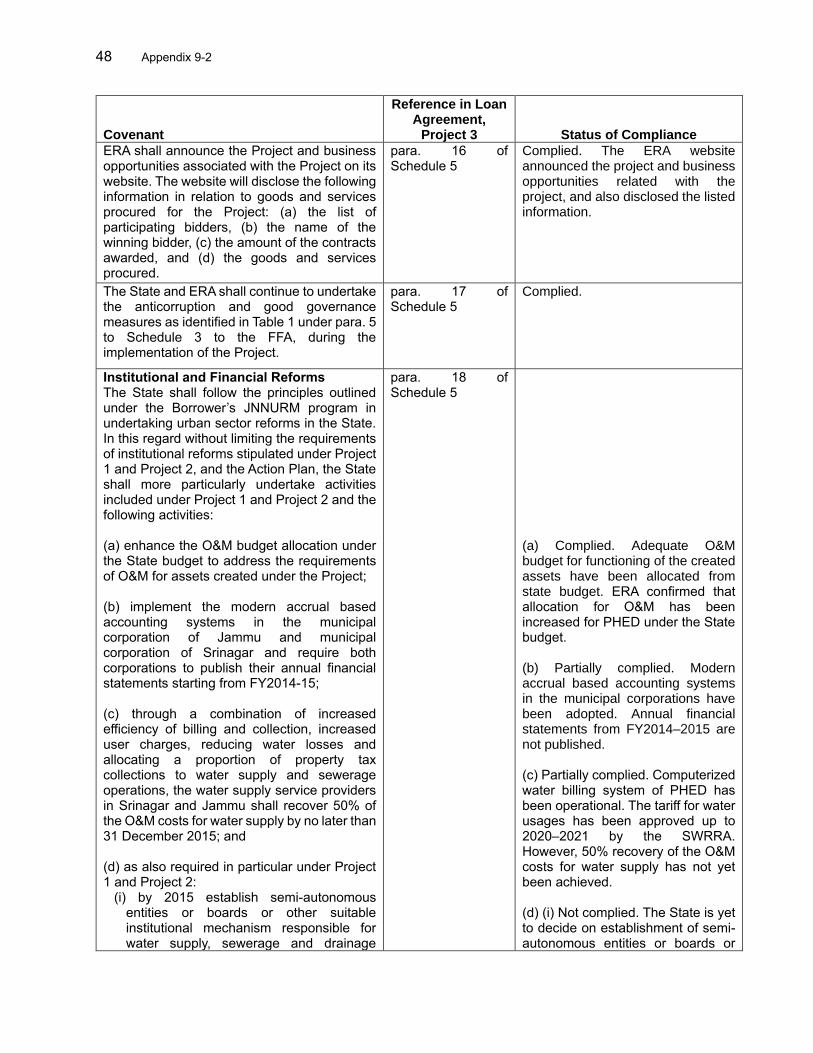
48 Appendix 9-2
Covenant
Reference in Loan Agreement,
Project 3 Status of Compliance
ERA shall announce the Project and business opportunities associated with the Project on its website. The website will disclose the following information in relation to goods and services procured for the Project: (a) the list of participating bidders, (b) the name of the winning bidder, (c) the amount of the contracts awarded, and (d) the goods and services procured.
para. 16 of Schedule 5
Complied. The ERA website announced the project and business opportunities related with the project, and also disclosed the listed information.
The State and ERA shall continue to undertake the anticorruption and good governance measures as identified in Table 1 under para. 5 to Schedule 3 to the FFA, during the implementation of the Project.
para. 17 of Schedule 5
Complied.
Institutional and Financial Reforms The State shall follow the principles outlined under the Borrower’s JNNURM program in undertaking urban sector reforms in the State. In this regard without limiting the requirements of institutional reforms stipulated under Project 1 and Project 2, and the Action Plan, the State shall more particularly undertake activities included under Project 1 and Project 2 and the following activities: (a) enhance the O&M budget allocation under the State budget to address the requirements of O&M for assets created under the Project; (b) implement the modern accrual based accounting systems in the municipal corporation of Jammu and municipal corporation of Srinagar and require both corporations to publish their annual financial statements starting from FY2014-15; (c) through a combination of increased efficiency of billing and collection, increased user charges, reducing water losses and allocating a proportion of property tax collections to water supply and sewerage operations, the water supply service providers in Srinagar and Jammu shall recover 50% of the O&M costs for water supply by no later than 31 December 2015; and (d) as also required in particular under Project 1 and Project 2:
(i) by 2015 establish semi-autonomous entities or boards or other suitable institutional mechanism responsible for water supply, sewerage and drainage
para. 18 of Schedule 5
(a) Complied. Adequate O&M budget for functioning of the created assets have been allocated from state budget. ERA confirmed that allocation for O&M has been increased for PHED under the State budget. (b) Partially complied. Modern accrual based accounting systems in the municipal corporations have been adopted. Annual financial statements from FY2014–2015 are not published. (c) Partially complied. Computerized water billing system of PHED has been operational. The tariff for water usages has been approved up to 2020–2021 by the SWRRA. However, 50% recovery of the O&M costs for water supply has not yet been achieved. (d) (i) Not complied. The State is yet to decide on establishment of semi-autonomous entities or boards or
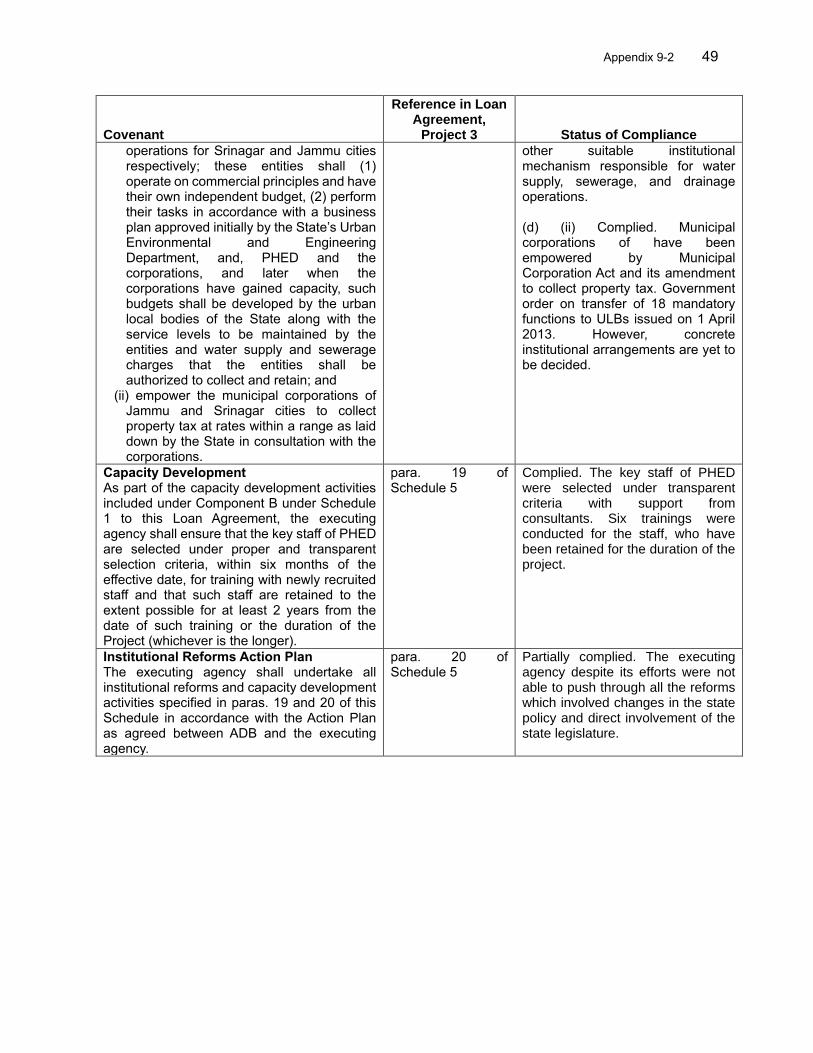
Appendix 9-2 49
Covenant
Reference in Loan Agreement,
Project 3 Status of Compliance
operations for Srinagar and Jammu cities respectively; these entities shall (1) operate on commercial principles and have their own independent budget, (2) perform their tasks in accordance with a business plan approved initially by the State’s Urban Environmental and Engineering Department, and, PHED and the corporations, and later when the corporations have gained capacity, such budgets shall be developed by the urban local bodies of the State along with the service levels to be maintained by the entities and water supply and sewerage charges that the entities shall be authorized to collect and retain; and
(ii) empower the municipal corporations of Jammu and Srinagar cities to collect property tax at rates within a range as laid down by the State in consultation with the corporations.
other suitable institutional mechanism responsible for water supply, sewerage, and drainage operations. (d) (ii) Complied. Municipal corporations of have been empowered by Municipal Corporation Act and its amendment to collect property tax. Government order on transfer of 18 mandatory functions to ULBs issued on 1 April 2013. However, concrete institutional arrangements are yet to be decided.
Capacity Development As part of the capacity development activities included under Component B under Schedule 1 to this Loan Agreement, the executing agency shall ensure that the key staff of PHED are selected under proper and transparent selection criteria, within six months of the effective date, for training with newly recruited staff and that such staff are retained to the extent possible for at least 2 years from the date of such training or the duration of the Project (whichever is the longer).
para. 19 of Schedule 5
Complied. The key staff of PHED were selected under transparent criteria with support from consultants. Six trainings were conducted for the staff, who have been retained for the duration of the project.
Institutional Reforms Action Plan The executing agency shall undertake all institutional reforms and capacity development activities specified in paras. 19 and 20 of this Schedule in accordance with the Action Plan as agreed between ADB and the executing agency.
para. 20 of Schedule 5
Partially complied. The executing agency despite its efforts were not able to push through all the reforms which involved changes in the state policy and direct involvement of the state legislature.
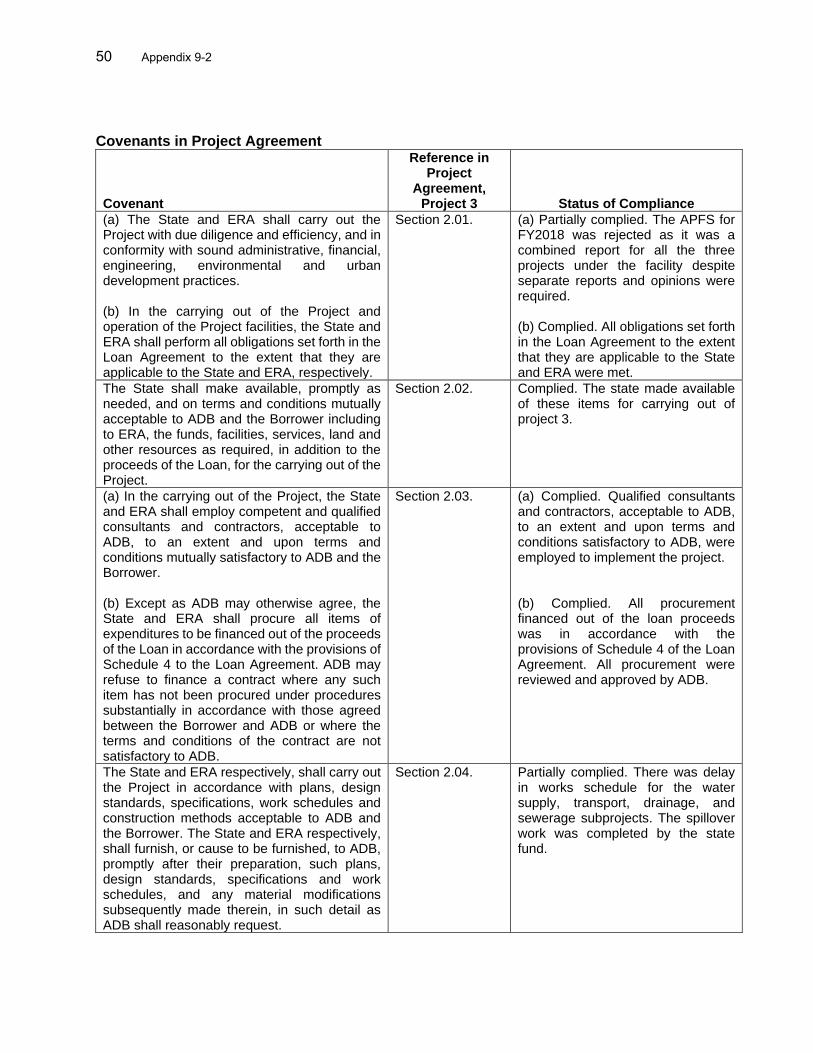
50 Appendix 9-2
Covenants in Project Agreement
Covenant
Reference in Project
Agreement, Project 3 Status of Compliance
(a) The State and ERA shall carry out the Project with due diligence and efficiency, and in conformity with sound administrative, financial, engineering, environmental and urban development practices. (b) In the carrying out of the Project and operation of the Project facilities, the State and ERA shall perform all obligations set forth in the Loan Agreement to the extent that they are applicable to the State and ERA, respectively.
Section 2.01. (a) Partially complied. The APFS for FY2018 was rejected as it was a combined report for all the three projects under the facility despite separate reports and opinions were required. (b) Complied. All obligations set forth in the Loan Agreement to the extent that they are applicable to the State and ERA were met.
The State shall make available, promptly as needed, and on terms and conditions mutually acceptable to ADB and the Borrower including to ERA, the funds, facilities, services, land and other resources as required, in addition to the proceeds of the Loan, for the carrying out of the Project.
Section 2.02. Complied. The state made available of these items for carrying out of project 3.
(a) In the carrying out of the Project, the State and ERA shall employ competent and qualified consultants and contractors, acceptable to ADB, to an extent and upon terms and conditions mutually satisfactory to ADB and the Borrower. (b) Except as ADB may otherwise agree, the State and ERA shall procure all items of expenditures to be financed out of the proceeds of the Loan in accordance with the provisions of Schedule 4 to the Loan Agreement. ADB may refuse to finance a contract where any such item has not been procured under procedures substantially in accordance with those agreed between the Borrower and ADB or where the terms and conditions of the contract are not satisfactory to ADB.
Section 2.03. (a) Complied. Qualified consultants and contractors, acceptable to ADB, to an extent and upon terms and conditions satisfactory to ADB, were employed to implement the project. (b) Complied. All procurement financed out of the loan proceeds was in accordance with the provisions of Schedule 4 of the Loan Agreement. All procurement were reviewed and approved by ADB.
The State and ERA respectively, shall carry out the Project in accordance with plans, design standards, specifications, work schedules and construction methods acceptable to ADB and the Borrower. The State and ERA respectively, shall furnish, or cause to be furnished, to ADB, promptly after their preparation, such plans, design standards, specifications and work schedules, and any material modifications subsequently made therein, in such detail as ADB shall reasonably request.
Section 2.04. Partially complied. There was delay in works schedule for the water supply, transport, drainage, and sewerage subprojects. The spillover work was completed by the state fund.
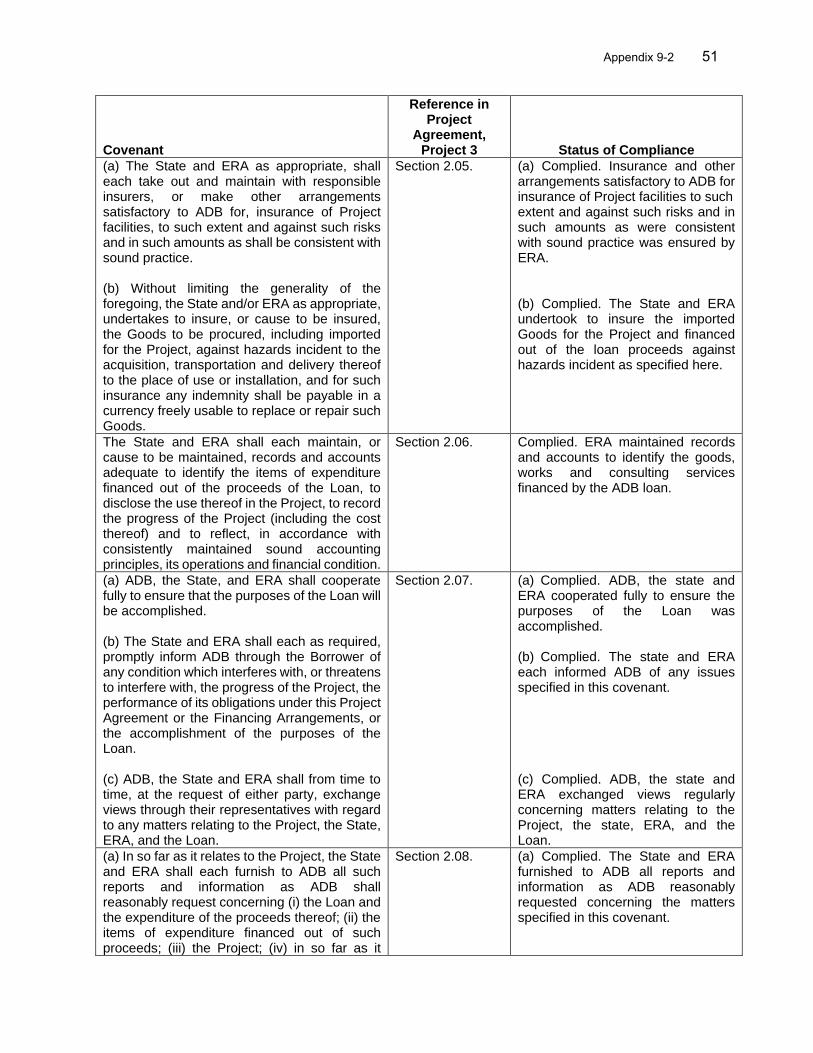
Appendix 9-2 51
Covenant
Reference in Project
Agreement, Project 3 Status of Compliance
(a) The State and ERA as appropriate, shall each take out and maintain with responsible insurers, or make other arrangements satisfactory to ADB for, insurance of Project facilities, to such extent and against such risks and in such amounts as shall be consistent with sound practice. (b) Without limiting the generality of the foregoing, the State and/or ERA as appropriate, undertakes to insure, or cause to be insured, the Goods to be procured, including imported for the Project, against hazards incident to the acquisition, transportation and delivery thereof to the place of use or installation, and for such insurance any indemnity shall be payable in a currency freely usable to replace or repair such Goods.
Section 2.05. (a) Complied. Insurance and other arrangements satisfactory to ADB for insurance of Project facilities to such extent and against such risks and in such amounts as were consistent with sound practice was ensured by ERA. (b) Complied. The State and ERA undertook to insure the imported Goods for the Project and financed out of the loan proceeds against hazards incident as specified here.
The State and ERA shall each maintain, or cause to be maintained, records and accounts adequate to identify the items of expenditure financed out of the proceeds of the Loan, to disclose the use thereof in the Project, to record the progress of the Project (including the cost thereof) and to reflect, in accordance with consistently maintained sound accounting principles, its operations and financial condition.
Section 2.06. Complied. ERA maintained records and accounts to identify the goods, works and consulting services financed by the ADB loan.
(a) ADB, the State, and ERA shall cooperate fully to ensure that the purposes of the Loan will be accomplished. (b) The State and ERA shall each as required, promptly inform ADB through the Borrower of any condition which interferes with, or threatens to interfere with, the progress of the Project, the performance of its obligations under this Project Agreement or the Financing Arrangements, or the accomplishment of the purposes of the Loan. (c) ADB, the State and ERA shall from time to time, at the request of either party, exchange views through their representatives with regard to any matters relating to the Project, the State, ERA, and the Loan.
Section 2.07. (a) Complied. ADB, the state and ERA cooperated fully to ensure the purposes of the Loan was accomplished. (b) Complied. The state and ERA each informed ADB of any issues specified in this covenant. (c) Complied. ADB, the state and ERA exchanged views regularly concerning matters relating to the Project, the state, ERA, and the Loan.
(a) In so far as it relates to the Project, the State and ERA shall each furnish to ADB all such reports and information as ADB shall reasonably request concerning (i) the Loan and the expenditure of the proceeds thereof; (ii) the items of expenditure financed out of such proceeds; (iii) the Project; (iv) in so far as it
Section 2.08. (a) Complied. The State and ERA furnished to ADB all reports and information as ADB reasonably requested concerning the matters specified in this covenant.
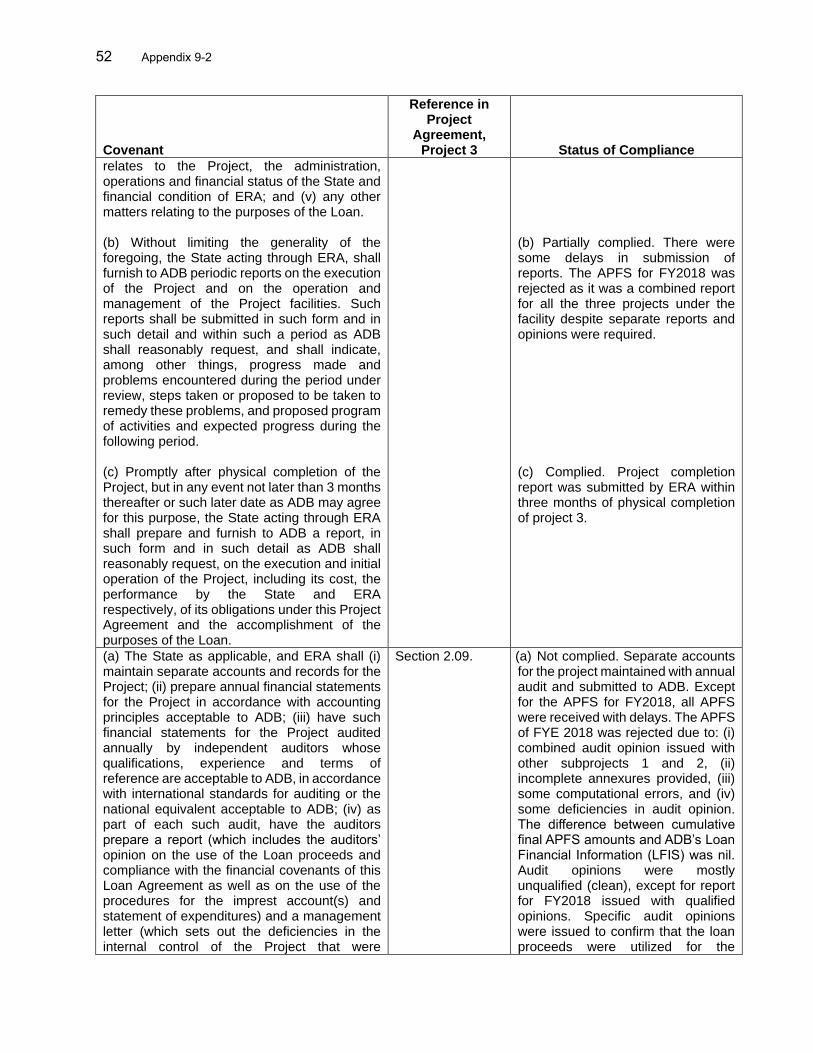
52 Appendix 9-2
Covenant
Reference in Project
Agreement, Project 3 Status of Compliance
relates to the Project, the administration, operations and financial status of the State and financial condition of ERA; and (v) any other matters relating to the purposes of the Loan. (b) Without limiting the generality of the foregoing, the State acting through ERA, shall furnish to ADB periodic reports on the execution of the Project and on the operation and management of the Project facilities. Such reports shall be submitted in such form and in such detail and within such a period as ADB shall reasonably request, and shall indicate, among other things, progress made and problems encountered during the period under review, steps taken or proposed to be taken to remedy these problems, and proposed program of activities and expected progress during the following period. (c) Promptly after physical completion of the Project, but in any event not later than 3 months thereafter or such later date as ADB may agree for this purpose, the State acting through ERA shall prepare and furnish to ADB a report, in such form and in such detail as ADB shall reasonably request, on the execution and initial operation of the Project, including its cost, the performance by the State and ERA respectively, of its obligations under this Project Agreement and the accomplishment of the purposes of the Loan.
(b) Partially complied. There were some delays in submission of reports. The APFS for FY2018 was rejected as it was a combined report for all the three projects under the facility despite separate reports and opinions were required. (c) Complied. Project completion report was submitted by ERA within three months of physical completion of project 3.
(a) The State as applicable, and ERA shall (i) maintain separate accounts and records for the Project; (ii) prepare annual financial statements for the Project in accordance with accounting principles acceptable to ADB; (iii) have such financial statements for the Project audited annually by independent auditors whose qualifications, experience and terms of reference are acceptable to ADB, in accordance with international standards for auditing or the national equivalent acceptable to ADB; (iv) as part of each such audit, have the auditors prepare a report (which includes the auditors’ opinion on the use of the Loan proceeds and compliance with the financial covenants of this Loan Agreement as well as on the use of the procedures for the imprest account(s) and statement of expenditures) and a management letter (which sets out the deficiencies in the internal control of the Project that were
Section 2.09. (a) Not complied. Separate accounts for the project maintained with annual audit and submitted to ADB. Except for the APFS for FY2018, all APFS were received with delays. The APFS of FYE 2018 was rejected due to: (i) combined audit opinion issued with other subprojects 1 and 2, (ii) incomplete annexures provided, (iii) some computational errors, and (iv) some deficiencies in audit opinion. The difference between cumulative final APFS amounts and ADB’s Loan Financial Information (LFIS) was nil. Audit opinions were mostly unqualified (clean), except for report for FY2018 issued with qualified opinions. Specific audit opinions were issued to confirm that the loan proceeds were utilized for the
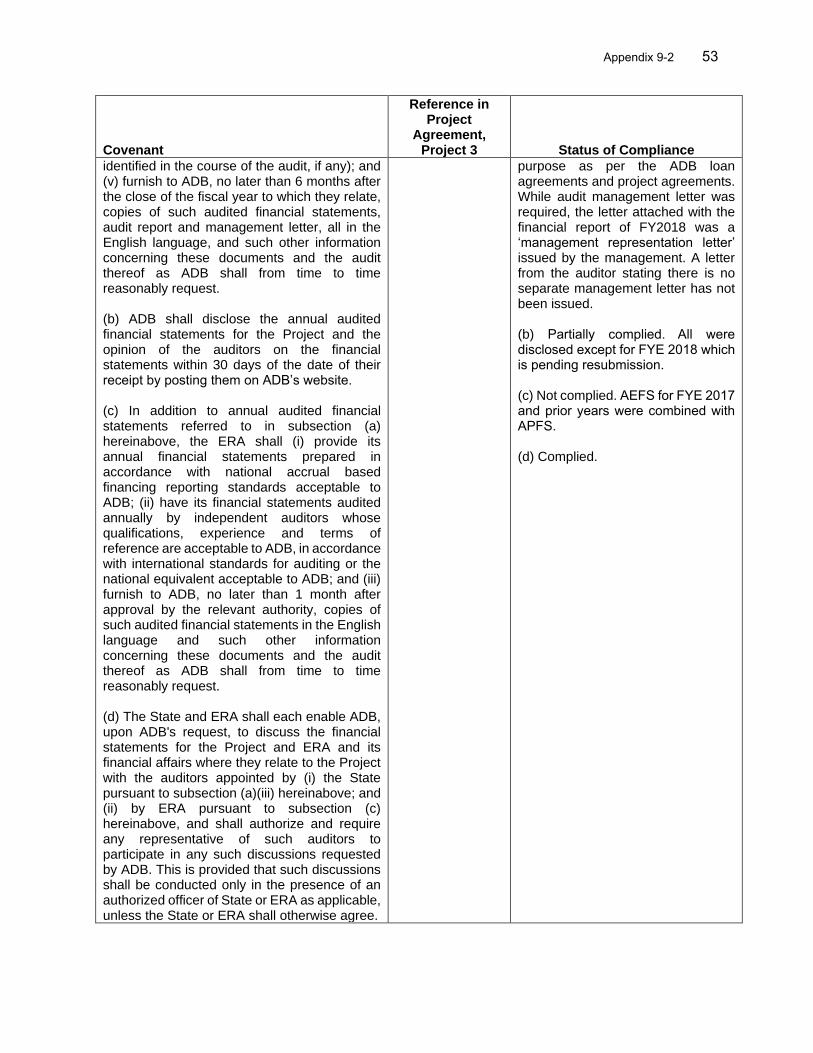
Appendix 9-2 53
Covenant
Reference in Project
Agreement, Project 3 Status of Compliance
identified in the course of the audit, if any); and (v) furnish to ADB, no later than 6 months after the close of the fiscal year to which they relate, copies of such audited financial statements, audit report and management letter, all in the English language, and such other information concerning these documents and the audit thereof as ADB shall from time to time reasonably request. (b) ADB shall disclose the annual audited financial statements for the Project and the opinion of the auditors on the financial statements within 30 days of the date of their receipt by posting them on ADB’s website. (c) In addition to annual audited financial statements referred to in subsection (a) hereinabove, the ERA shall (i) provide its annual financial statements prepared in accordance with national accrual based financing reporting standards acceptable to ADB; (ii) have its financial statements audited annually by independent auditors whose qualifications, experience and terms of reference are acceptable to ADB, in accordance with international standards for auditing or the national equivalent acceptable to ADB; and (iii) furnish to ADB, no later than 1 month after approval by the relevant authority, copies of such audited financial statements in the English language and such other information concerning these documents and the audit thereof as ADB shall from time to time reasonably request. (d) The State and ERA shall each enable ADB, upon ADB's request, to discuss the financial statements for the Project and ERA and its financial affairs where they relate to the Project with the auditors appointed by (i) the State pursuant to subsection (a)(iii) hereinabove; and (ii) by ERA pursuant to subsection (c) hereinabove, and shall authorize and require any representative of such auditors to participate in any such discussions requested by ADB. This is provided that such discussions shall be conducted only in the presence of an authorized officer of State or ERA as applicable, unless the State or ERA shall otherwise agree.
purpose as per the ADB loan agreements and project agreements. While audit management letter was required, the letter attached with the financial report of FY2018 was a ‘management representation letter’ issued by the management. A letter from the auditor stating there is no separate management letter has not been issued. (b) Partially complied. All were disclosed except for FYE 2018 which is pending resubmission. (c) Not complied. AEFS for FYE 2017 and prior years were combined with APFS. (d) Complied.
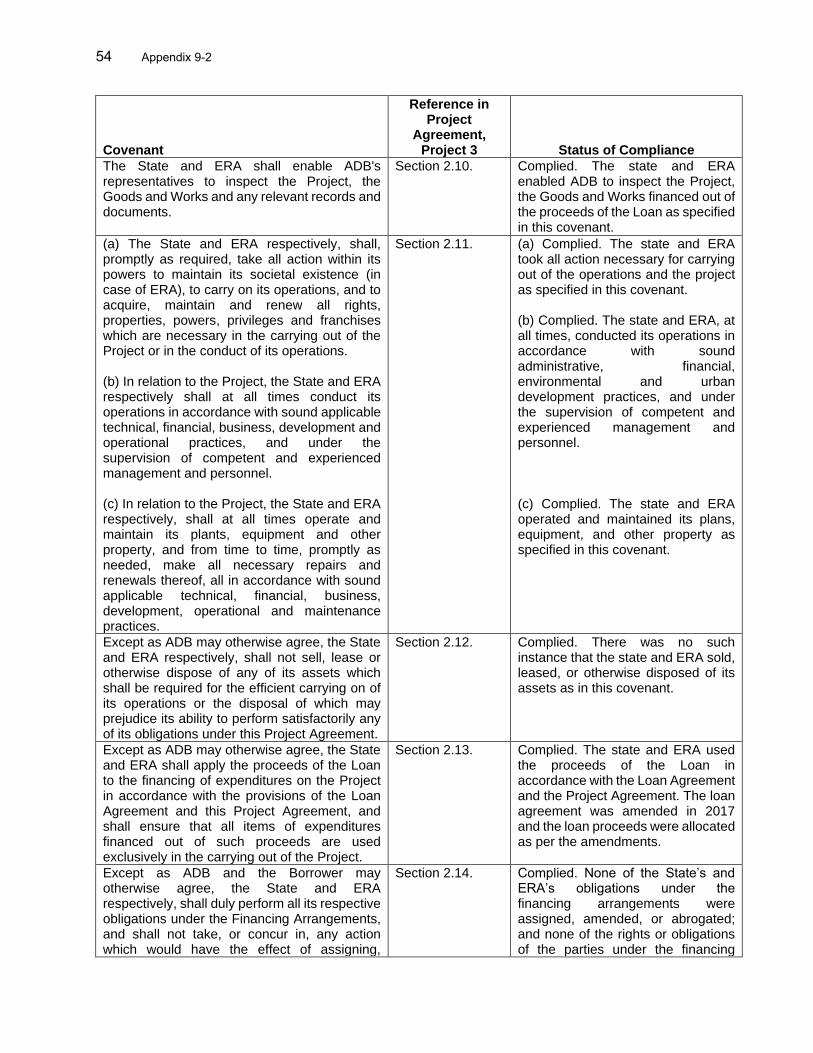
54 Appendix 9-2
Covenant
Reference in Project
Agreement, Project 3 Status of Compliance
The State and ERA shall enable ADB's representatives to inspect the Project, the Goods and Works and any relevant records and documents.
Section 2.10. Complied. The state and ERA enabled ADB to inspect the Project, the Goods and Works financed out of the proceeds of the Loan as specified in this covenant.
(a) The State and ERA respectively, shall, promptly as required, take all action within its powers to maintain its societal existence (in case of ERA), to carry on its operations, and to acquire, maintain and renew all rights, properties, powers, privileges and franchises which are necessary in the carrying out of the Project or in the conduct of its operations. (b) In relation to the Project, the State and ERA respectively shall at all times conduct its operations in accordance with sound applicable technical, financial, business, development and operational practices, and under the supervision of competent and experienced management and personnel. (c) In relation to the Project, the State and ERA respectively, shall at all times operate and maintain its plants, equipment and other property, and from time to time, promptly as needed, make all necessary repairs and renewals thereof, all in accordance with sound applicable technical, financial, business, development, operational and maintenance practices.
Section 2.11. (a) Complied. The state and ERA took all action necessary for carrying out of the operations and the project as specified in this covenant. (b) Complied. The state and ERA, at all times, conducted its operations in accordance with sound administrative, financial, environmental and urban development practices, and under the supervision of competent and experienced management and personnel. (c) Complied. The state and ERA operated and maintained its plans, equipment, and other property as specified in this covenant.
Except as ADB may otherwise agree, the State and ERA respectively, shall not sell, lease or otherwise dispose of any of its assets which shall be required for the efficient carrying on of its operations or the disposal of which may prejudice its ability to perform satisfactorily any of its obligations under this Project Agreement.
Section 2.12. Complied. There was no such instance that the state and ERA sold, leased, or otherwise disposed of its assets as in this covenant.
Except as ADB may otherwise agree, the State and ERA shall apply the proceeds of the Loan to the financing of expenditures on the Project in accordance with the provisions of the Loan Agreement and this Project Agreement, and shall ensure that all items of expenditures financed out of such proceeds are used exclusively in the carrying out of the Project.
Section 2.13. Complied. The state and ERA used the proceeds of the Loan in accordance with the Loan Agreement and the Project Agreement. The loan agreement was amended in 2017 and the loan proceeds were allocated as per the amendments.
Except as ADB and the Borrower may otherwise agree, the State and ERA respectively, shall duly perform all its respective obligations under the Financing Arrangements, and shall not take, or concur in, any action which would have the effect of assigning,
Section 2.14. Complied. None of the State’s and ERA’s obligations under the financing arrangements were assigned, amended, or abrogated; and none of the rights or obligations of the parties under the financing
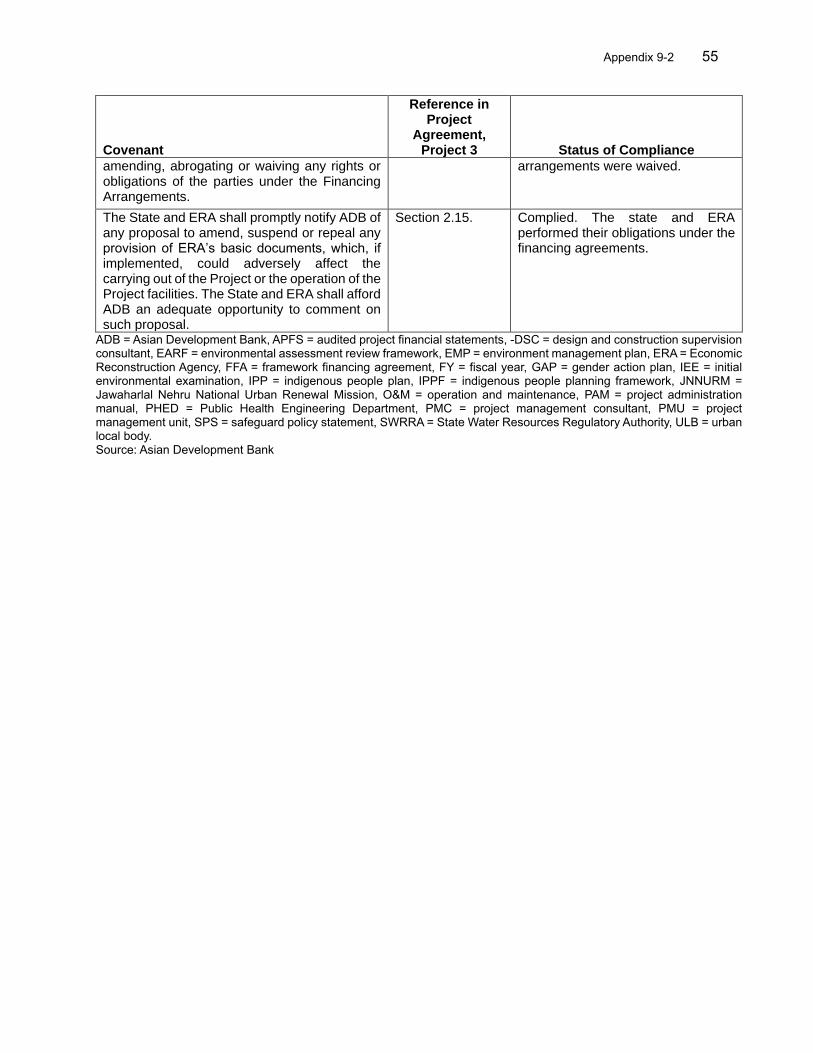
Appendix 9-2 55
Covenant
Reference in Project
Agreement, Project 3 Status of Compliance
amending, abrogating or waiving any rights or obligations of the parties under the Financing Arrangements.
arrangements were waived.
The State and ERA shall promptly notify ADB of any proposal to amend, suspend or repeal any provision of ERA’s basic documents, which, if implemented, could adversely affect the carrying out of the Project or the operation of the Project facilities. The State and ERA shall afford ADB an adequate opportunity to comment on such proposal.
Section 2.15. Complied. The state and ERA performed their obligations under the financing agreements.
ADB = Asian Development Bank, APFS = audited project financial statements, -DSC = design and construction supervision consultant, EARF = environmental assessment review framework, EMP = environment management plan, ERA = Economic Reconstruction Agency, FFA = framework financing agreement, FY = fiscal year, GAP = gender action plan, IEE = initial environmental examination, IPP = indigenous people plan, IPPF = indigenous people planning framework, JNNURM = Jawaharlal Nehru National Urban Renewal Mission, O&M = operation and maintenance, PAM = project administration manual, PHED = Public Health Engineering Department, PMC = project management consultant, PMU = project management unit, SPS = safeguard policy statement, SWRRA = State Water Resources Regulatory Authority, ULB = urban local body. Source: Asian Development Bank
56 Appendix 10
IMPLEMENTATION OF GENDER ACTION PLAN AND ACHIEVEMENTS
A. Introduction 1. The MFF Investment Program was designed to help the state address the its low percentage of households with access to safe drinking water, which reaches only 34.7% of 2.4 million people; lack of piped systems for sewage collection; and need for sewage treatment capacity in the two target towns. Census 2011 recorded 52% of households with toilets, and 24% connected directly to drains; 17% had to defecate in the open. The annual average of waterlogging or flooding in city centers was 2 hours in 30 days in one target town and 2.2 hours in 10 days in the other target town. Though 74% of the solid waste was collected in one target town and 100% in the other, most households in their congested areas discharged their wastes into open surface drains, endangering public health and water quality in streams, rivers, and lakes.1 The investment program sought to expand basic urban infrastructure to foster economic growth in the state and address these problems. 2. Project 3 under the investment program covered mainly water supply, drainage, and urban transport, which were appraised as essential to meet investment program objectives. The expected impact was improved living environments in the two target towns, as indicated by increased coverage of municipal water supply and drainage services, functional drainage systems, and better roads. The expected outcome was improved urban services in the two target towns as manifested in greater numbers of people benefiting from water supply subprojects, reduced hours of waterlogging with drainage improvement, and saved travel hours from flyover construction. The project aimed to considerably enhance the socioeconomic status of the households living below the poverty line (BPL), at 13% of the total and of households headed by women, at 8%, by improving the quality of life in user communities. 3. The project was categorized effective gender mainstreaming. To mainstream gender in the project, performance indicators and targets for gender equality and women’s empowerment were incorporated into the project design and monitoring framework (DMF), and a gender action plan (GAP) was prepared and implemented. B. Gender Issues 4. A gender analysis during project processing found that the female share in the state population had declined from 47.2% in 2001 to 46.9% in 2011. Women constituted 28.6% of the workforce in the state. The female work participation rate in 2011 was 22.5%, ranking the state 21st in Indian states. Women’s participation in community activities and infrastructure planning, particularly for water supply and sanitation, was considered low as the recorded figure in 2011 was 0.99%. Although the female literacy rate had improved from 43% in 2011 to 56.4% in 2011, more than 45% of girls aged to be in class I–X had dropped out of school. Low education attainment constrains women’s and girls’ development of their cognitive skills and self-confidence and keeps many women from participating meaningfully and productively in economic activities. 5. The recorded sex ratio in the state was 889:1,000, down by 3 from 2001 and considerably lower than the national average, which was 940:1000. 2 During design of the multitranche financing facility, a socioeconomic survey found anemia affecting 52% of married women aged
1 ADB. 2014. Periodic Financing Request for Jammu and Kashmir Urban Sector Development Investment Program: Tranche 3. C. Poverty, Social and Gender Dimensions para-C. 32. Manila. 2 Census Report, 2011; Press Note on Poverty Estimates, 2011; Planning Commission of India, July 2013; the state
Economic Survey 2012-2013; and 66th Round of National Sample Survey (2009-10).
Appendix 10 57
15–49 in urban areas of the state. This compromised their immune system, making them highly vulnerable to water-borne diseases that spread through poor sanitation. While women themselves suffered from compromised immunity, their traditional caring roles obligated them to take care of other household members, especially children, and the sick and elderly. With these obligations and other household tasks, only 42% of women had paid work. Women’s lack of time for paid work was exacerbated by the need to fetch water from outside their homes.3 C. Project Gender Features 6. The gender strategy of the project targeted BPL households and households headed by women as beneficiaries of the improving urban infrastructure for transport, water supply, and drainage. A GAP was prepared to create equal opportunity for women to participate in and benefit from the project. The following are its key features:
(i) Gender in urban infrastructures and services (a) Focus on households living before poverty line and those headed by women
in the provision of urban services, transport infrastructure, sewerage connections, water supply, and solid waste management.
(b) Develop women-friendly civic amenities to promote women’s and girls' needs, safety, and privacy in the public transport system in one target town.
(c) Promote improved health and hygiene-related practices among women household members living in subproject areas or zones of influence of drainage construction in the target towns.
(d) Promote community-led water conservation initiatives under nonrevenue water components and promote women’s leadership in water supply management in subproject areas in one target town.
(ii) Enabling Measures
(a) Raise awareness in target towns, including in poor and other low-income households and those headed by women, of gender issues and behavior change with initiatives to (i) conserve water; (ii) demonstrate the links between maintaining storm water drains and good personal and community hygiene and health and sanitation; and (iii) reduce waste, reuse, and recycle.
(b) Include clauses in all bidding documents requiring contractors to adopt gender equality targets and adhere to core labor standards, including equal wages for work of equal value.
(c) Develop capacity of the urban local body (ULB), municipal, and project staff on key gender concepts and the different roles played by women in water supply, sanitation, hygiene, health, and good practices in gender-inclusive urban development.
(d) Use a gender lens—a focus on gender aspects of the project—in project management and monitoring, including promoting women’s participation in the prioritization and monitoring of project activities.
(e) Develop project-specific public service advertisements highlighting the project’s benefits to the community, particularly for the poor and women.
D. Implementation, Monitoring, Reporting Arrangements
3 ADB. 2007. Report and Recommendation of the President to the Board of Directors: Proposed Multitranche Financing
Facility to the Government of India for the Jammu and Kashmir Urban Sector Development Investment Program. Summary of Poverty Reduction and Social Strategy (Appendix 7). Manila.
58 Appendix 10
7. The executing agency efficiently arranged for GAP implementation, monitoring, and reporting. Social and resettlement experts supervised GAP implementation in the target towns with a social and resettlement specialist (consultant). ULBs and line departments were tapped from time to time to support awareness-raising, community mobilization, and capacity development. The budget allocated under the project was sufficient to recruit a consulting firm led by a gender specialist to facilitate the timely and effective implementation of the GAP awareness and behavior change workshops; community consultation meetings; skills training; preparation of training modules; and brochures, pamphlets, and project-specific public service advertisements highlighting project’s benefits to the community particularly the poor and women. The project collected sex-disaggregated data and regularly submitted the GAP progress reports. E. Gender Action Plan Achievements
8. As shown in Table 1, all 10 GAP activities were completed, and 16 of 19 (84%) quantitative targets in the GAP and DMF were achieved. As such, GAP implementation was assessed as successful. The practical gender benefits of GAP implementation are summarized below:
(i) Less time poverty, safety risks, and health hazards with improved water and sanitation services. Laying new pipelines and replacing old, worn-out pipes in one target town increased access to high-quality water and sanitation for 30,000 households. Similarly, a new 18.5 kilometer (km) pipeline in the other target town augmented average water supply for 200,000 people, covering approximately 26,000 households. The construction of 41.77 km of drains in one target town benefited about 55,000 people, 13% in BPL households, 8% headed by women, and 47% of them women. The increased access to quality water and sanitation services has reduced the time spent by women and girls for water collection and sanitation management, which has enabled women to spend more time for socializing with neighbors and learning new skills, such as stitching and embroidery. It has also reduced the incidence of waterborne diseases through drainage improvement (Box 1).
(ii) Women’s improved ability to manage household water and sanitation needs. Women participated significantly in information, education, and awareness campaigns for project communities and residents, comprised 59% participants in six social mobilization campaigns on community-led water conservation and sanitation initiatives; 72% participants in workshops on behavior change for water conservation, personal hygiene, and water reduction, reuse, and recycling; and 58% participants of community meetings to establish links between storm water drains maintenance and hygiene.
9. Strategic benefits are summarized below:
(i) Women’s safety and convenience in public places. The automated car parking
facility at City Chowk —built under the subproject Semi-Automatic Multilevel Parking—facilitated the mobility for women traders and shoppers even at odd hours as it is equipped with modern conveniences and safety amenities, such as closed circuit television (CCTV); adequate lighting; a waiting room for women, the elderly, and children; and 24/7 deployment of security personnel (Box 2).
(ii) Incorporation of women’s needs and priorities in project planning, design, and management. The mandatory quota for women’s representation in the planning and designing of urban infrastructure and services urged the urban

Appendix 10 59
planners to provide women with space to raise their concerns. It facilitated the participation of over 60% women in community consultations. An outcome is women’s understanding of the impact of water supply, sanitation, and waste management amenities on their lives. This understanding became a motivation for women to raise their concerns on water supply, sanitation, and solid waste management, which led to the integration of gender-differentiated needs and priorities in the water and sanitation infrastructure design and processes. For example, some women in one of the towns found the timing of water supply to be convenient.
(iii) A better understanding of the interrelationship between gender and transport among urban planners. Projects 2 and project 3 confirmed to urban planners that integrating women in urban transport was indispensable to sustainable urban development. In this state, this constitutes a shift in the perceptions and attitudes of urban planners about the rights and roles of women in urban transport and urban development.
(iv) Enabling institutional environment and institutional capacity in gender mainstreaming. Training, orientation and cross-learning programs resulted in the service providers, including project staff, stakeholders, and public representatives, strengthened their understanding and recognition of gender equality in urban infrastructure, developing their capability to identify and address gender gaps in project planning and implementation, including practical ways to ensure meaningful participation of women. As did urban planners’ acknowledgment of women’s roles and rights in urban transport and development, participating service providers expressed support for gender equality and the need to address gender issues. Especially in the social context of this state, this indicates a shift in in favor of the rights and roles of women in urban infrastructure.
Box 1: Alleviating Time Poverty and Health Hazards Sushma Verma, covered under sub-project, Rehabilitation of Water Supply Network, Zone 2, 3, 4, and 5 in one of the target towns (Loan3132); shared during a focus group discussion on 8 January 2020.
“We, in Baghwati Nagar, could only dream of 24/7 potable water supply in our households. Our only source of water was hand pumps, which used to malfunction frequently, requiring us to fetch water from other more remote sources. The water used to get contaminated as old water pipes leaked, inviting a host of diseases. We recall several instances of quarrels as everyone queued for hours to collect water. Now, every household receives water 24/7, and this has made it possible for students, including my daughter, to dedicate more time to study and attend school regularly. I have more time to socialize with the neighbors, watch television, and learn new skills such as stitching and embroidery. However, I have a suggestion for the government to provide a back-up motor at the reservoir or distribution unit, which could be used when existing motors malfunction. We had a bitter experience when the department took 4 or 5 days to fix the motor when it broke.”
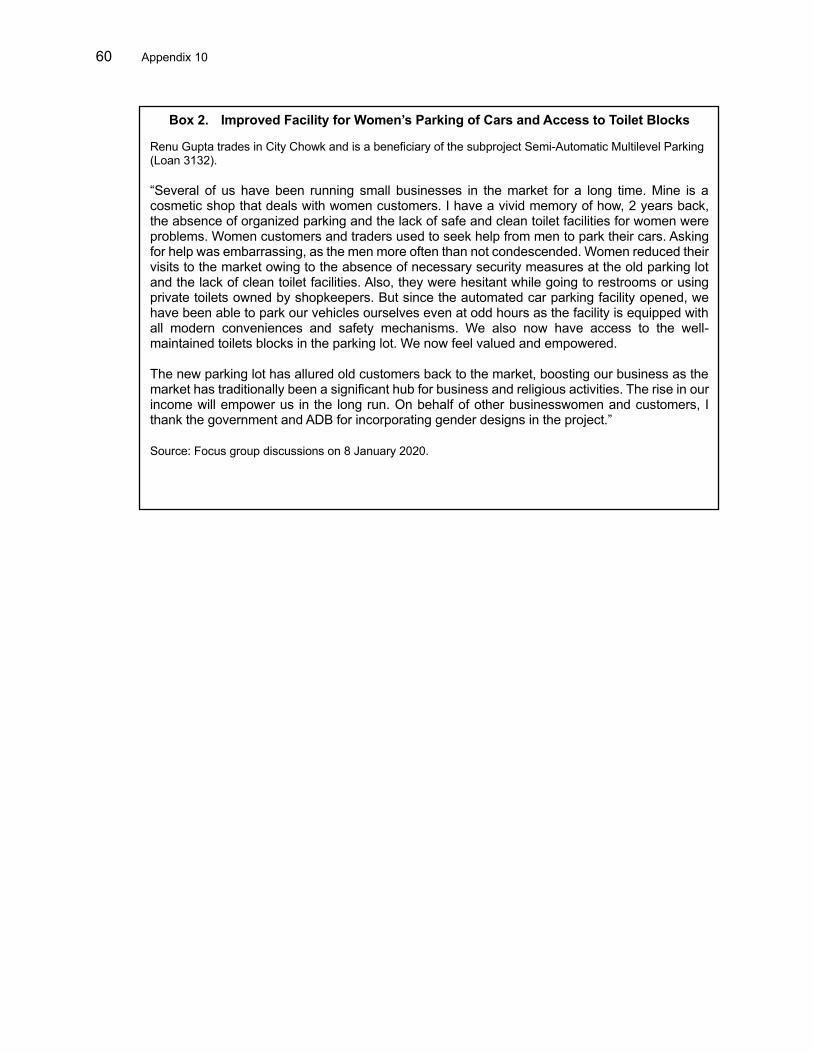
60 Appendix 10
Box 2. Improved Facility for Women’s Parking of Cars and Access to Toilet Blocks
Renu Gupta trades in City Chowk and is a beneficiary of the subproject Semi-Automatic Multilevel Parking (Loan 3132).
“Several of us have been running small businesses in the market for a long time. Mine is a cosmetic shop that deals with women customers. I have a vivid memory of how, 2 years back, the absence of organized parking and the lack of safe and clean toilet facilities for women were problems. Women customers and traders used to seek help from men to park their cars. Asking for help was embarrassing, as the men more often than not condescended. Women reduced their visits to the market owing to the absence of necessary security measures at the old parking lot and the lack of clean toilet facilities. Also, they were hesitant while going to restrooms or using private toilets owned by shopkeepers. But since the automated car parking facility opened, we have been able to park our vehicles ourselves even at odd hours as the facility is equipped with all modern conveniences and safety mechanisms. We also now have access to the well-maintained toilets blocks in the parking lot. We now feel valued and empowered. The new parking lot has allured old customers back to the market, boosting our business as the market has traditionally been a significant hub for business and religious activities. The rise in our income will empower us in the long run. On behalf of other businesswomen and customers, I thank the government and ADB for incorporating gender designs in the project.”
Source: Focus group discussions on 8 January 2020.
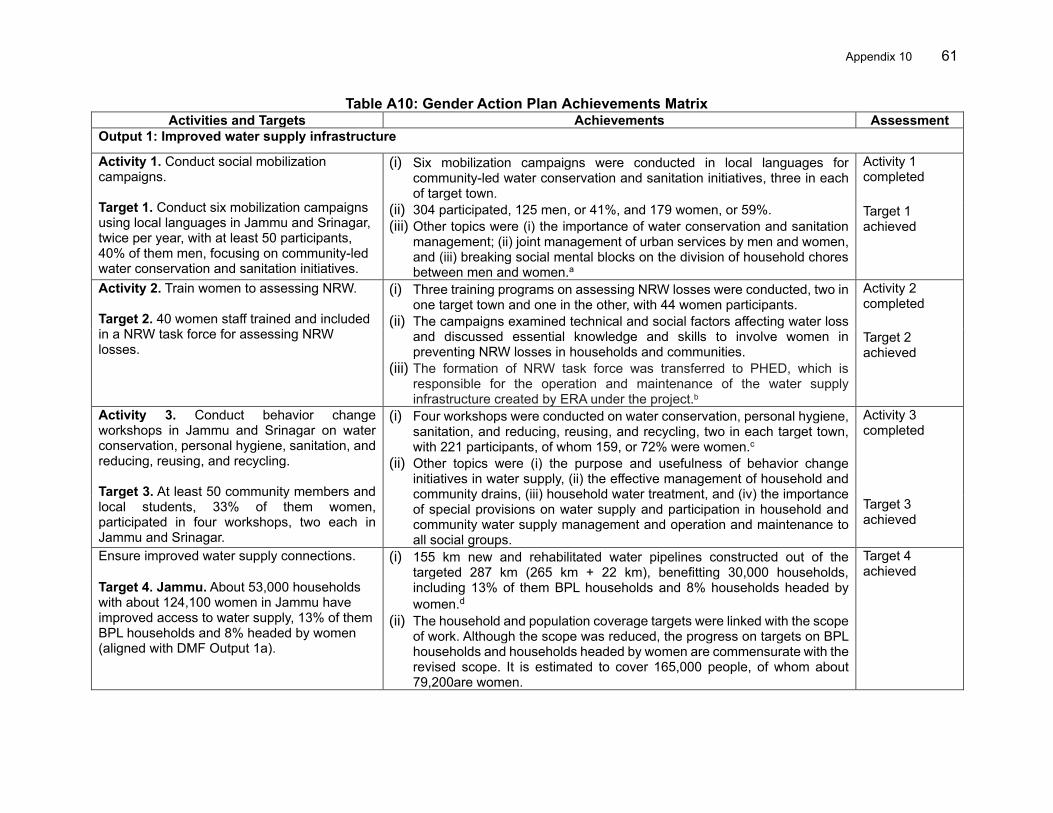
Appendix 10 61
Table A10: Gender Action Plan Achievements Matrix Activities and Targets Achievements Assessment
Output 1: Improved water supply infrastructure
Activity 1. Conduct social mobilization campaigns.
Target 1. Conduct six mobilization campaigns using local languages in Jammu and Srinagar, twice per year, with at least 50 participants, 40% of them men, focusing on community-led water conservation and sanitation initiatives.
(i) Six mobilization campaigns were conducted in local languages for community-led water conservation and sanitation initiatives, three in each of target town.
(ii) 304 participated, 125 men, or 41%, and 179 women, or 59%.
(iii) Other topics were (i) the importance of water conservation and sanitation management; (ii) joint management of urban services by men and women, and (iii) breaking social mental blocks on the division of household chores between men and women.a
Activity 1 completed
Target 1 achieved
Activity 2. Train women to assessing NRW. Target 2. 40 women staff trained and included in a NRW task force for assessing NRW losses.
(i) Three training programs on assessing NRW losses were conducted, two in one target town and one in the other, with 44 women participants.
(ii) The campaigns examined technical and social factors affecting water loss and discussed essential knowledge and skills to involve women in preventing NRW losses in households and communities.
(iii) The formation of NRW task force was transferred to PHED, which is responsible for the operation and maintenance of the water supply infrastructure created by ERA under the project.b
Activity 2 completed
Target 2 achieved
Activity 3. Conduct behavior change workshops in Jammu and Srinagar on water conservation, personal hygiene, sanitation, and reducing, reusing, and recycling. Target 3. At least 50 community members and local students, 33% of them women, participated in four workshops, two each in Jammu and Srinagar.
(i) Four workshops were conducted on water conservation, personal hygiene, sanitation, and reducing, reusing, and recycling, two in each target town, with 221 participants, of whom 159, or 72% were women.c
(ii) Other topics were (i) the purpose and usefulness of behavior change initiatives in water supply, (ii) the effective management of household and community drains, (iii) household water treatment, and (iv) the importance of special provisions on water supply and participation in household and community water supply management and operation and maintenance to all social groups.
Activity 3 completed
Target 3 achieved
Ensure improved water supply connections.
(i) 155 km new and rehabilitated water pipelines constructed out of the targeted 287 km (265 km + 22 km), benefitting 30,000 households, including 13% of them BPL households and 8% households headed by
women.d (ii) The household and population coverage targets were linked with the scope
of work. Although the scope was reduced, the progress on targets on BPL households and households headed by women are commensurate with the revised scope. It is estimated to cover 165,000 people, of whom about 79,200are women.
Target 4 achieved
Target 4. Jammu. About 53,000 households with about 124,100 women in Jammu have improved access to water supply, 13% of them BPL households and 8% headed by women (aligned with DMF Output 1a).
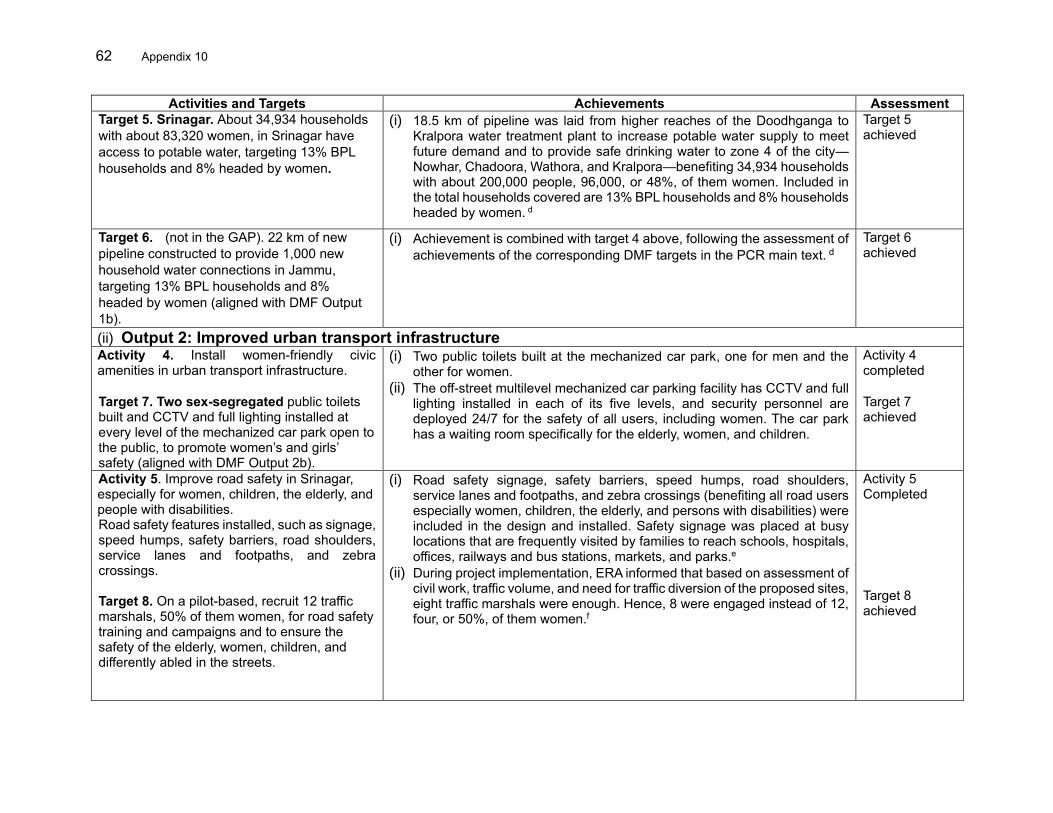
62 Appendix 10
Activities and Targets Achievements Assessment
Target 5. Srinagar. About 34,934 households
with about 83,320 women, in Srinagar have
access to potable water, targeting 13% BPL
households and 8% headed by women.
(i) 18.5 km of pipeline was laid from higher reaches of the Doodhganga to Kralpora water treatment plant to increase potable water supply to meet future demand and to provide safe drinking water to zone 4 of the city—Nowhar, Chadoora, Wathora, and Kralpora—benefiting 34,934 households with about 200,000 people, 96,000, or 48%, of them women. Included in the total households covered are 13% BPL households and 8% households headed by women. d
Target 5 achieved
Target 6. (not in the GAP). 22 km of new
pipeline constructed to provide 1,000 new
household water connections in Jammu,
targeting 13% BPL households and 8%
headed by women (aligned with DMF Output
1b).
(i) Achievement is combined with target 4 above, following the assessment of
achievements of the corresponding DMF targets in the PCR main text. d
Target 6 achieved
(ii) Output 2: Improved urban transport infrastructure Activity 4. Install women-friendly civic amenities in urban transport infrastructure.
(i) Two public toilets built at the mechanized car park, one for men and the other for women.
(ii) The off-street multilevel mechanized car parking facility has CCTV and full lighting installed in each of its five levels, and security personnel are deployed 24/7 for the safety of all users, including women. The car park has a waiting room specifically for the elderly, women, and children.
Activity 4 completed
Target 7. Two sex-segregated public toilets built and CCTV and full lighting installed at every level of the mechanized car park open to the public, to promote women’s and girls’ safety (aligned with DMF Output 2b).
Target 7 achieved
Activity 5. Improve road safety in Srinagar, especially for women, children, the elderly, and people with disabilities. Road safety features installed, such as signage, speed humps, safety barriers, road shoulders, service lanes and footpaths, and zebra crossings. Target 8. On a pilot-based, recruit 12 traffic marshals, 50% of them women, for road safety training and campaigns and to ensure the safety of the elderly, women, children, and differently abled in the streets.
(i) Road safety signage, safety barriers, speed humps, road shoulders, service lanes and footpaths, and zebra crossings (benefiting all road users especially women, children, the elderly, and persons with disabilities) were included in the design and installed. Safety signage was placed at busy locations that are frequently visited by families to reach schools, hospitals, offices, railways and bus stations, markets, and parks.e
(ii) During project implementation, ERA informed that based on assessment of civil work, traffic volume, and need for traffic diversion of the proposed sites, eight traffic marshals were enough. Hence, 8 were engaged instead of 12, four, or 50%, of them women.f
Activity 5 Completed
Target 8 achieved
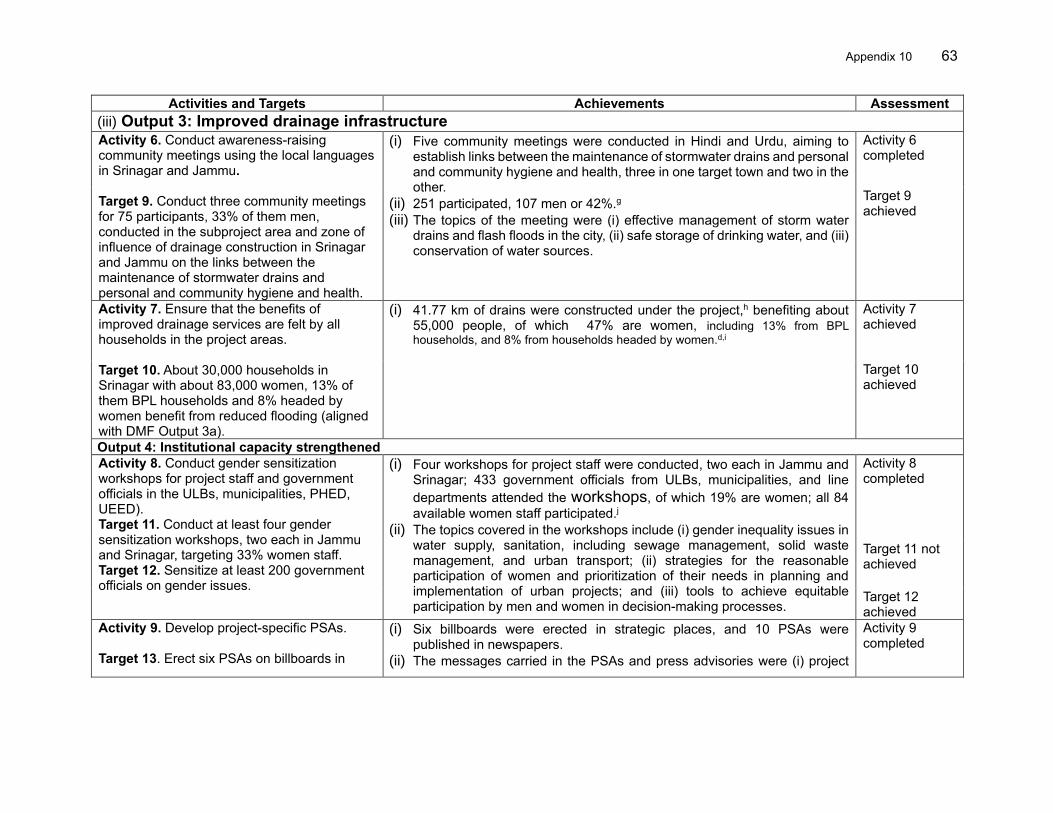
Appendix 10 63
Activities and Targets Achievements Assessment
(iii) Output 3: Improved drainage infrastructure Activity 6. Conduct awareness-raising community meetings using the local languages in Srinagar and Jammu. Target 9. Conduct three community meetings for 75 participants, 33% of them men, conducted in the subproject area and zone of influence of drainage construction in Srinagar and Jammu on the links between the maintenance of stormwater drains and personal and community hygiene and health.
(i) Five community meetings were conducted in Hindi and Urdu, aiming to establish links between the maintenance of stormwater drains and personal and community hygiene and health, three in one target town and two in the other.
(ii) 251 participated, 107 men or 42%.g
(iii) The topics of the meeting were (i) effective management of storm water drains and flash floods in the city, (ii) safe storage of drinking water, and (iii) conservation of water sources.
Activity 6 completed
Target 9 achieved
Activity 7. Ensure that the benefits of improved drainage services are felt by all households in the project areas. Target 10. About 30,000 households in Srinagar with about 83,000 women, 13% of them BPL households and 8% headed by women benefit from reduced flooding (aligned with DMF Output 3a).
(i) 41.77 km of drains were constructed under the project,h benefiting about 55,000 people, of which 47% are women, including 13% from BPL households, and 8% from households headed by women.d,i
Activity 7 achieved
Target 10 achieved
Output 4: Institutional capacity strengthened
Activity 8. Conduct gender sensitization workshops for project staff and government officials in the ULBs, municipalities, PHED, UEED). Target 11. Conduct at least four gender sensitization workshops, two each in Jammu and Srinagar, targeting 33% women staff. Target 12. Sensitize at least 200 government officials on gender issues.
(i) Four workshops for project staff were conducted, two each in Jammu and Srinagar; 433 government officials from ULBs, municipalities, and line
departments attended the workshops, of which 19% are women; all 84
available women staff participated.j (ii) The topics covered in the workshops include (i) gender inequality issues in
water supply, sanitation, including sewage management, solid waste management, and urban transport; (ii) strategies for the reasonable participation of women and prioritization of their needs in planning and implementation of urban projects; and (iii) tools to achieve equitable participation by men and women in decision-making processes.
Activity 8 completed
Target 11 not achieved
Target 12 achieved
Activity 9. Develop project-specific PSAs. Target 13. Erect six PSAs on billboards in
(i) Six billboards were erected in strategic places, and 10 PSAs were published in newspapers.
(ii) The messages carried in the PSAs and press advisories were (i) project
Activity 9 completed
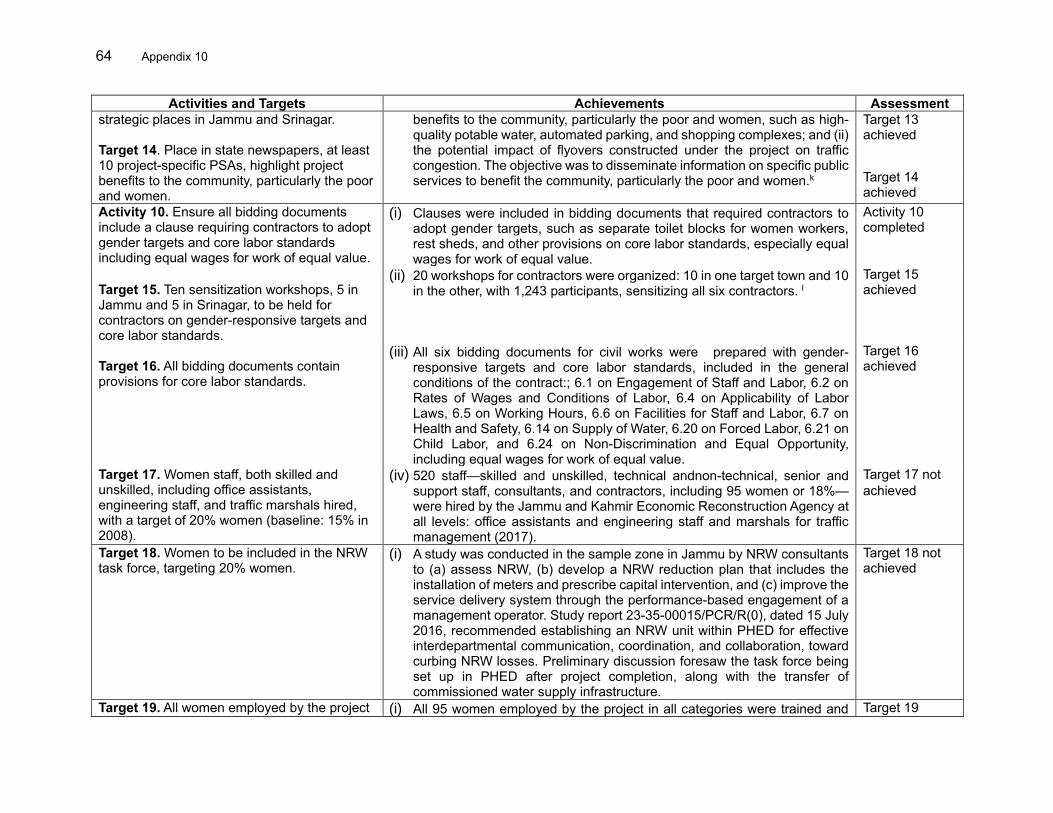
64 Appendix 10
Activities and Targets Achievements Assessment
strategic places in Jammu and Srinagar. Target 14. Place in state newspapers, at least 10 project-specific PSAs, highlight project benefits to the community, particularly the poor and women.
benefits to the community, particularly the poor and women, such as high-quality potable water, automated parking, and shopping complexes; and (ii) the potential impact of flyovers constructed under the project on traffic congestion. The objective was to disseminate information on specific public services to benefit the community, particularly the poor and women.k
Target 13 achieved
Target 14 achieved
Activity 10. Ensure all bidding documents include a clause requiring contractors to adopt gender targets and core labor standards including equal wages for work of equal value.
(i) Clauses were included in bidding documents that required contractors to adopt gender targets, such as separate toilet blocks for women workers, rest sheds, and other provisions on core labor standards, especially equal wages for work of equal value.
Activity 10 completed
Target 15. Ten sensitization workshops, 5 in Jammu and 5 in Srinagar, to be held for contractors on gender-responsive targets and core labor standards.
(ii) 20 workshops for contractors were organized: 10 in one target town and 10 in the other, with 1,243 participants, sensitizing all six contractors. l
Target 15 achieved
Target 16. All bidding documents contain provisions for core labor standards.
(iii) All six bidding documents for civil works were prepared with gender-responsive targets and core labor standards, included in the general conditions of the contract:; 6.1 on Engagement of Staff and Labor, 6.2 on Rates of Wages and Conditions of Labor, 6.4 on Applicability of Labor Laws, 6.5 on Working Hours, 6.6 on Facilities for Staff and Labor, 6.7 on Health and Safety, 6.14 on Supply of Water, 6.20 on Forced Labor, 6.21 on Child Labor, and 6.24 on Non-Discrimination and Equal Opportunity, including equal wages for work of equal value.
Target 16 achieved
Target 17. Women staff, both skilled and unskilled, including office assistants, engineering staff, and traffic marshals hired, with a target of 20% women (baseline: 15% in 2008).
(iv) 520 staff—skilled and unskilled, technical andnon-technical, senior and support staff, consultants, and contractors, including 95 women or 18%—were hired by the Jammu and Kahmir Economic Reconstruction Agency at all levels: office assistants and engineering staff and marshals for traffic management (2017).
Target 17 not
achieved
Target 18. Women to be included in the NRW task force, targeting 20% women.
(i) A study was conducted in the sample zone in Jammu by NRW consultants to (a) assess NRW, (b) develop a NRW reduction plan that includes the installation of meters and prescribe capital intervention, and (c) improve the service delivery system through the performance-based engagement of a management operator. Study report 23-35-00015/PCR/R(0), dated 15 July 2016, recommended establishing an NRW unit within PHED for effective interdepartmental communication, coordination, and collaboration, toward curbing NRW losses. Preliminary discussion foresaw the task force being set up in PHED after project completion, along with the transfer of commissioned water supply infrastructure.
Target 18 not achieved
Target 19. All women employed by the project (i) All 95 women employed by the project in all categories were trained and Target 19
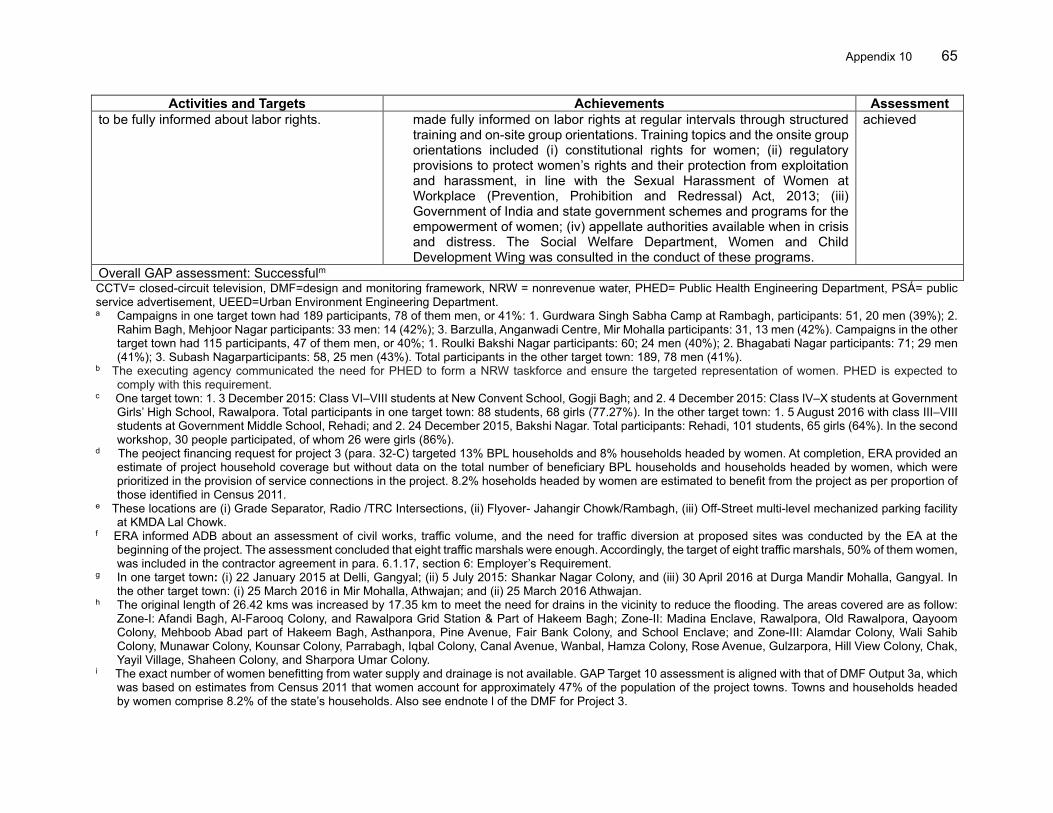
Appendix 10 65
Activities and Targets Achievements Assessment
to be fully informed about labor rights. made fully informed on labor rights at regular intervals through structured training and on-site group orientations. Training topics and the onsite group orientations included (i) constitutional rights for women; (ii) regulatory provisions to protect women’s rights and their protection from exploitation and harassment, in line with the Sexual Harassment of Women at Workplace (Prevention, Prohibition and Redressal) Act, 2013; (iii) Government of India and state government schemes and programs for the empowerment of women; (iv) appellate authorities available when in crisis and distress. The Social Welfare Department, Women and Child Development Wing was consulted in the conduct of these programs.
achieved
Overall GAP assessment: Successfulm CCTV= closed-circuit television, DMF=design and monitoring framework, NRW = nonrevenue water, PHED= Public Health Engineering Department, PSÁ= public service advertisement, UEED=Urban Environment Engineering Department. a Campaigns in one target town had 189 participants, 78 of them men, or 41%: 1. Gurdwara Singh Sabha Camp at Rambagh, participants: 51, 20 men (39%); 2.
Rahim Bagh, Mehjoor Nagar participants: 33 men: 14 (42%); 3. Barzulla, Anganwadi Centre, Mir Mohalla participants: 31, 13 men (42%). Campaigns in the other target town had 115 participants, 47 of them men, or 40%; 1. Roulki Bakshi Nagar participants: 60; 24 men (40%); 2. Bhagabati Nagar participants: 71; 29 men (41%); 3. Subash Nagarparticipants: 58, 25 men (43%). Total participants in the other target town: 189, 78 men (41%).
b The executing agency communicated the need for PHED to form a NRW taskforce and ensure the targeted representation of women. PHED is expected to comply with this requirement.
c One target town: 1. 3 December 2015: Class VI–VIII students at New Convent School, Gogji Bagh; and 2. 4 December 2015: Class IV–X students at Government Girls’ High School, Rawalpora. Total participants in one target town: 88 students, 68 girls (77.27%). In the other target town: 1. 5 August 2016 with class III–VIII students at Government Middle School, Rehadi; and 2. 24 December 2015, Bakshi Nagar. Total participants: Rehadi, 101 students, 65 girls (64%). In the second workshop, 30 people participated, of whom 26 were girls (86%).
d The peoject financing request for project 3 (para. 32-C) targeted 13% BPL households and 8% households headed by women. At completion, ERA provided an estimate of project household coverage but without data on the total number of beneficiary BPL households and households headed by women, which were prioritized in the provision of service connections in the project. 8.2% hoseholds headed by women are estimated to benefit from the project as per proportion of those identified in Census 2011.
e These locations are (i) Grade Separator, Radio /TRC Intersections, (ii) Flyover- Jahangir Chowk/Rambagh, (iii) Off-Street multi-level mechanized parking facility at KMDA Lal Chowk.
f ERA informed ADB about an assessment of civil works, traffic volume, and the need for traffic diversion at proposed sites was conducted by the EA at the beginning of the project. The assessment concluded that eight traffic marshals were enough. Accordingly, the target of eight traffic marshals, 50% of them women, was included in the contractor agreement in para. 6.1.17, section 6: Employer’s Requirement.
g In one target town: (i) 22 January 2015 at Delli, Gangyal; (ii) 5 July 2015: Shankar Nagar Colony, and (iii) 30 April 2016 at Durga Mandir Mohalla, Gangyal. In the other target town: (i) 25 March 2016 in Mir Mohalla, Athwajan; and (ii) 25 March 2016 Athwajan.
h The original length of 26.42 kms was increased by 17.35 km to meet the need for drains in the vicinity to reduce the flooding. The areas covered are as follow: Zone-I: Afandi Bagh, Al-Farooq Colony, and Rawalpora Grid Station & Part of Hakeem Bagh; Zone-II: Madina Enclave, Rawalpora, Old Rawalpora, Qayoom Colony, Mehboob Abad part of Hakeem Bagh, Asthanpora, Pine Avenue, Fair Bank Colony, and School Enclave; and Zone-III: Alamdar Colony, Wali Sahib Colony, Munawar Colony, Kounsar Colony, Parrabagh, Iqbal Colony, Canal Avenue, Wanbal, Hamza Colony, Rose Avenue, Gulzarpora, Hill View Colony, Chak, Yayil Village, Shaheen Colony, and Sharpora Umar Colony.
i The exact number of women benefitting from water supply and drainage is not available. GAP Target 10 assessment is aligned with that of DMF Output 3a, which was based on estimates from Census 2011 that women account for approximately 47% of the population of the project towns. Towns and households headed by women comprise 8.2% of the state’s households. Also see endnote l of the DMF for Project 3.
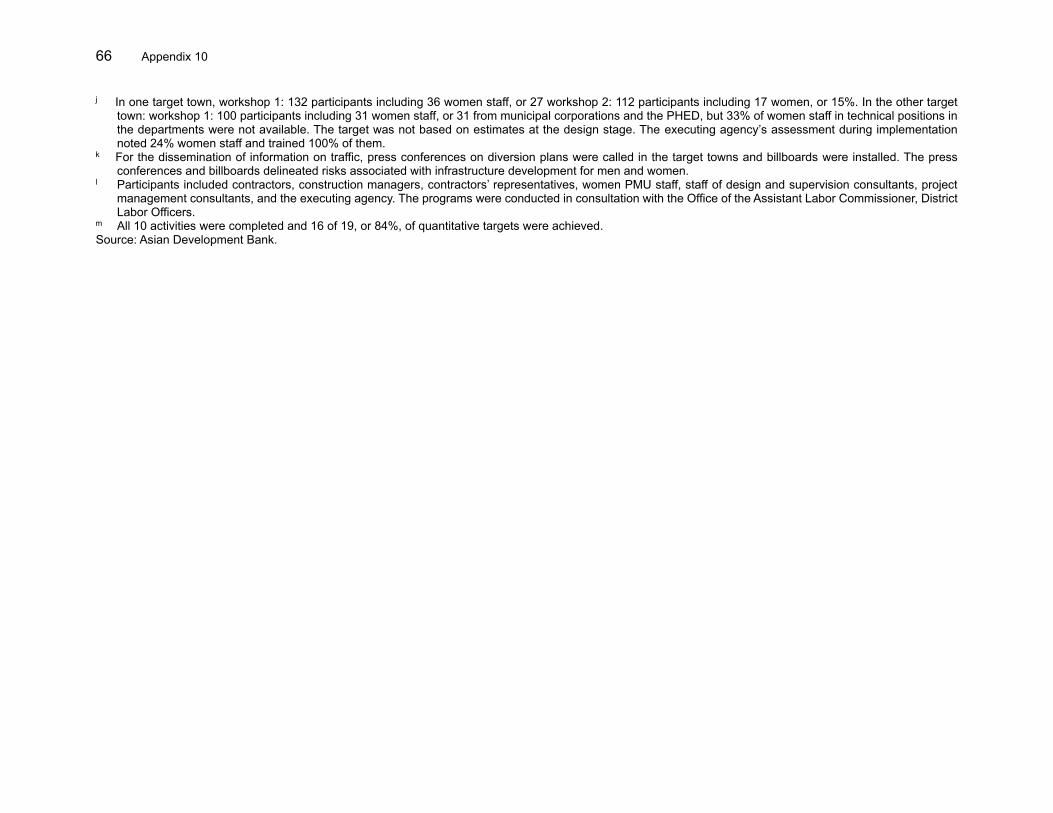
66 Appendix 10
j In one target town, workshop 1: 132 participants including 36 women staff, or 27 workshop 2: 112 participants including 17 women, or 15%. In the other target town: workshop 1: 100 participants including 31 women staff, or 31 from municipal corporations and the PHED, but 33% of women staff in technical positions in the departments were not available. The target was not based on estimates at the design stage. The executing agency’s assessment during implementation noted 24% women staff and trained 100% of them.
k For the dissemination of information on traffic, press conferences on diversion plans were called in the target towns and billboards were installed. The press conferences and billboards delineated risks associated with infrastructure development for men and women.
l Participants included contractors, construction managers, contractors’ representatives, women PMU staff, staff of design and supervision consultants, project management consultants, and the executing agency. The programs were conducted in consultation with the Office of the Assistant Labor Commissioner, District Labor Officers.
m All 10 activities were completed and 16 of 19, or 84%, of quantitative targets were achieved. Source: Asian Development Bank.
Appendix 10 67
F. LESSONS LEARNED 10. The GAP responded to gender issues identified during the project design phase, such as lower rate of participation and representation of women in community activities. The project’s gender strategy ensured equal benefit for women from the water supply services, public transport, and drainage improvement. The GAP achievements strengthened the project’s relevance. The analysis of sex-disaggregated project results found gender actions included in the project objectives relevant and commensurate with key issues identified at appraisal. Gender was mainstreamed in project design and implementation. The overall GAP implementation is effective as, in sum, 100% of the activities in the GAP were completed and 100% of the 18 quantitative targets of the GAP and DMF outputs were achieved. Further, an assessment of quantitative data and the lessons learned from the previous tranche of the facility show that the project gender strategy contributed highly toward gender equality and women’s empowerment in the project influence area, and so can be rated likely sustainable. A list of practical and strategic gender benefits is drawn from the GAP achievements matrix and testimonials shared by women beneficiaries (Section E). These benefits have set a precedent regarding women’s participation in urban sector projects in the state, which was formerly limited for lack of any mechanism and institutional drive toward gender equality and women’s empowerment, as well as conservative norms restricting social mobility. However, for the sustained promotion of gender equality and women’s empowerment, one crucial course of action is for the implementing agency and other line departments, government schemes, and programs, to continue pursuing initiatives to promote gender equality and women’s empowerment beyond the MFF. 11. The non-achievement of some targets could have been avoided if remedial actions were done during the project mid-term review mission (MTR). Specifically, the agreed relegation of the setting up of the NRW task force to the PHED and the agreed reduction of the target number of women marshals should have been formally documented or reflected in the MTR aide memoire. This lesson underscores the need to regularly monitor the GAP progress to identify unrealistic targets and for the ADB responsible gender officer or assigned consultant to participate in the MTR mission to raise corrective measures.
68 Appendix 11
SAFEGUARDS ASSESSMENTS
1. Safeguards categorization. The project 1 of the multitranche financing facility (MFF) was classified as B sensitive for environment, while projects 2 and 3 were category B. In case of involuntary resettlement, the projects 1 and 3 of the MFF were classified as category B,1 while project 2 was category A.2 For indigenous peoples, the MFF and all its tranches were classified as category C. 2. Safeguard implementation arrangements. An officer of the rank of the chief engineer deputed as the director of safeguards in the Economic Reconstruction Agency (ERA) was supported by four environmental and resettlement experts responsible for implementing safeguard requirements. Two officers from the state revenue department were posted as land acquisition officers. In addition, safeguard experts from the program management consultant and two design and supervision consultants provided support toward effectively implementing safeguards requirements and monitoring implementation. The civil works contractors had designated environment officers at their worksites. The state government constituted a high-powered committee titled the Divisional Level Committee (DLC) in May 2011 for fast-tracking the implementation of the resettlement plan/s for subprojects being executed by ERA under project 2 and 3. Regular training programs were conducted for ERA and contractor staff for safeguard implementation and monitoring. Overall institutional arrangements for managing safeguards are assessed adequate. A. Social Safeguard Assessment
3. The resettlement framework and indigenous peoples planning framework were prepared for the MFF facility but revised during loan processing to be consistent with safeguard policy statement, 2009. 3
4. Land acquisition was undertaken as per the State Land Acquisition Act 1990 (1934 AD) which also has a provision for negotiated purchase. This resulted in better bargain for the landowners who agreed to negotiate and were compensated for land value based on actual market price/replacement cost. Small alignment/design changes during implementation helped minimize resettlement impacts, in line with a key Asian Development Bank (ADB) principle to avoid and minimize resettlement impacts. Formation of the DLC made decisions regarding payment of compensation faster, transparent, and acceptable to all, particularly for the Category A subproject under project 2. For compensation payments that could not be made due to court cases or missing affected person, ERA adopted the escrow account route in projects 1 and 2, which facilitated project implementation while protecting the entitlements of the affected persons.4 As indicated by ERA, reviews, suggestions, and guidance provided by ADB missions from time
1 At appraisal project 1 was classified category A for involuntary resettlement and a full resettlement plan was prepared
for BC Road Flyover subproject. However, the resettlement plan was not implemented as the subproject was dropped from project 1 scope and all transport subprojects were moved to project 2.
2 Project 1 of the MFF was categorized and implemented as per ADB. 2002. Environmental Policy of the Asian Development Bank. Manila; ADB. 1995. Involuntary Resettlement. Manila; and ADB. 1998. The Bank’s Policy on Indigenous Peoples. Manila. The subprojects for constructing solid waste landfill sites at Achan under project 1, were categorized environmental category B sensitive.
3 The ADB Safeguards Policy Statement (SPS) applies to tranches of multitranche financing facility (MFF) projects for which periodic financing requests are approved by ADB Management after 20 January 2010. Tranche 2 and 3 subprojects required compliance with the SPS for environment, resettlement, and indigenous people.
4 PMU confirmed that under project 1, the amount (₹21.08 million) deposited in the escrow account towards pending compensation payments awaits the decision of the High Court. PMU also confirmed that the compensation amount for the affected person under project 2 who could not be traced, is also deposited in the escrow account.
Appendix 11 69
to time during the MFF implementation were crucial for adherence to safeguard policy requirements and compliance to loan covenants. The suggestions were implemented by the project management unit, which supported the proper implementation and documentation of safeguard policy requirements. While safeguard management in terms of institutional arrangements, information disclosure, consultations, project staff capacity building, and regular submission of semiannual safeguard monitoring reports—was generally satisfactory, there is an outstanding issue of pending compensation payments to 35 affected persons and one temple trust (common property resource owner) for one drainage subproject under project 2 as land ownership could not be established.5 A complaint received from one of the 35 affected persons regarding non-payment of compensation is pending resolution for the same reason. A corrective action related to payment of pending compensation payments under the drainage subproject under project 2 was discussed and agreed by ERA with ADB, to be accomplished by July 2021. Safeguards compliance under project 1 and project 3 is rated as effective, while pending the required corrective action, safeguards compliance for project 2 is rated less than effective.
5. Under project 3, three Resettlement Plans were prepared reviewed, cleared, and disclosed by ADB and ERA on their websites in accordance with the Safeguard Policy Statement, 2009 and government requirements. Out of the three resettlement plans, one was prepared for water supply, one for transport/parking, and one for drainage. All involuntary resettlement impacts were insignificant. Other contract packages of project 3 did not have any resettlement impacts. Impacts from the parking facility subproject was limited to relocation of one squatter business (tea stall), impact from the water supply subproject was limited to temporary income loss, and impacts from the drainage subproject include 0.26 hectare of private land acquisition (three land parcels at different locations, negotiated settlement) belonging to three households (22 affected persons). The three land parcels were vacant with no structures or use. During implementation, the land was obtained through negotiated settlement and owners were paid market value of their land. In case of water supply project, all temporary impacts on businesses were avoided during water supply pipe laying and one affected person (an informal tea stall operator) could not be traced during execution of the parking. Safeguard compliance management for project 3—including institutional arrangements, information disclosure, consultations, grievance redressal, project staff capacity building, and regular submission of semiannual safeguard monitoring reports—was rated generally satisfactory. 6. Indigenous Peoples. No impacts on indigenous peoples were identified at the time of project appraisal, and none were affected during implementation of the entire MFF comprising the three projects. 7. Information disclosure and grievance redress. Information disclosure and consultation activities for the implementation of safeguards were effectively carried out within the MFF including project 3. Such activities included (i) distribution and dissemination of safeguard summaries and related information through public information brochures in Urdu and Hindi to affected households, (ii) regular consultation meetings with affected households and other stakeholders during project implementation, (iii) monitoring, (iv) the disclosure of safeguards documents, and (v) regular field visits to the shopping complexes (constructed for rehabilitation of shops affected by the Jehangir Chowk subproject) along with the affected persons and all concerned officials including from line departments. A grievance redress mechanism was set up in accordance with the agreed frameworks to address any project-related grievances from affected people.
5 A corrective action plan was agreed to be implemented by ERA by July 2021 to ensure compensation payment to all
affected persons under one subproject.
70 Appendix 11
8. Monitoring and reporting. Internal safeguards monitoring reports adequately captured
the status of safeguard implementation and were submitted periodically. External monitoring of
social safeguard requirements was undertaken during project 2 implementation. 6 Bi-annual
environmental and social safeguards monitoring reports were timely submitted to ADB and duly
disclosed.
9. Implementation challenges. The implementation of the involuntary resettlement category A subproject under project 2 posed some implementation challenges especially related to social safeguards due to urban complexities and magnitude of construction activities. The challenges were successfully negotiated.
(i) All utility shifting including shifting of boundary walls etc. prior to contract award would have helped deliver projects in a timely, responsive, and efficient manner. However, safeguard team established communication channels with multiple stakeholders and used the DLC platform during project execution and successfully arrived at agreed settlement of all such issues.
(ii) Under project 2, affected business operators had apprehension about the preferential treatment regarding allotment of new shops at the shopping complexes. This was successfully negotiated in a transparent manner through the draw of lots in the presence of state administrative machinery. All shops were allotted as per the draw of lots.
(iii) Impact of restricted traffic movement and the loss of clientele of the shops in certain sections during construction of the flyover was mitigated through prior information disclosure in the local newspapers and night work at marketplaces. This process helped ensure continued business activity, without affecting the construction schedule.
(iv) Payment of non-titleholders was an issue as the State Land Acquisition Act 1990 (1934 AD) did not recognize entitlement of non-title holders. The resettlement framework and loan covenants were successfully invoked through the DLC platform and non-titleholders were paid the compensation amounts due to them as per the entitlement matrix adopted for the project.
10. Lessons learnt. The following important lessons regarding involuntary resettlement emerged from the project:
(i) Resettlement impacts are possible to reduce substantially by making small alignment/design modifications during implementation, and such changes are possible when safeguards team works in close coordination with project engineers involved in design and supervision.
(ii) The formation and active involvement of high-powered committees like DLC makes decisions regarding payment of compensation faster, transparent, and acceptable to all and should be utilized.
(iii) Lessons from grievance resolution in the category A subproject should have been drawn upon and the DLC platform utilized for all subprojects involving land acquisition and resettlement to facilitate grievance redress and timely implementation of resettlement plans.
(iv) Meaningful consultations can smoothen the process of resettlement and rehabilitation. The construction of the shopping complexes from the early stages of the project at
6 External monitoring was conducted by qualified firms through competitive bidding. Qualified NGOs with resettlement
and rehabilitation experience were not available in the state.
Appendix 11 71
two locations and involvement of shopkeepers in the process created positivity around the project and displayed credibility and commitment of the executive agency which led to smooth relocation of shops.
(v) Establishment of a land acquisition collector office within the project management unit is beneficial, especially to deal with involuntary resettlement category A subprojects.
(vi) Creation of an escrow account offers a practical solution when the project hits an implementation hurdle be it failed negotiation, or for other reasons.
B. Environment Safeguard Assessment
11. For project 3, five initial environmental examinations were prepared and disclosed on ADB and ERA websites in accordance with the Environmental Assessment and Review Framework and ADB’s Safeguard Policy Statement, 2009. No significant environmental impacts were anticipated throughout the MFF including project 3 at appraisal and none emerged during implementation. Project locations were outside sensitive areas and impacts during construction and operation were avoided and/or mitigated through measures outlined in the environmental management plans (EMPs), which were part of the civil works contracts. A summary of key environmental impacts and parameters which were closely monitored during construction include: (i) traffic management and disturbance to residents and businesses, (ii) occupational and community health and safety especially during trenching works, (iii) air and noise quality in populated areas, and (iv) meaningful and ongoing public consultations with surrounding communities. The ERA had strong and demonstrated capacity to implement environmental safeguards and was supported by consultants to monitor EMP implementation during construction activities. The ERA submitted semiannual environmental monitoring reports to ADB.The project introduced the environmental compliance certification process as part of every contractor’s progress claim which facilitated and helped promote environmental performance. In case of any non-adherence with agreed EMP provisions by the construction agencies, appropriate amounts from their invoices were withheld until environmental performance was improved. The practice of deducting a percentage of the billed amount, rather than withholding the entire amount, served as an incentive for improving the environmental performance, without causing undue cash flow stress on the smaller contractors. This practice was followed since project 1 and continued through subsequent tranches including project 3. ERA established an in-house monitoring infrastructure for testing of environmental parameters. ERA procured two vans and converted those into mobile monitoring stations with all required equipment for carrying out monitoring and testing of ambient air quality, noise levels and water quality. It also engaged technical personnel for analysis (in the stations as well as in the laboratory established in ERA premises) through the project management consultant. Subsequently, the mobile monitoring stations were also used by the other line departments. ERA developed these best practices within the system which stimulated regular environmental monitoring aspects. The objectives of the environment management plans were adequately achieved, and no outstanding issues were reported. The project has the potential to improve environmental and health conditions with well-maintained facilities. 12. Conclusion and lessons learned. Extensive consultations with stakeholders conducted during implementation enabled successful project implementation. Suggestions and guidance provided by ADB missions from time to time on environmental aspects were implemented by project authorities, which supported the proper implementation and documentation of safeguard policy requirements. The practice of issuing environmental certification improved the environmental performance of contracts and was carried over throughout the MFF. Other projects should consider the novel practice of establishing in-house monitoring and testing infrastructure through well-equipped mobile monitoring stations and trained staff.
72 Appendix 12
ECONOMIC AND FINANCIAL ANALYSIS A. Re-evaluation scope, methodology, and data input 1. The economic internal rates of return (EIRR) to ascertain project efficiency for water supply, sewerage, drainage, and urban transport for the interventions of the operating agencies of the target towns were assessed upon completion of project 3,1 and compared with appraisal estimates for (i) three water supply packages;2 (ii) one drainage package;3 (iii) one transport package; 4 (iv) one sewerage package; 5 and (iii) one semi-mechanized multilevel parking package.6 Economic evaluation for the project 3 as a whole were also undertaken to determine the accumulative economic significance. Economic re-evaluation also includes sensitivity analysis, at a 20% reduction of future benefits. 2. Financial analysis assessed the ability of the urban local bodies (ULBs) and the state agencies to meet its operation and maintenance (O&M) costs out of its revenue streams. The analysis was undertaken on (i) the Municipal Corporation for the parking facility; (ii) the state’s Public Health Engineering Department (PHED) which operates the water supply system; (iii) the state’s Public Works Department (PWD) which operates the flyovers; and (iv) the state’s Housing and Urban Development Department (HUDD) which operates the sewerage and drainage facility. At loan appraisal, financial viability evaluation of project 3 to determine the financial internal rate of return (FIRR) was carried out in respect of revenue generating subprojects namely for water supply and parking facility. 7 This was assuming that the targets set under the revenue enhancement plan would be implemented to meet O&M costs and capital cost recovery. Although these have been partially implemented, O&M of the water supply and parking facility are still largely dependent on government grants, thus are considered not self-sufficient despite collection of user charges. 3. As project 3 could also not achieve capital cost recovery, operating ratios were calculated for the state government finances, and a review of the overall finances of PHED, PWD, HUDD, and the municipal corporations were undertaken to determine the overall capacity to meet the O&M expenditure. The water supply, sewerage and drainage, flyover, and mechanized parking assets developed under project 3 are considered not self-sufficient despite collection of user charges.
1 Project 3 is the intervention of the state government towards the large scale and comprehensive urban basic
infrastructure improvement under multitranche financing facility and comprised of three water supply subprojects, one drainage subproject, one flyover with one grade separator subproject, one semi-mechanized multilevel parking subproject, and one sewerage (balance works of project 1) subproject. Targeted benefits were achieved under project 3.
2 The water supply intervention included completion of (i) rehabilitation of distribution network of 287 kilometers (km, at appraisal) with revised target of 155 km, new distribution network pipeline of 22 km (at appraisal)—revised target of 0 kms; (ii) new pipeline for nonrevenue water reduction—18.1 km of distribution pipeline network, metering of 4,300 connections with revised target of 3,500 house service connections, and supervisory control and data acquisition system (not in appraisal) including bulk flow meters; and (iii) bulk water pipeline of 18.5 km. (source: EA-PCR).
3 Drainage intervention included completion of 26.32 km—achieved 41.77 km. Additional km benefitted about 23,400 people.
4 Transport intervention included one bridge and one grade separator (changed from two grade separators planned at appraisal).
5 Balance works of project 1 sewerage subproject included 105 km of sewerage network and 20,000 house service connections.
6 One semi-mechanized multilevel parking facility for 720 light commercial vehicles (at appraisal) with revised target of 352 light commercial vehicles with capacity for two-wheelers etc. remaining same as at appraisal.
7 Source: Periodic Financing Request (PFR) for project 3: bulk water supply system FIRR was assessed at 3.8%, and parking facility FIRR assessed at 4.3% as against the assessed weighted average cost of capital of 1.87%.
Appendix 12 73
4. The economic and financial analysis was based on Asian Development Bank’s (ADB) Guidelines for the Economic Analysis of Projects (2017), Guidelines for the Economic Analysis of Water Supply Projects (1998), and TGN Financial Analysis and Evaluation (2019). Detailed assumptions for the analyses narrated separately. Data from the state agencies (PHED, PWD, and HUDD), the Municipal Corporation, reports of Technical Assistance to India for the Preparation of the MFF (PPTA-4515-IND), and the project completion report prepared by the Economic Reconstruction Agency (ERA) were used for the analyses. Project costs were derived from the actual yearly expenditure summary for each package by the state government for both ADB loan and the state government’s counterpart funding. 5. The financial value of subproject costs (₹ millions) include the yearly expenditure incurred by the state government (comprising both ADB loan and counterpart contribution) until November 2017.8 At completion of project 3, the financial costs concluded at (i) ₹1,456.8 million for water supply subproject; (ii) ₹1,768.3 million for drainage subproject; (iii) ₹553.6 million for transport subproject; (iv) ₹467.7 million for semi-mechanized multilevel parking subproject; and (v) ₹1,289.9 million for balance—works of sewerage subproject that did not complete under project 1. There were minor changes in scope during implementation to address ground realities,9 the disastrous flood of 2014, and to avoid duplication with the ongoing national and state programs. At completion, ADB loan size was reduced to $45.08 million from the appraisal estimate of $60.0 million.
B. Economic Evaluation Methodology 6. For the purpose of economic analysis, the actual financial cost is first re-evaluated at the current year 2021 prices10 and then converted into economic costs by applying prescribed conversion rates, adjusting for contingencies, taxes, and duties but excluding the financing costs of interest during construction and commitment charges.
1. At Appraisal 7. The selection criteria for the subprojects require an EIRR exceeding economic opportunity cost of capital (EOCC) of 12% for investments under project 3. The economic net present value (ENPV) for subprojects, assessed during loan appraisal in 2013, were positive, applying discount rates of 12%. Sensitivity analysis indicated that EIRR was most sensitive to capital costs overrun and delays in realization of benefits. 8. At appraisal, the subprojects that were considered for the economic evaluation and the resultant EIRR (base case) were: (i) 35.3%, 22.2% and 15.7% for three water supply packages; (ii) 16.5% for the drainage package; (iii) 26.0% for one package for a bridge and a grade
8 Project 3 closed on 30 May 2017 and financially closed in February 2018. In case of all subprojects, except for car
parking subproject, the expenditures incurred up to FY2019–2020, as provided by ERA, were considered for analysis at completion.
9 The scope changes are (i) water supply distribution pipelines rehabilitation reduced from 287 km to 155 km as per suggestion of PHED, (ii) 22 kilometers of new pipelines not constructed, (iii) Increase in length of drains from 26.32 km to 41.77 km. Changes in scope did reduce the number of beneficiaries in case of water supply—250,000 beneficiaries as against originally estimated—282,125. In case of drainage project, the number of beneficiaries increased by 24,000 due to increase in length of drains actually constructed. Within the project period, the implementation of subproject(s) was delayed by 1 to 2 years. All subprojects as on date are completed and operative.
10 Wholesale price indices published by Government of India were used for this purpose. Government of India, MINISTRY OF COMMERCE & INDUSTRY, 2020. https://eaindustry.nic.in/download_data_1112.asp (Downloaded on 13 December 2020)
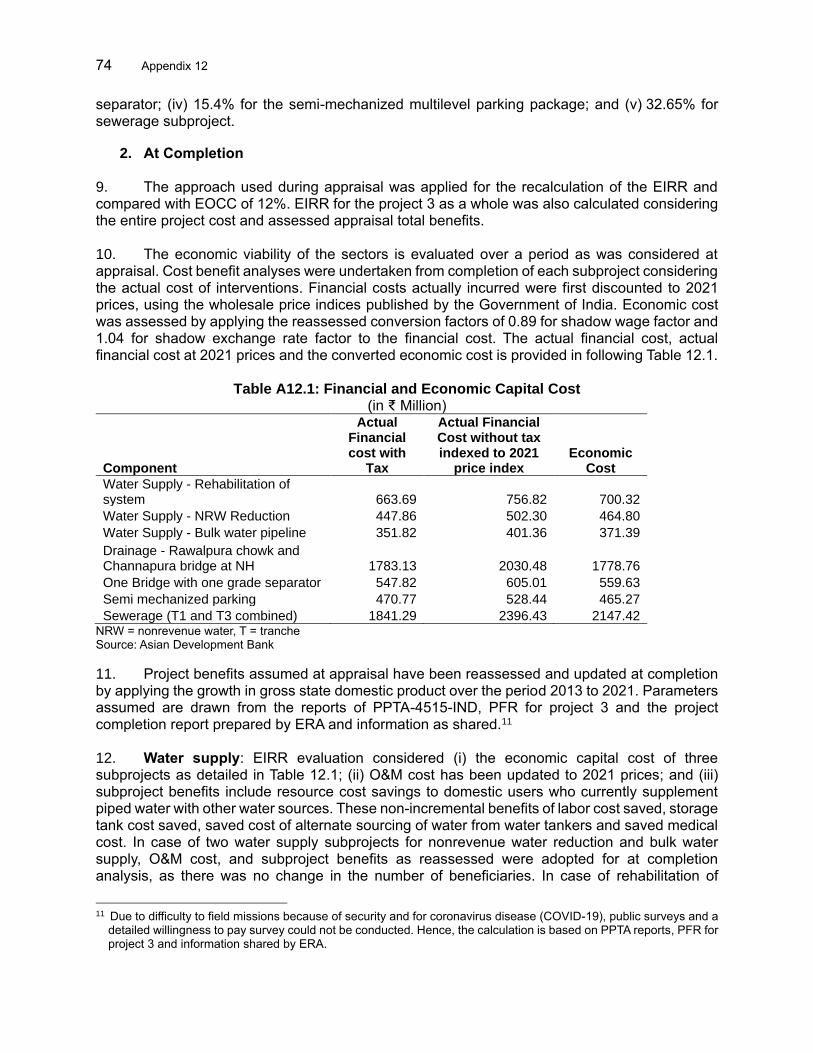
74 Appendix 12
separator; (iv) 15.4% for the semi-mechanized multilevel parking package; and (v) 32.65% for sewerage subproject.
2. At Completion 9. The approach used during appraisal was applied for the recalculation of the EIRR and compared with EOCC of 12%. EIRR for the project 3 as a whole was also calculated considering the entire project cost and assessed appraisal total benefits. 10. The economic viability of the sectors is evaluated over a period as was considered at appraisal. Cost benefit analyses were undertaken from completion of each subproject considering the actual cost of interventions. Financial costs actually incurred were first discounted to 2021 prices, using the wholesale price indices published by the Government of India. Economic cost was assessed by applying the reassessed conversion factors of 0.89 for shadow wage factor and 1.04 for shadow exchange rate factor to the financial cost. The actual financial cost, actual financial cost at 2021 prices and the converted economic cost is provided in following Table 12.1.
Table A12.1: Financial and Economic Capital Cost
(in ₹ Million)
Component
Actual Financial cost with
Tax
Actual Financial Cost without tax indexed to 2021
price index Economic
Cost
Water Supply - Rehabilitation of system 663.69 756.82 700.32
Water Supply - NRW Reduction 447.86 502.30 464.80
Water Supply - Bulk water pipeline 351.82 401.36 371.39
Drainage - Rawalpura chowk and Channapura bridge at NH 1783.13 2030.48 1778.76
One Bridge with one grade separator 547.82 605.01 559.63
Semi mechanized parking 470.77 528.44 465.27
Sewerage (T1 and T3 combined) 1841.29 2396.43 2147.42 NRW = nonrevenue water, T = tranche Source: Asian Development Bank
11. Project benefits assumed at appraisal have been reassessed and updated at completion by applying the growth in gross state domestic product over the period 2013 to 2021. Parameters assumed are drawn from the reports of PPTA-4515-IND, PFR for project 3 and the project completion report prepared by ERA and information as shared.11 12. Water supply: EIRR evaluation considered (i) the economic capital cost of three subprojects as detailed in Table 12.1; (ii) O&M cost has been updated to 2021 prices; and (iii) subproject benefits include resource cost savings to domestic users who currently supplement piped water with other water sources. These non-incremental benefits of labor cost saved, storage tank cost saved, saved cost of alternate sourcing of water from water tankers and saved medical cost. In case of two water supply subprojects for nonrevenue water reduction and bulk water supply, O&M cost, and subproject benefits as reassessed were adopted for at completion analysis, as there was no change in the number of beneficiaries. In case of rehabilitation of
11 Due to difficulty to field missions because of security and for coronavirus disease (COVID-19), public surveys and a
detailed willingness to pay survey could not be conducted. Hence, the calculation is based on PPTA reports, PFR for project 3 and information shared by ERA.
Appendix 12 75
distribution network, the benefits at completion were adjusted for the reduction in actual beneficiaries—appraisal 282,125 and completion 250,000 by about 32,000 people. Average time per household for fetching water daily was estimated at 10 minutes and resulting labor cost saved valued at ₹126.73 per month per household. Average cost per household for procuring water of drinking quality estimated at ₹245.00 per kiloliter. Average savings on account of health expenditure estimated at ₹433.65 per month per household. Based on these assumptions, EIRR for water supply subproject was re-evaluated. 13. Drainage: EIRR evaluation considered (i) the economic capital cost of the subproject as detailed in Table 12.1; (ii) O&M cost has been updated to 2021 prices; and (iii) subproject benefits include resource cost savings such as health benefits due to reduced incidence of disease as well as time savings due to reduced water logging. Economic benefits of saved medical cost, saved flooding costs, reduced damage to road infrastructure, and reduced loss of income from commerce and industry as assessed during appraisal were updated at completion analysis. Average days of flooding days is estimated at 12 days per annum. Average monthly health care cost savings estimated at ₹530.02 per household for treating diarrhea and other waterborne diseases due to lack of drainage networks. Average annual loss of income is estimated at ₹4,903.1 per household due to incidence of water logging. Average reduced damage to road infrastructure is estimated at ₹0.51 million per kilometer. Average reduced loss of income to commerce and Industry is estimated at ₹5,859.00 per year per establishment. The O&M cost and subproject benefit as reassessed were adjusted for at completion analysis for the increase in the number of beneficiaries—31,866 people at appraisal and 55,286 people at completion, which is an increase of around 23,400 people. Based on these assumptions, EIRR for drainage subproject was re-evaluated. 14. Transport: EIRR evaluation considered (i) the economic capital cost of one subproject for one bridge and one grade separator as detailed in Table 12.1, (ii) O&M cost has been updated to 2021 prices, and (iii) subproject benefits of vehicle time savings and vehicle operating cost savings as assessed during appraisal were updated at completion analysis. The unit value of resource cost savings considered for analysis are: vehicle time savings ranging from ₹65.00 to ₹129.00 per vehicle hour and vehicle operating costs ranging from ₹2.00 to ₹31.15 per vehicle kilometers for different types of vehicles. Number and category of vehicles, two/three-wheeler, minibus, and car and trucks, as projected during appraisal were considered for analysis. Based on these assumptions, EIRR of the flyover subproject was re-evaluated. EIRR evaluation considered (i) the economic capital cost of one subproject as detailed in Table 12.1, (ii) O&M cost has been updated to 2021 prices, and (iii) subproject benefits of vehicle time savings and savings in vehicle operating costs as assessed during appraisal were updated at completion analysis. The unit value of resource cost savings considered for analysis are: (i) vehicle time savings ranging from ₹65.00 to ₹129.00 per vehicle hour, and (ii) vehicle operating costs ranging from ₹2.00 to ₹31.15 per vehicle kilometers for different types of vehicles. Number and category of vehicles, two/three-wheeler, minibus, and car, as projected during appraisal were considered for analysis. Subproject benefits were adjusted due to the reduction in the size of the car parking facility. At appraisal, it planned to accommodate 720 cars, while actual on completion accommodates only 352 cars with 164 two-wheelers. Based on these assumptions, EIRR of the parking facility subproject was re-evaluated. 15. Sewerage: Balance works of sewerage subproject under project 1 were taken up under project 3. EIRR evaluation considered the economic capital cost of the subproject (projects 1 and 3) as detailed in Table 12.1. O&M cost has been updated to 2021 prices and subproject benefits include resource cost savings such as health benefits due to reduced incidence of disease as well as time savings due to reduced water logging. Economic benefits of saved medical cost,
76 Appendix 12
saved flooding costs, and improvement in property value as assessed during appraisal were updated at completion analysis. Average monthly health care cost savings estimated at ₹530.02 per household for treating diarrhea and other water borne diseases due to lack of drainage networks. Average annual loss of income is estimated at ₹4,903.10 per household due to incidence of water logging. Average improvement in property value is estimated at reduced damage to road infrastructure is estimated ranging from ₹347.00 to ₹2,309.00 per year per property. Based on these assumptions, EIRR of the sewerage subproject was re-evaluated.
3. Analysis and Re-evaluation 16. Overall, the multitranche financing facility (MFF) and project 3 are rated efficient as all subprojects, except for one sewerage (under projects1 and 3 combined), one water supply subproject (under project 2), and one drainage subproject (under project 2), assessed under each of the individual projects achieved a higher EIRR on investment at completion against the EOCC of 12% threshold rate, set at appraisal. The overall EIRR for project 3, not assessed at appraisal, was assessed at completion as 14.8%. Institutional efficiencies and grievance redress mechanisms developed by ERA reduced transaction costs in process and time and improved transparency and accountability of governance accountability while significantly augmenting its administrative capacity. The MFF is rated as efficient, with the EIRR of the sector components of all projects estimated at 21.6% for water supply, 14.5% for the sewerage, drainage, and solid waste management, and 14.8% for the urban transport. The estimated EIRR of the facility is 15.8%. 17. Water supply. The EIRR at completion of project 3 for the three water supply packages were assessed to be 26.1%, 12.9% and 20.1% as compared to the appraisal estimate of 35.3%, 22.2%, and 15.7%. Field missions and discussions with households to update the willingness-to-pay survey were not possible due to local unrest and travel restrictions due to COVID-19. In case of all three subprojects, projected benefits could be realized. In case of one subproject, the EIRR at completion is higher than the appraisal due to reduced cost of project intervention. In case of two out of three subprojects there were implementation delay of one to two years compared to appraisal. 18. Drainage. For the drainage subproject, the EIRR at completion were assessed to be 15.4%, as compared to the appraisal estimate of 16.5%. Additional population of about 23,400 benefitted due to increase in the length of drains constructed at 41.77 km as compared to the 26.32 km envisaged at appraisal. Although there was increase in beneficiaries, the EIRR at completion is slightly lower than the appraisal due to cost increase and implementation delay of 2 years. 19. Transport. For the transport subproject for a bridge and a grade separator, the EIRR at completion stage was assessed at 15.4%, as compared to the appraisal estimate of 26.0%. EIRR at completion is lower than the appraisal due to cost increase from reinforcing the bridge structure and implementation delay of 2 years compared to appraisal. For the multilevel parking facility subproject, the EIRR at completion was assessed to be 13.2% compared to the appraisal estimate of 15.4%. Main reason for the completion EIRR being lower than the appraisal EIRR is the reduced number of parking facility for cars and no implementation delay. At appraisal, parking space for 720 cars was planned. However, revised target of actual completion was parking space for 352 cars, two-wheelers and others remaining the same. 20. Sewerage. For sewerage subproject, the EIRR at completion was assessed as 8.7%,
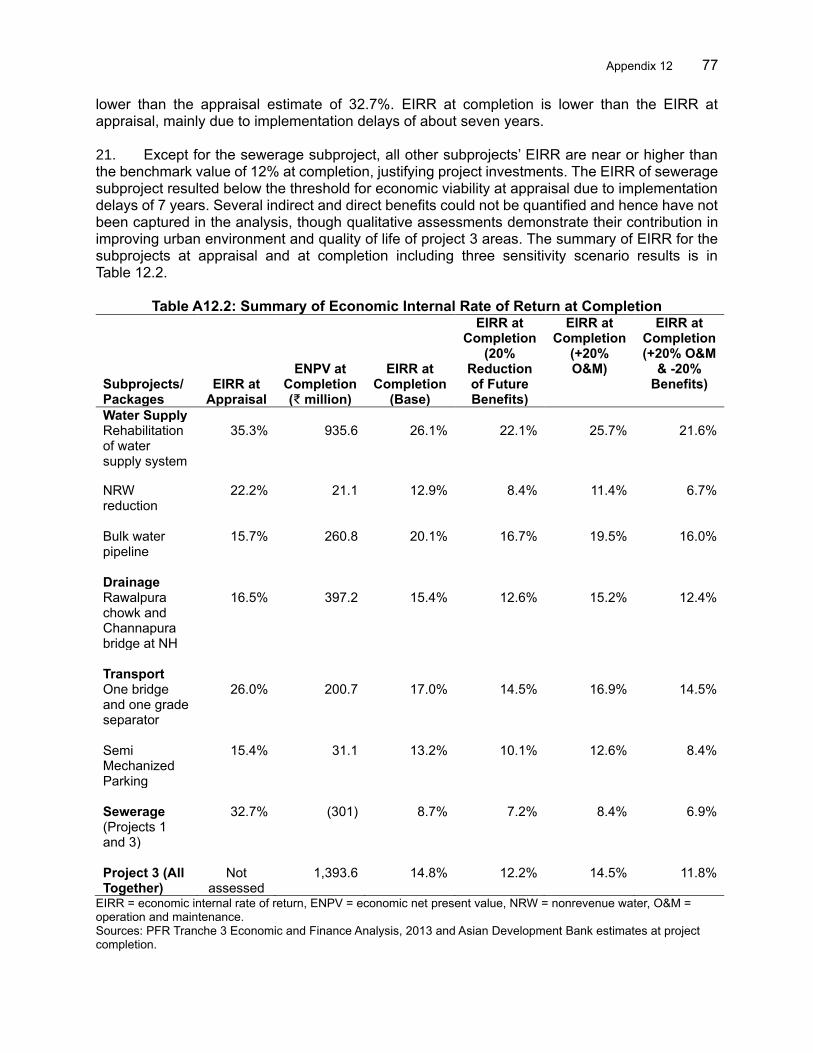
Appendix 12 77
lower than the appraisal estimate of 32.7%. EIRR at completion is lower than the EIRR at appraisal, mainly due to implementation delays of about seven years. 21. Except for the sewerage subproject, all other subprojects’ EIRR are near or higher than the benchmark value of 12% at completion, justifying project investments. The EIRR of sewerage subproject resulted below the threshold for economic viability at appraisal due to implementation delays of 7 years. Several indirect and direct benefits could not be quantified and hence have not been captured in the analysis, though qualitative assessments demonstrate their contribution in improving urban environment and quality of life of project 3 areas. The summary of EIRR for the subprojects at appraisal and at completion including three sensitivity scenario results is in Table 12.2.
Table A12.2: Summary of Economic Internal Rate of Return at Completion
Subprojects/Packages
EIRR at Appraisal
ENPV at Completion (₹ million)
EIRR at Completion
(Base)
EIRR at Completion
(20% Reduction of Future Benefits)
EIRR at Completion
(+20% O&M)
EIRR at Completion (+20% O&M
& -20% Benefits)
Water Supply Rehabilitation of water supply system
35.3% 935.6 26.1% 22.1% 25.7% 21.6%
NRW reduction Bulk water pipeline
22.2%
15.7%
21.1
260.8
12.9%
20.1%
8.4%
16.7%
11.4%
19.5%
6.7%
16.0%
Drainage Rawalpura chowk and Channapura bridge at NH
16.5% 397.2 15.4% 12.6% 15.2% 12.4%
Transport One bridge and one grade separator
26.0% 200.7 17.0% 14.5% 16.9% 14.5%
Semi Mechanized Parking
15.4% 31.1 13.2% 10.1% 12.6% 8.4%
Sewerage (Projects 1 and 3)
32.7% (301) 8.7% 7.2% 8.4% 6.9%
Project 3 (All Together)
Not assessed
1,393.6 14.8% 12.2% 14.5% 11.8%
EIRR = economic internal rate of return, ENPV = economic net present value, NRW = nonrevenue water, O&M = operation and maintenance. Sources: PFR Tranche 3 Economic and Finance Analysis, 2013 and Asian Development Bank estimates at project completion.

78 Appendix 12
22. In addition, analysis was carried out for the subprojects at the facility closure and a separate analysis for all facility costs at completion. At the end of the MFF, the economic viability of the sector interventions was reviewed for the three different projects under the MFF. It was observed that for the core interventions in all sectors, the returns were higher than the required 12%. The results are shown in Table A12.2 below.
Table A12.3: Summary of EIRR at Completion (Components and Facility)
Subprojects
ENPV at Completion (₹ million)
EIRR at Appraisal
EIRR at Completion
(Base)
EIRR at Completion
(20% Reduction of
Future Benefits)
EIRR at Completion
(+20% O&M)
EIRR at Completion
(+20% O&M & -
20% Benefits)
Water Supply
All projects combined 882.8
Not assessed 21.6% 18.0%
21.3%
17.6%
Sewerage, Drainage, and Solid Waste All projects combined 606.7
Not assessed 14.5% 11.8%
14.1%
11.3%
Urban Transport (Flyovers, Bridge, Grade Separator, and Parking) All projects combined 618.0
Not assessed 14.8% 12.2%
14.5%
11.9%
All Combined 2,107.6
Not assessed 15.8% 13.0%
15.4%
12.6
EIRR = economic internal rate of return, ENPV = economic net present value, O&M = operation and maintenance. Source: Asian Development Bank
C. Financial Evaluation
1. At Appraisal 23. At appraisal, financial viability evaluation of the project 3 while determining the financial internal rate of return (FIRR) was considered for water supply and mechanized parking subprojects, as these are revenue generating subjects. Other subprojects of project 3 were nonrevenue generating and hence FIRR was not assessed. For the two revenue generating subprojects, the FIRR at appraisal was more than the weighted average cost of capital at 1.87%. Emphasis was more on the O&M cost recovery and the operational sustainability of the subprojects. This was also the objective in the PPTA analysis at the MFF appraisal. Instead, a balance sheet based financial analysis and a revenue enhancement action plan was considered to ensure a 4% FIRR over the life of the MFF under different scenarios of 50% and 60% cost recovery. Tariffs were proposed as part of the action plan.12 24. FIRR for water supply system (bulk water supply) was assessed at 6.9%, and the same for parking facility was assessed at 5.8% as against the assessed weighted average cost of capital
12 PPTA-4515-IND; Volume 5 Economic and Finance Analysis, July 2006
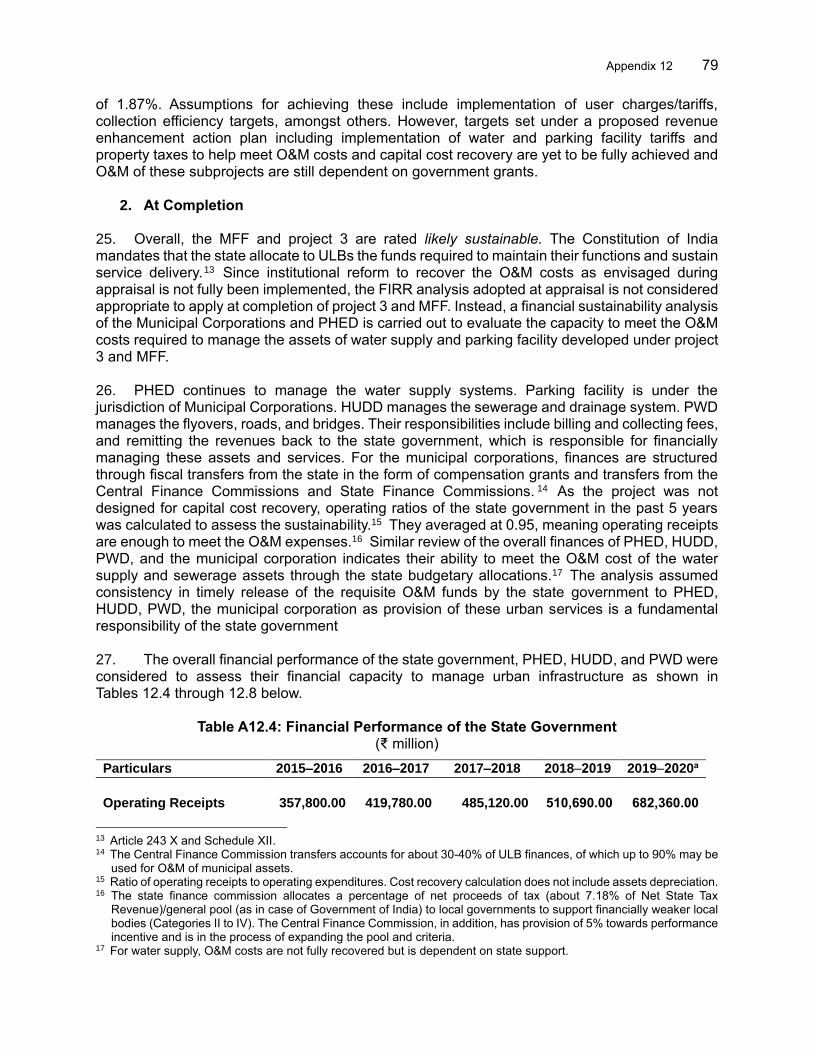
Appendix 12 79
of 1.87%. Assumptions for achieving these include implementation of user charges/tariffs, collection efficiency targets, amongst others. However, targets set under a proposed revenue enhancement action plan including implementation of water and parking facility tariffs and property taxes to help meet O&M costs and capital cost recovery are yet to be fully achieved and O&M of these subprojects are still dependent on government grants.
2. At Completion 25. Overall, the MFF and project 3 are rated likely sustainable. The Constitution of India mandates that the state allocate to ULBs the funds required to maintain their functions and sustain service delivery.13 Since institutional reform to recover the O&M costs as envisaged during appraisal is not fully been implemented, the FIRR analysis adopted at appraisal is not considered appropriate to apply at completion of project 3 and MFF. Instead, a financial sustainability analysis of the Municipal Corporations and PHED is carried out to evaluate the capacity to meet the O&M costs required to manage the assets of water supply and parking facility developed under project 3 and MFF. 26. PHED continues to manage the water supply systems. Parking facility is under the jurisdiction of Municipal Corporations. HUDD manages the sewerage and drainage system. PWD manages the flyovers, roads, and bridges. Their responsibilities include billing and collecting fees, and remitting the revenues back to the state government, which is responsible for financially managing these assets and services. For the municipal corporations, finances are structured through fiscal transfers from the state in the form of compensation grants and transfers from the Central Finance Commissions and State Finance Commissions. 14 As the project was not designed for capital cost recovery, operating ratios of the state government in the past 5 years was calculated to assess the sustainability.15 They averaged at 0.95, meaning operating receipts are enough to meet the O&M expenses.16 Similar review of the overall finances of PHED, HUDD, PWD, and the municipal corporation indicates their ability to meet the O&M cost of the water supply and sewerage assets through the state budgetary allocations.17 The analysis assumed consistency in timely release of the requisite O&M funds by the state government to PHED, HUDD, PWD, the municipal corporation as provision of these urban services is a fundamental responsibility of the state government 27. The overall financial performance of the state government, PHED, HUDD, and PWD were considered to assess their financial capacity to manage urban infrastructure as shown in Tables 12.4 through 12.8 below.
Table A12.4: Financial Performance of the State Government
(₹ million)
Particulars 2015–2016 2016–2017 2017–2018 2018–2019 2019–2020a
Operating Receipts 357,800.00 419,780.00 485,120.00 510,690.00 682,360.00
13 Article 243 X and Schedule XII. 14 The Central Finance Commission transfers accounts for about 30-40% of ULB finances, of which up to 90% may be
used for O&M of municipal assets. 15 Ratio of operating receipts to operating expenditures. Cost recovery calculation does not include assets depreciation. 16 The state finance commission allocates a percentage of net proceeds of tax (about 7.18% of Net State Tax
Revenue)/general pool (as in case of Government of India) to local governments to support financially weaker local bodies (Categories II to IV). The Central Finance Commission, in addition, has provision of 5% towards performance incentive and is in the process of expanding the pool and criteria.
17 For water supply, O&M costs are not fully recovered but is dependent on state support.
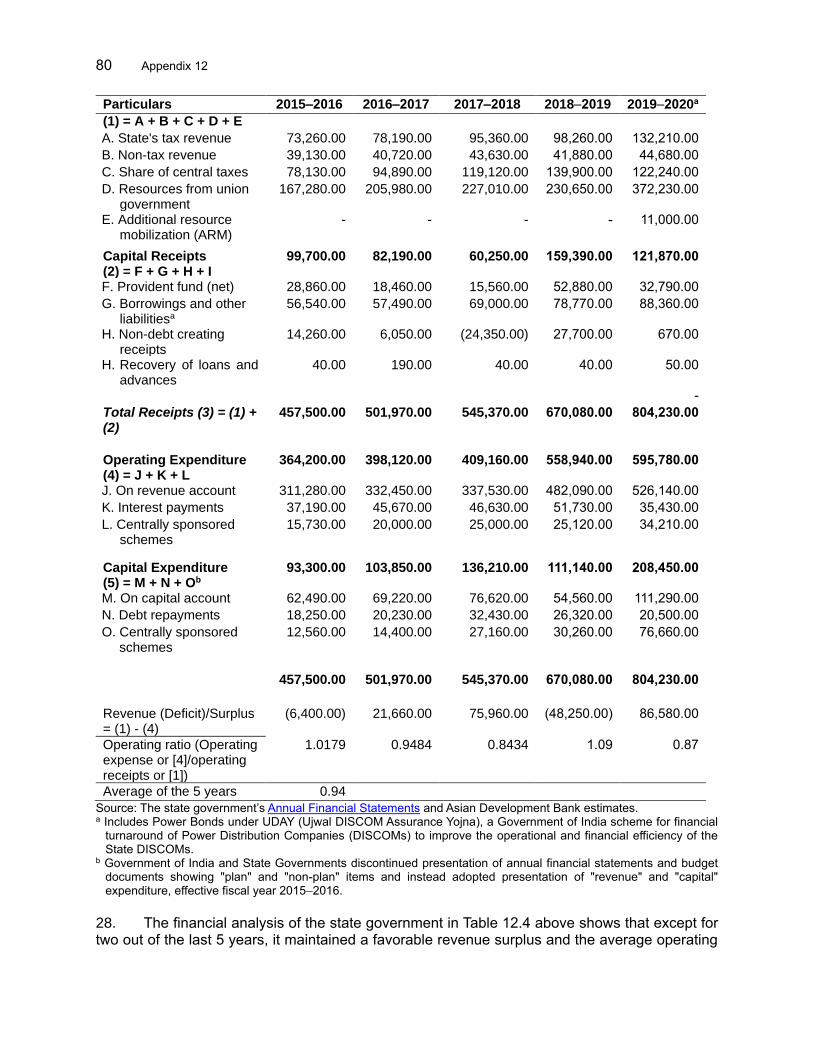
80 Appendix 12
Particulars 2015–2016 2016–2017 2017–2018 2018–2019 2019–2020a
(1) = A + B + C + D + E
A. State's tax revenue 73,260.00 78,190.00 95,360.00 98,260.00 132,210.00
B. Non-tax revenue 39,130.00 40,720.00 43,630.00 41,880.00 44,680.00
C. Share of central taxes 78,130.00 94,890.00 119,120.00 139,900.00 122,240.00
D. Resources from union government
167,280.00 205,980.00 227,010.00 230,650.00 372,230.00
E. Additional resource mobilization (ARM)
- - - - 11,000.00
Capital Receipts (2) = F + G + H + I
99,700.00 82,190.00 60,250.00 159,390.00 121,870.00
F. Provident fund (net) 28,860.00 18,460.00 15,560.00 52,880.00 32,790.00
G. Borrowings and other liabilitiesa
56,540.00 57,490.00 69,000.00 78,770.00 88,360.00
H. Non-debt creating receipts
14,260.00 6,050.00 (24,350.00) 27,700.00 670.00
H. Recovery of loans and advances
40.00 190.00 40.00 40.00 50.00
-
Total Receipts (3) = (1) + (2)
457,500.00 501,970.00 545,370.00 670,080.00 804,230.00
Operating Expenditure (4) = J + K + L
364,200.00 398,120.00 409,160.00 558,940.00 595,780.00
J. On revenue account 311,280.00 332,450.00 337,530.00 482,090.00 526,140.00
K. Interest payments 37,190.00 45,670.00 46,630.00 51,730.00 35,430.00
L. Centrally sponsored schemes
15,730.00 20,000.00 25,000.00 25,120.00 34,210.00
Capital Expenditure (5) = M + N + Ob
93,300.00 103,850.00 136,210.00 111,140.00 208,450.00
M. On capital account 62,490.00 69,220.00 76,620.00 54,560.00 111,290.00
N. Debt repayments 18,250.00 20,230.00 32,430.00 26,320.00 20,500.00
O. Centrally sponsored schemes
12,560.00 14,400.00 27,160.00 30,260.00 76,660.00
457,500.00 501,970.00 545,370.00 670,080.00 804,230.00
Revenue (Deficit)/Surplus = (1) - (4)
(6,400.00) 21,660.00 75,960.00 (48,250.00) 86,580.00
Operating ratio (Operating expense or [4]/operating receipts or [1])
1.0179 0.9484 0.8434 1.09
0.87
Average of the 5 years 0.94
Source: The state government’s Annual Financial Statements and Asian Development Bank estimates. a Includes Power Bonds under UDAY (Ujwal DISCOM Assurance Yojna), a Government of India scheme for financial
turnaround of Power Distribution Companies (DISCOMs) to improve the operational and financial efficiency of the State DISCOMs.
b Government of India and State Governments discontinued presentation of annual financial statements and budget documents showing "plan" and "non-plan" items and instead adopted presentation of "revenue" and "capital" expenditure, effective fiscal year 2015–2016.
28. The financial analysis of the state government in Table 12.4 above shows that except for two out of the last 5 years, it maintained a favorable revenue surplus and the average operating
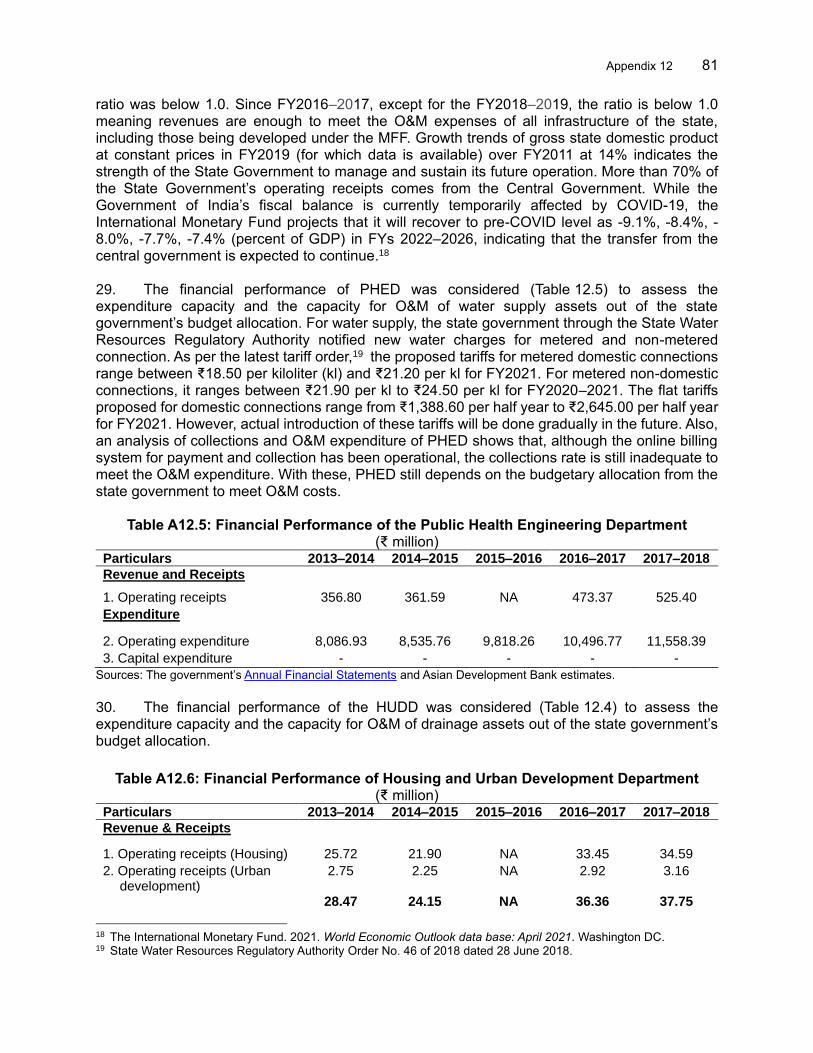
Appendix 12 81
ratio was below 1.0. Since FY2016–2017, except for the FY2018–2019, the ratio is below 1.0 meaning revenues are enough to meet the O&M expenses of all infrastructure of the state, including those being developed under the MFF. Growth trends of gross state domestic product at constant prices in FY2019 (for which data is available) over FY2011 at 14% indicates the strength of the State Government to manage and sustain its future operation. More than 70% of the State Government’s operating receipts comes from the Central Government. While the Government of India’s fiscal balance is currently temporarily affected by COVID-19, the International Monetary Fund projects that it will recover to pre-COVID level as -9.1%, -8.4%, -8.0%, -7.7%, -7.4% (percent of GDP) in FYs 2022–2026, indicating that the transfer from the central government is expected to continue.18 29. The financial performance of PHED was considered (Table 12.5) to assess the expenditure capacity and the capacity for O&M of water supply assets out of the state government’s budget allocation. For water supply, the state government through the State Water Resources Regulatory Authority notified new water charges for metered and non-metered connection. As per the latest tariff order,19 the proposed tariffs for metered domestic connections range between ₹18.50 per kiloliter (kl) and ₹21.20 per kl for FY2021. For metered non-domestic connections, it ranges between ₹21.90 per kl to ₹24.50 per kl for FY2020–2021. The flat tariffs proposed for domestic connections range from ₹1,388.60 per half year to ₹2,645.00 per half year for FY2021. However, actual introduction of these tariffs will be done gradually in the future. Also, an analysis of collections and O&M expenditure of PHED shows that, although the online billing system for payment and collection has been operational, the collections rate is still inadequate to meet the O&M expenditure. With these, PHED still depends on the budgetary allocation from the state government to meet O&M costs.
Table A12.5: Financial Performance of the Public Health Engineering Department (₹ million)
Particulars 2013–2014 2014–2015 2015–2016 2016–2017 2017–2018
Revenue and Receipts
1. Operating receipts 356.80 361.59 NA 473.37 525.40
Expenditure
2. Operating expenditure 8,086.93 8,535.76 9,818.26 10,496.77 11,558.39
3. Capital expenditure - - - - -
Sources: The government’s Annual Financial Statements and Asian Development Bank estimates.
30. The financial performance of the HUDD was considered (Table 12.4) to assess the expenditure capacity and the capacity for O&M of drainage assets out of the state government’s budget allocation.
Table A12.6: Financial Performance of Housing and Urban Development Department (₹ million)
Particulars 2013–2014 2014–2015 2015–2016 2016–2017 2017–2018
Revenue & Receipts
1. Operating receipts (Housing) 25.72 21.90 NA 33.45 34.59
2. Operating receipts (Urban development)
2.75 2.25 NA 2.92 3.16
28.47 24.15 NA 36.36 37.75
18 The International Monetary Fund. 2021. World Economic Outlook data base: April 2021. Washington DC. 19 State Water Resources Regulatory Authority Order No. 46 of 2018 dated 28 June 2018.
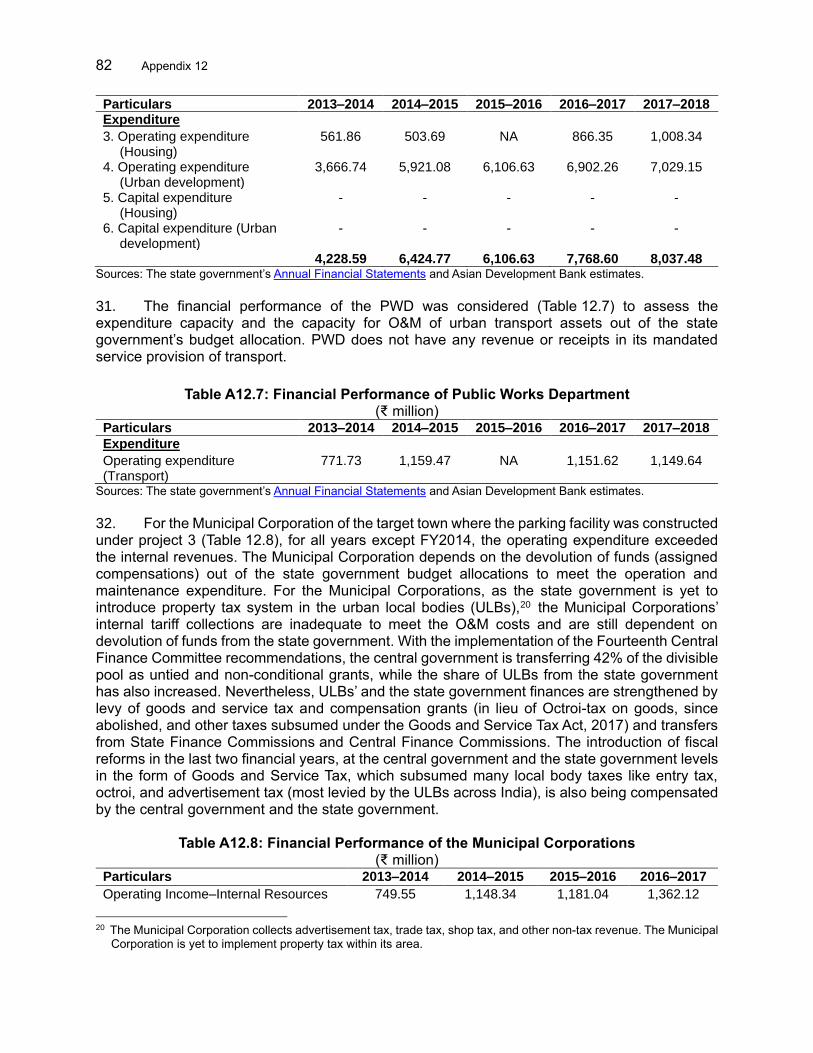
82 Appendix 12
Particulars 2013–2014 2014–2015 2015–2016 2016–2017 2017–2018 Expenditure
3. Operating expenditure (Housing)
561.86 503.69 NA 866.35 1,008.34
4. Operating expenditure (Urban development)
3,666.74 5,921.08 6,106.63 6,902.26 7,029.15
5. Capital expenditure (Housing)
- - - - -
6. Capital expenditure (Urban development)
- - - - -
4,228.59 6,424.77 6,106.63 7,768.60 8,037.48
Sources: The state government’s Annual Financial Statements and Asian Development Bank estimates.
31. The financial performance of the PWD was considered (Table 12.7) to assess the expenditure capacity and the capacity for O&M of urban transport assets out of the state government’s budget allocation. PWD does not have any revenue or receipts in its mandated service provision of transport.
Table A12.7: Financial Performance of Public Works Department (₹ million)
Particulars 2013–2014 2014–2015 2015–2016 2016–2017 2017–2018
Expenditure
Operating expenditure (Transport)
771.73 1,159.47 NA 1,151.62 1,149.64
Sources: The state government’s Annual Financial Statements and Asian Development Bank estimates. 32. For the Municipal Corporation of the target town where the parking facility was constructed under project 3 (Table 12.8), for all years except FY2014, the operating expenditure exceeded the internal revenues. The Municipal Corporation depends on the devolution of funds (assigned compensations) out of the state government budget allocations to meet the operation and maintenance expenditure. For the Municipal Corporations, as the state government is yet to introduce property tax system in the urban local bodies (ULBs),20 the Municipal Corporations’ internal tariff collections are inadequate to meet the O&M costs and are still dependent on devolution of funds from the state government. With the implementation of the Fourteenth Central Finance Committee recommendations, the central government is transferring 42% of the divisible pool as untied and non-conditional grants, while the share of ULBs from the state government has also increased. Nevertheless, ULBs’ and the state government finances are strengthened by levy of goods and service tax and compensation grants (in lieu of Octroi-tax on goods, since abolished, and other taxes subsumed under the Goods and Service Tax Act, 2017) and transfers from State Finance Commissions and Central Finance Commissions. The introduction of fiscal reforms in the last two financial years, at the central government and the state government levels in the form of Goods and Service Tax, which subsumed many local body taxes like entry tax, octroi, and advertisement tax (most levied by the ULBs across India), is also being compensated by the central government and the state government.
Table A12.8: Financial Performance of the Municipal Corporations (₹ million)
Particulars 2013–2014 2014–2015 2015–2016 2016–2017
Operating Income–Internal Resources 749.55 1,148.34 1,181.04 1,362.12
20 The Municipal Corporation collects advertisement tax, trade tax, shop tax, and other non-tax revenue. The Municipal
Corporation is yet to implement property tax within its area.
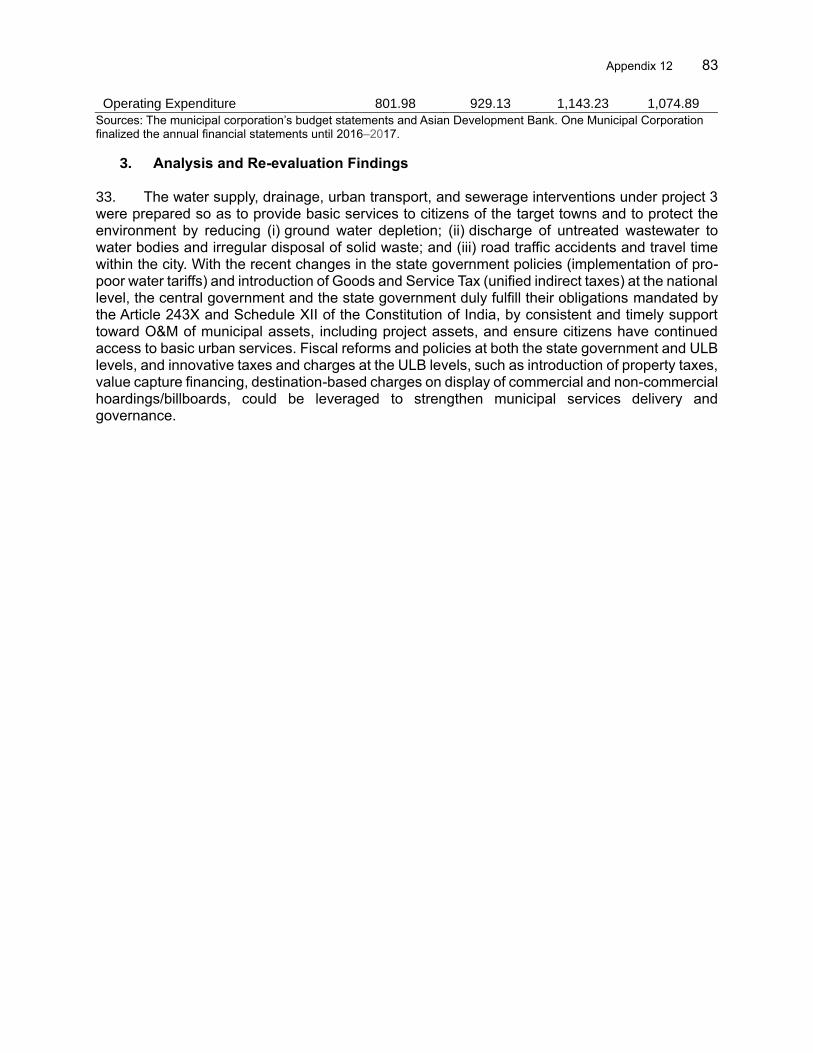
Appendix 12 83
Operating Expenditure 801.98 929.13 1,143.23 1,074.89
Sources: The municipal corporation’s budget statements and Asian Development Bank. One Municipal Corporation finalized the annual financial statements until 2016–2017.
3. Analysis and Re-evaluation Findings 33. The water supply, drainage, urban transport, and sewerage interventions under project 3 were prepared so as to provide basic services to citizens of the target towns and to protect the environment by reducing (i) ground water depletion; (ii) discharge of untreated wastewater to water bodies and irregular disposal of solid waste; and (iii) road traffic accidents and travel time within the city. With the recent changes in the state government policies (implementation of pro-poor water tariffs) and introduction of Goods and Service Tax (unified indirect taxes) at the national level, the central government and the state government duly fulfill their obligations mandated by the Article 243X and Schedule XII of the Constitution of India, by consistent and timely support toward O&M of municipal assets, including project assets, and ensure citizens have continued access to basic urban services. Fiscal reforms and policies at both the state government and ULB levels, and innovative taxes and charges at the ULB levels, such as introduction of property taxes, value capture financing, destination-based charges on display of commercial and non-commercial hoardings/billboards, could be leveraged to strengthen municipal services delivery and governance.
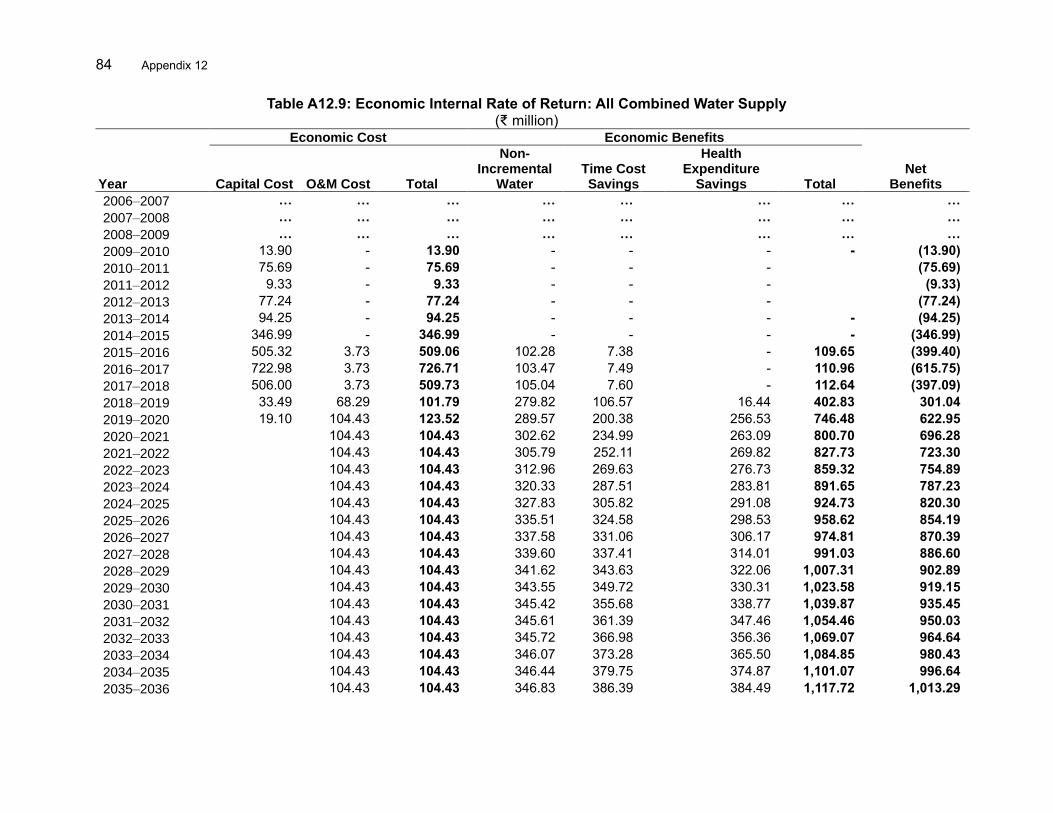
84 Appendix 12
Table A12.9: Economic Internal Rate of Return: All Combined Water Supply (₹ million)
Economic Cost Economic Benefits
Year Capital Cost O&M Cost Total
Non- Incremental
Water Time Cost Savings
Health Expenditure
Savings Total Net
Benefits
2006–2007 … … … … … … … …
2007–2008 … … … … … … … …
2008–2009 … … … … … … … …
2009–2010 13.90 - 13.90 - - - - (13.90)
2010–2011 75.69 - 75.69 - - -
(75.69)
2011–2012 9.33 - 9.33 - - -
(9.33)
2012–2013 77.24 - 77.24 - - -
(77.24)
2013–2014 94.25 - 94.25 - - - - (94.25)
2014–2015 346.99 - 346.99 - - - - (346.99)
2015–2016 505.32 3.73 509.06 102.28 7.38 - 109.65 (399.40)
2016–2017 722.98 3.73 726.71 103.47 7.49 - 110.96 (615.75)
2017–2018 506.00 3.73 509.73 105.04 7.60 - 112.64 (397.09)
2018–2019 33.49 68.29 101.79 279.82 106.57 16.44 402.83 301.04
2019–2020 19.10 104.43 123.52 289.57 200.38 256.53 746.48 622.95
2020–2021
104.43 104.43 302.62 234.99 263.09 800.70 696.28
2021–2022
104.43 104.43 305.79 252.11 269.82 827.73 723.30
2022–2023
104.43 104.43 312.96 269.63 276.73 859.32 754.89
2023–2024
104.43 104.43 320.33 287.51 283.81 891.65 787.23
2024–2025
104.43 104.43 327.83 305.82 291.08 924.73 820.30
2025–2026
104.43 104.43 335.51 324.58 298.53 958.62 854.19
2026–2027
104.43 104.43 337.58 331.06 306.17 974.81 870.39
2027–2028
104.43 104.43 339.60 337.41 314.01 991.03 886.60
2028–2029
104.43 104.43 341.62 343.63 322.06 1,007.31 902.89
2029–2030
104.43 104.43 343.55 349.72 330.31 1,023.58 919.15
2030–2031
104.43 104.43 345.42 355.68 338.77 1,039.87 935.45
2031–2032
104.43 104.43 345.61 361.39 347.46 1,054.46 950.03
2032–2033
104.43 104.43 345.72 366.98 356.36 1,069.07 964.64
2033–2034
104.43 104.43 346.07 373.28 365.50 1,084.85 980.43
2034–2035
104.43 104.43 346.44 379.75 374.87 1,101.07 996.64
2035–2036
104.43 104.43 346.83 386.39 384.49 1,117.72 1,013.29
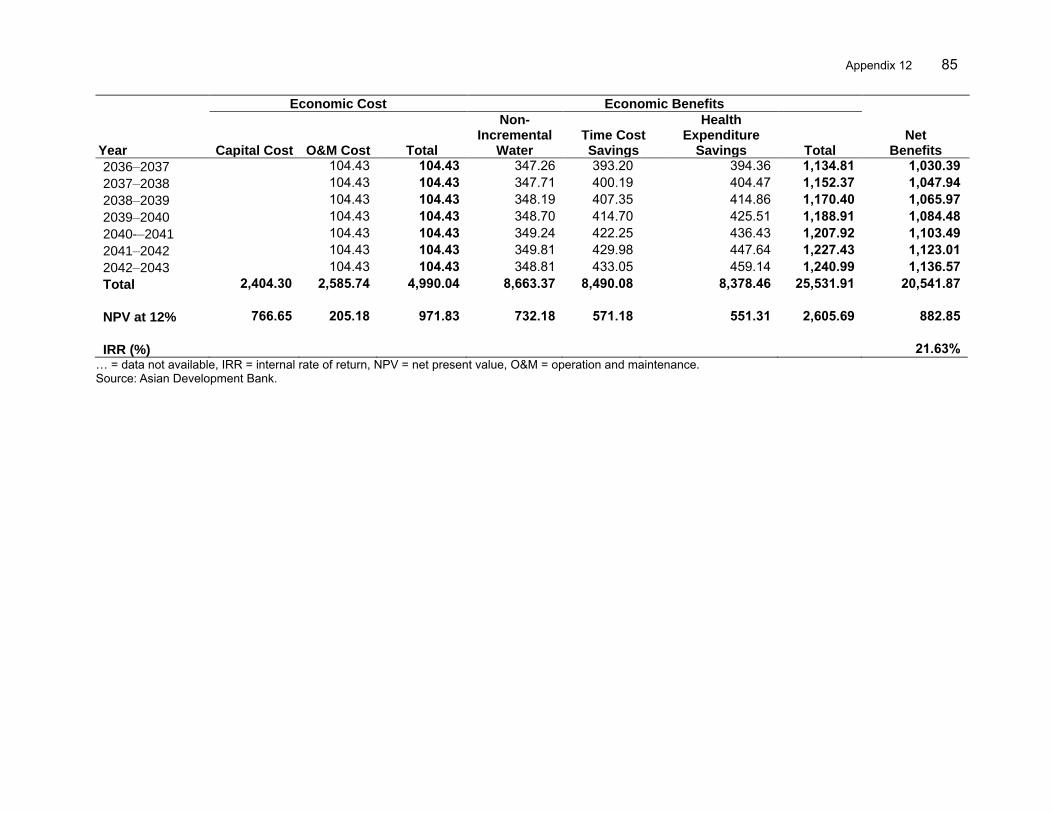
Appendix 12 85
Economic Cost Economic Benefits
Year Capital Cost O&M Cost Total
Non- Incremental
Water Time Cost Savings
Health Expenditure
Savings Total Net
Benefits
2036–2037
104.43 104.43 347.26 393.20 394.36 1,134.81 1,030.39
2037–2038
104.43 104.43 347.71 400.19 404.47 1,152.37 1,047.94
2038–2039
104.43 104.43 348.19 407.35 414.86 1,170.40 1,065.97
2039–2040
104.43 104.43 348.70 414.70 425.51 1,188.91 1,084.48
2040-–2041
104.43 104.43 349.24 422.25 436.43 1,207.92 1,103.49
2041–2042
104.43 104.43 349.81 429.98 447.64 1,227.43 1,123.01
2042–2043
104.43 104.43 348.81 433.05 459.14 1,240.99 1,136.57
Total 2,404.30 2,585.74 4,990.04 8,663.37 8,490.08 8,378.46 25,531.91 20,541.87
NPV at 12% 766.65 205.18 971.83 732.18 571.18 551.31 2,605.69 882.85
IRR (%)
21.63% … = data not available, IRR = internal rate of return, NPV = net present value, O&M = operation and maintenance. Source: Asian Development Bank.
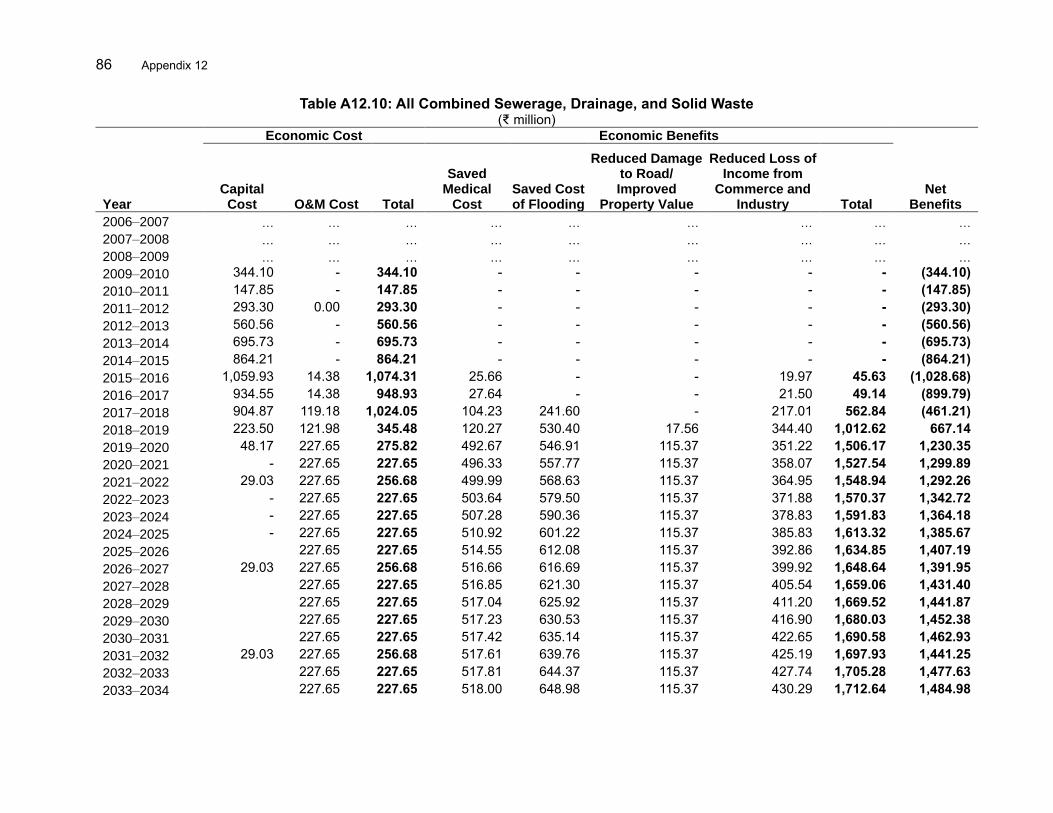
86 Appendix 12
Table A12.10: All Combined Sewerage, Drainage, and Solid Waste (₹ million)
Economic Cost Economic Benefits
Year Capital
Cost O&M Cost Total
Saved Medical
Cost Saved Cost of Flooding
Reduced Damage to Road/ Improved
Property Value
Reduced Loss of Income from
Commerce and Industry Total
Net Benefits
2006–2007 … … … … … … … … …
2007–2008 … … … … … … … … …
2008–2009 … … … … … … … … …
2009–2010 344.10 - 344.10 - - - - - (344.10)
2010–2011 147.85 - 147.85 - - - - - (147.85)
2011–2012 293.30 0.00 293.30 - - - - - (293.30)
2012–2013 560.56 - 560.56 - - - - - (560.56)
2013–2014 695.73 - 695.73 - - - - - (695.73)
2014–2015 864.21 - 864.21 - - - - - (864.21)
2015–2016 1,059.93 14.38 1,074.31 25.66 - - 19.97 45.63 (1,028.68)
2016–2017 934.55 14.38 948.93 27.64 - - 21.50 49.14 (899.79)
2017–2018 904.87 119.18 1,024.05 104.23 241.60 - 217.01 562.84 (461.21)
2018–2019 223.50 121.98 345.48 120.27 530.40 17.56 344.40 1,012.62 667.14
2019–2020 48.17 227.65 275.82 492.67 546.91 115.37 351.22 1,506.17 1,230.35
2020–2021 - 227.65 227.65 496.33 557.77 115.37 358.07 1,527.54 1,299.89
2021–2022 29.03 227.65 256.68 499.99 568.63 115.37 364.95 1,548.94 1,292.26
2022–2023 - 227.65 227.65 503.64 579.50 115.37 371.88 1,570.37 1,342.72
2023–2024 - 227.65 227.65 507.28 590.36 115.37 378.83 1,591.83 1,364.18
2024–2025 - 227.65 227.65 510.92 601.22 115.37 385.83 1,613.32 1,385.67
2025–2026
227.65 227.65 514.55 612.08 115.37 392.86 1,634.85 1,407.19
2026–2027 29.03 227.65 256.68 516.66 616.69 115.37 399.92 1,648.64 1,391.95
2027–2028
227.65 227.65 516.85 621.30 115.37 405.54 1,659.06 1,431.40
2028–2029
227.65 227.65 517.04 625.92 115.37 411.20 1,669.52 1,441.87
2029–2030
227.65 227.65 517.23 630.53 115.37 416.90 1,680.03 1,452.38
2030–2031
227.65 227.65 517.42 635.14 115.37 422.65 1,690.58 1,462.93
2031–2032 29.03 227.65 256.68 517.61 639.76 115.37 425.19 1,697.93 1,441.25
2032–2033
227.65 227.65 517.81 644.37 115.37 427.74 1,705.28 1,477.63
2033–2034
227.65 227.65 518.00 648.98 115.37 430.29 1,712.64 1,484.98
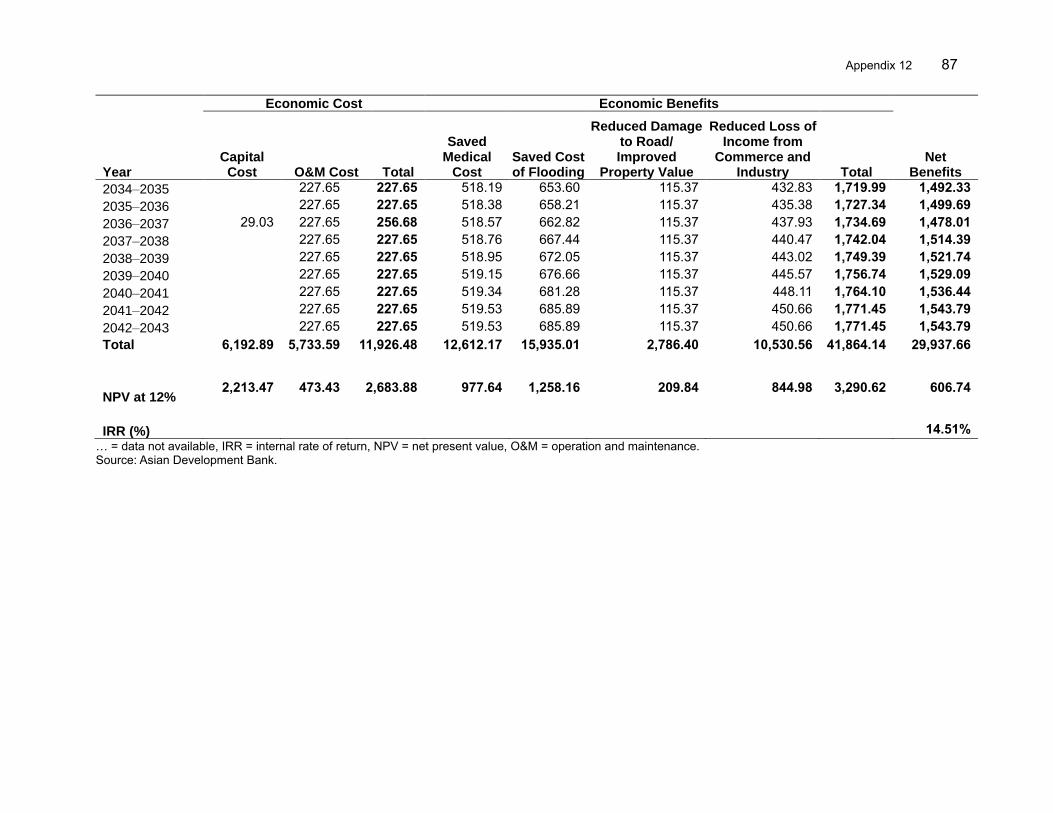
Appendix 12 87
Economic Cost Economic Benefits
Year Capital
Cost O&M Cost Total
Saved Medical
Cost Saved Cost of Flooding
Reduced Damage to Road/ Improved
Property Value
Reduced Loss of Income from
Commerce and Industry Total
Net Benefits
2034–2035
227.65 227.65 518.19 653.60 115.37 432.83 1,719.99 1,492.33
2035–2036
227.65 227.65 518.38 658.21 115.37 435.38 1,727.34 1,499.69
2036–2037 29.03 227.65 256.68 518.57 662.82 115.37 437.93 1,734.69 1,478.01
2037–2038
227.65 227.65 518.76 667.44 115.37 440.47 1,742.04 1,514.39
2038–2039
227.65 227.65 518.95 672.05 115.37 443.02 1,749.39 1,521.74
2039–2040
227.65 227.65 519.15 676.66 115.37 445.57 1,756.74 1,529.09
2040–2041
227.65 227.65 519.34 681.28 115.37 448.11 1,764.10 1,536.44
2041–2042
227.65 227.65 519.53 685.89 115.37 450.66 1,771.45 1,543.79
2042–2043
227.65 227.65 519.53 685.89 115.37 450.66 1,771.45 1,543.79
Total 6,192.89 5,733.59 11,926.48 12,612.17 15,935.01 2,786.40 10,530.56 41,864.14 29,937.66
NPV at 12% 2,213.47 473.43 2,683.88 977.64 1,258.16 209.84 844.98 3,290.62 606.74
IRR (%)
14.51%
… = data not available, IRR = internal rate of return, NPV = net present value, O&M = operation and maintenance. Source: Asian Development Bank.
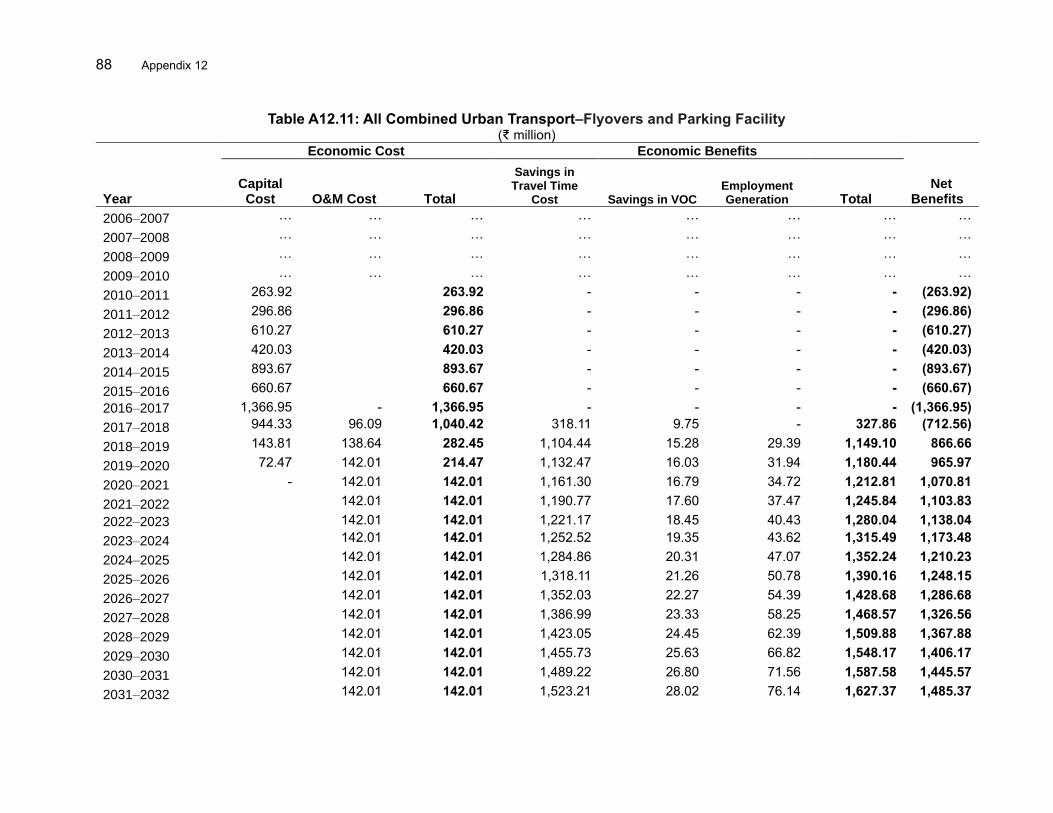
88 Appendix 12
Table A12.11: All Combined Urban Transport–Flyovers and Parking Facility (₹ million)
Economic Cost Economic Benefits
Year Capital
Cost O&M Cost Total
Savings in Travel Time
Cost Savings in VOC Employment Generation Total
Net Benefits
2006–2007 … … … … … … … …
2007–2008 … … … … … … … …
2008–2009 … … … … … … … …
2009–2010 … … … … … … … …
2010–2011 263.92
263.92 - - - - (263.92)
2011–2012 296.86
296.86 - - - - (296.86)
2012–2013 610.27
610.27 - - - - (610.27)
2013–2014 420.03
420.03 - - - - (420.03)
2014–2015 893.67
893.67 - - - - (893.67)
2015–2016 660.67
660.67 - - - - (660.67)
2016–2017 1,366.95 - 1,366.95 - - - - (1,366.95)
2017–2018 944.33 96.09 1,040.42 318.11 9.75 - 327.86 (712.56)
2018–2019 143.81 138.64 282.45 1,104.44 15.28 29.39 1,149.10 866.66
2019–2020 72.47 142.01 214.47 1,132.47 16.03 31.94 1,180.44 965.97
2020–2021 - 142.01 142.01 1,161.30 16.79 34.72 1,212.81 1,070.81
2021–2022
142.01 142.01 1,190.77 17.60 37.47 1,245.84 1,103.83
2022–2023
142.01 142.01 1,221.17 18.45 40.43 1,280.04 1,138.04
2023–2024
142.01 142.01 1,252.52 19.35 43.62 1,315.49 1,173.48
2024–2025
142.01 142.01 1,284.86 20.31 47.07 1,352.24 1,210.23
2025–2026
142.01 142.01 1,318.11 21.26 50.78 1,390.16 1,248.15
2026–2027
142.01 142.01 1,352.03 22.27 54.39 1,428.68 1,286.68
2027–2028
142.01 142.01 1,386.99 23.33 58.25 1,468.57 1,326.56
2028–2029
142.01 142.01 1,423.05 24.45 62.39 1,509.88 1,367.88
2029–2030
142.01 142.01 1,455.73 25.63 66.82 1,548.17 1,406.17
2030–2031
142.01 142.01 1,489.22 26.80 71.56 1,587.58 1,445.57
2031–2032
142.01 142.01 1,523.21 28.02 76.14 1,627.37 1,485.37
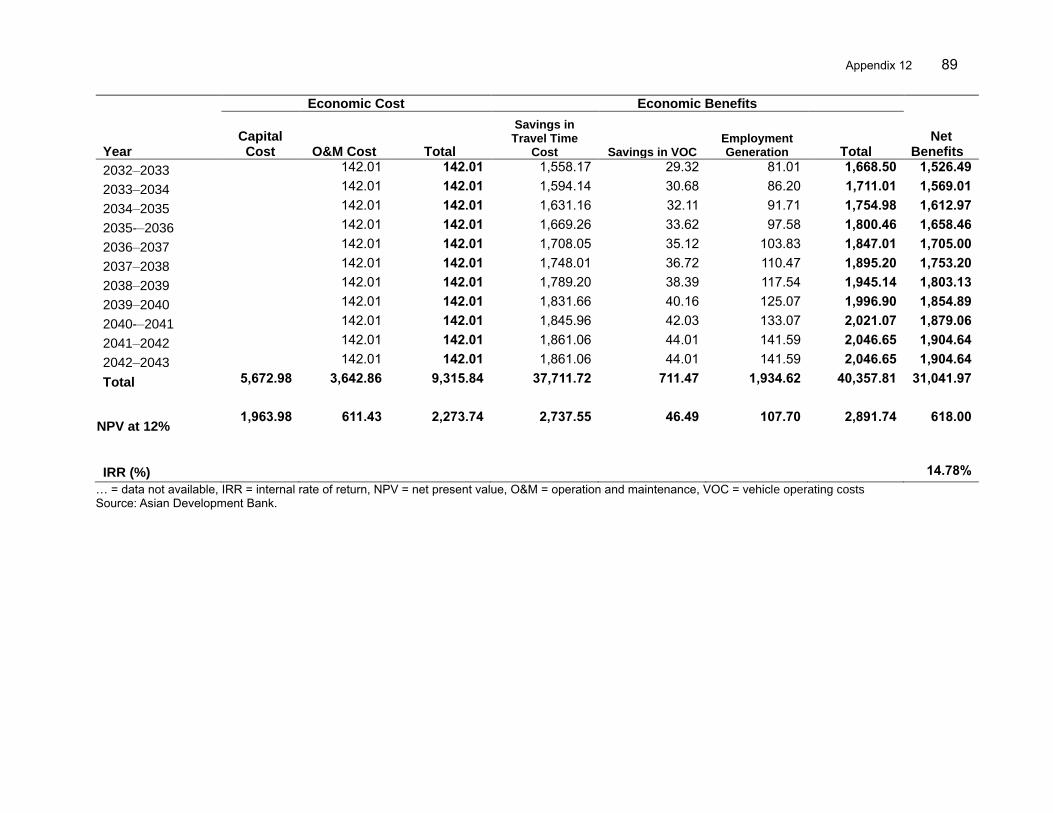
Appendix 12 89
Economic Cost Economic Benefits
Year Capital
Cost O&M Cost Total
Savings in Travel Time
Cost Savings in VOC Employment Generation Total
Net Benefits
2032–2033
142.01 142.01 1,558.17 29.32 81.01 1,668.50 1,526.49
2033–2034
142.01 142.01 1,594.14 30.68 86.20 1,711.01 1,569.01
2034–2035
142.01 142.01 1,631.16 32.11 91.71 1,754.98 1,612.97
2035-–2036
142.01 142.01 1,669.26 33.62 97.58 1,800.46 1,658.46
2036–2037
142.01 142.01 1,708.05 35.12 103.83 1,847.01 1,705.00
2037–2038
142.01 142.01 1,748.01 36.72 110.47 1,895.20 1,753.20
2038–2039
142.01 142.01 1,789.20 38.39 117.54 1,945.14 1,803.13
2039–2040
142.01 142.01 1,831.66 40.16 125.07 1,996.90 1,854.89
2040-–2041
142.01 142.01 1,845.96 42.03 133.07 2,021.07 1,879.06
2041–2042
142.01 142.01 1,861.06 44.01 141.59 2,046.65 1,904.64
2042–2043
142.01 142.01 1,861.06 44.01 141.59 2,046.65 1,904.64
Total 5,672.98 3,642.86 9,315.84 37,711.72 711.47 1,934.62 40,357.81 31,041.97
NPV at 12% 1,963.98 611.43 2,273.74 2,737.55 46.49 107.70 2,891.74 618.00
IRR (%)
14.78%
… = data not available, IRR = internal rate of return, NPV = net present value, O&M = operation and maintenance, VOC = vehicle operating costs Source: Asian Development Bank.
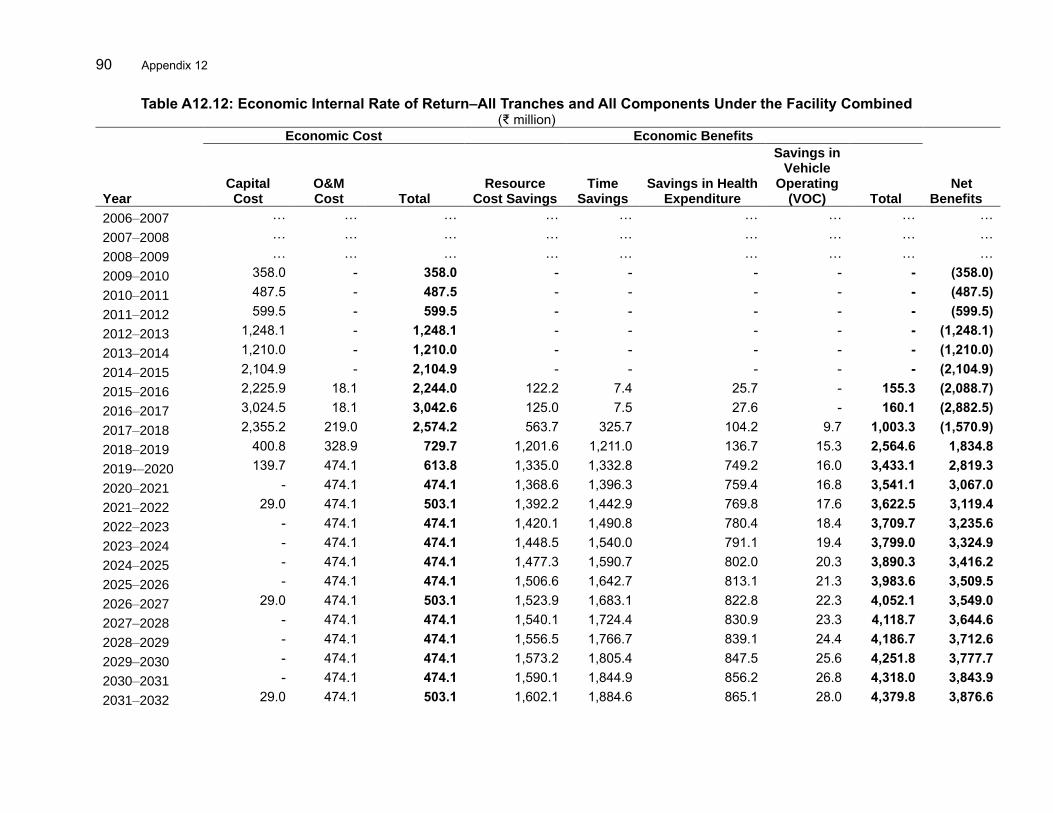
90 Appendix 12
Table A12.12: Economic Internal Rate of Return–All Tranches and All Components Under the Facility Combined (₹ million)
Economic Cost Economic Benefits
Year Capital
Cost O&M Cost Total
Resource Cost Savings
Time Savings
Savings in Health Expenditure
Savings in Vehicle
Operating (VOC) Total
Net Benefits
2006–2007 … … … … … … … … …
2007–2008 … … … … … … … … …
2008–2009 … … … … … … … … …
2009–2010 358.0 - 358.0 - - - - - (358.0)
2010–2011 487.5 - 487.5 - - - - - (487.5)
2011–2012 599.5 - 599.5 - - - - - (599.5)
2012–2013 1,248.1 - 1,248.1 - - - - - (1,248.1)
2013–2014 1,210.0 - 1,210.0 - - - - - (1,210.0)
2014–2015 2,104.9 - 2,104.9 - - - - - (2,104.9)
2015–2016 2,225.9 18.1 2,244.0 122.2 7.4 25.7 - 155.3 (2,088.7)
2016–2017 3,024.5 18.1 3,042.6 125.0 7.5 27.6 - 160.1 (2,882.5)
2017–2018 2,355.2 219.0 2,574.2 563.7 325.7 104.2 9.7 1,003.3 (1,570.9)
2018–2019 400.8 328.9 729.7 1,201.6 1,211.0 136.7 15.3 2,564.6 1,834.8
2019-–2020 139.7 474.1 613.8 1,335.0 1,332.8 749.2 16.0 3,433.1 2,819.3
2020–2021 - 474.1 474.1 1,368.6 1,396.3 759.4 16.8 3,541.1 3,067.0
2021–2022 29.0 474.1 503.1 1,392.2 1,442.9 769.8 17.6 3,622.5 3,119.4
2022–2023 - 474.1 474.1 1,420.1 1,490.8 780.4 18.4 3,709.7 3,235.6
2023–2024 - 474.1 474.1 1,448.5 1,540.0 791.1 19.4 3,799.0 3,324.9
2024–2025 - 474.1 474.1 1,477.3 1,590.7 802.0 20.3 3,890.3 3,416.2
2025–2026 - 474.1 474.1 1,506.6 1,642.7 813.1 21.3 3,983.6 3,509.5
2026–2027 29.0 474.1 503.1 1,523.9 1,683.1 822.8 22.3 4,052.1 3,549.0
2027–2028 - 474.1 474.1 1,540.1 1,724.4 830.9 23.3 4,118.7 3,644.6
2028–2029 - 474.1 474.1 1,556.5 1,766.7 839.1 24.4 4,186.7 3,712.6
2029–2030 - 474.1 474.1 1,573.2 1,805.4 847.5 25.6 4,251.8 3,777.7
2030–2031 - 474.1 474.1 1,590.1 1,844.9 856.2 26.8 4,318.0 3,843.9
2031–2032 29.0 474.1 503.1 1,602.1 1,884.6 865.1 28.0 4,379.8 3,876.6
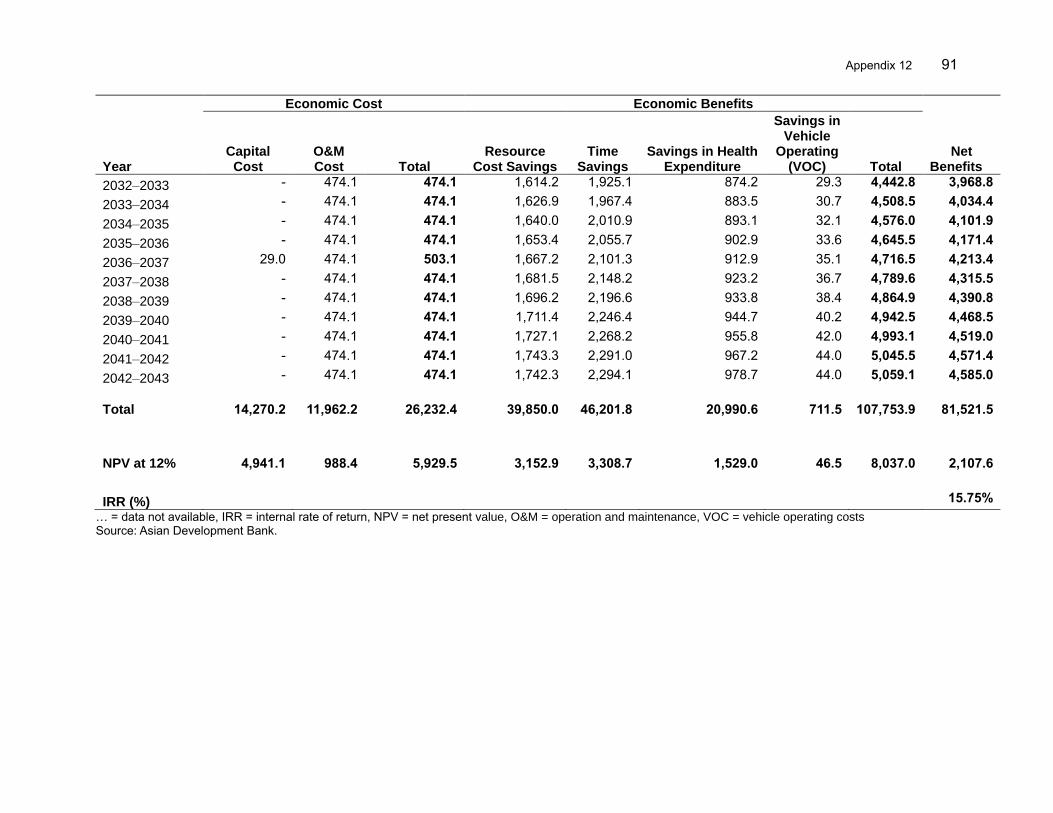
Appendix 12 91
Economic Cost Economic Benefits
Year Capital
Cost O&M Cost Total
Resource Cost Savings
Time Savings
Savings in Health Expenditure
Savings in Vehicle
Operating (VOC) Total
Net Benefits
2032–2033 - 474.1 474.1 1,614.2 1,925.1 874.2 29.3 4,442.8 3,968.8
2033–2034 - 474.1 474.1 1,626.9 1,967.4 883.5 30.7 4,508.5 4,034.4
2034–2035 - 474.1 474.1 1,640.0 2,010.9 893.1 32.1 4,576.0 4,101.9
2035–2036 - 474.1 474.1 1,653.4 2,055.7 902.9 33.6 4,645.5 4,171.4
2036–2037 29.0 474.1 503.1 1,667.2 2,101.3 912.9 35.1 4,716.5 4,213.4
2037–2038 - 474.1 474.1 1,681.5 2,148.2 923.2 36.7 4,789.6 4,315.5
2038–2039 - 474.1 474.1 1,696.2 2,196.6 933.8 38.4 4,864.9 4,390.8
2039–2040 - 474.1 474.1 1,711.4 2,246.4 944.7 40.2 4,942.5 4,468.5
2040–2041 - 474.1 474.1 1,727.1 2,268.2 955.8 42.0 4,993.1 4,519.0
2041–2042 - 474.1 474.1 1,743.3 2,291.0 967.2 44.0 5,045.5 4,571.4
2042–2043 - 474.1 474.1 1,742.3 2,294.1 978.7 44.0 5,059.1 4,585.0
Total
14,270.2
11,962.2
26,232.4
39,850.0
46,201.8
20,990.6
711.5
107,753.9
81,521.5
NPV at 12% 4,941.1 988.4 5,929.5 3,152.9 3,308.7 1,529.0 46.5 8,037.0 2,107.6
IRR (%)
15.75%
… = data not available, IRR = internal rate of return, NPV = net present value, O&M = operation and maintenance, VOC = vehicle operating costs Source: Asian Development Bank.
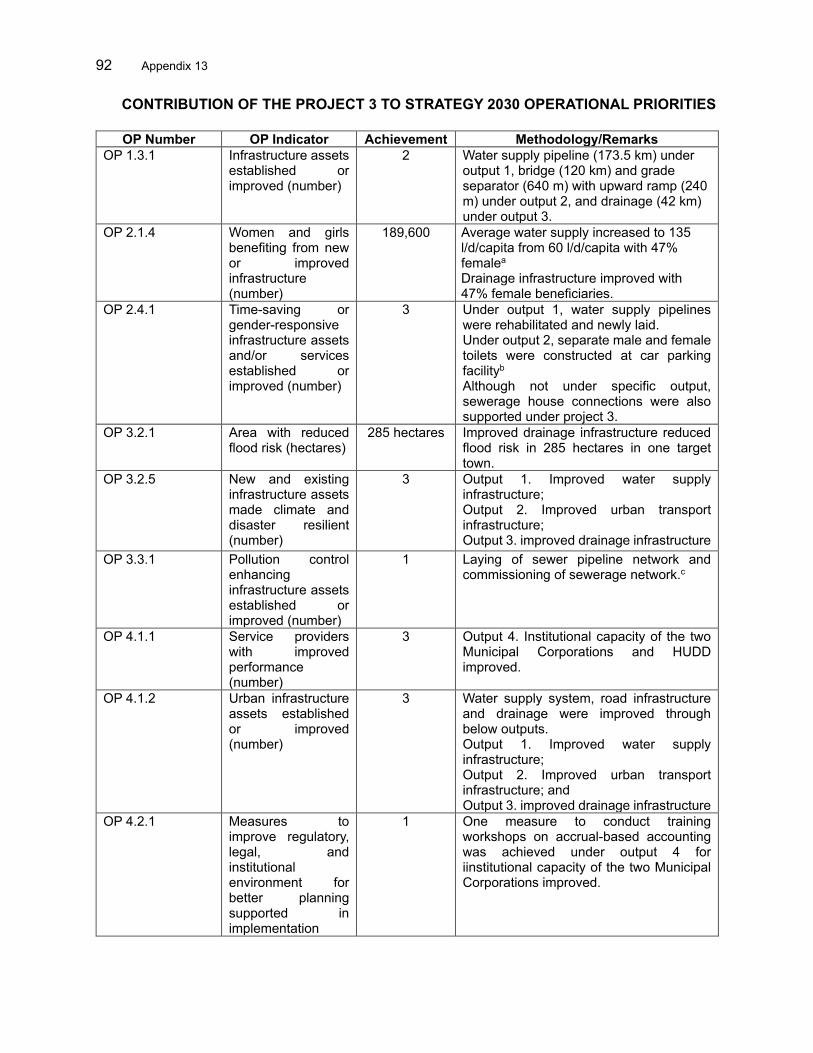
92 Appendix 13
CONTRIBUTION OF THE PROJECT 3 TO STRATEGY 2030 OPERATIONAL PRIORITIES
OP Number OP Indicator Achievement Methodology/Remarks
OP 1.3.1 Infrastructure assets established or improved (number)
2 Water supply pipeline (173.5 km) under output 1, bridge (120 km) and grade separator (640 m) with upward ramp (240 m) under output 2, and drainage (42 km) under output 3.
OP 2.1.4 Women and girls benefiting from new or improved infrastructure (number)
189,600 Average water supply increased to 135 l/d/capita from 60 l/d/capita with 47% femalea
Drainage infrastructure improved with 47% female beneficiaries.
OP 2.4.1 Time-saving or gender-responsive infrastructure assets and/or services established or improved (number)
3 Under output 1, water supply pipelines were rehabilitated and newly laid. Under output 2, separate male and female toilets were constructed at car parking facilityb
Although not under specific output, sewerage house connections were also supported under project 3.
OP 3.2.1 Area with reduced flood risk (hectares)
285 hectares Improved drainage infrastructure reduced flood risk in 285 hectares in one target town.
OP 3.2.5 New and existing infrastructure assets made climate and disaster resilient (number)
3 Output 1. Improved water supply infrastructure; Output 2. Improved urban transport infrastructure; Output 3. improved drainage infrastructure
OP 3.3.1 Pollution control enhancing infrastructure assets established or improved (number)
1 Laying of sewer pipeline network and commissioning of sewerage network.c
OP 4.1.1 Service providers with improved performance (number)
3 Output 4. Institutional capacity of the two Municipal Corporations and HUDD improved.
OP 4.1.2 Urban infrastructure assets established or improved (number)
3 Water supply system, road infrastructure and drainage were improved through below outputs. Output 1. Improved water supply infrastructure; Output 2. Improved urban transport infrastructure; and Output 3. improved drainage infrastructure
OP 4.2.1 Measures to improve regulatory, legal, and institutional environment for better planning supported in implementation
1 One measure to conduct training workshops on accrual-based accounting was achieved under output 4 for iinstitutional capacity of the two Municipal Corporations improved.
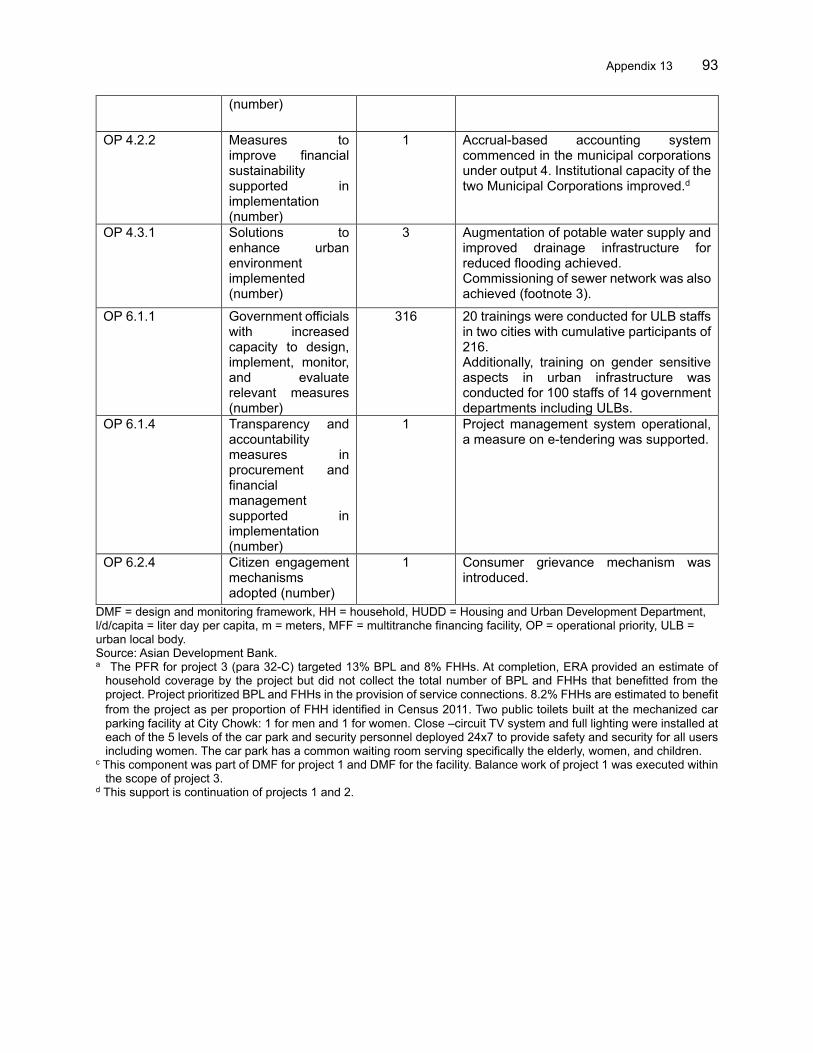
Appendix 13 93
(number)
OP 4.2.2 Measures to improve financial sustainability supported in implementation (number)
1 Accrual-based accounting system commenced in the municipal corporations under output 4. Institutional capacity of the two Municipal Corporations improved.d
OP 4.3.1 Solutions to enhance urban environment implemented (number)
3 Augmentation of potable water supply and improved drainage infrastructure for reduced flooding achieved. Commissioning of sewer network was also achieved (footnote 3).
OP 6.1.1 Government officials with increased capacity to design, implement, monitor, and evaluate relevant measures (number)
316 20 trainings were conducted for ULB staffs in two cities with cumulative participants of 216. Additionally, training on gender sensitive aspects in urban infrastructure was conducted for 100 staffs of 14 government departments including ULBs.
OP 6.1.4 Transparency and accountability measures in procurement and financial management supported in implementation (number)
1 Project management system operational, a measure on e-tendering was supported.
OP 6.2.4 Citizen engagement mechanisms adopted (number)
1 Consumer grievance mechanism was introduced.
DMF = design and monitoring framework, HH = household, HUDD = Housing and Urban Development Department, l/d/capita = liter day per capita, m = meters, MFF = multitranche financing facility, OP = operational priority, ULB = urban local body. Source: Asian Development Bank. a The PFR for project 3 (para 32-C) targeted 13% BPL and 8% FHHs. At completion, ERA provided an estimate of
household coverage by the project but did not collect the total number of BPL and FHHs that benefitted from the project. Project prioritized BPL and FHHs in the provision of service connections. 8.2% FHHs are estimated to benefit
from the project as per proportion of FHH identified in Census 2011. Two public toilets built at the mechanized car
parking facility at City Chowk: 1 for men and 1 for women. Close –circuit TV system and full lighting were installed at each of the 5 levels of the car park and security personnel deployed 24x7 to provide safety and security for all users including women. The car park has a common waiting room serving specifically the elderly, women, and children.
c This component was part of DMF for project 1 and DMF for the facility. Balance work of project 1 was executed within the scope of project 3.
d This support is continuation of projects 1 and 2.


