Golder, Golder Associates and the GA globe design are trademarks of Golder Associates Corporation
A world ofcapabilities
delivered locally
2009 AUGUR CREEK SEDIMENT AND BENTHIC INVERTEBRATE MONITORING STUDY White King / Lucky Lass Mines Superfund Site
Submitted To: U.S. Environmental Protection Agency Region 10 Seattle, Washington Submitted By: Western Nuclear Inc. Fremont Lumber Co. Prepared By: Golder Associates Inc. 18300 NE Union Hill Road, Suite 200 Redmond, WA 98052 USA November 7, 2011 Project No. 033-1398-001.540
REPO
RT
November 2011 i 033-1398-001.540
REP 1107_11 Augur Creek Sediment Monitoring Study.docx
Table of Contents
1.0 INTRODUCTION .............................................................................................................................. 1
1.1 Background .................................................................................................................................. 1
1.2 Site Description ............................................................................................................................ 2
1.3 Study Objectives .......................................................................................................................... 2
1.4 Contamination Pathways ............................................................................................................. 3
2.0 METHODS ....................................................................................................................................... 5
2.1 Field Sample Collection ............................................................................................................... 5
2.1.1 Program Timing ........................................................................................................................ 5
2.1.2 Sampling Locations .................................................................................................................. 5
2.1.3 Supporting Water Quality ........................................................................................................ 5
2.1.4 Sediment Quality ...................................................................................................................... 6
2.1.5 Benthic Invertebrate Communities ........................................................................................... 6
2.1.5.1 Station and Habitat Characterization ................................................................................... 7
2.1.5.2 Depositional Sample Collection ........................................................................................... 7
2.1.5.3 Erosional Sample Collection ................................................................................................ 7
2.1.5.4 Taxonomic Analysis and Identification ................................................................................. 8
2.2 Quality Assurance/Quality Control ............................................................................................... 8
2.2.1 Water and Sediment ................................................................................................................ 8
2.2.1.1 Supporting Water Quality ..................................................................................................... 8
2.2.1.2 Sediment Quality .................................................................................................................. 9
2.2.2 Benthic Invertebrates ............................................................................................................... 9
2.3 Data Analysis ............................................................................................................................. 10
2.3.1 Supporting Water Quality ....................................................................................................... 10
2.3.2 Sediment Quality .................................................................................................................... 10
2.3.3 Benthic Invertebrates ............................................................................................................. 10
2.3.3.1 Habitat Characteristics ....................................................................................................... 10
2.4 Invertebrate Tissue Sampling and Analysis ............................................................................... 12
3.0 RESULTS AND DISCUSSION ...................................................................................................... 13
3.1 2009 Supporting Water Quality .................................................................................................. 13
3.2 2009 Sediment Characterization ................................................................................................ 13
3.2.1 Physical Conditions ................................................................................................................ 14
3.2.2 Chemical and Biological Conditions....................................................................................... 15
3.3 Contaminants of Potential Concern in Sediments ..................................................................... 16
3.4 Benthic Invertebrate Communities in Depositional Habitat ........................................................ 16
3.4.1 Sampling Station Characteristics ........................................................................................... 16
3.4.2 Quantitative Analysis ............................................................................................................. 17
3.4.2.1 Community Metrics ............................................................................................................ 17
November 2011 ii 033-1398-001.540
REP 1107_11 Augur Creek Sediment Monitoring Study.docx
3.4.2.2 Individual Benthic Invertebrate Taxa .................................................................................. 17
3.4.2.3 Multivariate Analysis .......................................................................................................... 18
3.4.2.4 Relationship to Temperature and Percent Fines ............................................................... 19
3.5 Erosional Benthic Invertebrate Communities ............................................................................. 19
3.6 Sensitivity of Benthic Invertebrates to Arsenic and Uranium ..................................................... 20
3.6.1 Arsenic ................................................................................................................................... 20
3.6.1.1 Waterborne Arsenic ........................................................................................................... 20
3.6.1.2 Sediment-Associated Arsenic ............................................................................................ 21
3.6.2 Uranium .................................................................................................................................. 23
3.7 Potential Impact of Cattle Disturbance on Benthic Invertebrate Communities .......................... 23
4.0 SUMMARY AND CONCLUSIONS ................................................................................................. 25
5.0 RECOMMENDATIONS .................................................................................................................. 27
6.0 CLOSING ....................................................................................................................................... 28
7.0 REFERENCES ............................................................................................................................... 29
List of Tables
Table 1 Augur Creek Sampling Locations Table 2 QA/QC of Sediment Chemistry Table 3 Augur Creek Water Analytical Results (2004-2009) Table 4 Augur Creek Sediment Analytical Results (2004-2009) Table 5 Flow and Depth of Water in Augur Creek Table 6 Summary of Evidence of Cattle at Augur Creek Table 7 Mean Upstream and Downstream Metric Values for Benthic Macroinvertebrate Data from
Augur Creek, 2009 Table 8 Mean Upstream and Downstream Abundances for Dominant Benthic Macroinvertebrate
Taxa from Augur Creek, 2009 Table 9 Spearman Rank Correlations of Abundances of Benthic Invertebrate Species in
Depositional Habitat with NMDS Dimension Scores Table 10 Spearman Rank Correlations of Selected Habitat Variables Measured in Depositional
Habitat with NMDS Dimension Scores Table 11 Benthic Macroinvertebrate Community Metrics from Erosional Stations in Augur Creek,
2009
List of Figures
Figure 1 Vicinity Map Figure 2 Augur Creek and White King Pond Sampling Stations Figure 3 Mean Water Arsenic Concentration in Augur Creek (2005-2009) Figure 4 Mean Sediment Arsenic Concentration in Augur Creek (2005-2009) Figure 5 Mean Sediment U-238 Concentration in Augur Creek (2005-2009) Figure 6 Comparison of Abundance and Community Composition Indicators for Depositional (DE)
and Erosional (ER) Benthic Invertebrate Samples from Augur Creek (July 2009) Figure 7 NMDS Ordination Plot for Benthic Invertebrate Samples Collected from Augur Creek Figure 8 Relationship of 2009 Benthic Community Summary Metrics to Percent Fines and Water
Temperature
November 2011 iii 033-1398-001.540
REP 1107_11 Augur Creek Sediment Monitoring Study.docx
List of Appendices
Appendix A Data Validation Checklists Appendix B Photographs Appendix C 2009 Raw Benthic Invertebrate Identification and Enumeration for Augur Creek Appendix D 2009 Benthic Invertebrate Identification and Enumeration QAQC Appendix E 2009 Individual Station Data for Physical, Chemical, and Biological Summary Metrics
November 2011 1 033-1398-001.540
REP 1107_11 Augur Creek Sediment Monitoring Study.docx
1.0 INTRODUCTION
1.1 Background
Augur Creek flows adjacent to the White King Mine/Lucky Lass Mines Superfund Site, and has received
surface runoff from mine waste rock piles. Consequently, Augur Creek sediments downstream from the
White King stockpiles contain concentrations of arsenic and uranium elevated relative to upstream sites
(Golder 2008).
The lead agency for White King Mine/Lucky Lass Mines Superfund Site activities is the United States
Environmental Protection Agency (USEPA). Other agencies involved are the United States Forest Service
(USFS), the Oregon Department of Environmental Quality (ODEQ), and the Oregon Department of Energy
(ODE). The Record of Decision (ROD) was issued by the USEPA for the Site in 2001 (USEPA 2001).
The remedial actions included the following major components affecting the major features of the site:
Re-contouring the White King Protore Stockpile so that it is no longer within the Augur Creek 500-year floodplain.
Relocation of Augur Creek into historic channels.
Construction of three wetland berms in the White King meadow.
Revegetation of the three new wetland areas by seeding and planting willow cuttings and bushes.
Removal of designated soils from the White King Mine haul road and certain “off-pile” areas where there was mine-related waste above Site remediation levels, and placement of these materials on the regraded Protore Stockpile, referred to in the design documents as the Consolidated Stockpile.
Excavation of the White King Overburden Stockpile and placement of the material on the Consolidated Stockpile.
Placement of 20 inches of cover soil and four inches of a topsoil / armor gravel mixture on the Consolidated Stockpile surface sufficient to support vegetation, and seeding of the stockpile surface.
Placement of three inches of topsoil and reseeding of those areas where soil has been removed.
Consolidation of “off-pile” material in the Lucky Lass Stockpile, the stockpile regraded, covered with clean soil, and hydroseeded.
In anticipation of the five-year remediation review required under the Comprehensive Environmental
Response, Compensation, and Liability Act (CERCLA), the Oregon Department of Environmental Quality
(ODEQ) had requested that Tronox LLC undertake a study to assess the relative health of the benthic
invertebrate communities in Augur Creek, upstream and downstream of inputs from White King Mine. The
study was requested to address concerns that elevated sediment arsenic concentrations may be impacting
Augur Creek biota, with a resultant deterioration of aquatic ecosystem health downstream. In addition to
assessing aquatic health in Augur Creek, this study also provides a third year of post-construction
November 2011 2 033-1398-001.540
REP 1107_11 Augur Creek Sediment Monitoring Study.docx
monitoring results (2007 to 2009) for water and sediment quality, at established Augur Creek sampling
areas within the vicinity of the White King/Lucky Lass Mines Superfund Site.
Tronox LLC declared bankruptcy, which was finalized on February 14, 2011. Subsequently, Western
Nuclear Inc. has assumed the responsibility of implementing the operation, maintenance, and monitoring
activities required by the ROD, including finalizing this report.
1.2 Site Description
The White King/Lucky Lass Mines Superfund Site is located in south-central Oregon, approximately
17 miles northwest of Lakeview, Oregon (Figure 1). The Superfund site consists of two former uranium
mines, located within one mile of each other. Portions of the Site are within the Fremont National Forest,
managed by the USFS, and portions are on private lands owned by Fremont Lumber and the Coppin
Family Trust.
The two former uranium mines, White King Mine and Lucky Lass Mine, collectively encompass
approximately 140 acres. Prior to remedial actions, major features at the White King Mine included the
White King Pond (formed when water collected in the open mine pit), the former so-called “Protore
Stockpile”, and the former “Overburden Stockpile”. Both stockpiles were actually composed of overburden
materials and were subsequently consolidated as described below. The two stockpiles contained a
combined volume of almost one million cubic yards. The pit pond occupies approximately 13 acres and
contains approximately 80 million gallons of water. Augur Creek runs south through the eastern side of the
White King area and receives discharge from the White King Pond. Major features at the Lucky Lass Mine
include the Lucky Lass Pond and former associated overburden stockpile. This pond covers
approximately 5 acres. The Lucky Lass Stockpile covered approximately 14 acres (5.6 ha) and contained
approximately 260,000 cubic yards of material.
1.3 Study Objectives
A sediment and benthic invertebrate monitoring study was designed to address the ODEQ
recommendation to undertake a study to assess the relative health of the benthic invertebrate communities
in Augur Creek upstream and downstream of inputs from White King Mine. The study had the following
objectives:
Determine if invertebrate community structure was impaired above and below the White King Mine.
Determine if there was any correlation between measures of community structure and arsenic and/or uranium sediment concentrations.
November 2011 3 033-1398-001.540
REP 1107_11 Augur Creek Sediment Monitoring Study.docx
The study design specified that co-located benthic invertebrate samples and sediment quality samples
would be taken from depositional habitats (i.e., areas containing fine-grained sediments and low stream
velocities) in an established sampling area upstream from the White King Stockpile, and an established
sampling area downstream (with supporting water quality samples).
Cattle are permitted to graze in and around Augur Creek within the study area. The effects of their
activities on the creek include disturbance of the substrate and banks, removal of instream and riparian
vegetation, and increased nutrient inputs from manure. Numerous studies (e.g., Quinn et al. 1992,
Scrimgeour and Kendall 2003, Braccia and Voshell 2007) have found that cattle grazing can have a
marked detrimental effect on stream macroinvertebrate communities, causing shifts in taxonomic
composition, density, and diversity. For this reason, cattle grazing in the study area were viewed as a
factor which could confound the ability of the study to ascertain whether differences in benthic invertebrate
communities at upstream and downstream sites were due to mine related contamination or cattle grazing.
Although cattle disturbance in the two sampling areas was monitored quantitatively (e.g., number of cattle
tracks) and incorporated into the statistical analysis along with other quantitative habitat variables
(e.g., dissolved oxygen concentrations), it was known a priori that it might not be possible to separate the
effects of cattle grazing from the effects of sediment contamination.
Based on a request from the agencies, erosional habitat (i.e., riffle/run areas containing larger sediment
size fractions including gravels and cobbles and higher stream velocities) sampling was included in the
study design in addition to depositional habitat sampling, to provide data that would be useful for
comparison by the regulators with other benthic community datasets state-wide and in the Pacific
Northwest. Benthic communities were sampled from erosional habitats upstream of the confluence with
the drainage from Lucky Lass Mine and upstream and downstream from the White King Mine.
1.4 Contamination Pathways
There are many potential pathways for contaminants to have entered Augur Creek from the White King
Mine. Investigation into the pathways of contamination and major contributors was not the objective of this
study, however, the following bullets summarize some of the physical mechanisms by which Augur Creek
sediment and water may have been contaminated upstream and downstream of the White King Mine:
Surface water transport – Contaminants originating from the Lucky Lass Mine upstream of the former White King protore and overburden stockpiles many have been transported downstream. For example, a creek drains the area in the vicinity of the Luck Lass Mine overbuden stockpile, and the confluence of this creek with Augur Creek approximately one mile downstream of the source therefore presented a pathway that may have contributed to contamination in the dissolved phase or suspended particulate matter. Capping of the Lucky Lass Mine overburden stockpile should have largely eliminated this pathway.
November 2011 4 033-1398-001.540
REP 1107_11 Augur Creek Sediment Monitoring Study.docx
Stockpile placement – As shown in Figure 2, the historical location of the stockpiles (both Protore and Overburden stockpiles) immediately adjacent to the stream provided a direct pathway for settling of solids released by air or water. Consolidation and capping of these stockpiles should have largely eliminated this pathway.
Bank erosion – All of the downstream depositional stations exhibited unstable banks, with varying degrees of bank erosion and bank slumping. Large bank failures are of source of potential release of contaminants originally in bank soils to the aquatic environment. These contaminants would be redistributed in Augur Creek by the natural stream flows.
Natural mineralization – Although reference conditions are less contaminated relative to water and sediment contamination adjacent to the White King Mine, the substances evaluated in this report are naturally occurring and are present at low concentrations throughout the study area.
The portion of Augur Creek that spans the upstream and downstream study areas contains a variety of
stream habitats, ranging from runs with moderate riffle development to depositional pools. Overall,
however, the physical properties of the creek (organic carbon contents, particle size distributions, flow
regimes, and riparian habitats) are similar between the upstream and downstream sampling reaches, such
that differences in contamination profile are not attributable to hydrological and hydrodynamic conditions
alone. The elevated concentrations of some substances (e.g., arsenic, uranium) observed in downstream
depositional areas is most likely primarily residual contamination from runoff from the former White King
protore and overburden stockpiles.
November 2011 5 033-1398-001.540
REP 1107_11 Augur Creek Sediment Monitoring Study.docx
2.0 METHODS
2.1 Field Sample Collection
2.1.1 Program Timing
Sampling in Augur Creek was conducted from July 19 to 25, 2009.
2.1.2 Sampling Locations
Eight co-located benthic invertebrate and sediment quality samples from depositional habitats were taken
from areas both upstream and downstream of the ore stockpiles. Two surface water quality samples were
also taken from each sampling area to document supporting stream water quality. The upstream and
downstream areas had previously been sampled annually for sediment and/or water quality from 2005 to
2008. Golder has been monitoring sediment and/or water quality in Augur Creek upstream and
downstream of the ore stockpiles since 2004. However, in 2005 the original 2004 downstream sampling
area was relocated further downstream because gamma radiation measurements performed after the
2004 sampling event revealed that the 2004 water and sediment samples had been collected in an “offpile”
removal area, and therefore did not properly reflect baseline downstream conditions (Golder 2006). The
‘new’ downstream stations were considered far enough away from the planned remediation and stockpile
consolidation area.
Composite benthic invertebrate samples from erosional habitats were taken from Augur Creek in both
upstream and downstream sampling areas and at an erosional habitat reference area upstream of both the
White King and Lucky Lass mine sites. The upstream and downstream sampling areas and the erosional
habitat reference area sampled in 2009 are shown in Figure 2, and station coordinates are provided in
Table 1.
2.1.3 Supporting Water Quality
In situ water quality was measured upstream and downstream of the ore stockpiles. Surface water quality
samples were taken from the furthest upstream and furthest downstream stations within each sampling
area. Stations 1 and 8 were sampled in the downstream area and Stations 1 and 5 were sampled in the
upstream area. Sampling locations are shown on Figure 2; whereas location coordinates are given in
Table 1. Stream temperature, dissolved oxygen, conductivity and turbidity was measured using a portable
HoribaTM model U-10 meter. Water samples were taken for the following parameters and submitted to
General Engineering Laboratories (GEL), Charleston, South Carolina for analysis:
General Water Quality Parameters: pH, hardness, alkalinity, total dissolved solids (TDS), total suspended solids (TSS).
Nutrient Parameters and Algal Productivity: total and dissolved phosphorus, total Kjehldahl nitrogen (TKN), ammonia, nitrate+nitrite, chlorophyll a.
November 2011 6 033-1398-001.540
REP 1107_11 Augur Creek Sediment Monitoring Study.docx
Parameters of Potential Concern: Total and dissolved arsenic and uranium by Inductively Coupled Plasma-Mass Spectrometry (ICP-MS).
Two water samples were submitted for analysis from each of the two sampling areas and two blank
samples (one field blanks and one trip blank) were also submitted for quality assurance/quality control
(QA/QC) purposes. Water samples were shipped in a cooler with ice to the designated analytical
laboratory, to adhere to maximum hold times specified by the laboratory.
Water samples were taken according to protocols consistent with procedures outlined in the Operation,
Maintenance, and Monitoring Plan (OMMP) (Golder 2005).
2.1.4 Sediment Quality
Sediment samples were taken using a pole-mounted Ekman dredge from each of the established
8 sampling stations within the upstream and downstream sampling areas, for a total of 16 samples (see
Figure 2 and Table 1). The sediment stations had previously been sampled by Golder in 2005 and 2007
for sediment quality, and stations had been selected to represent longer-term sediment accumulation
areas with sufficient fine-grained sediments for chemical analyses.
The 8 downstream stations were sampled on July 21 to 23, while the 8 upstream stations were sampled on
July 23 to 25. One station was also sampled in duplicate for quality assurance/quality control (QA/QC)
purposes in each area. Depositional sediments were sampled to a depth of approximately 4 inches
(10 cm). Each sample was homogenized and aliquots submitted to GEL Laboratories LLC for analysis of
the following parameters:
General Sediment Quality Parameters: moisture content, particle size, total organic carbon.
Parameters of Potential Concern: Total arsenic and uranium by ICP-MS.
Sediment samples were shipped in a cooler with ice to the designated analytical laboratory to adhere to
maximum hold times specified by the testing methodologies Sediment samples were taken according to
sampling protocols consistent with procedures outlined in the OMMP and previous sampling events from
2004 to 2007 (Golder 2005). Between each station, sample equipment was decontaminated by washing
with soapy water and rinsing with distilled water.
2.1.5 Benthic Invertebrate Communities
Field sampling methodology for depositional and erosional sample locations, in addition to habitat
characteristics are discussed below.
November 2011 7 033-1398-001.540
REP 1107_11 Augur Creek Sediment Monitoring Study.docx
2.1.5.1 Station and Habitat Characterization
The following was documented in either field notes or photographs taken at each station:
Water depth and velocity.
In situ water quality (stream temperature, dissolved oxygen, conductivity and turbidity).
Wetted width, channel width, embeddedness, channel morphology.
Riparian vegetation, bank stability.
Extent of benthic algae (none, low, medium, high).
Evidence of cattle disturbance: this was quantified on the date of sampling at each station through the use of four 1.2 square yard (1 m2) plots placed 1.09 yards (1 m) from the station in each of the following directions: NW, NE, SW, and SE. Data was collected on the number of tracks present, presence of manure and cow trails within each plot, and if vegetation had been browsed.
2.1.5.2 Depositional Sample Collection
A composite sample was taken from each of the eight sampling stations within each sampling area,
starting at the most downstream station and continuing upstream systematically. The downstream
sampling area was sampled before the upstream area.
A pole-mounted Ekman dredge (36 square inches or 0.0225 m2) was used to obtain three replicate
sediment grab samples at each station (sediment and incidental vegetation). The three replicates were
then composited into a 4-gallon bucket. The resultant composite sample was field sorted using a 500 µm
mesh sieve, with the sorted sample preserved in 10 percent buffered formalin for submission to the
taxonomy laboratory.
2.1.5.3 Erosional Sample Collection
Benthic invertebrate sampling of erosional habitats was conducted according to procedures consistent with
Hayslip (2007) and Hubler (2008). Erosional riffle habitat was identified in Augur Creek at three stations:
downstream and upstream of the White King Mine and at a reference location upstream of the Lucky Lass
Mine discharge (Figure 2). Sampling was conducted starting at the most downstream station and
continuing upstream systematically. At each of the three erosional sampling stations, a total of 8 square
feet (0.74 m2) was sampled with a D-frame kicknet 400 µm mesh that was used to sample eight 1 square
foot (0.092 m2) areas.
For each 1 square foot sample, the kicknet was placed securely against the creek substrate and held in
place, while the upsteam substrate (in the sample area) was systematically picked up and brushed off
within the creek to remove any attached organisms. Once all large substrate was removed from the
sample area, it was transferred to a tray and photographed to document substrate characteristics. The
remaining substrate in the sample area was vigorously stirred and disturbed by hand for thirty seconds.
The kicknet was then removed from the creek and immersed several times to remove fine sediments and
November 2011 8 033-1398-001.540
REP 1107_11 Augur Creek Sediment Monitoring Study.docx
concentrate organisms to the bottom of the net. The net was held vertically and the material within was
rinsed with creek water into the collection chamber of the net using a filtered 400 µm mesh. The eight
samples were then composited into a 4-gallon bucket and the resultant composite sample field sorted
using a 500 µm mesh sieve before preserving in 10 percent buffered formalin for submission to the
taxonomy laboratory.
2.1.5.4 Taxonomic Analysis and Identification
Benthic invertebrate samples were submitted to Lesley Davenport of Sandpiper Biological Consulting in
Victoria, British Columbia for identification to the Lowest Practical Level (LPL) and enumeration. Lowest
practical level for most taxa typically means identification to a genus or species where possible for insects,
oligochaetes, molluscs, microcrustaceans, and mites. This approach concurred with the LPL levels
specified in Hayslip (2007).
2.2 Quality Assurance/Quality Control
2.2.1 Water and Sediment
Quality assurance and quality control (QA/QC) procedures were used during field sampling and laboratory
analysis as specified in the Quality Assurance Project Plan (QAPP, Golder 2003). The following sections
present summary assessment of data validation exercises performed on individual data packages
generated for laboratory analysis associated with the 2009 surface water and sediment collections.
Data validation was performed on each sample delivery group received from the laboratory, using
guidelines established by the Superfund Contract Laboratory program. Data quality criteria is as
presented in USEPA Contract Laboratory Program National Functional Guidelines for Inorganic Data
Review (USEPA 2004), the governing QAPP, and laboratory established recovery indices as appropriate.
Data qualification is applied to the level of detection as relates to the laboratory practical quantification limit
(PQL) for nutrient and inorganic parameters or the laboratory detection limit (DL) appropriate to
radiochemistry parameters. Data qualification is also applied to analytical results as a result of deficiencies
identified during the course of validation. A summary of the data validation qualifiers is provided with the
checklists in Appendix A.
2.2.1.1 Supporting Water Quality
No water quality parameters greater than 5 times the reported detection limit were measured in the field or
trip blanks. All water quality parameters were analyzed within their respective maximum hold times
specified by the testing methodologies, with the exception of pH. The pH tests were performed on day 3,
rendering the out of limit condition for all associated samples. Results have been qualified as
estimated (J). Receipt temperatures were out of limit for several general chemistry parameters. Receiving
temperatures are recommended to be maintained at 4°C (+/- 2°). However, the temperature upon receipt
November 2011 9 033-1398-001.540
REP 1107_11 Augur Creek Sediment Monitoring Study.docx
was 10 and 11°C, qualifying associated results for NO3/NO2-N, NH3-N, TKN, phosphorus, and alkalinity as
estimated (J for detects /UJ for non-detects) for all results. Arsenic was detected in the method blank
associated with the dissolved fraction metals analysis. Associated detects are qualified as estimated with
a high bias (J+), and selected detections below the reporting limit (RL) but above the MDL have been
raised to the RL and qualified as non-detect (U). Calcium was detected in the method blank associated
with the total fraction metals analysis. Associated detects below the reporting limit (RL) but above the
MDL have been raised to the RL and qualified as non-detect (U). The serial dilution for magnesium (Mg)
was out of limit (+/- 10 percent) for sample AC-DS-01. Due to the potential dissimilarity of sample matrix
among this sample group, only sample AC-DS-01 is qualified as estimated (J). Data validation checklists
applied to the surface water samples are provided in Appendix A.
2.2.1.2 Sediment Quality
All sediment quality parameters were analyzed within their respective maximum hold times specified by the
testing methodologies. The concentrations of some parameters varied by more than 20 percent between
duplicate sediments samples (i.e., gravel and total organic carbon in duplicate samples taken from the
upstream station US-3, and total organic carbon and arsenic in duplicate samples taken from downstream
station DS-1 (Table 2)). This is not unusual in sediment samples as sediment quality tends to be spatially
variable, however the level of replication within each study area (n = 8) appeared to be sufficient to
adequately characterize the range of variability in uranium and arsenic concentrations within the two study
areas.
Laboratory duplicate analysis was performed on sample AC-DS-01 for arsenic and uranium. Both of these
metals exceeded the relative percent difference (RPD) maximum (35 percent) for sediment/ soil matrices.
Due to potential dissimilarity of sample matrix among this sample group, only sample AC-DS-01 is
qualified as estimated (J) for both analytes. Matrix spike and matrix spike duplicate recovery exceeded
recovery limits for arsenic. Recovery was low associated with sample AC-DS-01. Therefore, results for
sample AC-DS-01 only are qualified as estimated (J). All samples have been verified against laboratory
raw data as presented in the laboratory data package deliverable. A summary holding time status table,
and a summary of the data validation qualifiers applied to the sediment samples, is provided with the
checklists in Appendix A.
2.2.2 Benthic Invertebrates
Quality control procedures for the benthic invertebrate taxonomy involved re-identification by an
independent taxonomist of two of the 16 samples collected. Overall, results of the re-identification found
several minor discrepancies between the two taxonomists (i.e., disagreement on one or two specimens) in
the identification of seven genera, but the general level of agreement between them was 90 to 95 percent.
Overall, the quality control results indicate that the quality of benthic invertebrate data were acceptable
(see Appendix D).
November 2011 10 033-1398-001.540
REP 1107_11 Augur Creek Sediment Monitoring Study.docx
2.3 Data Analysis
2.3.1 Supporting Water Quality
Upon receipt, the water quality data underwent a QA/QC evaluation (Section 2.2) and were compiled in
Table 3, along with previous post-remediation data collected in 2006 and 2007, and data collected in 2005
prior to site remediation. Average annual concentrations for each parameter were calculated. The
uranium radionuclide concentrations were reported in mg/L and so were converted to pCi/L using the
equation: U238 (mg/kg) * 0.33627 = pCi/g.
2.3.2 Sediment Quality
Upon receipt, the sediment quality data underwent a QA/QC evaluation (Section 2.2) and were compiled in
Table 4 for samples collected in depositional habitats, along with previous post-remediation data collected
in 2006 and 2008, and data collected in 2005 prior to site remediation. Average concentrations for each
parameter were calculated and a two-way Analysis of Variance (ANOVA) procedure used to determine if
there was any significant difference between sediment arsenic concentration between the upstream and
downstream sampling areas, and also over time (p ≤ = 0.05). When the arsenic data were log
transformed, the assumptions of normality (Shapiro-Wilk Test) and homogeneity of variance (Levene's
Test) were met. These assumptions were not met for the uranium dataset, and so the nonparametric
Kruskal-Wallis one way ANOVA procedure was used to determine if there was any significant difference
between sediment uranium concentrations between the upstream and downstream sampling areas, and
also over time (p ≤ = 0.05). Univariate statistical comparisons were carried out using SystatTM version 11.0
statistical software.
2.3.3 Benthic Invertebrates
2.3.3.1 Habitat Characteristics
Quantitive data related to water depth, velocity and in situ water quality were tabulated by site for the
samples collected in depositional habitats with average values in Table 5, while quantitive data related to
cattle disturbance were tabulated by site with average values in Table 6.
Community Metrics
Community metrics for the depositional habitats are shown in Table 7 and community metrics for erosional
habitat are shown in Table 11. From upstream and downstream sampling sites, the following metrics were
calculated:
Total number of organisms present (total abundance)
Total number of taxa present (taxonomic richness)
Total proportion of organisms in the Orders Ephemeroptera, Plecoptera, and Trichoptera (“EPT taxa”) present
November 2011 11 033-1398-001.540
REP 1107_11 Augur Creek Sediment Monitoring Study.docx
The proportion of organisms in the dominant (i.e., most abundant taxon)
Total proportion of chironomids present
Simpson’s Index (D), a measure of taxonomic diversity (calculated as D = 1 - ∑ pi2)
Dominant Taxa
A list of the “dominant” benthic macroinvertebrate taxa (i.e., the taxa that were represented by ten or more
specimens) was derived from the sampling data for the depositional habitat (Table 8). This list contained
16 taxa, which were the subject of further comparisons in abundance between upstream and downstream
locations. This was done to exclude taxa for which only a few organisms were collected.
Comparisons of mean abundance and metric values between upstream and downstream sites were made
using a one-way analysis of variance procedure with interaction on year and site using SPSS™ version
14.0 statistical software (α=0.05). Means were compared using a non-parametric procedure (i.e., two-
sample Kolmogorov–Smirnov test), as the data violated the assumptions of normality and equality of
variance and were therefore not suited to analysis using parametric statistic tests.
Multivariate Statistical Comparison
A multivariate Non-metric Multidimensional Scaling (NMDS) analysis was conducted to identify differences
in benthic community composition between stations using SystatTM version 11.0 statistical software.
Results are presented in Table 9. The NMDS analysis translates a complex data set into a small number
of surrogate variables (‘dimensions’) that retain as much as possible of the variation in the original set of
variables, but facilitate an understanding of overall patterns within the data. NMDS starts by mapping out
the relationships among all stations in the form of a Bray-Curtis dissimilarity matrix. Bray-Curtis distance is
a measure of how dissimilar two stations are. NMDS then tries to find a reduced dimensional (ideally two
dimensional) representation of the stations that retains as much as possible the same pattern of distances
among cases. The resulting dimensions are therefore related to the original variables in multivariate
space, but not necessarily linearly or even monotonically. Station scores along the dimension axes
provide a means of assessing the overall structure of the benthic community at a particular station, as well
as identifying spatial patterns among stations. NMDS has no parametric requirements (i.e., assumptions
of a normal distribution in the underlying data), so it can be applied to data without the need for a specific
data distribution.
The interpretation of an NMDS ordination plot allows the data to be explored in a graphical and intuitive
manner. Stations that appear close together on the plot have relatively similar community composition.
Stations that are distant on the plot have relatively dissimilar community composition. The individual taxa
contributing to dissimilarity among stations (i.e., those taxa whose abundances or biomass vary most
among stations) can be identified by examining how individual taxa correlate to the NMDS dimension
November 2011 12 033-1398-001.540
REP 1107_11 Augur Creek Sediment Monitoring Study.docx
scores. The correlation of the individual taxa to the NMDS scores enables an examination of the main
reasons for a difference in community composition as depicted by the ordination plots.
The abundance of major taxonomic groups were used as the input variables. Values were log10(x+1)
transformed prior to analysis to reduce the influence of numerically dominant taxa and allow the NMDS to
capture a more balanced representation of the community as a whole. Two dimensions were selected for
the NMDS after confirming that the final stress value of the two-dimensional configuration was sufficiently
low (<0.2) for the benthic invertebrate abundance data (Clarke 1993). The resulting NMDS dimensions
were interpreted by conducting Spearman rank correlations between the dimension scores and
abundances of taxa used as inputs to the NMDS (SystatTM version 11.0 statistical software).
Habitat variables including sediment particle size, total organic carbon, sediment arsenic and uranium
(U-238) concentrations, stream velocity, stream depth, dissolved oxygen, and parameters related to cattle
disturbance were also correlated to the NMDS dimensions using Spearman rank correlations. Results are
provided in Table 10.
2.4 Invertebrate Tissue Sampling and Analysis
It was originally intended that invertebrate tissue samples be collected to supplement the sediment and
benthic invertebrate community sampling, to further investigate the bioavailability of arsenic and uranium.
However, the relatively low volumes of invertebrates collected did not permit this to occur.
November 2011 13 033-1398-001.540
REP 1107_11 Augur Creek Sediment Monitoring Study.docx
3.0 RESULTS AND DISCUSSION
3.1 2009 Supporting Water Quality
During 2009, the mean dissolved oxygen concentrations in stream water at the upstream (9.1±1.4 mg/L)
and downstream (9.3±0.4 mg/L) areas were above 9 mg/L. The minimum dissolved oxygen value
recorded in the upstream area was 7.3 mg/L, while the minimum value recorded in the downstream area
was 8.6 mg/L. The range of pH values during 2009 were similar upstream and downstream of the mine
site (7.44 to 7.84 pH units), which is within the ODEQ water quality standard for Goose Lake Basin of 7 to
9 (Oregon Administrative Rules (OAR) 340-041-0145). Levels of conductivity in both sampling areas were
150 S/m.
Total suspended solids were low (~5 mg/L or less) in the stream water at both the upstream and
downstream sites, and algal productivity (as chlorophyll a) was low and mostly not detectable in the stream
water. In 2009, phosphorus and nitrogen concentrations were 1 to 2 times higher at the downstream
locations compared to upstream. Conversely, ammonia concentrations were slightly higher upstream
compared to downstream. Overall, the 2009 nutrient data do not appear to indicate that cow manure
inputs downstream affected stream water quality. However, it is possible that a proportion of the available
nutrients at the upstream and downstream stations may have been assimilated by the abundant instream
vegetation at these locations.
Both arsenic and uranium were mostly present in dissolved forms in stream water upstream and
downstream of the White King Mine. Downstream total arsenic concentrations were on average 10 times
higher than in the upstream area, but concentrations were well below the Oregon chronic water quality
criteria for arsenic (48 µg/L; ODEQ 2009; Figure 3).
3.2 2009 Sediment Characterization
This section summarizes the physical and ecological condition of the sediment sampling areas from both
erosional and depositional areas of Augur Creek. These stream characteristics are important because
physical and habitat conditions in streams play a substantial role in influencing the observed invertebrate
community composition.
Appendix E presents the individual station data for summary physical, chemical, and biological metrics,
including:
Table E1 – Stream habitat parameters (hydrological parameters and riparian characteristics) for all sampled stations;
Table E2 – Sediment chemistry, water quality, and biological parameters for upstream depositional stations;
November 2011 14 033-1398-001.540
REP 1107_11 Augur Creek Sediment Monitoring Study.docx
Table E3 – Sediment chemistry, water quality, and biological parameters for downstream depositional stations;
Table E4 – Water quality and biological parameters for erosional stations.
These data were tabulated in response to a request from the Oregon Department of Environmental Quality
(ODEQ; January 2011) following review of the draft document.
3.2.1 Physical Conditions
On average, sediments upstream of the mine site were mostly a mix of sand and silt with some gravel and
clay (Table 4). The relative proportions of these sediment types varied according to sampling station
(Table E2), with:
~50 percent sand and approximately equal proportions of gravel and silt at stations US-1, US-2 and US-3.
~50 percent silt with approximately equal proportions of gravel and sand at stations US-4, US-5, and US-6.
~60 percent sand and silt with mostly clay at stations US-7, and US-8.
On average, sediments downstream of the mine site were also mostly a mix of sand and silt with some
gravel and clay (Table 4). The relative proportions of these sediment types varied according to sampling
station (Table E3), with:
~50 percent sand and approximately with mostly silt and clay at stations DS-1, DS-2, DS-3 and DS-6.
~60 to 90 percent sand and gravel with some silt and clay at stations DS-4 and DS-5.
~86 percent silt and ~13 percent sand at station DS-7.
49 percent silt and clay, with 39 percent sand and 12 percent gravel at DS-8.
Based on particle size distributions, the physical structure of the downstream sediments are more variable
than those upstream. On average, total organic carbon content of downstream sediments was
approximately half the organic carbon content of the upstream sediments (26,115 mg/kg vs. 47,338 mg/g,
respectively). Upstream organic carbon levels were variable and ranged from 10,200 mg/kg at US-1 to
130,000 mg/kg at US-5; whereas downstream levels ranged from 5,150 mg/kg at DS-5 to 99,400 mg/kg at
DS-7.
Table E1 provides additional details of stream channel characteristics, including width, degree of
embeddedness, channel morphology, bank stability, and associated riparian vegetation. Both upstream
and downstream areas contained a high proportion of stations with unstable banks, including eroding and
slumping river banks. More stations were located where wetted widths fell between 65 cm and 150 cm,
although the channel morphology and degree of embeddedness varied significantly among stations. The
riparian vegetation adjacent to the streams consisted of grasses and sedges as the dominant flora at most
November 2011 15 033-1398-001.540
REP 1107_11 Augur Creek Sediment Monitoring Study.docx
stations, with sage brush, hellebores, and herbaceous plants found at varying density across the study
area.
3.2.2 Chemical and Biological Conditions
Tables E2 and E3 present the results of select chemical parameters (water and sediment quality) for each
of the individual sampling stations, and also summarize key biological parameters for upstream (Table E2)
and downstream (Table E3) depositional sediments. Summary metrics from the benthic community
assessment are included by individual sampling station; as these data are discussed in detail in Sections
3.4 and 3.5, they are not discussed here. However, potential indicators of environmental disturbance,
including density of cattle tracks, water quality characteristics (flow velocity, pH, temperature, conductivity,
turbidity, dissolved oxygen) and sediment quality characteristics are summarized.
The dissolved oxygen concentrations ranged from 7.6 to 11.2 across all depositional stations, indicating
values slightly below saturation. The measures of conductivity, turbidity, and pH indicated similar
conditions at most stations, although stations AC-US-1 and AC-DS-2 exhibited higher turbidty than other
stations, and stations AC-DS-6 through AC-DS-8 were slightly alkaline (pH 8.9 - 9.5). The most notable
differences among stations were related to the following factors:
Temperature – Water temperatures ranged from 12 degrees to 30 degrees, with wide variability in measurements among both upstream and downstream stations;
Cattle signs – Although some signs of cattle encroachment (tracks and/or manure signs) were documented at all stations except AC-US-8, the density of these signs varied significantly across the study area. In particular, the number of cattle signs increased substantially in downstream locations, with more than half of the stations exhibiting a density of more than 12 signs (per standard area), whereas none of the upstream locations reached this density. On average, there were four times the number of cattle tracks at stations downstream vs. upstream of the mine (13 vs. 3; Table 6).
From the above, it is evident that a number of physical factors, particularly substrate type, water
temperature, and sediment disturbance due to cattle use, may confound the assessment of potential
chemical-based influenced on biological communities. Cows were observed to utilize the stream on a
frequent basis and subsequently trample the bottom substrates in both upstream and downstream
sampling areas (Appendix B, Appendix E). This means that sediments in the downstream area, in
particular, would have been subject to disturbance and mixing of sediment layers, at least at some
locations. The implication of this disturbance on the biological assemblages is complex because some
taxa are enhanced and others suppressed by physical disturbances, depending on the successional stage
of the disturbed sediments.
November 2011 16 033-1398-001.540
REP 1107_11 Augur Creek Sediment Monitoring Study.docx
3.3 Contaminants of Potential Concern in Sediments
The mean arsenic concentration in sediments sampled downstream of the remediated White King site in
2009 (70.2 mg/kg) was an order of magnitude greater than the corresponding mean concentration from the
upstream area (2.08 mg/kg). The difference between sediment arsenic concentrations upstream and
downstream of the mine site in 2009 was statistically significant (p<0.05; Figure 4). There was no
significant difference in arsenic concentrations over time in sediments collected in 2009 vs. 2007 vs. 2005
(p>0.05).
Downstream sediment arsenic concentrations ranged from 8.21 mg/kg at station D/S-1 to 199 mg/kg at
station D/S-5, indicating substantial variability in arsenic concentrations within a relatively short stretch of
stream (~110 m; ~7 to 40 m between stations). All eight sediment arsenic concentrations sampled
downstream in 2009 exceeded the Oregon Freshwater Sediment Screening Level for arsenic (6 mg/kg;
ODEQ 1998) and arsenic concentrations in ~60 percent of the downstream samples were above the
consensus-based freshwater sediment quality guideline (probable effect level) recommended by McDonald
et al. (2000; Figure 4). Arsenic concentrations in the upstream area were all below 6 mg/kg and therefore
did not exceed the sediment quality guidelines. Variability was also observed in arsenic concentrations at
the upstream area but it was proportionally less than for the downstream area.
Similar to arsenic, there was a statistically significant difference between sediment uranium (as U-238)
concentrations upstream and downstream of the mine site in 2009 (p<0.05; Figure 5). Mean uranium
concentrations in downstream sediments were approximately forty times higher than mean concentrations
upstream (14.8 vs. 0.35 pCi/g). There was no significant difference in uranium concentrations over time in
sediments collected in 2009 vs. 2007 vs. 2005 (p>0.05).
Contaminant concentrations in sediments can often be inherently variable, both spatially and over time.
However, variability in contaminant concentrations within the upstream and downstream sampling areas
probably have been accentuated by cattle disturbance in the stream. Cow-related disturbance and mixing
of the sediments in Augur Creek could therefore be a confounding factor in the assessment of sediment
quality over time downstream from the mine.
3.4 Benthic Invertebrate Communities in Depositional Habitat
3.4.1 Sampling Station Characteristics
Quantitative habitat characteristics such as stream velocity, stream depth, in situ water quality cattle tracks
and cattle manure are summarized in Tables 5 and 6, with individual station data presented in Appendix
E2 and E3. Representative photographs showing stream habitat characteristics at the upstream and
downstream sampling areas are presented in Appendix B. Generally the downstream sampling area was
shallower with lower velocities compared to upstream. The downstream area also showed evidence of
November 2011 17 033-1398-001.540
REP 1107_11 Augur Creek Sediment Monitoring Study.docx
higher cattle use. The sediment and substrate in the downstream area was considerably more compact
than the upstream area. Riparian vegetation was also noticeably different; with the downstream area
primarily pasture with grasses and some sedges in comparison to the upstream site which was dominated
by sagebrush (Appendix B). Significant bank erosion was apparent at the downstream locations (Photos 5
and 7). Tree cover was absent from the upstream and downstream sites with coniferous forest removed
65 feet (20 m) and 16 feet (5 m), respectively. The riparian vegetation at the reference erosional site
consisted of grasses and forbs with mature coniferous forest within 10 feet (3 m) of the creek resulting in
some canopy overhanging the creek.
3.4.2 Quantitative Analysis
The raw benthic invertebrate taxonomic and enumeration data for the upstream and downstream
depositional communities are presented in Appendix C. Univariate metrics for benthic community
composition (abundance, richness, dominance, and contributions of major taxonomic groups) are provided
for each sampling station in Appendix E (Tables E2 and E3 for depositional stations). Overall, there are
low abundances of invertebrates throughout Augur Creek in both upstream and downstream reaches; it
does not appear to be a very productive watercourse.
3.4.2.1 Community Metrics
The total abundance of organisms, taxonomic richness, abundance of EPT organisms, and number of EPT
taxa were significantly (p<0.05) higher at upstream sites than at downstream sites (Table 7; Figure 6). An
average of 12 times more organisms, and twice as many taxa, were found in upstream versus downstream
samples. Also, chironomids composed a significantly higher percentage of the samples at upstream
versus downstream sites.
In contrast, the mean percentage of organisms in the most common taxon in each sample, the mean
percentage of EPT taxa in the samples, and community diversity (Simpson’s diversity index) did not vary
significantly between upstream and downstream sites (Table 7; Figure 6).
3.4.2.2 Individual Benthic Invertebrate Taxa
In terms of the abundance of the 16 dominant taxa, in most cases abundance was highly variable among
sites within the upstream and downstream sampling areas (Table 8). Consequently, although the
abundance of most of these taxa was higher at upstream sampling sites, the difference in mean
abundance at upstream versus downstream sites was not significant (p>0.05).
Nonetheless, numbers of the two most abundant taxa overall, the limephilid caddifly larvae Pschoglypha,
and the pea clam Pisidium, were significantly higher (p<0.05) at upstream sampling locations than at
downstream sites. The leech Helobedella stagnalis was more abundant downstream than upstream from
the mine (Table 8).
November 2011 18 033-1398-001.540
REP 1107_11 Augur Creek Sediment Monitoring Study.docx
3.4.2.3 Multivariate Analysis
Two NMDS dimensions were derived from the benthic community data. The stress value of the final
configuration was 0.11, which indicates that the two-dimensional representation of the data (Figure 7)
provides a good representation of ecological patterns in the input data (Clarke 1993). Samples that are
close together on this plot had relatively similar benthic communities, whereas samples that are far apart
were relatively dissimilar. Spearman rank correlations between the original taxa abundances and the
NMDS Dimension variables indicate which taxa were most closely associated with each of the Dimension
variables (Table 9). For example, taxa that are positively correlated to Dimension 1 exhibited relatively
higher abundances at stations with higher scores for Dimension 1 (i.e., on the right side of Figure 7).
NMDS Dimension 1 had a strong positive relationship with Helobdella stagnalis (rs=0.69) and a strong
negative relationship with Psychglypha (Trichoptera; rs=-0.86), Pisidium, Spaerium (Bivalvia; rs=-0.86,
-0.58), Thienemannimyia (Chironomidae; rs=-0.77), and Cordulegaster (Odonata; rs=0.-74). As Dimension
1 scores increase (to the right of Figure 7), abundances of H. stagnalis increase and as Dimension 1
scores decrease, abundances of Psychoglypha, Pisidium, Spaerium, Thienemannimyia, and
Cordulegaster increase. Dimension 2 was strongly positively correlated with a Megaloptera species Sialis
(rs=0.68) and strongly negatively correlated with Baetis (Ephemeroptera; rs=-0.66) and Procladius
(Chironomidae; rs=-0.65).
The clearest separation is apparent between upstream and downstream locations along Dimension 1.
Upstream stations clustered with relatively low Dimension 1 scores (i.e., high abundance of Trichoptera
[caddisfly larvae] and Bivalvia [clams]) whereas downstream stations clustered with higher scores,
suggesting a greater abundance of Hirudinea (leeches). Separation along Dimension 2 was less clear and
there did not appear to be any clear separation between upstream and downstream locations. Based on
clustering observed in the NMDS ordination plot, differences between upstream and downstream locations
appear to be more significant than differences between replicates at each location (Figure 7).
Habitat and physiochemical variables including sediment particle size, total organic carbon, arsenic
concentrations, uranium concentrations, velocity, depth, dissolved oxygen, and cattle disturbance were
correlated along the dimensions associated with the benthic invertebrate communities (Table 10). Arsenic
and uranium concentrations in sediments (rs=0.86, 0.83) as well as number of cattle tracks (rs=0.63) were
positively correlated with Dimension 1, indicating that benthic communities at downstream locations are
correlated with higher arsenic and uranium concentrations in sediments, as well as increased disturbance
by cattle. The other habitat and physiochemical variables did not correlate significantly with either
dimension.
November 2011 19 033-1398-001.540
REP 1107_11 Augur Creek Sediment Monitoring Study.docx
3.4.2.4 Relationship to Temperature and Percent Fines
In review comments on the draft version of this report, ODEQ (2011) commented on the potential
sensitivity of benthic community composition to two specific environmental factors, specifically water
temperature and sediment composition (texture and particle size). To evaluate the potential linkage
between these factors and biological assemblages, we explore the statistical associations observed
between these modifying factors and benthic abundance and taxonomic richness. Figure 8 presents
scatterplots of these associations, subdivided by benthic metric and station type (upstream versus
downstream).
No consistent statistical relationships were observed in this analysis; the results of linear regressions for
each combination of biological metric (richness, total abundance), environmental factor (temperature,
percent fines), and station type (upstream, downstream) were not statistically significant (p>0.05).
Figure 8 indicates a relatively flat biological response across a range of values for each factor. Although
there are clear systematic differences between upstream and downstream stations, the temperature and
percent fines measures do not appear to explain much if any of the observed variability.
The above analysis is imprecise in that there are numerous sources of uncertainty in both the
environmental factors (e.g., point estimates of temperature may not reflect longer term conditions) and the
biological metrics (i.e., biological assemblages are inherently variable over space and time, and difficult to
describe with univariate metrics). However, the analysis is sufficient to provide confidence that an analysis
of covariance using these environmental indicators would be unlikely to meaningfully improve our
understanding the factors influencing biological community composition.
3.5 Erosional Benthic Invertebrate Communities
The raw bentic invertebrate taxonomic and enumeration data for the upstream and downstream erosional
habitat communities are presented in Appendix C. Individual station data for key indicator metrics are
provided in Appendix E (Table E4 for erosional samples). Table E4 also summarizes some water quality
indicators for the reference erosional station (REF ER), which was located upstream of the impacted area
and the upstream White King Mine stations. The fact that the eight erosional habitat samples taken from
the downstream and upstream riffle/run areas were combined into a single composite sample for each
area prevented statistical comparisons of the upstream versus downstream erosional benthic communities.
However, a number of taxa (e.g., families of Plecoptera, Trichoptera, and Coleoptera) were present in the
erosional habitat samples that were absent from the depositional habitat samples.
Invertebrate abundance in the downstream composite sample was almost twice that observed in the
upstream sample, whereas the number of taxa and the diversity in both composite samples was
approximately the same (Table 11). EPT organisms (dominated by larval Philopotamidae) were much
more abundant in the upstream sample, whereas the opposite was true for chironomids. Several
November 2011 20 033-1398-001.540
REP 1107_11 Augur Creek Sediment Monitoring Study.docx
individual taxa, include a chironomid (Diptera: Chironomidae: Thienemannimyia sp.), a blackfly larva
(Diptera: Simuliidae: Simulium sp.), and a damselfly nymph (Odonata: Coenagrionidae: Argia sp.) were
considerably more common in the downstream sample than in the upstream composite sample.
3.6 Sensitivity of Benthic Invertebrates to Arsenic and Uranium
The benthic invertebrate data analyses indicated that the limephilid caddifly larvae Pschoglypha, the pea
clam Pisidium, the clam Spaerium, the chironomid Thienemannimyia, and the dragonfly larvae
Cordulegaster, were significantly more abundant upstream of the stockpiles compared to downstream. By
comparsion, the leech H. stagnalis was significantly more common downstream of the stockpiles. The
correlation analysis indicated that downstream communities were significantly correlated with higher
arsenic and uranium concentrations in sediments, as well as increased disturbance by cattle. The overall
reduction in abundance and taxonomic richness (but not diversity) could potentially be due to exposure to
higher concentrations of arsenic, uranium and/or the effects of cattle disturbance or other habitat variables
that were not tested. In the absence of toxicological data specifically relating to the toxicity of arsenic or
uranium to the key taxa identified in this study 1, available information concerning the toxicity of arsenic and
uranium to freshwater benthic invertebrates was reviewed.
3.6.1 Arsenic
3.6.1.1 Waterborne Arsenic
Benthic invertebrates appear to be less sensitive to waterborne arsenic exposure than biota residing in the
water column, such as the zooplankton species Daphnia magna (Suhendrayatna and Maeda 1999) and
Ceriodaphnia dubia (Spehar and Fiandt 1986), Cyclops vernalis2 (Borgmann et al. 1980). Arsenic
sensitivity within benthic invertebrate communities is variable, with some invertebrates such as chironomid
midge larvae relatively tolerant of arsenic exposure (96-h LC50 estimates of 9.8 – 919 mg/L; Jeyasingham
and Ling 2000) compared to other invertebrates that include the isopod Asellus aquaticus, the snail Physa
fontinalis, the mayfly Heptagenia sulfurea and the caddisfly Hydropsiche pellucidula (96-h LC50 estimates
of 1.65-2.4 mg/L; Canivet et al. 2001). Canivet et al. (2001) found the amphipod Gammarus fossarum to
be particularly sensitive (96-h LC50 estimate of 0.2 mg/L).
Jeyasingham and Ling (2000) reported that although chironomid midge larvae were relatively tolerant of
waterborne arsenic exposure, arsenic toxicity depended on the arsenic species tested, with 96-h LC50
estimates ranging from 17–64 mg/L for As(III) to 104–919 mg/L for As(V). In oxygenated and
circumneutral pH streams, such as Augur Creek in July 2009, a large proportion of the dissolved arsenic
fraction would most likely be present as the As(V). Dissolved As(V) is less mobile and less toxic compared
with the other dominant inorganic arsenic species in freshwater environments (As[III]). 1 Pschoglypha, Pisidium, Spaerium, Thienemannimyia, Cordulegaster, H. stagnalis. 2 The lowest available toxicity threshold for invertebrate species was the 14-d EC20 (sublethal concentration causing
20 percent reduction in growth) of 320 μg/L for the copepod Cyclops vernalis.
November 2011 21 033-1398-001.540
REP 1107_11 Augur Creek Sediment Monitoring Study.docx
Longer-term toxicity testing with another benthic invertebrate, the mayfly Baetis tricaudatus indicated that
the 12-d LC50 (arsenic as As[V]) was > 0.98 mg/L, while the 12-d LC50 (arsenic as As[III]) was 0.55 mg/L
(Irving et al. 2008). Mayfly growth and development were significantly inhibited after separate 12 day
exposures to 1 mg /L of arsenic as As[V] and as As[III]. Similarly, Spehar et al. (1980) reported that As[III]
induced 100 percent mortality in Gammarus pseudolimnaeus after 14 days of exposure to 1 mg/L,
whereas exposure to 1 mg/L of As[V] only caused 20 percent mortality.
3.6.1.2 Sediment-Associated Arsenic
A review of the available literature revealed that information related to the toxicity of arsenic to biota
residing in freshwater sediments is considerably more limited than that available for biota residing in the
water column. For example, there were no studies available where arsenic toxicity thresholds had been
derived from spiked-sediment toxicity tests specifically designed to determine cause and effect
relationships due to arsenic exposure. This could be due to the relatively complicated biogeochemistry
and bioavailability of arsenic, in addition to concerns regarding methodologies associated with these
laboratory-based toxicity tests.
Reviews of arsenic toxicity to sediment dwelling biota with the view to deriving sediment quality guidelines
have therefore concentrated on the compilation of information from field-based studies, where sediment
quality and effects on resident biota (typically invertebrate communities) have been concurrently assessed
(Environment Canada 1999, MacDonald 2000). In some studies, sediment toxicity testing was also
determined as part of the synoptic sediment assessment. Compiled field-based data are intended to
provide an indication of the association between sediment arsenic concentrations and observed effects on
resident aquatic biota, but do not infer cause and effect data per se. This is because observed effects on
benthic invertebrate communities can be influenced by other factors such as sediment particle size, other
contaminant concentrations, and metal hydroxides and sulfides, which can affect the bioavailability of
arsenic to aquatic biota (Environment Canada 1999).
From a review of the effects and toxicity information compiled by Environment Canada (1999) in the
Biological Effects Database for Sediments (BEDS), it is evident that there is substantial variability in the
responses of benthic invertebrate communities to exposure to arsenic and other physicochemical
stressors, and that the bioavailability of contaminants like arsenic often depends on the site-specific
conditions. Even data related to whole sediment toxicity testing can be variable, most probably due to
variation in the bioavailability of contaminants of concern in the sediments being tested and the physical
characteristics of those sediments.
November 2011 22 033-1398-001.540
REP 1107_11 Augur Creek Sediment Monitoring Study.docx
Environment Canada (1999) concluded there was a biological effect associated with arsenic sediment
concentrations ranging from 3.86 to 404 mg/kg in 53 of the 242 entries in the BEDS database. They
determined that in 189 of the 242 entries in the database there was no biological effect that could be
associated with sediment arsenic concentrations ranged from 3.86 to 404 mg/kg. This reflects the
substantial variability present in biological effect/sediment databases, such as those used to derive arsenic
sediment quality guidelines in North America. For example, some studies in the BEDS database suggest
that arsenic concentrations as high as ~50 to ~260 mg/kg have not resulted in ecological/toxicological
effects on aquatic biota3, but other studies included in the same database indicate that this concentration
range has been associated with effects on aquatic biota4.
To address similar variability in the field-based dataset used by MacDonald et al. (2000) to develop
consensus-based sediment quality guidelines, the authors evaluated each proposed guideline for reliability
using matching sediment chemistry and toxicity data from field studies conducted throughout the United
States. The ability of the arsenic threshold effect concentration (TEL = 9.79 mg/L) in predicting the
absence of sediment toxicity was evaluated, as was the ability of the arsenic probable effect concentration
(PEL = 33 mg/L) to predict sediment toxicity. The threshold that defined if the TEL or PEL provided an
accurate basis for predicting toxicity or not predicting toxicity, in freshwater sediments throughout North
America, was a predictive ability of ≥75 percent.
The predictive ability of the arsenic PEL was only marginally above the acceptability threshold
(76.9 percent), unlike PEL thresholds derived for other metals which correctly predicted toxicity in
~90 percent of the samples evaluated5. This indicates that the PEL of 33 mg/L derived for arsenic may not
be as accurate in predicting toxicity as PEL thresholds derived for other metals, possibly due to the
relatively complicated arsenic biogeochemistry and bioavailability relative to some other metals.
Nevertheless, the mean arsenic concentration in Augur Creek sediments downstream of the mine in 2009
was approximately double the arsenic PEL threshold. Consequently, there is the potential that observed
effects in the benthic invertebrate community may be associated with exposure to arsenic in the stream
sediments, despite the marginal ability of the guideline to predict toxicity to benthic invertebrates.
The other applicable arsenic sediment quality guidelines for the Augur Creek sediment study were the
consensus-based arsenic TEL, which had a predictive ability just below the acceptability criteria set by
MacDonald et al. (2000) and the Oregon Freshwater Sediment Screening Level for arsenic (6 mg/kg;
ODEQ 1998). The Oregon Freshwater Sediment Screening Level for arsenic is a conservative screening
3 For example, a high abundance of benthic invertebrates or major taxonomic groups were not found to cause toxicity
when subjected to standard toxicity testing, or observed effects were not due to arsenic concentrations in the sediments.
4 For example, a low abundance of benthic invertebrates or major taxonomic groups were found to cause toxicity when subjected to standard toxicity testing, or observed effects could be associated with arsenic in the sediments.
5 The consensus-based arsenic TEL had a predictive ability of 74.1 percent.
November 2011 23 033-1398-001.540
REP 1107_11 Augur Creek Sediment Monitoring Study.docx
level value intended as an initial tool in the risk assessment process (Level II). The screening level value
refers to arsenic as As(III) in the sediments and is based on the TEL of 5.9 mg/kg given in screening quick
reference tables developed for the National Oceanic and Atmospheric Administration (NOAA), which is
intended to be used as a preliminary screening tool and does not represent criteria or clean up levels
(NOAA 1999).
3.6.2 Uranium
There was limited information available regarding the sensitivity of benthic invertebrates to uranium, and
toxicity thresholds have only been established for a few standard toxicity test species in waterborne toxicity
tests. The amphipod Hyallela azteca was more sensitive to uranium exposure over a 96-hour exposure
relative to the midge Chironomus tentans, with an estimated lethal toxicity threshold (LC50) of 8.2 mg/L
compared to 33.5 mg/L (Liber and White Sobey, unpublished data, cited in Muscatello 2004). Similar
toxicity thresholds for a chironomid species were reported by Peck et al. (2002) in 72-hour toxicity tests at
pH 6 and pH 4 with LC50 toxicity estimates of 36 and 58 mg/L, respectively. Toxicity threshold data
generated by Liber and George (2000) and Poston et al. (1984) suggest that water fleas that reside in the
water column may be more sensitive to uranium exposure than invertebrates that reside in the sediment.
For example the 48-hour LC50 estimate for the daphnid C. dubia was 0.43 mg/L, and the Lowest
Observed Effect concentration (LOEC) during a 5-day test by Poston et al. (1984) was 0.52 mg/L.
Only a few studies have investigated the toxicity of uranium on sediment dwelling biota, with variability in
the toxicity thresholds generated. Beak International Inc. (1998) reported 96-hour LC20 toxicity thresholds
of 15 mg/kg for juvenile amphipods (H. azteca) and 57 mg/kg for adult amphipods. Longer–term toxicity
testing with H. azteca generated a LC50 toxicity threshold of 2,442 mg/kg and an IC50 (growth inhibition)
of 1,918 mg/kg (Liber and White Sobey, unpublished data, cited in Muscatello 2004). Similar toxicity
testing with the chironomid C. tentans suggested that midge larvae may be more tolerant of sediment
associated uranium than amphipods, particularly with respect to survival (LC50 = 10,551 mg/kg; IC50
[growth inhibition] = 2,695 mg/kg).
3.7 Potential Impact of Cattle Disturbance on Benthic Invertebrate Communities
In contrast to the literature concerning the toxicological effects of arsenic and uranium in sediments to
benthic macroinvertebrates, there is abundant literature that indicates that benthic invertebrate
communities are significantly affected by the disturbance of their habitat due to cattle grazing. Braccia and
Voshell (2007) found highly significant and strong declines in macroinvertebrate community metrics such
as abundance and diversity as the density of cattle increased, and Silla (2005) found that species richness
was significantly lower in grazed vs. ungrazed sites. Quinn et al. (1992) and Scrimgeour and Kendall
(2003) found that the taxonomic composition of invertebrate communities in intensively grazed streams
varied significantly relative to control streams. Braccia and Voshell (2006) identified 97 benthic
November 2011 24 033-1398-001.540
REP 1107_11 Augur Creek Sediment Monitoring Study.docx
macroinvertebrate taxa whose abundance varied with grazing intensity, and found that benthic
macroinvertebrate communities in grazed streams differed markedly from those in ungrazed streams.
Based on Multi-Dimensional Scaling (MDS) analyses, the benthic invertebrate communities at grazed sites
were distinct from those at ungrazed sites (Silla 2005). Changes in invertebrate communities in response
to grazing may not occur in a linear fashion. Instead, communities remain stable until a threshold level of
disturbance is reached (Braccia and Voshell 2007, Herbst and Kane 2004).
November 2011 25 033-1398-001.540
REP 1107_11 Augur Creek Sediment Monitoring Study.docx
4.0 SUMMARY AND CONCLUSIONS
The following conclusions can be drawn from the 2009 Augur Creek sediment and benthic invertebrate
monitoring study.
In 2009, sediment arsenic and uranium concentrations were significantly higher downstream from White King Mine compared to those measured upstream. Over time since 2005, there has been no significant change in arsenic and uranium concentrations in upstream or downstream sediments.
Benthic invertebrate abundance and taxonomic richness in depositional habitat was significantly lower downstream from the White King Mine compared to upstream. An average of 12 times more organisms, and twice as many taxa, were found in upstream versus downstream samples.
In contrast, the diversity of the upstream and downstream communities (as defined by Simpson’s diversity index) and the mean abundance of dominant taxa did not vary significantly between upstream and downstream sites.
Multivariate analysis of the 2009 benthic community data indicated that the caddisfly Psychglypha, the bivalves, Pisidium and Spaerium, the chironmid Thienemannimyia, and the dragonfly Cordulegaster were significantly more abundant at the upstream vs. the downstream sampling areas. Conversely, the leech H. stagnalis was less abundant at the upstream vs. the downstream sampling areas. Statistical analysis indicated that downstream benthic communities were significantly correlated with higher arsenic and uranium concentrations in sediments as well as increased disturbance by cattle in the downstream sampling area.
At erosional sites, families of Plecoptera, Trichoptera, and Coleoptera were present that were absent from the depositional habitat samples. Invertebrate abundance in the downstream composite sample was almost twice that observed in the upstream sample, whereas the number of taxa and the diversity in both composite samples was approximately the same. EPT organisms (dominated by larval Philopotamidae) were much more abundant in the upstream sample, whereas the opposite was true for chironomids. Several individual taxa, include a chironomid (Diptera: Chironomidae: Thienemannimyia sp.), a blackfly larva (Diptera: Simuliidae: Simulium sp.), and a damselfly nymph (Odonata: Coenagrionidae: Argia sp.) were considerably more common in the downstream sample than in the upstream composite sample.
There is substantial variability in biological effect/sediment databases such as those used to derive arsenic sediment quality guidelines in North America. For example, some studies in the BEDS database (Environment Canada 1999) suggest that arsenic concentrations as high as ~50 to ~260 mg/kg have not resulted in ecological/toxicological effects, while other studies included in the same database indicate that this concentration range has been associated with effects on aquatic biota.
Despite the marginal ability of the arsenic PEL guideline to predict toxicity to benthic invertebrates, there is the potential that observed effects in the Augur Creek benthic invertebrate community may be associated with exposure to arsenic in downstream sediments.
Overall, benthic invertebrate communities in Augur Creek depositional habitats were significantly different downstream of the White King Mine, compared to upstream, in terms of abundance of invertebrates and taxonomic richness, but not diversity. This difference in benthic communities correlated with significantly higher arsenic and uranium concentrations in the sediments downstream of the mine as well as cattle disturbance.
November 2011 26 033-1398-001.540
REP 1107_11 Augur Creek Sediment Monitoring Study.docx
Cattle disturbance remains a confounding factor in the aquatic health assessment of Augur Creek within the vicinity of the White King Mine/Lucky Lass Mine Superfund Site. Cattle disturbance could be a potential confounding factor in sediment quality monitoring at the downstream sampling area due to possible mixing of recent and historically deposited sediment.
In conclusion, it appears that physical substrate and disturbance status are significant confounding factors
in the assessment of resident invertebrate communities. Based on review of the draft report, ODEQ
(2011) concurred, indicating that "riparian conditions and instream habitat are likely significant issues for
the benthic invertebrate assemblage relative to the presence of metal toxicity."
Priorities for future site management should emphasize the promotion of best management practices,
specifically those that preclude cattle and promote riparian/ground cover growth. There are several
benefits to this approach, including:
improvement of riparian condition and reduced erosion (which will improve the physical and habitat factors influencing benthic communities);
improved water quality due to reduced organic enrichment from cattle manure;
reduced contributions of arsenic and uranium from the surrounding sediments and stockpiles, due to reduced mass loadings from sloughing events and bank erosion.
These site management priorities will offset some of the uncertainty in the study design. It is not currently
known whether the cattle influence obscures a significant influence of chemical-related factors
(e.g., arsenic, uranium); however, it is likely that adoption of best management practices would improve
the ecological status of Augur Creek in an ecologically meaningful way.
November 2011 27 033-1398-001.540
REP 1107_11 Augur Creek Sediment Monitoring Study.docx
5.0 RECOMMENDATIONS
Contaminants and cattle grazing may both be impacting invertebrate community structure in Augur Creek
downstream of the White King Mine. The confounding effect of cattle on the experimental design for the
2009 study therefore makes it difficult to draw conclusions regarding the effect of sediment metal
concentrations on the invertebrate community of Augur Creek. To effectively separate the effect of cattle
from the effect of metal concentrations in the field, cattle would need to be excluded from the study area.
To date, attempts to exclude cattle from the study area have not proven effective.
Therefore, due to the potential effects of cattle on the benthic invertebrate community and in the absence
of a definitive causal relationship demonstrating that differences in the upstream and downstream benthic
invertebrate communities are due to metals impact from the White King and Lucky Lass mines, additional
remedial actions for Augur Creek sediments are not recommended.
November 2011 28 033-1398-001.540
REP 1107_11 Augur Creek Sediment Monitoring Study.docx
6.0 CLOSING
We trust that this report meets with your present needs. If you have any questions or require any
clarification on any of the information contained herein, please do not hesitate to contact the undersigned
at your convenience.
GOLDER ASSOCIATES LTD.
Lilly Cesh, M.E.T. Elaine Irving, Ph. D. Environmental Scientist Senior Environmental Scientist
Gary Lawrence, M.R.M. Doug Dunster Associate, Senior Environmental Scientist Principal, Senior Consultant
LC/EI/GL/DD/asd
\\Bur1-s-filesrv2\Final\2003\1398\033-1398-001\REP 1107_11 Augur Creek Sediment Mon. Study\REP 1107_11 Augur Creek Sediment Monitoring
Study.docx
November 2011 29 033-1398-001.540
REP 1107_11 Augur Creek Sediment Monitoring Study.docx
7.0 REFERENCES
BEAK International Inc. 1998. Toxicity of uranium and trace metal discharged to the aquatic environment. Prepared for the Atomic Energy Control Board, Ottawa, ON. (Solicitation No. 87055-7-5010/1).
Borgmann, U., R. Cove, and C. Loveridge. 1980. Effects of metals on the biomass production kinetics of freshwater copepods. Canadian Journal of Fisheries and Aquatic Sciences 37:567–575.
Braccia, A., and J.R. Voshell Jr. 2007. Benthic macroinvertebrate responses to increasing levels of cattle grazing in Blue Ridge Mountain streams, Virginia, USA. Environmental Monitoring and Assessment. 131: 185-200.
Canivet, V., P. Chambon and J. Gibert. 2001. Toxicity and bioaccumulation of arsenic and chromium in epigean and hypogean freshwater invertebrates. Archives of Environmental Contamination and Toxicology. 40:345–354.
Clarke, K.R., 1993. Non-parametric multivariate analyses of changes in community structure. Australian Journal of Ecology. 18: 117-143.
Environment Canada. 1999. Canadian sediment quality guidelines for arsenic: Supporting document. Environmental Conservation Service, Ecosystem Science Directorate, Science Policy and Environmental Quality Branch, Guidelines and Standards Division, Ottawa. Draft.
Golder Associates Inc. (Golder). 2003. Quality Assurance Project Plan for Soil, Sediment, and Surface Water Monitoring at the White King / Lucky Lass Mines Superfund Site, Revision 0: Golder Associates Inc., dated December 12.
Golder. 2005. Operation, Maintenance, and Monitoring Plan for the White King/Lucky Lass Mines Superfund Site. Submitted to U.S. EPA Region X on behalf of Kerr-McGee Chemical Worldwide LLC, Western Nuclear Inc., and Fremont Lumber Co., dated April 1.
Golder. 2006. White King Pond and Augur Creek Study: Report on Phase 1 and 2 Results at the White King/Lucky Lass Superfund Site. Submitted to U.S. EPA Region X on behalf of Kerr-McGee Chemical Worldwide LLC, Western Nuclear Inc., and Fremont Lumber Co., dated September 2006.
Golder. 2008. 2007 Monitoring of White King Pond, Augur Creek, and Groundwater at the White King/Lucky Lass Mines Superfund Site. Submitted to U.S. Environmental Protection Agency Region X on behalf of Tronox LLC, Western Nuclear Inc., and Fremont Lumber Co., dated July 2008.
Hayslip, G., editor, 2007. Methods for the collection and analysis of benthic macroinvertebrate assemblages in wadeable streams of the Pacific Northwest. Pacific Northwest Aquatic Monitoring Partnership, Cook, Washington.
Herbst. D.B., and J.M. Kane. 2004. Response of stream channels, riparian habitat, and aquatic invertebrate community structure to varied livestock grazing exposure and management in the West Walker River watershed. Regional Water Quality Control Board Report, Lahontan.
Hubler, S. 2008. PREDATOR: Development and use of RIVPACS-type macroinvertebrate models to assess the biotic condition of wadeable Oregon streams (November 2005 models), Oregon Department of Environmental Quality, Laboratory Division, Watershed Assessment Section, July 2008.
Irving, E.C., R.B. Lowell, J.M. Culp, K. Liber, Q. Xie, and R. Kerrich. 2008. Effects of arsenic speciation [As(V) vs. As(III)] and dissolved oxygen condition on the toxicity of arsenic to a lotic mayfly. Environmental Toxicology and Chemistry. 27: 583-590.
November 2011 30 033-1398-001.540
REP 1107_11 Augur Creek Sediment Monitoring Study.docx
Jeyasingham, K. and N. Ling. 2000. Acute toxicity of arsenic to three species of New Zealand chironomids: Chironomus zealandicus, Chironomus sp., and Polypedilum pavidus (Diptera, Chironomidae). Bulletin of Environmental Contamination and Toxicology. 64:708–715.
Liber, K. and T. George. 2000. Toxicity of uranium to Ceriodaphnia dubia at different water hardness representative of northern Saskatchewan conditions. Report for COGEMA Resources Inc. Toxicology Centre, University of Saskatchewan. Saskatoon, SK, Canada
MacDonald, D.D., C.G. Ingersoll, and T.A. Berger. 2000. Development and evaluation of consensus based sediment quality guidelines for freshwater ecosystems. Archives of Environmental Contamination and Toxicology. 39:20-31.
Muscatello, J.M. 2004. Chronic toxicity and accumulation of uranium in the aquatic invertebrate Chironomus tentans. Masters of Science thesis. University of Saskatchewan. July 2004. 127 pp.
NOAA (National Oceanic and Atmospheric Administration). 1999. Freshwater Sediment Screening Quick Reference Tables (SQuiRTs). National Oceanic and Atmospheric Administration, Coastal Resource Coordination Branch, Hazmat Report 99-1. September 1999.
Oregon Department of Environmental Quality (ODEQ). 1998. Guidance for ecological risk assessment: Levels I, II, III, IV. Oregon Department of Environmental Quality, Waste Management & Cleanup Division, Cleanup Policy & Program Development Section. Portland, ON. April 1998.
Oregon Department of Environmental Quality (ODEQ). 2011. Memorandum from Bob Schwarz, Shannon Hubler, and Paul Seidel to Bill Adams: White King/Lucky Lass Mines Superfund Site, ECSI #601: Review of Augur Creek Sediment and Benthic Invertebrate Monitoring Study. January, 6.
Peck, M.R., D.A. Klessa and D.J. Baird. 2002. A tropical sediment toxicity test using the dipteran Chironomus crassiforceps to test metal bioavailability with sediment pH change in tropical acid-sulfate sediments. Environmental Toxicology and Chemistry. 21:720-728.
Poston, T.M., R.W. Jr Hanf and M.A. Simmons. 1984. Toxicity of uranium to Daphnia magna. Water Air and Soil Pollution. 22:289–298.
Quinn, J.M., R.B. Williamson, R.K. Smith, and M.L. Vickers. 1992. Effects of riparian grazing and channelization in streams in Southland, New Zealand. 2. Benthic invertebrates. New Zealand Journal of Marine and Freshwater Research 26:259-273.
Scrimgeour, G.J., and S. Kendall. 2003. Effects of livestock grazing on benthic invertebrates from a native grassland ecosystem. Freshwater Biology 48(2): 347-362.
Spehar, R.L. and J.T. Fiandt. 1986. Acute and chronic effects of water quality criteria–based metal mixtures on three aquatic species. Environmental Toxicology and Chemistry. 5:917–931.
Spehar, R.L., J.T. Fiandt, R.L. Anderson and D.L DeFoe. 1980. Comparative toxicity of arsenic compounds and their accumulation in invertebrates and fish. Archives of Environmental Contamination and Toxicology. 9:53–63.
Silla, A.J. 2005. Effect of cattle grazing on benthic macroinvertebrate communities in the Kalgan River system, south-west Western Australia. Summary report. Department of Water, Government of Western Australia. 17 p.
Suhendrayatna, A.O. and S. Maeda. 1999. Arsenic accumulation, transformation and tolerance on freshwater Daphnia magna. Toxicology and Environmental Chemistry. 72:1–11.
November 2011 31 033-1398-001.540
REP 1107_11 Augur Creek Sediment Monitoring Study.docx
U.S. Environmental Protection Agency (USEPA). 2001. White King/Lucky Lass Superfund Site Record of Decision. Fremont National Forest. Lakeview, Oregon. Office of Environmental Cleanup, EPA Region 10. September 2001.
USEPA. 2004. USEPA Contract Laboratory Program National Functional Guidelines for Inorganic Data Review. OSWER 9240.1-45. EPA 540-R-04-004. October 2004.

TABLES
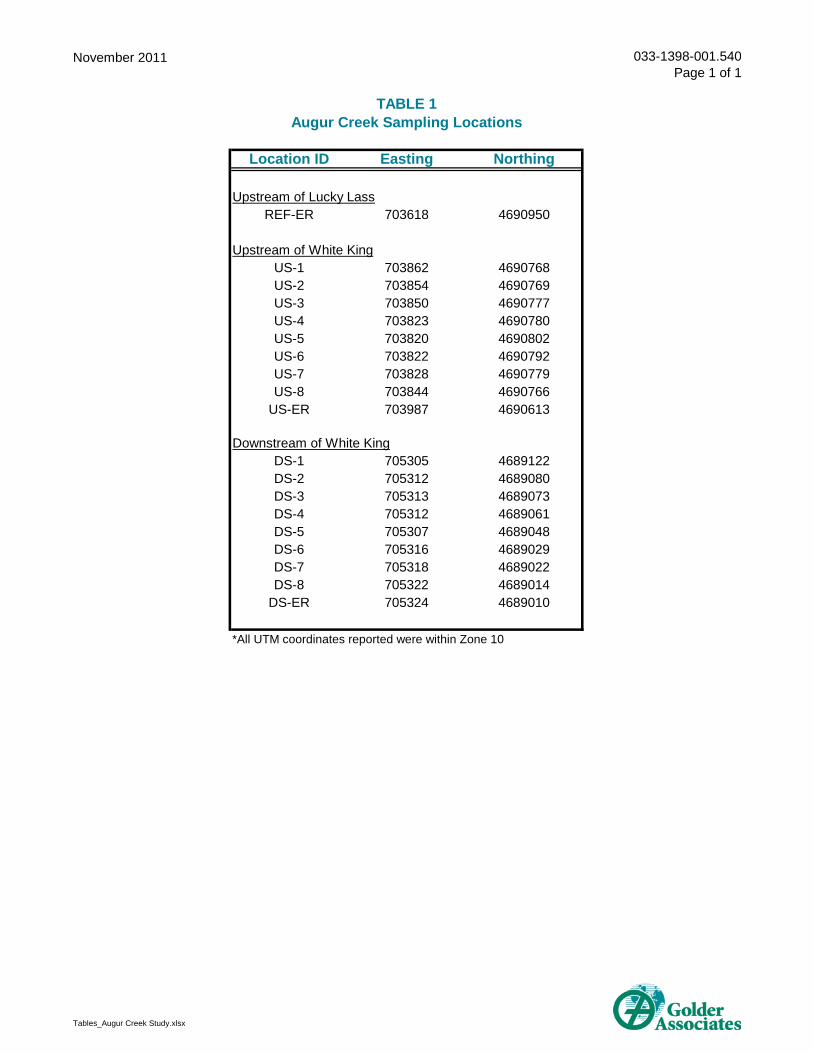
November 2011 033-1398-001.540Page 1 of 1
Tables_Augur Creek Study.xlsx
Location ID Easting Northing
Upstream of Lucky LassREF-ER 703618 4690950
Upstream of White KingUS-1 703862 4690768US-2 703854 4690769US-3 703850 4690777US-4 703823 4690780US-5 703820 4690802US-6 703822 4690792US-7 703828 4690779US-8 703844 4690766
US-ER 703987 4690613
Downstream of White KingDS-1 705305 4689122DS-2 705312 4689080DS-3 705313 4689073DS-4 705312 4689061DS-5 705307 4689048DS-6 705316 4689029DS-7 705318 4689022DS-8 705322 4689014
DS-ER 705324 4689010
*All UTM coordinates reported were within Zone 10
TABLE 1Augur Creek Sampling Locations
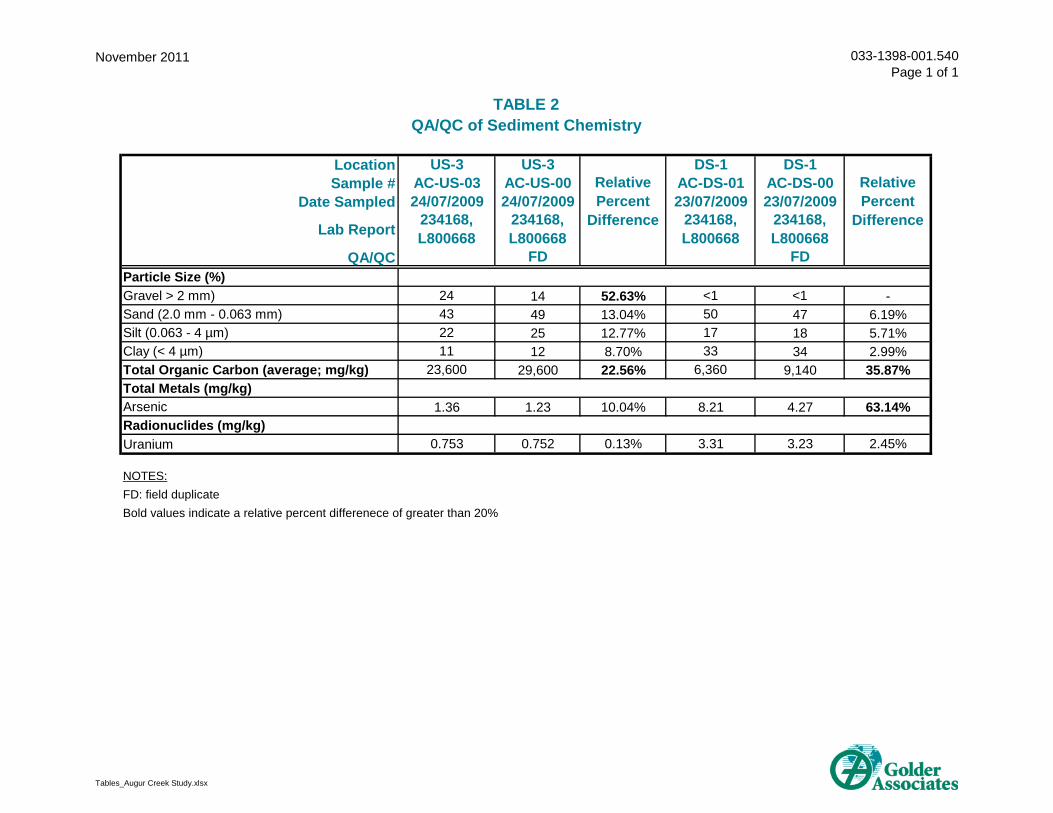
November 2011 033-1398-001.540Page 1 of 1
Tables_Augur Creek Study.xlsx
Location US-3 US-3 DS-1 DS-1Sample # AC-US-03 AC-US-00 AC-DS-01 AC-DS-00
Date Sampled 24/07/2009 24/07/2009 23/07/2009 23/07/2009
Lab Report 234168, L800668
234168, L800668
234168, L800668
234168, L800668
QA/QC FD FDParticle Size (%)Gravel > 2 mm) 24 14 52.63% <1 <1 - Sand (2.0 mm - 0.063 mm) 43 49 13.04% 50 47 6.19%Silt (0.063 - 4 µm) 22 25 12.77% 17 18 5.71%Clay (< 4 µm) 11 12 8.70% 33 34 2.99%Total Organic Carbon (average; mg/kg) 23,600 29,600 22.56% 6,360 9,140 35.87%Total Metals (mg/kg)Arsenic 1.36 1.23 10.04% 8.21 4.27 63.14%Radionuclides (mg/kg)Uranium 0.753 0.752 0.13% 3.31 3.23 2.45%
NOTES:FD: field duplicateBold values indicate a relative percent differenece of greater than 20%
Relative Percent
Difference
Relative Percent
Difference
TABLE 2QA/QC of Sediment Chemistry
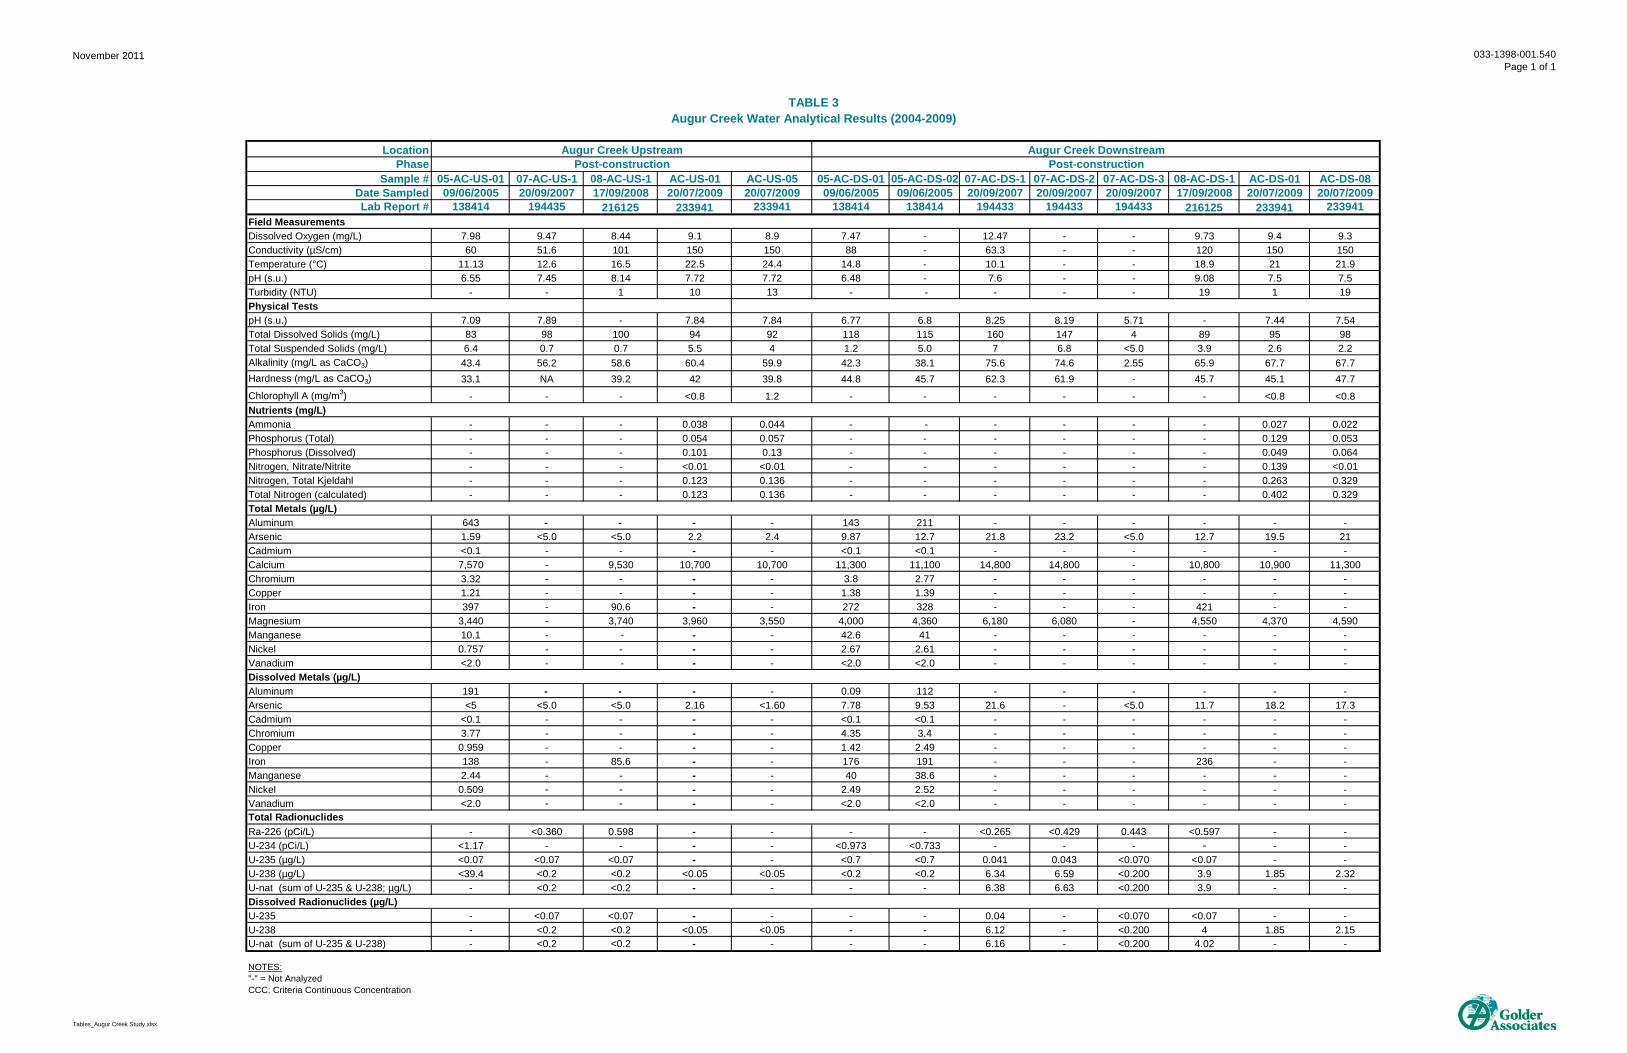
November 2011 033-1398-001.540Page 1 of 1
Tables_Augur Creek Study.xlsx
LocationPhase
Sample # 05-AC-US-01 07-AC-US-1 08-AC-US-1 AC-US-01 AC-US-05 05-AC-DS-01 05-AC-DS-02 07-AC-DS-1 07-AC-DS-2 07-AC-DS-3 08-AC-DS-1 AC-DS-01 AC-DS-08Date Sampled 09/06/2005 20/09/2007 17/09/2008 20/07/2009 20/07/2009 09/06/2005 09/06/2005 20/09/2007 20/09/2007 20/09/2007 17/09/2008 20/07/2009 20/07/2009Lab Report # 138414 194435 216125 233941 233941 138414 138414 194433 194433 194433 216125 233941 233941
Field MeasurementsDissolved Oxygen (mg/L) 7.98 9.47 8.44 9.1 8.9 7.47 - 12.47 - - 9.73 9.4 9.3Conductivity (µS/cm) 60 51.6 101 150 150 88 - 63.3 - - 120 150 150Temperature (°C) 11.13 12.6 16.5 22.5 24.4 14.8 - 10.1 - - 18.9 21 21.9pH (s.u.) 6.55 7.45 8.14 7.72 7.72 6.48 - 7.6 - - 9.08 7.5 7.5Turbidity (NTU) - - 1 10 13 - - - - - 19 1 19Physical TestspH (s.u.) 7.09 7.89 - 7.84 7.84 6.77 6.8 8.25 8.19 5.71 - 7.44 7.54Total Dissolved Solids (mg/L) 83 98 100 94 92 118 115 160 147 4 89 95 98Total Suspended Solids (mg/L) 6.4 0.7 0.7 5.5 4 1.2 5.0 7 6.8 <5.0 3.9 2.6 2.2Alkalinity (mg/L as CaCO3) 43.4 56.2 58.6 60.4 59.9 42.3 38.1 75.6 74.6 2.55 65.9 67.7 67.7Hardness (mg/L as CaCO3) 33.1 NA 39.2 42 39.8 44.8 45.7 62.3 61.9 - 45.7 45.1 47.7
Chlorophyll A (mg/m3) - - - <0.8 1.2 - - - - - - <0.8 <0.8Nutrients (mg/L)Ammonia - - - 0.038 0.044 - - - - - - 0.027 0.022Phosphorus (Total) - - - 0.054 0.057 - - - - - - 0.129 0.053Phosphorus (Dissolved) - - - 0.101 0.13 - - - - - - 0.049 0.064Nitrogen, Nitrate/Nitrite - - - <0.01 <0.01 - - - - - - 0.139 <0.01Nitrogen, Total Kjeldahl - - - 0.123 0.136 - - - - - - 0.263 0.329Total Nitrogen (calculated) - - - 0.123 0.136 - - - - - - 0.402 0.329Total Metals (µg/L)Aluminum 643 - - - - 143 211 - - - - - - Arsenic 1.59 <5.0 <5.0 2.2 2.4 9.87 12.7 21.8 23.2 <5.0 12.7 19.5 21Cadmium <0.1 - - - - <0.1 <0.1 - - - - - - Calcium 7,570 - 9,530 10,700 10,700 11,300 11,100 14,800 14,800 - 10,800 10,900 11,300Chromium 3.32 - - - - 3.8 2.77 - - - - - - Copper 1.21 - - - - 1.38 1.39 - - - - - - Iron 397 - 90.6 - - 272 328 - - - 421 - - Magnesium 3,440 - 3,740 3,960 3,550 4,000 4,360 6,180 6,080 - 4,550 4,370 4,590Manganese 10.1 - - - - 42.6 41 - - - - - - Nickel 0.757 - - - - 2.67 2.61 - - - - - - Vanadium <2.0 - - - - <2.0 <2.0 - - - - - - Dissolved Metals (µg/L)Aluminum 191 - - - - 0.09 112 - - - - - - Arsenic <5 <5.0 <5.0 2.16 <1.60 7.78 9.53 21.6 - <5.0 11.7 18.2 17.3Cadmium <0.1 - - - - <0.1 <0.1 - - - - - - Chromium 3.77 - - - - 4.35 3.4 - - - - - - Copper 0.959 - - - - 1.42 2.49 - - - - - - Iron 138 - 85.6 - - 176 191 - - - 236 - - Manganese 2.44 - - - - 40 38.6 - - - - - - Nickel 0.509 - - - - 2.49 2.52 - - - - - - Vanadium <2.0 - - - - <2.0 <2.0 - - - - - - Total Radionuclides Ra-226 (pCi/L) - <0.360 0.598 - - - - <0.265 <0.429 0.443 <0.597 - - U-234 (pCi/L) <1.17 - - - - <0.973 <0.733 - - - - - - U-235 (µg/L) <0.07 <0.07 <0.07 - - <0.7 <0.7 0.041 0.043 <0.070 <0.07 - - U-238 (µg/L) <39.4 <0.2 <0.2 <0.05 <0.05 <0.2 <0.2 6.34 6.59 <0.200 3.9 1.85 2.32U-nat (sum of U-235 & U-238; µg/L) - <0.2 <0.2 - - - - 6.38 6.63 <0.200 3.9 - - Dissolved Radionuclides (µg/L)U-235 - <0.07 <0.07 - - - - 0.04 - <0.070 <0.07 - - U-238 - <0.2 <0.2 <0.05 <0.05 - - 6.12 - <0.200 4 1.85 2.15U-nat (sum of U-235 & U-238) - <0.2 <0.2 - - - - 6.16 - <0.200 4.02 - -
NOTES:"-" = Not AnalyzedCCC: Criteria Continuous Concentration
TABLE 3Augur Creek Water Analytical Results (2004-2009)
Augur Creek Upstream Augur Creek DownstreamPost-construction Post-construction
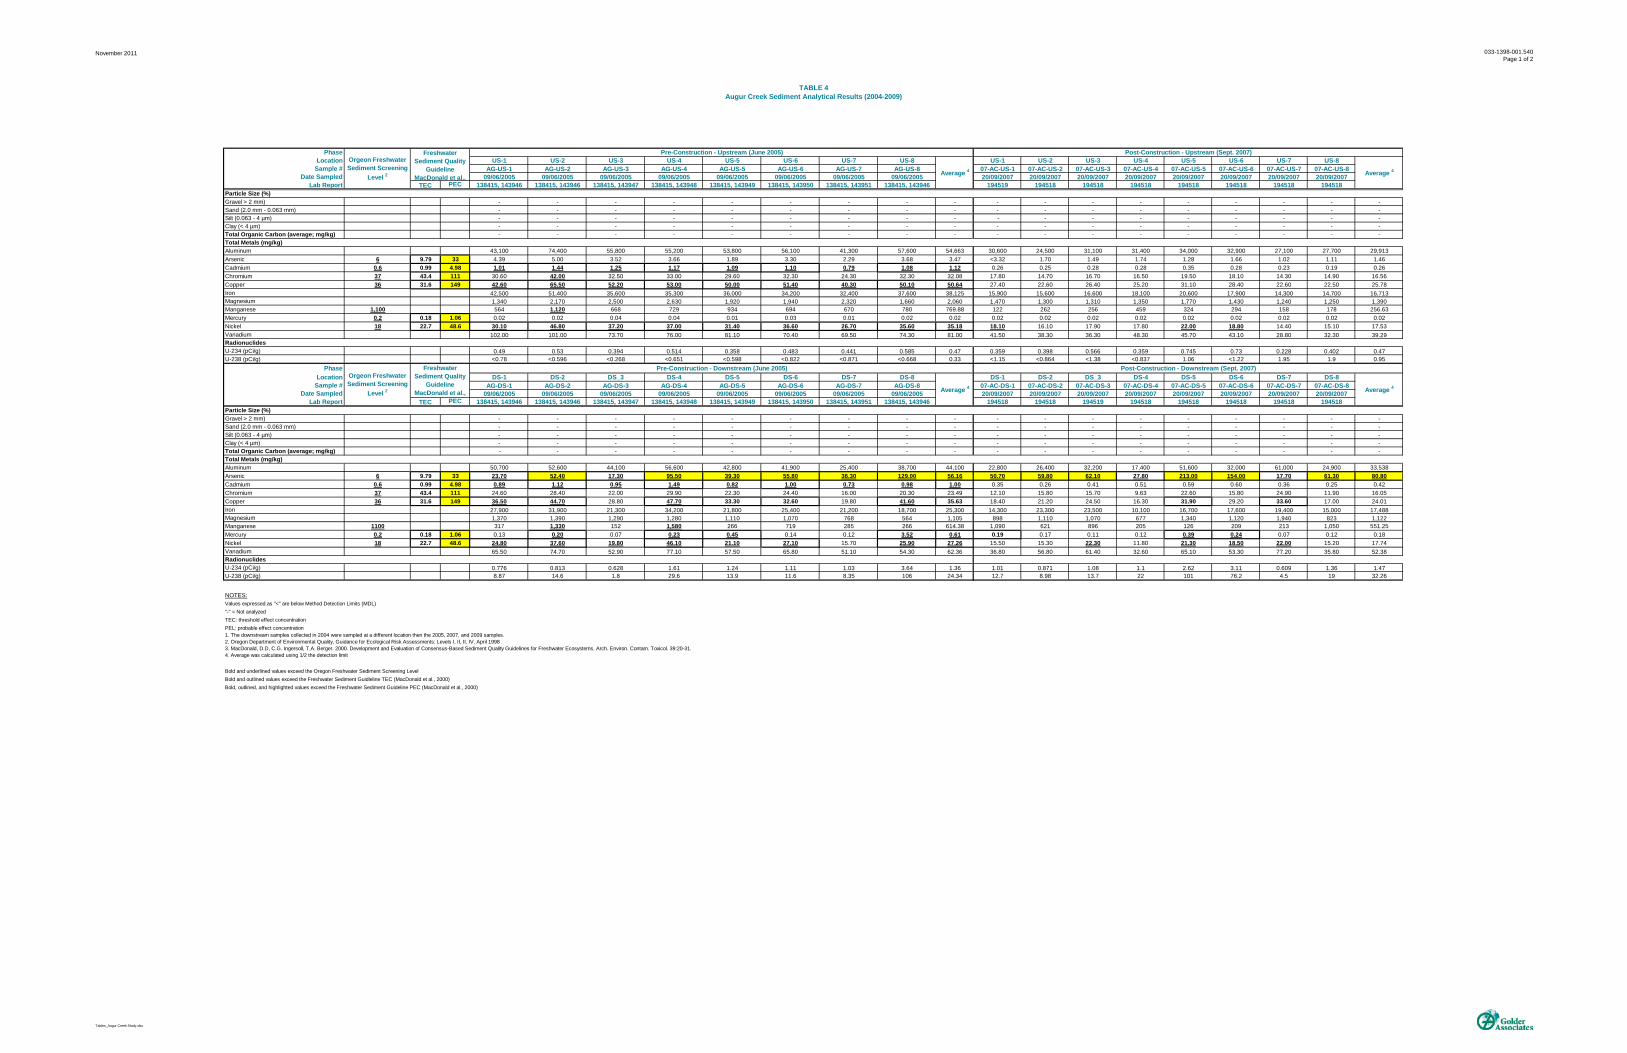
November 2011
TABLE 4Augur Creek Sediment Analytical Results (2004-2009)
033-1398-001.540Page 1 of 2
Tables_Augur Creek Study.xlsx
Phase Pre-Construction - Upstream (June 2005) Post-Construction - Upstream (Sept. 2007) Location US-1 US-2 US-3 US-4 US-5 US-6 US-7 US-8 US-1 US-2 US-3 US-4 US-5 US-6 US-7 US-8
Sample # AG-US-1 AG-US-2 AG-US-3 AG-US-4 AG-US-5 AG-US-6 AG-US-7 AG-US-8 07-AC-US-1 07-AC-US-2 07-AC-US-3 07-AC-US-4 07-AC-US-5 07-AC-US-6 07-AC-US-7 07-AC-US-8Date Sampled 09/06/2005 09/06/2005 09/06/2005 09/06/2005 09/06/2005 09/06/2005 09/06/2005 09/06/2005 20/09/2007 20/09/2007 20/09/2007 20/09/2007 20/09/2007 20/09/2007 20/09/2007 20/09/2007
Lab Report TEC PEC 138415, 143946 138415, 143946 138415, 143947 138415, 143948 138415, 143949 138415, 143950 138415, 143951 138415, 143946 194519 194518 194518 194518 194518 194518 194518 194518Particle Size (%)Gravel > 2 mm) - - - - - - - - - - - - - - - - - - Sand (2.0 mm - 0.063 mm) - - - - - - - - - - - - - - - - - - Silt (0.063 - 4 µm) - - - - - - - - - - - - - - - - - - Clay (< 4 µm) - - - - - - - - - - - - - - - - - - Total Organic Carbon (average; mg/kg) - - - - - - - - - - - - - - - - - - Total Metals (mg/kg)Aluminum 43,100 74,400 55,800 55,200 53,800 56,100 41,300 57,600 54,663 30,600 24,500 31,100 31,400 34,000 32,900 27,100 27,700 29,913Arsenic 6 9.79 33 4.39 5.00 3.52 3.66 1.89 3.30 2.29 3.68 3.47 <3.32 1.70 1.49 1.74 1.28 1.66 1.02 1.11 1.46Cadmium 0.6 0.99 4.98 1.01 1.44 1.25 1.17 1.09 1.10 0.79 1.08 1.12 0.26 0.25 0.28 0.28 0.35 0.28 0.23 0.19 0.26Chromium 37 43.4 111 30.60 42.00 32.50 33.00 29.60 32.30 24.30 32.30 32.08 17.80 14.70 16.70 16.50 19.50 18.10 14.30 14.90 16.56Copper 36 31.6 149 42.60 65.50 52.20 53.00 50.00 51.40 40.30 50.10 50.64 27.40 22.60 26.40 25.20 31.10 28.40 22.60 22.50 25.78Iron 42,500 51,400 35,600 35,300 36,000 34,200 32,400 37,600 38,125 15,900 15,600 16,600 18,100 20,600 17,900 14,300 14,700 16,713Magnesium 1,340 2,170 2,500 2,630 1,920 1,940 2,320 1,660 2,060 1,470 1,300 1,310 1,350 1,770 1,430 1,240 1,250 1,390Manganese 1,100 564 1,120 668 729 934 694 670 780 769.88 122 262 256 459 324 294 158 178 256.63Mercury 0.2 0.18 1.06 0.02 0.02 0.04 0.04 0.01 0.03 0.01 0.02 0.02 0.02 0.02 0.02 0.02 0.02 0.02 0.02 0.02 0.02Nickel 18 22.7 48.6 30.10 46.80 37.20 37.00 31.40 36.60 26.70 35.60 35.18 18.10 16.10 17.90 17.80 22.00 18.80 14.40 15.10 17.53Vanadium 102.00 101.00 73.70 76.00 81.10 70.40 69.50 74.30 81.00 41.50 38.30 36.30 48.30 45.70 43.10 28.80 32.30 39.29Radionuclides U-234 (pCi/g) 0.49 0.53 0.394 0.514 0.358 0.483 0.441 0.585 0.47 0.359 0.398 0.566 0.359 0.745 0.73 0.228 0.402 0.47U-238 (pCi/g) <0.78 <0.596 <0.268 <0.651 <0.598 <0.822 <0.871 <0.668 0.33 <1.15 <0.864 <1.38 <0.837 1.06 <1.22 1.95 1.9 0.95
Phase Pre-Construction - Downstream (June 2005) Post-Construction - Downstream (Sept. 2007) Location DS-1 DS-2 DS_3 DS-4 DS-5 DS-6 DS-7 DS-8 DS-1 DS-2 DS_3 DS-4 DS-5 DS-6 DS-7 DS-8
Sample # AG-DS-1 AG-DS-2 AG-DS-3 AG-DS-4 AG-DS-5 AG-DS-6 AG-DS-7 AG-DS-8 07-AC-DS-1 07-AC-DS-2 07-AC-DS-3 07-AC-DS-4 07-AC-DS-5 07-AC-DS-6 07-AC-DS-7 07-AC-DS-8Date Sampled 09/06/2005 09/06/2005 09/06/2005 09/06/2005 09/06/2005 09/06/2005 09/06/2005 09/06/2005 20/09/2007 20/09/2007 20/09/2007 20/09/2007 20/09/2007 20/09/2007 20/09/2007 20/09/2007
Lab Report TEC PEC 138415, 143946 138415, 143946 138415, 143947 138415, 143948 138415, 143949 138415, 143950 138415, 143951 138415, 143946 194518 194518 194519 194518 194518 194518 194518 194518Particle Size (%)Gravel > 2 mm) - - - - - - - - - - - - - - - - - - Sand (2.0 mm - 0.063 mm) - - - - - - - - - - - - - - - - - - Silt (0.063 - 4 µm) - - - - - - - - - - - - - - - - - - Clay (< 4 µm) - - - - - - - - - - - - - - - - - - Total Organic Carbon (average; mg/kg) - - - - - - - - - - - - - - - - - - Total Metals (mg/kg)Aluminum 50,700 52,600 44,100 56,600 42,800 41,900 25,400 38,700 44,100 22,800 26,400 32,200 17,400 51,600 32,000 61,000 24,900 33,538Arsenic 6 9.79 33 23.70 52.40 17.30 95.50 39.30 55.80 36.30 129.00 56.16 50.70 59.80 62.10 27.80 213.00 154.00 17.70 61.30 80.80Cadmium 0.6 0.99 4.98 0.89 1.12 0.95 1.49 0.82 1.00 0.73 0.98 1.00 0.35 0.26 0.41 0.51 0.59 0.60 0.36 0.25 0.42Chromium 37 43.4 111 24.60 28.40 22.00 29.90 22.30 24.40 16.00 20.30 23.49 12.10 15.80 15.70 9.63 22.60 15.80 24.90 11.90 16.05Copper 36 31.6 149 36.50 44.70 28.80 47.70 33.30 32.60 19.80 41.60 35.63 18.40 21.20 24.50 16.30 31.90 29.20 33.60 17.00 24.01Iron 27,900 31,900 21,300 34,200 21,800 25,400 21,200 18,700 25,300 14,300 23,300 23,500 10,100 16,700 17,600 19,400 15,000 17,488Magnesium 1,370 1,390 1,290 1,280 1,110 1,070 768 564 1,105 898 1,110 1,070 677 1,340 1,120 1,940 823 1,122Manganese 1100 317 1,330 152 1,580 266 719 285 266 614.38 1,090 621 896 205 126 209 213 1,050 551.25Mercury 0.2 0.18 1.06 0.13 0.20 0.07 0.23 0.45 0.14 0.12 3.52 0.61 0.19 0.17 0.11 0.12 0.39 0.24 0.07 0.12 0.18Nickel 18 22.7 48.6 24.80 37.60 19.80 46.10 21.10 27.10 15.70 25.90 27.26 15.50 15.30 22.30 11.80 21.30 18.50 22.00 15.20 17.74Vanadium 65.50 74.70 52.90 77.10 57.50 65.80 51.10 54.30 62.36 36.80 56.80 61.40 32.60 65.10 53.30 77.20 35.80 52.38Radionuclides U-234 (pCi/g) 0.776 0.813 0.628 1.61 1.24 1.11 1.03 3.64 1.36 1.01 0.871 1.08 1.1 2.62 3.11 0.609 1.36 1.47U-238 (pCi/g) 8.87 14.6 1.8 29.6 13.9 11.6 8.35 106 24.34 12.7 8.98 13.7 22 101 76.2 4.5 19 32.26
NOTES:Values expressed as "<" are below Method Detection Limits (MDL)"-" = Not analyzedTEC: threshold effect concentrationPEL: probable effect concentration1. The downstream samples collected in 2004 were sampled at a different location then the 2005, 2007, and 2009 samples. 2. Oregon Department of Environmental Quality, Guidance for Ecological Risk Assessments: Levels I, II, II, IV, April 19983. MacDonald, D.D, C.G. Ingersoll, T.A. Berger. 2000. Development and Evaluation of Consensus-Based Sediment Quality Guidelines for Freshwater Ecosystems. Arch. Environ. Contam. Toxicol. 39:20-31.4. Average was calculated using 1/2 the detection limit
Bold and underlined values exceed the Oregon Freshwater Sediment Screening LevelBold and outlined values exceed the Freshwater Sediment Guidleline TEC (MacDonald et al., 2000)Bold, outlined, and highlighted values exceed the Freshwater Sediment Guideline PEC (MacDonald et al., 2000)
Orgeon Freshwater Sediment Screening
Level 2
Orgeon Freshwater Sediment Screening
Level 2
Freshwater Sediment Quality
Guideline MacDonald et al.,
Freshwater Sediment Quality
Guideline MacDonald et al.,
Average 4 Average 4
Average 4 Average 4
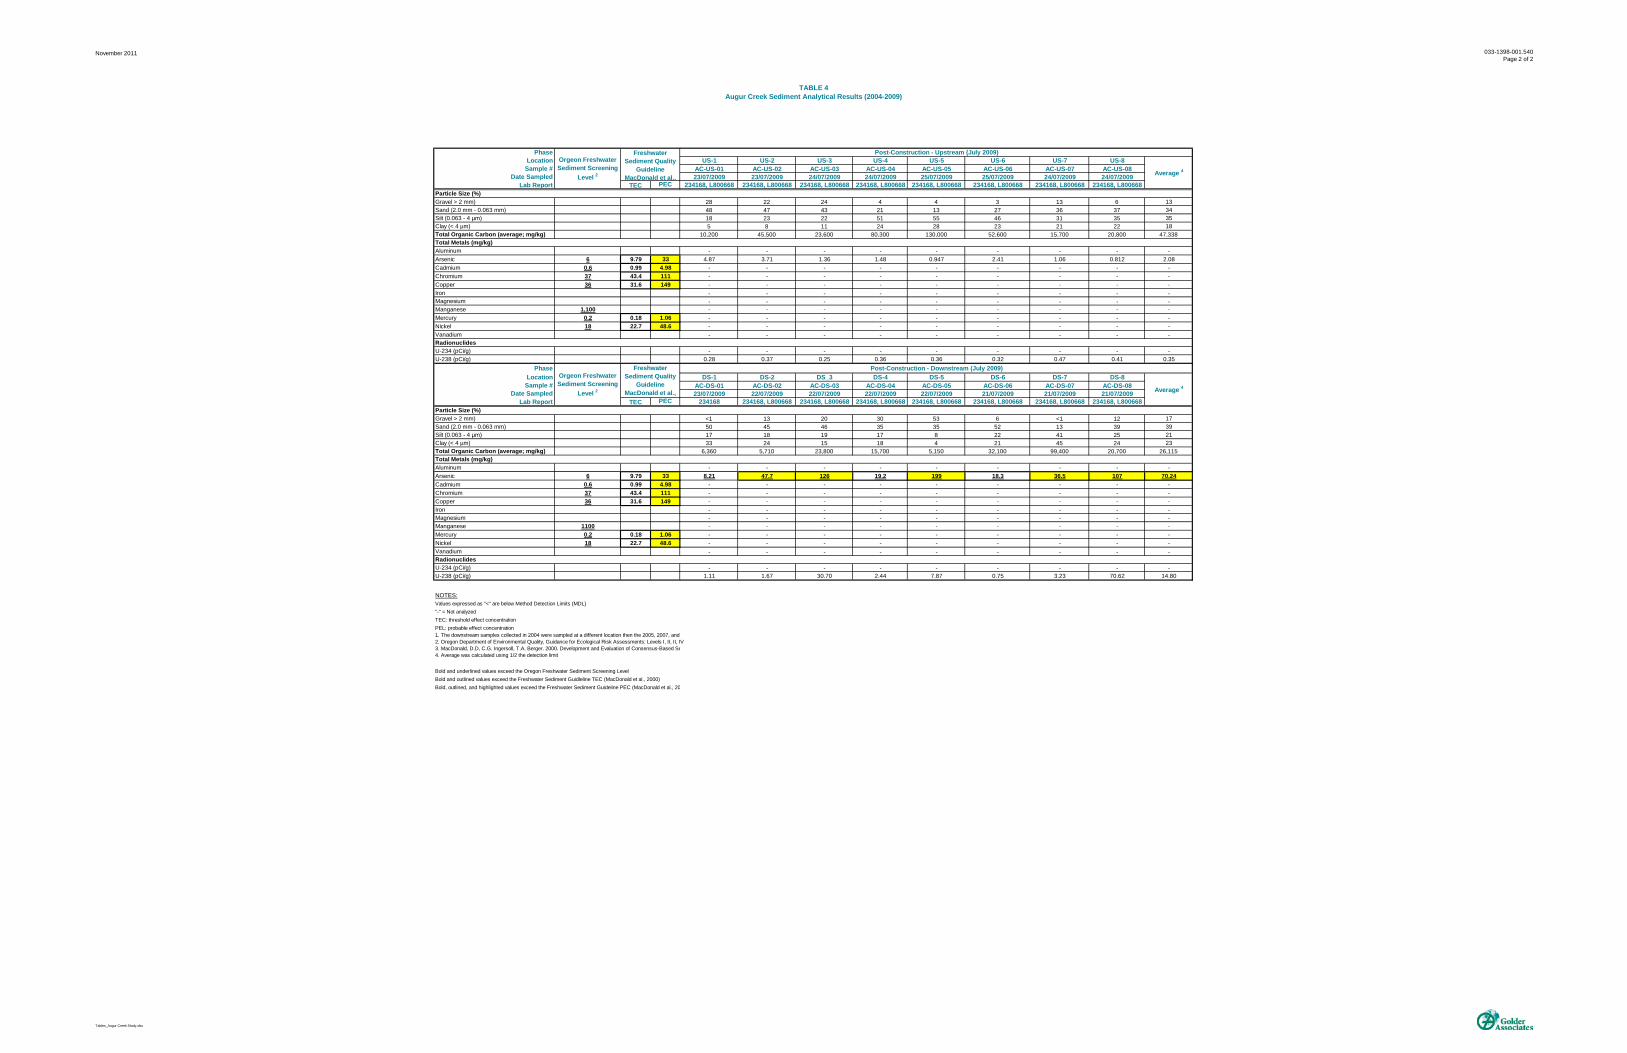
November 2011
TABLE 4Augur Creek Sediment Analytical Results (2004-2009)
033-1398-001.540Page 2 of 2
Tables_Augur Creek Study.xlsx
PhaseLocation
Sample #Date Sampled
Lab Report TEC PECParticle Size (%)Gravel > 2 mm)Sand (2.0 mm - 0.063 mm)Silt (0.063 - 4 µm)Clay (< 4 µm)Total Organic Carbon (average; mg/kg)Total Metals (mg/kg)AluminumArsenic 6 9.79 33Cadmium 0.6 0.99 4.98Chromium 37 43.4 111Copper 36 31.6 149IronMagnesiumManganese 1,100Mercury 0.2 0.18 1.06Nickel 18 22.7 48.6VanadiumRadionuclides U-234 (pCi/g)U-238 (pCi/g)
PhaseLocation
Sample #Date Sampled
Lab Report TEC PECParticle Size (%)Gravel > 2 mm)Sand (2.0 mm - 0.063 mm)Silt (0.063 - 4 µm)Clay (< 4 µm)Total Organic Carbon (average; mg/kg)Total Metals (mg/kg)AluminumArsenic 6 9.79 33Cadmium 0.6 0.99 4.98Chromium 37 43.4 111Copper 36 31.6 149IronMagnesiumManganese 1100Mercury 0.2 0.18 1.06Nickel 18 22.7 48.6VanadiumRadionuclides U-234 (pCi/g)U-238 (pCi/g)
NOTES:Values expressed as "<" are below Method Detection Limits (MDL)"-" = Not analyzedTEC: threshold effect concentrationPEL: probable effect concentration1. The downstream samples collected in 2004 were sampled at a different location then the 2005, 2007, and 2. Oregon Department of Environmental Quality, Guidance for Ecological Risk Assessments: Levels I, II, II, IV 3. MacDonald, D.D, C.G. Ingersoll, T.A. Berger. 2000. Development and Evaluation of Consensus-Based Se 4. Average was calculated using 1/2 the detection limit
Bold and underlined values exceed the Oregon Freshwater Sediment Screening LevelBold and outlined values exceed the Freshwater Sediment Guidleline TEC (MacDonald et al., 2000)Bold, outlined, and highlighted values exceed the Freshwater Sediment Guideline PEC (MacDonald et al., 20
Orgeon Freshwater Sediment Screening
Level 2
Orgeon Freshwater Sediment Screening
Level 2
Freshwater Sediment Quality
Guideline MacDonald et al.,
Freshwater Sediment Quality
Guideline MacDonald et al.,
Post-Construction - Upstream (July 2009)US-1 US-2 US-3 US-4 US-5 US-6 US-7 US-8
AC-US-01 AC-US-02 AC-US-03 AC-US-04 AC-US-05 AC-US-06 AC-US-07 AC-US-0823/07/2009 23/07/2009 24/07/2009 24/07/2009 25/07/2009 25/07/2009 24/07/2009 24/07/2009
234168, L800668 234168, L800668 234168, L800668 234168, L800668 234168, L800668 234168, L800668 234168, L800668 234168, L800668
28 22 24 4 4 3 13 6 1348 47 43 21 13 27 36 37 3418 23 22 51 55 46 31 35 355 8 11 24 28 23 21 22 18
10,200 45,500 23,600 80,300 130,000 52,600 15,700 20,800 47,338
- - - - - - - - - 4.87 3.71 1.36 1.48 0.947 2.41 1.06 0.812 2.08 - - - - - - - - - - - - - - - - - - - - - - - - - - - - - - - - - - - - - - - - - - - - - - - - - - - - - - - - - - - - - - - - - - - - - - - - - - - - - - - - -
- - - - - - - - - 0.28 0.37 0.25 0.36 0.36 0.32 0.47 0.41 0.35
Post-Construction - Downstream (July 2009)DS-1 DS-2 DS_3 DS-4 DS-5 DS-6 DS-7 DS-8
AC-DS-01 AC-DS-02 AC-DS-03 AC-DS-04 AC-DS-05 AC-DS-06 AC-DS-07 AC-DS-0823/07/2009 22/07/2009 22/07/2009 22/07/2009 22/07/2009 21/07/2009 21/07/2009 21/07/2009
234168 234168, L800668 234168, L800668 234168, L800668 234168, L800668 234168, L800668 234168, L800668 234168, L800668
<1 13 20 30 53 6 <1 12 1750 45 46 35 35 52 13 39 3917 18 19 17 8 22 41 25 2133 24 15 18 4 21 45 24 23
6,360 5,710 23,800 15,700 5,150 32,100 99,400 20,700 26,115
- - - - - - - - - 8.21 47.7 126 19.2 199 18.3 36.5 107 70.24 - - - - - - - - - - - - - - - - - - - - - - - - - - - - - - - - - - - - - - - - - - - - - - - - - - - - - - - - - - - - - - - - - - - - - - - - - - - - - - - - -
- - - - - - - - - 1.11 1.67 30.70 2.44 7.87 0.75 3.23 70.62 14.80
Average 4
Average 4
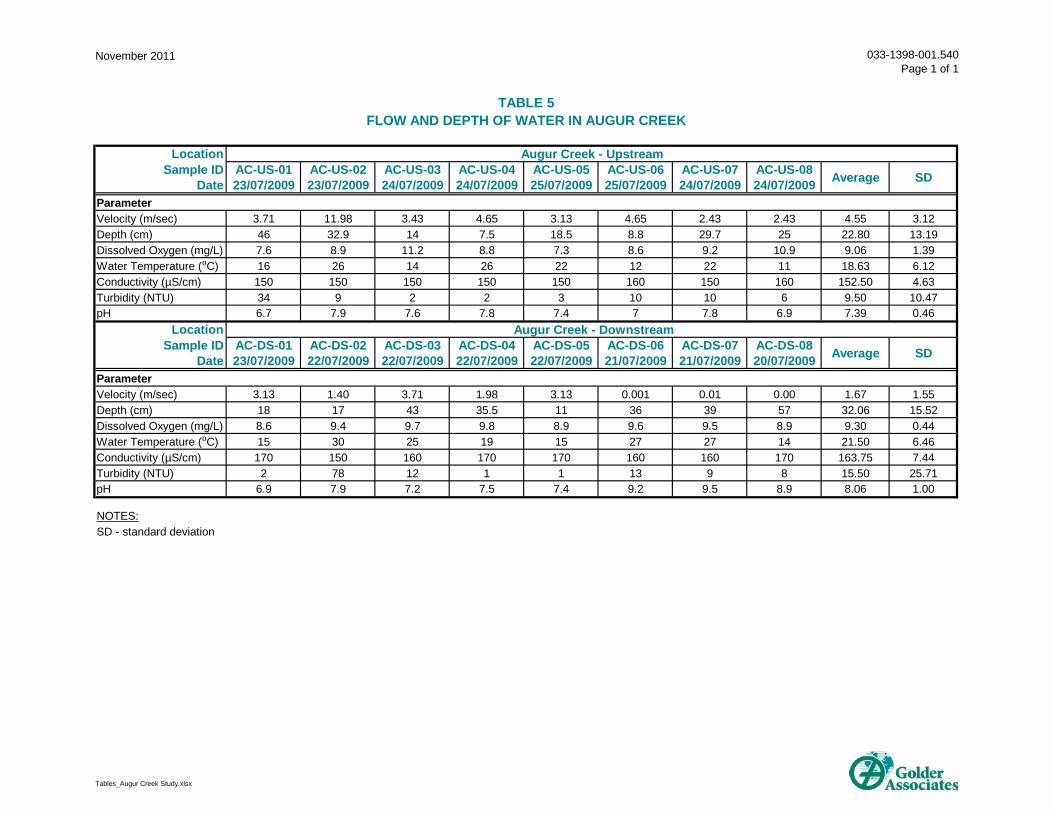
November 2011 033-1398-001.540Page 1 of 1
Tables_Augur Creek Study.xlsx
Location Augur Creek - UpstreamSample ID AC-US-01 AC-US-02 AC-US-03 AC-US-04 AC-US-05 AC-US-06 AC-US-07 AC-US-08
Date 23/07/2009 23/07/2009 24/07/2009 24/07/2009 25/07/2009 25/07/2009 24/07/2009 24/07/2009ParameterVelocity (m/sec) 3.71 11.98 3.43 4.65 3.13 4.65 2.43 2.43 4.55 3.12Depth (cm) 46 32.9 14 7.5 18.5 8.8 29.7 25 22.80 13.19Dissolved Oxygen (mg/L) 7.6 8.9 11.2 8.8 7.3 8.6 9.2 10.9 9.06 1.39Water Temperature (⁰C) 16 26 14 26 22 12 22 11 18.63 6.12Conductivity (µS/cm) 150 150 150 150 150 160 150 160 152.50 4.63Turbidity (NTU) 34 9 2 2 3 10 10 6 9.50 10.47pH 6.7 7.9 7.6 7.8 7.4 7 7.8 6.9 7.39 0.46
Location Augur Creek - DownstreamSample ID AC-DS-01 AC-DS-02 AC-DS-03 AC-DS-04 AC-DS-05 AC-DS-06 AC-DS-07 AC-DS-08
Date 23/07/2009 22/07/2009 22/07/2009 22/07/2009 22/07/2009 21/07/2009 21/07/2009 20/07/2009ParameterVelocity (m/sec) 3.13 1.40 3.71 1.98 3.13 0.001 0.01 0.00 1.67 1.55Depth (cm) 18 17 43 35.5 11 36 39 57 32.06 15.52Dissolved Oxygen (mg/L) 8.6 9.4 9.7 9.8 8.9 9.6 9.5 8.9 9.30 0.44Water Temperature (⁰C) 15 30 25 19 15 27 27 14 21.50 6.46Conductivity (µS/cm) 170 150 160 170 170 160 160 170 163.75 7.44Turbidity (NTU) 2 78 12 1 1 13 9 8 15.50 25.71pH 6.9 7.9 7.2 7.5 7.4 9.2 9.5 8.9 8.06 1.00
NOTES:SD - standard deviation
Average SD
TABLE 5FLOW AND DEPTH OF WATER IN AUGUR CREEK
Average SD
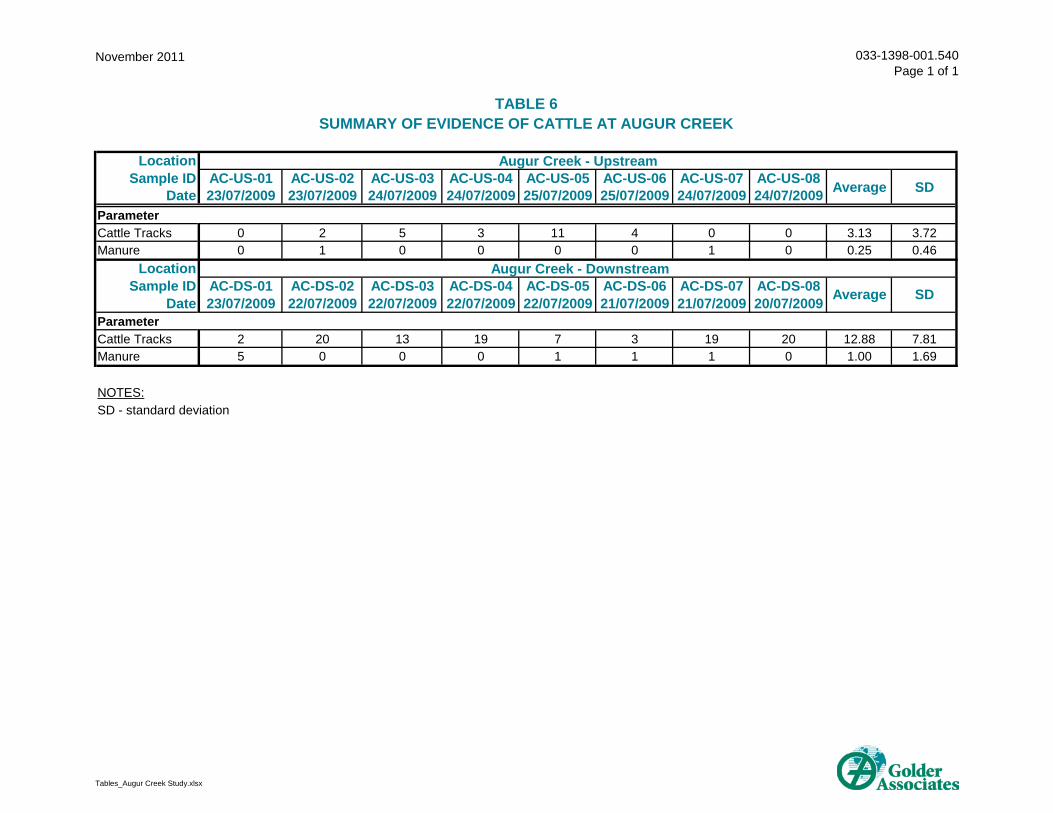
November 2011 033-1398-001.540Page 1 of 1
Tables_Augur Creek Study.xlsx
Location Augur Creek - UpstreamSample ID AC-US-01 AC-US-02 AC-US-03 AC-US-04 AC-US-05 AC-US-06 AC-US-07 AC-US-08
Date 23/07/2009 23/07/2009 24/07/2009 24/07/2009 25/07/2009 25/07/2009 24/07/2009 24/07/2009ParameterCattle Tracks 0 2 5 3 11 4 0 0 3.13 3.72Manure 0 1 0 0 0 0 1 0 0.25 0.46
Location Augur Creek - DownstreamSample ID AC-DS-01 AC-DS-02 AC-DS-03 AC-DS-04 AC-DS-05 AC-DS-06 AC-DS-07 AC-DS-08
Date 23/07/2009 22/07/2009 22/07/2009 22/07/2009 22/07/2009 21/07/2009 21/07/2009 20/07/2009ParameterCattle Tracks 2 20 13 19 7 3 19 20 12.88 7.81Manure 5 0 0 0 1 1 1 0 1.00 1.69
NOTES:SD - standard deviation
Average SD
Average SD
TABLE 6SUMMARY OF EVIDENCE OF CATTLE AT AUGUR CREEK
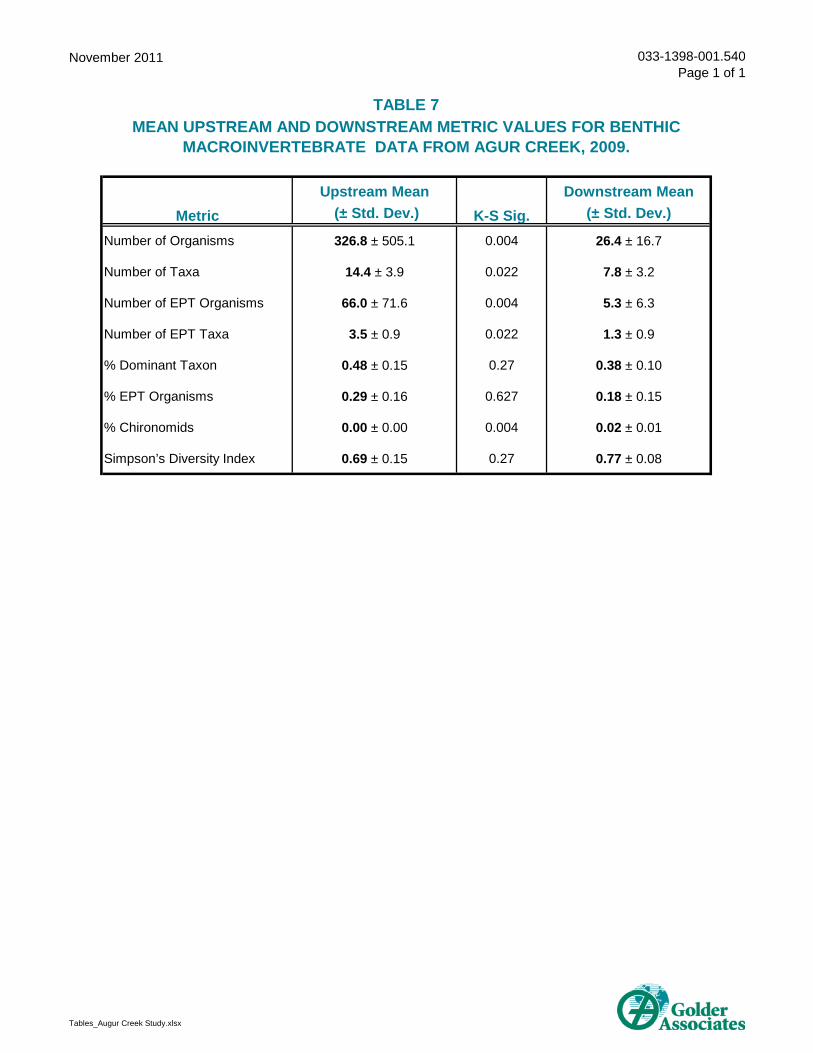
November 2011 033-1398-001.540Page 1 of 1
Tables_Augur Creek Study.xlsx
Upstream Mean Downstream Mean (± Std. Dev.) (± Std. Dev.)
Number of Organisms 326.8 ± 505.1 0.004 26.4 ± 16.7
Number of Taxa 14.4 ± 3.9 0.022 7.8 ± 3.2
Number of EPT Organisms 66.0 ± 71.6 0.004 5.3 ± 6.3
Number of EPT Taxa 3.5 ± 0.9 0.022 1.3 ± 0.9
% Dominant Taxon 0.48 ± 0.15 0.27 0.38 ± 0.10
% EPT Organisms 0.29 ± 0.16 0.627 0.18 ± 0.15
% Chironomids 0.00 ± 0.00 0.004 0.02 ± 0.01
Simpson’s Diversity Index 0.69 ± 0.15 0.27 0.77 ± 0.08
TABLE 7MEAN UPSTREAM AND DOWNSTREAM METRIC VALUES FOR BENTHIC
MACROINVERTEBRATE DATA FROM AGUR CREEK, 2009.
Metric K-S Sig.
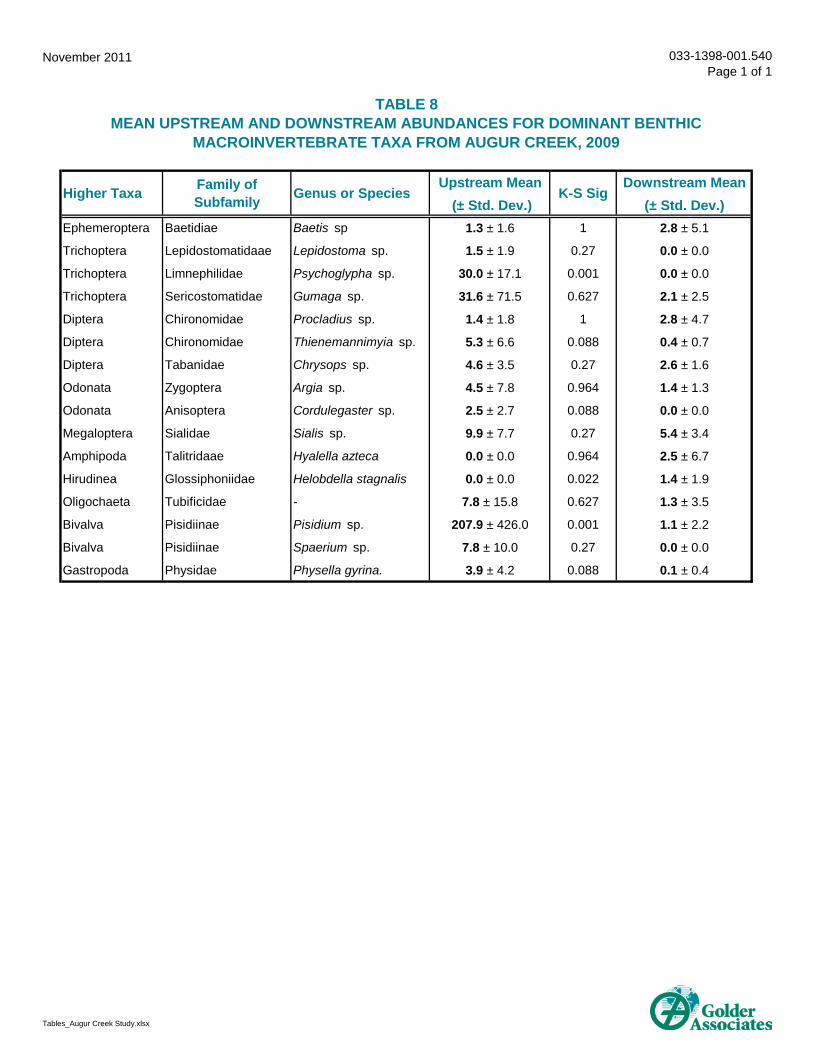
November 2011 033-1398-001.540Page 1 of 1
Tables_Augur Creek Study.xlsx
Upstream Mean Downstream Mean (± Std. Dev.) (± Std. Dev.)
Ephemeroptera Baetidiae Baetis sp 1.3 ± 1.6 1 2.8 ± 5.1
Trichoptera Lepidostomatidaae Lepidostoma sp. 1.5 ± 1.9 0.27 0.0 ± 0.0
Trichoptera Limnephilidae Psychoglypha sp. 30.0 ± 17.1 0.001 0.0 ± 0.0
Trichoptera Sericostomatidae Gumaga sp. 31.6 ± 71.5 0.627 2.1 ± 2.5
Diptera Chironomidae Procladius sp. 1.4 ± 1.8 1 2.8 ± 4.7
Diptera Chironomidae Thienemannimyia sp. 5.3 ± 6.6 0.088 0.4 ± 0.7
Diptera Tabanidae Chrysops sp. 4.6 ± 3.5 0.27 2.6 ± 1.6
Odonata Zygoptera Argia sp. 4.5 ± 7.8 0.964 1.4 ± 1.3
Odonata Anisoptera Cordulegaster sp. 2.5 ± 2.7 0.088 0.0 ± 0.0
Megaloptera Sialidae Sialis sp. 9.9 ± 7.7 0.27 5.4 ± 3.4
Amphipoda Talitridaae Hyalella azteca 0.0 ± 0.0 0.964 2.5 ± 6.7
Hirudinea Glossiphoniidae Helobdella stagnalis 0.0 ± 0.0 0.022 1.4 ± 1.9
Oligochaeta Tubificidae - 7.8 ± 15.8 0.627 1.3 ± 3.5
Bivalva Pisidiinae Pisidium sp. 207.9 ± 426.0 0.001 1.1 ± 2.2
Bivalva Pisidiinae Spaerium sp. 7.8 ± 10.0 0.27 0.0 ± 0.0
Gastropoda Physidae Physella gyrina. 3.9 ± 4.2 0.088 0.1 ± 0.4
TABLE 8MEAN UPSTREAM AND DOWNSTREAM ABUNDANCES FOR DOMINANT BENTHIC
MACROINVERTEBRATE TAXA FROM AUGUR CREEK, 2009
Higher Taxa Family of Subfamily Genus or Species K-S Sig
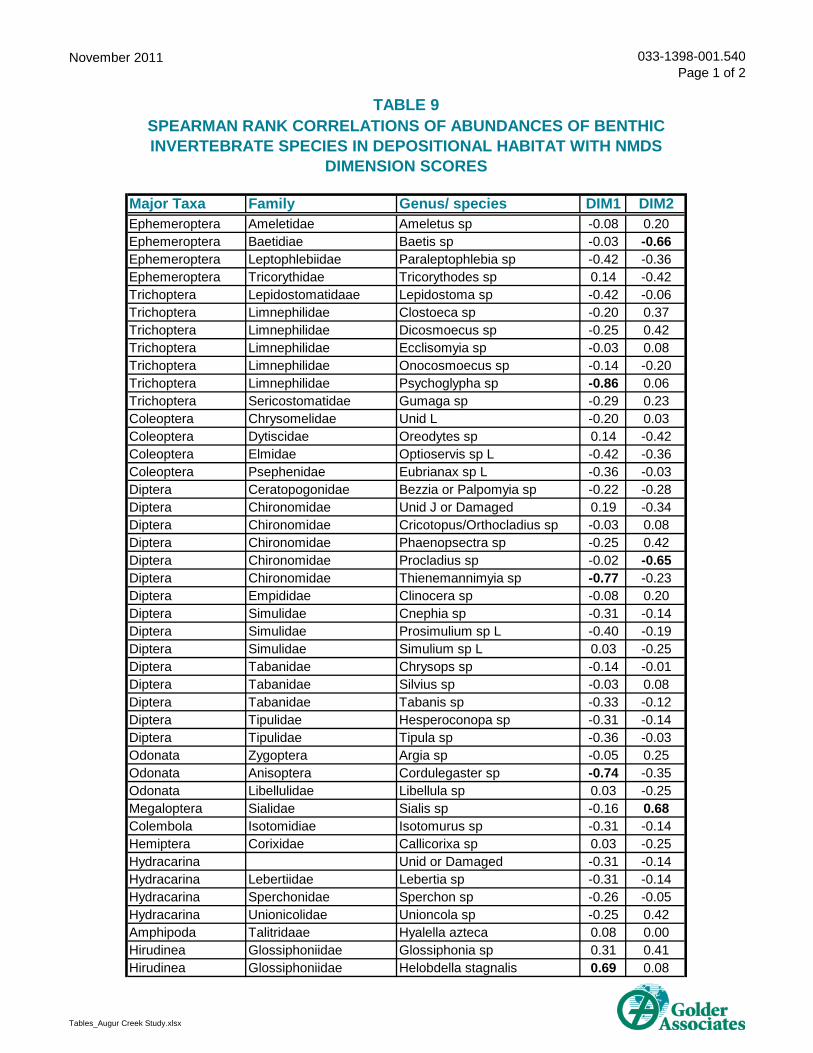
November 2011 033-1398-001.540Page 1 of 2
Tables_Augur Creek Study.xlsx
Major Taxa Family Genus/ species DIM1 DIM2Ephemeroptera Ameletidae Ameletus sp -0.08 0.20Ephemeroptera Baetidiae Baetis sp -0.03 -0.66Ephemeroptera Leptophlebiidae Paraleptophlebia sp -0.42 -0.36Ephemeroptera Tricorythidae Tricorythodes sp 0.14 -0.42Trichoptera Lepidostomatidaae Lepidostoma sp -0.42 -0.06Trichoptera Limnephilidae Clostoeca sp -0.20 0.37Trichoptera Limnephilidae Dicosmoecus sp -0.25 0.42Trichoptera Limnephilidae Ecclisomyia sp -0.03 0.08Trichoptera Limnephilidae Onocosmoecus sp -0.14 -0.20Trichoptera Limnephilidae Psychoglypha sp -0.86 0.06Trichoptera Sericostomatidae Gumaga sp -0.29 0.23Coleoptera Chrysomelidae Unid L -0.20 0.03Coleoptera Dytiscidae Oreodytes sp 0.14 -0.42Coleoptera Elmidae Optioservis sp L -0.42 -0.36Coleoptera Psephenidae Eubrianax sp L -0.36 -0.03Diptera Ceratopogonidae Bezzia or Palpomyia sp -0.22 -0.28Diptera Chironomidae Unid J or Damaged 0.19 -0.34Diptera Chironomidae Cricotopus/Orthocladius sp -0.03 0.08Diptera Chironomidae Phaenopsectra sp -0.25 0.42Diptera Chironomidae Procladius sp -0.02 -0.65Diptera Chironomidae Thienemannimyia sp -0.77 -0.23Diptera Empididae Clinocera sp -0.08 0.20Diptera Simulidae Cnephia sp -0.31 -0.14Diptera Simulidae Prosimulium sp L -0.40 -0.19Diptera Simulidae Simulium sp L 0.03 -0.25Diptera Tabanidae Chrysops sp -0.14 -0.01Diptera Tabanidae Silvius sp -0.03 0.08Diptera Tabanidae Tabanis sp -0.33 -0.12Diptera Tipulidae Hesperoconopa sp -0.31 -0.14Diptera Tipulidae Tipula sp -0.36 -0.03Odonata Zygoptera Argia sp -0.05 0.25Odonata Anisoptera Cordulegaster sp -0.74 -0.35Odonata Libellulidae Libellula sp 0.03 -0.25Megaloptera Sialidae Sialis sp -0.16 0.68Colembola Isotomidiae Isotomurus sp -0.31 -0.14Hemiptera Corixidae Callicorixa sp 0.03 -0.25Hydracarina Unid or Damaged -0.31 -0.14Hydracarina Lebertiidae Lebertia sp -0.31 -0.14Hydracarina Sperchonidae Sperchon sp -0.26 -0.05Hydracarina Unionicolidae Unioncola sp -0.25 0.42Amphipoda Talitridaae Hyalella azteca 0.08 0.00Hirudinea Glossiphoniidae Glossiphonia sp 0.31 0.41Hirudinea Glossiphoniidae Helobdella stagnalis 0.69 0.08
TABLE 9SPEARMAN RANK CORRELATIONS OF ABUNDANCES OF BENTHIC INVERTEBRATE SPECIES IN DEPOSITIONAL HABITAT WITH NMDS
DIMENSION SCORES
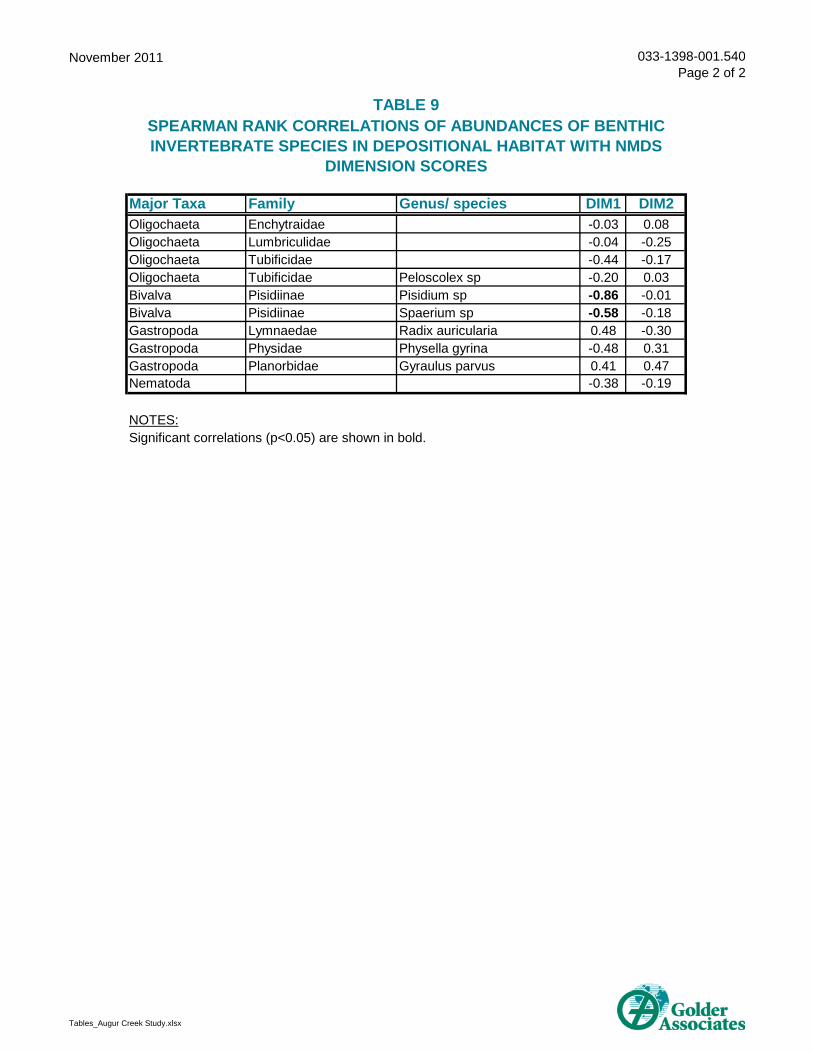
November 2011 033-1398-001.540Page 2 of 2
Tables_Augur Creek Study.xlsx
Major Taxa Family Genus/ species DIM1 DIM2
TABLE 9SPEARMAN RANK CORRELATIONS OF ABUNDANCES OF BENTHIC INVERTEBRATE SPECIES IN DEPOSITIONAL HABITAT WITH NMDS
DIMENSION SCORES
Oligochaeta Enchytraidae -0.03 0.08Oligochaeta Lumbriculidae -0.04 -0.25Oligochaeta Tubificidae -0.44 -0.17Oligochaeta Tubificidae Peloscolex sp -0.20 0.03Bivalva Pisidiinae Pisidium sp -0.86 -0.01Bivalva Pisidiinae Spaerium sp -0.58 -0.18Gastropoda Lymnaedae Radix auricularia 0.48 -0.30Gastropoda Physidae Physella gyrina -0.48 0.31Gastropoda Planorbidae Gyraulus parvus 0.41 0.47Nematoda -0.38 -0.19
NOTES:Significant correlations (p<0.05) are shown in bold.
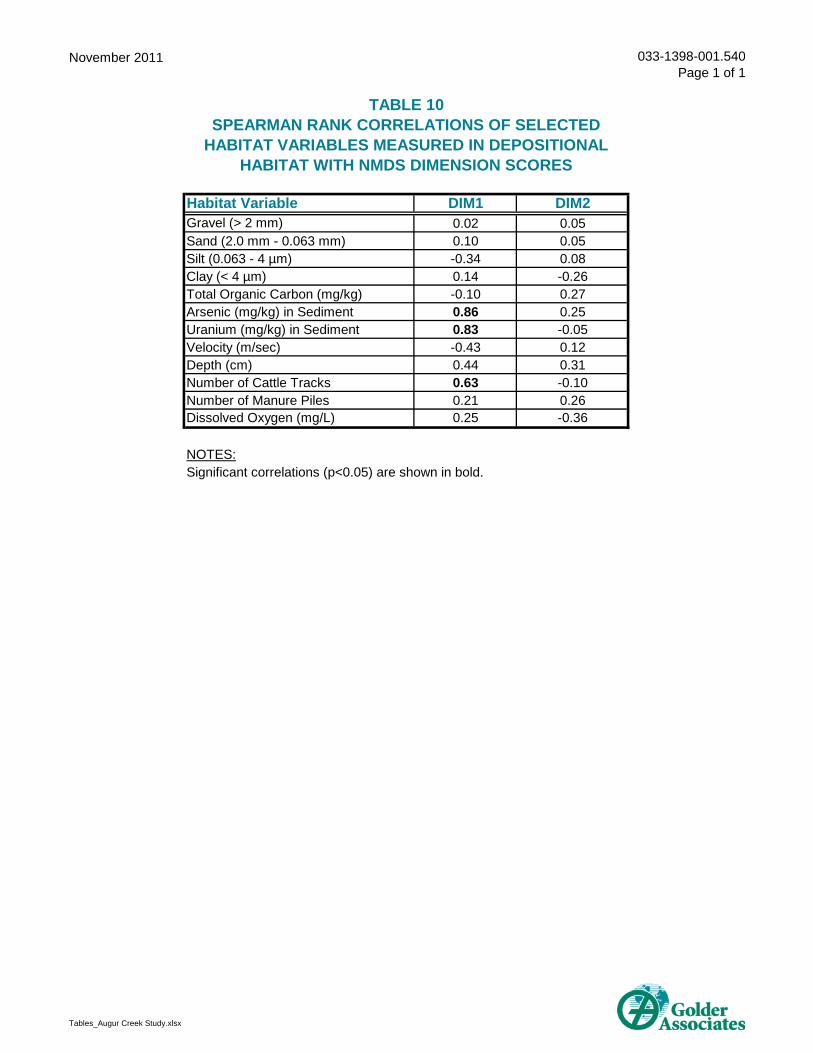
November 2011 033-1398-001.540Page 1 of 1
Tables_Augur Creek Study.xlsx
Habitat Variable DIM1 DIM2Gravel (> 2 mm) 0.02 0.05Sand (2.0 mm - 0.063 mm) 0.10 0.05Silt (0.063 - 4 µm) -0.34 0.08Clay (< 4 µm) 0.14 -0.26Total Organic Carbon (mg/kg) -0.10 0.27Arsenic (mg/kg) in Sediment 0.86 0.25Uranium (mg/kg) in Sediment 0.83 -0.05Velocity (m/sec) -0.43 0.12Depth (cm) 0.44 0.31Number of Cattle Tracks 0.63 -0.10Number of Manure Piles 0.21 0.26Dissolved Oxygen (mg/L) 0.25 -0.36
NOTES:Significant correlations (p<0.05) are shown in bold.
SPEARMAN RANK CORRELATIONS OF SELECTED HABITAT VARIABLES MEASURED IN DEPOSITIONAL
HABITAT WITH NMDS DIMENSION SCORES
TABLE 10
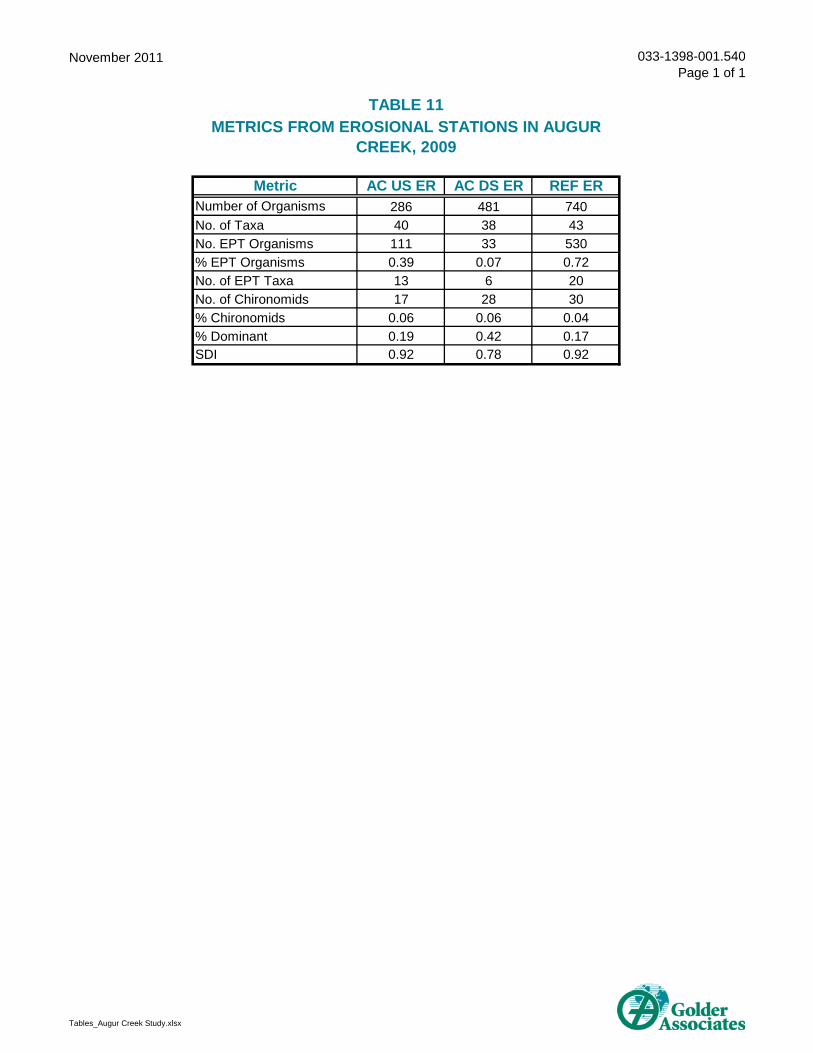
November 2011 033-1398-001.540Page 1 of 1
Tables_Augur Creek Study.xlsx
Metric AC US ER AC DS ER REF ERNumber of Organisms 286 481 740No. of Taxa 40 38 43No. EPT Organisms 111 33 530% EPT Organisms 0.39 0.07 0.72No. of EPT Taxa 13 6 20No. of Chironomids 17 28 30% Chironomids 0.06 0.06 0.04% Dominant 0.19 0.42 0.17SDI 0.92 0.78 0.92
TABLE 11 METRICS FROM EROSIONAL STATIONS IN AUGUR
CREEK, 2009

FIGURES
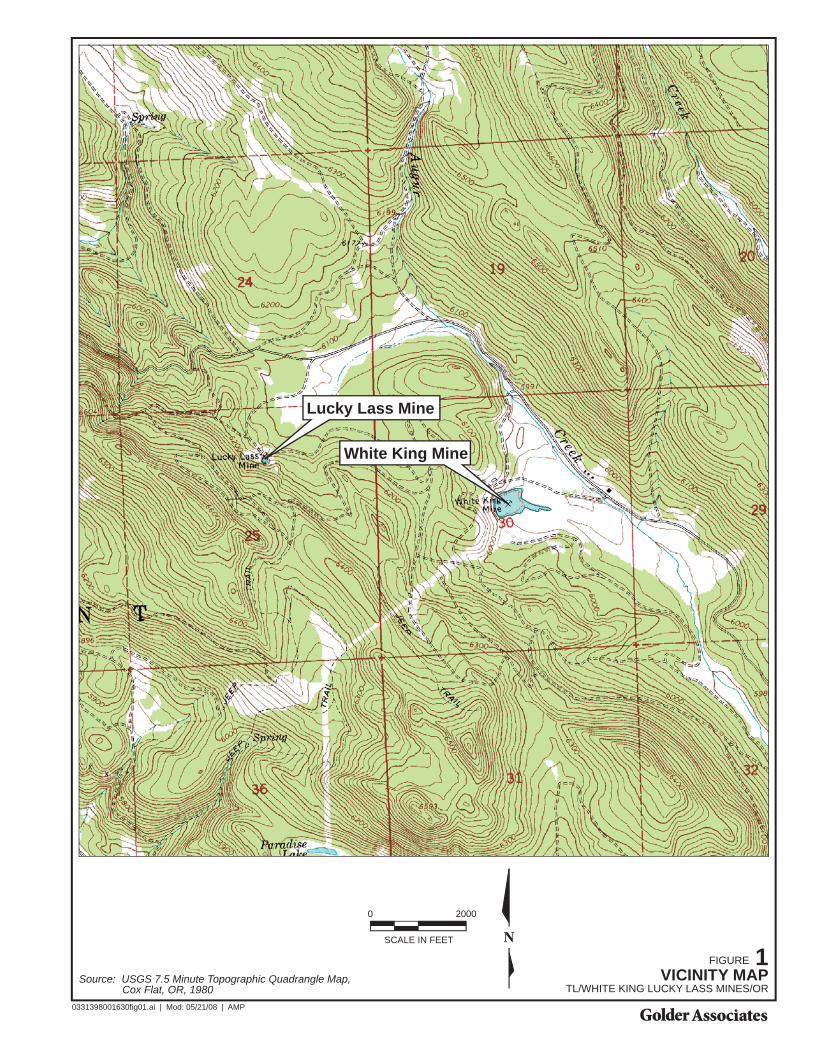
Source: USGS 7.5 Minute Topographic Quadrangle Map, Cox Flat, OR, 1980
SCALE IN FEET
20000
FIGURE 1VICINITY MAP
TL/WHITE KING LUCKY LASS MINES/OR0331398001630fig01.ai | Mod: 05/21/08 | AMP
Lucky Lass Mine
White King Mine
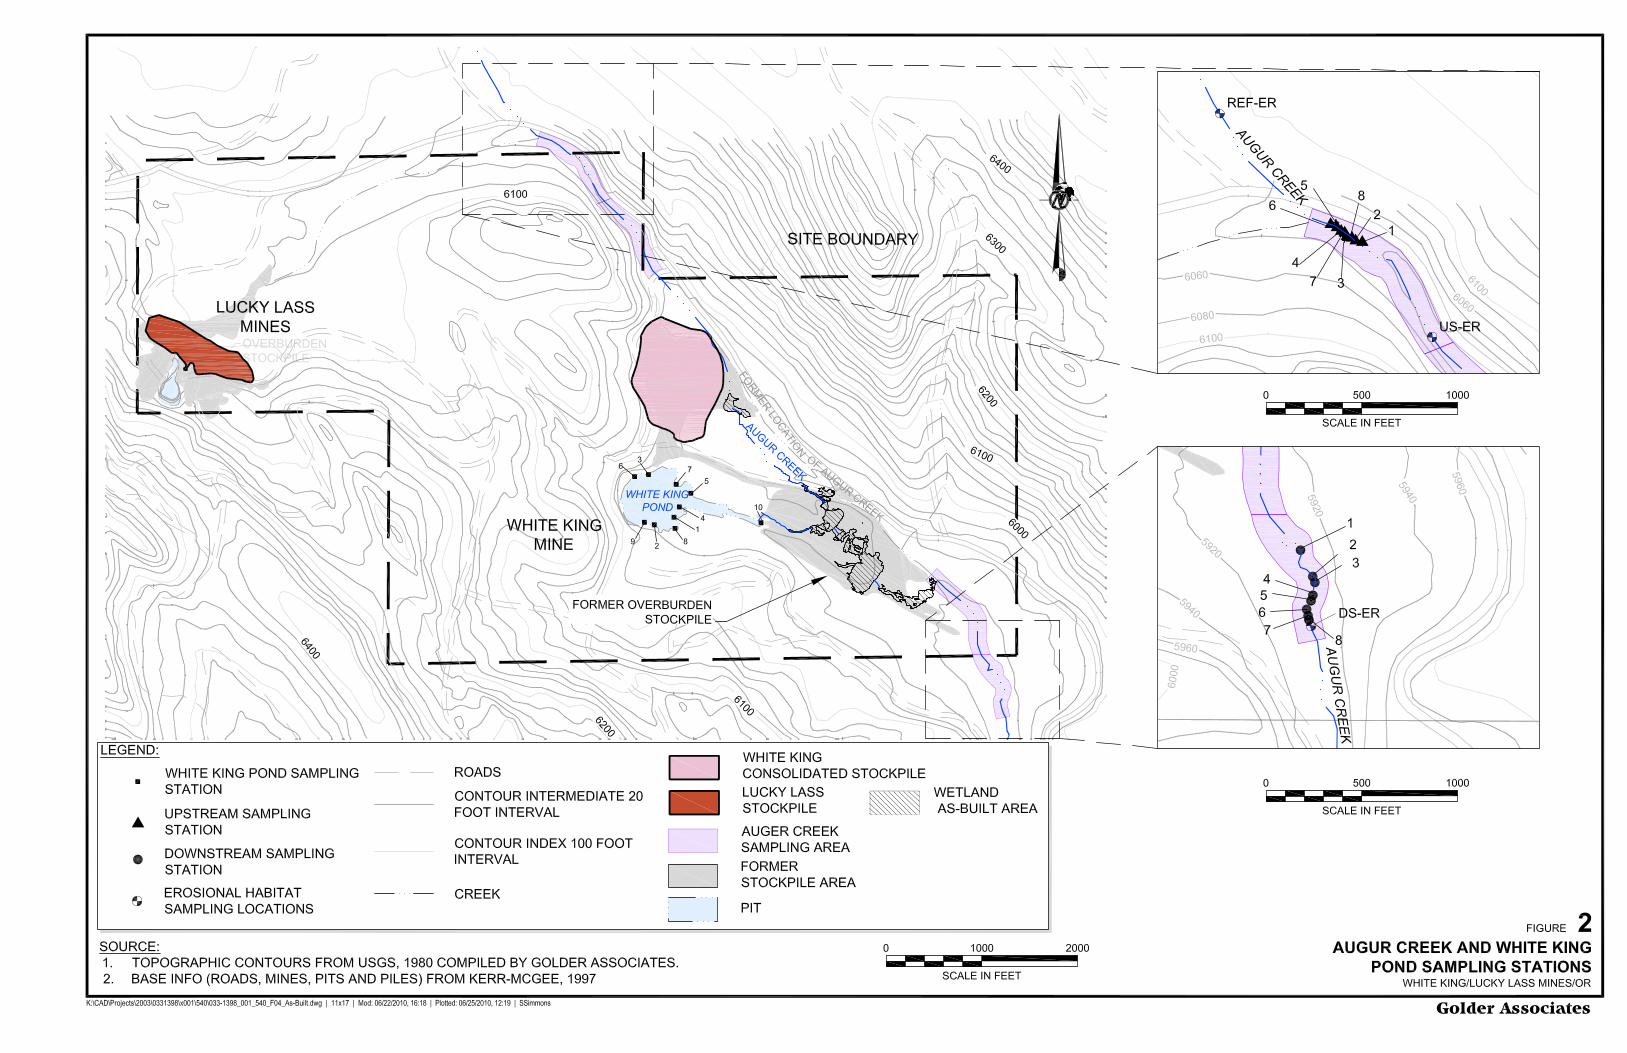
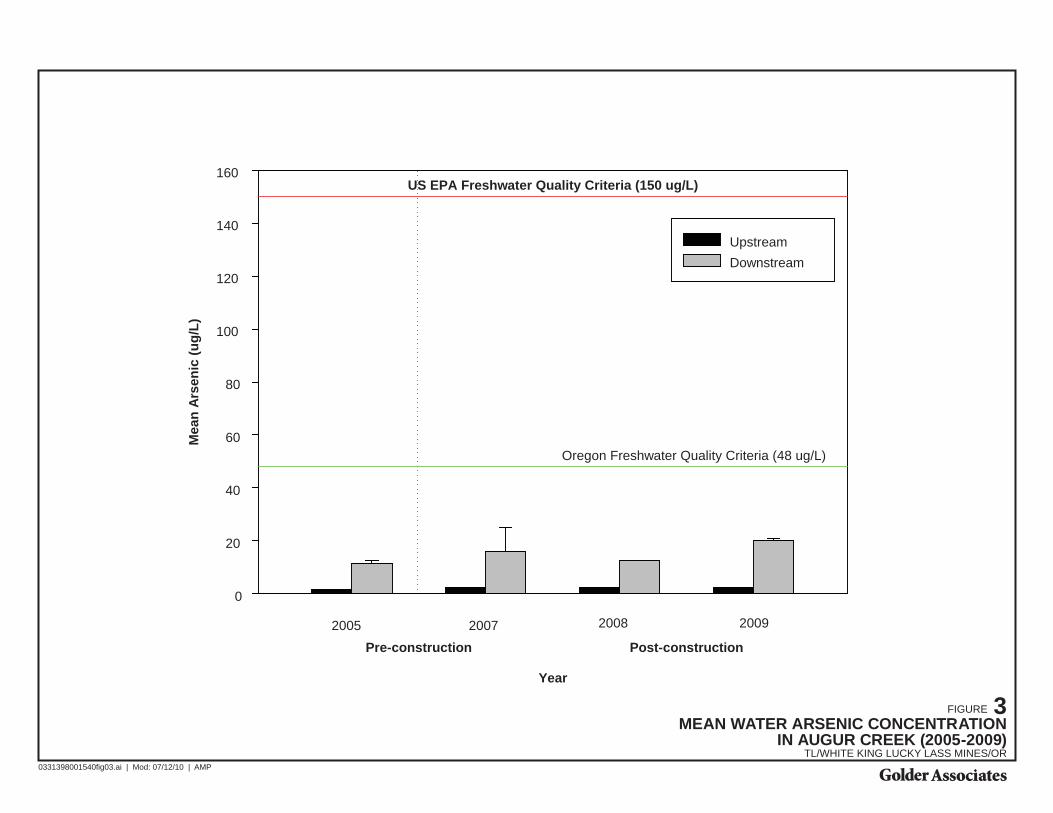
FIGURE 3MEAN WATER ARSENIC CONCENTRATION
IN AUGUR CREEK (2005-2009)TL/WHITE KING LUCKY LASS MINES/OR
0331398001540fig03.ai | Mod: 07/12/10 | AMP
Mea
n A
rsen
ic (
ug
/L)
0
20
40
60
80
100
120
140
160
UpstreamDownstream
2005 2007 2008 2009
Pre-construction Post-construction
US EPA Freshwater Quality Criteria (150 ug/L)
Oregon Freshwater Quality Criteria (48 ug/L)
Year
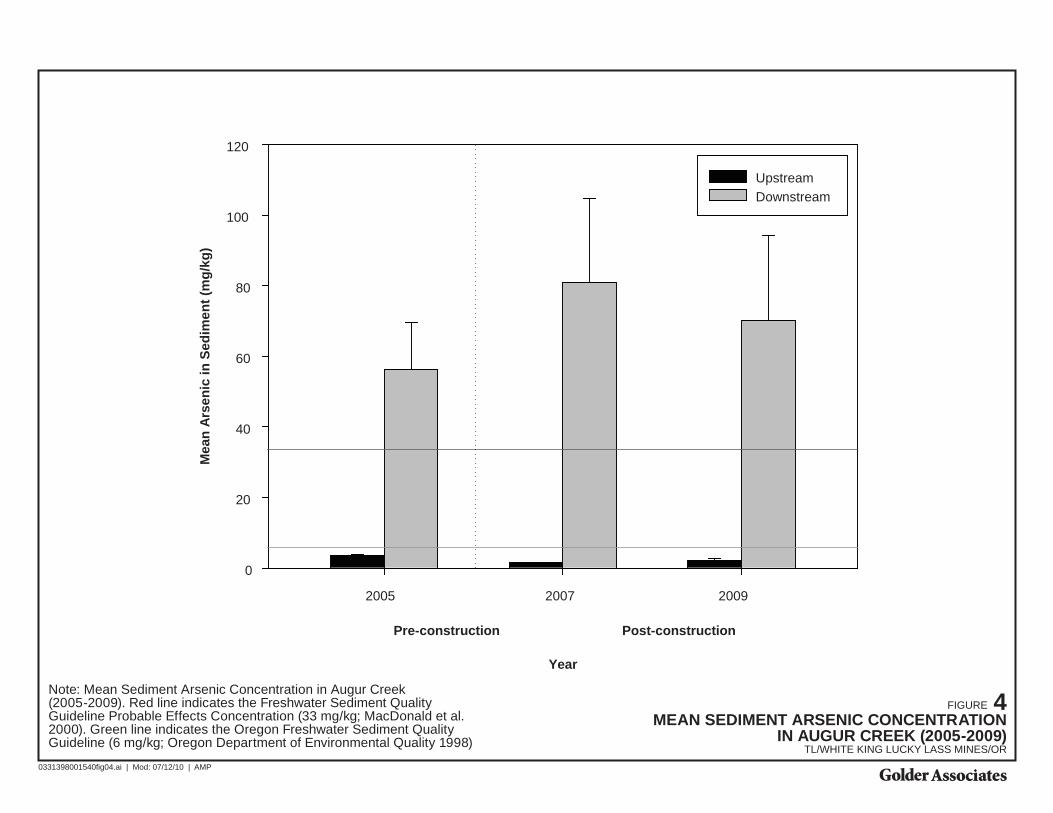
FIGURE 4MEAN SEDIMENT ARSENIC CONCENTRATION
IN AUGUR CREEK (2005-2009)TL/WHITE KING LUCKY LASS MINES/OR
0331398001540fig04.ai | Mod: 07/12/10 | AMP
0
20
40
60
80
100
120
2005 2007 2009
Year
Mea
n A
rsen
ic i
n S
edim
ent
(mg
/kg
)
Post-constructionPre-construction
UpstreamDownstream
Note: Mean Sediment Arsenic Concentration in Augur Creek (2005-2009). Red line indicates the Freshwater Sediment Quality Guideline Probable Effects Concentration (33 mg/kg; MacDonald et al. 2000). Green line indicates the Oregon Freshwater Sediment Quality Guideline (6 mg/kg; Oregon Department of Environmental Quality 1998)
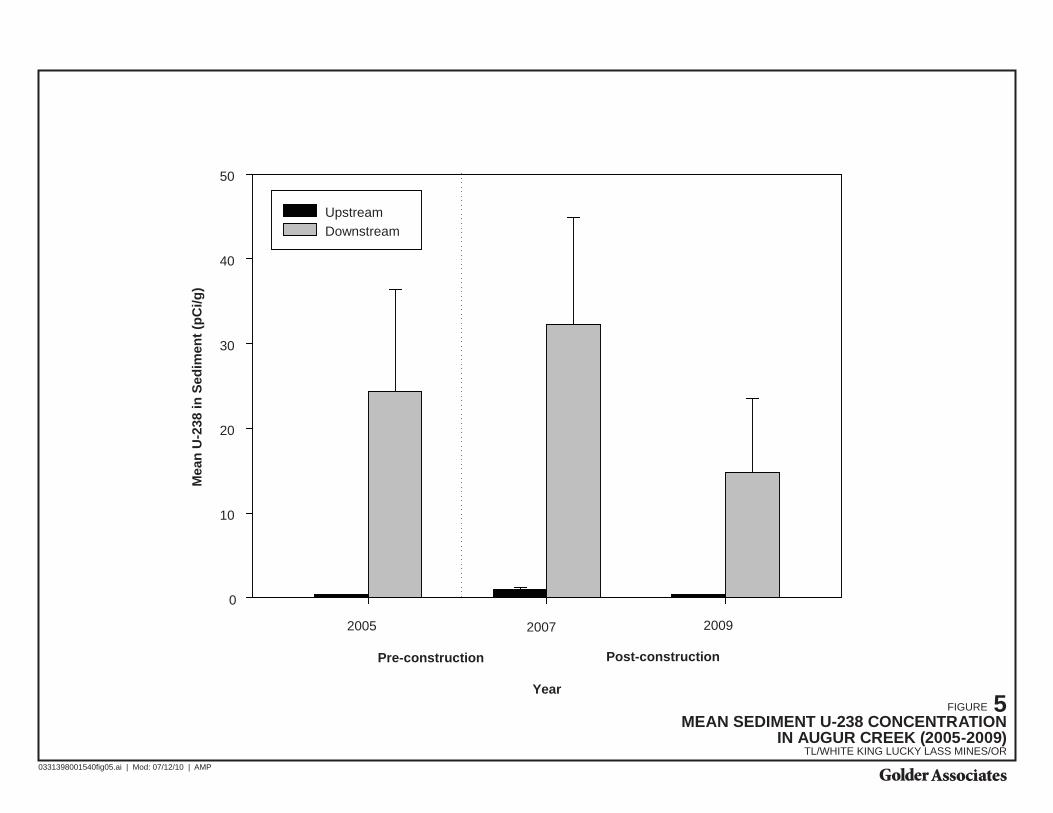
FIGURE 5MEAN SEDIMENT U-238 CONCENTRATION
IN AUGUR CREEK (2005-2009)TL/WHITE KING LUCKY LASS MINES/OR
0331398001540fig05.ai | Mod: 07/12/10 | AMP
Year
Mea
n U
-238
in
Sed
imen
t (p
Ci/g
)
0
10
20
30
40
50
UpstreamDownstream
2005 2007 2009
Pre-construction Post-construction
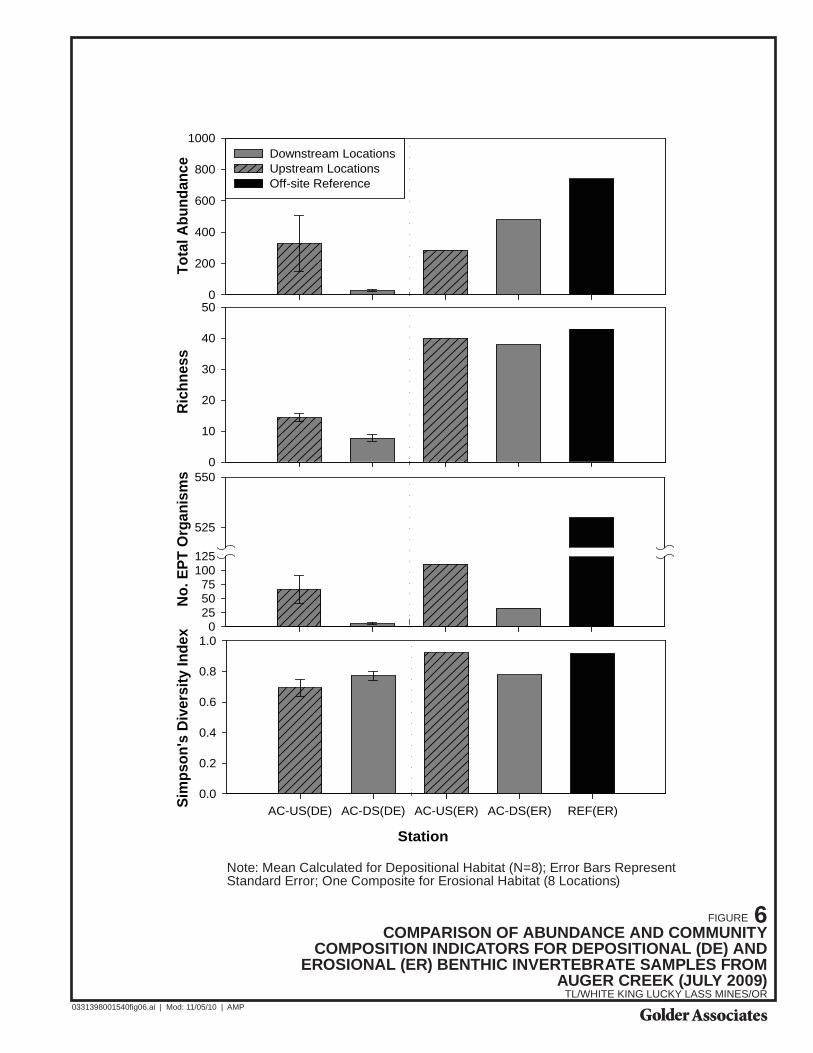
FIGURE 6COMPARISON OF ABUNDANCE AND COMMUNITY
COMPOSITION INDICATORS FOR DEPOSITIONAL (DE) AND EROSIONAL (ER) BENTHIC INVERTEBRATE SAMPLES FROM
AUGER CREEK (JULY 2009) TL/WHITE KING LUCKY LASS MINES/OR
0331398001540fig06.ai | Mod: 11/05/10 | AMP
No
. EP
T O
rgan
ism
s
0255075
100125
525
550
Ric
hn
ess
0
10
20
30
40
50
Station
AC-US(DE) AC-DS(DE) AC-US(ER) AC-DS(ER) REF(ER)Sim
pso
n's
Div
ersi
ty In
dex
0.0
0.2
0.4
0.6
0.8
1.0
To
tal A
bu
nd
ance
0
200
400
600
800
1000Downstream LocationsUpstream LocationsOff-site Reference
Note: Mean Calculated for Depositional Habitat (N=8); Error Bars Represent Standard Error; One Composite for Erosional Habitat (8 Locations)
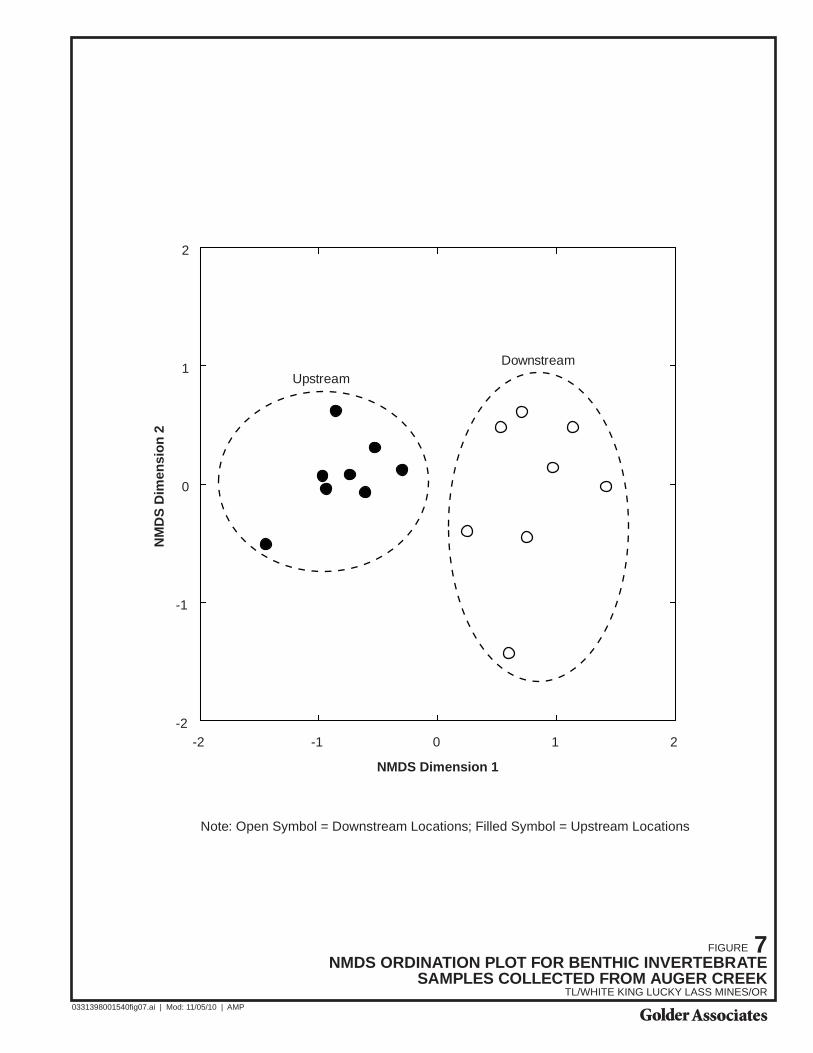
FIGURE 7NMDS ORDINATION PLOT FOR BENTHIC INVERTEBRATE
SAMPLES COLLECTED FROM AUGER CREEK TL/WHITE KING LUCKY LASS MINES/OR
0331398001540fig07.ai | Mod: 11/05/10 | AMP
NMDS Dimension 1
-2 -1 0 1 2
NM
DS
Dim
ens
ion
2
-2
-1
0
1
2
UpstreamDownstream
Note: Open Symbol = Downstream Locations; Filled Symbol = Upstream Locations
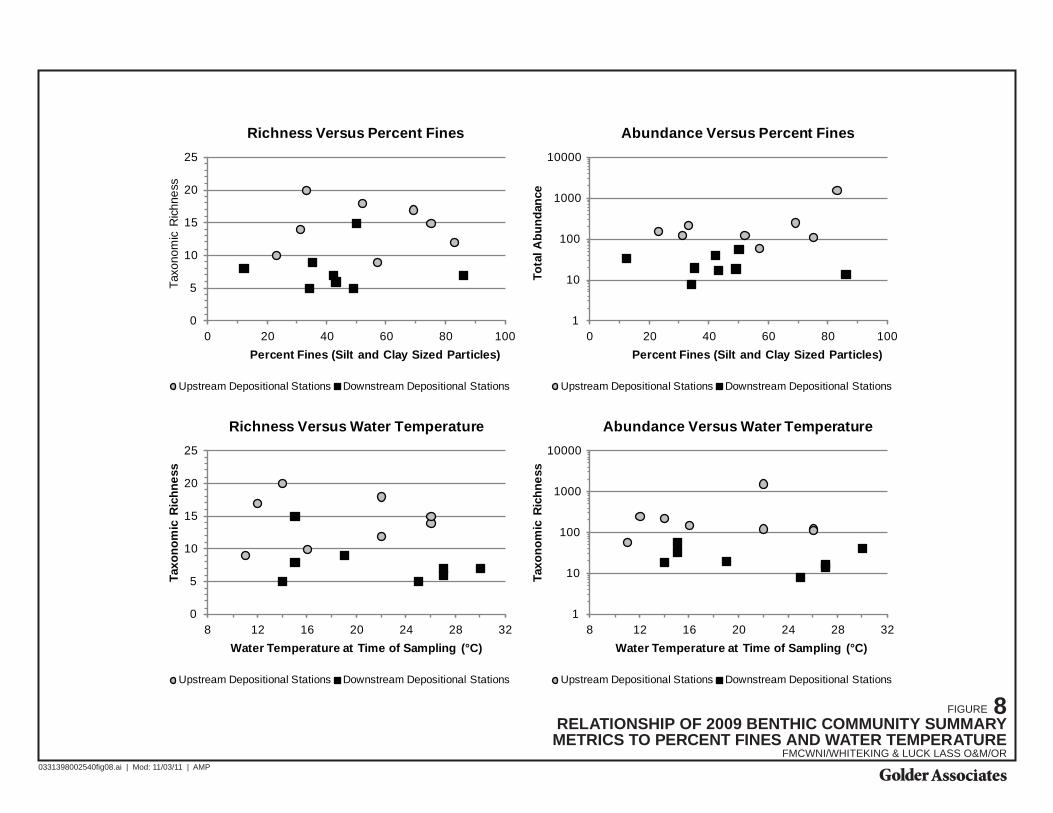
FIGURE 8RELATIONSHIP OF 2009 BENTHIC COMMUNITY SUMMARY METRICS TO PERCENT FINES AND WATER TEMPERATURE
FMCWNI/WHITEKING & LUCK LASS O&M/OR0331398002540fig08.ai | Mod: 11/03/11 | AMP
0
5
10
15
20
25
0 20 40 60 80 100
Taxo
nom
ic R
ichn
ess
Percent Fines (Silt and Clay Sized Particles)
Richness Versus Percent Fines
Upstream Depositional Stations Downstream Depositional Stations
1
10
100
1000
10000
0 20 40 60 80 100
To
tal A
bu
nd
ance
Percent Fines (Silt and Clay Sized Particles)
Abundance Versus Percent Fines
Upstream Depositional Stations Downstream Depositional Stations
0
5
10
15
20
25
8 12 16 20 24 28 32
Tax
on
om
ic R
ich
ne
ss
Water Temperature at Time of Sampling (°C)
Richness Versus Water Temperature
Upstream Depositional Stations Downstream Depositional Stations
1
10
100
1000
10000
8 12 16 20 24 28 32
Tax
on
om
ic R
ich
ne
ss
Water Temperature at Time of Sampling (°C)
Abundance Versus Water Temperature
Upstream Depositional Stations Downstream Depositional Stations
APPENDIX A DATA VALIDATION CHECKLISTS
November 2011 A-1 033-1398-001.540
Appendix A.docx
1.0 QUALITY ASSURANCE / QUALITY CONTROL (QA/QC)
Quality assurance and control procedures were used during field sampling and laboratory analysis as specified in the Quality Assurance Project Plan (QAPP; Golder 2003). The following sections present summary assessment of data validation exercises performed on individual data packages generated for laboratory analysis associated with the 2009 surface water, and the 2009 sediment collections. Data for the 2009 groundwater monitoring task (laboratory sample delivery group #237826) is provided in a separate report.
Data validation was performed on each sample delivery group received from the laboratory, using guidelines established by the Superfund Contract Laboratory program. Data quality criteria is as presented in U.S. Environmental Protection Agency (USEPA) Contract Laboratory Program National Functional Guidelines for Inorganic Data Review, (USEPA 2004), the governing QAPP, and laboratory established recovery indices as appropriate. Data qualification is applied to the level of detection as relates to the laboratory practical quanitation limit (PQL) for nutrient and inorganic parameters, or the laboratory detection limit (DL) appropriate to radiochemistry parameters. Data qualification is also applied to analytical results as a result of deficiencies identified during the course of validation. A summary of the data validation qualifiers is provided with the checklists, and per sample qualification is provided on annotated laboratory report pages within this Appendix.
1.1 Surface Water QA/QC
Surface water samples were collected on July 20, 2009 in SDG #233941, and analyzed for the following parameters:
Total alkalinity by SM 2320B
Ammonia as N (NH3-N) by USEPA 350.1
Total kjeldahl nitrogen (TKN) by USEPA 351.2
Nitrate/ nitrite as N (NO3/NO2-N) by USEPA 353.2
Total phosphorus by USEPA 365.4
Total dissolved solids (TDS) by USEPA modified Method 160.1
Total suspended solids (TSS) by USEPA Method 160.2
Hardness by SM 2340B
pH by USEPA Method 9040B
Total and dissolved arsenic and uranium by USEPA Method 3005/ 6020
1.1.1 Qualifications Applied
Holding times were beyond the 24 hour limit for pH analysis. The pH tests were performed on day 3, rendering the out of limit condition for all associated samples. Results have been qualified as estimated (J).
Receipt temperatures were out of limit for multiple general chemistry parameters. Receiving temperatures are required to be maintained at 4 degrees Celcius (+/- 2 degrees). However, the temperature upon receipt was 10 an 11 degrees Celcius, qualifying associated results for NO3/NO2-N, NH3-N, TKN, phosphorus, and alkalinity as estimated (J for detects /UJ for non-detects) for all results.
Arsenic was detected in the method blank associated with the dissolved fraction metals analysis. Associated detects are qualified as estimated with a high bias (J+), and selected detections below the reporting limit (RL) but above the MDL have been raised to the RL and qualified as non-detect (U).
November 2011 A-2 033-1398-001.540
Appendix A.docx
Calcium was detected in the method blank associated with the total fraction metals analysis. Associated detects below the reporting limit (RL) but above the MDL have been raised to the RL and qualified as non-detect (U).
The serial dilution for magnesium (Mg) was out of limit (+/- 10%) for sample AC-DS-01. Due to the potential dissimilarity of sample matrix among this sample group, only sample AC-DS-01 is qualified as estimated (J).
1.1.2 Total Fraction Analysis
Samples AC-US-01 FB, and AC-TB were identified as field blanks and trip blanks respectively. Field blank samples consisted of deionized water provided by the laboratory that was uncapped during sample collection and added to a collection bottle in the sampling environment. The trip blank typically remains sealed during transport and is sent back to the laboratory unopened. The samples generally support the quality of procedures applied in collection, filtration, and handling in the field, and analysis by the laboratory. There were trace detections of arsenic in sample AC-US-01 FB, and AC-TB above the detection limit (MDL) but below the RL. Qualification of metal results by the laboratory as estimated (J) is routinely applied to results in this range. There were trace detections of NH3-N and phorphorus in AC-US-01 FB, and trace detections of phorphorus in AC-TB, below the RL but above the MDL. Qualification of general chemistry results by the laboratory as estimated (J) is routinely applied to results in this range.
Sample AC-DS-01 in the total fraction for metals, and AC-DS-01 in the dissolved fraction for general chemistry parameters were selected for matrix spike and matrix spike duplicate analysis. All recoveries met qualification guidelines and no qualifications were applied. A summary holding time status table, and a summary of the data validation qualifiers applied to the surface water samples, is provided with the checklists within this Appendix.
1.1.3 Dissolved Fraction Analysis
Samples AC-US-01 FB, and AC-TB were identified as field blanks and trip blanks respectively for the dissolved fraction analysis of metals. Arsenic and uranium were reported as non-detect at the RL for both samples.
1.2 White King Pond and Augur Creek Sediment QA/QC
Sediment samples were collected on July 23, 2009 in SDG #234168, and analyzed for the following parameters:
Total organic carbon (TOC) USEPA modified Method 9060,
Arsenic and uranium by USEPA Method 3050/ 6020.
1.2.1 Qualifications Applied
Laboratory duplicate analysis was performed on sample AC-DS-01 for arsenic and uranium. Both of these metals exceeded the relative percent difference (RPD) maximum (35%) for sediment/ soil matrices. Due to potential dissimilarity of sample matrix among this sample group, only sample AC-DS-01 is qualified as estimated (J) for both analytes.
Matrix spike and matrix spike duplicate recovery exceeded recovery limits for As. Recovery was low associated with sample AC-DS-01. Therefore, results for sample AC-DS-01 only are qualified as estimated (J).
All samples have been verified against laboratory raw data as presented in the laboratory data package deliverable. A summary holding time status table, and a summary of the data validation qualifiers applied to the sediment samples, is provided with the checklists within this Appendix.
November 2011 A-3 033-1398-001.540
Appendix A.docx
2.0 REFERENCES:
APHA. 1989. Standard Methods for the Examination of Water and Wastewater, 20th Ed.
SM. 1989. Standard Methods for the Examination of Water and Wastewater’, 17th Edition, American Public Health Association, American Water Works Association, Water Pollution Control Federation, 1989.
Golder. 2003. Quality Assurance Project Plan for Soil, Sediment, and Surface Water Monitoring at the White King / Lucky Lass Mines Superfund Site, Revision 0, Golder, December 12, 2003.
USEPA. 2004. USEPA Contract Laboratory Program National Functional Guidelines for Inorganic Data
Review. OSWER 9240.1-45. EPA 540-R-04-004. October 2004.

APPENDIX B PHOTOGRAPHS
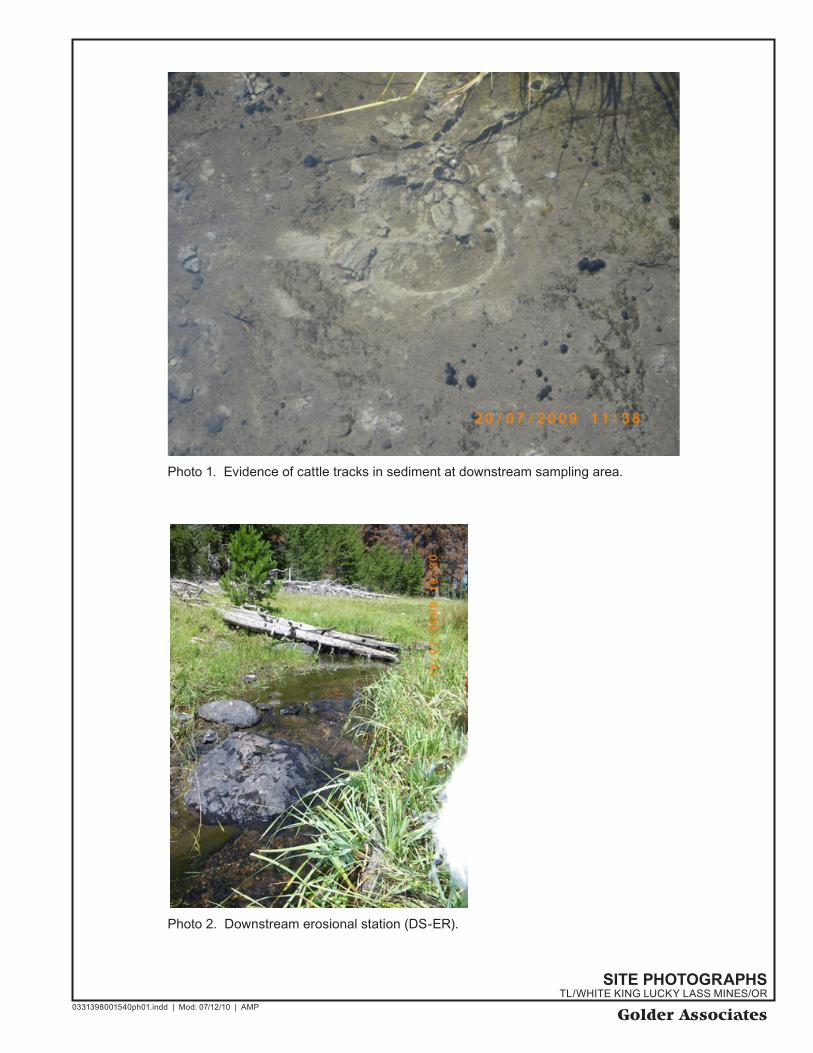
Photo 1. Evidence of cattle tracks in sediment at downstream sampling area.
Photo 2. Downstream erosional station (DS-ER).
0331398001540ph01.indd | Mod: 07/12/10 | AMP
SITE PHOTOGRAPHSTL/WHITE KING LUCKY LASS MINES/OR
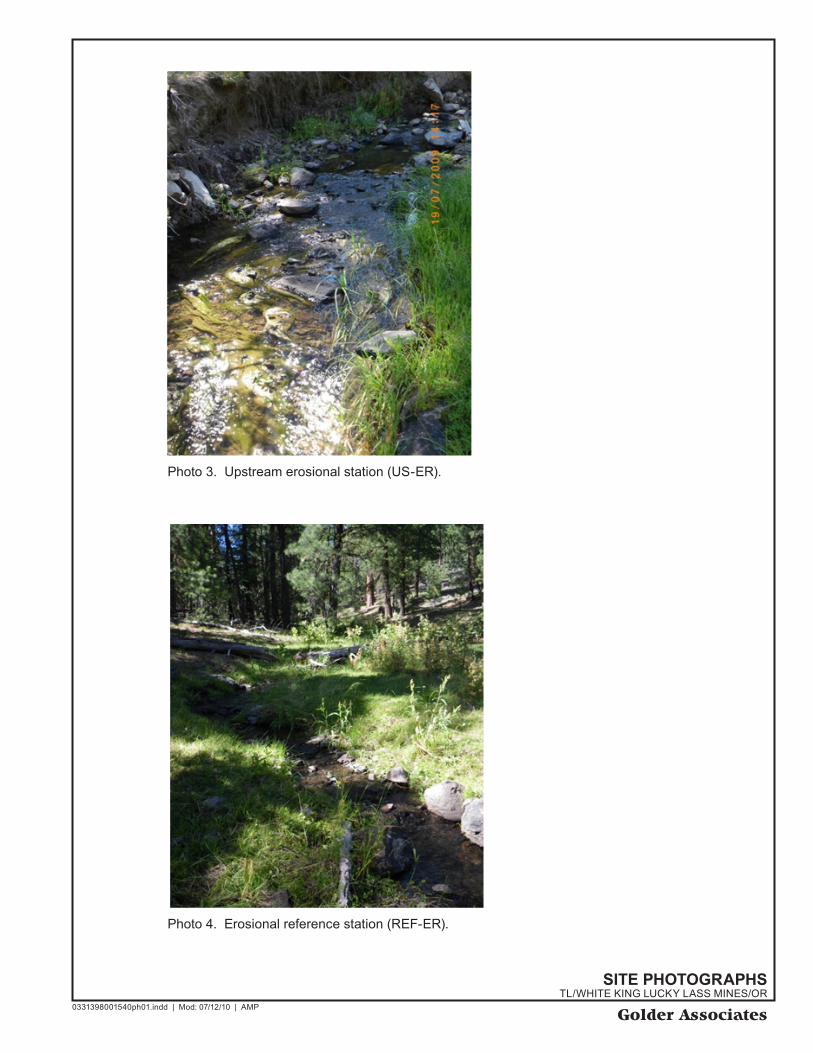
Photo 3. Upstream erosional station (US-ER).
Photo 4. Erosional reference station (REF-ER).
0331398001540ph01.indd | Mod: 07/12/10 | AMP
SITE PHOTOGRAPHSTL/WHITE KING LUCKY LASS MINES/OR
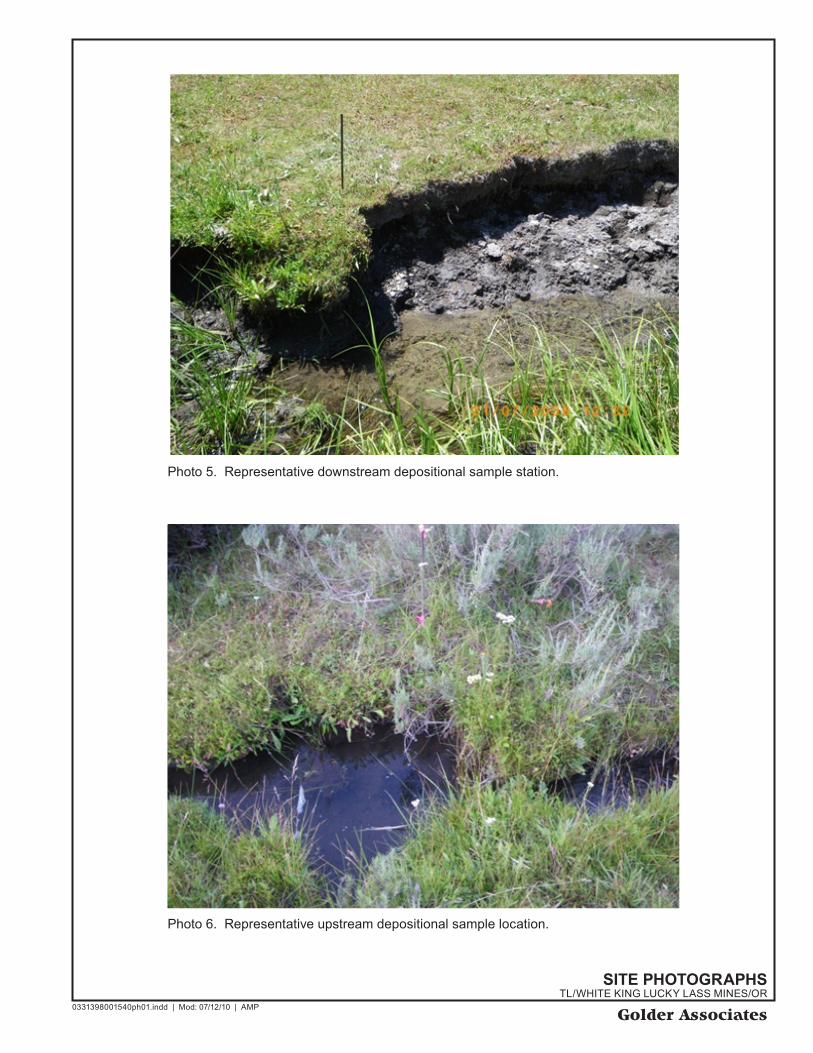
Photo 5. Representative downstream depositional sample station.
Photo 6. Representative upstream depositional sample location.
0331398001540ph01.indd | Mod: 07/12/10 | AMP
SITE PHOTOGRAPHSTL/WHITE KING LUCKY LASS MINES/OR
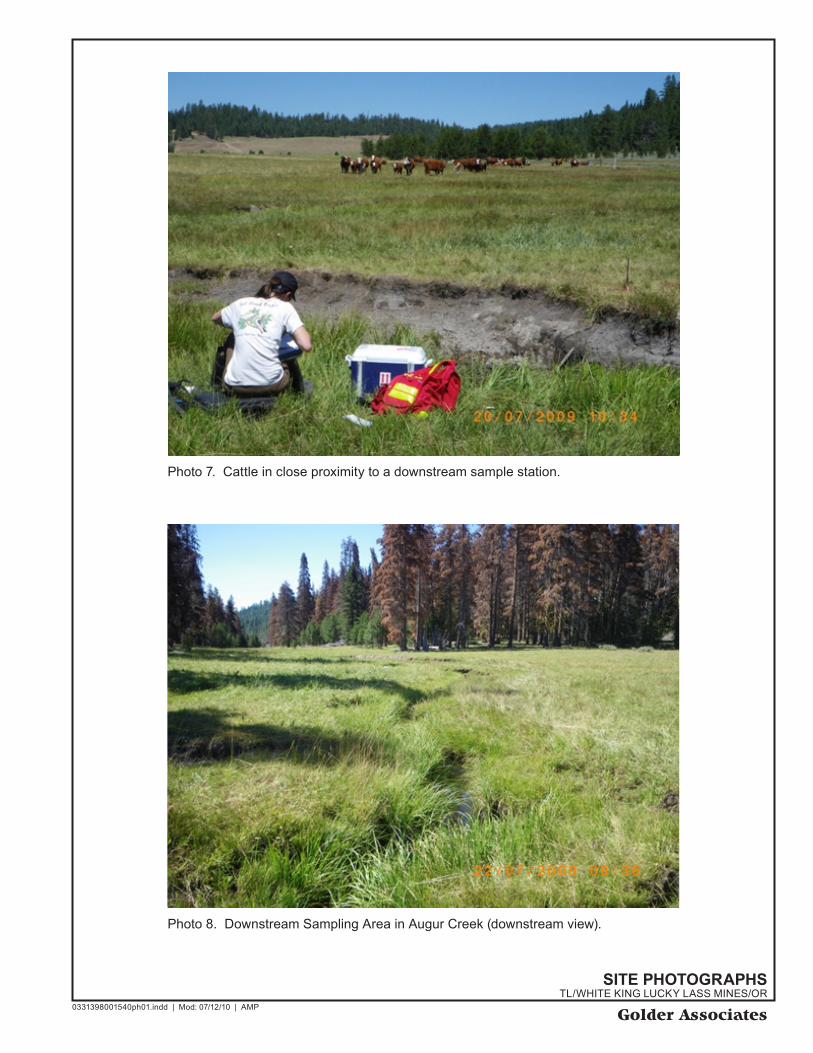
Photo 7. Cattle in close proximity to a downstream sample station.
Photo 8. Downstream Sampling Area in Augur Creek (downstream view).
0331398001540ph01.indd | Mod: 07/12/10 | AMP
SITE PHOTOGRAPHSTL/WHITE KING LUCKY LASS MINES/OR
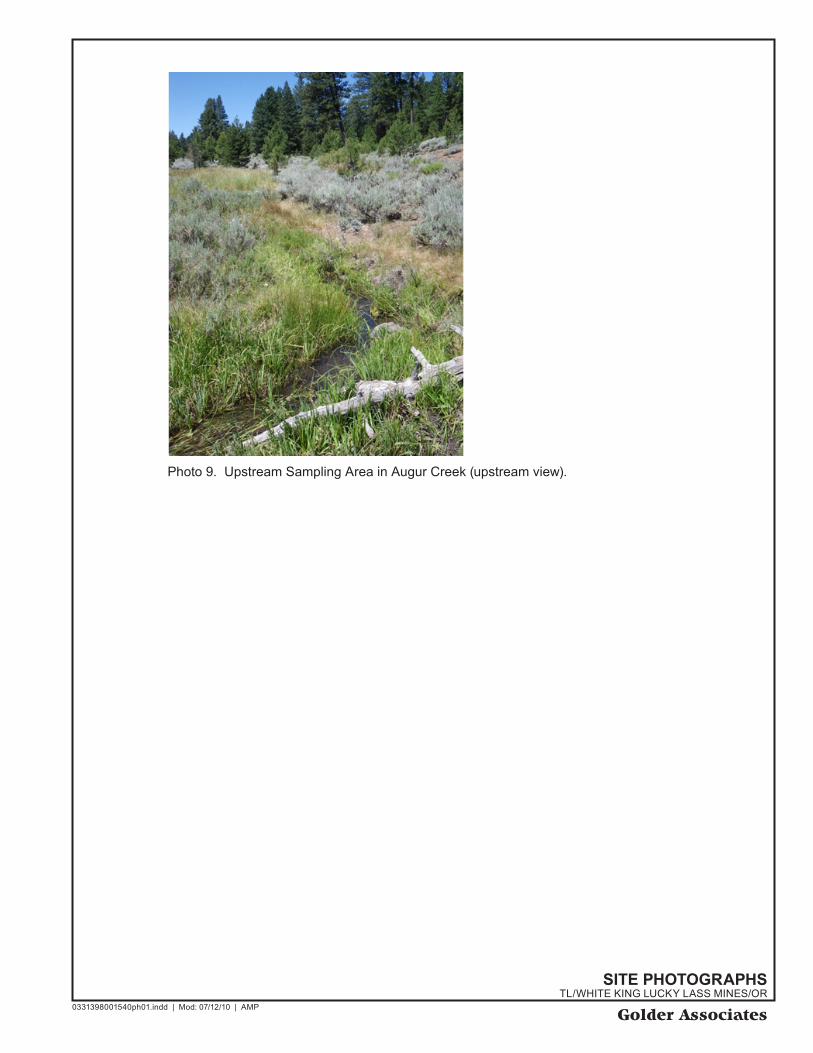
Photo 9. Upstream Sampling Area in Augur Creek (upstream view).
0331398001540ph01.indd | Mod: 07/12/10 | AMP
SITE PHOTOGRAPHSTL/WHITE KING LUCKY LASS MINES/OR

APPENDIX C 2009 RAW BENTHIC INVERTEBRATE IDENTIFICATION AND
ENUMERATION FOR AUGUR CREEK
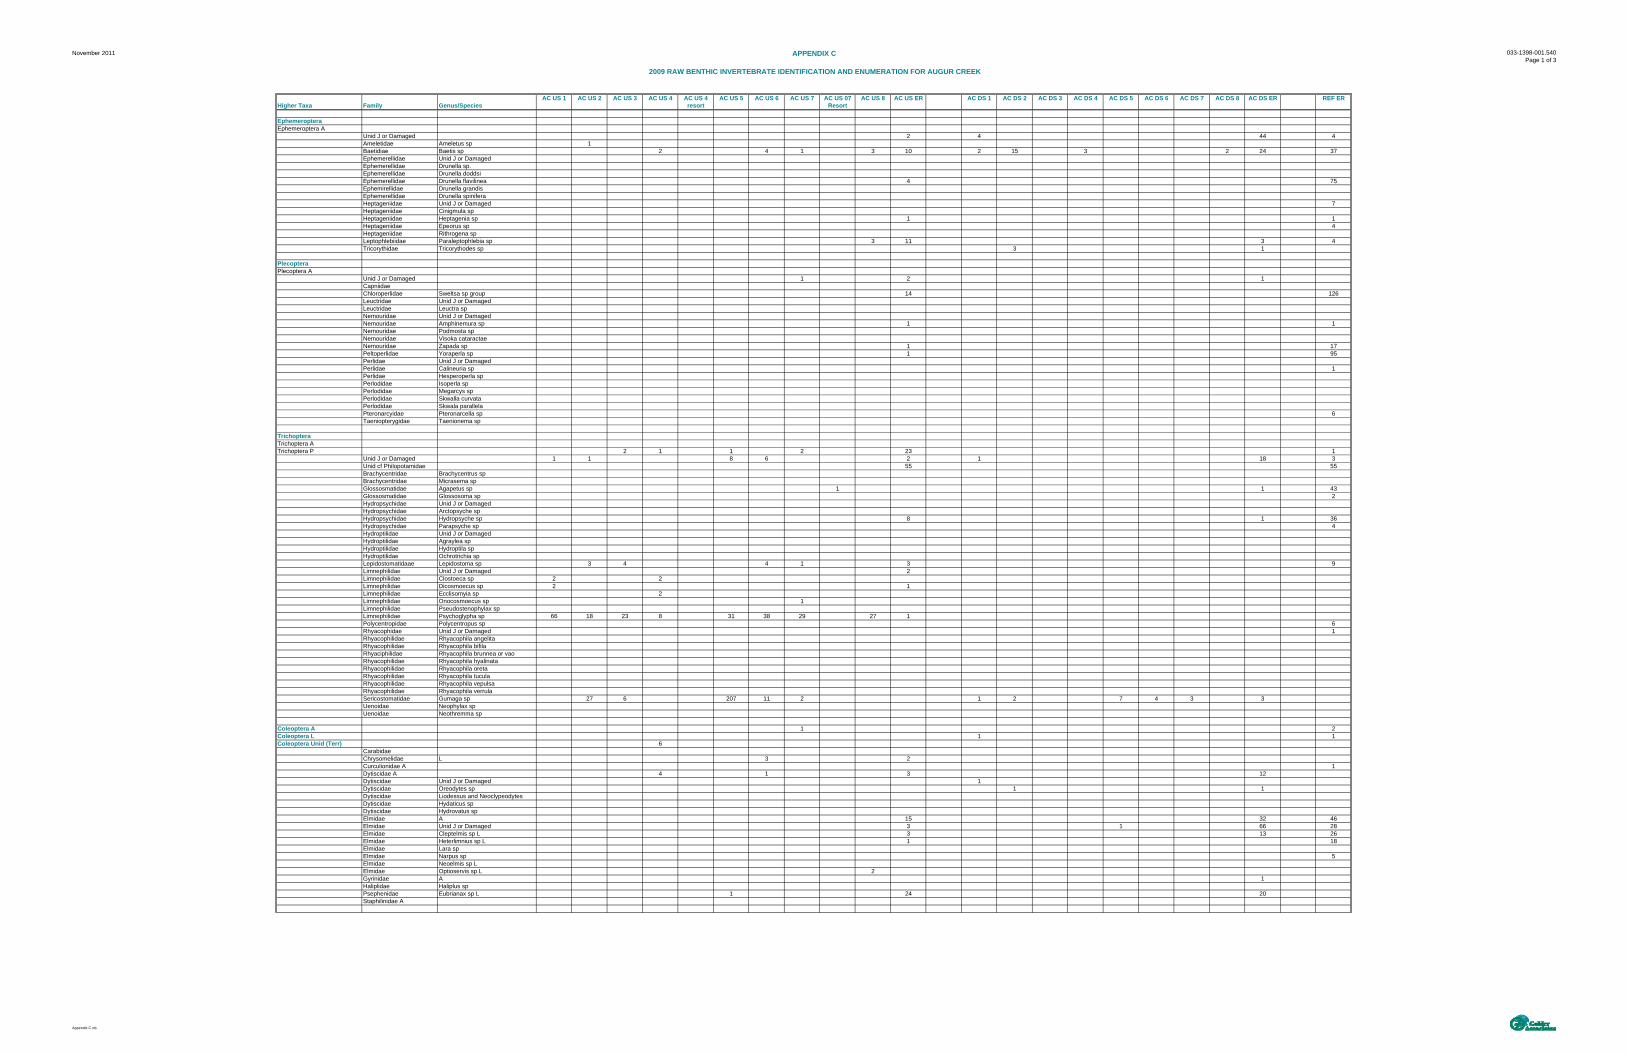
November 2011 APPENDIX C
2009 RAW BENTHIC INVERTEBRATE IDENTIFICATION AND ENUMERATION FOR AUGUR CREEK
033-1398-001.540Page 1 of 3
AC US 1 AC US 2 AC US 3 AC US 4 AC US 4 AC US 5 AC US 6 AC US 7 AC US 07 AC US 8 AC US ER AC DS 1 AC DS 2 AC DS 3 AC DS 4 AC DS 5 AC DS 6 AC DS 7 AC DS 8 AC DS ER REF ERHigher Taxa Family Genus/Species resort Resort
Ephemeroptera Ephemeroptera A
Unid J or Damaged 2 4 44 4Ameletidae Ameletus sp 1Baetidiae Baetis sp 2 4 1 3 10 2 15 3 2 24 37Ephemerellidae Unid J or DamagedEphemerellidae Drunella sp.Ephemerellidae Drunella doddsiEphemerellidae Drunella flavilinea 4 75Ephemirellidae Drunella grandisEphemerellidae Drunella spiniferaHeptageniidae Unid J or Damaged 7Heptageniidae Cinigmula spHeptageniidae Heptagenia sp 1 1Heptageniidae Epeorus sp 4Heptageniidae Rithrogena spLeptophlebiidae Paraleptophlebia sp 3 11 3 4Tricorythidae Tricorythodes sp 3 1
Plecoptera Plecoptera A
Unid J or Damaged 1 2 1CapniidaeChloroperlidae Sweltsa sp group 14 126Leuctridae Unid J or DamagedLeuctridae Leuctra spNemouridae Unid J or DamagedNemouridae Amphinemura sp 1 1Nemouridae Podmosta spNemouridae Visoka cataractaeNemouridae Zapada sp 1 17Peltoperlidae Yoraperla sp 1 95Perlidae Unid J or DamagedPerlidae Calineuria sp 1Perlidae Hesperoperla spPerlodidae Isoperla spPerlodidae Megarcys spPerlodidae Skwalla curvataPerlodidae Skwala parallelaPteronarcyidae Pteronarcella sp 6Taeniopterygidae Taenionema sp
TrichopteraTrichoptera ATrichoptera P 2 1 1 2 23 1
Unid J or Damaged 1 1 8 6 2 1 18 3Unid cf Philopotamidae 55 55Brachycentridae Brachycentrus spBrachycentridae Micrasema spGlossosmatidae Agapetus sp 1 1 43Glossosmatidae Glossosoma sp 2Hydropsychidae Unid J or DamagedHydropsychidae Arctopsyche spHydropsychidae Hydropsyche sp 8 1 36Hydropsychidae Parapsyche sp 4Hydroptilidae Unid J or DamagedHydroptilidae Agraylea spHydroptilidae Hydroptila spHydroptilidae Ochrotrichia spLepidostomatidaae Lepidostoma sp 3 4 4 1 3 9Limnephilidae Unid J or Damaged 2Limnephilidae Clostoeca sp 2 2Limnephilidae Dicosmoecus sp 2 1Limnephilidae Ecclisomyia sp 2Limnephilidae Onocosmoecus sp 1Limnephilidae Pseudostenophylax spLimnephilidae Psychoglypha sp 66 18 23 8 31 38 29 27 1Polycentropidae Polycentropus sp 6
Rhyacophidae Unid J or Damaged 1Rhyacophilidae Rhyacophila angelitaRhyacophilidae Rhyacophila bifilaRhyaciphilidae Rhyacophila brunnea or vaoRhyacophilidae Rhyacophila hyalinataRhyacophilidae Rhyacophila oretaRhyacophilidae Rhyacophila tuculaRhyacophilidae Rhyacophila vepulsaRhyacophilidae Rhyacophila verrula Sericostomatidae Gumaga sp 27 6 207 11 2 1 2 7 4 3 3Uenoidae Neophylax spUenoidae Neothremma sp
Coleoptera A 1 2Coleoptera L 1 1Coleoptera Unid (Terr) 6
CarabidaeChrysomelidae L 3 2Curculionidae A 1Dytiscidae A 4 1 3 12Dytiscidae Unid J or Damaged 1Dytiscidae Oreodytes sp 1 1Dytiscidae Liodessus and NeoclypeodytesDytiscidae Hydaticus spDytiscidae Hydrovatus spElmidae A 15 32 46Elmidae Unid J or Damaged 3 1 66 28Elmidae Cleptelmis sp L 3 13 26Elmidae Heterlimnius sp L 1 18Elmidae Lara spElmidae Narpus sp 5Elmidae Neoelmis sp LElmidae Optioservis sp L 2Gyrinidae A 1Haliplidae Haliplus spPsephenidae Eubrianax sp L 1 24 20Staphilinidae A
Appendix C.xls
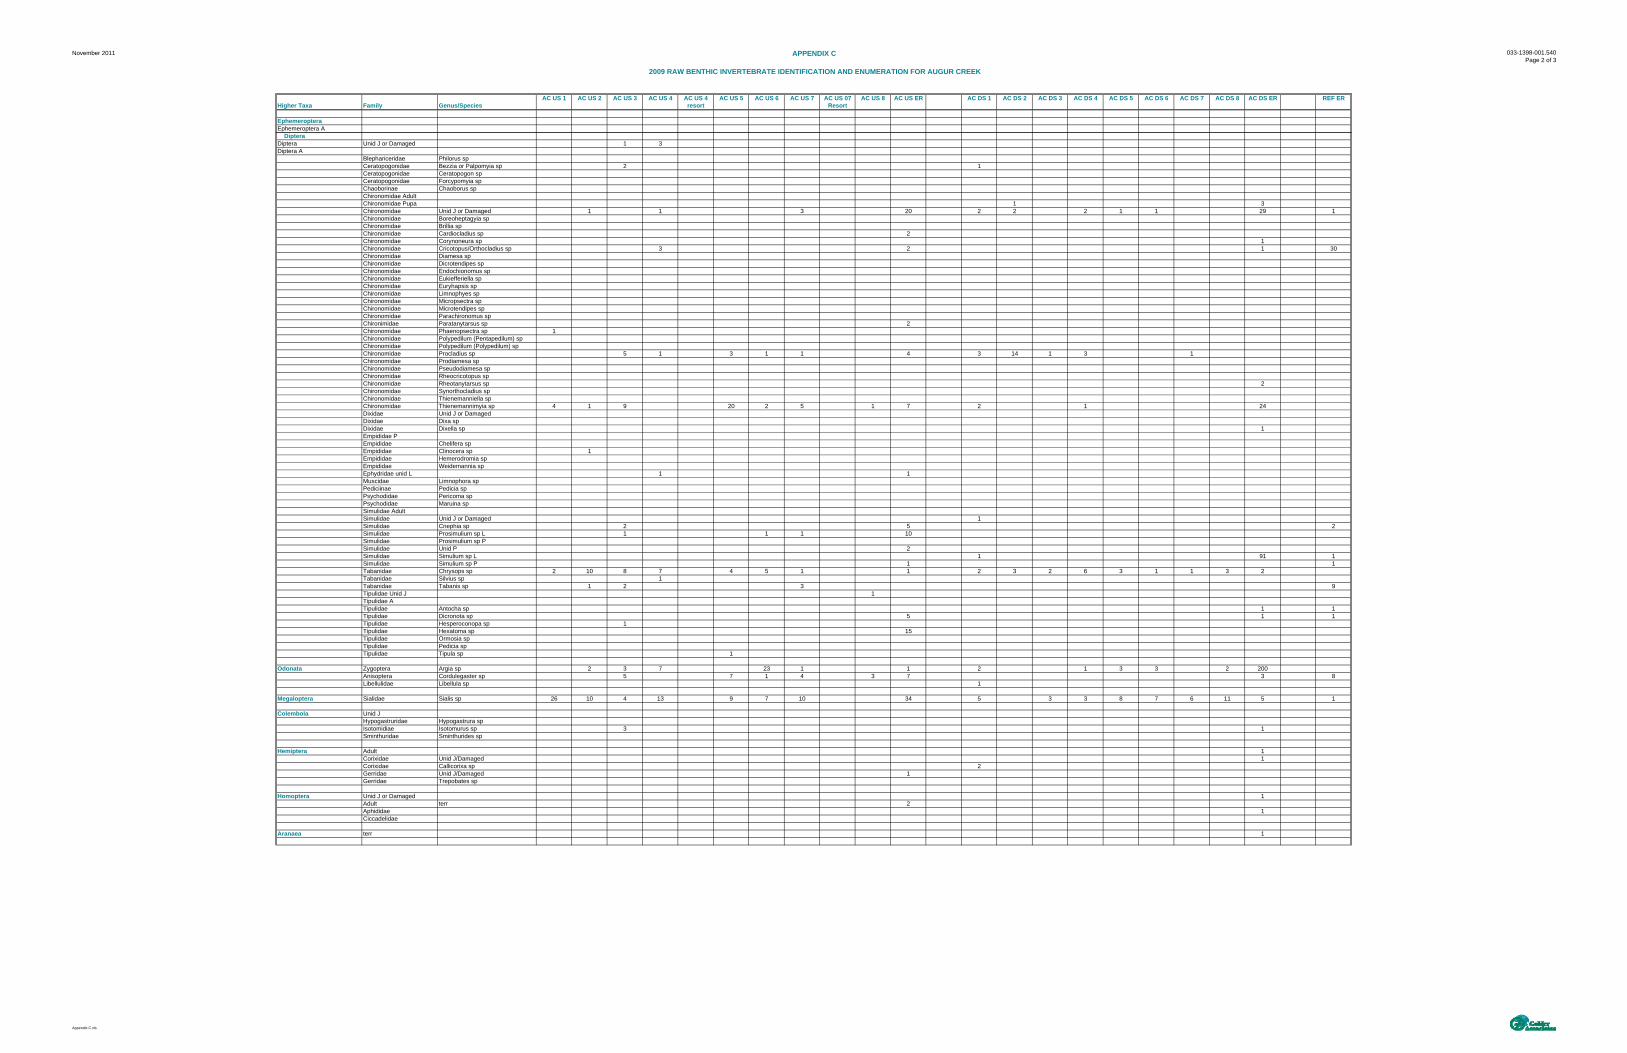
November 2011 APPENDIX C
2009 RAW BENTHIC INVERTEBRATE IDENTIFICATION AND ENUMERATION FOR AUGUR CREEK
033-1398-001.540Page 2 of 3
AC US 1 AC US 2 AC US 3 AC US 4 AC US 4 AC US 5 AC US 6 AC US 7 AC US 07 AC US 8 AC US ER AC DS 1 AC DS 2 AC DS 3 AC DS 4 AC DS 5 AC DS 6 AC DS 7 AC DS 8 AC DS ER REF ERHigher Taxa Family Genus/Species resort Resort
Ephemeroptera Ephemeroptera A DipteraDiptera Unid J or Damaged 1 3Diptera A
Blephariceridae Philorus spCeratopogonidae Bezzia or Palpomyia sp 2 1Ceratopogonidae Ceratopogon spCeratopogonidae Forcypomyia spChaoborinae Chaoborus spChironomidae AdultChironomidae Pupa 1 3Chironomidae Unid J or Damaged 1 1 3 20 2 2 2 1 1 29 1Chironomidae Boreoheptagyia spChironomidae Brillia spChironomidae Cardiocladius sp 2Chironomidae Corynoneura sp 1Chironomidae Cricotopus/Orthocladius sp 3 2 1 30Chironomidae Diamesa spChironomidae Dicrotendipes spChironomidae Endochionomus spChironomidae Eukiefferiella spChironomidae Euryhapsis spChironomidae Limnophyes spChironomidae Micropsectra spChironomidae Microtendipes spChironomidae Parachironomus spChironimidae Paratanytarsus sp 2Chironomidae Phaenopsectra sp 1Chironomidae Polypedilum (Pentapedilum) spChironomidae Polypedilum (Polypedilum) spChironomidae Procladius sp 5 1 3 1 1 4 3 14 1 3 1Chironomidae Prodiamesa spChironomidae Pseudodiamesa spChironomidae Rheocricotopus spChironomidae Rheotanytarsus sp 2Chironomidae Synorthocladius spChironomidae Thienemanniella spChironomidae Thienemannimyia sp 4 1 9 20 2 5 1 7 2 1 24Dixidae Unid J or DamagedDixidae Dixa spDixidae Dixella sp 1Empididae PEmpididae Chelifera spEmpididae Clinocera sp 1Empididae Hemerodromia spEmpididae Weidemannia spEphydridae unid L 1 1Muscidae Limnophora spPediciinae Pedicia spPsychodidae Pericoma spPsychodidae Maruina spSimulidae AdultSimulidae Unid J or Damaged 1Simulidae Cnephia sp 2 5 2Simulidae Prosimulium sp L 1 1 1 10Simulidae Prosimulium sp PSimulidae Unid P 2Simulidae Simulium sp L 1 91 1Simulidae Simulium sp P 1 1Tabanidae Chrysops sp 2 10 8 7 4 5 1 1 2 3 2 6 3 1 1 3 2Tabanidae Silvius sp 1Tabanidae Tabanis sp 1 2 3 9Tipulidae Unid J 1Tipulidae A Tipulidae Antocha sp 1 1Tipulidae Dicronota sp 5 1 1Tipulidae Hesperoconopa sp 1Tipulidae Hexatoma sp 15Tipulidae Ormosia spTipulidae Pedicia spTipulidae Tipula sp 1
Odonata Zygoptera Argia sp 2 3 7 23 1 1 2 1 3 3 2 200Anisoptera Cordulegaster sp 5 7 1 4 3 7 3 8Libellulidae Libellula sp 1
Megaloptera Sialidae Sialis sp 26 10 4 13 9 7 10 34 5 3 3 8 7 6 11 5 1
Colembola Unid JHypogastruridae Hypogastrura spIsotomidiae Isotomurus sp 3 1Sminthuridae Sminthurides sp
Hemiptera Adult 1Corixidae Unid J/Damaged 1Corixidae Callicorixa sp 2Gerridae Unid J/Damaged 1Gerridae Trepobates sp
Homoptera Unid J or Damaged 1Adult terr 2Aphididae 1Ciccadelidae
Aranaea terr 1
Appendix C.xls
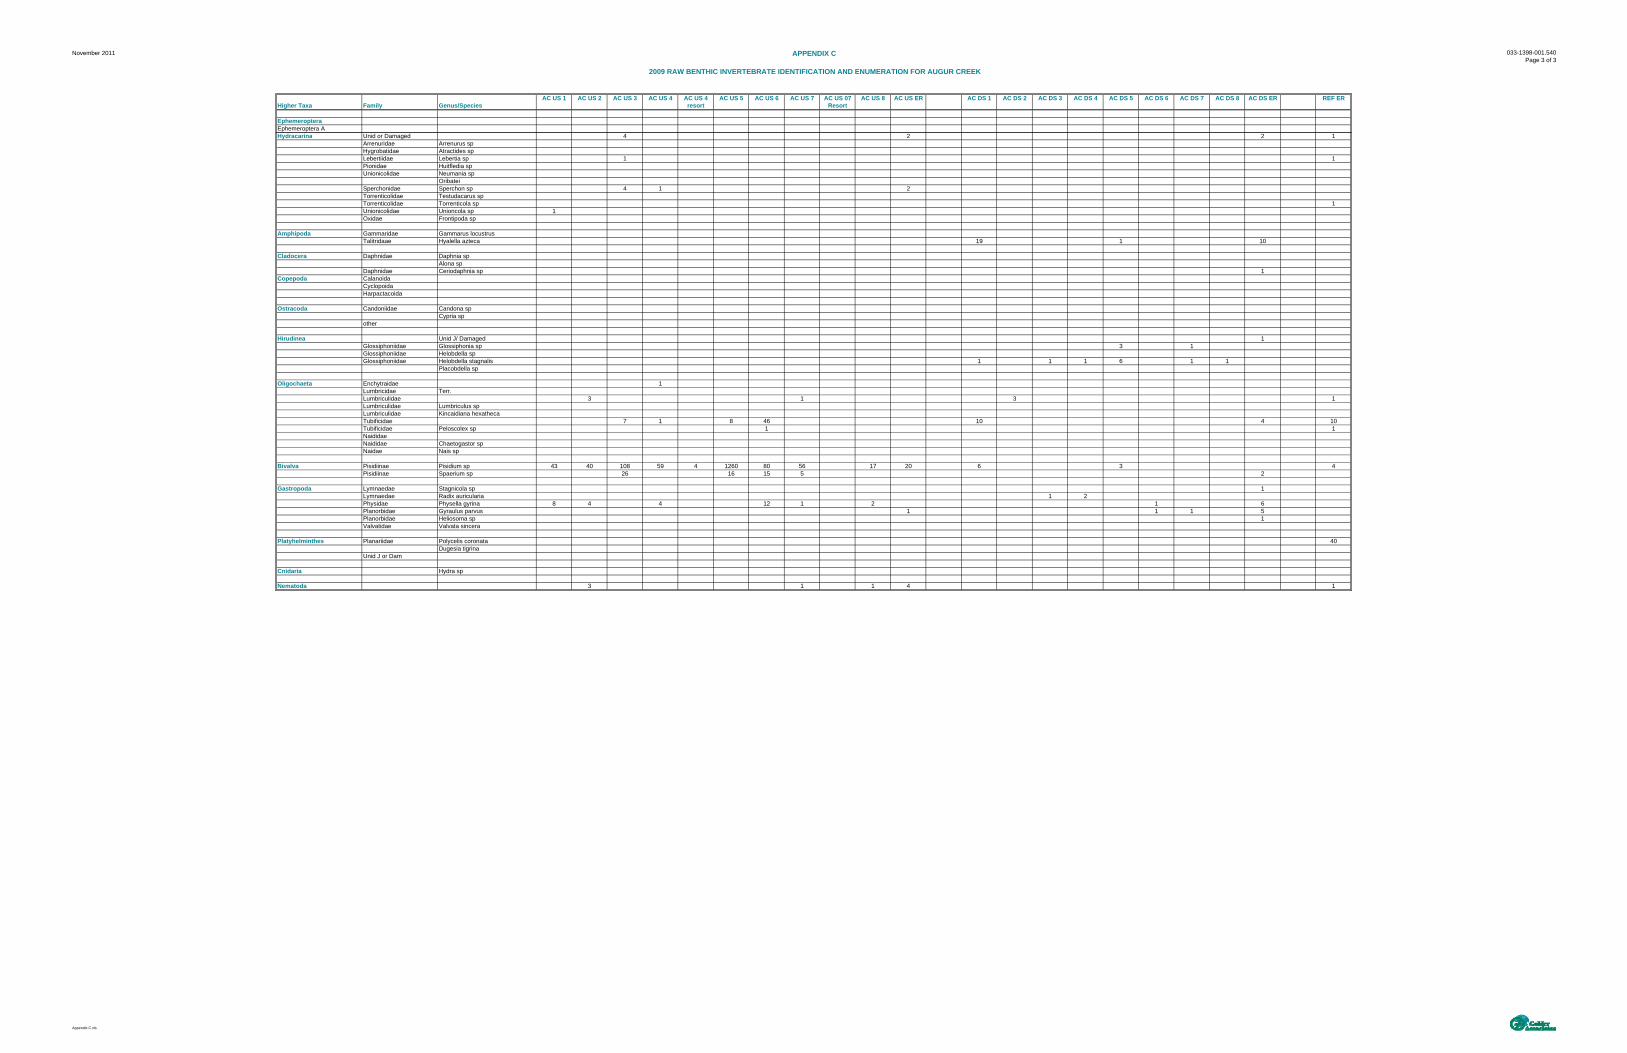
November 2011 APPENDIX C
2009 RAW BENTHIC INVERTEBRATE IDENTIFICATION AND ENUMERATION FOR AUGUR CREEK
033-1398-001.540Page 3 of 3
AC US 1 AC US 2 AC US 3 AC US 4 AC US 4 AC US 5 AC US 6 AC US 7 AC US 07 AC US 8 AC US ER AC DS 1 AC DS 2 AC DS 3 AC DS 4 AC DS 5 AC DS 6 AC DS 7 AC DS 8 AC DS ER REF ERHigher Taxa Family Genus/Species resort Resort
Ephemeroptera Ephemeroptera AHydracarina Unid or Damaged 4 2 2 1
Arrenuridae Arrenurus spHygrobatidae Atractides spLebertiidae Lebertia sp 1 1Pionidae Huitfledia spUnionicolidae Neumania sp
OribateiSperchonidae Sperchon sp 4 1 2Torrenticolidae Testudacarus spTorrenticolidae Torrenticola sp 1Unionicolidae Unioncola sp 1Oxidae Frontipoda sp
Amphipoda Gammaridae Gammarus locustrusTalitridaae Hyalella azteca 19 1 10
Cladocera Daphnidae Daphnia spAlona sp
Daphnidae Ceriodaphnia sp 1Copepoda Calanoida
CyclopoidaHarpactacoida
Ostracoda Candoniidae Candona spCypria sp
other
Hirudinea Unid J/ Damaged 1Glossiphoniidae Glossiphonia sp 3 1Glossiphoniidae Helobdella spGlossiphoniidae Helobdella stagnalis 1 1 1 6 1 1
Placobdella sp
Oligochaeta Enchytraidae 1Lumbricidae Terr.Lumbriculidae 3 1 3 1Lumbriculidae Lumbriculus sp
Lumbriculidae Kincaidiana hexatheca Tubificidae 7 1 8 46 10 4 10Tubificidae Peloscolex sp 1 1NaididaeNaididae Chaetogastor spNaidae Nais sp
Bivalva Pisidiinae Pisidium sp 43 40 108 59 4 1260 80 56 17 20 6 3 4Pisidiinae Spaerium sp 26 16 15 5 2
Gastropoda Lymnaedae Stagnicola sp 1Lymnaedae Radix auricularia 1 2Physidae Physella gyrina 8 4 4 12 1 2 1 6Planorbidae Gyraulus parvus 1 1 1 5Planorbidae Heliosoma sp 1Valvatidae Valvata sincera
Platyhelminthes Planariidae Polycelis coronata 40Dugesia tigrina
Unid J or Dam
Cnidaria Hydra sp
Nematoda 3 1 1 4 1
Appendix C.xls
APPENDIX D 2009 BENTHIC INVERTEBRATE IDENTIFICATION AND ENUMERATION QAQC
ENUMERATION FOR AUGUR CREEK
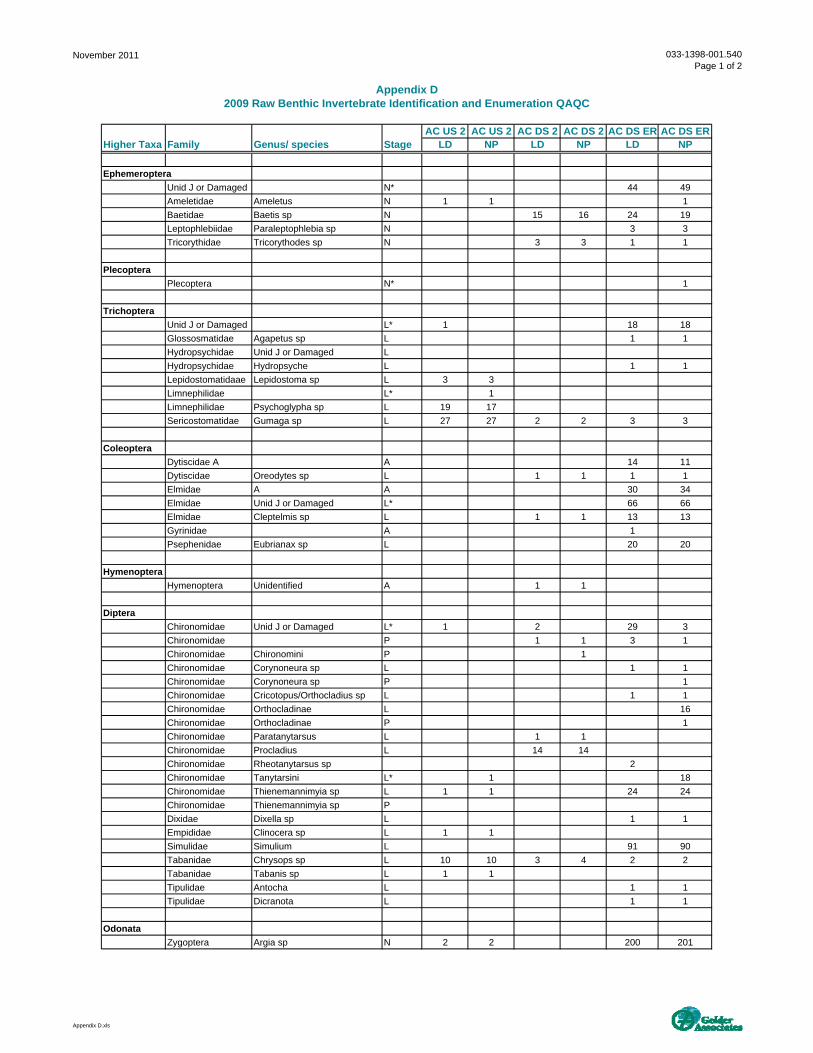
November 2011 033-1398-001.540Page 1 of 2
AC US 2 AC US 2 AC DS 2 AC DS 2 AC DS ER AC DS ERHigher Taxa Family Genus/ species Stage LD NP LD NP LD NP
Ephemeroptera
Unid J or Damaged N* 44 49Ameletidae Ameletus N 1 1 1Baetidae Baetis sp N 15 16 24 19Leptophlebiidae Paraleptophlebia sp N 3 3Tricorythidae Tricorythodes sp N 3 3 1 1
Plecoptera
Plecoptera N* 1
Trichoptera
Unid J or Damaged L* 1 18 18Glossosmatidae Agapetus sp L 1 1Hydropsychidae Unid J or Damaged LHydropsychidae Hydropsyche L 1 1Lepidostomatidaae Lepidostoma sp L 3 3Limnephilidae L* 1Limnephilidae Psychoglypha sp L 19 17Sericostomatidae Gumaga sp L 27 27 2 2 3 3
Coleoptera
Dytiscidae A A 14 11Dytiscidae Oreodytes sp L 1 1 1 1Elmidae A A 30 34Elmidae Unid J or Damaged L* 66 66Elmidae Cleptelmis sp L 1 1 13 13Gyrinidae A 1Psephenidae Eubrianax sp L 20 20
Hymenoptera
Hymenoptera Unidentified A 1 1
Diptera
Chironomidae Unid J or Damaged L* 1 2 29 3Chironomidae P 1 1 3 1Chironomidae Chironomini P 1Chironomidae Corynoneura sp L 1 1Chironomidae Corynoneura sp P 1Chironomidae Cricotopus/Orthocladius sp L 1 1Chironomidae Orthocladinae L 16Chironomidae Orthocladinae P 1Chironomidae Paratanytarsus L 1 1Chironomidae Procladius L 14 14Chironomidae Rheotanytarsus sp 2Chironomidae Tanytarsini L* 1 18Chironomidae Thienemannimyia sp L 1 1 24 24Chironomidae Thienemannimyia sp PDixidae Dixella sp L 1 1Empididae Clinocera sp L 1 1Simulidae Simulium L 91 90Tabanidae Chrysops sp L 10 10 3 4 2 2Tabanidae Tabanis sp L 1 1Tipulidae Antocha L 1 1Tipulidae Dicranota L 1 1
Odonata
Zygoptera Argia sp N 2 2 200 201
Appendix D2009 Raw Benthic Invertebrate Identification and Enumeration QAQC
Appendix D.xls
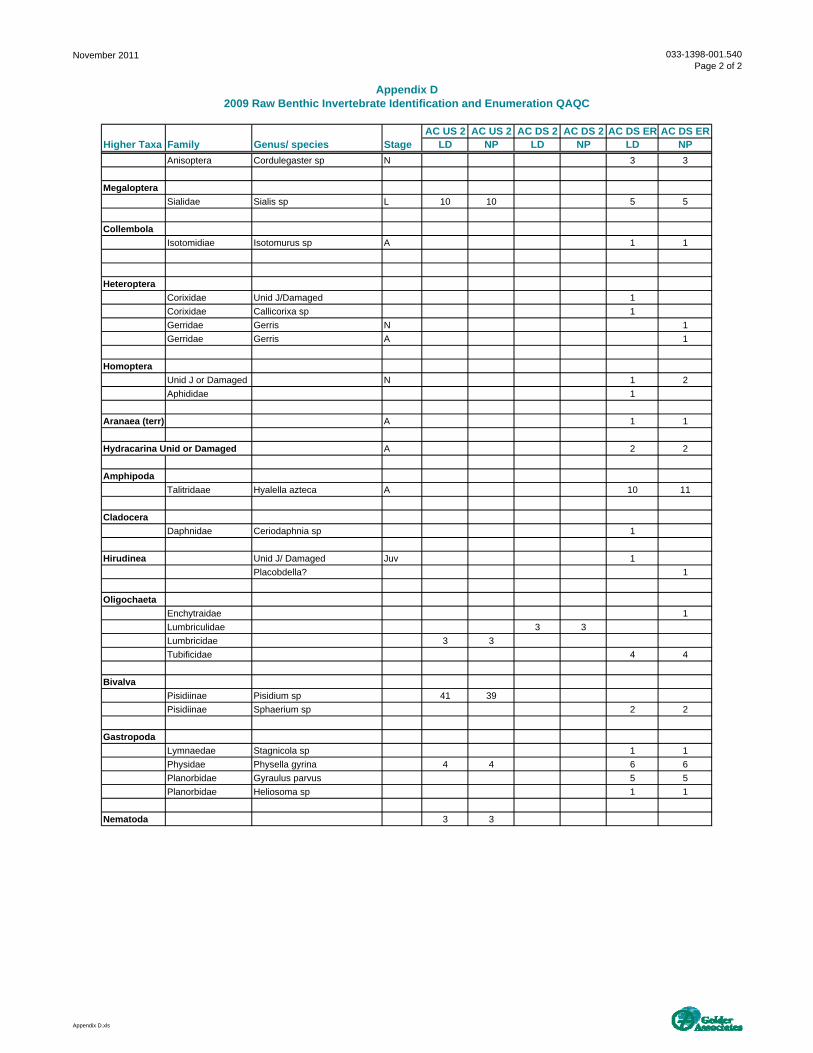
November 2011 033-1398-001.540Page 2 of 2
AC US 2 AC US 2 AC DS 2 AC DS 2 AC DS ER AC DS ERHigher Taxa Family Genus/ species Stage LD NP LD NP LD NP
Appendix D2009 Raw Benthic Invertebrate Identification and Enumeration QAQC
Anisoptera Cordulegaster sp N 3 3
Megaloptera
Sialidae Sialis sp L 10 10 5 5
Collembola
Isotomidiae Isotomurus sp A 1 1
Heteroptera
Corixidae Unid J/Damaged 1Corixidae Callicorixa sp 1Gerridae Gerris N 1Gerridae Gerris A 1
Homoptera
Unid J or Damaged N 1 2Aphididae 1
Aranaea (terr) A 1 1
Hydracarina Unid or Damaged A 2 2
Amphipoda
Talitridaae Hyalella azteca A 10 11
Cladocera
Daphnidae Ceriodaphnia sp 1
Hirudinea Unid J/ Damaged Juv 1Placobdella? 1
Oligochaeta
Enchytraidae 1Lumbriculidae 3 3Lumbricidae 3 3Tubificidae 4 4
Bivalva
Pisidiinae Pisidium sp 41 39Pisidiinae Sphaerium sp 2 2
Gastropoda
Lymnaedae Stagnicola sp 1 1Physidae Physella gyrina 4 4 6 6Planorbidae Gyraulus parvus 5 5Planorbidae Heliosoma sp 1 1
Nematoda 3 3
Appendix D.xls
APPENDIX E 2009 INDIVIDUAL STATION DATA FOR PHYSICAL, CHEMICAL, AND BIOLOGICAL
SUMMARY METRICS
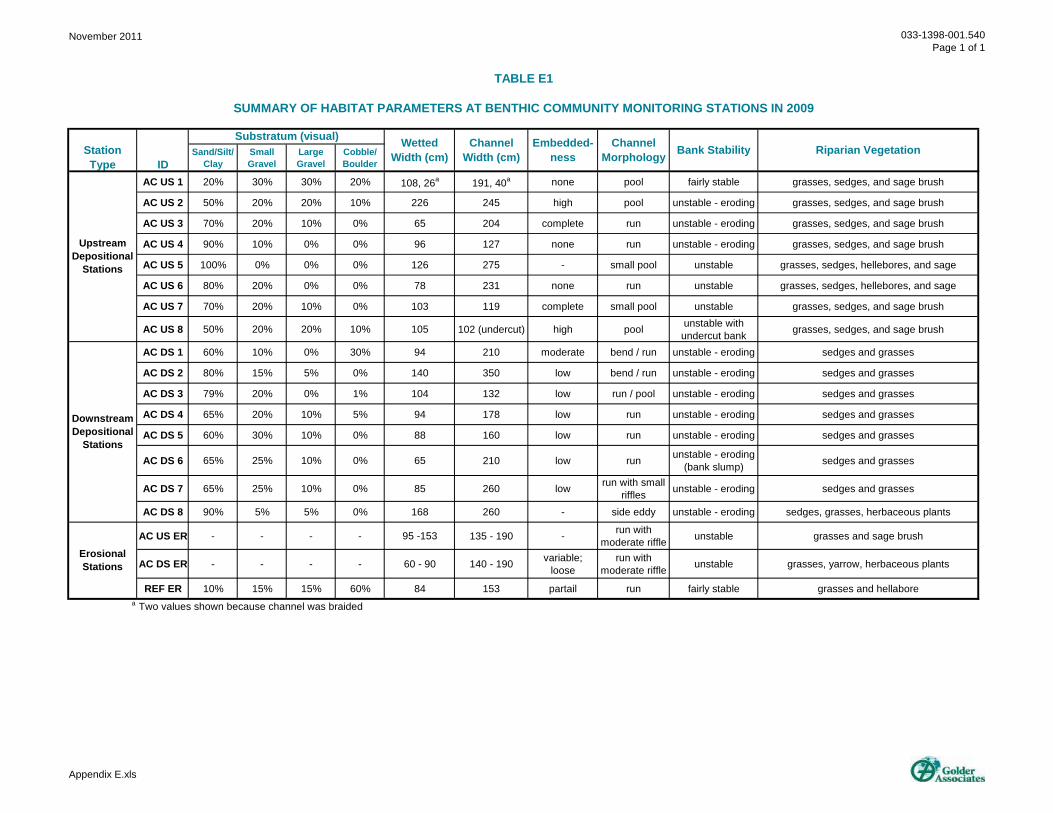
November 2011 033-1398-001.540Page 1 of 1
Appendix E.xls
Sand/Silt/ Clay
Small Gravel
Large Gravel
Cobble/ Boulder
AC US 1 20% 30% 30% 20% 108, 26a 191, 40a none pool fairly stable grasses, sedges, and sage brush
AC US 2 50% 20% 20% 10% 226 245 high pool unstable - eroding grasses, sedges, and sage brush
AC US 3 70% 20% 10% 0% 65 204 complete run unstable - eroding grasses, sedges, and sage brush
AC US 4 90% 10% 0% 0% 96 127 none run unstable - eroding grasses, sedges, and sage brush
AC US 5 100% 0% 0% 0% 126 275 - small pool unstable grasses, sedges, hellebores, and sage
AC US 6 80% 20% 0% 0% 78 231 none run unstable grasses, sedges, hellebores, and sage
AC US 7 70% 20% 10% 0% 103 119 complete small pool unstable grasses, sedges, and sage brush
AC US 8 50% 20% 20% 10% 105 102 (undercut) high pool unstable with undercut bank grasses, sedges, and sage brush
AC DS 1 60% 10% 0% 30% 94 210 moderate bend / run unstable - eroding sedges and grasses
AC DS 2 80% 15% 5% 0% 140 350 low bend / run unstable - eroding sedges and grasses
AC DS 3 79% 20% 0% 1% 104 132 low run / pool unstable - eroding sedges and grasses
AC DS 4 65% 20% 10% 5% 94 178 low run unstable - eroding sedges and grasses
AC DS 5 60% 30% 10% 0% 88 160 low run unstable - eroding sedges and grasses
AC DS 6 65% 25% 10% 0% 65 210 low run unstable - eroding (bank slump) sedges and grasses
AC DS 7 65% 25% 10% 0% 85 260 low run with small riffles unstable - eroding sedges and grasses
AC DS 8 90% 5% 5% 0% 168 260 - side eddy unstable - eroding sedges, grasses, herbaceous plants
AC US ER - - - - 95 -153 135 - 190 - run with moderate riffle unstable grasses and sage brush
AC DS ER - - - - 60 - 90 140 - 190 variable; loose
run with moderate riffle unstable grasses, yarrow, herbaceous plants
REF ER 10% 15% 15% 60% 84 153 partail run fairly stable grasses and hellabore a Two values shown because channel was braided
Upstream Depositional
Stations
Downstream Depositional
Stations
Erosional Stations
Substratum (visual)
IDStation Type
TABLE E1
SUMMARY OF HABITAT PARAMETERS AT BENTHIC COMMUNITY MONITORING STATIONS IN 2009
Wetted Width (cm)
Channel Width (cm)
Embedded-ness
Channel Morphology Riparian VegetationBank Stability
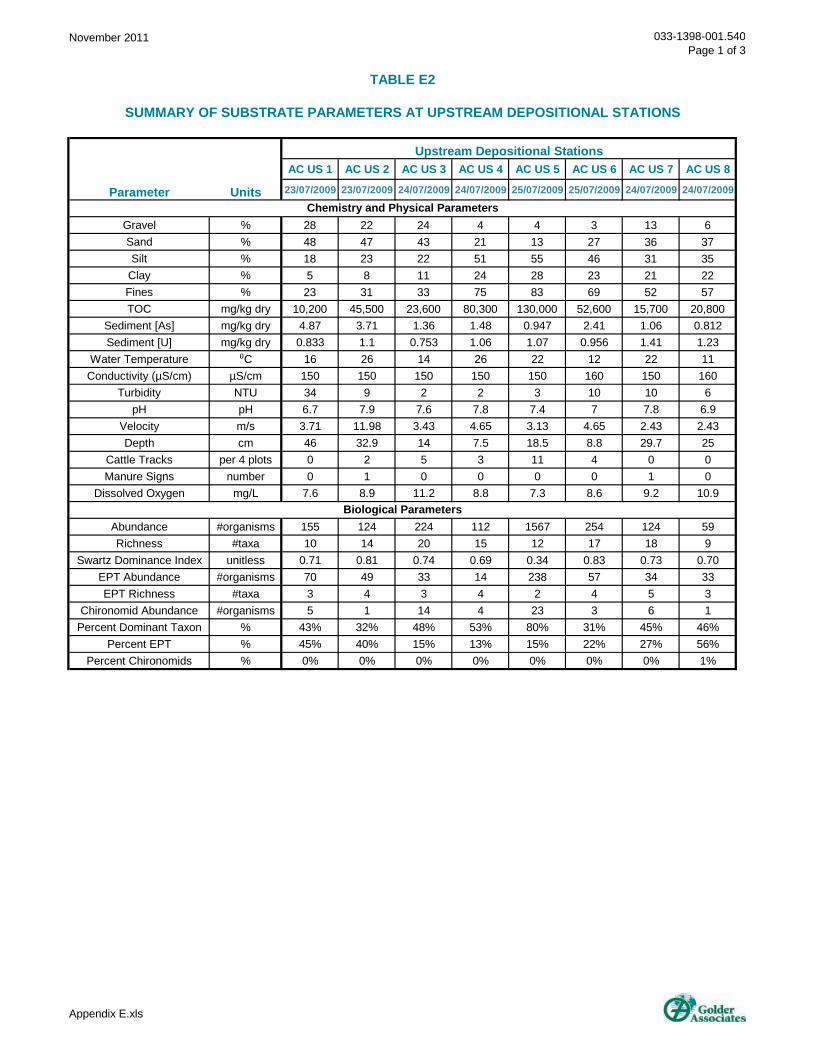
November 2011 033-1398-001.540Page 1 of 3
Appendix E.xls
AC US 1 AC US 2 AC US 3 AC US 4 AC US 5 AC US 6 AC US 7 AC US 8
23/07/2009 23/07/2009 24/07/2009 24/07/2009 25/07/2009 25/07/2009 24/07/2009 24/07/2009
Gravel % 28 22 24 4 4 3 13 6Sand % 48 47 43 21 13 27 36 37Silt % 18 23 22 51 55 46 31 35
Clay % 5 8 11 24 28 23 21 22Fines % 23 31 33 75 83 69 52 57TOC mg/kg dry 10,200 45,500 23,600 80,300 130,000 52,600 15,700 20,800
Sediment [As] mg/kg dry 4.87 3.71 1.36 1.48 0.947 2.41 1.06 0.812Sediment [U] mg/kg dry 0.833 1.1 0.753 1.06 1.07 0.956 1.41 1.23
Water Temperature ⁰C 16 26 14 26 22 12 22 11Conductivity (µS/cm) µS/cm 150 150 150 150 150 160 150 160
Turbidity NTU 34 9 2 2 3 10 10 6pH pH 6.7 7.9 7.6 7.8 7.4 7 7.8 6.9
Velocity m/s 3.71 11.98 3.43 4.65 3.13 4.65 2.43 2.43Depth cm 46 32.9 14 7.5 18.5 8.8 29.7 25
Cattle Tracks per 4 plots 0 2 5 3 11 4 0 0Manure Signs number 0 1 0 0 0 0 1 0
Dissolved Oxygen mg/L 7.6 8.9 11.2 8.8 7.3 8.6 9.2 10.9
Abundance #organisms 155 124 224 112 1567 254 124 59Richness #taxa 10 14 20 15 12 17 18 9
Swartz Dominance Index unitless 0.71 0.81 0.74 0.69 0.34 0.83 0.73 0.70EPT Abundance #organisms 70 49 33 14 238 57 34 33EPT Richness #taxa 3 4 3 4 2 4 5 3
Chironomid Abundance #organisms 5 1 14 4 23 3 6 1Percent Dominant Taxon % 43% 32% 48% 53% 80% 31% 45% 46%
Percent EPT % 45% 40% 15% 13% 15% 22% 27% 56%Percent Chironomids % 0% 0% 0% 0% 0% 0% 0% 1%
Chemistry and Physical Parameters
Biological Parameters
Upstream Depositional Stations
Parameter Units
TABLE E2
SUMMARY OF SUBSTRATE PARAMETERS AT UPSTREAM DEPOSITIONAL STATIONS
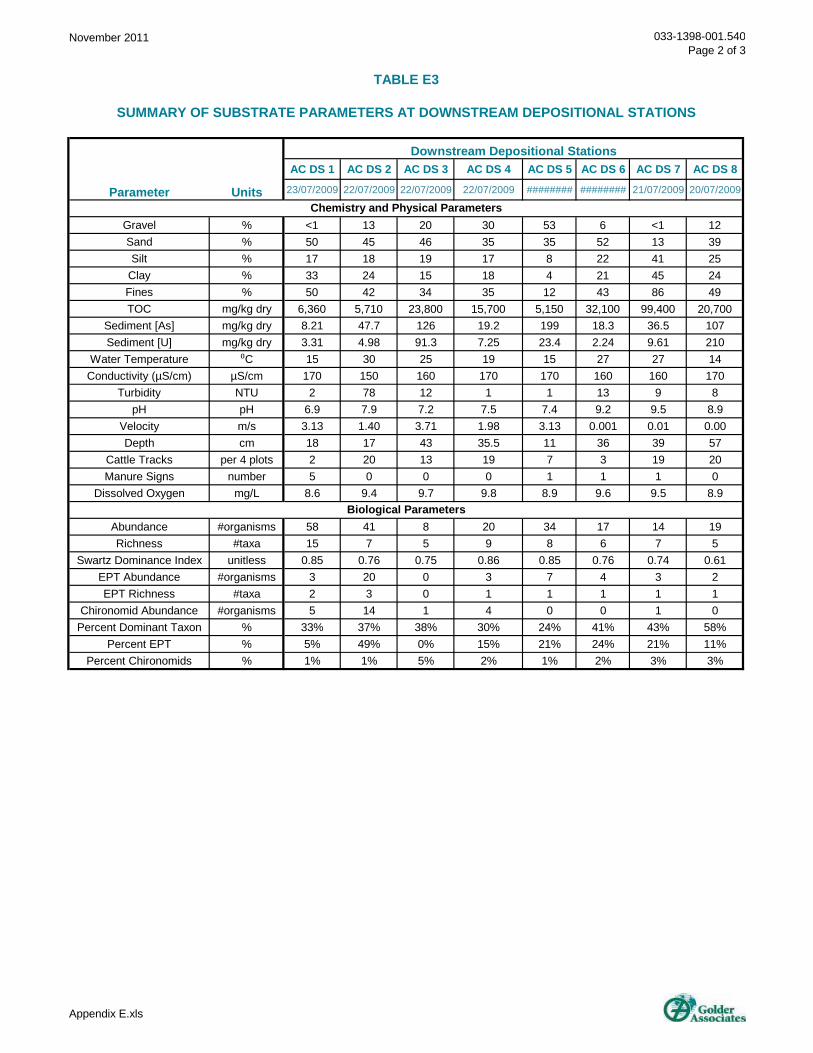
November 2011 033-1398-001.540Page 2 of 3
Appendix E.xls
AC DS 1 AC DS 2 AC DS 3 AC DS 4 AC DS 5 AC DS 6 AC DS 7 AC DS 8
23/07/2009 22/07/2009 22/07/2009 22/07/2009 ######## ######## 21/07/2009 20/07/2009
Gravel % <1 13 20 30 53 6 <1 12Sand % 50 45 46 35 35 52 13 39Silt % 17 18 19 17 8 22 41 25
Clay % 33 24 15 18 4 21 45 24Fines % 50 42 34 35 12 43 86 49TOC mg/kg dry 6,360 5,710 23,800 15,700 5,150 32,100 99,400 20,700
Sediment [As] mg/kg dry 8.21 47.7 126 19.2 199 18.3 36.5 107Sediment [U] mg/kg dry 3.31 4.98 91.3 7.25 23.4 2.24 9.61 210
Water Temperature ⁰C 15 30 25 19 15 27 27 14Conductivity (µS/cm) µS/cm 170 150 160 170 170 160 160 170
Turbidity NTU 2 78 12 1 1 13 9 8pH pH 6.9 7.9 7.2 7.5 7.4 9.2 9.5 8.9
Velocity m/s 3.13 1.40 3.71 1.98 3.13 0.001 0.01 0.00Depth cm 18 17 43 35.5 11 36 39 57
Cattle Tracks per 4 plots 2 20 13 19 7 3 19 20Manure Signs number 5 0 0 0 1 1 1 0
Dissolved Oxygen mg/L 8.6 9.4 9.7 9.8 8.9 9.6 9.5 8.9
Abundance #organisms 58 41 8 20 34 17 14 19Richness #taxa 15 7 5 9 8 6 7 5
Swartz Dominance Index unitless 0.85 0.76 0.75 0.86 0.85 0.76 0.74 0.61EPT Abundance #organisms 3 20 0 3 7 4 3 2EPT Richness #taxa 2 3 0 1 1 1 1 1
Chironomid Abundance #organisms 5 14 1 4 0 0 1 0Percent Dominant Taxon % 33% 37% 38% 30% 24% 41% 43% 58%
Percent EPT % 5% 49% 0% 15% 21% 24% 21% 11%Percent Chironomids % 1% 1% 5% 2% 1% 2% 3% 3%
Biological Parameters
Chemistry and Physical ParametersParameter
Downstream Depositional Stations
Units
TABLE E3
SUMMARY OF SUBSTRATE PARAMETERS AT DOWNSTREAM DEPOSITIONAL STATIONS
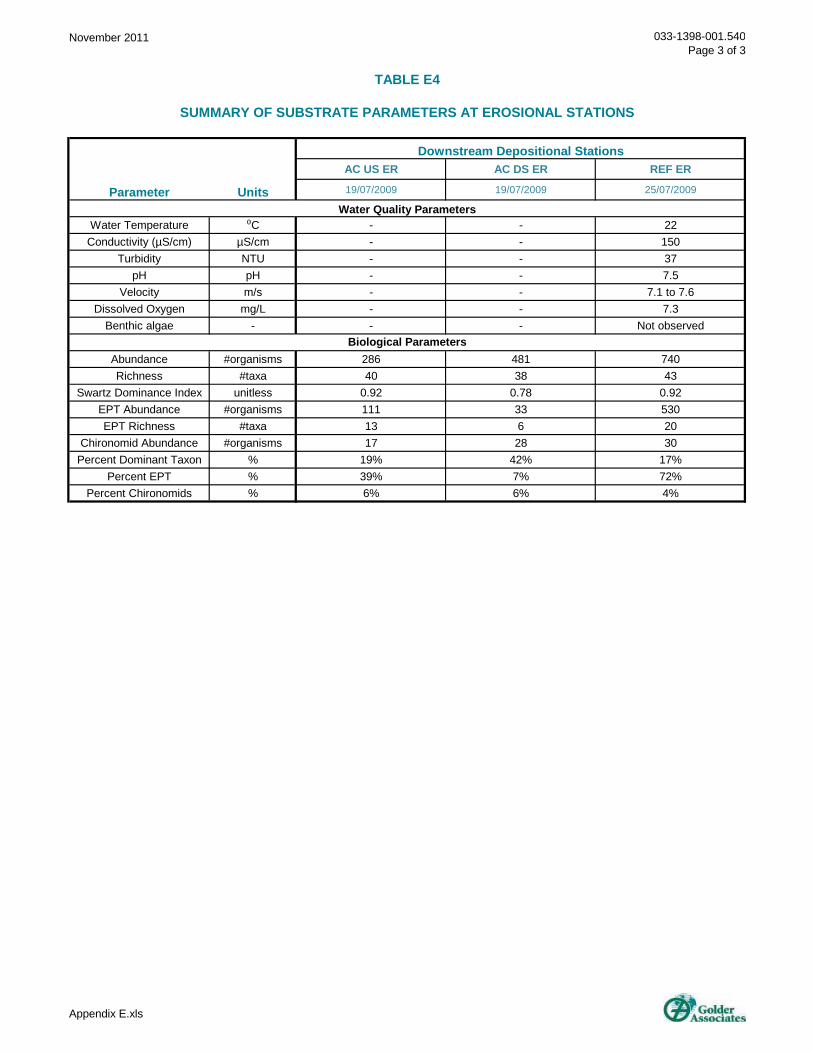
November 2011 033-1398-001.540Page 3 of 3
Appendix E.xls
AC US ER AC DS ER REF ER
19/07/2009 19/07/2009 25/07/2009
Water Temperature ⁰C - - 22Conductivity (µS/cm) µS/cm - - 150
Turbidity NTU - - 37pH pH - - 7.5
Velocity m/s - - 7.1 to 7.6Dissolved Oxygen mg/L - - 7.3
Benthic algae - - - Not observed
Abundance #organisms 286 481 740Richness #taxa 40 38 43
Swartz Dominance Index unitless 0.92 0.78 0.92EPT Abundance #organisms 111 33 530EPT Richness #taxa 13 6 20
Chironomid Abundance #organisms 17 28 30Percent Dominant Taxon % 19% 42% 17%
Percent EPT % 39% 7% 72%Percent Chironomids % 6% 6% 4%
Units
Biological Parameters
Water Quality Parameters
TABLE E4
SUMMARY OF SUBSTRATE PARAMETERS AT EROSIONAL STATIONS
Downstream Depositional Stations
Parameter

Golder, Golder Associates and the GA globe design are trademarks of Golder Associates Corporation
Golder Associates Inc. 18300 NE Union Hill Road, Suite 200
Redmond, WA 98052 USA Tel: (425) 883-0777 Fax: (425) 882-5498


