file copy appraisal of the second coffee improvement...
TRANSCRIPT

Report No. 908-BU FILE COPYAppraisal of theSecond Coffee Improvement ProjectBurundiOctober 30, 1975
Eastern Africa Projects DepartmentGeneral Agriculture Projects Division
Not for Public Use
Document of the World Bank
This document has a restricted distribution and may be used by recipientsonly in the performance of their official duties. Its contents may nototherwise be disclosed without World Bank authorization.
Pub
lic D
iscl
osur
e A
utho
rized
Pub
lic D
iscl
osur
e A
utho
rized
Pub
lic D
iscl
osur
e A
utho
rized
Pub
lic D
iscl
osur
e A
utho
rized

CURRENCY EQUIVALENTS
Curreney Unit = Franc Burundi (FBu)US$1 = FBu 78.35FBu 100 = US$1.28FBu 1 million = US$12,763
WEIGHTS AND MEASURES
1 kg = 1,000 gram= 2.205 lb
1 metrie ton = 1,000 kg= 2,205 lb
lare 0.01 ha1 ha 2.1471 acres1 km = 0.621 milei km2 = 0.386 square mile
ABBREVIATIONS
ISABU = Institut des Sciences Agronomiques du Burundi(Agricultural Research Institute)
ITAB = Institut Technique Agricole du Burumdi(Agricultwral Training Institute)
OCIBU =,Office des Cultures Industrielles du Burundi(Agency for Industrial Crops)
Burumdi Government and OCIBU Fiscal YearJanuary _ ta DecemUe 31

BURUNDI
SECOND COFFEE IMPROVEMENT PROJECT
TABLE OF CONTENTS
Page No.
SUMMARY AND CONCLUSIONS ...............................-
I. INTRODUCTION .......................................... 1
II. BACKGROUND ........................................... 2A. General ................................. 2B. The Agricultural Sector ..................... 3C. The Coffee Industry ..... ......... ............ 3D. Agricultural Services ..... .................. 6E. First Coffee Improvement Project ............ 7
III. THE PROJECT AREA ...................................... 8
IV. THE PROJECT ........ ......................... 9A. General Description ................. 9B. Detailed Features ...... ..................... 10C. Project Costs ............................... 15D. Financing ................................... 16E. Procurement ................ ................. 17F. Disbursement ......................... 18G. Accounts and Audits ...... ................... 18
V. ORGANIZATION AND MANAGEMENT ...... .................... . 18
VI. PRODUCTION, MARKETING, FARbIERS' BENEFITSAND EFFECTS ON GOVERNMENT BUDGET ................ ... 20
A. Yields and Production ........... ............ 20B. Markets and Prices ............ .............. 21C. Farmers' Benefits ............. .............. 22D. Effects on Government Budget . . 23
VII. ECONOMIC BENEFITS AND JUSTIFICATION ..... .............. 23
VIII. AGREEMENTS REACHED AND RECOMMENDATION .... ............ 24
This report is based on the findings of an appraisal mission consisting ofMessrs. H. van Voorthuizen, R. Le Breton, and G.R. Henderson (IDA) and H.Vieilhescare (consultant), which visited Burundi in October 1974, and onthe findings of a second mission to Burundi which Mr. van Voorthuizen under-took in April-May, 1975.
Annexes (Continuation)
10. Farm Budgets
Table 1 - Net Production Values per ha for Coffee in Three Different AreasTable 2 - Net Production Values per ha for Food CropsTable 3 - Budgets for 0.85 ha Farms in Three Different Areas without and
with Development of Coffee and Food Crops
11. Team of Advisers
12. Economic Cost - Benefit Analysis
Table 1 - Economic Cost - Benefit Analysis - Rates of Return andSensitivity Analysis
Table 2 - Cost-Benefit Analysis - Whole ProjectTable 3 - Cost-Benefit Analysis - Agricultural Services ComponentTable 4 - Cost-Benefit Analysis - Coffee Processing ComponentTable 5 - Incremental Coffee ProductionTable 6 - Production of Fully-Washed CoffeeTable 7 - Projected Coffee Values
13. Project Implementaion Schedule
ORGANIZATION CHART
MAP 1 - Burundi Coffee GrowingMAP 2 - Project Area

ANNEXES
1. Coffee Growing and Research
2. Coffee Processing
3. Coffee Marketing and Prices
Table 1 - Coffee Price ForecastsTable 2 - Export Values of Burundi and Kenya CoffeeTable 3 - Coffee Exports per Calendar YearTable 4 - Coffee Price Sliding Scale - Campaign 1974/75Table 5 - Distribution of Sales Proceeds of Arabica Coffee, 1969-1973
4. Food Production
5. Office des Cultures Industrielles du Burundi (OCIBU)
Table 1 - Stabilization Fund - Comparative Balance Sheet, 1971-1973Table 2 - Stabilization Fund - Profit and Loss Accounts, 1971-1973Table 3 - Coffee Promot:ion Fund - Comparative Balance Sheet, 1971-1973Table 4 - Coffee Promotion Fund - Profit and Loss Accounts, 1971-1973Table 5 - OCIBU - Summarized Balance Sheet, 1971-1973Table 6 - OCIBU - Operating Accounts, 1971-1973Table 7 - Adjustment of' OCIBU's Annual Results
6. Project Cost Estimates
Table 1 - Summary of Project CostsTable 2 - Agricultural ServicesTable 3 - Coffee ProcessingTable 4 - Coffee ResearchTable 5 - Construction Equipment, Bridges, Water SupplyTable 6 - Project ManagementTable 7 - Technical Advice and MonitoringTable 8 - Administrative and Technical ServicesAppendix - Unit Costs for Coffee Washing Stations
7. Requirements and Financing of Fertilizers and Other Inputs
Table 1 - Requirements and Financing of FertilizersTable 2 - Farmers Payments for Inputs and Balances of OCIBU
Fertilizer Fund
8. Government Cash Flow
9. Estimated Schedule of Disbursements


BURUNDI
SECOND COFFEE IMPROVEMENT PROJECT
SUMMARY AND CONCLUSIONS
i. Burundi is a poor and very densely populated country and at least90% of its population of 3.4 million people is dependent on smallholderagriculture which accounts for about 60% of GDP. Per capita GDP of therural population is slightly less than the national average of US$94 mostlycomprising of food production for subsistence. Coffee is the main cash cropand is grown by about 400,000, or more than half, of all farm families.Annual exports of green coffee at about 20,000 ton contribute more than80% to the country's foreign exchange earnings. The Government's agricul-tural policy emphasizes quantity and quality improvement to existing exportcrops, diversification into other export crops, increased food productionto meet nutritional needs and generally the conservation and improvementof Burundi's agricultural resources through water and soil conservationprograms. A first Coffee Improvement Project, started in 1969 with IDAsupport, has assisted about 44,000 coffee growers in the northern provinceof Ngozi to increase the production and quality of smallholder coffee.A Second Coffee Improvement Project, now proposed, would expand the areaof the first project to include all Ngozi's 110,000 coffee growers, whoproduce about one third of the country's coffee, and would also provideimproved farm services to the remaining 35,000 farmers of the province whodo not grow coffee. In addition to increasing the volume of coffee produc-tion, the Project would endeavour to improve the quality of coffee and in-crease the production of foocd crops.
ii. This report appraises a Project which would over 5 years providestrengthened extension servic:es to improve coffee husbandry techniques espe-cially in the fields of insect control, pruning, mulching and the applicationof chemical fertilizers. It would provide technical assistance for theoperation of the four existing coffee washing stations and construct fouradditional stations as an extended trial to identify economic methods toimprove the quality of Burundi's coffee. Provision for the multiplicationand distribution of improved seeds and distribution of fertilizers wouldincrease the production of food crops, especially that of maize. Erosioncontrol measures, mainly through planting of setaria grass, would be encouragedby the extension services. A small experimental rural development programwould be included in the Project. The Project would further support the Insti-tut des Sciences Agronomiques du Burundi (ISABU), the agricultural researchinstitute, for applied coffee research and would also assist in the rehabili-tation and maintenance of natural drinking water sources and bridges andculverts in Ngozi province. The resident Project management team would bebacked up by an international advisory team which would visit Burundi atregular intervals.
iii. The Office des Cultures Industrielles du Burundi (OCIBU), which is aparastatal agency for export crops, would be responsible for the major part of

- ji
the Project. OCIBU would exercise its responsibility through the ProjectDepartment which was established to implement the first project. ISABU wouldbe responsible for the coffee research component.
iv. Total project costs are estimated at about US$7.5 million. TheKuwait Fund for Arab Economic Development is expected to finance 85Z of thecosts of the construction of thie additional coffee washing stations, and thecoffee research, ater supply and road components of the Project (US$1.2 mil-lion). IDA would fînancé . o:: the total cost of the other components(US$5.2 million) or all foreign exchange costs (about US$3.2 million) andabout 68% of the local costs of these components. The Government wouldfinance the balance of the costs, (about US$1.1 million).
v. Fertilizers and pesticides would be procured by international com-petitive bidding in accordance %,rith Bank/IDA guidelines. Vehicles, farmtools and miscellaneous equipmernt and materials would be procured locally inaccordance with normal GovernmerLt procedures which are satisfactory. Due tothe limited building capacity irL the country, the remoteness of the Projectarea and the scattered locations of the sites, construction of staff housing,offices and stores would be undertaken by force account.
vi. The production of green çcofee is expected to increase by 800 ton atfull development to be reached after 7 years. The four existing and the foïurnew washing stations would improveIiê quality of a further 800 ton greencoffee. Maize production would increase by 750 ton oyex,5 years and the pro-duction of other food crops and that of smalilivestock would also be expectedto increase but cannot be quantiEied. This also applies to the benefits fromthe coffee research program and lmproved water supply facilities which wouldraise the health standards in the Project area.
vii. The economic rate of return of the agricultural services componentis 24% and that of the coffee processing component, which is of an experimen-taL nature, is tentatively estimated at 9%. The economic rate of return forthe whole Project including coffee processing, but excluding coffee research,experimental rural development ac:tivities and drinking water improvements, is21%. The major risk facing the IProject is that coffee prices would be lowerthan forecast; a 20% reduction of the benefits would reduce the rate of returnto 11%. A typical farmer in the high potential coffee areas cultivating0.85 ha, combining coffee improvements with the use of selected seed and fertil-izers for his maize crop, would increase the net value of his production byabout US$35 (FBu 2,750) from US$332 (FBu 26,000) to about US$367 (FBu 28,750).
viii. The first Coffee Improvement Project is the only Bank Group supportedagricultural project in Burundi. The Project's progress has been unsatisfactorydue to the internal disturbances of 1972, shortages of both expatriate andnational staff and transporc difficulties in neighboring countries resultingin frequent delays in delivery of essential construction and other materials.As a result, experience with improved coffee processing techniques has been-mi..ed since only one out of four coffee washing stations has operated forcwo full seasons, the others becoining operative only in 1975. Moreover, it is

- iii -
difficult to assess the Project's impact on coffee production since no yielddata have been collected in a systematic manner. The new Project would aimto overcome these problems through an extension of the coffee processingtrial period, better staff arrangements, and provision for monitoring andevaluation of the Project's progress.
ix. Subject to the required assurances, the Project would be suitablefor an IDA Credit of US$5.2 million.


BURUNDI
SECOND COFFEE IMPROVEMENT PROJECT
I. INTRODUCTION
1.01 Burundi is one of the most densely populated and poorest countriesin the world and most of its population of 3.4 million people depends onsmallholder agriculture. The production of exportable cash crops is vir-tually limited to Arabica coffee which is grown in small quantities byabout 400,000, or 55% of all farm families. Coffee accounts for more than80% of the value of all Burundi's exports while other crops, mainly cottonand tea, contribute less than 10%. Implementation of the First Five YearDevelopment Plan (1968-72) was slow and only 40% of the planned targetshad been achieved at the end of the Plan period. Preparation of a SecondPlan (1973-77) suffered from a lack of coordination and a final versionwas only accepted by the Government in March 1975. Basic economic policiesare not well defined and the only clear statement of objectives has beendrafted by the Ministry of Agriculture and Livestock. These are:
(a) to conserve and improve the conditions for agricul-tural production through water and soil conserva-tion programs;
(b) to provide nutritional needs and assure a more bal-anced diet;
(c) to diversify cash crop production for export andimprove the quality of existing export crops;
(d) to substitute domestic output for food crops thatare presently imported; and
(e) to obtain a balanced regional development throughexploitation of regional potentials.
1.02 A first coffee improvement project supported by an IDA credit ofUS$1.8 million (Credit 147-BU) aimed to improve the quantity and qualityof coffee in an area covering about one third of the northern province ofNgozi. The Government subsequently requested IDA to finance a SecondCoffee Improvement Project which would cover the entire province. This isBurundi's best coffee growing area and has a higher population density thanany of the other six provinces. The Project, as proposed by Government,included further distribution of inputs for coffee growing and strengtheningof extension services, construction and operation of 38 coffee washing stationsin addition to the four established under the first project, expansion ofcoffee research facilities, and the development of food production. Duringappraisal it was found that tlhe available evidence did not justify alarge scale investment în coffee washing stations and that an extension
- 2 -
of the trial period would be more appropriate. In the course of the firsttwo years the Project would finance the construction of four additionalwashing stations and would alsa provide technical assistance in the fieldof coffee processing to determine the performance of the four existingstations under full production conditions. Because a number of the pro-posed components will involve a considerable degree of experimentationthe Project would also provide for a team of international experts whichwould visit Burundi at regular intervals to advise the Government on theimplementation and evaluation of the Project.
1.03 Performance under the first coffee improvement project, the onlyagricultural project with IDA support, has not been satisfactory, mainlybecause of staffing and procurement problems which are further discussedin Chapter II.
1.04 The proposed Project was prepared by Government with the assistanceof the IBRD Regional Mission in Eastern Africa. This report is based on thefindings of an appraisal mission composed of Messrs. H. van Voorthuizen,R. Le Breton, and G.R. Henderson (IDA) and H. Vieilhescaze (consultant),which visited Burundi in October 1974, and on the findings of a secondmission which Mr. van Voorthuizen undertook in April-May 1975.
II. BACKGROUND
A. General
2.01 Burundi is a small landlocked country in Eastern Africa some1400 km from the Indian Ocean, and borders Rwanda to the north, Zaire tothe west,2 and Tanzania to the east and the routh. The total area is24,970 km , which excludes anot`her 2,850 km of part of Lake Tanganyikawithin Burundi's territory. 2 The population was estimated at 3.4 millionpeople in 1972 or 136 per km which makes the country one of the mostdensely populated in Africa. Despite a natural growth rate of 2.1% itis unlikely that the actual population has grown any faster than 1%because of high emigration during the past years. Except for the capitalBujumbura with a population of about 100,000 inhabitants, and a few admin-istrative and commercial centers, there are no organized settlements or vil-lages in the country. The vast majority of the people live on their farmsand smallholder agriculture accDunts for about 60% of GDP. The GDP wasabout US$94 per capita in 1974 and that of the rural population slightlyless. Sales of food products are estimated to be less than 10% of produc-tion and the total value of marketed agricultural production, includingcoffee, was probably only US$12-15 per capita.

- 3 -
B. The Agricultural Sector
2.02 Burundi has a range of altitude and rainfall that allows for con-siderable diversity in crop patterns. Coffee is the dominant cash crop,accounting for about 7% of GDP. Other cash crops include cotton, tea,rice, palm oil and sugarcane but the contribution to GDP of all of thesecrops combîned is less than 1%. With three-fifths of Burundi's land areaused for extensive grazing or not used at all, being marginal or unsuitablefor settled agriculture, population pressure is very high in the remainingcultivated areas. As a result average land holdings are small (less than1 ha) and fragmented and overcropping leads to soil depletion and erosion.Living standards are stagnant if not actually decreasing and malnutrition iswidespread. With declining soil fertility and crop yields and a diminishingper capita resource base the outlook for the future is unpromising.
2.03 Of the crops grown in Burundi, food crops contribute about halfof GDP and occupy 90% of the cultivated land. Rising population pressurenecessitates increased food crop production, but poor extension services,unavailability of improved seeds and fertilizer, lack of credit, highcosts of transport and inadequate marketing facilities, are constraintson development. Coffee is by far the most important export crop andaccounts for more than 80% of Burundi's exports. The production of cotton,accounting for 5% of exports, has been declining for some years probablybecause of unfavorable pricing policies. Tea, which has been introducedas part of the coffee diversification policy, accounts for about 2% ofexports. Livestock plays .n important part but productivity is low andas more pasture land is talcen under cultivation, production will declinefurther. There are, however, prospects for the disinfestation of the tse-tse fly in the Mosso region which would open up an area for more intensivegrazing. Exports of cattle are very low but exports of hides have beenincreasing and account for about 4% of exports.
C. The Coffee Industry
Production
2.04 Some 95% of Burundi's coffee is of the Arabica variety with goodliquoring qualities and grown exclusively by smallholders; the remainderis Robusta produced on a few estates on the Ruzizi plain. The main small-holder coffee growing areas are Ngozi, Gitega, and Muyinga provinces (mapIBRD No. 3971); Ngozi prov:Ldes over one third of total production. Total

- 4 -
Burundi green coffee 1/ production and exports have fluctuated greatly overthe past five years; the 1969 production was a low 14,550 ton whereas a re-cord 27,500 ton was produced in 1974. On the basis of 5-year moving averagesthe Arabica production has increased by some 3.25% annually, whereas Robustaoutput has grown about 11% per year. The increased Arabica production reflectsa steady acreage expansion, while the Robusta increase reflects the rehabili-tation and expansion of commercial estates.
2.05 Smallholder Arabica coEfee is grown in small stands, on averageabout 160 trees per farmer, covering about 0.10 ha, often in several plots.Although improved in the area of the first project, coffee husbandry isgenerally poor, because vital food crop production for subsistence receivespriority over coffee improvement. Fertilizer is only applied in the areasof the first project but an annual countrywide insect control campaign isorganized and financed by the Office des Cultures Industrielles du Burundi(OCIBU). Yields are low, in the region of 450-500 gram of parchment coffeeper tree or 700-800 kg per ha, compared with 2,000-3,000 kg per ha on someestates in East Africa. Very little applied coffee research has taken placein Burundi, being mostly limited to fertilizer trials in 1962-66, and morerecently during the first project. Variety trials have been conducted at theRubona research station in Rwanda with results applicable to Burundi growingconditions. Little progress has been made in formulating an agronomic andentomological research program.
Processing
2.06 Traditionally almost all Arabica coffee is processed by the farmersthemselves. About three quarters of the coffee crop is still pulped by handon the farms and the balance is pulped at some 325 hand-pulping centers, con-sisting of hand-driven disc pulpers and facilities to partially clean the beans,producing the so-called semi-washed coffee. The pulping centers, establishedin the coffee growing areas prior to independence, are now maintained byOCIBU but frequent break-downs haLve reduced their effectiveness. In general,coffee quality suffers from indiscriminate picking, poor processing and drying,and inadequate storage and hulling.
2.07 A first attempt to produce a high quality fully-washed coffee wasmade in 1953 when a washing station, equipped with engine-driven pulpers,washing facilities and oil fired dryers was built at Butegana, near Kayanza,
1/ The following terminology is used in this report: Cherry, the completefruit of the coffee tree, should be picked when it turns red, and nor-mally contains two beans. These beans are individually covered bymembranes, the silver-skins, and parchment-like shells, all covered bya mucilaginous substance. Immediately surrounding this is the skin ofthe cherry. Skin is removed in the pulping process, and mucilage duringwashing and fermentation. Pulped coffee, when dried, is called parchmentcoffee. The parchment and silver-skins are removed in hulling factories,which produce clean or green coffee. All coffee trading is in greencoffee, which is eventually roasted before consumption.

in Ngozi province. The designed capacity was 300 ton of parchment coffeeand because of the distances involved most of the cherries needed to betransported by road from buying centers to the station. The venture wasnot successful; the dryers never performed well and nave long been aban-doned and cherry transportation turned out to be costly. OCIBU still oper-ates the station far below its designed capacity but the quality of thecoffee is irregular and ofiten no better than the traditional semi-washedcoffee.
2.08 A second attempt to produce fully-washed coffee was made under thefirst project. Four stations with an annual capacity of 125 ton parchmentcoffee each, equipped with pre-graders, engine-driven pulpers and facilitiesfor fermenting, washing, soaking and open air drying have been built, of whichthree came into operation only in the 1975 season. Experience obtained so faris thus very limited and only 40-50 ton were produced by the first station ineach of the 1973 and 1974 seasons. An economic evaluation of the washingstation program originally proposed for this Project, showed an 8% internalrate of return. Thus Burundi has yet to establish an economic processingmethod to increase the value of coffee exports.
Marketing
2.09 The internal marketing of smallholder parchment coffee is done byprivate traders, who are licensed by OCIBU to buy at specified markets, oncertain days. All transactions are in cash but there are no standard weightcontrols, and considerable under-weighing is said to exist. The traderstransport the parchment cofEfee to Bujumbura for sale to private exporters,who arrange for hulling, some in their own mills. After hulling, the greencoffee is bagged and sent ito OCIBU stores where lots are sampled and classifiedby grade. OCIBU is responsible for contacts with buyers, preparation ofsamples, acceptance of off ers and the issue of export permits. Over 60% ofBurundi's semi-washed coffee is sold in the United States; the FederalRepublic of Germany is the next most important market and in the last twoyears the USSR has bought significant amounts. The small quantities offully-washed coffee produced so far have been sold in the more quality-con-scious European market. Growers' prices for parchment coffee, trade andexport commissions, and transport and hulling margins are fixed by the Gov-ernment Coffee Board each ear before the start of the harvesting season inrelation to the expected world market price. The farmerst share of grossearnings from coffee exports varied in most of the past years between 52 and58% and was an exceptionalLy high 70% in 1969/70 when world market prices werevery low. The cost of processing handling and transport of the coffee toDar-es-Salaam was on average about 15% of gross earnings; OCIBU's operationaltax, including provisions for the Stabilization and Promotion Funds, wereabout 8% and the balance, about 15-25%, accrued to the Government. Thepricing policy as implemented over recent years, has guaranteed a satisfactory,stable, price to the farmer, and provided the Government with an important,although irregular, source of income as it absorbes the wide fluctuations inexport prices.

D. Agricultural Services
2.10 The Ministry of Agriculture and Livestock is primarily responsiblefor the provision of services to the agricultural sector. It operatesthrough 2 departments, Agriculture and Livestock, and through a group of5 parastatal agencies. The parastatais include separate agencies for thethree export crops: coffee, cotton and tea; an agricultural research insti-tute and agricultural schools. Total extension staff, all employed bythe Ministry, consists of about 800 workers giving a ratio of one workerfor about 1,000 farmers. The arnual budget of the Ministry is about US$1.5million or less than 5 percent of the total Goverrnnent budget. A number ofagricultural services and projec:ts are, however, financed with foreignassistance, not included in the Ministry's budget.
2.11 The three parastatals dealing with coffee, cotton and tea, maintaintheir own accounts, but are essentially Government service agents. OCIBU,the coffee organization, is governed by a Board of Directors, chaired bythe Minister of Agriculture, and the day-to-day operations are overseenby the Director-General. Its main activities include maintenance of coffeequality standards, organization of coffee pest control campaigns, maintenanceof communal hand pulping centers, establishment of coffee nurseries, devel-opment of new export markets, and advising Government on general coffeematters, in particular producer prices. OCIBU also manages a coffee PriceStabilization Fund and a Coffee Promotion Fund.
2.12 Additionally OCIBU has been responsible for carrying out thefirst coffee improvement project: with headquarters based at Ngozi and usingextension staff which remained fmployed by the Ministry of Agriculture.Under the project OCIBU's resporLsibilities have been extended to the buy-ing of coffee cherries from the farmers, the operation and maintenance ofthe coffee washing stations and the export of fully washed coffee for itsown account.
2.13 Agricultural research is carried out by the Institut des SciencesAgronomiques du Burundi (ISABU) which is governed similarly to OCIBU. ISABUoperates four experimental stations and supervises and coordinates severalpilot projects for tea production. Due to lack of staff and equipment ISABUhas so far been unable to assigrn personnel exclusively to coffee research.
2.14 There are three agricultural schools and training institutes inBurundi. The Institut TechniquE Agricole du Burundi (ITAB) at Gitega hasa 4 year course for agronomists. Between 10 and 15 students completed thecourse in each of the last 3 years. The capacity of the school has recentlybeen expanded and the out-turn is expected to increase to about 30 from1978/79. Another school, the Ec:ole Professionelle Agricole (EPA) at Karuzi,trains field assistants (moniteurs) and the two year course has an averageout-turn of 25 students every year. A 1-year course for field assistantsis provided at the Rutegama Vocational School; the out-turn is about 20per year. The entire out-turn is employed by the Ministry of Agricultureand Livestock.

E. First Coffee Improvement Project
2.15 The first coffee improvement project in Ngozi started in July, 1969,supported by an IDA credit of US$1.8 million. The project aimed at an in-crease in the quantity and an improvement of the quality of coffee producedby about 44,000 farmers by:
(a) constructing and operating four coffee washingstations;
(b) strengthening the extension service throughin-service training of the staff;
(c) distributing fertilizers and other inputs;
(d) rehabilitating 80 communal hand pulpingcenters; and
(e) repairing 350 small bridges and culverts oncoffee tracks.
2.16 The project's progress has been unsatisfactory, partly due to itsslow implementation. This has been caused by a number of circumstances,including the civil strife of 1972, senior staff shortages and changes inleadership, limited construction capacity in the country, supply delaysand shortages, and lack of coordination both with OCIBU headquarters andprovincial authorities. As a result, the closing date of the project waspostponed in two stages from December 31, 1973 to December 31, 1975.
2.17 At the completion of the project a number of important questionsremain unanswered. Better miulching, clean stumping, pruning and the useof fertilizers have visibly improved the coffee stands. But it is notpossible to evaluate the project's impact on production, nor to derive anadequate data base on which to plan follow-up activities since no adequatearrangements were made to monitor systematically the coffee yields which isparticularly difficult as the harvest is spread over several months and theyields fluctuate strongly from year to year. This is especially true inrespect of the effects of improved husbandry techniques and fertilizers onyields, both separately and in combination with each other. The constructionof the first washing station was held up by delays in obtaining materials andthat of the other three stations was delayed pending assessment of the per-formance of the first. In addition, the first station operated far below itsdesigned capacity during the past two seasons, as cherry prices were lowerthan the relative price for parchment 1/ and farmers preferred to continueprocessing the coffee themselves. As a result the washing stations have sofar provided little operational experience. Liquoring tests by brokers in
I/ This has since been corrected for the 1975 season.

-8-
Nairobi, and prices realized for fully-washed coffee produced so far, haveindicated that benefits can be derived from better processing but the quanti-tites, which have been sold thus far, were too small to give firm evidenceof the amount of premium which may be expected in the future. Finally, theimprovement of hand pulping centers, bridges and culverts has not beenexecuted due to staff shortages.
2.18 The difficulties of the first project have been taken into accountin the design of the second Project. Construction work would be undertakenby force account in view of the limited private construction capacity. A newProject director has been recruaited in 1974 from the IBRD Agriculture Develop-ment Service (ADS). A coordination committee would be established to improvecommunications between the Project and Governmental and provincial authoritiesand the services of a team of advisers would be used to help provide answersto the main questions thrown up by the first project, particularly with re-spect to coffee processing, coifee husbandry techniques and monitoring ofyields.
III. THE PROJECT AREA
3.01 The Project area comprises the entire province of Ngozi which isthe center of Burundi's coffee growing region and which produces currentlyabout 35% of the nation's coffee crop. The provin5e has an estimatedpopulation of about 700,000 persons, or 270 per km . As in other partsof the country, Ngozi's emigration rate is believed to be high and thepopulation increase probably does not exceed 1% per year. It is estimatedthat the average family comprises 4.7 persons and that there are 150,000families. Some 97%, or 145,000 families, are engaged in agriculture.
3.02 The Project area is a hilly plateau intersected by marshy valleysand perennial streams. The altitude of the plateau ranges from 1,500 to2,000 m with a mountain range in the extreme west of the province runningnorth/south. Annual rainfall averages 1,200 to 1,500 mm, mainly dividedinto a long season (March-May) and a short season (Oct.-Nov.). Annual fluc-tuations are, however, large and they have a significant effect on crop pro-duction. Soils are mostly deep and well drained but large tracts on steepslopes are subject to serious water erosion, aggravated by increased cropcultivation. A well developed road system provides two all weather gravelroads across the Project area and in the west the main road Bujumbura-Kayanza is presently being pavecl. There is a network of secondary roadsand an extensive system of coffee tracks runs roughly along the contours.The roads are generally satisfactorily maintained with communal labor,though the maintenance of culverts and bridges is often neglected becauseof lack of materials.

-9-
3.03 A typical family holding cultivates 0.75 to 1.0 ha, on averagemade up of as many as 20 smanll plots. Land close to the farmer's house ispermanently cultivated. More distant plots are cultivated for two or threeyears and then fallowed but fallow periods are now being reduced as a rhsuktof population pressure. There are three growing seasons: two on the hillsduring the rainy seasons and one in the marshy valley bottoms during themain dry season. In the past Burundi families grew only food crops forsubsistence but, during the 30 years preceding the country's independence,coffee was introduced on the majority of the farms. Bananas are also animportant source of cash income for the farmers; in Ngozi sales proceedsfrom banana beer are twice as high as those from all other food crops com-bined. Important food crops include cassava, beans, sweet potatoes, maizeand sorghum; almost all are intercropped. One third of all farmers owncattle, which are grazed on communal land unsuited for field crops, andmost of the farmers have small livestock such as goats, sheep, chickens,pigs and rabbits.
3.04 Coffee can be grown in all areas of Ngozi province except for thewestern mountain range (Zaire-Nile divide) where the altitudes, exceeding2,000 m, are too high. Some 110,000 families, or 90% of those living inthe suitable areas, grow colffee, and the total number of trees is estimatedat 17.6 million (11,000 ha) for the whole province. Fertilizer trials con-ducted in the 1960's as welL as informed local opinion suggest that somesoils, mainly in the eastern and southern parts of the province, are eitherof low fertility or not deep enough and that consequently coffee yields arebelow average in these areas. Pending completion of a semi-detailed soilsmap by ISABU, to be availabLe in 1977, an arbitrary division in "high" and"low" potential coffee areas has been made for Project purposes. About twothirds of the coffee is grown in the "high" potential areas and thebalance in the "low" potential areas.
IV. THE PROJECT
A. General Description
4.01 The Project would, over five years, support the development ofsmallholder coffee and food crop production in Ngozi province throughdistribution of farm inputs and strengthening of extension services. Itwould also address a number of fundamental problems concerning the cultivationand processing of coffee, the expansion of food production, and the organizationof extension services and thu's'''ontribute to the future development ofagricultùral production in ithe country as a whole. Specificially, the Projectwould provide for:

- 10 -
(a) inputs and strengthened extension services to sustain andextend the improvemerit of coffee cultivation, started underthe first project;
(b) construction of four additional coffee washing stations andtechnical assistance for the operation of the four existingstations and for trials with alternative processing methods;
I (c) staff and equipment for an expanded coffee research program;
(d) inputs, field trials and extension advice for the cultivationof food crops;
(e) construction or repair, of potable water sources, bridgesand culverts;
(f) experimental rural de.velopment activities including theimprovement of small livestock, training of draught animals,the use of water mills and the establishment of farmercooperatives; and
(g) a resident management: team of experts backed up by a smallteam of international advisers which would at regular in-tervals assist in formulating work programs and advise onspecific Project problems.
Apart from the coffee research program, which would be implemented by ISABU,the Project would be carried out by OCIBU. Overall direction of Projectactivities would be by a commit:tee of representatives of the Government,including Project management, and which would be advised by the team of ad-visers.
B. Detailed Features
Extension Services
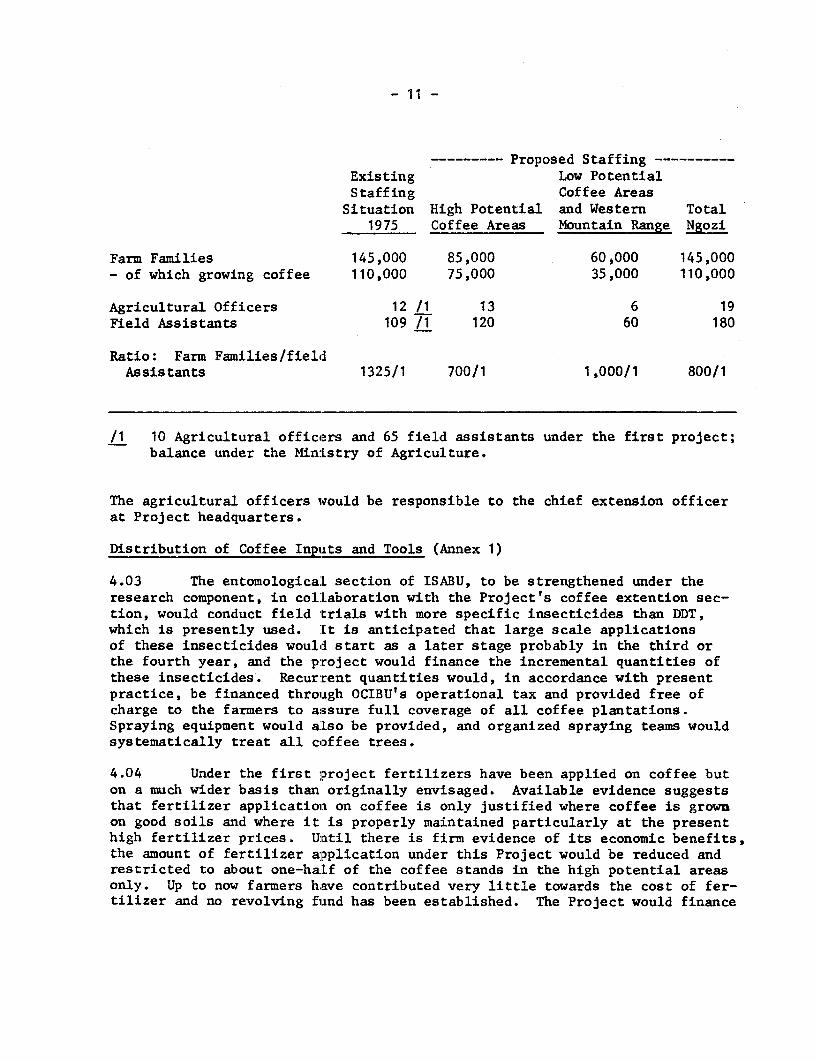
4.02 In order to streanlirLe and strengthen extension, the concept oftw_. different services - one for coffee, established and managed by the firstproject, and another for other activities under the responsibility of theMinistry of Agriculture - would. be replaced by a single organization whichwould advise on all agricultura.l matters. Coffee extension would be backedup by the supply of nmdern tools and inputs and would be mainly concentratedon the areas with a high potential for coffee growing. In the areas withlower potential, coffee extension work would be less intensive. Food cropextension advice would be given. to farmers in all areas including the highaltitude western mountain range where no coffee is being grown. Extensionstaffing would be as follows:
- 11 -
--------- Proposed Staffing ----------Existing Low PotentialStaffing Coffee AreasSituation High Potential and Western Total
1975 Coffee Areas Mountain Range Ngozi
Farm Families 145,000 85,000 60,000 145,000- of which growing coffee 110,000 75,000 35,000 110,000
Agricultural Officers 12 /1 13 6 19Field Assistants 109 /1 120 60 180
Ratio: Farm Families/fieldAssistants 1325/1 700/1 1,000/1 800/1
/1 10 Agricultural officers and 65 field assistants under the first project;balance under the Min:Lstry of Agriculture.
The agricultural officers would be responsible to the chief extension officerat Project headquarters.
Distribution of Coffee Inputs and Tools (Annex 1)
4.03 The entomologicaL section of ISABU, to be strengthened under theresearch component, in collaboration with the Project's coffee extention sec-tion, would conduct field itrials with more specific insecticides than DDT,which is presently used. [t is anticipated that large scale applicationsof these insecticides would start as a later stage probably in the third orthe fourth year, and the project would finance the incremental quantities ofthese insecticides. Recurrent quantities would, in accordance with presentpractice, be financed through OCIBU's operational tax and provided free ofcharge to the farmers to assure full coverage of all coffee plantations.Spraying equipment would also be provided, and organized spraying teams wouldsystematically treat all coffee trees.
4.04 Under the first project fertilizers have been applied on coffee buton a much wider basis than originally envîsaged. Available evidence suggeststhat fertilizer application on coffee is only justified where coffee is grownon good soils and where it is properly maintained particularly at the presenthigh fertilizer prices. Until there is firm evidence of its economic benefits,the amount of fertilizer alpplication under this Project would be reduced andrestricted to about one-half of the coffee stands in the high potential areasonly. Up to now farmers have contributed very little towards the cost of fer-tilizer and no revolving fund has been established. The Project would finance

- 12 -
the full cost of fertilizer for the first year and the incremental quantitiesthereafter. Government would set. a repayment price for farmers which wouldgradually increase but would not exceed a level which deprives them of thefinancial incentive to use fertilizers. On present price projections, theGovernment subsidy would decline to about 25% of cost by the end of the Pro-ject. A Government subsidy on fertilizers is justified since the return tofertilizers for the country as a whole is considerably higher than the returnto the farmers, who receive about. 50-60% of the export value of the coffee.Repayments by farmers would be made as at present through farmers' groups.This has been successfully tried out on a limited scale during the 1974 seasonand the details may be modified in the light of further experience. The pro-ceeds of farmers' repayments for fertilizers as for other inputs would beplaced in a revolving fund accourLt to be supplemented by a government subsidywhen necessary. On the basis of current price projections the annual subsidywould be in the order of about US$50,000 from year 6 onwards. During negotia-tions an assurance was obtained from the Government that a revolving fundaccount would be established by January 31, 1976. In addition the Governmentagreed that it would submit proposals to IDA for post-Project arrangementsfor the recovery of input costs, including costs of distribution and interestcosts, and the operation of the revolving fund, by December 31, 1979 (See alsoAnnex 7).
4.05 Simple pruning tools (secateurs and saws) would be made availableat half the cost price. The Project would provide for the replacement ofold and diseased coffee trees with high yielding varieties and also providenew households with planting material, together estimated at 4% annuallyof the existing trees. This is in accordance with Governments' policy and, inview of the serious population pressure in Ngozi Province, is the maximum levelthat can reasonably be sustained without reducing land resources available forfood crop production. An assurance that the planting program would not exceedthe 4% level has been obtained f rom the government during negotiations. Inconformity with present practice the nurseries would be established with com-munal labor and the Project would. provide for nursery maintenance.
Coffee Processing (Annex 2)
4.06 The Project would provide technical assistance for a three yearperiod for the operation of the four coffee washing stations built underthe first project. The Project would also support the construction offour more washing stations during the first two Project years as an extendedtrial. The new stations would be simpler than those built previously and atthe end of the trial period more precise information would be available on theconstruction costs of the new stations and on the operating results of theexisting four. The Project would also assess alternative processing methodsand maintain the existing 150 hand-pulpers. OCIBU would formulate proposalsfor the future processing of coffee and would discuss these with IDA by Decem-ber 31, 1977. An assurance to this effect has been obtained during negotia-tions.
- 13 -
Coffee Research Program (Annex 1)
4.07 The Project would support a strengthened ISABU coffee researchprogram which would focus on insect and disease problems and on husbandrytechniques applicable to smallholders, including further trials with chemicalfertilizers. The Project would finance salaries and housing and transportcosts of two internationally recruited research officers who would be sup-ported by Burundi counterpart staff. The Project would also provide for thenecessary scientific equipment for the laboratories now being constructedwith Belgian aid in Bujumbura.
Food Production (Annex 4)
4.08 The Project would support a number of activities aimed at anincrease in the level of food production and soil conservation. In viewof the limited local experience with improved production techniques onlyan indicative description of the types of activities can be given; theprogram would be reviewed each year in consultation with the internationalteam of advisers (paragraph 4.13). Following positive experience with multi-plication and distribution of improved seeds under similar conditions inneighboring Rwanda, two seed multiplication farms would be established, main-ly for maize but possibly also for beans, sweet potatoes, cassava, ground-nuts and soybeans. Following on the encouraging results of the FAO supportedfood crop fertilizer trials, fertilizers would be made available, in thefirst place for maize, but possibly also for high altitude crops - potatoesand wheat. The extension services would encourage the establishment ofsetaria grass hedges against water erosion, drainage of the marshes and theuse of farm yard manure on the fields. Multiplication fields for setariagrass would be established by the Project to provide farmers with initialplanting material.
4.09 The terms of sale fEor fertilizers to be applied on food cropswould essentially be the same as for fertilizers for coffee and thus involvea gradually decreasing subsidy. Limited quantities would be distributed freeof charge for demonstration purposes to farmers who would for the first timeapply fertilizers on their food crops. To discourage domestic consumption ofimproved seeds and pending further experience on the costs of production anddistribution of seeds, sales prices would be about 10% higher than prevailingmarket levels. As no permanent arrangements have been worked out yet (seeparagraph 4.04) the distribution of fertilizers and other inputs, involvingdeferred payments, would initially be restricted to farmers who also growcoffee - the large majority -- and their contributions towards the costs ofthe inputs would be collected after the coffee harvest.
Water Supply
4.10 Between 200 and 300 natural springs have been tapped and protectedwith concrete linings betweer 1949 and 1964 but most of these springs areout of use because of poor maintenance. The Project would rehabilitate thesesprings and protect others which so far have not been tapped.
- 14 -
Bridges and Culverts
4.11 There exists a dense network of roads and tracks in the Project areaand no further investments are required to expand the system. Road mainte-nance is adequately carried out through communal work but some 300-400 bridgesand culverts are poorly maintai:xed. The Project would provide the necessarymaterials for their reconstruction which would be carried out with communallabor.
Experimental Rural Development Activities
4.12 The Project would assist in improving the production of livestockmainly by the distribution of irmproved breeding stock of sheep, goats, rabbitsand possibly poultry. Other activities would be: training of cattle fordraught purposes; installation and operation of grain mills using perennialstreams as the source of power; cultivation of vegetables in the marshes;and establishment of farmers cooperatives. Disbursements for this componentwould be conditional on the preparation of detailed proposals, acceptable toIDA, regarding these activities.
Training
4.13 A priority need in Burundi is for practical on the job training andmotivation of extension staff. Accordingly under the Project the managementwould have specific responsibility for training counterparts. In particularthe internationally recruited coffee and food crop officers would train exten-sion workers through introductory courses for new staff and regular, compre-hensive, training programs for existing staff. Each year some ten staffmetbers would visit other East African countries which have advanced experiencein coffee. The Project would also acquire and operate a vehicle, with loud-speaker and projector, to support extension work.
Team of Advisers (Annex 11)
4.14 Agricultural development in Burundi in general and a number of Pro-ject components in particular - notably coffee processing and cultivation, andfood crop and livestock development - require a large amount of further prac-
tical experimentation and sound detailed planning because previous experiencewith these activities is limited. As the main responsibility of the residentPrc5ect management team members would be to manage the day-to-day affairs of
the Project, which would not allow them to keep regularly in touch with re-
levant developments in other countries, there is a clear need for back-upexpert guidance. The Project would therefore provide for a small, broadlyexperienced, internatîonally recruited team of advisers (about three persons)which would visit Burundi at regular intervals (twice in the first year, once
or twice in the following years) for periods of about 2-3 weeks each. The

- 15 -
team would have general discussions with Government on the possibilities andpriorities for agricultural development, and would help formulate detailedwork programs for the Project, monitor its progress and advise on its problens.This would include recommen,dations for specific studies by ad-hoc specialists,when appropriate; a provision for this has been included in the Project. As-surances were obtained duriing negotiations that the qualifications and expe-rience of the team members and the terms and conditions of their service wouldbe acceptable to the Association. They should have a wide experience underconditions similar to those in Burundi, and should serve for at leastthree years to assure continuity of advice. A total of about 15 man-monthsof consultants services, covering both the team and ad-hoc specialists, isprovided for under the Project.
Environmental Aspects
4.15 The Project would rehabilitate and protect natural springs to providethe rural population with safe drinking water. Mulching of coffee trees andthe establishment of setaria grass hedges would reduce the risk of soil ero-sion. The Project's research component would recommend appropriate coffeeinsecticides with the minimlum adverse environmental effects and would alsomaintain close contacts with research work, currently carried out in Kenya,on the water pollution hazard associated with the coffee washing process.
C. Project Costs (Annex 6)
4.16 Total Project cost including contingencies is estimated at FBu 591million (US$7.5 million) andi the foreign exchange component is estimated at57%. Detailed cost items are estimated as follows:

- 16 -
--- FBu' 000 ------- ------ US$'000 ----- ForeignExchange
Local Foreign Total Local Foreign Total %
Agricultural Services 108,506 79,664 188,170 1,385 1,017 2,402 42Coffee Processing 7,760 18,680 26,440 99 238 337 71Coffee Research 9,915 35,705 45,620 126 456 582 78Construction, Equipment,Bridges, Water Supply 5,280 7,620 ---12,900 68 97 165 c2 '60
Project Management 29,050 76,585 105,635 371 977 1,348 73Technical Advice andMonitoring 7,403 13,912 21,315 94 178 272 % 65
Administrative andTechnical Services 15,672 13,038 28,710 200 166 366 45
Base Costs 183,586 245,204 428,790 2,343 3,129 5,472 57
Physical Contingencies 9,179 12,260 21,439 117 156 273 57Price Contingencies 60,452 80,133 140,585 771 1,023 1,794 57
Project Cost withContingencies 253,217 337,597 590,814 3,231 4,308 7,539 57
Costs have been estimated at mid 1975 prices and cover capital and incrementaloperating costs. To provide a complete Project the costs also include thenon-incremental operating costs of the existing coffee extension staff asunder the Project their effectiveness would be increased and their activitiesextended to include food crop extension work as well. A physical contingencyof 5% has been included in the total Project cost. Price contingencies havebeen calculated at the following rates: vehicles, equipment and operatingcosts 11% in 1975/76, 9% in 1976/77, and 8% in 1977/78 - 1979/80; constructionworks 15% in 1975/76, 13% in 1976/77, and 12% in 1977/78 - 1979/80; wagesand salaries 10% throughout the Project period. No taxes or duties arepayable except for the taxes on local salaries which are insignificant.
D. F_nancing
4.17 The financing of Project costs would be shared in the followingamounts and proportions:

- 17 -
FBu US$ % of(million) (million) Total Cost
IDA 408 5.2 69
Kuwait Fund 94 1.2 16
Government 89 1.1 15
Total 591 7.5 100
The Kuwait Fund for Arab Economic Development is expected to finance 85% ofthe costs of the construction of the additional coffee washing stations, andthe coffee research and water supply and road construction components of theProject. IDA would finance 85% of the costs of the other components, or allforeign exchange costs (US$3.2 million) and about 68% of local costs of thecomponents concerned. The proposed Kuwait Fund loan would be for 25 years at3% interest and the proposed IDA credit of US$5.2 million on standard terms tothe government. The Government would make available the proceeds of the IDAcredit and the Kuwait Fund Loan and its own contribution to OCIBU which wouldreimburse ISABU for the expenses incurred in carrying out the research compo-nent of the Project. Because OCIBU and ISABU would act as Government agenciesin carrying out the Project, the allocations would be free of interest andwould cover 100% of all Project expenditures. In view of the anticipated timelag of about six months between depletion of funds of the first project andthe start of the proposed Project retroactive financing is proposed in anestimated amount of US$0.5 mil:Lion for expenses incurred after January 1, 1975.Effectiveness of the Kuwait Funid Loan would be a condition of the effective-ness of the proposed IDA credit.
E. Procurement
4.18 Fertilizers and pesticides (US$0.6 million) would be procured byinternational competitive bidding in accordance with Bank/IDA guidelines.Vehicles, farm tools and miscellaneous equipment and materials (US$0.5 million)would be procured locally in accordance with normal Government procedureswhich are satisfactory; essential service and satisfactory competition isavailable from local representatives of foreign suppliers. As the constructionof civil works in scattered locations throughout the remote Project area isunlikely to attract foreign bids and local private construction capacity isvery limited, the construction of staff housing, offices and stores (US$0.5million) would be undertaken by force account; building materials would beprocured locally in accordance with normal Government procedures. Assurancesto the above have been obtained during negotiations.

- 18 -
F. Disbursement
4.19 Disbursement of funds from the credit account would be on the fol-lowing basis:
(a) 100% of cif and 70% of local costs of equipment, vehiclesand farm inputs, including fertilizers and pesticides,
(b) 100% of cif or 70% of local costs of construction materials,equipment and furniture for houses, office, and stores;
(c) 70% of total cost of civil works for houses, offices,stores;
(d) 100% of foreign exchange and 70% of local costs of salariesand wages of staff an,l operating costs of units employedor created under the Project.
(e) 100% of foreign exchange and 70% of local costs of live-stock, materials, equ:Lpment and other inputs for theexperimental rural development program.
All Project cost items are detailed in Annex 6. Disbursements would be fullydocumented. The estimated schectule of disbursement is at Annex 9. Any fundsremaining in the Credit account at the end of the Project would be reallocatedat the discretion of the Association.
G. Acccunts and Audits
4.20 Accounts, which would reflect the costs of the various Projectcomponents, would be maintained by the Project's administrative and accountingunit. OCIBU's full accounts, including separate accounts for Project expend-itures, would be audited by independent auditors acceptable to the Associationand would be submitted to IDA within six months of the end of each fiscal year.Assurances on the above have been obtained during negotiations.
V. ORGANIZATION AND MANAGEMENT
Organization (Annex 5)
5.01 OCIBU would be responsLble for implementing the Project, except forthe research component which wouLd be executed by ISABU. OCIBU would exerciseits responsibility through the Project Department which was established toimplement the first coffee improvement project. The Project manager, would,as director of the Project Depart:ment, report to the Director-General of OCIBU.
- 19 -
The Project would be administered through four divisions covering respectively,agricultural services, coffee processing, construction and technical services,and administrative and accounting services.
5.02 The Government has agreed to establish a committee composed of theMinister of Agriculture, the Minister of Finance, the Minister of Planning,the Director-Generals of OCIBU and ISABU, the President of the Central Bank,the Governor of Ngozi province and the Project manager to coordinate and super-vise all Project activities. The committee would meet regularly, at least4 times per year, to discuss detailed work programs and budgets and to reviewthe Project's progress and problems. The committee would work closely withthe team of advisers which would provide technical guidance for the Project.The committee would meet the team at the end of each visit to discuss theteam's findings and recommendations.
5.03 During the first year the Project would require seven internationallyrecruited senior staff, including two for the coffee research component. Ofthese, three are already in place, i.e., the Project manager - recruited fromthe IBRD Agriculture Development Service (ADS) -, a coffee processing officerand a construction officer. A coffee extension officer has been recruitedand will take up his position shortly. The two research officers, and afinancial controller remain to be recruited. The government agreed duringnegotiations that the services of a food crop extension officer, presentlyemployed in Burundi under a bilateral arrangement with the Belgian Governmentwould be made available for the Project during the first Project year and thatbefore September 30, 1976 the government will examine with the Association thesteps to be taken to assure the full time presence in the project of a foodcrop specialist. In years 2, 3, 4 and 5 the number of internationally re-cruited staff would be 8, 7, 6, and 6 respectively. During negotiations itwas agreed that appointments to these posts and any subsequent reappointmentwould be made in consultation with the Association. Most of the seniorcounterpart positions are already filled under the first project and no majordifficulties are expected in finding candidates for the remaining posts.
Management and Senior Staff
5.04 The Project manager would specifically concern himself with theimplementation, coordination and evaluation of all Project activities. Hewould prepare working documents to be discussed by the coordinating committee,and would direct a small group of enumeratots which would collect relevantdata, especially on crop yields. He would be assisted by a Burundi deputy-manager who is also already in place.

- 20 -
5.05 The agricultural services division has an experienced Burundichief appointed under the first project. He would be assisted by the coffeeand food crops specialists, who would be responsible for training of Burundiextension staff, for the establishment of demonstration plots and for theorganization of the distribution of farm inputs.
5.06 The senior coffee pro-essing officer and his Burundi deputy (alsoin place), would be responsible for the operation of the coffee washingstations and for experiments with alternative processing methods. Theywould collect and interpret data on technical and organizational aspectsrelevant to the economic assessinent of various alternatives.
5.07 The financial controlLer and his Burundi deputy would be in chargeof the administrative and accounting services. They would give particularattention to financial evaluation aspects of the Project. The financialcontroller would also assist OCtBU headquarters with the organization oftheir accounts when appropriate. The construction officer would be in chargeof all Project construction act:Lvities.
Junior Staff
5.08 The number of agricultural officers would be increased from thepresent 12 to 19 from year 4 onwards. The posts would be filled with graduatesfrom ITAB at Gitega. A total oi- 109 agricultural assistants were employedin Ngozi province in 1975, of whom 41 were graduates of the Karuzi orRutegama agricultural schools; an additional 71 extension workers would berequired by year 4 when the extension serives would be at full strength.The annual out-turn of graduates from the Karuzi and Rutegama schools isestimated to be sufficient for Burundi's foreseeable agricultural developmentneeds. The basic agricultural education of all staff would be supplementedby in-service training under the guidance of the Project's two extensionofficers.
VI. PRODUCTION, MARKETING, FARMERS' BENEFITS ANDEFFECTS ON GOVERNMENT BUDGET
A. Yields and Production
Coffee (Annex 1)
6.01 Project activities aimed at the improvement of insect controlspruning and mulching techniques in all coffee growing areas of Ngozi provinceand the application of fertilizers in the high potential areas are estimatedto increase the coffee parchment production as follows:

- 21 -
Without Project With ProjectNumber Coffee Number Yield Produc- Yield Produc-
of Area of per tion per tionCoffee Trees Tree TreeGrowers
(ha) (million) (gram) (ton) (gram) (ton)
/1Area First Project 52,000 5,200 8.32 515- 4,285 575 4,784
Other High Potential 23,000 2,300 3.68 475 1,748 575 2,116Areas
Low Potential Areas 35,000 3,500 5.60 425 2,380 450 2,520
Total 110,000 11,000 17.60 8,413 9,420
/1 Without the services provided by the Project (extension services, dis-tribution of fertilizers) the present average yield of 550 gram pertree would decline to 515 gram.
At full development (year 7) the incremental production for the whole pro-vince would be about 1,000 t:on parchment coffee (800 ton green coffee). Theabove estimates take into account the experience under the first projectand are lower than previously forecast.
Food Crops (Annex 4)
6.02 An estimated 6,000 farmers would increase their maize productionfrom 1,100 to 1,300 kg per ha through the use of improved seed and some2,000 of these farmers wouldl further increase their yields to 2,200 kgper ha through fertilizer application. The incremental maize productionwould amount to 750 ton from year 5. No projections have been made forcrops other than maize since little local experience has so far beengained with food crop development activities; shifts in emphasis may occurduring Project implementation.
B. Markets and Prices (Annex 3)
6.03 Coffee marketing would continue through private traders andexporters with grading and licensing of all exports carried out by OCIBU,as at present. The existing arrangement whereby prices of parchmentcoffee and of coffee cherrie;s are fixed each year by the Coffee Board inrelation to the expected world market price, would remain unchanged.Prices for Burundi's semi-washed coffee fob Dar-es-Salaam, were on averageabout 55 US cts/lb in 1972/73, increased subsequently to about 70 cts inearly 1974 and dropped thereafter sharply to about 40 cts in late 1974 andearly 1975. A recovery to 50 cts in 1975, followed by increases to 76 cts in1978 and 78 US cts/lb in 1985 (constant 1975 prices), is expected on the basis

- 22 -
of IBRD's price forecast. 1/ The growers price for parchment coffee wasincreased from FBu 34/kg in 1972, to FBu 38/kg in 1973, and to FBu 45/kg in1974; the farmers share of gross earnings from coffee exports was about 55%during those yeare (see also para 2.09). Incremental food crop productionwould mainly be consumed by farla familles and no special marketing arrange-ments are envisaged.
C. Farmers' Benefits (Annex 10)
6.04 Improved insect contrDl techniques are expected to reduce pro-duction losses on all 110,000 coffee farms in Ngozi province. The majorityof the growers would also improve mulching and pruning techniques and abouthalf of the farmers in the high potential areas would use fertilizers.Individual yield estimates for ,each of these improvements, or combinationsthereof, cannot be precisely forecast. However, based on average yieldincreases estimated in paragraph 6.01, it is expected that average cashincomes from coffee would improve as follows:
Without With IncrementalProject Project(FBu) (FBu) FBu US$ Percentage
Area First Project 3,630 3,930 300 3.80 8
Other High Potential 3,345 3,930 585 7.50 17Areas
Low Potential Areas 2,990 3,170 180 2.30 6
The expected average incremental cash incomes are relatively modest reflect-ing the small area of coffee trees owned by the typical Ngozi farmer(0.1 ha). Variations in incremental cash incomes are however expected tobe substantial, not only for farmers located in the different areas butalso for farmers wîthin a particular area, depending on the extent to whichthey adopt the improved techniques. Farmers who effectively combine allnew activities could achieve incremental cash incomes which are double thoseindicated above. Faced with little risks, it is thus considered thatsufficient incentives exist for farmers to adopt many of the innovations.
6.05 Improved maize seed would increase the net value of the productionof some 6,000 farmers from about 0.25 ha by about FBu 565 (US$7) and some2,000 of these farmers would further increase their incomes by FBu 1,550(US$20) through fertilizer application on their maize. Farmers in the
1J This forecast was made before the July 1975 sharp increase in pricesfollowing reports of a severe frost in Brazil. The forecast has recentlybeen updated and the new projections indicate prices which are about 20%higher in the coming three vears, 10% higher in 1980 and 6% lower in1985, compared with the premious forecast.

- 23 -
high potential coffee areas who combine coffee improvement with the useof selected seed and fertilizers for maize would increase the net valueof their total production by about FBu 2,750 (US$35) from FBu 26,000 (US$332)to about FBu 28,750 (US$367), an increase of about 11%.
D. Effects on Governnent Budget (Annex 8)
6.06 The cumulative Government cash flow arising out of the Project wouldbe positive from year 4. From that year Government would build up a cumulativesurplus, reaching a peak of FBu 53 million (US$0.7 million) in year 10, andthereafter gradually declining to FBu 23 million (US$0.3 million) in year 25with the increase in the IDA Credit debt service. The annual cost of con-tinued extension and other services to the Project area from year 6 onwardsamounts to FBu 39 million (US$50.5 million) and has been included in the cashoutflow. The annual cash inflow consists of incremental revenue from coffeein the form of Government and OCIBU taxes on exports. The Government cashflow shows the aggregate position for both the Government and OCIBU. Noseparate cash flow has been calculated for OCIBU since this is regarded as aGovernment agency and because its costs will be reimbursed by Government.
VII. ECONOMIC BENEFITS AND JUSTIFICATION (Annex 12)
7.01 The chief benefits of the Project would be increased productionof coffee and food crops and an improvement in the quality of the coffeeprocessed in the washing stations. The annual increase in coffee productionbrought about by the Project at full development is estimated at 800 tongreen coffee with a gross value of US$1.35 million at constant 1975 IBRDforecast prices. The incremental value of a further 800 ton of fully-washedgreen coffee, representing the production of four existing and four proposedwashing stations, is expected to be,US$135,000 annually at full developmenton the basis of a 10% premium for fully-washed over semi-washed coffee.The increase in food crop production is expected to be about 750 ton ofmaize valued at aboutiUS$75,000. Production of other food crops and ofsmall livestock is also likelv to increase but these cannot be quantified.The same applies for the additional benefits to the coffee industry as awhole to be expected from the expanded research program. About 110,000farmers are expected to benefit from the Project.
7.02 The economic rate of return of the whole Project is estimated at21% with foreign exchange valued at 20% above the official exchange rate,reflecting more accurately the value of foreîgn exchange to Burundi. Withoutshadow pricing of foreign exchange the rate of return would be 17%. Thecoffee research program, the experimental rural development activities andimproved water supply facilities were not included in the calculations as

- 24 -
their benefits cannot be estimated. Costs and benefits from the coffee pro-cessing component have been included in the rate of return calculation ofthe whole Project, together with those for the agricultural services componentwhich comprises both coffee and food crop development. The rate of returnfor the latter component is estirnated at 24% with shadow pricing of foreignexchange and at 20% without. The rate of return of the coffee processingcomponent is tentatively estimated at 9%. Although this is low the componenthas been included in the Project as an extended trial to test a number ofassumptions which are important l'or future investment decisions. Taking intoaccount that Ngozi province is overpopulated, that no significant alternativeemployment opportunities exist, and that the development activities requireonly a small amount of additional work by the farm families, incrementalon-farm labor requirements have not been costed.
7.03 The Project's main risk is that coffee prices would be less thanforecast. A reduction of benefits of 20% because of lower prices or loweryields would reduce the rate of return to 11%. A further reduction to7% would occur if costs were also to increase by 10%.
7.04 Since the possibilities to grow other cash crops than coffee arevery limited for the large majority of Burundi's smallholder farmers andthe anticipated incremental production would be too small to effect worldmarket coffee prices, the introduction of improved cultivation techniques toincrease the productivity of smallholder coffee is justified.
7.C5 In accordance with present practices farmers' share of the grossearnings from incremental coffee production can be expected to be in therange of 55-60%. The benefits from incremental food crop production wouldentirely accrue to the participating farmers. There are no significant dif-ferences in income between various segments of the Burundi rural populationand the benefits of the Project would be fairly evenly distributed over allfarm families in Ngozi province. Farmers will also benefit from improvementsto rural water supplies which would have a significant effect on the healthof the local population.
VIII. AGREEMENTS REACHED AND RECOMMENDATION
3.01 During negotiations assurances were obtained from the Government inthe following principal points:
(a) the proceeds of farmers' repayments for fertilizers andother inputs would be placed in a revolving fund accountto be established by Jarnuary 31, 1976, and that Governmentwould submit detailed proposals to the Association forpermanent arrangements Eor the recovery of input costsand the operation of the revolving fund by December 31, 1979(paragraphs 4.04 and 4.09);

- 25 -
(b) replacement of old coffee trees and supplementary plantingsfor new households would together not exceed the level of4% of existing plantations annually (paragraph 4.05);
(c) Government would formulate proposals for the future processingof coffee and would discuss these with the Association byDecember 31, 1977 (paragraph 4.06);
(d) Government would agree to establish a team of visitingadvisers and to appoint ad-hoc consultants for specificstudies, all of wh,Dse qualifications, experience and termsand conditions of iemployment would be satisfactory tothe Association (paragraph 4.14);
(e) Government would appoint a coordinating committee whichwould meet regularLy to discuss working programs, annualbudgets and the Project's progress and problems (paragraph5.02); and
8.02 A condition of disbursement on account of expenditures for the acti-vities under the experimental rural development program would be the submissionof detailed proposals, accept:able to the Association, for the activities to beundertaken in this component (paragraph 4.12).
8.03 A condition of effectiveness of the proposed IDA Credit would beeffectivenes6 of the Kuwait Fund loan (para. 4.17).
8.04 Subject to the above assurances the Project would be suitable for anIDA Credit of US$5.2 million to the Government of Burundi.

ANNEX 1Page 1
BURUNDI
SECOND CCOFFEE IMPROVEMENT PROJECT
Coffee Growing and Research
A. Achievements of the First Project
1. The appraisal of the first project assumed that the average yieldsof 7 million coffee trees owned by 44,000 farmers in Ngozi province wouldincrease from an estimated base line level of 425 gram of parchment coffeeper tree to 625 gram, mainly through improved insect control, better pruningpractices and mulching. A further increase to 825 gram parchment per treewould be achieved on 50% of the trees which would receive urea applicationsat a rate of 140 gram per tree per annum.
Husbandry Techniques
2. Growing practices appear to have improved during the implementationof the project and there is a visible difference in coffee stands inside andoutside the project area. Insect control measures consist of two applicationsof DDT-Malathion against the Antestia bug which can cause considerable losses.The campaign against this insect is carried out nationwide by OCIBU but theeffectiveness inside the Project area seems to be higher than outside. About2.5 to 3.5 Antestia per tree were counted in 1972-74 inside the project areawhereas some 6 to 9 Antestia were found in other areas of Ngozi province.Some 165 to 170 ton of DDT-Malathion were distributed in the project both in1972 and 1973 which amounts to an average of 20 gram per tree. It is reported,however, that an unknown, but probably sizeable proportion is used by thefarmers in their homes rather than on their coffee trees. On a national scaleinsect damage because of Antestia has been higher in 1972 and 1973 than inthe two previous years. The proportion of healthy beans decreased from about75% to 55%-60%.
3. Pruning techniques have improved but are still far from satisfac-tory. Before the project started 20% of the coffee trees were pruned annuallyirrespective of the stand of the trees at that moment. All stems were cutdown at the same time and it took close to two years before the trees startedproducing again. Under the project, pruning is done on a more selective basebut still at least two of the three stems are cut down before new shoots areallowed to develop.
4. Mulching appears to be the area where the project has been mostsuccessful and this is now done in a satisfactory manner on more than halfof the plantations. Banana, beans and maize residues are customarily usedfor mulching purposes and the project has successfully grown and distributedTrypsacum laxum grass plants to supplement the natural trash.

ANNEX 1Page 2
5. Chemical fertilizers have been distributed on a large scale duringthe first project as shown in the following table:
Quantity ofNumber of Fanners Number of Trees Fertilizers
Year Month Total Pro-:or- Total Propor- Total Per Treeunder tion under tion FertilizedProject Using Project Fertil-Adminis- Fertil- Adminis- izedtration izers tration
('000) (%) (ton) (gram)
1969 November 7,000 62 1,300 36 59 126
1970 April 14,000 9( 2,300 68 170 108November 28,000 82 4,400 73 224 70
1971 April 43,000 76 6,900 69 332 70November 47,000 7i 7,700 62 336 70
1972 April 50,000 69 8,000 70 368 65November 51,000 80 8,250 77 439 70
1973 April 51,500 83 8,300 75 428 69November 52,000 70 8,460 56 317 67
1974 April 52,000 53 8,460 44 386 104
The number of farmers using fertilizers has consistently been higher thananticipated and the same is true for the number of trees fertilized, exceptfor the April 1974 season when farmers had to pay for fertilizers for thefirst time. The application rate has always been in the region of 65-70 gramper tree per season (or 135-140 gram per year), except for the first crop yearand the April 1974 season when higher rates were given. Throughout the projectperiod urea was applied, except in April 1974 when about half of the supplyconsisted of compound NPK 20.10.10 fertilizer. According to ISABU, continuousapplications of pure nitrogen fertilizers result in decreasing yields becauseof shortages of other nutrients. Therefore a NPK 20.10.10 application wasrecommended once every three years. In November 1974 no fertilizers weredistributed; OCIBU had received only one bid and the price of US$445 per tonurea, fob Kigoma, was considered to be too high. FAO, however, supplied 500tons of urea at a subsidized price of US$120 per ton cif Bujumbura in early1975 and about half of this consignnent was distributed to some 23,000 farmersin April 1975.
ANNEX 1Page 3
Yields
6. Unfortunately it is impossible to determine the effect of the firstproject in terms of production increases because yields have not been moni-tored in a systematic manner. The available production statistics for thecountry as a whole suggest that the average annual production of parchmentcoffee over the last 5 years was in the region of 25,000 ton. It is furtherestimated that the total number of coffee trees, including young and unpro-ductive trees, was about 50 million during the same period but the marginof error is considerable. The average production per tree in Burundi wouldthus be in the region of 500 gram parchment per year. A proper break-downof yields according to growing areas is not available, but the quantitiesof parchment purchased in the coffee buying centers over the years 1969-1972suggest that the production per tree in the whole of Ngozi province wasabout 20 gram above the national average of 500 gram. The yield figuresprepared by project managemenit for the area of the first project are scantyand conflicting. According to one set of figures based on yield data col-lected over a 5-year period oin only 12 coffee plantations, good qualitystands with fertilizer appliciations would have yielded about 480 gram pertree and without fertilizer 370 gram. Poor quality stands, either with orwithout fertilizers, produced less than 200 gram per tree. These figuressuggest very low average yields in the project and these cannot be reconciledwith the best estimates of the national coffee production. In a draft paperon the second Project prepared by project management, the average yield pertree in the whole province was estimated at 500 gram and the yield in thearea of the first project at 600 gram per tree. These estimates are probablymore accurate.
7. It is clear that in the absence of reliable yield figures for theproject as a whole, any attempt to disentagle the effects that improvedhusbandry practices and the use of fertilizer might have had on the yieldswould be subject to a large amount of speculation. It is, however, clearthat the appraisal estimates for the first project--200 gram yield increasethrough better husbandry techniques and an additional 200 gram increase pertree from fertilizer--were too optimistic. Information available to theappraisal mission for the first project consisted mainly of the results offertilizers trials which were conducted by ISABU during 1962-1966. Sincethe appraisal of the first project, little additional information has beengathered. A new series of fertilizer trials has been undertaken in Ngoziprovince during the last three years but a full five-year pruning cycle isrequired as a minimum to produce meaningful results.
8. A closer look at the 1962-1966 trials, which were conducted in 6different locations inside Ngozi Province, leads to the conclusion thatyields vary considerably, whether or not fertilizers are applied. The impor-tant determining factors appear to be location and type of soil, the standardof maintenance of the plantations, the stage in the pruning cycle and weatherconditions. The average yield of all control plots (without fertilizers)over the 5 year period was about 680 gram parchment per tree. But the annual
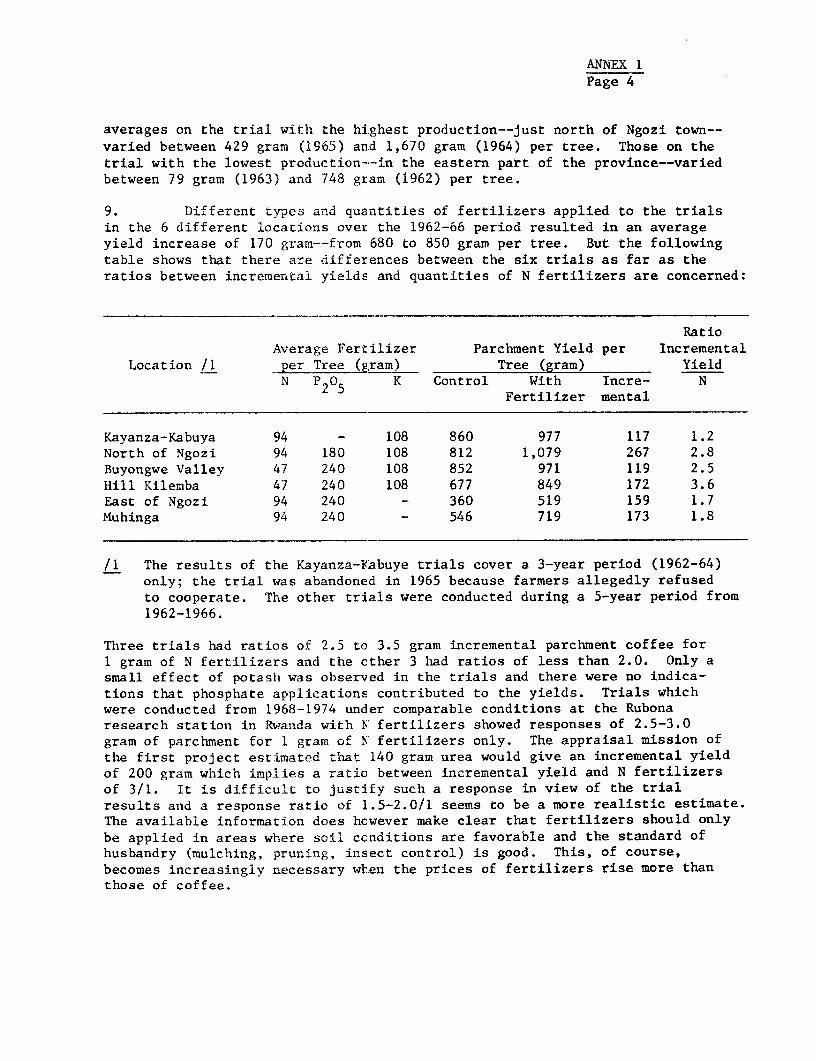
ANNEX 1Page 4
averages on the trial with the highest production--just north of Ngozi town--
varied between 429 gram (1965) and 1,670 gram (1964) per tree. Those on thetrial with the lowest production--in the eastern part of the province--variedbetween 79 gram (1963) and 748 gram (1962) per tree.
9. Different types and quantities of fertilizers applied to the trialsin the 6 different locations over the 1962-66 period resulted in an averageyield increase of 170 gram--from 680 to 850 gram per tree. But the followingtable shows that there are differences between the six trials as far as theratios between incremental yields and quantities of N fertilizers are concerned:
RatioAverage Fertilizer Parchment Yield per Incremental
Location /1 per Tree (gram) Tree (gram) YieldN P2 K Control With Incre- N
Fertilizer mental
Kayanza-Kabuya 94 - 108 860 977 117 1.2North of Ngozi 94 180 108 812 1,079 267 2.8Buyongwe Valley 47 240 108 852 971 119 2.5Hill Kilemba 47 240 108 677 849 172 3.6East of Ngozi 94 240 - 360 519 159 1.7Muhinga 94 240 - 546 719 173 1.8
/l The results of the Kayanza-Fabuye trials cover a 3-year period (1962-64)only; the trial was abandoned in 1965 because farmers allegedly refusedto cooperate. The other trials were conducted during a 5-year period from1962-1966.
Three trials had ratios of 2,5 to 3.5 gram incremental parchment coffee for1 gram of N fertilizers and the cther 3 had ratios of less than 2.0. Only asmall effect of potash was observed in the trials and there were no indica-tions that phosphate applications contributed to the yields. Trials whichwere conducted from 1968-1974 under comparable conditions at the Rubonaresearch station in Rwanda with N fertilizers showed responses of 2.5-3.0gram of parchment for 1 gram of N fertilizers only. The appraisal mission ofthe first project estimated that 140 gram urea would give an incremental yieldof 200 gram which implies a ratio between incremental yield and N fertilizersof 3/1. It is difficult to justify such a response in view of the trialresults and a response ratio of 1.5-2.0/1 seems to be a more realistic estimate.The available information does hcwever make clear that fertilizers should onlybe applied in areas where soil ccnditions are favorable and the standard ofhusbandry (mulching, pruning, insect control) is good. This, of course,becomes increasingly necessary w.en the prices of fertilizers rise more thanthose of coffee.
ANNEX 1Page 5
10. Furthermore, taking into account that large scale fertilization ofroughly one half of the coffee trees in the first project has started around1971 and that it takes a few years before yields increase significantly, thefollowing estimates should not be too far off the mark: before the firstproject 475 gram parchment per tree and at the end of the first project 550gram.
B. Objectives of the Second Project
Project Area
11. The second Project would cover the entire province of Ngozi, includ-ing the area of the first project. It is estimated that some 110,000 farmersin the province grow coffee. On average, each farmer has about 160 treesand the total number of coffee trees in the province can thus be estimatedat 17.6 million. Both the 1962-66 fertilizer trials and informed localopinion suggest, however, that a fair proportion of these trees are grownunder marginally suitable conditions. Soils are a major determining factorin this respect and it is known that some soils are either too poor or notdeep enough to allow for a profitable coffee crop. For planning purposes,it has been estimated that about 12 million coffee trees are grown in "highpotential" areas and the remaining 5.6 million in "low potential" areas.The high potential areas include the entire area of the first project, whichhas about 8.3 million coffee trees, and areas mainly to the west of the firstproject with some 3.7 million coffee trees. The low potential areas arelocated mainly in the southern and eastern parts of the province.
12. It is recognized that the basis for the division of the provincesin high and low potential areas is rather arbitrary. A semi-detailed soilsmap, which will probably be available in 1977, should be helpful in deter-mining the areas with a good potential for coffee growing. But for thepurpose of this appraisal the division into "high" and "low" potential areasis the best that can be made at this time. The high potential areas wouldreceive more attention than the low potential areas. The use of chemicalfertilizers would be restricted to the high potential areas only, but thestandard of insect control would be about the same in both areas.
Coffee Pruning
13. The current system of pruning in Burundi is a three stem system runover a 5 year period. In t:he first year of the cycle two of the three oldstems on the tree are cut off and four or five new suckers are allowed togrow. In the second year, the best three suckers are selected, the othersuckers and the remaining old stem are removed. In the following three yearsonly new suckers and the lower lateral branches are removed. The chief dis-advantage of this system is that it lowers production by about 30% in the
ANNEX 1Page 6
first year and by about 90% in i:he second year. There are also in some areasof Ngozi province marked biennial bearing patterns which are often associatedwith unsuitable pruning systems. A more suitable pruning system, that hasbeen proven in neighboring couni:ries, is one which allows new suckers togrow in the 5th year. In the following year, the first year of the cycle,one of the old stems (or two, ii1 they are both weak and bent over and givea little promise of a good crop` are removed and the best three suckers areselected, and all other suckers are removed. Lateral branches on the oldstem are "handled out" or thinned by the removal of their unproductivetertiaries and twigs to allow more light into the center of the tree, andthe lowest lateral branches are removed to give more space and light to thesuckers. In the second year theb last of the old stems is removed so thatin the following years all the crop will be on the new younger stems; theseare again "handled out" each year and lateral branches raised and thinned.The overall principle of this system is no more complicated than that al-ready practised .and there is no good reason why such a system could not beadopted on the advice of the coffee agronomist to be appointed to the project.Farmers are already used to the idea of pruning coffee and are issued withsecateurs, the most important tcols, which are at present under-utilized,so no radically new techniques bave to be learned--although later, as farmersbecome more experienced, the system can be further improved to become a littlemore sophisticated. The advantage of a system such as this over the exist-ing one is that yields are kept at a more constant level over the wholepruning cycle so that the yield pattern does not give the very marked declinein the second year as is the present pattern in Burundi.
Mulching
14. The purposes of mulchirig are four-fold:
(a) to add organic matter to the soil;
(b) to reduce soil temperature and to conserve moisture inthe soil during dry weather;
(c) to control weed growth; and
(d) to control soil erosion.
Mulching has been practiced in coffee in Burundi for several years and wasgiven considerable emphasis during the first coffee project. As a result,standards of mulching in the Proiect area are high and are well above thestandards in coffee outside. In the Project area mulching is better incoffee fields along tracks than in the fields away from tracks.
15. Because of the pressure on land in Ngozi province, farmers arenot able to find enough natural mulclling material. To alleviate this prob-lem, the first project distribute.d slips of Tripsacum laxum (Guatemala grass)from which farmers can grow theitr own future needs. This has been well

ANNEX 1Page 7
received by the farmers who appreciate the need for it. It is easy to grow,yields well, and can be grown in places where food crops cannot be grown.Even so, the problem of where to plant the mulch has not been entirelyresolved; if it is grown beside the coffee on banks and ridges where othercrops cannot be grown and where it does not have to be carried far it islikely to compete with the coffee, especially for potassium, leading event-ually to potassium deficiency in the soil which will reduce coffee yields.The emphasis on mulching will be maintained in the new Project and farmerswill be encouraged to make the best use they can of available material suchas banana leaves and other crop residues. The Project will continue aslong as it is necessary to make slips available to farmers to grow theirown mulch. Farmers will be encouraged to use the pulp from hand pulpingcenters and washing stations which can be given free and is of benefit inreturning to the soil some of the nutrients taken from it.
Insects
16. The most serious coffee pest in Burundi is the antestia insect(Antestia lineaticollis) which damages the beans, causing them to be down-graded in quality. Antestia is at present controlled by dusting the treeswith a DDT-Malathion mix supplied to the farmers free of charge by OCIBU.This method does not seem fully effective, however, and the very large numberof insect-damaged beans causes concern. As stated above (para 2), a propor-tion of the insecticide is used by the farmers in their homes, and the insectcounting system used by the project staff is not particularly effective inproviding a check on whether control measures are working.
17. Apart from antestia, the coffee is infested with berry borerswhich also damage the beans and in fact cause more losses than antestia. Itis unusual for borers of this type, i.e. Stephanoderes spp., to be presentin such large nunbers in coffee grown at this altitude since Stephanoderesare usually found at lower altitudes. It is possible that the increasingincidence of berry borers is due to the destruction of their natural predatorsby use of DDT-Malathion. Another insect pest common in coffee in Burundi isthe fruit-fly. It is believed that this is a vector for the bacteria prod-ucing potato-taste and other off-flavors in coffee which cause coffee to bedown-graded for quality and for which Burundi coffees have acquired an un-desirable reputation.
18. The Project insect control measures should be reviewed by theproject coffee agronomist in consultation with the research team. In parti-cular more accurate insect counts should be made. A simple technique is tospread a sheet round the base of the tree, cover the tree with another sheetand spray inside the tree with a knockdown insecticide such as pyrethrum.If regular and frequent counts are made on a proper random sample of treesa fairly accurate picture of insect populations can be obtained. Considera-tion should also be given to using a more specific insecticide of whichseveral types are available commercially. Provision has been made in theProject for spraying teams equipped with motorized sprayers or dusters (there

ANNEX 1Page 8
are areas where lack of suitable water supplies make it difficult to usesprayers) who would visit all farmers in turn. For control of fruit-flies,specific baits can be used, but more knowledge is needed about the speciesof flies present before a successful eradication campaign can be carriedout. This is one of the topics which would be covered by the ISABU coffeeresearch component of the Project. At the end of the harvesting season allfruit should be stripped from the tree, regardless of quality, so as to removethe hosts for pests and disease which could carry on to the next season.This requires careful explanation by extension workers, if farmers are notto become confused, as it is exactly contrary to the policy of selectivepicking that is encouraged durirLg the harvest season and it will no doubttake time before it becomes accepted and practised by the farmers.
Diseases
19. At present there are no serious disease problemns in Ngozi. Leafrust (Hemilea vastatrix) is present but is fairly readily controlled inneighboring countries. Coffee berry disease (Colletotrichum coffeeanum)is also present but is not a serious problem at this time.
Fertilizers
20. Farmers and extension staff alike considered the distribution offertilizers as one of the major purposes of the first project which isreflected in its local title "Project d'Application d'Engrais." A carefulapproach towards the use of fertilizers is, however, appropriate and therelationships between coffee prices--both farm gate and export--and fertil-izer prices should be closely waLtched. These relationships have deterioratedover the last few years. Besides, the response to fertilizers is unlikelyto be as high as anticipated when the first project commenced. Assumingthat,
(a) two years of straight N applications would be followed bya one year's application of compound NPK, 20.10.10;
(b) the ratio between incremental quantity of parchment coffeeand quantity of N fertilizers would be 2:1 if fertilizersare applied to coffee plantations which are well maintainedas far as pruning, mulching, and insect control is concerned;
'c) the 1974 farm gate price of FBu 44 (US$0.56) per kg parchmentcoffee would remain unchanged; and
(d) using the IBRD/IDA price projections in constant 1975 termsfor both fertilizers and coffee as a base and assuming that thefarmer would have to pay the full costs of the fertilizers;
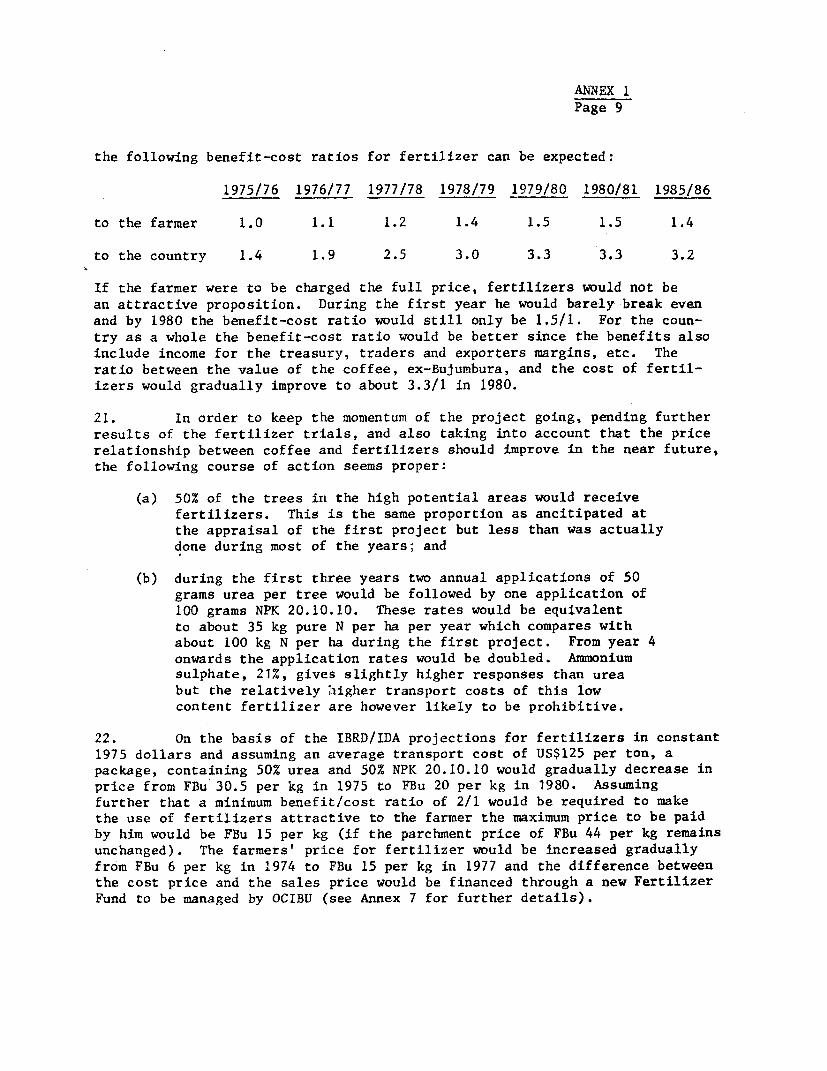
ANNEX 1Page 9
the following benefit-cost ratios for fertilizer can be expected:
1975/76 1976/77 1977/78 1978/79 1979/80 1980/81 1985/86
to the farmer 1.0 l.1 1.2 1.4 1.5 1.5 1.4
to the country 1.4 1J.9 2.5 3.0 3.3 3.3 3.2
If the farmer were to be charged the full price, fertilizers would not bean attractive proposition. During the first year he would barely break evenand by 1980 the benefit-cost ratio would still only be 1.5/1. For the coun-try as a whole the benefit-cost ratio would be better since the benefits alsoinclude income for the treasury, traders and exporters margins, etc. Theratio between the value of the coffee, ex-Bujumbura, and the cost of fertil-izers would gradually improve to about 3.3/1 in 1980.
21. In order to keep the momentum of the project going, pending furtherresults of the fertilizer trials, and also taking into account that the pricerelationship between coffee and fertilizers should improve in the near future,the following course of action seems proper:
(a) 50% of the trees iri the high potential areas would receivefertilizers. This is the same proportion as ancitipated atthe appraisal of the first project but less than was actuallydone during most of the years; and
(b) during the first three years two annual applications of 50grams urea per tree would be followed by one application of100 grams NPK 20.10.10. These rates would be equivalentto about 35 kg pure N per ha per year which compares withabout 100 kg N per ha during the first project. From year 4onwards the application rates would be doubled. Ammoniumsulphate, 21%, giveis slightly higher responses than ureabut the relatively higher transport costs of this lowcontent fertilizer are however likely to be prohibitive.
22. On the basis of the IBRD/IDA projections for fertilizers in constant1975 dollars and assuming an average transport cost of US$125 per ton, apackage, containing 50% urea and 50% NPK 20.10.10 would gradually decrease inprice from FBu 30.5 per kg in 1975 to FBu 20 per kg in 1980. Assumingfurther that a minimum benefit/cost ratio of 2/1 would be required to makethe use of fertilizers attractive to the farmer the maximum price to be paidby him would be FBu 15 per kg (if the parchment price of FBu 44 per kg remainsunchanged). The farmers' price for fertilizer would be increased graduallyfrom FBu 6 per kg in 1974 to FBu 15 per kg in 1977 and the difference betweenthe cost price and the sales price would be financed through a new FertilizerFund to be managed by OCIBU (see Annex 7 for further details).

ANNEX 1Page 10
Yields
23. The following coffee parchment yields have been used in this report:
Gram per Tree Kg per HaWithout With Without WithProject Project Project Project
Area First Project 515 575 825 920
Other High Potential Areas 475 575 760 920
Low Potential Areas 425 450 680 720
Actual yields in the area of the first project are estimated at 550 gram pertree (825 kg per ha). All costs of the extension staff for the area of thefirst project are covered by the second Project in order to further improvethe standards of coffee husbandry and to increase the productivity of foodcrops. The "Without Project" case would therefore be characterized by theabsence of any staff and a discontinuation of fertilizer supplies. This wouldresult in a yield reduction estimated at about 35 gram per tree (55 kg perha) compared with actual yields. Full development yields in the area of thefirst project would be reached in year 5, in the other high potential areasin year 7 and in the low potential areas in year 6. Annual production esti-mates are given in Annex 12, Table 5.
C. Coffee Research Program
24. The national agricultural research institute, ISABU, was establishedafter independence and it inherited four small experimental stations createdin Burundi by the INEAC 1/ which was responsible for agricultural research lnthe former Belgian Congo and Ruanda-Urundi. The main station serving Ruanda-Urundi and parts of Congo's Kivu province was located at Rubona, Rwanda, andthis well equipped and staffed station is now the center of Rwanda's nationalresearch institute, ISAR. ISABU is, however, understaffed in most technicaland scientific departments and so far it lacks adequate facilities. Priorto the appraisal of this Project, Belgium has made a commitment to financethe construction of central laboratories and administrative facilities inBujumbura.
24. In spite of the overwhelming importance of coffee production forthe country's economy, ISABU has s0 far not been able to assign a particularteam for concentrated research onl this single crop. This situation is
Il Institut National pour I'Etude Economique au Congo.

ANNEX 1Page 11
responsible for the almost total lack of accurate information on the basicfactors affecting yields and quality of the coffee production. The Projectwould therefore assist ISABIU in launching an adequate coffee research programand finance a 2-man expatriiate research team, the construction of staff housesand the purchase of equipment required for ISABU's new central laboratoresin Bujumbura.
26. The coffee research program would cover the following subjects:
(a) Agronomy
- Mulching: sources and qualities of various mulching materialsavailable in the coffee growing areas; introduction of newmaterials.
- Pruning: experiments with different types and cycles ofpruning.
- Varieties: comparative trials with existing and new varieties.
- Fertilizer: evaluation of existing trial results and furtherfield trials in conjunction with soil and foliar analysis,including a breakdown in the quality aspects of yields (numberof berries. density and size distribution of green beans,foliar density, leaf size distribution, internodal growth, etc.).
(b) Entomology
- Identification and distribution of all insect pests withinthe Project area, covering crops which are grown in closeassociation with coffee.
- Means of controlling major insect pests.
(c) Phytopathology
- Identification and distribution of potentially harmfulfungus diseases.
- Means of controlling fungus diseases.
(d) Pedology
- Correlations between soil types and yields in coffeeplantations.
ANNEX 1Page 12
(e) Microbiology
- Investigations of the causative formation and cure of"potato taste" and other off-flavors.
July 8, 1975
I

A@NEX 2Page i
BURUNDI
SECOND COFFEE IMPROVEMENT PROJECT
Coffee Processing
The Traditional Process
1. Climatic conditions in Burundi during the coffee harvest season,April to July, do not permit coffee to be dried after picking without sepa-ration of the cherry from the bean as, in absence of warm dry weather, thefruit would rot on the bean and spoil it. Traditionally therefore Burundicoffee has been processed by methods that produce a semi-washed coffee.After it is picked, the cherry is pulped to remove the outer skin and partof the flesh of the fruit. This is either done by hand (squeezing) or bytrampling on the fruit to remove the bean, or in one of the 325 hand-poweredmechanical pulpers which were built prior to Burundi's independence. Thebeans are 'then washed to remove adhering bits of skin and mucilage, anddried in the sun; the resulting dried beans are known as parchment coffeeand are sold in this form to local traders.
2. The quality of coffee produced by the traditional process is poor.The pulping process is incomplete even in the hand pulpers as all cherries,regardless of size, pass through the same pulper. The smaller unripe beansare not pulped at all and the larger ones may be damaged by the pulper.There is no sorting of cherries before pulping so poor and better qualitycherries are pulped together. A certain amount of mucilage sticks to thebeans even after washing and ferments on the beans. The parchment coffee isinsufficiently dried and has to be further dried before hulling. Coffeewith a high moisture content favors the spread of micro-organisms thatproduce off-flavors.
The Fully-washed Process
3. Coffee washing stations of the type built under the first projectaim to improve the quality of the parchment by closer quality control andmore thorough washing and drying. Before cherries are pulped, they aregraded into two qualities and are pulped separately. They pass throughthe pulper and are then sorted again by a mechanical grader into those whichfloat and those which sink (the better quality). Any cherries which passthrough the first pulper without being pulped go through another small pulper.The pulp is carried off and deposited, and the beans are carried into con-crete tanks where they are allbowed to ferment. This breaks down the remain-ing mucilage and after fermentation the coffee is washed carefully until itis clean and free of all mucilage, then it is soaked under water for atleast 12 hours. This kills off any insect larvae that could be beneath the
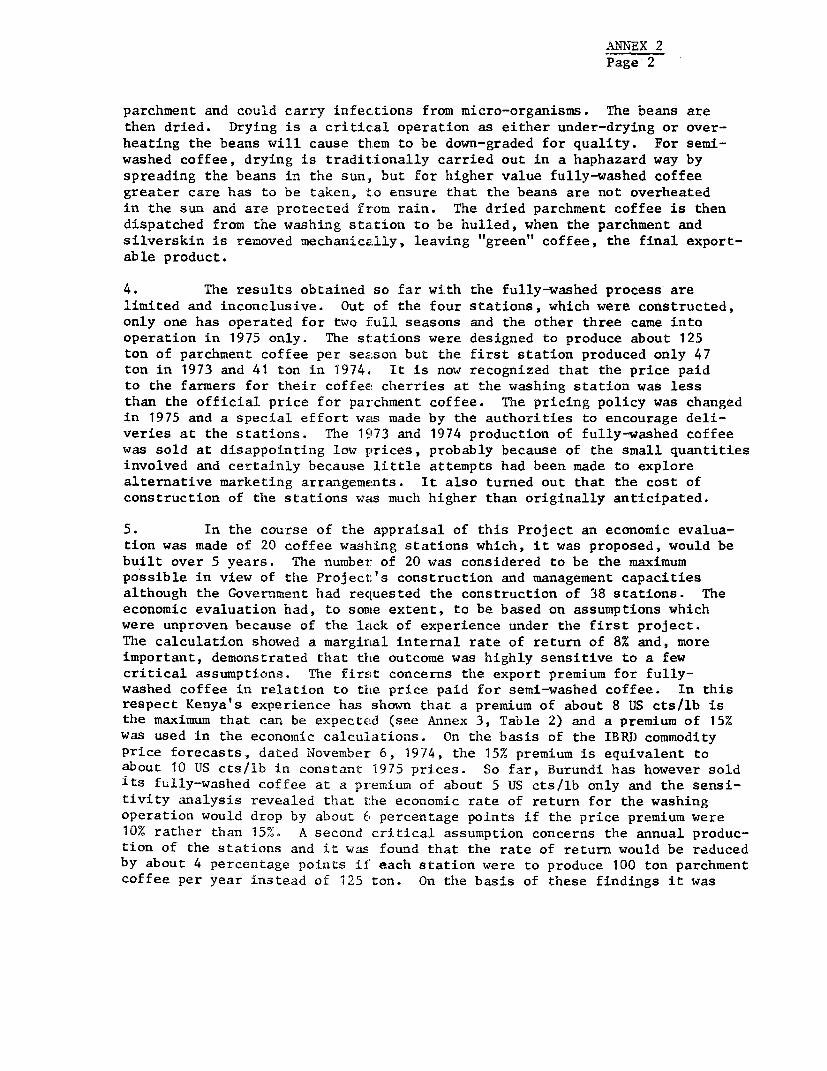
ANNEX 2Page 2
parchment and could carry infections from micro-organisms. The beans arethen dried. Drying is a critical operation as either under-drying or over-heating the beans will cause them to be down-graded for quality. For semi-washed coffee, drying is traditionally carried out in a haphazard way byspreading the beans in the sun, but for higher value fully-washed coffeegreater care has to be taken, to ensure that the beans are not overheatedin the sun and are protected f rom rain. The dried parchment coffee is thendispatched from the washing station to be hulled, when the parchment andsilverskin is removed mechanically, leaving "green" coffee, the final export-able product.
4. The results obtained so far with the fully-washed process arelimited and inconclusive. Out of the four stations, which were constructed,only one has operated for two full seasons and the other three came intooperation in 1975 only. The stations were designed to produce about 125ton of parchment coffee per season but the first station produced only 47ton in 1973 and 41 ton in 1974. It is now recognized that the price paidto the farmers for their coffee cherries at the washing station was lessthan the official price for parchment coffee. The pricing policy was changedin 1975 and a special effort was made by the authorities to encourage deli-veries at the stations. The 1973 and 1974 production of fully-washed coffeewas sold at disappointing low prices, probably because of the small quantitiesinvolved and certainly because little attempts had been made to explorealternative marketing arrangements. It also turned out that the cost ofconstruction of the stations was much higher than originally anticipated.
5. In the course of the appraisal of this Project an economic evalua-tion was made of 20 coffee washing stations which, it was proposed, would bebuilt over 5 years. The number of 20 was considered to be the maximumpossible in view of the Project's construction and management capacitiesalthough the Government had recquested the construction of 38 stations. Theeconomic evaluation had, to soine extent, to be based on assumptions whichwere unproven because of the lack of experience under the first project.The calculation showed a marginal internal rate of return of 8% and, moreimportant, demonstrated that the outcome was highly sensitive to a fewcritical assumptions. The first concerns the export premium for fully-washed coffee in relation to tne price paid for semi-washed coffee. In thisrespect Kenya's experience has shown that a premium of about 8 US cts/lb isthe maximum that can be expected (see Annex 3, Table 2) and a premium of 15%was used in the economic calculations. On the basis of the IBRD commodityprice forecasts, dated November 6, 1974, the 15% premium is equivalent toabout 10 US cts/lb in constant 1975 prices. So far, Burundi has however soldits fully-washed coffee at a premium of about 5 US cts/lb only and the sensi-tivity analysis revealed that the economic rate of return for the washingoperation would drop by about 6, percentage points if the price premium were10% rather than 15%. A second critical assumption concerns the annual produc-tion of the stations and it wa-c found that the rate of return would be reducedby about 4 percentage points if each station were to produce 100 ton parchmentcoffee per year instead of 125 ton. On the basis of these findings it was

ANNEX 2Page 3
concluded that a large scale investment program in washing stations couldnot be justified at the present time and that a further trial period wouldbe appropriate.
6. The Project would provide further technical assistance for theoperation of the 4 existing stations for a period of 3 years. This timeperiod would be long enough to bring all 4 stations on stream and to estab-lish adequate cherry buying, station operation and marketing procedures.A further trial period would also be appropriate to establish to what extentand at what cost the capacity of the stations can be expanded. There areindications that sufficient coffee is being grown in the vicinity of thestations to allow for a production of 150-175 ton parchment coffee per seasonand that relatively little additional investment, mainly in drying areas,would be required to increase the capacity of the stations to that level.Since most of the operating costs of the stations are fixed this wouldimprove their rate of return.
7. The Project would a]Lso support the construction of 4 new stationsas an extended trial. The new stations would be of a simpler and less ex-pensive design than those buiLt previously. Savings should also be possiblethrough the construction of the new stations by force account, rather than bya contractor, since the lack of competition in the remote Project area tendsto increase construction costs.
8. The fully-washed coffee to be produced during the trial periodshould be consistently of a good quality to allow Burundi to establish afavorable market reputation. A price premium of the order of about 10 UScts/lb fob Dar-es-Salaam, combined with a production of about 150 ton parch-ment coffee per station would probably be the minimum required to justifyfuture investments in washing stations. Since it is uncertain that theseobjectives will be reached during the extended trial period the Projectwould also investigate alternative methods to increase the quality andhence the export value of cofEee. These alternatives could include improvedhand pulpers, possibly combined with centralized drying facilities. Themain objective for the trial period would thus be to gain experience withvarious alternatives which could provide a sound basis for future investmentdecisions on coffee processing facilities.
July 1 1975

ANNEX 3Page 1
BURtJNDI
SECOND COFFEE IMPROVEMENT PROJECT
Coffee Marketing and Prices
The World Market
1. The latest IBRD review of world coffee market prospects (April 1975),which pre-dates the severe frost damage to Brazil's 1975 coffee crop, con-cludes that coffee prices will recover from the low levels of 1974/75 andthat heavy surpluses with resultant low prices are not anticipated duringthe 1980's. Although the growth of world demand is expected to slow to 1.5percent per annum in 1972-80 and 2.4% per annum from 1980-85, compared with2.8% per annum in the 1960s, production in Brazil, which is by far the mostimportant factor influencing world prices, is not likely to be able to main-tain its share of the export market because of increasing domestic demand.
2. Production policy was controlled by the International CoffeeAgreement (ICO) until the agreement expired in September 1973. Negotiationsfor a new agreement have not yet been concluded. So far there is no evidencethat expiry of the agreement has led to large scale plantings similar tothose implemented in the 1950's and 1960's which produced surpluses andcaused wide price fluctuations. In 1974, however, coffee prices droppedsharply and remained depressed in the first half of 1975, because of excellentcrops in the main producing countries combined with a slow demand which isthought to be related to the stagnation in the growth of real incomes in the'United States and Western Europe. The IBRD commodity forecast of 27th May,1975 for Guatemala prime washed coffee, spot New York, shows that prices in1973 constant dollar terms will return by 1978 to approximately the 1973level (63 US cts/lb) and increase slightly thereafter (Table 1).
Burundi Coffees
3. Prices for Burundi's se:ni-washed arabica coffees have closelyfollowed the trends for other cofEees of comparable standard in the worldmarket and since Burundi is a small scale producer with no power to influencemarket trends there is no reason to suppose that this relationship will change..En other words, forecasts for world market prices can be taken as forecastsfor Burundi prices, too. In the :?ast, Burundi has not produced fully-washedcoffees except in very small quantities; it has not therefore been possibleto determine a historical pattern of price trends for Burundi fully-washedcoffee. The evidence so far produced, comparing Burundi fully-washed coffeewith Kenya coffee, shows that it would be reasonable to expect Burundi fully-washed to sell at a premium of about 8 US cts/lb over semi-washed coffee

ANNEX 3Page 2
(Table 2). A few more years experience is, however, essential and it ishoped that sales of fully-washed coffee from the existing project washingstations will provide some more certain answers.
Coffee Exports in Burundi
4. As local consumption of coffee in Burundi is negligible almost allcoffee produced in the country is exported. Export statistics are confusedby significant quantities illegally entering and leaving the country throughneighboring countries but the moving average export over five years up to 1973has been about 20,000 ton a year of which all except for some 1,500 ton ofRobusta, is Arabica (see Table 3). Exports have been rising at about 3.75%per annum but Burundi's share of the world market is still less than 0.8%.Exports of semi-washed coffee are arranged by private exporters 1/. Exportsales are made on the basis of international bidding, organized and evaluatedby OCIBU. Established buyers of Burundi coffee are notified by telex, indi-cating quantity and quality, of a forthcoming sale and are invited to makebids. Prices are compared with current international quotations and, if judgedacceptable, OCIBU approves the sale, usually giving the contract to thehighest bidder. Foreign bids often indicate the preferred exporter; incases where no particular lexporter is specified, OCIBU makes the exportallocation itself. Quality standards are those established since beforeindependence by the Office des Cafes Indigenes du Ruanda-Urundi (OCIRU) andare the internationally recognized standards on the basis of which exportsales are inade. Fully-washed coffee produced in the new washing stationsand by the Butegana cooperative is exported by OCIBU itself.
Price Structure
5. Before the beginning of each coffee season, the Coffee Board estab-lishes the various margins to be paid from the proceeds of coffee sales tothe producers, the exporters and OCIBU. Government is heavily dependent oncoffee exports for its revenues and the residual balance, after payments havebeen made to other parties, goes to the Government. The amounts of deductionsare calculated for each price level on a sliding scale; that for the 1974/75season is shown in Table 4. The price paid to producers is fixed for thewhole season and does not vary according to final export prices. Likewisefixed deductions are made for trader's commission, costs of transport,hulling, bagging, etc., and to cover OCIBUT's normal operating overheads.Deductions are also made for a coffee promotion tax, a diversification tax(formerly paid to ICO but now paid to a Government fund for agricultural
1/ Changes in the current system are expected following the establishmentof a new export compamy, the Burundi Coffee Company, in April 1975. Themajority of the shares (55%) of the Company are owned by the BurundiGovernment, the Central BAnk and OCIBU, and the balance (45%) by theformer private exporters.

ANNEX 3Page 3
development), a selection tax to pay for improved coffee planting materials,and a tax to cover Government's contribution to the cost of the ongoing firstcoffee improvement project. In addition to these fixed amounts, deductionsare made for the exporter's margin and insurance and bank charges as a per-centage of the fob price. The balance goes to Government, to be allocatedbetween the Treasury and the Coffee Stabilization Fund. Table 5 shows thepast distribution of sales proceeds and it may be expected that future dis-tribution of gross earnings wilL follow similar patterns.
July 1, 1975

BURUNDI
SECOND COFFEE IMPROVEMENT PROJECTDEUXIEME PROJET D'AMELIORATION DE LA PRODUCTION DE CAFE
Coffee Price ForecastsPr<'visions des Prix de Café
Guatemala 1/ Burundi 2/
Prime Washed Semi-WashedPremière qualité Semi-lavé
US cts/lb US cts/lb US cts/lb FBu/kgcts EU/livre cts EU/livre cts EU/livre
(1973) (1973) 3/ (1975) 4/ (1975) 5/
1975 44 37 50 861976 53 46 62 1071977 60 53 71 1231978 63 56 76 1301979 63 56 76 1301980 63 56 76 1301985 65 58 78 135
1/ IBRD projections in 1973 constant prices,spot New York. 1/ IBRD prévisions à prix constants de 1973,spot N.Y.,2/ fob Dar-es-Salaam; deductions of 5.5 US cts/lb for 2/ fob Dar-es-Salaam; réductions de 5.5 cts
transport costs Dar-es-Salaam - New York and 1.5 US EU/livre coût de transport Dar-es-Salaam-N.Y.cts/lb for quality differential. et 1.5 cts EU/livre pour différence de qualite'.
3/ 1973 constant prices. 3/ A prix constants de 1973.4/ 1973 prices multiplied by inflation factor 1.349 4/ Prix de 1973 multipliés par facteur d'inflation
to arrive at 1975 constant prices. de 1.349 enfin d'arriver à prix constants de 1975.5/ 1975 constant prices. 5/ A prix constants de 1975.
t- Jy XJuly 1, 1975 -- e
tum
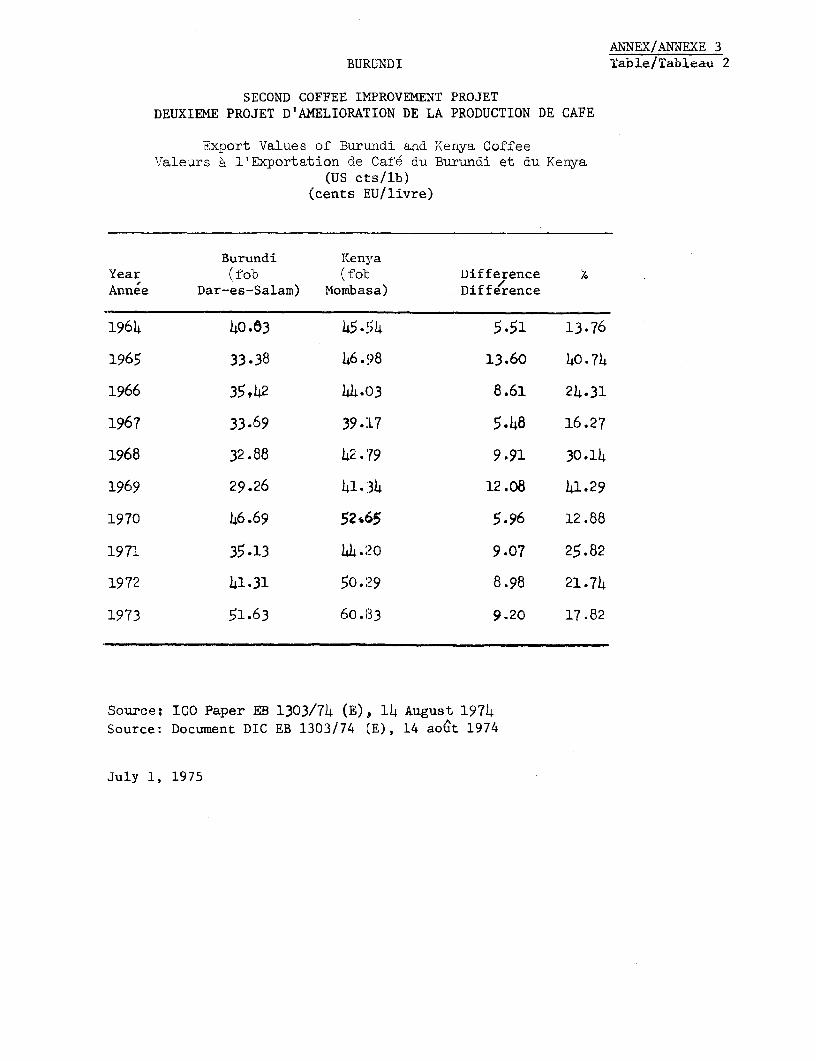
ANN EX/ANNEXE 3BURUNDI Table/Tableau 2
SECOND COFFEE IMPROVEMENT PROJETDEUXIEME PROJET D'AMELIORATION DE LA PRODUCTION DE CAFE
Export Values of Burundi and Kenya CoffeeValeurs à l'Exportation de Café du Burundi et du Kenya
(US cts/lb)(cents EU/livre)
Burundi Kenya
Year (fob (fot DifferenceAnnée Dar-es-Salam) Mombasa) Difference
1964 408.3 45.54 5.51 13.76
1965 33.38 46.98 13.60 40.74
1966 35,42 44.(3 8.61 24.31
1967 33-69 39.L7 5.48 16.27
1968 32.88 42.'79 9.91 30.14
1969 29.26 41..34 12.08 4L.29
1970 46.69 52*65 5.96 12.88
1971 35-13 4h.420 9.07 25.82
1972 41.31 50.29 8.98 21.74
1973 51.63 60.-33 9.20 17.82
Source: ICO Paper EB 1303/74 (E), 14 August 1974Source: Document DIC EB 1303/74 (E), 14 aoCt 1974
July 1, 1975

ANNEX/ANNEXE 3Table/Tableau 3
BURUNDI
SECOND COFFEE IMPROVEMENT PROJECTDEUXIEME PROJET D'AMEL:EORATION DE LA PRODUCTION DE CAFE
Coffee Exports per Calendar YearExportations de Café par Armée Civile
(ton green coffee)(tonaes de café vert)
Year 5 Year Moving AverageAnnée Arabica Kobusta Total Moyenne mobile sur
cinq ans
1960 9,991 278 10,269
1961 13,077 283 13,360
1962 13,001 185 13,186
1963 5,777 205 5,.82
1964 17,737 534 18J271 12,214
1965 12,831 766 13,597 12,879
1966 14,071 693 14,764 13,160
1967 17,900 938 18,838 14,290
1968 15,929 1,078 16,607 16,415
1969 13,370 1,272 14,642 15,690
1970 19,141 843 19,984 16,967
1971 18,302 805 19,107 17.8ae
1972 22,224 1,956 24,180 18,904
1973 21,278 1,383 22,661 20,115
Source: Bank of the Republic of Burundi, annual reports.
Source: Rapports annuels de la Banque de la République du Burundi
July 1. 1975

BURUNDI
SECOND COFFEE IMPROVEMENT PROJECT
Coffee Price Sliding, Scale - Camapaign ti/t/(Decision OCIBU'e Board Meeting April 8 and 24, 1974)
Fixed Components FBu OCIBU Taxes3 FBu
per ton per ton B/F 69,989
Produlcers FBu 45/12. x 1,000 x i.3333/ 59,999 Remuneratory Tax 4,100
Traders comimission FBu 2/kG x 1,000 x 1,3333 2,667 Promotion Tax 307
Financing charges 1,271 Project 147-BU Tax 450
Sundry: Diversification Tax 750
Transport Hulling Factory to Selection Tax 40 5,647
OCI3U warehouse 100
Tratnsport OCIBU to Dar-Es-Sala:. 3,000 Total Fixed Components FBa 75,636
Processing:Dryirng FBu 400 4/
Processinà 6 adi Waging 2/ FBu 1,600 2,000 Provision collected for Stabilization Fund Tax:- Fbu 2,900/r.on
Bags FBu 57 x 16.7- 952 Provision collected for Custom Duties FBu 23,075/ton
Provision collected by Central Bank to adjust Custom duties,69,989 Stabilization Fund Tax and Exporters dues when the exact
*mn-Ont offorreign cu-rrc0/ciec invotvcd i repàtrieted -- -------- on
Price FOB - Dar-Es-Salam US cts/lb 63 63.5 64 64.5 65 65.5 66 66.5 67 67.5 - - - - 75
Combined price ( x 0.97980)- US gys/lb 61.73 62 22 62.71 63.20 63.69 64.18 64.67 65.16 65.65 66.14 73.49
Value of 1 metric ton ( x 1.7273- ) 106,626 107,473 108,319 109,165 110,012 110,858 111,704 112,551 113,397 114,244 - - - - - 126,939
Exporters Reemuneration (4%)7/ 4,2h5 4,299 4,333 4,367 4,400 4,434 4,468 4,502 4,536 4,570 - - - - - 5,078
Insurance (0.001683 of metric ton value) 179 181 182 184 185 187 188 189 191 192 - - - - - 214
Bank collection charges 570 575 580 584 589 593 598 602 607 611 - - - - - 679
(0.0535 of metric ton value) 570 575 580 584 589 593 598 602 607 611 - - - - - 679
Fixed components8/ 75,636 75,636 75,636 75,636 75,636 75,636 75,636 75,636 75,636 75,636 - - - - - 75,636
Balance te be distributed to GoverasentTreastury and Stabilization Funds9_i 25,976 26,782 27,588 28,394 29,202 30,008 30,814 31,622 32,427 33,235 - - - - - 45,332
1/ The processing operation renuires an average of 1.3333 kg of parchment coffee to obtain 1 kg of green coffee. The processing yield ratio averages 75%.
2/ One coffee bag weighs 60 Kg. The bagging of one ton of coffee renuires 16.7 bags.
3/ OCIBU Taxes are based on the number of tons exported and not on the,export price fob D.E.S. (D.E.S. = Dar-Es-Salam).
4/ Provisions for Custom duties and Stabilization Fund Tax are based on the net actual foreign currencies enuivalent to the fob D.E.S. export price.
5/ 0.97980 = weighted average of tons exported by ouality during the last three years. Ex: 0.97980 x US cts 63 = US cts 61.736/ One metric ton = 22,046 pounds; 1 US $ = FBu 78.35. 22,046 x 78.35= 1.7273. Ex: US ets 61.73 x 1.7272 = 106,626
7/ 4% of fob D.E,S. export price per ton.8/ Based on factors independent from the fob D.E.S. export price. This amount remains unvariable all over the campaign whatever the fob price fluctuations.
9/ If the total actual custom duties and Stabilization Fund Tax exceeds this balance, Central Bank completes the amount renuired by using the adjustment
provision of FBu 11,000/ton initially collected from exporters, and gives back the remainder to exporters. In theopposite case Central Bank refunds the difference te
exporters together with the adjustment provision.
January 23, 1975
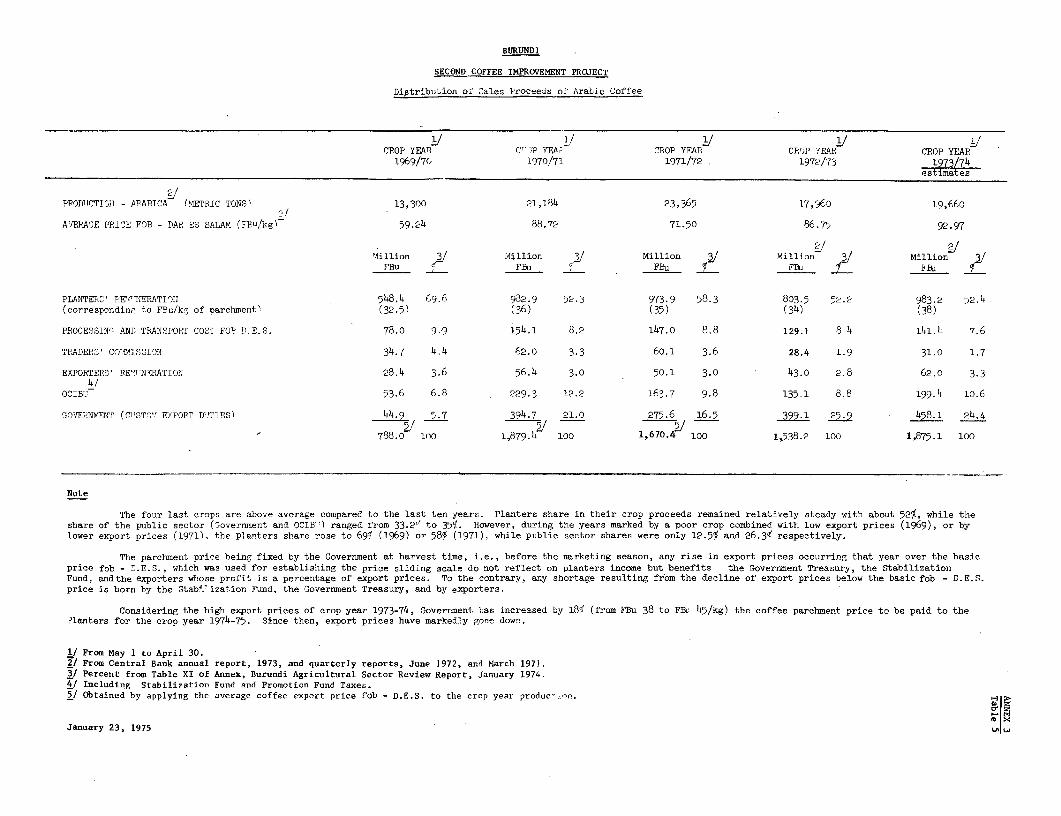
BURUNDI
SECOND COFFEE IMPROVEMENT PROJECT
Distribution of Cales Rroceeds of Arabie Coffee
CROP YEAR C' :P YEAP- CROP YFAR CROP YEAR CROP YEAR1969/7C 1970/71 1971/72 1972/73 1973/74
estimates
PPODIJCTIOII - ARABICA (ME-RIC TONS) 13,300 21,184 23,365 17,960 19,6602/
A-ERAGE PRICE FOB - DAR ES SALAM (FEu/kg) 59.24 88.72 71.50 86.75 92.97
Million 3 Million J Million 3/ Million J Million 3FBu C FBu _ FEu _ FBu _ FBu C
PLANTEPZ' p9p.Aî 548.4 69.6 982.9 52.3 973.9 58.3 803.5 52.2 983.2 52.4(corresponding to FEu/kg of Darchment) (32.5) (36) (35) (34) (38)
PROCESSIN'Q AND TRANSPORT COST FOB D.E.S. 78.0 9.9 154.1 8.2 147.0 8.8 129.1 8 4 141.4 7.6
TRADERS' C0'ISCION 34.7 4.4 62.0 3.3 60.1 3.6 28.4 1.9 31.0 1.7
EXPORTERS' RE'lNERATIOl 28.4 3.6 56.4 3.0 50.1 3.0 43.0 2.8 62.0 3.34/
OCIBU 53.6 6.8 229.3 12.2 163.7 9.8 135.1 8.8 199.4 1o.6
GOVEP.NEmnT (C'STO'.! EXPOBT DaTlES) 44.9 5.7 394.7 21.0 275.6 16.5 399.1 25.9 458.1 24.4
5/~~~~~~~~~~~~2788.0 1iD 1,879.4 100 1,670.4 100 1,538.2 100 1,875.1 100
Note
The four last crops are above average compared to the last ten years. Planters share in their crop proceeds remained relatively steady with about 52%, while theshare of the public sector (Sovernment and OCIB7') ranged from 33.2` to 35%. However, during the years marked by a poor crop combined with low export prices (1969), or bylower export prices (1971). the planters share rose to 69d (1969) or 581, (1971), while public sector shares were only 12.5% and 26.3< respectively.
The parchment price being fixed by the Governiment at harvest time, i.e., before the marketing season, any rise in export prices occurring that year over the basicprice fob - D.E.S., which was used for establishing the price sliding scale do not reflect on planters income but benefits the Government Treasury, the StabilizationFund, andthe exporters whose profit is a percentage of export prices. To the contrary, any shortage resulting from the decline of export prices below the basic fob - D.E.S.price is born by the Stab4P ization Fund, the Goveronent Treasury, and by exporters.
Considering the high export prices of crop year 1973-74, Government has increased by 18! (from FBu 38 to FBu, 45/kg) the coffee parchment price to be paid to the?lanters for the crop year 1974-75. Since then, export prices have markedly gone down.
1/ From May 1 to April 30.2 From Central Bank annual report, 1973, and quarterly reports, June 1972, and Miarch 1971.2/ Percent from Table XI of Annex, Burundi Agricultural Sector Review Report, January 1974.4/ Including Stabilization Fund and Promotion Fund Taxes.5/ Obtained by applying the average coffee export price fob - D.E.S. to the crop year produc.on.
January 23, 1975

ANNEX 4Page 1
BURUNDI
SECOND COFFEE IMPROVEMENT PROJECT
Food Production -
Introduction
1. Because of its high population density Burundi is obliged topreserve and improve its land resources and to develop food productioncapacity through intensification of cultivation techniques in order tomeet the growing requirements for food stuffs. This is particularly truefor Ngozi province, which has a higher population density (270 per km2)than any of the other 6 provinces. Efforts to increase coffee productionshould therefore be accompanied by attempts to raise the productivity offood crops. Fairly detailed information is available on the crops whichare grown in Ngozi and on the level of nutrition of the population. Thereare many sound ideas as to how food production can be improved and soilconservation practised. But thus far experience in these fields is verylimited and agricultural extension work for all practical purposes isrestricted to coffee growing only.
Food Crops
2. A typical Ngozi farm family cultivates no less than 20 to 25different pieces of land measuring on average less than 400 m2 and whichtotal about 85 ares (0.85 ha) c,f cultivated land per family. Some 80 aresare usually located on ths hills which can be cultivated all year round, theremaining 5 ares being in the valley bottom marshes which are cultivated inthe main dry season only. Since the 1966 revolution nearly all farmers havecustomary land ownership rights.
3. Food crops are grown on about 75 ares and the other 10 aresare cultivated with coffee. BaLnana and cassava are the two importantannual food crops and beans, sweet potatoes and maize are the main sea-sonal crops. Only about 10% - 15% of the food crops is cultivated inpure stands and the remainder is intercropped with one or more othercrops. This is traditionally clone as a hedge against crop failure.More than 250 different crop mixtures, sometimes involving up to 5
1/ This Annex draws heavily on two excellent studies made by SEDES ofParis, France:
- Enquete Statistique Agricole 1967 dans la Region de Ngozi etGitega, 1969;
- Enquete Statistique Alimentaire et Budgetaire 1970-1971 dans laRegion Ngozi et Muyinga, 1973.

ANNEX 4Page 2
different crops, have been counted in Ngozi province. Important mixtureson the hills during the long rain season (February/March - June) are beansand banana, beans and a rootcrop (sweet potatoes or cassava), bananas and
a rootcrop; and beans, banana and a rootcrop. Beans and maize are verycommonly intercropped during the long rain season (October-December) on thehills and the dry season (August - November) in the marshes.
4. Mhen counted separately, the ares of different crops add up toabout three times the size of the plots. A typical cropping pattern on anaverage 85 ares farm is as follows:
Location Period Crop Area (ares)
Hills Annual Coffee 10Banana 36Cassava 30 76
Hills Long Rain Season Sweet Potato 44Beans 31Sorghum 9Others 9 93
Hills Short Rain Season Beans 29Maize 30 59
Marshes Dry Season Beans 6Maize 6Sweet Potato 1 13
241
5. Bananas are grown on1 almost one half of Ngozi's food crop landwhich is a higher proportion than anywhere else in Burundi. Most of thebananas are used for the production of local beer and only a small propor-tion is consumed as a fruit. An unknown but sizeable proportion of bananabeer is sold either inside or outside the province and it is generallybelieved that the development of coffee as a cash crop has raised thedemand for banana beer and, hence, has stimulated the expansion of thearea under bananas. The production of beer from bananas is wastefulnutritionally since about 50% of the calories of the banana fruits arelost during processing. The same applies for sorghum which is also mainlyused for the production of beer. The Ministry of Agriculture is aware of
this and would like to reduce the number of banana trees in favor of otherfoodcrops. It is not clear, however, how such a policy could be implementedsince this would run counter to firmly established traditions and habits.With an increasing population and land becoming scarcer, the point couldhowever be reached that the farmers simply cannot any longer afford to growbananas to the present extent.

ANNEX 4Page 3
6. Only 10% - 12% of all bananas are cultivated in pure stands ata density of about 6,500 plants per ha giving a production of about 7 to 8ton per ha. In mixed stands the density is on average 3,500 plants andthe production about 4 ton per ha.
7. Cassava is grown on a'bout 40% of the food crop area. The crop,introduced during the Belgian trusteeship, does very well on the hills.Pure stands account for 10% - 12% of the total cassava area and produceabout 6 ton of fresh tubers per year per ha or 12 ton after a full growingperiod of 2 years. The density of cassava grown in mixed stands is much lowerand its yield is in the region of 2 ton per ha per production cycle of2 years. There is scope for yield increases through the introduction ofbetter varieties; research work has been done on the Amani station in
Uganda to develop mosaic free varieties.
8. Sweet Potatoes have baen an established crop for many generations,grown mainly on the hills but sinall areas can also be found in the marshes.The crop is grown on 60% of the food crop area. In the marshes most of thesweet potatoes are grown in pure stands yielding about 8 to 9 ton freshtubers per ha. On the hills more than 90% is grown in mixed stands pro-ducing on average 2 ton per ha. Both the yields and the palatability ofsweet potatoes could be improved with better varieties.
9. Beans are the most important food crop in the region as in thewhole of Burundi. The combined area during the different seasons on boththe hills and in the marshes is equal to about 90% of the physical foodcrop areas. The areas under beans on the hills are about the same inboth seasons. Mixed stands account for more than 95% of the total areaunder beans but the planting density in mixed stands is only 15% less thanin pure stands during the long rain season. During the short rain season,when beans are intercropped with maize, the planting density is 35% lessthan in pure stands. Because of these differences in planting densitiesyields on the hills are somewhat higher in June - about 700 kg per ha -than in January - 600 kg per ha. Pure stands on the hills yield onaverage about 900 kg per ha and the production in the marshes, mixedwith maize, is about 750 kg.
10. A large number of bean varieties are grown in Burundi, but allare semi-dwarfs with short growing periods. Although standards of cultiva-tion are good it should be possible to increase the yield through the useof improved varieties and possibly a limited application of phosphate fer-tilizers. Field trials conducted in the 1972/73 season by a FAO experthave demonstrated that yields can be increased from 690 to 970 kg per ha(41%) through the application of 45 kg P205*
11. Maize is almost entirely grown in mixtures with beans during theshort rain season on the hills and during the dry season in the marshes.Maize is usually sown during tillage and beans about 2 to 3 weeks laterwhen the maize seeds have germinated. Beans are harvested about 3 months
ANiNEX 4Page 4
after sowing and maize 4 to 6 weeks thereafter. The yields ot maize inmixed stands with beans is much lower on the hills - about 425 kg per ha -than in the marshes where the production is reportedly averaging 1,275 kgof grain per ha. Late sowing of maize on the hills is cited as a majorreason for low yields but sometimes farmers have little choice when, forinstance, the rains fail to arrive on time.
12. There is certainly scope for production increases through theintroduction of higher yielding synthetic varieties and through the applica-tion of fertilizers. Pure stands of bamboo synthetic maize without fer-tilizers have produced between 2,000 and 3,000 kg per ha during the last5 years on the ISABU research station at Murongwe, close to the Projectarea. And FAO fertilizer trials on pure stands of maize showed a yieldincrease of 45% from 2,000 to, 2,900 kg grain per ha with P fertilizers(60 kg P205) and of 70% to 3,400 kg with N and P fertilizers (40 kg N and60 kg P20 5)
Livestock
13. Cattle. Ownership of cattle was a measure of social status intraditional Burundi society and to a certain extent this is still thecase. Cattle are not kept primarily for the production of milk, maeatand manure - although an estiLmated 200 liters of milk per cow are ex-tracted annually for the chi]Ldren and some manure is used on crop fields -but as an investment of savings in order to be able to meet large expenseswhen required. In 1972 the B3urundi herd was estimated at about 750,000head. Some 100,000 head were owned by about 25% of the farmers of NgoziProvince who had on average :3 head of cattle each. Owners with more than10 head of cattle are very rare.
14. Productivity of cattle is very low because of the absence of anyselection, poor health conditions and lack of fodder during parts of theyear. Mortality is high, especially amongst calves of which 35% die underthe age of one year because of East Coast fever or parasites. The calvingrate is a low 50% and the annual offtake is estimated to be less than 10%.Securing sufficient animal feed poses a continuous and increasing problemespecially during the dry season. Natural grazing grounds become scarcerbecause of increasing cultivation and overgrazing is a serious problem.It is estimated that less than 1.5 ha of natural pastures are now availableper head of cattle. No fodder crops are cultivated and because of the mixedcropping system cattle can be allowed in the harvested field for only a fewshort periods per year. As a result there is only a very small proportionof young males in the herd because the owners are forced to sell prematurelybefore they reach maturity.
15. Small Livestock. In 1972 there were some 900,000 sheep and goatsin Burundi. One third of the farmers of Ngozi province owned about 175,000animals. Feeding the goats and sheep is a lesser problem than that of cattlebut goats can cause considerable damage if not properly controlled. Theannual offtake is estimated at 35% for goats and 25% for sheep. Goats are
ANNEX 4Page 5
consumed locally and young males are frequently slaughtered at young age.Sheep, which are traditionally viewed as a symbol of God, are not consumedby the local population but solcl to Bujumbura or the plain bordering LakeTanganyika where part of the population is Moslem. Young males are soldat the age of two years. Other small livestock in Ngozi include chickens,pigs and rabbits. Little atten1:ion has so far been paid by the LivestockDepartment to the development o:: small livestock but it should be possibleto improve the productivity through breeding and health measures.
Level of Nutrition
16. The nutrition survey conducted in 1970/71 by the Societe d'Etudespour le Developpement Economique et Social (SEDES) in Ngozi province revealedan average daily intake of 1,891 calories, about 88% of the estimated re-quirement of 2,144 calories per person. Besides this apparent overallshortfall in consumption there were diet imbalances. The share of beansand peas in the daily menu was 347 calories or 45% of total intake andthat of cassava, sweet potatoes and other root crops was 641 calories or34% of total. Banana and sorghum beer accounted for 128 calories or 7%of daily intake. On the other hand the amount of calories supplied in theform of cereals, animal products, oil crops and fruits was far too low.Maize, wheat and sorghum accounted for only 50 calories or 2.5% of dailyintake and meat, fish and milk for 7 calories or less than 0.5%. Ground-nuts and oil contributed 10 calories per day and the consumption of fruitswas negligible.
17. In weight and value terms there are striking differences in theproportions of food intake, compared with consumption expressed in caloricterms. Beans, peas and rootcrops, which contributed nearly 80% of thecalories, represented less than 60% of both total weight and total valueof the daily menu. But banana and sorghum beer, which contributed 7% ofthe calories, accounted for 17% of the weight intake (245 grams per personper day) and no less than 25% of the value of the daily menu.
Cash Income from Agriculture
18. SEDES found in 1970-71 that an average Ngozi farm family receivedabout FBu 6,125 (US$78) from the sale of agricultural products. The breakdown of this figure was as follows:
FBu
Coffee 2,225
Banana and other beers 1,760
Food crops 870
Livestock products and fish 1,270
6,125

zû'TX 4Page 6
This confirms the importance of bananas in the cropping pattern. Sales ofbanana beer were double those of all other food crops combined.
Objectives of the Second Project
19. The results of the nutrition survey underline the necessity of anincrease in the level of food production ifn general. As far as feasible,special attention should be given to cereals, oîl crops, fruit and animalproduction. It should be recognized however that so far little experiencewith these activities has been gained. The Project would therefore concen-trate on further exploration of promising courses of action through largescale experiments at farm levrels. The projections are necessarily of anindicative nature and detailed annual programs for food crop and livestockdevelopment activities would be prepared by the Ministry of Agriculture inconsultation with the proposed team of advisers.
Foodcrops
20. Seed Multiplication. Recent experience in Burundi with the multi-plication and distribution oi- selected food crop seeds is very limited.Experience elsewhere, especially in neighboring Rwanda, under comparableconditions indicate that the prospects for yield increases through the pro-duction and distribution of Lmproved seed varieties are good and thereforetwo seed multiplication farms would be established - one near Ngozi and theother probably near Kayanza. As in Rwanda, the main effort would be concen-trated on maize because this crop offers the largest scope for improvementboth in production terms and from the point of view of arriving at a morebalanced diet. Other crops with possibilities for yield increases throughbetter seed varieties include beans, sweet potatoes, cassava and probablygroundnuts and soybeans which as yet are grown by only a small number offarmers. An initial stock oiE synthetic or composite maize seeds would beprocured from abroad, possibly from Rwanda, and improved seeds would be soldto the farmers at prices slightly above (about 10%) going market prices for thecrop produce concerned to prevent domestic consumption.
21. The two farms woul<l be developed along the following lines:
1975/76 1976/77 1977/78 1978/79 1979/80(1) (2) (3) (4) (5)
Farm 1, ha 5 10 15 15 15
Farm 2, ha - 5 10 15 15
Total, ha 5 15 25 30 30
On the assumption that one half of the area of the two farms were to beplanted with maize and assuming that:
(a) seed production would be 2,000 kg per ha;
(b) farmers would receive seed for 0.25 ha; and
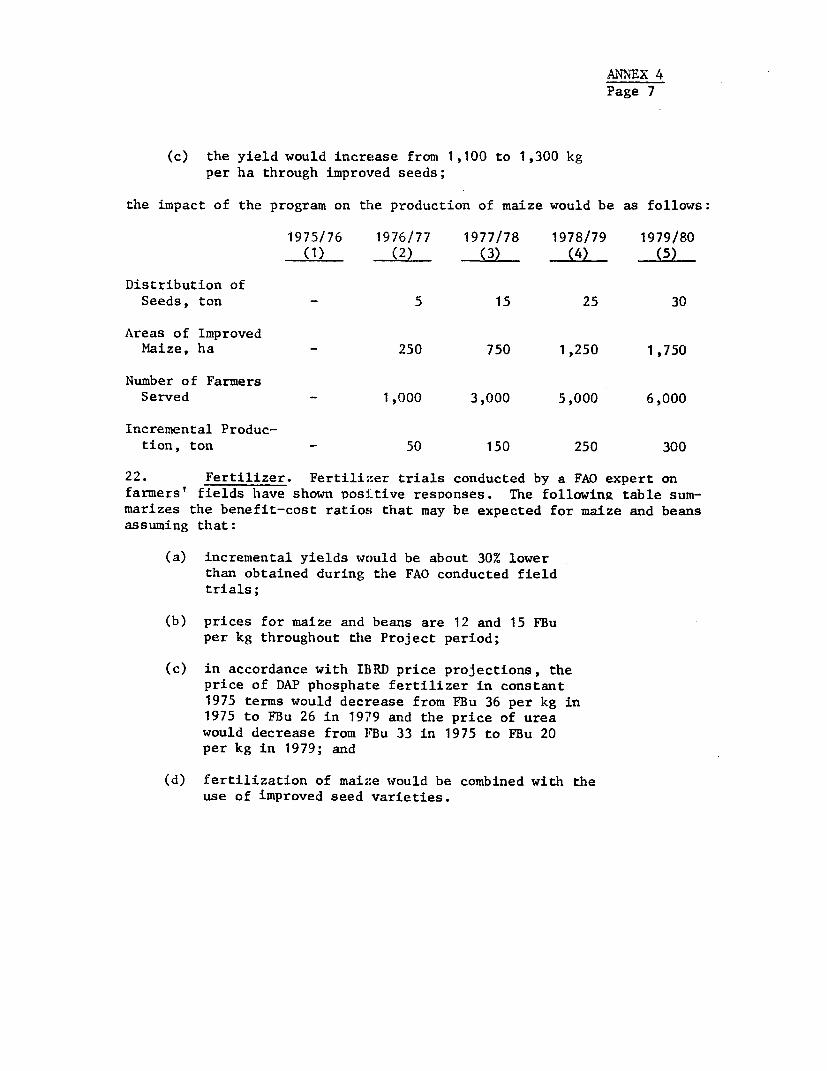
ANNEX 4Page 7
(c) the yield would increase from 1,100 to 1,300 kgper ha through improved seeds;
the impact of the program on the production of maize would be as follows:
1975/76 1976/77 1977/78 1978/79 1979/80(1) (2) (3) (4) (5)
Distribution ofSeeds, ton - 5 15 25 30
Areas of ImprovedMaize, ha - 250 750 1,250 1,750
Number of FarmersServed - 1,000 3,000 5,000 6,000
Incremental Produc-tion, ton - 50 150 250 300
22. Fertilizer. Fertilizer trials conducted by a FAO expert onfarmers' fields have shown positive responses. The following table sum-marizes the benefit-cost ratios that may be expected for maize and beansassuming that:
(a) incremental yields would be about 30% lowerthan obtained during the FAO conducted fieldtrials;
(b) prices for maize and beans are 12 and 15 FBuper kg throughout the Project period;
(c) in accordance with IBRD price projections, theprice of DAP phosphate fertilizer in constant1975 terms would decrease from FBu 36 per kg in1975 to FBu 26 in 1979 and the price of ureawould decrease from FBu 33 in 1975 to FBu 20per kg in 1979; and
(d) fertilization of maize would be combined with theuse of improved seed varieties.
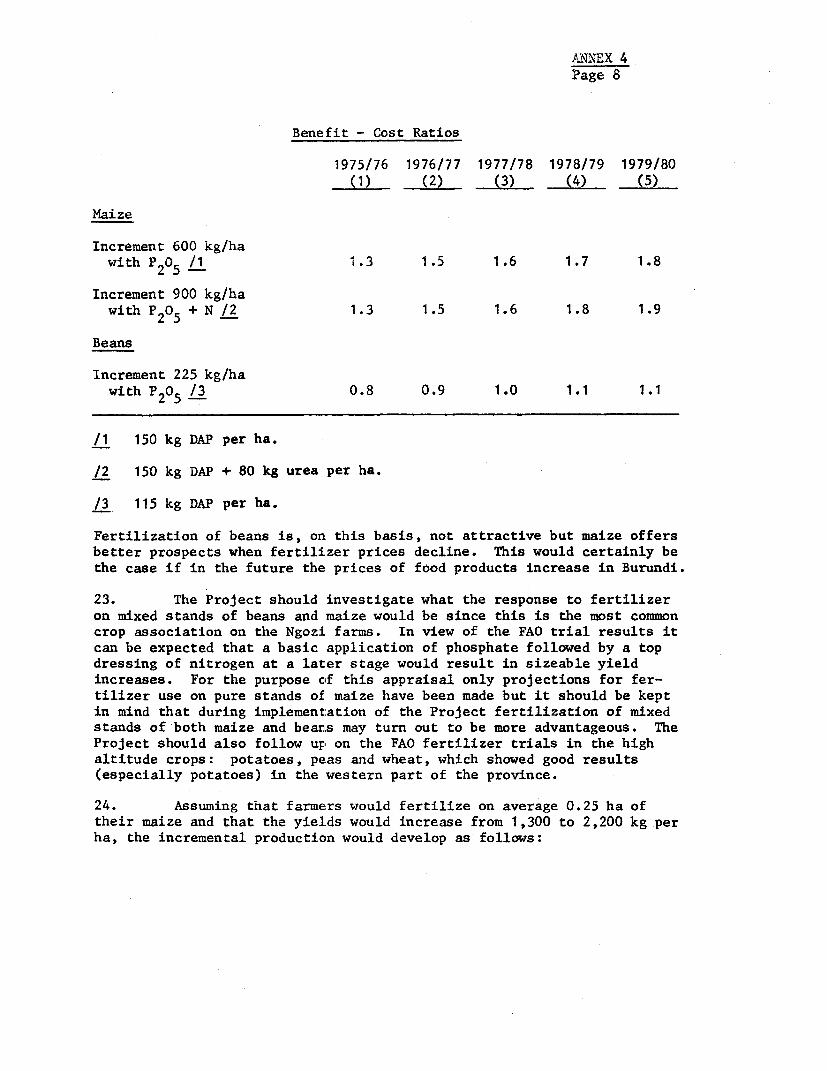
ANNEX 4Page 8
Benefit - Cost Ratios
1975/76 1976/77 1977/78 1978/79 1979/80(1) (2) (3) (4) (5)
Maize
Increment 600 kg/hawith P205 /1 1.3 1.5 1.6 1.7 1.8
Increment 900 kg/hawith P205 + N /2 1.3 1.5 1.6 1.8 1.9
Beans
Increment 225 kg/hawith P205 /3 0.8 0.9 1.0 1.1 1.1
/1 150 kg DAP per ha.
/2 150 kg DAP + 80 kg urea per ha.
/3 115 kg DAP per ha.
Fertilization of beans is, onL this basis, not attractive but maize offersbetter prospects when fertilizer prices decline. This would certainly bethe case if in the future the prices of food products increase in Burundi.
23. The Project should investigate what the response to fertilizeron mixed stands of beans and maize would be since this is the most commoncrop association on the Ngozi farms. In view of the FAO trial results itcan be expected that a basic application of phosphate followed by a topdressing of nitrogen at a later stage would result in sizeable yieldincreases. For the purpose of this appraisal only projections for fer-tilizer use on pure stands of maize have been made but it should be keptin mind that during implementation of the Project fertilization of mixedstands of both maize and beanLs may turn out to be more advantageous. TheProject should also follow up on the FAO fertilizer trials in the highaltitude crops: potatoes, peas and wheat, which showed good results(especially potatoes) in the western part of the province.
24. Assuming that farmers would fertilize on average 0.25 ha oftheir maize and that the yields would increase from 1,300 to 2,200 kg perha, the incremental production would develop as follows:

ANNEX 4Page 9
1975/76 1976/77 1977/78 1978/79 1979/80_(1) (2) (3) (4) (5
Number of Farmersusing Fertilizers - 300 700 1,200 2,000
Maize Area, ha - 75 175 300 500
Incremental Production, ton - 67.5 157.5 270 450
25. Burundi has no experience yet with a credit system for the recov-ery of the costs of inputs for food crops. The FAO expert, who is in chargeof the fertilizer trials, has sold small quantities against cash paymentsduring the 1973/74 season to farmers in an area where the trials had beensuccessful in the previous year. Experience elsewhere shows, however, thateither credit arrangements or subsidies are necessary to encourage largescale application of fertilizers. It is evident that the terms of salefor fertilizers for both coffee and food crops should not differ. It istherefore necessary initially to restrict fertilizer distribution for foodcrops to the farmers who also grow coffee (the large majority) to allow forthe recovery of the cost, together with the cost of fertilizer for coffee,after the coffee harvest.
26. Soil Productivity. Cut of every 4 plots no less than 3 are locatedon hill slopes which are often very steep. The need to protect soils underthese conditions against the devastating effects of run-off water has longbeen recognized. On a large number of hills, ditches and terraces werelaid out and setaria grass was planted in the 15 years preceding inde-pendence in order to control erosion. After independence these works werelargely neglected by the farmers but recently the Ministry of Agriculturethrough its extension service has embarked upon a campaign to restore andexpand the conservation works. Since clearly the long run productivity ofthe soil is at stake soil conservation should rank very high amongst thepriorities for the extension staff of the second Project. An assessmentwould have to be made on the requirements for setaria plant material, andmultiplication and distribution thereof would be included in the Project'sactivities.
27. The Project would also encourage proper drainage of the marshes.Ir. many instances drainage is poor and the productivity of the marshescould be improved where adequate drainage ditches were laid out.
28. Poor organic condition of the soil is a frequent reason for lowproductivity. In a number of the FAO conducted fertilizer trials theresponse to fertilizer was practically nil since the soils did not con-tain a minimum of organic matter. The farmers should be encouraged inevery conceivable way to conserve the manure produced by their animalsin order to enable them to improve upon the productivity of their soils.
ANNEX 4Page 10
Livestock
29. The Project would also give attention to the development of smalllivestock, e.g., sheep, goats, rabbits and possibly poultry - probablythrough the establishment of two modest breeding farms which would raiseand issue improved breeding stock to interested farmers. Details would beworked out during the first Project year.
July 1, 1975
ANNEX 5Page 1
BURUNDI
SECOND COFFEE IMPROVEMENT PROJECT
Office des Cultures Industrielles du Burundi(OCIBU)
Background
1. OCIBU is a financially autonomous parastatal institution estab-lished in 1964 following the liquidation of OCIRU (Office des Cafes Indigenesdu Ruanda - Urundi). The former OCIRU operated in Ruanda - Urundi, formerlyunder Belgian trusteeship, until Rwanda and Burundi were created as indepen-dent nations.
Objectives
2. OCIBU's objectives are to promote and develop domestic and externaloutlets for those agricultural products which are subject to quality andpacking standards. To this end OCIBU is authorized to:
(a) produce, transport, process and pack agriculturalproducts;
(b) establish and enforce quality and packing standardsfor marketable agricuiltural products;
(c) finance crops particularly when cooperative societiesare involved; and
(d) market crops whenever this may be required by theGovernment.
OCIBU is also authorized to negotiate international agreements related tothe production and sale of agricultural products and to administer fundsand grants specifically intende!d for the promotion and sale of agricul-tural products.
Activities
3. Despite its broad mandate, OCIBU deals in practice only withcoffee. For other industrial crops such as tea and cotton, separateparastatal agencies have been established. In the coffee sector, OCIBU'smain activity is to ensure the quality of Burundi coffee exports in accord-ance with internationally recognized grades. Other activities include:

ANNEX 5Page 2
(a) the establishment and maintenance of coffeenurseries for replanting with high yieldingvarieties in collaboration with the Ministryof Agriculture;
(b) development of new export markets for coffee,and campaigns for increased domestic coffeeconsumption;
(c) representation of Burundi at the InternationalCoffee Organization (ICO);
(d) establishment and supervision of communal hand-pulping centers for coffee; and
(e) importation, distribution and instruction in theuse of pesticides, fertilizers and other agricul-tural inputs.
OCIBU also administers a Coffee Price Stabilization Fund and a Coffee Promo-tion Fund which were built up) prior to independence. Finally, OCIBU is alsoresponsible for the implementation of the on-going first coffee itprovementproject.
Organization and Management
4. OCIBU has its head office in Bujumbura and is empowered to openbranches in Burundi and abroad as required by its objectives. The organi-zation i8 administered by a Board of Directors consisting of three ex-officio members: the Minister of Agriculture (Chairman), the Minister ofEconomic Affairs, and the Director-General of ISABU, and two farmer repre-sentatives and two representatives of the commercial sector nominated bythe Minister of Agriculture. Implementation of the Board's decisions issupervised by a Management Committee of five members consisting of theMinister of Agriculture (Chairman), the Director-General of ISABU, theDirector of OCIBU, one representative of the commercial sector and onefarmer representative. The Director of OCIBU, nominated by the Ministerof Agriculture, is in charge of the day-to-day affaira. Re attends theBoard meetings but has no voting rights.
5. OCIBU is managed tlhrough six departments; their main responsibili-ties are:
(a) Administration and Accounts. Deals with personnelmatters, secretariat, accounts and finance.
(b) Coffee Licensing and Grading. Responsible forliquoring and classifying of coffee, issueing exportlicenses, and collection of taxes.

ANNEX 5Page 3
(c) Warehouses. Responsible for storage and-movementof coffee.
(d) Marketing. Acts as intermediary in the sale ofcoffee to overseas buyers. It handles all exportand import administration including documentarycredits in cooperation with the Central Bank.In addition, it promotes Burundi coffee abroadand distributes coffee samples. The marketingprocedure is described in Annex 3.
(e) Coffee Handpulper Services. In charge of construc-tion of new handpulping centers and maintenance ofthe existing 450 handpulpers which are spread overall coffee growing areas. It operates also theButegana coffee washing station, formerly a coopera-tive society, which ceased to function as such afterits operating losses exceeded its subscribed andpaid-up capital.' e
(f) Projects. This Department is responsible for theimplementation of the first coffee improvementproject.
Price Stabilization and Promotion Funds
6. - OCIBU àdministers,the Coffee Price Stabilization Fund and theCoffee Promotion Fund through separate accounts. The Coffee StabilizationFund aims at regulating the farmers' price of parchment coffee and tosecure thé highest teturn possible to the coffee growers. The Fund receivesthe income from a-special tax levied on each ton of exported greep coffeeaccording to the following procedure: at the time of coffee shipping theexporter pays to the customs department a provisional stabilization tax(FBu 2,900/ton for 1974/75) and a provisional custom« eduty (FBu 23,075/tonfor 1974/75) together with-an adjustment provision (FBu 11,000/ton for1974/75) to the Central Bank. 'Stabilization tax and customs duty arefinally adjusted by the Central Bank, using the adjustment provision, assoon as the local bank involved in the exporter's operation declares theartual net foreign currencies received. The Coffee Promotion Fund financesthe campaign for the promotion of coffee consumption inside and outside thecountry. A promotion tax levied on exported coffee and earnings from com-mercial operations connected to promotional actions developed in Burundiand in Belgium are paid into the Fund.
7. The balance sheets and profit and loss accounts of both Funds(Tables 1 to 4) give evidence of their importance but the statutory pro-visions governing the Funds (Royal decree establishing OCIBU, dated June 18,1964, art. 24 to 27) are not specific enough to support an efficient controlsystem of their activities. It would be preferable for clear regulationsto be drawn up to define the activities of the Funds and, particularly, to

el 'NZ _5
Page 4
stipulate terms and conditions for drawing from these Funds and the sectorseligible for investment or financial assistance.
Staffing
8. OCIBU is adequately staffed: the administrative and technicalofficers have experience and are qualified for their jobs. The accountantis qualified for accounting routine, but lacks sufficient experience in themodern accounting techniques required by complex organizations such asOCIBU. A qualified chief accountant should be recruited without delay.
Resources
9. After the liquidation of the former OCIRU all tangible assetsand inventories remaining within Burundi boundaries, and a share of OCIRU'sliquid assets, were taken ovier by OCIBU. This initial equity has been in-creased by annual appropriation of profits to reserves. As of December 31,1973 capital and reserves amounted to FBu 44.5 million (US$567,000) and pro-visions for assets depreciation to FBu 28.7 million (US$366,000). Otherresources are derived from taxes levied on fob value of exported products(mainly coffee) controlled by OCIBU, from rents and interest and from loansand grants from Government or other sources, authorized by the Ministry ofFinance. Tax rates and the way they are levied are determined by the Boardevery year. Among these taxes one covers OCIBU's overall operating expendi-tures including those of the Coffee Board (remunerative tax). Others arerepayable by OCIBU: the promotion tax is paid into the Coffee PromotionFund administered by OCIBU; the Coffee Project tax raises the funds forGovernnent's contribution in the financing of the ongoing first coffeeimprovement project; and the diversification tax covers Burundi's contri-bution to the Diversification Fund that was administered by ICO.
Accounts
10. OCIBU's machine-typed accounts are well-kept but the bookkeepingsystem is apparently outdated and does not facilitate the analysis ofOCIBU's growing complex operations. The revision of the old chart ofaccounts, using a more rational and systematic classification and subdivi-sion of accounts together wiLth the strict application of standard account-ing practices, would help overcome the difficulties. Entries are simul-taneously posted on the account ledger and on the concerned relevantjournal (cash, bank, purchases, sales, etc.) but not consolidated on ageneral journal which, to facilitate control, should be opened. Delaysin posting entries are too :Long: three months at the time of the visitof the appraisal mission. Accounts should be permanently kept up to dateand a trial balance should be established at least every month instead ofevery quarter.
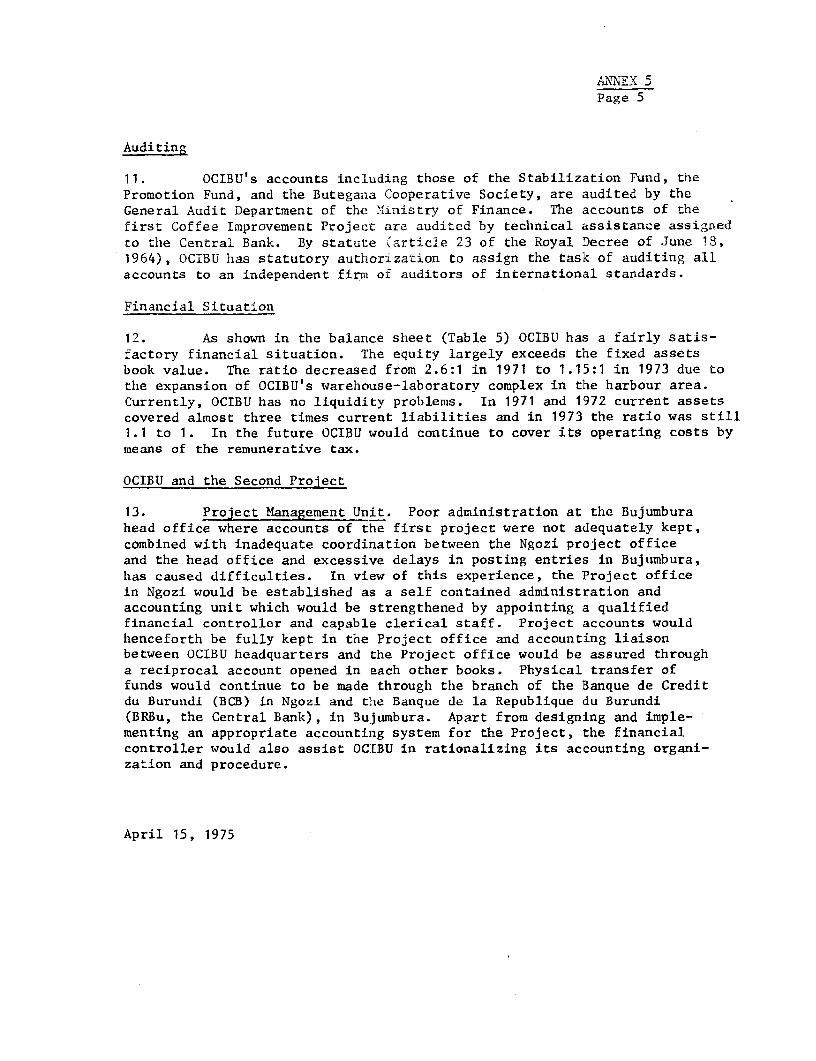
ANNEX 5Page 5
Auditing
11. OCIBU's accounts incLuding those of the Stabilization Fund, thePromotion Fund, and the Butegana Cooperative Society, are audited by theGeneral Audit Department of the ̀ MInistry of Finance. The accounts of thefirst Coffee Improvement Project are audited by technical assistance assignedto the Central Bank. By statute .article 23 of the Royal Decree of June 13,1964), OCIBU has statutory authorization to assign the task of auditing allaccounts to an independent firni of auditors of international standards.
Financial Situation
12. As shown in the balance sheet (Table 5) OCIBU has a fairly satis-factory financial situation. The equity largely exceeds the fixed assetsbook value. The ratio decreased from 2.6:1 in 1971 to 1.15:1 in 1973 due tothe expansion of OCIBU's warehouse-laboratory complex in the harbour area.Currently, OCIBU has no liquidity problems. In 1971 and 1972 current assetscovered almost three times current liabilities and in 1973 the ratio was still1.1 to 1. In the future OCIBU would continue to cover its operating costs bymeans of the remunerative tax.
OCIBU and the Second Project
13. Project Management Unit. Poor administration at the Bujumburahead office where accounts of the first project were not adequately kept,combined with inadequate coordination between the Ngozi project officeand the head office and excessive delays in posting entries in Bujumbura,has caused difficulties. In view of this experience, the Project officein Ngozi would be established as a self contained administration andaccounting unit which would be strengthened by appointing a qualifiedfinancial controller and capable clerical staff. Project accounts wouldhenceforth be fully kept in the Project office and accounting liaisonbetween OCIBU headquarters and the Project office would be assured througha reciprocal account opened in each other books. Physical transfer offunds would continue to be made through the branch of the Banque de Creditdu Burundi (BCB) in Ngozi and the Banque de la Republique du Burundi(BRBu, the Central Bank), in Bujumbura. Apart from designing and imple-menting an appropriate accounting system for the Project, the financialcontroller would also assist OCIBU in rationalizing its accounting organi-zation and procedure.
April 15, 1975

BURUNDI
SECOND COFFEE IMPROVEMENT PROJECT
STABILIZATION FUND
Comparative Balance Sheet as at December 31, 1971, 1972, 1973
(FBu rillion)
1971 1972 1973 1971 1972 1973
ASSETS LIABILITIES
Fixed Assets Accumulated FundLand 1.8 1.8 0.4 Fund brought forward 125.4 76.0 83.4Buildings 5.1 5.1 2.6 Surplus or (s'hortage) (49.4) 7.4 60.0
Less depreciation 2.0 1.3 0.8 for the year 76.0 83.4 143.43.1 3.8 1.8
4.9 5.6 2.2 Provision for Bad DebtsZaire investment 13.6 13.6 13.6
Current Assets, 2/
Cash at BRBu-1
119.7 60.5 26.6Investments:
Treasury Bills 16.0 8.0 23.0
135.7 68.5 49.6
Shares in BND/ 5.0 5.0 5.0
Shares in EPB- 0.2 0.2 0.2 Creditors
Loan from FED 74.7-/ - -5.2 5.2 5.2 Accrued expenses 1.4 0.1 0.1
Debtors:
Re-t receivable (accr,ed) 0.8 1.1 1.0BRBu (adjustment Coffee Taxes) - - 54.4
OCIBU (Coffee Taxes) 2.9 0.5 0.3Loan to Ministry of 2.3
Agriculture 1970 2.6- 2.6- 2.3Advance to Butegana Coop. - - 7.0
Advance to OCIBU _ _ 21.5
6.3 4.2 86.5Fictitious Assets 6/ 6/
Interest on investment in Zaire 13.6 1366
165.7 97.1 157.1 165.7 97.1 157.1
1/ Banque de la Republique du Burundi (Central Bank)
2/ Of which FBu 71.7 million in a blocked account for reiabursement of European Development Fund (FED) advance.
3/ National Economic Development Bank
4/ Bujumbura Port Authority
5/ Includes interest due and neu overdue installment. The loan of FBu 2.5 million was made in 1970 forpurchasing vehieles for the Government extension staff - 5 year repayment - 57. interest p.a.
6/ Disputed claim regarding interest due on Burundi participation ta Ruzizi Da. and Hydro-Electric Plant built inZaire.
7/ Ineludes inter-st due 1972 and two overdue installments of FBu 500,000 each.
8/ Loan agree.ent 1969 bolt-en OCIBU as Fund Ad.ini9trater -nd F E D - b.an te ho repaid April lst, 1972 -interest 37. p.a. This loan was used for a) reimbursing BRBu rebate on Coffee Taxes te coffee exporters 1969(FBu 37.3 million) b) reiobursing the Government its advance to Diversification Fund I.C.O0 for lst and 2ndnuarter 1969 (FBu 3.7 million) c) loau te Ministry of Agriculture for vehicles purchase (FBu 2.5 sillion)d) reimbursing the Government its participation to IDA Project 147-BU in 1969/70 (FBu 7 million) e) Government
Extraordinary Budget (FBu 24.2 million).
an:uary 21, 1977,

BURUNDI
SECoND COFFEE IMPROVEMENT PROJECT
SrABILIUTYI•t FUND
Profit and Loss Accounts as at December 31, 1971. 1972. 1973(FBu '000)
1971 1972 1973 1971 1972 1973
EXPENDITURES INCOME
General AdministrationBank charges 2 2 2 Taxes levied for FED loan repayment 38,897 12,955 -Tnterest on FED loan 9 - -Share of OCIBU's overheads 250 250 250 Taxes levied for Stabilization Fund 20,114 61,312 18,876Insurance - Taxes - Depreciation 572 326 211
2/833 578 463 Recovery of export taxes 1970/71 - - 1,214-
BRBu adjust.nent on taxes 1973/74 - - S4.4163/I,,eLveiliion "Prices Support':
Payments to Exporters via BRBu 74,830,/ 62,053 - Rents 1,207 1,022 506Payments to Government 31,153- - - Other income 883 1,111 269Payments to OCIBU for expenses - - -
1593 62,053-
Other ExpensesBad debts written off 3,712 - 1,940Loss on US $ devaluation - 6,400 12,873
Surplus of Income - 7,369 60,025 Shortage of Income 49,427 -
110,528 76,400 75.301 110,528 76,400 75.30
1/ To cover Government participation in IDA Project 147-BU for 1969/70 (FBu 7 million) and to feed itsInvestment Budget (FBu 24.1 million)
2/ As settlement of dispute with BRBu about INDURUNDI export tax 1970/71. .D3/ Represents adjustments as of 12/31/73 of Stabilization Fund Taxes corresponding to 10,875 tons af
1973 coffee crop exported.
Jsnuary 21, 1975

BURUNDI
SECOND COFFEE IMPROVEMENT PROJECT
COFFEE PROM"TION FUND
Comparative Balance Sheet as at December 31, 1971. 1972, 1973(FBu million)
1971 1972 1973 1971 1972 1973
ASSETS LIABILITIES
Current Assets j/ Coffee Promotion Fund 16.5 13.2 17.4Cash and Banks 8.8 7.5 4.3Stock green coffee: Bujumbura 1.4 5.6 3.3Stock green coffee: Anvers 1.6 3.2 2.9Goods en route - - 3.1
Receivable accounts Payable accountsDebtors 0.7 0.5 6.0 Creditors 1.9 0.3 0.1Advances to Project 147-BU - 0.5
Transicory account 2.6 0.4 0.42/
Shortage of income 3.3 - - Excess of income - 4.2 2.5
18.4 17.7 20.0 18.4 17.7 20.0
I/ Of which FBu 8.7 million at Central Bank and the balance FBu 0.1 million in cash and at Banaue Lambert-Bruxelles.
2/ This loss results from a wrong accounting procedure. The Management Committee deciding in March 1972 to transferthe profit 1970 (FBu 4.5 million) to OCIBU, as a subsidy for the purchase of small saws distributed free to planters, K:this amount was debited to the Profit and Loss a/c 1971 instead of debiting Reserves to which the profit 1970 had v
already been added. Subsequently the Profit and Loss a/c 1971 should have shown a profit of FBu 1.2 million instead e >;
of a loss of FBu 3.3 million, and Reserves vould have been FBu 12 million on the balance sheet 12/31/71 instead of c- r
FBu 16.5 million.
January 21, 1975

BURUNDI
SECOND COFFEE IMPROVEMENT PROJECT
COFFEE PROMOTION FUND
Profit and Loss Accounts as at December 31, 1971, 1972. 1973(FBu '000)
1971 1972 1973 1971 1972 1973
EXPENDITURES INCOME
General Administration Taxes levied on coffee exported 5,866 7,117 6,956Bank charges 16 34 104
Share in OCIBtl overheads 1,046 1,046 1,046
Subsidies to OCIBU:To purchase small tools free to planters 2,597 - 2,001
Profit 1970 transferred to OCIBU as l/
subsidy 4,457- - -Cost of a new roaster 586 - -
8,702 1,080 3,151
2/P.C.B.C. Service Bujumbura Sales "P,C.B.C" Bujumbura 2,422 2,519 3,255
Coffee for roasting 2,110 2,200 2,391 Sales "Contact" - Brussels & Antwerp 2,786 3,625 4,877
All other direct expenses 407 818 863 Sales exported coffee parcels - - 126
2,517 3.018 3,254
Contact _Service - Antwerp
Coffee for roasting 1,839 2,378 4,064
All other direct expenses 1,387 1,782 2,083
3,226 4,160 6,147
Expenses of Exhibitions
International 528 817 945 Sundry Profits 724 - 2,054Domestic 103 30 78
631 847 1,023
_ndry Losses - 10 1,152
Surplus of Income - 4,146 2,541 Shortage of Income 3,278
15,076 13.261 17,268 15,076 13,261 17,268
1/ Should not have been charged to Profit and Loss a/c 1971 but transferred to OCIBU by debiting
Promotion Fund Reserves to which Profits 1970 had already been added. So 1971 would have beenclosed with a profit of FBu 1,178,755 (FBu 4,457,488 - FEu 3,278,733). See remark 2/ table 4.
2/ Propagande pour la Consomsation du Bon Cafe. (Promotion of good coffee consumption).
3/ Contact is an organization whose objective is to promote consumption of Burundi Arabica Coffee
abroad and particularly to Europa. Parcels of 2 kg of coffee are sent abroad on behalf of ( Burundi residents (FBu 300 per parcel in 1973) or purchased in Brussels through Bannue Lambert -BAI or in Antwerp.
Janiuary 21, 1975

BIRUNDI
SECOND COFFEE IMPROVEMENT PROJECT
OCIBU
Summarized Balance Sheet as at December 31, 1971, 1972, 1973(FBu million)
1971 1972 1973 1971 1972 1973
ASSETS LlABILITIES
Fixed Assets Capital 17.3 17.3 17.3Land 0.5 0.4 0.4 Reserves 18.2 18.2 27.2Buildings 24.2 27.6 47.4-Equipment - Furniture 12.0 15.5 16.7Vehicles 2.0 2.6 2.7
38.2 45.7 66.8
Less Depreciation 25.0 26.2 28.7
Net Book Value 13.2 19.5 38.1
13.7 19.9 38.5 35.5 35.5 44.5
Current Assets Current Liabilities 6/Cash and Banks 25.4 24.6 45.22! Sundry Creditors 6.1 3.8 37.6-Merchandise Stock and en Route 1.2 0.6 12.93/ Accrued Expenses 10.9 11.8 7.1Advances to Butegana Coop. 6.0 7.0 - 3 Deposits Received 0.1 0.1 0.171Advance to Coffee Project Ngozi - 3.0 3.0 Advances From Stabilization Fund - - 21.5-Advances to Staff C.8 0.5 1.74/ Ministry of Finance: 8/Sundry Debtors 11.1 7.6 34.1- Surplus Diversification Tax - -17.1-
Surplus Project 147-BU Tax - -409/
44.5 43.3 96.9 17.1 15.7 87.4
Transitory Accounts 1.3 - 0.1 Transitory Accounts 0.4 0.5 1.0
Fiscal Year Profit 6_5 11_5 2,6
Total Assets 59.5 63.2 135.5 Total Liabilities 59.5 63.2 135.5
l/ Compared to 1972 the increase comes from cost of a second warehouse and a new laboratory builtin OCIBU complex at Bujumbura Harbour.
2/ Represents mainly the purchase cost of empty jute bags, hand pulping materials and empty poly-ethylene bags for insectici'e spraying.
3/ Advances reimbursed through an advance from Stabilization Fund.
4/ Of which FBu 28 million represents export taxes due by coffee exporters.
5/ Unadjusted
6/ Of which FBu 34 million represents coffee export taxes due for November and December 1973 toCentral Bank
7/ Of which FBu 20 million for purchase of jute bags and FBu 1.5 million for staff housing loans,
8/ To show the excess of Diversification Tax over actual payment "ade to ICO London as a liabilityto the Ministry of Finance and not as a profit to OCIB11 as previously recorded in OCIBU's books.
9/ To show the excess of Project 147-BU tax over the tax utilization as a tiability to the Ministry of Financeand not as previously recorded in OCIBU's books.
,arIîsar-, 52, 197,2
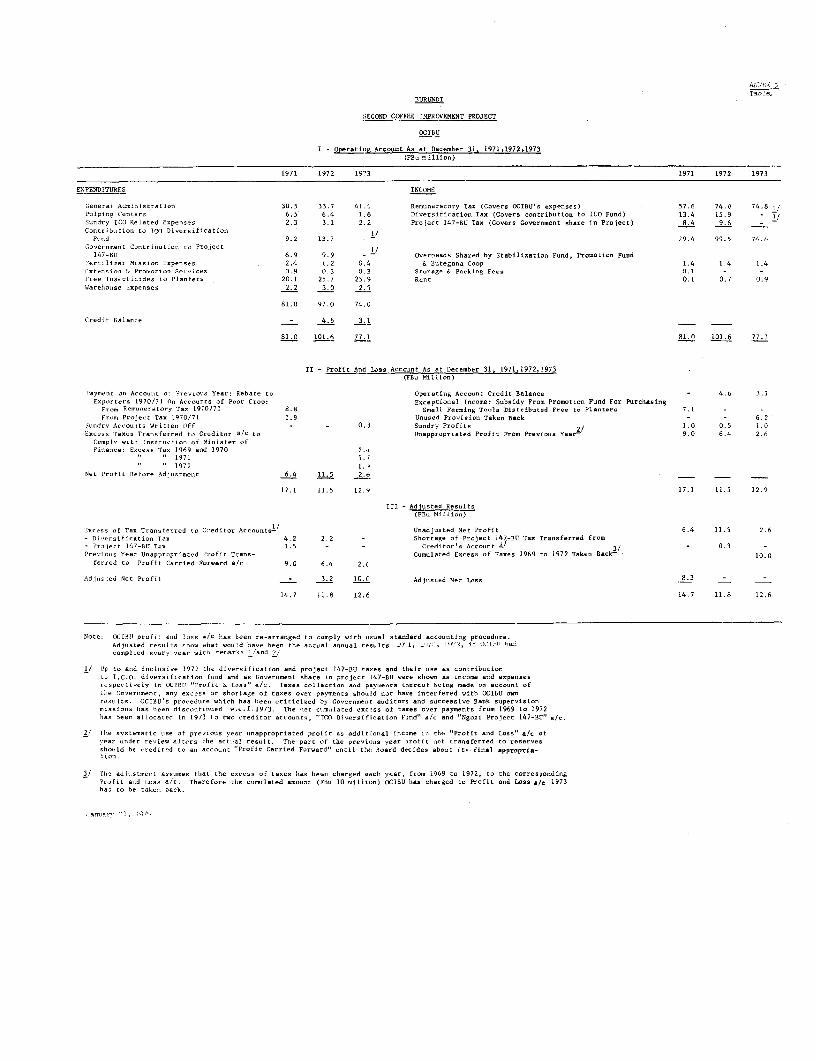
bURUiNDI
iECOND COFFEE IMPROVEIIENT PROJECT
OCIBU
I - Operati,g Account As at Denember 31, 1971,1972,1973WFBl tillas>
1971 1972 19'3 1971 1972 1973
E1PEND7ITIRES INCOME
Gene:ral Adrciistr-cson 30.5 33.7 41.1 Re.uneratory Tas (Covers OCIBU's expenses) 57.6 74.0 74.8Pulp:ig Cencers 6.5 6.4 1.6 Diversification Tam (Covers contribution te ICO Fsnd) 13.4 15.9 -Su-dr-y ICO Related Exposnes 2.3 3.1 2.2 Pro/rot 147-BU 'DX (Covers Govern.ent share in Pro/jet) 8.4 9.6 - _Contribltion to ]CO Diversification 1/
Fond 9.2 13.7 - 79.4 99.5 74.8C.overnnmecr Contribution ru Project 1/
147-BU 6.9 9.9 - Overhesads Shard by Stabilieatios PFnd, Promotion FundFerci.lizer Mission Copeoses 2.4 1.2 0.4 h Outegans Coup 1.4 1.4 1.4intrusion & Promotion Snr-ices 0.9 0.3 0.3 storage & Packing Fers 0.1 - -Frne I-lsn'ticides tr Plasetrs 20.1 25.7 25.9 Rent 0.1 0.7 0.9Worelivuse ixpenses 2 2 3.0 2.5
81.0 97.0 74.0
Credit Onlsece - 4.6 3.1
81.0 101.6 77.1 81.0 101.6 77.1
II - Profit And Loss Accrunt As at Decreber 31, 1971,1972,1973(FBl Million)
Puyncnt ,n Anonnt cf P-rvious YUr: Rebate tE Operattig Account Credit Balance - 4.6 3.1E.F-rt-rs 1970/71 Un Acountrs uf PFor Crop: EIneptional Income: Subsidy Fron Promotion Fond For PFrrhastig
Fron Rcesnorratory Tan 1970/71 8.8 Seaul Farcis0 Tnuîn DistrRibutd Frac tso Plactera 7.1 - -
F-on Pruject Tsn 1970/71 1.9 Unuord Frovision Tskec Beck - - 6.2Solndrr Accounots writt-: oIff - - 0.1 Sundry Profits 2/ 1.0 0.5 7.6Emcus Tases TrDsferred tu Creditor a/n to Unappropciatnd Profit From Peios er 9.0 6.4 2.6
Conplu with lnscrnction cf Minister ofFinance: toEn. s Tac 1969 and 1970 2-.
n ' 1971 5.7n 1972 1.1)
Net Profit Be/fen Aduntonent 6.4 11.5 2 ti
17.1 11.5 12.1 17.1 11.5 12.9
III - Adjustrd Results(FBl Million>
Enresu uf Tan Transfrred to C:cditor Acounts-/ Ueadj/stcd Net Profit 6.4 11.5 2.6- -irrsific-tion Toc 4.2 2.2 - Shortage of Pro/cnt 147-BV Tux Tra.sfee-cd fron- Pro j-c 147-RU Tus 1.5 - - Croditur's Accnnnt - 3/ - 0.3Pre_ions Yrar Unappropriactr Frofi Trans- Cumslaced Encras of Tomes 1969 tE 1972 Takcr Bacr k 10.o
fer:red to Profit Carried Fpr-rrd sfc 9.0 6.4 2.1
Adi-,ocd N9t Profit - 3.2 10.C Adj/sted Nlt i.ons 8 3
14.7 11.8 12.6 14.7 11.8 12.6
Note: OCIBJ profit oud -sn a/c has bren re- trranond Eu co-ply ith ubosual ntadard acionnting procedure.Adjnsted res-ils show chat .o.ld have becs th. -rccal ononal resuts i/ 1, _ )./, 1:77, ir OC/'Si' hro,romplicd evcry -cri cith -eenr.rs l.sc 2/
l lp ro an-d inclusive 1972 the divcrsiuicatîsc ard projnct 147-BU t..es and their use us rontributiontc 1.C.0. diveesifistifon fund -nd as Uovei,cent share iu pro/jrt 147-BU ere sbowc os in-cme and expenes-r-sper-tiv-ly ir iCIBIU "Profit & Loon" o/c. Taxe collection and psyoero tnereoE hcing mode os annou at ofthe Covrenr-ent, any encens or shortage of taxes over paynents should tot hbac interfered with OCIBU ownrcslnt. OCIBU's proced-e nhich han been criticized by Governnen E aditers ani successive Bank supervisionmissions IaS bren disrcrtinned w.e.f.1973. The net cn -olsrnd excsss nf traes over paymcntn froc 1969 ts 1972han bren allocaced in 1973 Eu two rediteor aceo Cnns," "TC0 ivenoifiucilon FPnd" a/r and "ENgoi Prosjot 147-BI" r/r.
2/ T7he svstmati ose of preciovs y-er '.nappropriatcd profir os addition]a incom ir th. "Profit aod Loss" a/r of-ear nlder reci-e nitors thse -nt::l renullt. The part cf thr previn-s year p,,fit ont transferred tn rencenes
sbo-ld bl -reditid to on s Pc-uft "Freit Carrird For.ard" cntil tht! Board de-ides ahbut ite final appropria-
3/ du. .d...sme .. assooes thot the.ecess of tanes bus bren rhbrged e-cb yeor, froc i969 to 1972, tr th. correspondingPrfit ard Loss s/r. Therefore the cunulated amoun. t (FB 10 nilli'n) OCIBU haa charged tc Profit .nd Lons a/r 1973has te be tsken b_ck.
Jsvrsnrva S, ID7'

Adjiutm,ieil, of CC'IPîJ's Annual Rezults
Profit Previous YearsTo Deduct for Adjustment Adjusted Results Carried Forward a/c Reserves
Net ExcessProfit Carried of Diver- To To To To
FY Results Forward as per sification Total Profit Loss Cumul. Add Deduct Cumul. Add Deduct Cumul.From OCTBU OCIBU'S and Pro,jectBooks/ Books-' Taxes
InheritedFrom OCIRU 2.0
1964 0.7 - - - 0.7 - 0.7 - - - 0.7 - 2.7
1965 12.6 - - 12.6 - 13.3 11.6 - 11.6 1.0 - 3.7
1966 13.8 11.6 _ 11.6 2.2 - 15.5 - 0.1 11.5 2.? (0.1 6.o
1967 13.9 ll.5 - 11.5 2.4 - 17.9 - 0.1 11.4 2 40.1 ( '.5
1968 8.1 1.-1.4 - 3.3 14.6 - 3.3 8.1 -3.1 5.0 3.1 _ 11.6
1969 0.1 5.0 0.7 5.7 - 5.6 9.0 0.6 - 5.6 - D.6 11.05.6 0
1970 15.7 0.1 1.7 1.8 13.9 - 22.9 7.? - 7.2 6.7(0.6 6.6 0.6< - 18.3
1971 6.4 9.0 5.7 14.7 - 8.3 14.6 1.7 8.3 - 1.7 16.68.3 0
1972 11.5 6.4 1.9 8.3 3.2 - 17.8 2.6 - 2.6 0.6 - 17.2
1973 12 .6- 2.6 - 2.6 10.0 - 27.8 - - 2.6 10 - 27.9
1/ Although profit appropriation to reserves is usually decided by the Board in the course of the followicng year it isshown here same year at closing of account for easier reading.
2/ From OCIBU'S annex to balance sheeb 1973 (accounting comments).3/ OCIBU has charged its profit and loss account 1973 with the total net excess of taxes (FB_ 10 n-lllion) whieh here aboe
have been deducted before 1973. Subsequently the Fa, 10I million have to be taken back and the FBa 2.6 million profitshowr. in OCIBU'S books for 1973 become FB,2 12.6 million. The FDS 10 million profit goes entirely to reserves.
Tancary 21, 1D7t

Bt'RU'NDI
050bND COFFEE IMPROVEMENT PROJECTDEUXIEME PROJET D'AMELIORATION DE LA PRODUCTION DE CAPE
Summary of Project CostSommaire des CoSits du Projet
(FBu 000)
Annual CostYear/Année Year/Ann4e Year/Année Year/Année Year/Année Foreig, Exchange vear 6 Onwards
'able l 2 3 4 Total Cost Devises Coût Annuel___ Tableax (1975/76) (1976/77) (1977/78) (1978/79) (1979/80) Coût Total 5 FBu'OOO A Partir Année 6
Agricultural Services 2 27,592 32,904 44,340 50,359 32,975 188,170 42 79,664 21,400 Services AgricolesCoffee Processing 3 11,750 13,410 980 150 150 26,440 71 18,680 150 Traitesent du CaféCoffee Research 4 14,770 9,210 6,960 7,720 6,960 45,620 78 35,705 7,215 Recherche CaféConstruction Equipment,Bridges,Water appSy 5 6,300 2,900 2,900 400 400 12,900 60 7,620 450 Mat. de Constr. ,Pots, Approv. d'eauProject Management 6 37,165 19,940 16,940 17,280 14,310 105,635 73 76,585 7,300 Di-ection du ProjetTechnical Advise asd Evaluatio., 7 5,327 4,047 3,847 4,247 3,847 21,315 65 13,912 - Conseils Techniques et EvaluutiooAdministrative an. Techuical Services 8 9,382 4,522 4,042 6,722 4,042 28,710 45 13,038 4,942 Services Administratifs et Techniques
Base Cests 112,286, 86,933 80,009 86,878 62,684 4'2o,7y) 57 245,204 4-,4P,7 CoAts de Base
countingencie - Phy,sical_ 5,6i4 4,347 4,0 6 4,344 3,034 2 ,439 57 12,26 Ts,prév - Dpasserent des hantitPsi/
-Prsyicl 2 7 l2,969 2o,082 28,563 4o,138 38,833 140,585 57 80,133 -HauSse des Prix
Total Projeet Cost/with Contingencies 130,869 111,362 112,572 131,30 o04,651 590,8I4 57 33,(Y7 CoOts Totaux du Projet avec Imprévus
Estimated at 54 of base costs. i/ Evalués 'a 5% du coût de base.
É/ Annual price contingencies have been computed as follows: Year l: 117; l Provisions annuelles pour hausse des prix été calculéss coume suite:Year 2: 22d; Year 3: 34é; Year 4: 44%; and Tear 5: 594. Année 1: 11%; Année 2:22% Année 3:343; Année 4: 444; et Année 5: 593.
October 6, "975
Bts
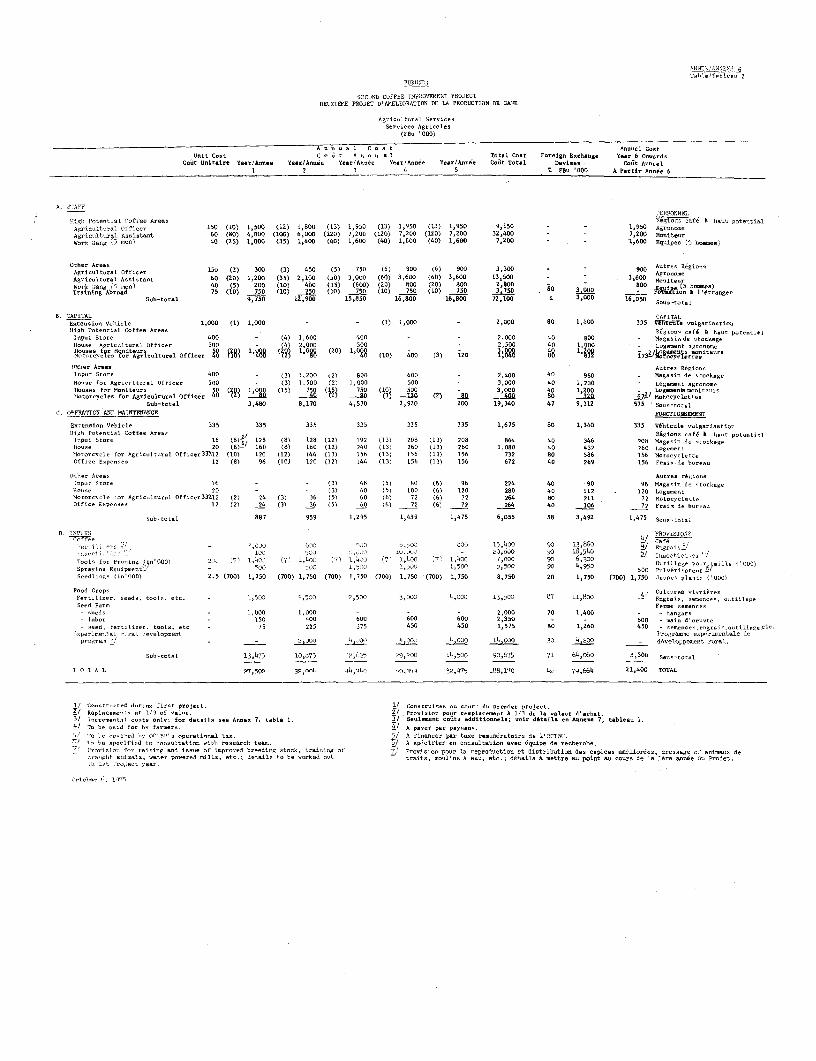
T.hle,Teblce,, 2
1003372E PROJET 0'OAMILI0RATION DE LA PRODOCTI0N DE CAPE
(Pu000)
UeREe Ce4a c e A Tetel Cees Porel gs Esch.sge bar 6 Oo,-edsCet De ti-.s Yes.se eodeé ooAvé eeAsé erAseée Colt Tetal Devi.es Coda Av...e
i 2 34 S 7 mO 'DES A P.otir Assée 6
il.tl't .1 1.ff- A-- ~~~~~~~~~~~~~~~~~~~~~~~~~~~~~~Ogcccaéh-hat pcts>ticlAceiuit ft o'vr15E (lE) 4,500 (12) 1,800 (13) 1,930 (13) 1,950 (13) 1,950 9,050 - -1,050 Ageca-lA.Sor>oc ituaSslstcct 60 (80) 4,8000 (19E) 6,09E (l2O) 7,20E (120) 7,200 (120) 7,200 32,400 - -7,200 DoaStecuWcr4 J6u va 40 (25) i,DOO (35) 1,400 (40) 1, 60 (40) 1,600 (AD) 1,600 7,200 - - ehO Equplov (5 Ac_a,e
0O6ev AroAt-evgAerîas_tcre 0ffca- 030, (2) 300 (3) 450 (5) 750 (S) 000 (4) 900 3,300 - 900 At, duvAgtcitura_I As_istec 60 (20) 1,200 (35) 2,1I0 (30) 3,000 (60) 3,600 (60) 3,600 l3,100 - -3,600 ArccOc-A 7-g'~Ica 4D (5) 20 M (10) 400 (135 (600) (20) 600 (20) 800 2,60 - 000 M. SeToeicfog A6r-d 75 0)70 (10) 7 300(10) 7 90 (10) 750 (10) 7 30 37050.0 - ~ Dî~CIO
Sab-tsta1 9,730 12,900 05,000 06,000 16,800 72,100 4 3,000 16 o050 tcteo
B. CAPOTI CAPITALOocte... i Sahîclo 1,000 (0) 1,000 - - (1) 0,000 - 2,000 60 0,600 335 cesoae aîarseto
bouc Socre ~~~~ ~ ~~~~~400 - (4) 0,000 400 - 0,000 40 000 - Mcocc d.. ca.gNass agi fftra 001c 300 - (A) 2,000 30 00 0 0 1,00 - éceoogcoc
}>r>rrcvcls 0cr agrvcsotsrolOffice 40(OS '00 () 8 1'40 (10) 400 (3) 2
ivyci Ssore ~~~~ ~ ~~~~~400 - (33 1.200 (23 600) 400 2,400 40 960 M.Ngasin do oekgcaus-,c A--cau cee Officer 300 - (33 3,300 (23 1,000 500 -3,000 40 1,'00o Lsgses- gcva
Oaec0rMootas- (0 , (5 (13 30 - 3-0 40 leOO L.&eeo acatcccs
Sa6-tct.1 3,460 8,170 4,570 2,920 200 19,340 47 9,112 5735 cs-ce
C 007'7900 ATlfrOAI95POCCINCMD
Dcctevaiss Vohiclo 335 335 335 335 395 335 1,675 80 1,540 335 VéhîsOsuuîorleacHlu,11 P se-tts Cottes croc ,EOoOv cf hhutilvt
Inpcr tooro 1~~~~~~~~~~6 1S 28 >03 128 (12> 192 1133 700 >133 700 064 40 346 vo aosvd cchg20 (3~ 160 (03 160 (023 240 (03> 260 (133 260 0,000 40 437 760toev
Mctcvevclo 0crAgecccl curaiOfOs--rS7.12 (10) 120 (123 144 (133 156 (133 036 (133 056 232 60 50 3 Mot- cet
Ettîco tcpcvces ~~~~~~~~12 (8 96 (101 120 (023 144 (133 036 (033 136 672 40 269 156 Orsi, dc b-ro-
,caî2- r 16 -- (3) AS (3) 80 (6) 96 224 40 '90 96 Hag-iv do cckaIcl- 23 - - 33 62 33> 100 (63 120 200 40 107 - 120 ialesocmct -rac ie a Aoclto Off--3r3Jll (23 24 (33 36 (5) 60 >43 72 (43 732 264 60 70 32iaeyvoc0001cr Erc>s-s- 17 (2> 24 (3> 3_6 (5 40 6> 22 (6 72 264 40 100 2Pos sbra
tub- oscel 6~~ ~ ~~~87 959 0,2035 0,430 1,475 6,055 30 3,492 1,475 Scc-sa
D. INP00P0I-0TS1
ler>llc'si - ~~~~~ ~~~~ ~~~~~,O,) ùJ t>7 c50~ 8003 1,h4oo 90 13,54o-- -- 5 c.',,. il. ta -~~~~U O'0,sJ 90 14,354, / uot1v
Tc-ls fcr Prvlo sOEO> '> 7' 1, 40) y>, 1,4oo 7>1 î,4x *'1,3 o'~ 1,4037 7,000 90 6,3223,03sp-ayicg t5 lpcot. 00 700 O ) ,5f 1O O 49op I, 00500 Pccs-rtst- r Seolcc(ic>300 0.3 (700) 0,730 (700) 0,750 (700) 1,730 (700) 1,750 (700) 1,750 8,750 20 1,750 (700) 1,730 Jsacs plouc, ('077>
Pet -oa odo. tccît. ota. - 0,370 ~,530 7,570 3,300 4,000 13,520 kiT 1100 - Occls soc,. .cllSsed Pava PFr-oa-asc-
- shodo - ~~~~~~ ~~~~~~ ~~1,000 1,00 - - - 2,000 70 0,400 -- Sta es-- 1,6cr - 03~~~~~~~~~~~~~10 400 400 600 600 D,350 - - 600 -iaa> d' -cu-
- Z stfrtls,tsl,aa -75 225 3735 450 450 0,325 60 1,260 430-5 esa, vce ,uEleoC
~~c-u.~~rscr '' - - 0,007 JL~~~~~ ésQu 2.000 14,000 37 O.c00 - 'Oc>volvppva.oct rural.wo 0 4,,0
Suh-soset 13, t ~~~~~~~ ~~108775 0,7 4,3 o,0o 7,7 71 44,00o6ocoace
00T2 A 7,500 rpSo 44,740 50.ats 32,975 106.170 40 79,664 01,400 TOTAL
0/ Caatrucecl dclv>,brutp-e3-at i/ C-vsc-lr- e' caa- d. preler pr-jeal.Il Oaleaocvc or 131 at -e1ce 2/ Prasiaiu race rooPloce-oc à 1>3 do le valsa d'ache..
-toacort>coa esîr; for do,talv s as..s 7, table 1.S./ Deas-es ce.s tedditi ....ls; voir dételle on Aese 7, -abl... 1.
T.eb apeidf-r Sa rauttaat>esacbee.IA p.y- dole etP uelttuseeaéqls sesbrc
- ' rîicuC- r-iaiv -ad iaecce a? taprasd b-sdic otc,tcou C2 evsv pos 1.c r-p-d-totc eh dietributiccd,esèe ndlro ddrvs fj c:ilrccd-a., usi,ater pa--sJills, sOct viil, tu Se varoi rat tecita, acclas s oc, tEc.> dételle A ,stte au poInt aucus o ère ec de l Orc.(u.

BURUNDI
SECOND COFFEE IMPROVEMENT PROJECT
DEUXIEME PROJET D'AMELIORATION DE LA PRODUCTION DE CAFE
Coffee ProcessingTraitemoent du Café
(<F8u ' 000>
A nnuaI CDStC oût A n n ue I Annual Cost
Unit Cost Total Cost Foreign Exchange Year 6 Onwards
Cout Initaire Near/AnnAi -ear/Année Ynar/Année Y.ar!née iear/énnée CGL ToLo1 Deviox6 Coûlt
_ _______________ 2 3 4 5 _ FBu'OOO A Partir Année 6
WASEINU STATIONS - STATIONS DE LAVAGE -
Capitl. Capital
Co,,.troction and Equipment 5.800 (2) 11.600 (2) 11.600 - - - 23,200 75 17,400 - Construction et Equipement
Operation anl Maintenance 2/ Fonctionnemeent -/
Fixed processing costs 200 - (4) 800 - - - 800 75 600 - Coût fixe
Variable processing costs - 240 210 - - 450 - - CoûIt variable
Maintenance 310 - 620 620 - - 1,240 55 680 -- Entretien
Sub-total 11,604 13,260 830 - - 25,690 18,680 - Sous-total
HAND PULPERS DEPULPEUSES A MAIN
Maintenance I (150) 150 (150) 150 (150) 150 (150) 150 (150) 150 750 25 190 (150) 150 Entretien
T O T A L 11.7 13.410 980 150 150 26I440 71 18.680 150 TOTAL
l/or details see Appendix at the end ol this Anr,ex. 1/ Pour détails voir Appendix i la fin de cette Annexe.
Sj Total csts in the first yeer of operatlon and ineremental costs in the second year,
uainly to cover expeniitures related to possible teething problem anAd staff training la l-xièae année,s pincipale.mrent pon r compenser pour dnpenses relatées auxe d
req,irements. problèmes éventuelles de désarrage et la nécessité de former le personnel. t
*''ly 5, 19 5
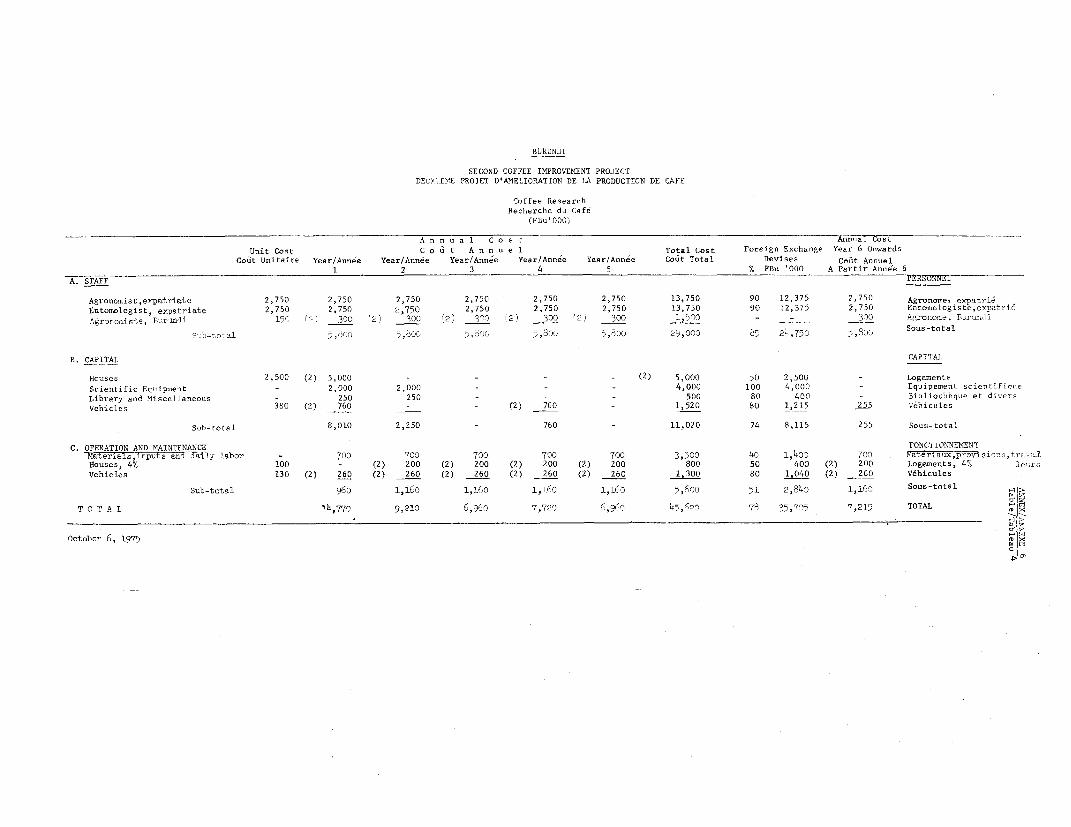
BURUNDI
SECOND COFFEE IMPROVEMENT PROJECTDE[XIE1'E PROJET D'AMELIORATION DE LA PRODUCTION DE CAFE
Coffee ResearchRecherche du Cafe
(FBu '000)
A n n u a 1 C o s t ual CostUnit Cost C o û t A n n u e 1 Total Cost Foreign Exchange Year 6 Onwards
Cout Unitaire Year/Annee Year/Année Year/Année Year/Année Year/Année Coùt Total Devises Coût Annuel1 2 3 4 5 N FBu '000 A Partir Annee 6
A. STAFF PEESONNUL
Agronomist,expatriate 2,750 2, 750 2,750 2,750 2,750 2,750 13,750 90 12,375 2,750 Agronome, expatriéEntomologist, expetriate 2,750 2,750 2,750 2,750 2,750 2,750 13,750 90 12,375 2,750 Entomologiste,expatriéAgrono,risfe, BiDr,m,i 150 ,- 300 (2) 300 2) 300 '2) 300 '9) 300 1,50 - _ 300 Agronome, lueur. i
Br.b-total 5,u00 5,oO y,,0 ,8oe "80 29,075 Sous-total
B. CAPITAL CAPTTAT,
Houses 2,500 (2) 5,000 - _ _ (2) 5,000 50 2,500 - LogementsScientific Equiprnent - 2,000 2,000 - - - 4,000 100 4,000 - Equipement scientifiqteLibrary and Miscellaneous - 250 250 - - - 500 80 400 - Bibliothèque et diversVehicles 380 (2) 760 - - (2) 760 - 1,520 80 1,215 255 Vehicules
Sub-total 8,010 2,250 - 760 - 11,020 74 8,115 255 Sous-total
C. OPERATION AND MAINTENANCE FONCTIONNEMENTMaterials,inputs and daily labor - 700 700 700 700 700 3,500 45 1,405 700 Mâtateriaux,pro9'liorn,tra,rlHouses, 47. 100 - (2) 200 (2) 200 (2) 200 (2) 200 800 50 400 (2) 200 Logements, 4% le-esVehicles 130 (2) 260 (2) 260 (2) 260 (2) 260 (2) 260 1,300 80 1,040 (2) 260 Véhicules
Sub-total 960 î,î6o l,l6o 1,J60 1,160 5,6oo 51 2,840 1160 Sous-total >
T 0 T A L i4,770 9,210 6, 960 7,720 6,960 45,6?2 78 35,705 7,215 TOTAL
October 6, 1971
aet

BURUNDI
SECOND COPFEE IMPROVESIENT PROJECTDEUXIEME PROJET DWA.fIORATION DE LA PRODUCTION DE CAPE
Construction EquipTaent, Bridges, Nater SupplyEquipement de Construction, Pontj, Approv ionoemee d'Eau
(FBu` 000)
An nua 1 CoL st-nnua 1Cos t
Unit Cost C o u t A n n u e 1 Total Cost Forci?n Exchange Year 6 Onwards
Cout unitaire Yeat/Annee YearlAnnee Year/Annee Year/Année Year/Année Coit Total Devises COT,t Annuel
1 7 1 4 _ i FR" 000 A P.rtir A-nr 6 __ _
CAPITAL CAPITAL
Tipping Truck 1,5OO 1,500 - - - - 1,500 80 1,200 c Camion benne
Tractor 1,00 1,000 - - - 1,000 80 800 _ Tracteur
Watter Tanker 200 2D0 - - 200 80 160 - Citerne
Trailer 200 200 - - - - 200 80 160 Remorquc
Concrete Mixer 100 100 100 80 80 B_étonière
Pick-up 400 400 - - - . 400 80 320 - Camionette
Sub-total 3,400 - - - - 3,400 80 2,720 - Sous-total
BRID87,5 AND CULVERIS PONT .Ed8IXELU
Repaie and Maintenance 400 400 400 400 400 400 2,000 20 400 200 Réparâtion et entretien
WATER SOURCES SOURCES D'EAU
Rehabilitetion and Maintenance (5%) 50 (50) 2,500 (50) 2,500 (50) 2,500 - - 7,500 60 4,500 250 Remise en êtat et
entretien
T O T A L 6,300 2,900 2,900 400 400 12,900 60 7,620 450 TOTAL
July 1, 1975
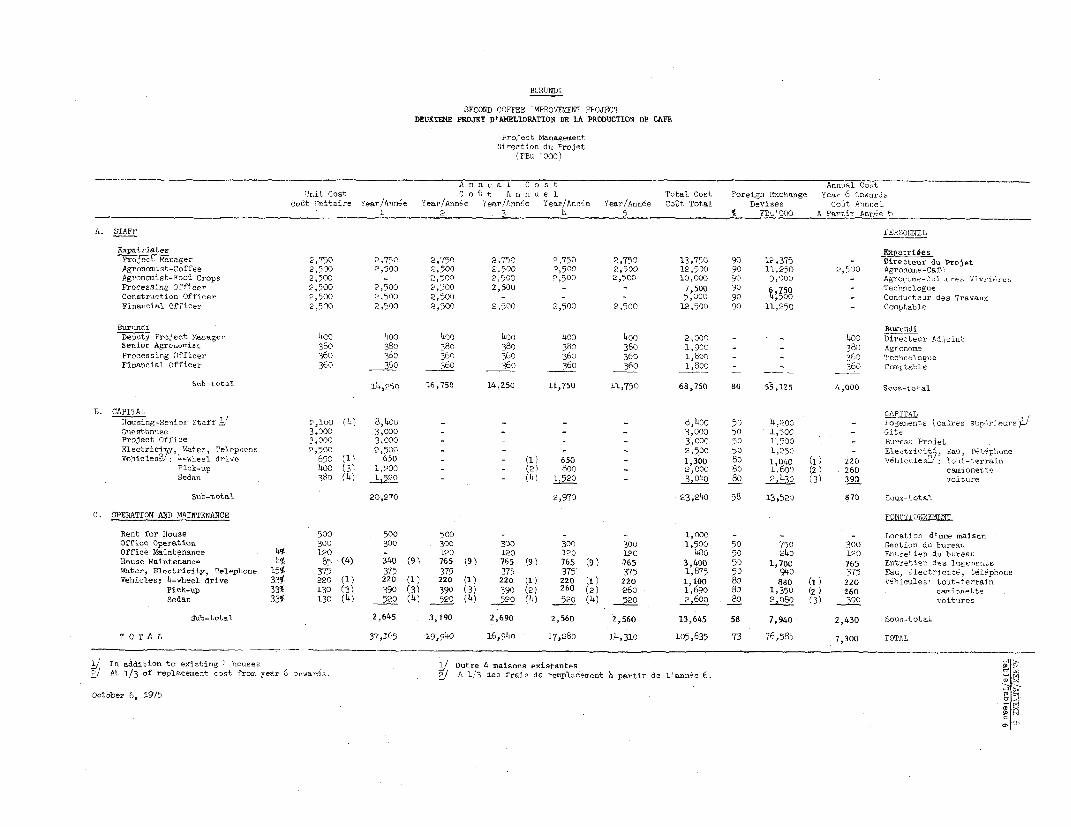
SECOIND COFFEE IMPRO'rNENC PPOJECTDEUXIEhE PROJET D'A»ELIOPATIOIZ DE LA PRODUCTION DE CAFE
Project ManagementDirection du projet
(PPu '000!
An n u a C o s t Annuel os
'r.it Cost C o 1i t A n n u e I Total Cont Poreigi, Exctange Year r 'nwards
Coit ITnitaire Year/Année Year/Année Year/Anné:e Year/Anr,-'e Year/Année Cout Total Devises Coût AnnueL
1____ _____ _____ _____ ____ _____ _____ ___ _ _ 2 3 4 F %. P1u O0 A Partir Anro e 6
A. STAFF PER212 2LL
triates E
Pro/est Manager 2,750 2,750 2,750 2,750 2,750 2,750 13,750 90 12,375 - Dire-teur du Projet
Agrmoomist-Coffee 2,500 2,500 2,500 2.500 2,500 2,500 12,500 90 11,250 2,500 Agroieoue-Caf,'
Agronomitt-Food Crops 2,500 - 2,500 2,500 2,500 2,500 10,000 yO 9,000 - Agroucca-C'lo,res Otorlér-e
Process'ng Officer 2,500 2,500 2,500 2,500 - - 7,500 90 6,750 - lechrologue
Construction Offiter 2,500 2,500 2,500 _ _ - 5,000 9o 4,500 _ Condlucteur des Travaux
Fioancial Of'ficer 2,500 2.500 2,500 2,500 2,500 2,500 12,500 90 11,250 - Comptable
Burundi Burundi
Leputy Prolcet Manager 400 4oc 4oo 40o 40o 400 2,000 - - 409 Directeuo Adjoint
Senior Aereuuu*isl 330 380 380 380 380 380 1,900 - - 380 Agron,me
Processing Officer 360 360 36C 360 360 360 1,Soo - - 3609 TcYno1Doîe
Financial officer 3(0 360 360 360 360 360 1,800 - - 360 Comptable
Sub-total 14,250 16,750 14,250 11,750 11,750 68,750 80 5,125 4,000 Soua-total
B. CAPITAL CAPI LAI
Housing-Senior Staff' 2,100 (4) 8,400 - - - - 8,400 50 4,2oC - T0ogeenleràs ,calreo siop4rteLre
Guestbo,se 3,000 3,000 - - - 3,000 50 1,500 - rite
Project Office 3,00o 3,000 - - - 3,090 50 1,530 - rnau Projet
flectriciy 7 Water, Celepl,ne 2,500 2,500 - - - - 2,500 50 1,050 - Electricitr, Eau, Télêplu,re
vemhices?: 4-wheel drive 650 (1) 650 - - (1) 650 - 1,300 80 1,040 (1> 220 Vé11ic1es27
tout-terrain
Pick-up 400 (3) 1,200 - - (2) 800 - 2,000 So 1,60C (2) 260 camionette
Sedan 380 (4) 1,520 - - (4) 1,520 - 3,040 80 12,3 (3) 390 '4oiture
Sub-tota1 20,270 2,970 23,240 58 13,520 870 Sous-total
C, OPERATION AID MATNITEANCE
Rent for House 500 500 500 - - 1,000 - - - Location d'une maison
Office Operation 300 300 300 300 300 300 1,500 50 750 300 Gention du bureau
Office Maintenance 4% 120 - 120 120 120 120 43o 50 240 120 Entretien du burea,
House Maintenance 4, 85 (4> 340 (9) 765 (9) 765 (9) 765 (9) 765 3,400 50 1,700 765 Entretien des loge.roctL
Water, Electricity, Telephone 151 375 375 375 375 375 375 1,875 50 940 375 Eau, r iectricite, téléphone
Vehitlee: 4-wheel drive 33% 220 (1) 220 (1) 220 (1) 220 (11 220 1) 220 1,100 80 880 (i) 220 VéhicLes- tout-terrain
Pick-up 33% 130 (3) 390 (3) 390 (3) 390 (2) 260 (2) 260 1,690 80 1,350 2) 260 cami;nette
Sedan 33% 130 (4) 520 (4) 520 (4) 520 (4) 520 (4) 520 2,600 80 2,08 (3) 390 voitures
Sub-total 2,645 3,190 2,690 2,560 2,560 13,645 58 7,940 2,430 So1os-total
T O T A L 37,165 19,940 16,940 17,280 14,310 105,635 73 76,58,5 7,300 TOTAL
In addition to existing 4 houses j Outre 4 maisons existantes "-'
j At 1/3 of replaceenot cost te-on year C onwadrs. j A 1,3 des irais de remplacemrent partir de l'année 6.
october 6, 3975

BrUnNDI
SEC0Wn COFFEE DTMROVEMTNT PROJEC0DEIJIEME PROJET D'»OELIORATION DE LA FRODUCTIOh DE CAPE
Tecbnical Advice and !ionitorin'Conseils Techniqlues et 5onidage
('.u ' 000 )
-A n n u a l C o s t Annual Cost
tnit Cost C o u t A n n u e I Total Cost Foreign Exchange Year ( Dnwards
Coût Trnitaire Year/Année Year/Année Year/Anm,e Year/Arnée Year/Année Coft Total Devises Co&t Annuel
1 2 3 4 5 % FBu'000 A Partir Asnm,e 6
A. STRPS PIlCOONtI.
Tenu of Advisers -Eq,ipe de Conseiller-
penn (dayel 24 (50) 1,200 (50) 1,200 (50) 1,200 (50) 1,200 (50) 1,200 6,000 100 6,000 _ Uc,roroPro, ______
Sprbsistee Conte 4 ,(n) 200 (50)200(50) 2GG (35) ZO tWO -U0- Indem:tés (,ioar
Ai Fares 160 (5) 800 (5) 800 (5) 800 (5) 80tl (5) 800 4,000 100 4,000 F Frais de Voyage
Supplementary Consbuls 1,000 1,000 1,000 1,000 1,0<- 1,000 5,000 50 2,500 _ ?unnui1n Skppîiooertaîren
Arceiteet (months) 200 (3) 600 200 - - - 800 - - ArchiteCte (mois!
Data Collecting Tew, Eqluipe de Sondage
Agricultural Ecolomit180 18° 10 1C TH(8C g o - - _ Econormiste Agricole
oE rcunrs 60 (4i 240 (4) 240 (4) 240 (4) 240 (4) 240 1,200 - - - Fruoesateurn
Driver (2 72 72 72 72 72 363 - - _ chauffelor
S2,b-kotab 4,292 3,892 3,692 3,692 3,692 19,200 65 12,500 _ Sous-total
B. CAPI TA L CAPITAL
Data Collecting Team Equipe de Sorldage
House 1/ 500 500 500 14 200 - Logeaent I/
Vehicle 400 40û - - 400 - 800 80 640 - Véhicule
SBh-totel 900 _ _ 400 - 1,300 65 840 - SDus-total
C. IPEJ?ATI h_AI_D MAIN.Là FLOECTIOxNwEfSlï
Housc 20 - 20 20 20 20 80 40 30 - Logement
'Tehlcke 135 135 135 135 135 135 675 80 1 - Véhicnle
Sub-total 135 155 155 155 155 755 76 572 So- ou-total
TOTAL, 5.327 4,047 3,847 4 3i 3287 2 I 65 13,912 _ 10121
I/ port agriculturel econaniat 1f Pour 8tcrsiste agricole. tJuly 1, 1975Po
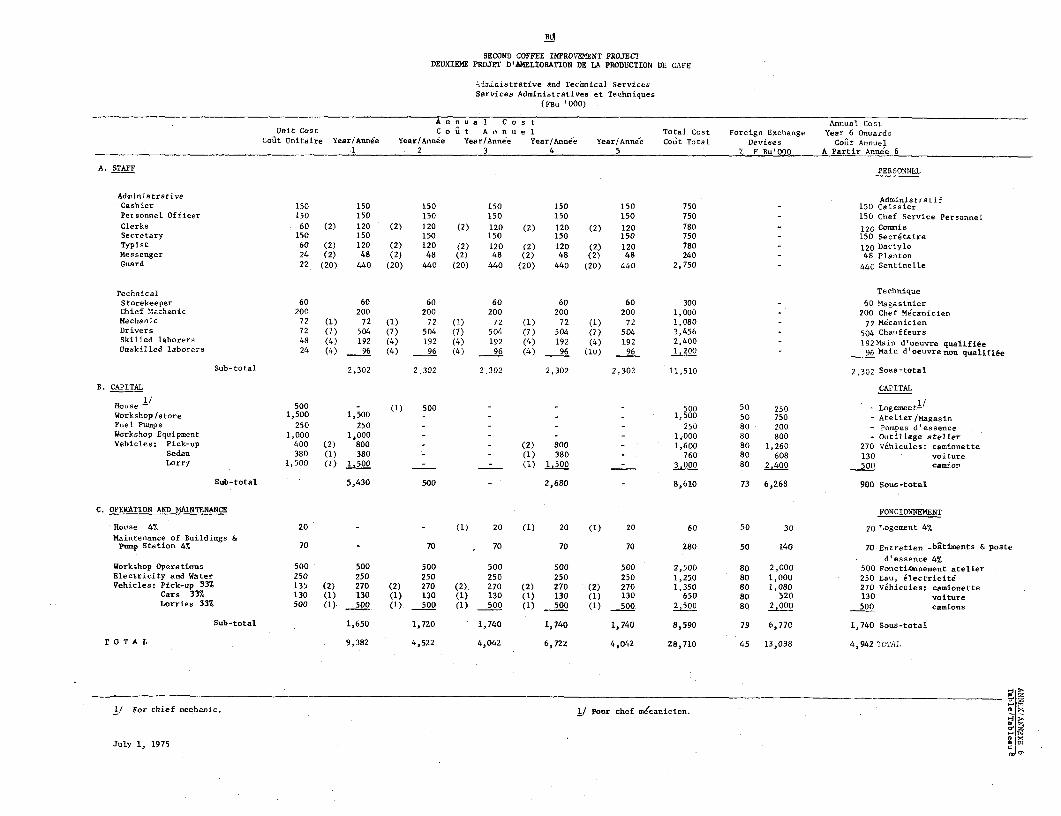
Bi.-
SECOND COFFEE IMPROVEMENT PROJECTDEUXIEME PROJET D'AMELIORATION DE LA PRODUCTION DE CAFE
Adainistrative and Technical ServicesServices Administratives et Techniques
(PEBu '000)
An n u a 1 C o s t Annual CostUnit Cost C o a t A n n u e 1 Total Cost Foreign Exchange Year 6 Onvards
Coût Unitaire Year/Année Year/Année Year/Année Year/Annee Year/Annee Coùt Total Devises Coût Annuel1 2 3 4 5 % F Bu'000 A Partir Année 6
A. STAFF PERSONNEL
Administrative AdministratifCashier 150 150 150 150 150 150 750 - 150 CaissierPersonnel Officer 150 150 150 150 150 150 750 - 150 Chef Service PersonnelClerks 60 (2) 120 (2) 120 (2) 120 (2) 120 (2) 120 780 - 120 CosmisSecretary 150 150 150 150 150 150 750 - 150 SecrétaireTypist 60 (2) 120 (2) 120 (2) 120 (2) 120 (2) 120 780 - 120 DactyloMessenger 24 (2) 48 (2) 48 (2) 48 (2) 48 (2) 48 240 - 48 PlantonGuard 22 (20) 440 (20) 440 (20) 440 (20) 440 (20) 440 2,750 - 440 Sentinelle
Technical TechniqueStorekeeper 60 60 60 60 60 60 300 - 60 Magasinier,aief Mechanic 200 200 200 200 200 200 1,000 - 200 Chef MécanicienMechanic 72 (1) 72 (1) 72 (1) 72 (1) 72 (1) 72 1,080 - 72 MécanicienDrivers 72 (7) 504 (7) 504 (7) 504 (7) 504 (7) 504 3,456 _ 504 Chs8uffeursSkilled laborers 48 (4) 192 (4) 192 (4) 192 (4) 192 (4) 192 2,400 - 192Main d'oeuvre qualifiéeUnskilled laborers 24 (4) 96 (4) 96 (4) 96 (4) 96 (10) 96 1,200 - 96 Main d'oeuvre non qualifiée
Sub-total 2,302 2.302 2 302 2,302 2,302 11,510 2,302 Sous-total
B. CAPITAL CAPITAL
Huase - 500 - (1) 500 - - - 500 50 250 - Logement-/Workshop/store 1,500 1,500 - - - _ 1,500 50 750 - Atelier /MagasinFuel Pumps 250 250 - - - - 250 80 200 - Pompes d'essenceWorkshop Equipment 1,000 1,000 - - - - 1,000 80 800 - Outillage atelierVehicles: Pick-up 400 (2) 800 - - (2) 800 - 1,600 80 1,260 270 Véhicules: camionette
Sedan 380 (1) 380 - - (1) 380 - 760 80 608 130 voitureLorry 1,500 (1) 1.500 - - (1) 1,500 - 3.000 80 2,400 500 camion
Sub-total 5,430 500 - 2,680 - 8,610 73 6,268 900 Sous-total
C. OPERATION AND MAINTENANCE PONCIONNEMENT
house 4b 20 - - (1) 20 (1) 20 (1) 20 60 50 30 20 Logement 4%Maintenance of Buildings &
Psump Station 47 70 - 70 70 70 70 280 50 140 70 Entretien -bâtiments 4 poste
d'essence 4%Workshop Operationus 500 500 500 500 500 500 2,500 80 2,000 500 Fonctionnement atelierElectricity and Water 250 250 250 250 250 250 1,250 80 1,000 250 Eau, électricitéVehicles: Pick-up 33% 135 (2) 270 (2) 270 (2) 270 (2) 270 (2) 270 1,350 80 1,080 270 Vehicûies: camionette
Cars 33% 130 (1) 130 (1) 130 (1) 130 (1) 130 (1) 130 650 80 520 130 voitureLorries 33% 500 (1) 500 (1) 500 (1) 500 (1) 500 (1) 500 2,500 80 25000 500 camions
Sub-total 1,650 1,720 1,740 1,740 1,740 8,590 79 6,770 1,740 Sous-total
T O T A L 9,382 4,522 4,042 6,722 4,042 28,710 45 13,038 4,942 TC0AL
1/ For chief mechanic. pour chef mécanicien.> ,1
July 1, 1975 c

BURUNDI
SECOND COFFEE IMPROVEMENT PROJECTDEUXIEME PROJET D'AMELIORATION DE LA PRODUCTION DE CAFE
Unit Costs for Coffee Washing StationsCouts Unitaires des Stations de Lavage
1. CAPITAL FBu 1. INVESTISSEMENT
Construction (Office, factory building, tanks,etc) 2,200,000 Construction (Bureau, magasin, usines, réservoirs,etc)Equipment (Machinery, piping, installation,etc) 1,900,000 Equipement (Machines, tuyaux, installation,etc)Drying Areas (Terracing, dryiug tables and trays) 1,000,000 Sections de sechage (Terrasses, tables,claies,etc)Miscellaneous equipment (Scales, office equipment,etc) 200,000 Equipement divers (Balances, mobilier du bureau,etc)Managers house 400,000 Maison pour responsableAccess Road 100,000 Piste d'acces
Total 5,800,000 Total
2. OFERATING COSTS 2. FRAIS DE FONCTIONNEMENT
a) Fixed Costs a) Couts fixesStaff and Permanent Labour vQQjOO.OOeMaintenance: Construction 5% 140,000 Entretien: construction 57%
Equipment 5% 110,000 équipement 5%Drying Areas 5% 50,000 sections de séchage 5%Access road 10% 10,000 pistes d'acces 10%
Sub-total 510,000 Sous-total
b) Variable Costs b) Coûts Variables- for 50 tons parchment coffee: - pour 50 tonnes de cl é nrcnaAlum, 40 k& @ FBu 25 /Kg 1,000 Alun, 40 kg @ FBu 25 /KgBags, 1 per 60 kg every 5 years, @ FBu 90 15,000 Sacs, 1 par 60 kg chaque 5 années, @ FBu 90Fuel, 400 litres, @ FBu 22 8,800 Carburant, 400 litres, @ FBu 22Oil, 27.5 litres, @ FBu 80 2,200 Huile, 27.5 litres, @ FBu 80Seasonal labor, 600 man days @ FBu 30 18,000 M.O. journalière, 600 jours @ FBu 30
Sub-total 45>000 Sous-total
- for 100 ton parchment 90,000 - pour 100 tonnes de parche- for 125 ton parchment 112,500 - pour 125 tonnes de parche
c) Total Operating Cost c) - Total frais de fonctionnement- for 50 ton parchment 520,000 - pour 50 tonnes de parche- for 100 ton parchment 565,000 - pour 100 tonnes de parche- for 125 ton parchment 587,500 - pour 125 tonnes de parche > k
M,
July 1, 1975
(D'>

ANNEX 7Page 1
BURUNDI
SECOND COFFEE IMPROVEMENT PROJECT
Requirements and Financing of Fertilizers and Other Inputs
1. During the first project all fertilizers were paid by projectfunds and farmers received the fertilizers free of any charge until theend of 1973. In 1974 the farmers were required to pay for the first time;the price was determined at FBu 6 per kg urea, which covered about half ofthe purchase cost. The new Project would finance the purchase of totalfertilizer requirements, both for coffee and food crops, during the firstProject year and the incremental quantities in the following years. Thecost of recurrent requirements would be financed by OCIBU which wouldadminister a special revolving f'ertilizer fund for that purpose.
2. Because of the currently high fertilizer costs and the resultingmarginal benefit-cost ratio of fertilizers applied to coffee, it would becounter-productive to charge the farmers with the full cost. A benefit-cost ratio of at least 2/1 would need to be assured to make the use offertilizers attractive (see also Annex 1). For a package, comprisingequal quantities of urea and NPK 20.10.10 the maximum price to be paidby the farmer would be about FBu 15 per kg. The farmers' price wouldbe increased gradually from FBu 6 per kg in 1974 to FBu 15 in 1977. Inthe last Project year this price would still remain about FBu 5 (or 25%)below the projected real cost of the fertilizer. It would be justifiedto finance the difference through a Government subsidy since the returnfrom fertilizers to the country as a whole is considerably higher thanthe return to the farmer (Annex 1, paragraph 20).
3. Farmer's prices for fertilizers to be applied to food crops wouldbe comparable with those for coffee and thus involve a subsidy element. Theprice of a fertilizer package for maize, comprising DAP and urea in the weightratio 150:80, would be gradualLy increased and reach FBu 20 per kg in 1978(about FBu 4 per kg below the expected cost price). Details on fertilizerrequirements for both coffee alnd food crops, as well as the costs involved,are given in Table 1.
4. All farmers' repayments for fertilizers, for improved seed andfor coffee pruning tools would be deposited in a special fertilizer fundto be administered by OCIBU. Estimates of the annual amounts to be paidout of the fund for the purchase of recurrent quantities of fertilizersand of farmers' payments into the fund are given in Table 2. The balanceof the fund would be positive in years 1 and 4 and slightly negative inyears 2, 3 and 5. From year 6 onwards an annual Governmnent subsidy ofabout FBu 4 million (US$50,000) would be required to balance expendituresand receipts of the fund, mainly because the farmers would not pay thefull fertilizer cost for coffee. In addition short term financing would
ANNEX 7Page 2
be required to finance fertilizer purchases until the farmers' paymentsare received. The annual amotnt involved would be about FBu 6.5 million(US$25,000) in Project years 2, 3 and 4, FBu 13 million (US$65,000) inyear 5 and FBu 15 million (USS190,000) from year 6 onwards.
July 1, 1975
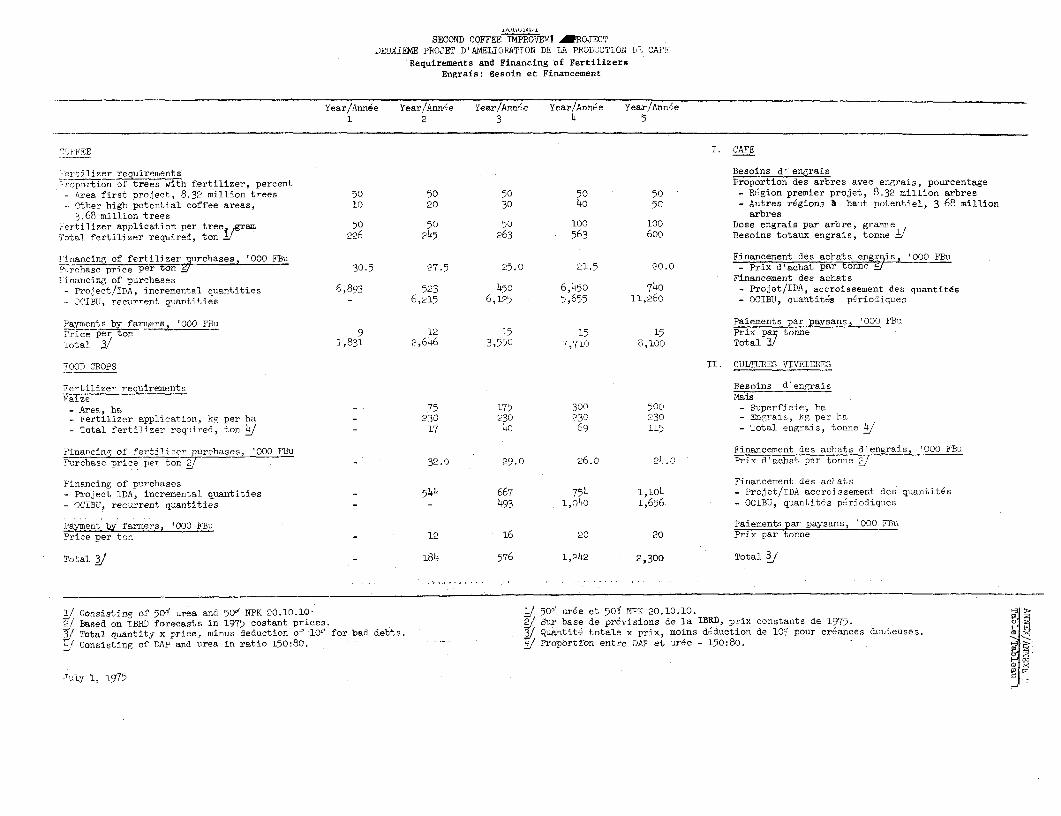
SECOND COFFEE IMPROVEN1 ,WROJECTDEUXIEME PROJET D'AMELIOBATION DE L7 PFOLJCTIOLW BR CA'F'
Requirements and Financing of FertilizersEngrais: Besoin et Financement
Year/Année Year/Année Year/Année Year/Année Year/Année
i 2 3 4 5
r h kEE I. CAFE
-`ertilizer requiremnents Besoins d' engrais
r-,portion of trees with fertilizer, percent Proportion des arbres avec engrais, pourcentage
- Area first project, 8.32 million trees 50 50 50 50 50 - Région premier projet, 8.32 million arbres-- ther high potential coffee areas, 10 20 30 40 50 - Autres régions à haut potentiel, 3 68 million3.68 million trees arbres
ertilizer application per tree gram 50 50 50 100 100 Dose engrais par arbre, granmne
'otal fertilizer required, ton i 226 245 263 563 600 Besoins totaux engrais, tonne /
'iriancing of fertilizer purchases, '000 FBu Financement des achats is '000 FBuPrchase price per ton '5- 30.5 27.5 25.0 21.5 20.0 - Prix d'achat par tonne- /
:inancing of purchases Financement des achats- Project/IDA, incremental quantities 6,893 523 450 6,450 740 - Projet/IDA, accroissemiient des quantités
yrJnIBTp, recurrent quatvtites - 6,215 6,125 5,655 11,260 - OCIBU, quantités périodiques
Payments by farmers, '000 PBu Paiements par paysans, '000 FBuPrice per ton 9 12 15 15 15 Prix par tonne
l'otal 31 1,831 2,646 3,550 7,710 8,100 Total i
FOOD CPOPS II. CULTURES VIVRIERES
Fertilizer requirements Besoins d'engraisMaise Mais
- Area, ha - 75 175 300 500 - Superficie- ha- Fertilizer application, kg per ha - 230 ?30 230 230 - Engrais, kg per ha- Total fertilizer required, ton 3/ - 17 40 69 115 - Total engrais, tonne 3
Financing of fertilizer purchases, '000 FBu Financement des achats d'engrais, '000 FBu
Purchase price per ton / - 32.0 29.0 26.0 24.0 Prix d'achat rar tonne 2
Financing of purchases Financement des achats
- Project IDA, incremental quantities - 544 667 754 1,104 - Projet/IDA accroissement des quantités
- OCIBU0 , recurrent quantities - - 493 1,040 1,656 - OCIBB, quantités périodiques
Payment by farmers, '000 FBu Paiements par paysans, '000 FBu
Price per ton - 12 16 20 20 Prix par tonne
Tota] - 184 576 1,242 2,300 Total
3 Consisting of 50 urea and 50e NPK 20.10.10 / 501 urée et 50# NPK 20.10.10. 2/ Based on IBRD forecasts in 1975 costant prices. 3 Sur base de prévisions de la IBRD, prix constants de 1975.3/ Total quantity x price, minus deduction of 10e for bad debts. 3/ Quantité totale x prix, moins d_duction de 101 pour créances douteuses. (D
Consisting of DAP and urea in ratio 150:80. Proportfon entre DAP et urée - 150:80.
Tuly 1, 1975

BURUNDISECOND COFFEE IMPROVEMENT PROJECT
DEUXIEME PROJET D'AMELIORATION DE LA PRODUCTION D',: CAFEFarmers'Payments for Inputs and Balances of OCIBU Fertilizer Fund
Paiements par les Paysans pour Facteurs de Production, et Soldes du Fonds Engrais OCIBU(PFBuÀ 000 )
Year/Année Year/Année Year/Année Year/Année Year/Année1 2 3 5
Financing of purchases by OCIRU Financement des achats par Fonds_e__i_l__e Fu1l- Engrais OCIBU
Recurrent fertilizer for coffee J - 6,?15 6,125 5,655 11,260 Engrais périodiqi,es pour caf- 1/Rec,urrent fertilizer for food crops J - 493 1,040 1,656 Engrais périodiques pour culture- vivrirres JTotal 6,215 6,618 6,95 1-2,916 Total
Fanners'r ents Paiements parpayEar.s
P'ertilizer for coffee J 1,831 2,646 3,550 j ,710 8,100 Engrais pour café 1Tools for coffee 2] 630 630 630 630 630 Outils pour café 2Fertilizer for food cr ps J - 184 576 1,242 2,300 Engrais pou-r cultures vivrières -Improved maize seeds 2 - 59 176 293 351 Semences de mais sélectionn-es 3/
Total 2,461 3,519 4,932 9,875 11,381 Total
Balance OCIBU PFertilizer Fund Solde Fonds Engrais OCIBU(ciiul-T- 2,461 ( 235) (1,921) 1,259 (276) ( cumuleé
Annex 7, Table 1. Annexe 7, Tableau 1.J At 501 of cost (Annex 6, Table 2) minus deduction of 1l0 for bad debts. J A raison de 50O' du coût d'achat (Annexe 6, Tableau 2):déduction de 10% pour créances douteuses.
J For quantities see Annex 4; price F`Bu 13 per kg; 10 deduction for 3/ Pour quantités voir Annexe 4; prix FBu 13 par kg;bad detts déduction de 10M pour créances douteusés.
July 1, 1975
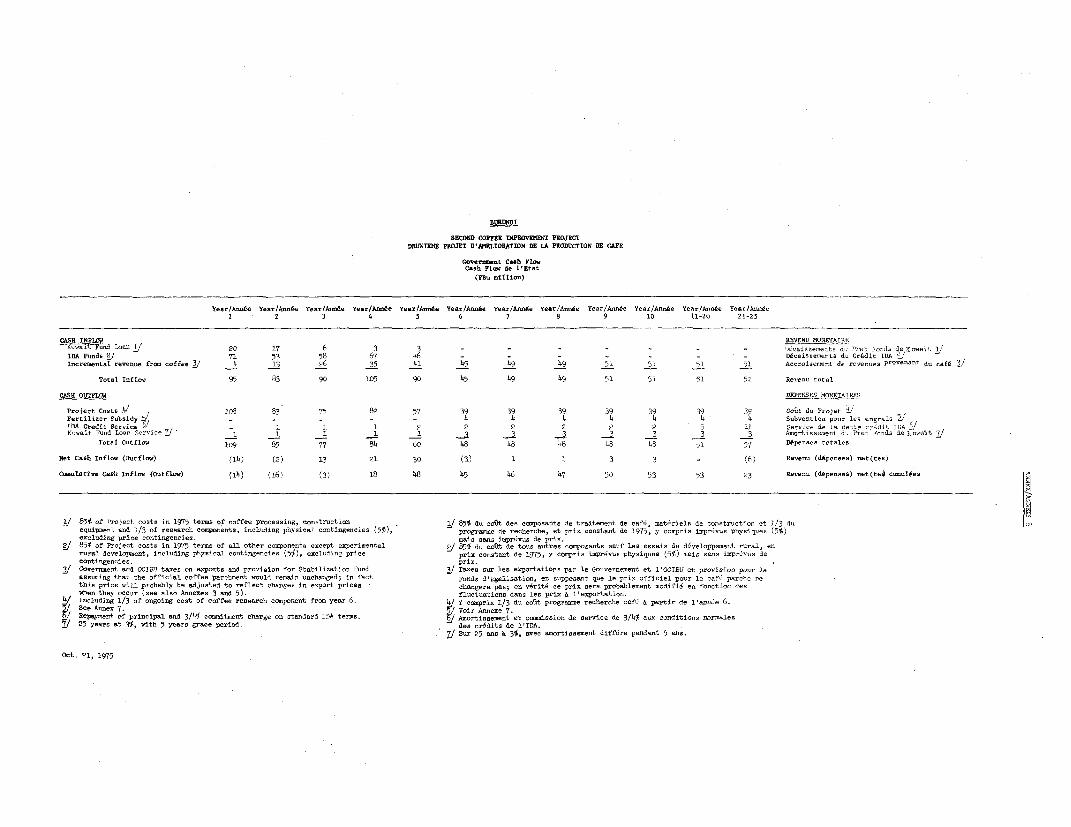
BURUNDI
SECORD COFFRE flPROVDEMUf PROJECTDEUXIEME PROJET D'»IELTORATION DE LA PRODUCTION DE CAPE
Gover.mont Cash FloxCash FlI de l'Etat
(PEu million)
Yeau/Année Voue/Année Yeaor/Arne Year(Ansée Year/Axeide Year/tnore Yannéee Yeat/Année Year/Ansée Year/Année YeAr/Anoée Vaa/drtAée
2 3 4 5 6 7 8 9 1O 11-20 21-25
CASH IN111 REVENTU MONETAIRE
Gl9iTr9lnd Loae 20 17 6 3 3 - - - _ - - _ 'Ycisse-rlts du -ret Fends de touait 1/
TDA Fends 2/ 71 53 58 67 46 - - - - - _ - Désoioeemnets du Crédit IDA "J
Tnnreosrntaî revenue fram caffia 3/ 4 13 26 35 41 45 49 49 51 51 51 51 Arnroeeet de revenu-es prve- nant du café 3]
Total Intlo 95 83 90 105 90 45 49 49 51 51 51 51 Revenu total
CASH OUTFLT w DEPENSES 5tONETAIFFiS
Project Costo .4/ 1<08 83 75 82 57 39 39 39 39 39 39 39 Coût du Projet S/
F-rtili-er S.b5idy 5/ - - - 4 4 4 4 4 4 4 Subhentiun peur lu regrets ,- /
MA tCrFdit Loerire 6' - 1 1 2 2 2 2 2 2 5 il Service de la dett redit ILA JK-nit F-ed L.- Servi un/ ] 1 i i i1 3 3 3 3 33 Assrttns~euet du fret Fundu du tuen.t 7/
Total Otfla 1s9 t5 77 84 60 48 48 48 48 48 51 57 Dépenses . ettlce
Net Caoh Infloi (Outflov) (14) (2) 13 21 30 (3) 1 1 3 3 - (6) Revenu (dépen.ea) net(trn)
Csuutive CaosTuh Iflai (Outflov) (14) (i6) (3) 18 48 45 46 47 50 53 53 23 Revenu (dépenses) net(tsè cu-ulos.
J 85 etf Project caste ie 1975 terse e o affee proce-sing, construction J 85 du coût duo coposanto de traitenent de café, matérielo de uonstruction et 1/3 du à
equip.ent sud 1/3 ef researeh cs& sneanta, including physical cotingeneies (p%), progrumme du recherche, et prix aonstent de 1975, y cempris imprévue physiques (5%)
uSmcludOug price -otingencies. nais sans imprévuo de prix.
J 857 of Praject costs it 1975 terus of ail other corponents except expnritentai _t 85% du cout du tous autres eaipasetu sauf les eauis do dévlelppement rural, en
rural develepoent, dnculding phynical costingencîes (5%), excluding prine prix constatt de 1975, y nompris impr4vus physiqune (5%) rais sans inprdvuu de
cortin5encis. prix.
GI davernment and OI 5J taxes on experts and proviaion for Stabili-ation Fusd 3/ Tanes sur tua expnrtations par le Gouvernement et l'OCIBU ut pruviso peur le
asouming thet the official coffe pareh.ennt voud remie umnchanged; in fact Fondo dlEgliatitn, en ouppoanst que le prix officiel pour te eafé parche ne
this priae sill proehbly bu adjeoted te reflect nhonges in export prices changera pas; en vérité ce prix sera probablment medifié en feectian des
eehen they occur (nec alun Annexes 3 osd 5). fluctustioss dans les prix à l'exprtation.
Q I.iliading 1/3 ef eegoiag no-t of crefee renearh coempanent frai year 6. QIY iemprin 1/3 du enflt pregrane recherche café à partir de l'année 6.
2 Sue Arnx 7. 5/ Voir Annexe 7.
6] Repayunt e=t principal and 3/49 cormitment charge -n standard IDA teuam. g Aa.ertiaaenent et cmission de service du 3/4% aux conditions noris s
25 yeara at 3%, with 5 Yers grace pario,d des credita de 1'IDA.
/ S-s 25 ana t 3%, avec amortistomeet différe pendant 5 ams.
Oct. 21, 1975

BURUNDI
SECOND COFFEE IMPROVEENT PROJECTDEUXIEME PROJET r'AMELIORATION DE LA PRODUCTION DE CAFE
Estimated Schedule of DisbursementsPlan Estimatif des Décaissements
(us$ooo )
IDA Fiscal Year Disbursement/Décaissement Exercise IDAQuarter Quarter/Trimestre Cumulative/Cumulé Trimestre
]975/76 1975/76
S'eptember SeptembreI)ecember DécembreMlarch - - Mars.June 400 400 Juin
1-976/77 1976/77
S'eptember 300 700 SeptembreI)ecember 300 1,000 DécembreMarch 250 1,250 MarsJune 250 1,500 Juin
1977/78 1977/78
September 250 1,750 SeptembreDecember 250 2,000 Décembre
March 250 2,250 MarsJune 250 2,500 Juin
-L978/79 1978/79
',eptember 2,750 SeptembreDecember 250 3,000 DécembreMarch 250 3,250 MarsJune 250 3,500 Juin
.1979/80 1979/80
September 250 3,750 SeptembreDecember 250 4,000 DécembreM.arch 250 4$1250 MarsJune 250 4,500 Juin
1980/81 1980/81
September 250 4,750 SeptembreDecember 250 5,000 Décembre
Marc~~~~~~~ ~200 5,200 Mars

ANNEX 10Page 1
BURUNDI
SECOND COFFEE IMPROVEMENT PROJECT
Farm Budgets
General
1. Farm sizes do not vary widely in Burundi and generally thereexists a close relationship between the size of the family and the areaof the holding. In Ngozi province, the average farm size is about 0.85 ha.Some 25% of the farms are smaller than 0.5 ha and 10% larger than 1.5 ha;all other farms measure between 0.5 and 1.5 ha.
2. Out of an estimategd total of 145,000 farms in the province, some20,000 farms are located on the Zaire-Nile watershed which is unsuitablefor coffee cultivation. About 110,000 of the remaining 125,000 farmersgrow coffee. Coffee occupies about 10% of cultivated land for most farms.Exceptions are the small farmns under 0.25 ha which have on average only2.5% of the land under coffee. The larger farms over 1.50 ha grow coffeeon about 7% of their land which is also slightly less than the average forthe middle size farma. For the great majority of the holdings the propor-tions of the various food crops in the cropping pattern do not vary withthe size nor with the location of the farms, except for the farms locatedon the Zaire-Nile watershed. With an altitude of more than 2,000 metersthese farms grow potatoes, w'heat and peas, instead of cassava, sweetpotatoes, and bananas.
3. The fertility of t'he land varies widely, even within farms. Thesupply of organic manure is an important factor and generally land close tothe farmer's residence is more fertile and better taken care of than moredistant plots. But, as described in Annex 1, coffee does less well in theeastern and southern parts of the province than in the other areas, andhence a distinction between "high" and "low" potential coffee growingareas has been made. Because of a lack of reliable data no attempt hasbeen made during appraisal to relate food crop yields to soil differencesin the various regions of the province.
Values of Crop Production
4. Estimates have been made on yields, seed and fertilizer costsand the gross and net values of production for coffee and the main foodcrops both with and without the proposed improvements. Average pricespaid in the local markets in Ngozi during 1974 have been used for thecalculation of the values of crops produced. These prices are subjectto wide fluctuation, but in general they were considerably higher in1974 than in previous years. High altitude crops like wheat, potatoes

ANiNEX 10Page 2
and peas have been excluded from this calculation since insufficientinformation is available on these crops. This, however, does not implvthat these crops should be excluded from the list of possible developmentactions. As stated earlier (Annex 4), the outlined food crop developmentprogram is tentative and changes in the course of the Project's implementa-tion are likely.
5. Tables 1 and 2 show 1-hat, at 1974 price levels, coffee grown inthe high potential coffee areas gives a better return than any other crop.Amongst the food crops, bananas rank first and in the low potential coffeeareas returns from pure stand bananas are about as high as from coffee.Improvement of coffee growing conditions in the high potential coffeeareas would result in an increase of the net value of production from itspre-development level of about FBu 33,500 (US$430) to FBu 38,000 - 40,000(US$485-510) per ha in year 7 clepending on whether or not fertilizers areused. Improved maize seed would increase the net production value byabout FBu 2,400 (US$30) from about FBu 12,950 (US$165) to about FBu 15,350(US$195) per ha. With both improved seeds and fertilizers, the net valueof maize production would rise to about FBu 21,550 (US$276), an increaseof FBu 8,600 (US$110). The combined income from 1 ha of improved maizewith fertilizer, grown in the first season and another food crop, forinstance beans, in the second season, would be about FBu 32,000 (US$405).This is about the same as the per ha income from pure stand bananas butstill lower than the income from coffee grown under improved conditionsin the high coffee potential areas.
Farm Budgets
6. The per ha estimates have subsequently been used to computebudgets for a typical farm measuring 0.85 ha at different stages ofcoffee and food crop development (Table 3). The assumed cropping pat-tern reflects the provincial average and is valid for nearly all farmsizes, except for the very small which have less coffee. There is noreason to believe that the standards of crop husbandry and the readînessto adopt modern inputs vary witn the size of the farms and therefore alinear relationship between farn size and farm income may be assumed.
7. With the Project, cash income from coffee in the area of thefirst project would be FBu 3,931) (US$50) for a typical farm measuring0.85 la. Tlis is FBu 300 (US$3.80) higner tian obtained without theProjeet and FBu 125 (US$1 .60) more than the farmer receives at present(see also Annex t). This increase is modest because of the small sizeof thie coffee plantations and because farmers would pay 150% more forfertilizer as they did in 1974.
8. In the other high porential coffee areas cash receipts from.^offee would by year 7 reach the saine level as in the area of the firstproject, which means an increase of Phu 585 (US$7.50) over the actualincome of FBu 3,345 (US$42.50) for a Tarm with 0.10 ha of coffee. Inth1e low porenltial coffee areas, incomes from coffee would L;crease by*Bu 175 (US$2.25) fromi FBu 2,990 (US$>3.25) tG FEu 3,165 (IJS$40.50).
ANWEX i 0Page 3
Variations in incremental cash incomes from coffee are however expectedto be substantial, not only for farmers located in the different areasbut also for farmers within a particular area, depending upon the extentthey adopt the improved techniques. Farmers who would combine all Projectactivities could easily achieve incremental cash incomes which are doubleof those indicated above.
9. An estimated 6,000 farmers would increase the net value of theirproduction by about FBu 565 (US$7.25) through the cultivation of 0.25 hamaize with improved seeds instead of the usual mixture of maize and beansgrown from local seeds. Some 2,000 of these farmers would also use fer-tilizer on their maize which could result in a further increase of aboutFBu 1,550 (US$19.75).
10. The net value of alL crops grown on a typical farm of 0.85 hawas in 1974 about FBu 26,000 (US$332). As a result of the Project activ-ities aiming at the improvement of coffee growing techniques the net valueof the production would rise by amounts varying between FBu 175 in theareas with a low potential for coffee growing and FBu 650 - and possiblymore - in the high potential areas where the new techniques, includingfertilization, would be adopted by about half of the farmers. In thelatter areas the net value of total crop production would rise to aboutFBu 28,750 (US$367) when farmers combine coffee improvement with the useof selected seeds and fertilizers for maize.
July 1, 1975

BUTUNODISECOND COFFEE IMPROVEMENT PROJECT
DEUXIEME PROJET D'AMELIORATION DE LA PRODUCTION DE CAFE
Net production values per ha for coffee in three different areas ±/Valeur nette de la production par ha pour café dans trois régions différentes 1/
Production Fertilizer Net value -Production Engrais of production
Quantity Gross4 Quantity Unit Costparchment value-J price2 Valeur netteQuantité Valeur Quantite Prix Coût de la produc-parche bruS 4/ unitaire2/ tion
(kg) (F bu) (kg) (F Bu) (F Bu) (1` Bu)
Area first project,1974/75- with fertilizer 930 4o,g2o 224 C 1,344 3Q,576 Région 'remier Drojet, t974/75- without fertilizer 830 36,520 - - - 36,520 - avec engrais- average 880 38,720 112 6 672 38,o48 - sans engrais
- moyenne
WITHOIT PROJECT SANS PROJET
Area first project 825 36,300 - - - 36,300 Région premier pro,et
Other high potential areas 760 33,44o 33,44o Autres régions a haut potentiel
Low potential areas 680 29,920 - - - 29,920 Reegions à bas potentiel
WITH PROJECT AVEC PROJE1'
Areas first project Région premier proHi,et--with fertilizer2/ 970 42,680 160 15 2,400 40,280 - avec engraiswithout fertilizer 870 38,280 - - - 38,280 - sans engrais
- average 920 40,480 80 15 1,200 39,280 - moyenne
Other high potential qreas.1 Autres régionsà hfut potentiel L/- with fertilizer 3] 930 40,920 160 15 2,400 38,520 - avec engrais -3- without fertilizer 830 36,520 - - 36,520 - sans engrais- average 880 38,720 80 15 1,200 37,520 - moyenne
Low potential areas 720 31,680 - - - 31,680 Regions de bas potentiel
L/ Based on 1,600 trees Der ha 1/ Si base de 1,600 arbres par ha2/ 'Urea, 461Y N 2 rée, 46e N.
1/ i2 urea and 1/2 N.P.K., 20.10.10 1/2 urée et 12 N.P.K., 20.10.10 /Based on a archment orice of 44 i Bu per kg. Sur base du prix de 44 F Bu par kg cate-parche.5/ Prices oaid by farmers 5/ Prix payés par les paysans.Year 5 figures; in year 7 production would be same as 6/ Ch.iffres pour l'annee 5; l'année 7, la production attendraitin area of first project. - le meme niveau que dans la région du premier projet.
July 1, 1975 O

BURUNDI1SECOND COFFEE IMPNOVEMENT PROJECT
DEUXIEME PROJET D'AMELIORATION DE LA PRODUCTION DE CAPE
Nlet Production Values per ha for Food Cropseleur Nette de la roduction par.a pour des Culture Vivrières
Production Seeds Fertilizer Total Net value ofProduction Semences Engrais costs production
Quantity Unit Gross Quantity Unlt Cost Quantity Unit CostPrice value Price Price Valeur nette
Quantité Prix 'laleur Quantité Prix Coût Quantité Prix Coût Coût de launitaire brute unitaire unitaire total production
(kg) (F Bu) (F Bu) (kg) (F Bu) (F Bu) (kg) (F Bu) (F Bu) (F Bu) (F Bu)
WIBHOIJT PROJECF SANS PROJET
Pure Stands Cultures pures
- Banana, tills 7,500 4 30,000 - - - - - - - 30,000 - Banane, colline- Cassava, hills 6,ooo 4 24,oOo - - - - - - - 24,0Oo - Manioc, colline- Sweet potato, tille 6,ooo 4 24,ooo - - - - - - - u4 000 Patate douce, colline- Sweet potato, marshes 8,000 4 32,000 - - - - - - - 32,00I - patate douce, marais- Beans, hills 800 15 12,000 80 15 1,200 - - - 1,200 10,800 - Haricot, colline- Mai-e, hills 1,100 12 13,200 20 12 240 - - - 240 12,960 - Mais , colline
Mixed Stands Cultures associées
- Bana-, hills 4,ooo 4 16,000 - - 16,0oo - Banane, colline_ Cassava, hills 1,000 4 4,ooo - - 4,0co - Manioc, colline_ Sweet potato, hills 2,000 4 8,0o0 - - - - - - - 8,000 - Patate douce, colline_ Beans, hills, long rain season 700 15 10,500 70 15 1,050 - - - 1,050 9,450 - Haricot, colline, longue sais0e pluie_ Beans, hills, short rain season 600 15 9,000 60 15 900 - - - 900 8,100 - Haricot, colline, courte saison pluie- Beans, marshes 750 15 11,250 70 15 1,050 - - - 1,050 10,200 - Haricot, marais- Maize, hills 425 12 5,100 10 12 120 - - - 120 4,980 - Mais, colline- Maize, marshes 1,275 12 15,300 15 12 180 - - - 180 15,120 - Mass, marais- Sorghum, hllts 400 12 4,800 10 12 120 - - - 120 4,680 - Sorgho, colline- Other crops _ - 15,000 - - - - - - - 15,000 - Autres cultures
WITH PROJECT AVEC PROJET
Pure Stands, hills Cultures pures, collines
Maize, improved seed, na fertilizer 1,300 12 15,600 20 13 ./ 260 - - 260 15,340 - Maize, seememces selectionnées,pas d'engreisMaize, improved seed, fertilizer 2,200 12 26,400 20. 13 j 260 230 20 4,600 4,860 21,540 - Maize. semences selectionnées, engrais
j Market price for malze plils 1 F Bu per kg. j Prix du marché pour mais plus 1 F Bu par kg.É/ 150 kg DAP,phosphate 40%, and 80 kg ures, 46% N; 2/ 150 kg DAP,phosphate 40%, et 80 kg urée, 46% N;
price FBu 20 per 1e. prix FBu 20 per kg. kg,
Juiy 1, 1975
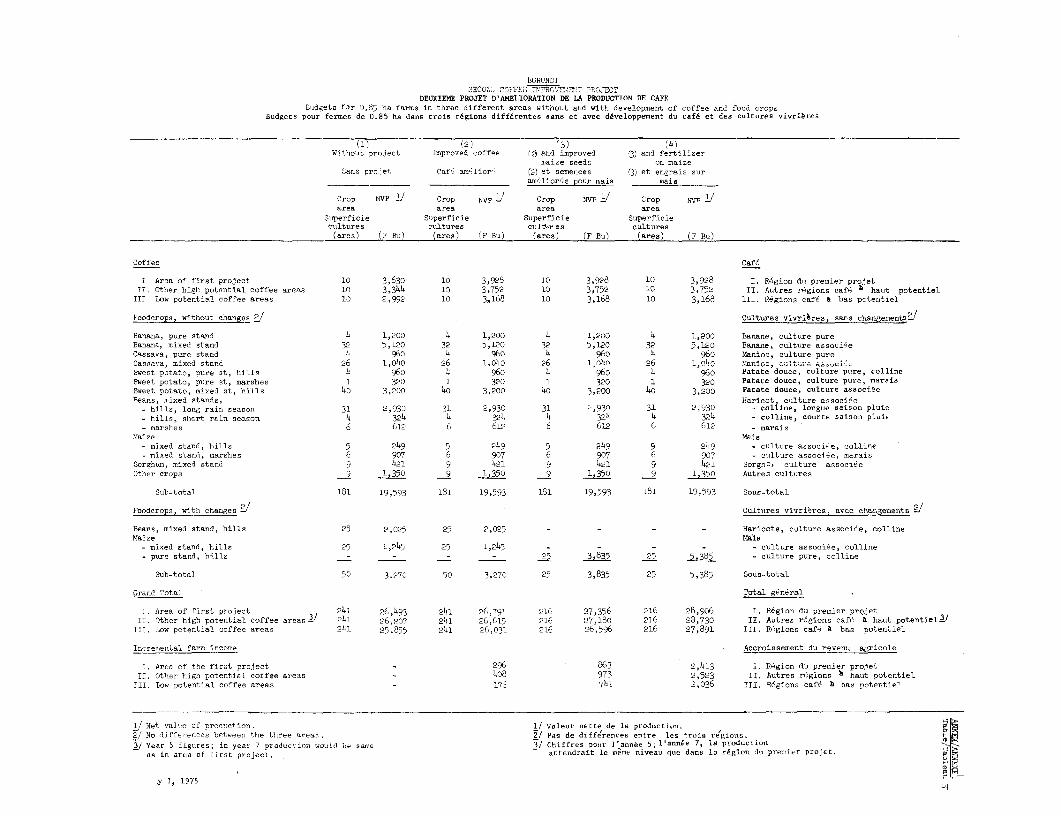
BURUNDISECO.LCrE IIIC,ï'--FE.rC
DEIJXIEME PROJET D'AMElIORATION DE LA PRODUCTION DE CAFFBiudgets for 0.85 ha farms in three different areas without and with development of coffee and food crops
Budgets pour fermnes de 0.85 ha dans trois régions différentes sans et avec développement du café et des cultures vivrières
(1) (2) '3) (4)Without proiect Improved coffee (3 and improved 3; and fertilizer
mize seeds on maizeSans pro'et Safd amelierS (2) et semences (3) et engrais sur
_pouaméliorés pour sais mais
Crop NvP 1/ Crop NVP S/ Crop SNv il Crop SVP 1/area area area area
Superficie Superficie Superficie Superficiecultures culltures cuItur es cultures
(ares) (F Bu) (ares) (F Bu) (ares) (F Bu) (ares) (F Bu)
Coffee Café
I Area of first project 10 3,630 10 3,928 10 3,998 10 3,928 I. Région du premier projetII. Ottler high potential coffee areas 10 3,344 10 3,752 10 3,752 10 3,752 II. Autres régions café h haut potentiel
IIT Iow potential coffee areas 10 2,992 10 3,168 10 3,168 10 3,168 III. Régions café a bas potentiel
Foodcrops, w_thout changes g! Cultures vivrières, sans chmngementre/
Banana, pure stand 4 1,200 4 1,200 4 1,200 4 1,200 Banane, culture pureBanana, mixed stand 32 5,120 32 5,120 32 5,120 32 5,120 Banane, culture associéeCassava, pure stand 4 960 4 960 4 960 4 960 Manioc, culture pureCassava, mixed stand 26 1,040 26 1,040 96 26 1, 04)0 Mlanric, culture asiclsbweet potato, pure st, hills 4 960 4 96o 4 960 4 960 Patate douce, culture pure, collineSweet potato, pure st, marshes 1 320 1 320 1 320 1 320 Patate douce, culture pure, maraisSweet potato, mixed st, hills 40 3,200 40 3,200 40 3,200 4o 3,200 Patate douce, culture associéeBeans, mixed stands, Haricot culture associee
- hills, long rain season 31 2,930 31 2,930 31 2930 31 2,930 - colliine, longue saison pluie- bills, short rain season 4 324 4 324 4 324 4 324 - colline, courte saison pluie- marshes 6 612 6 6i2 6 612 6 6l2 - marais
Maize Mais- mixed stand, hills 5 249 5 249 5 249 9 249 - culture associîe, colline- mixed stand, marshes 6 907 6 907 6 907 6 907 - culture associ-e, marais
Sorghum, mixed stand 9 421 9 421 9 421 9 421 Sorgho, culture associéeOther crops 9 1,350 9 1,350 9 1,350 9 1,350 Autres cult,,res
Sub-total 181 19,593 181 19,593 181 19,593 ii 19,593 Sous-total
Foodcrops, with changes 2/ Cultures vivrières, avec changements
Beans, mixed stand, hills 25 2,025 25 2,025 - - - - Haricots, culture associée, collineMaize Mais
- mixed stand, hills 25 1,245 25 1,245 - - - - culture associée, colline- pure stand, tills - - - _ 25 3,835 25 5,385 - culture pure, colline
Sut-total 50 3.270 50 3,270 25 3,835 25 5,385 Sous-total
Grand Total Total général
1. Area of first project 241 06,493 241 26,791 2IC 27,356 216 98,906 I. Région du premier projetIl. Other high potential coffee areas _ 241 26,207 241 26,615 216 27,18o 216 28,730 II. Autres régions café R haut potentiel 3/
III. Low potential coffee areas 241 25,855 241 26,031 216 26,596 216 27,891 III. Régions café à bas potentiel
Incremental farm incoae Accroissement du revenu agricole
*. Area of the first project - 296 863 2,413 I. Région du premier projetII. Othler high potential coffee areas - 408 973 2,523 II. Autres régions a haut potentiel
III. tom potential coffec arems - 175 741 2,036 III. Régions café à bas potentiel
/ Net val`e of production. l/ Valeur nette de la production.2/ No differences between the three areas. 2/ Pas de diffe'rences entre les trois réegioes.
Y2 Year 5 figures; in yesr 7 production wko,ld be same 3I Chiffres poser l'annee 5; l'année 7, la productionas in area ef fir-t project. attendrait le mens niveau que dans la région Su precier projet,
1y 1, 1975

MNNEX 1,Page 1
BURUNDI
SECOND COFFEE IMPROVEMENT PROJECT
Advisory Team of International Experts
1. With a high rural population density and limited scope for theexpansion of its cultivated areas, Burundi needs to give high priority tothe increase of its on-farm production. Because of population pressures,farm sizes have become smaller, soil fertility has been reduced throughthe lack of sound husbandry, and as a result crop yields have in manyinstances declined. Crop diseases and pests, particularly in coffee,have increased and have also contributed to reduced yields. To helpmaintain farm cash incomes and foreign exchange earnings, more areashave been planted under export crops reducing the area available forfood crops. If recent trends continue, Burundi would be faced with aserious situation in which it may be difficult to sustain export earningsand with increasing dependence on imported food.
2. Although the broad directional needs can be clearly defined, themeans of meeting them are far from certain and present many technological,organizational and economic as well as social problems. Little researchwork has been carried out and little attention has been given to the devel-opment of integrated farm systems, applicable to a large number of amallfarmas which would also improve and sustain soil conservation and fertility.Moreover, the last two years the rapid increase in fertilizer and pesticideprices has made necessary a reappraisal of their economic application. Atthe farm level extension services are weak and poorly managed and input,credit and marketing services inadequately provided.
3. This overall situation is by no means unique to Burundi. Itsorigins, however, significantLy reflect the country's poverty and thelimited budgetary support which it can allocate for agriculture. ThisÏn turn necessitates the urgent development of the most effective andeconomic technical and delivery systens for the fundamentally difficulttask of on-farm improvement and for which Burundi has few alternatives.In this endeavor Burundi can afford to make even fewer mistakes than otherdeveloping countries and it should therefore seek to draw as much as possi-ble on the experience of other countries.
4. To meet production needs, the proposed Project would assist anumber of on-farm development opportunities even though some componentsat present lack sufficient technical knowledge to prescribe preciseprograms. To implement the Plroject effectively it will therefore benecessary to provide a high level of technical support. This would requireemphasis on applied research and would also involve extension, supporting

N LNE-X i1Page 2
farm services and economic analysis of alternative systems. Because ofthe diversity of needs this recquirement could not be provided throughProject management nor would it: be possible to secure a permanent teamof experts at the level required to reside in the country. To the con-trary, there would be a distinct advantage in having a team of expertswho would visit the country periodically but regularly, who could providewide international experience and redirect the focus of existing services(rather than an accelerated expansion of those services without appro-priate direction).
5. It is envisaged that the team would comprise three experts whocollectively would provide technical guidance in the following subjects:
(a) coffee cultivation with particular regard toplanting varieties, cultivation practices,including fertilizer application, and pestand disease control;
(b) coffee processing with particular regardto product improvement by alternativemethods;
(c) food crop development: with emphasis onvarietal improvements, cultivation prac-tices and fertilizer application;
(d) on-farm livestock possibilities in the con-text of developing irLtegrated farm systems;
(e) soil conservation ancL improvement; and
(f) extension and farm support services.
6. The team would visit Burundi twice in the first year, and once o-twice per year in the following years, for periods of 2-3 weeks each, ifpossible in conjunction with Batnk supervision missions. The Project Managerwould be responsible for conduc:ting the team's visits and for providing itwith progress and technical reports and work programs. These would besystematically reviewed by the team with Government counterpart staff underthe chairmanship of a senior official during visits and recommendations madeas appropriate. In addition, the team would make recommendations for ad-hocconsultations on specific problems, when appropriate. It is anticipated thatthe team would have general discussions with the Government on Burundi'spossibilities and priorities fc,r agricultural development, and further directits attention at the technical problems associated with the Project thoughthis would not preclude a review of other related developments outside theProject area. Its work would also be expected to provide Government with astronger technicai base on which to prepare further projects. It is possiblethat the team would have the scme composition as that being proposed toprovide advice for a similar project in neighboring Rwanda.

.Ali`.EX t 1Page 3
7. The selection of the team members would be made by Government inconsultation with the Association. It would be particularly important thatthe team members would agree to serve for at least three years and the selec-tion of the team leader would be crucial in view of the coordinating rolewhich he would be expected to play.
July 25, 1975
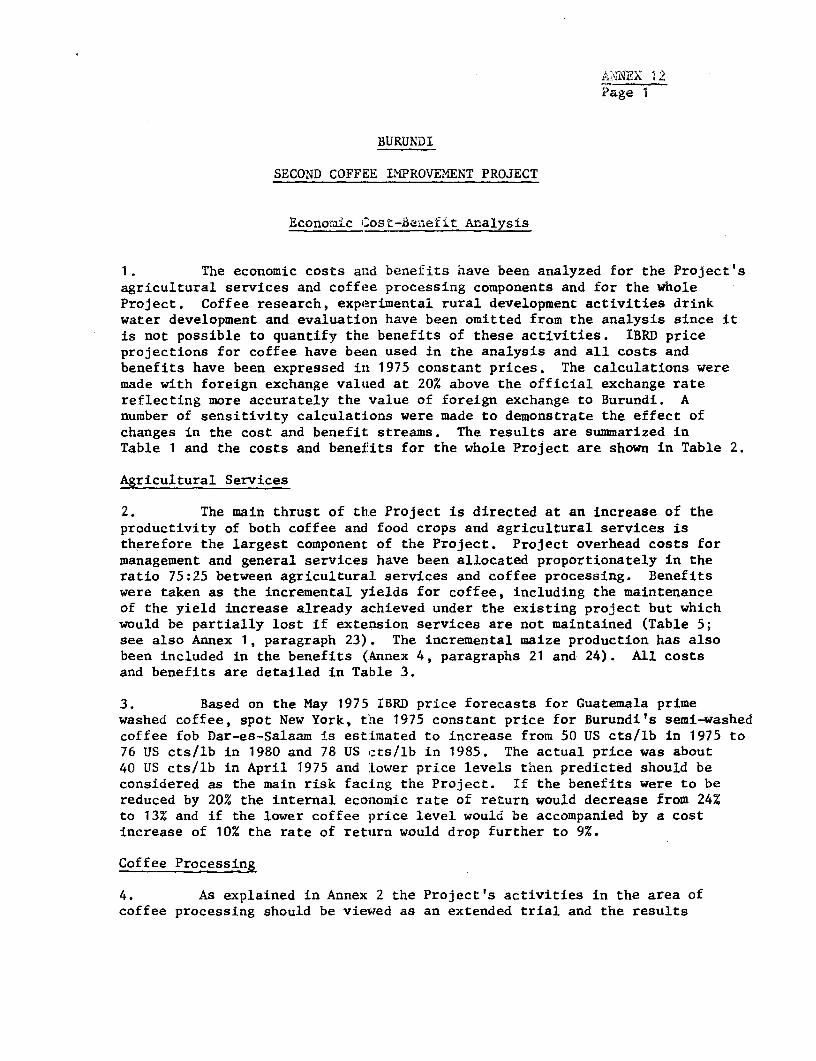
L"'NEX 1 2Page t
BURUNDI
SECOND COFFEE LEPROVEMENT PROJECT
Economic ,'ost-Beiefit Analysis
1. The economic costs and benefits have been analyzed for the Project'sagricultural services and coffee processing components and for the wholeProject. Coffee research, experimental rural development activities drinkwater development and evaluation have been omitted from the analysis since itis not possible to quantify the benefits of these activities. IBRD priceprojections for coffee have been used in the analysis and all costs andbenefits have been expressed iII 1975 constant prices. The calculations weremade with foreign exchange valued at 20% above the official exchange ratereflecting more accurately the value of foreign exchange to Burundi. Anumber of sensitivity calculations were made to demonstrate the effect ofchanges in the cost and benefit: streams. The results are summarized inTable 1 and the costs and benef'its for the whole Project are shown in Table 2.
Agricultural Services
2. The main thrust of the Project is directed at an increase of theproductivity of both coffee and food crops and agricultural services istherefore the largest component of the Project. Project overhead costs formanagement and general services have been allocated proportionately in theratio 75:25 between agricultural services and coffee processing. Benefitswere taken as the incremental yields for coffee, including the maintenanceof the yield increase already achieved under the existing project but whichwould be partially lost if extension services are not maintained (Table 5;see also Annex 1, paragraph 23). The incremental maize production has alsobeen included in the benefits (Annex 4, paragraphs 21 and 24). All costsand benefits are detailed in Table 3.
3. Based on the May 1975 IBRD price forecasts for Guatemala primewashed coffee, spot New York, t`ne 1975 constant price for Burundils semi-washedcoffee fob Dar-es-Salaam is estimated to increase from 50 US cts/lb in 1975 to76 US cts/lb in 1980 and 78 US cts/lb in 1985. The actual price was about40 US cts/lb in April 1975 and lower price levels then predicted should beconsidered as the main risk facing the Project. If the benefits were to bereduced by 20% the internal economic rate of return would decrease from 24%to 13% and if the lower coffee price level would be accompanied by a costincrease of 10% the rate of return would drop further to 9%.
Coffee Processing
4. As explained in Annex 2 the Project's activities in the area ofcoffee processing should be viewed as an extended trial and the results

ASSNEX 12Page 2
thereof would provide the basis for future investment decisions. In orderto give a further illustration of the critical importance of items such asthe price premium for fully washed coffee and the annual production of thestations a detailed economic analysis has been made of the coffee processingcomponent. It should be understood, however, that the main purpose of thetrial period would be to test the assumptions.
5. The construction costs for the 4 new stations with the operatingcosts for the 4 new as well as tne 4 existing stations have been included inthe cost stream of the processing component. The investment cost of the 4existing stations has been treat:ed as sunk costs since the stations vould notfunction properly without the rmangement assistance provided for under theProject. Project overhead costs have been allocated proportionally as indicatedin paragraph 2. The incremental value of the fully washed coffee produced bythe 8 stations has been included in the benefits (Tables 6 and 7). The annualcosts and benefits are shown in Table 3.
6. If the investment cost for che 4 existing stations were not to betreated as sunk cost but added to the cost stream in year 1 the internal rateof return would decrease from 9% to 47%. In another test the cost of anexpatriate processing officer was added to the cost stream from year 4 on-wards as it is as yet uncertain if the 8 stations can be properly managedwithout his assistance after the completion of the 3 year trial period.This would reduce the internal rate of return from 9% to 2%. It would, how-ever, probably be feasible to provide part-time expatriate management assis-tance during the processing season in which case the reduction in the rateof return would be less.
7. The IBRD coffee price projections were changed after the economicevaluation of the earlier anticipated construction program for 20 washingstations was made (see Annex 2). Compared with the previous forecast thechange amounts to an increase of the price level of about 20% from 1977/78onwards. Taking also into account that Burundi sold a small consignment offully-washed coffee, produced in 1974, at a price which exceeded that forsemi-washed coffee by about 5 US cts/lb, fob Dar-es-Salaam, only, a 15% pricepremium for fully-washed coffee no longer appears justified. Hence, a 10%premium has been assumed, amounting to a premium of 6 US cts/lb in 1975,7 cts in 1976 and 8 cts from 1977 onwards. If the premium were to be 12.5%instead of 10%, the internal rate of return would rise from 9 to 16%. Thisunderlines the critical importance of adequate marketing arrangements forthe Project's fully-washed coffee.
8. In a final test it has been assumed that the annual production ofthe stations would be 150 ton of parcl-ment coffee instead of 125 ton. Thiswould increase the rate of return from 9 to 15% and again proves how impor-tant it would be to try to raise the throughput of the stations during the3 year trial period.
July 8, 1975

BURUNDI
SECOND COFFEE IMPROVEMENT PROJECTDEUXIEME PROJET D'IAMELIORATION DE LA PRODUCTION DE CAFE
Economic Cost - Benefit Analysis - Rates of Return and Sensitivity AnalysisAnalyse Economique des Coûts et des Avantages - Taux de Rentabilité et Etude de Sensibilité
Internal Rate of Return1. Whole Prolect - Taux de Rentabilité 1. ProJet Entier l/
Foreign exchange shadow priced at 120% 21% Devises calculés au taux d'échange virtuel de 120%No shadow pricing of foreigu exchange 17% Devises calculés au taux d'échange officielAll costs increased by 10% 16% Tous les coûts augmentés par 10%Benefits reduced by 20% 11% Tous les avantages réduits par 20%Costs increased by 10% and benefits reduced by 20% 7% Tous les coûits augmentés par 10% et tous les avantages réduits par 20%
2. Agricultural Services 2/ 2. Services Agricoles Seulement 2/
Foreign exchange shadow priced at 120% 24h Devises calculés au taux d'échange virtuel de 120%No shadow pricing of foreign exchange 20% Devises calculés au taux d'échange officielCosts increased by 10% 19% Tous les coûts augmentés par 10%Benefits reduced by 20% 13% Tous les avantages réduits par 20%Costa increased by 10% and benefits reduced by 20% 9% Tous les couts augmentés par 10% et tous les avantages réduits par 20%
3. Coffee Processing Only 3/ 3. Traitement de Café Seulement 3/
Foreign exchange shadow priced at 120%; Devises calculés au taux d'échange virtuel de 120%;10% premium for fully-washed coffee 9% prime de 10% pour le café fully-washed
No shadow pricing of foreign exchange 6% Devises calculés au taux d'échange officielAll costs increased by 10% 5% Tous les coûts augmentés par 10%Investment cost of 4 existing stations included in Coûts d'inves ,ssement des 4 stations existantes compris dans
year 14/ 4% l'année 1Costs of expatriate processing officer included from Y compris coit d'un technologue-expatrié à partir de
year 4 onwards 5/ 2% l'année 4 1Premium for fully-washed coffee 12.5% 16% Prime pour le café fully-washed 12.5%Production 150 ton parchment per station per year Production 150 tonnes café parche par station per année
instead of 125 ton 15% au lieu de 125 tonnes
1/ Except coffee research, experimental rural development activities 1/ Sauf recherche du café, programme pilot de développement rural etand evaluation; see Table 2. évaluation; voir tableau 2.
2/ Table 3. 2/ Tableau 3. S"3/ Table 4. 3/ Tableau 4.4/ Treated as sunk cost in the other calculations. 4/ Pas compris dans les autres calculs car ces coûts étaient déja encourues. fD5/ Project provides for expatriate processing officer for first 3 5/ Projet envisage technologue expatrié pour premières 3 années seulement. a
years only.
October 6, 1975
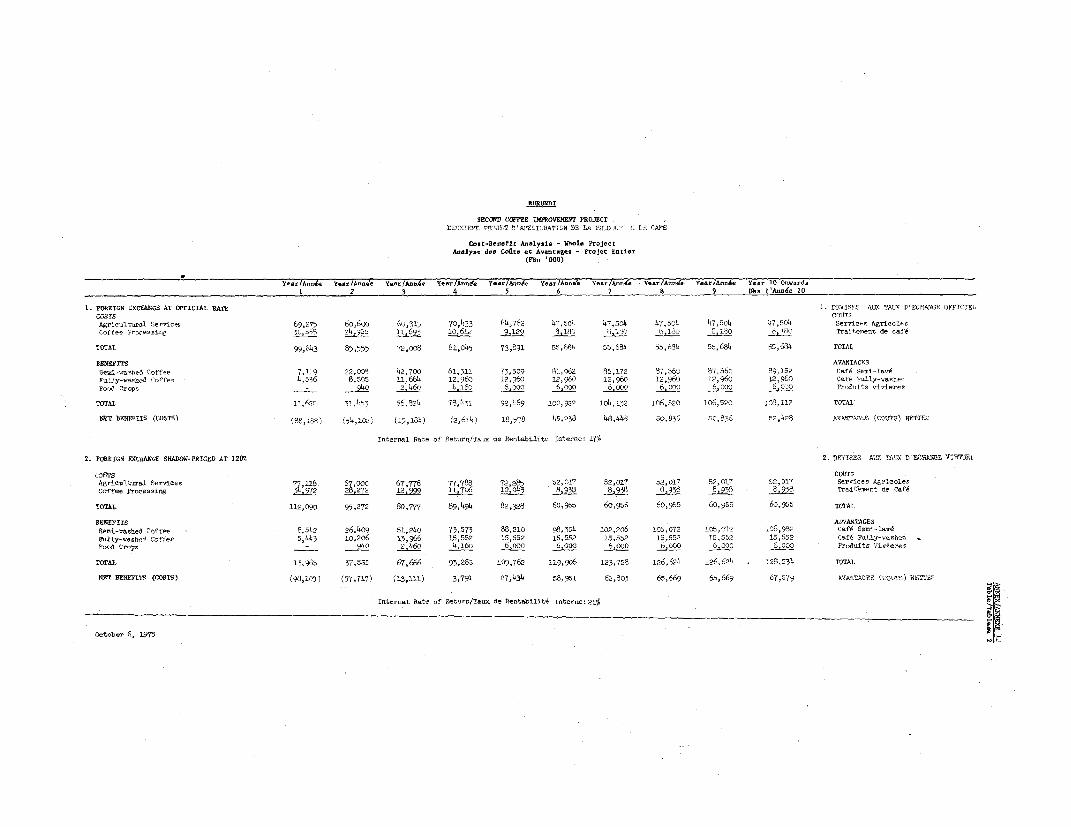
SECOND COFPEE IMPEOVEHMET PROJECTDEJXTEIrC PFE'FT D'AUIIIPATIN DL LA 'DJ25 - LE: CApE
Cost-Denefit Analysis - 1,lhole ProjentAnalyse de. Codts et Avantagea - frjtec Entier
(FBn 000)
Vear/Annde Yesrt4nnee Vaar6nn~ef VeerrAnné-e Y frtlneée Year6Anne-e YerzAne6 -y.ear0Annde YearJAnnee Sea. 10 Onv-rdsl 2 3 4 5 6 7 S5 9 rEsl'Anée IO
i. FOREIGN EXCBAUCE AT OFFICIAL FATE 1. DEVISES AMX TAUX D'ECHANGE OFFICTEL
Agricultural Servicea 69,275 60,600 6),315 75,'133 64,762 47.504 47,504 47,504 47,504 47,504 Services Agricbles1o,iee rocsins 55,566 25 11s4 S II,697 312 9,129 8 5 ,180 6 8 ,18t d ,1P2 -lB Trs iterent d_ café
TOTAL 99,843 85,555 72,008 81,045 73,B91 s5,f.84 55,684 55,684 55,684 5s,684 TOTAL
BNE FrTS AVANTAGESSeO-2'asSeé Coffee 7,119 52,006 42,700 61.311 73.509 61.962 35,172 87,560 a7,560 59,152 Café Seri-lavéFully-wrshe0d cr
4e- 4,b36 8,50 11,664 12,960 12,960 12,960 12,960 12,960 12,960 12,960 laCé 5Faly-oasne
Food Crops 94 2,460 4.160 j- 6,f9 0 6 o 0.0 661) P ) Fr,duits vivieres
TOTAL 5,655 t',4c5 56,621 78,4Bl Qss,6g 100,922 10,132 106,520 i o,520 î16,1l2 TOTAL
NET BENEFITS (COST9) 086,0 6) )1,i412 5),i84) (2,6i4) 18,578 45,238 48,449 bO,836 Sc,136 b2,428 AliEArEES (17035) R325
Internml Rate of Return/Taux de Rentabi1it, lnterne: 17%
2. FOREIGN R0CEANŒE SE-AKW-PRICED AT 1201 2. PElISES AUX TAUX D'E5 5GE VITRTEI,
COSTS CCOT5AgricnltuaI Services 77 118 67,000 61,7 78 77,788 75,285 52,017 52,017 52,017 52,017 52,017 Services Aîrieo1esCoffee Prorce.sirn 28.-272 1 Z 11, 10,043 8,933 833 8,93 8 8 ,993 8 9 , 938 Traif.eOnt de Salé
TOTAL 115,090 95,272 80,777 89,494 82,328 60,955 60,955 60,955 60,955 60,955 TOTAL1
BENEFITS ASVANTAGESSerni-vasheA Coffee I 8,542 26.40Q 51,240 73,573 88,210 98,354 102,206 105,072 ,072 .56,9e2 Crfé Semj-ls-éFolIy-wssh,d Coffee 5,443 10,206 15,966 15,552 15,552 15,552 15,552 15,552 15,552 15,552 Café Fély-saA5s6Fosoi Crops - 940 2,460 4,160 6.000 6,000 6,000 4.000 6,000 4 ~ GOFroditstVieres
TOTAL 12.965 37,555 67,666 93,285 1O9,762 119,906 123,758 126,624 î26,624 . 128,53h TOTAL
NE BENEifIT5 (COSTS) (95,105) (57, 717) (13,111) 3,791 27,434 58,951 62,805 65,669 65,669 67,579 AvANTAÇ;ys (comTS) l1riEF
tIntrnaL Rate of Re dsrc/Taux de Rentabiit,é Interne: 2176
October 6, 1975 sl
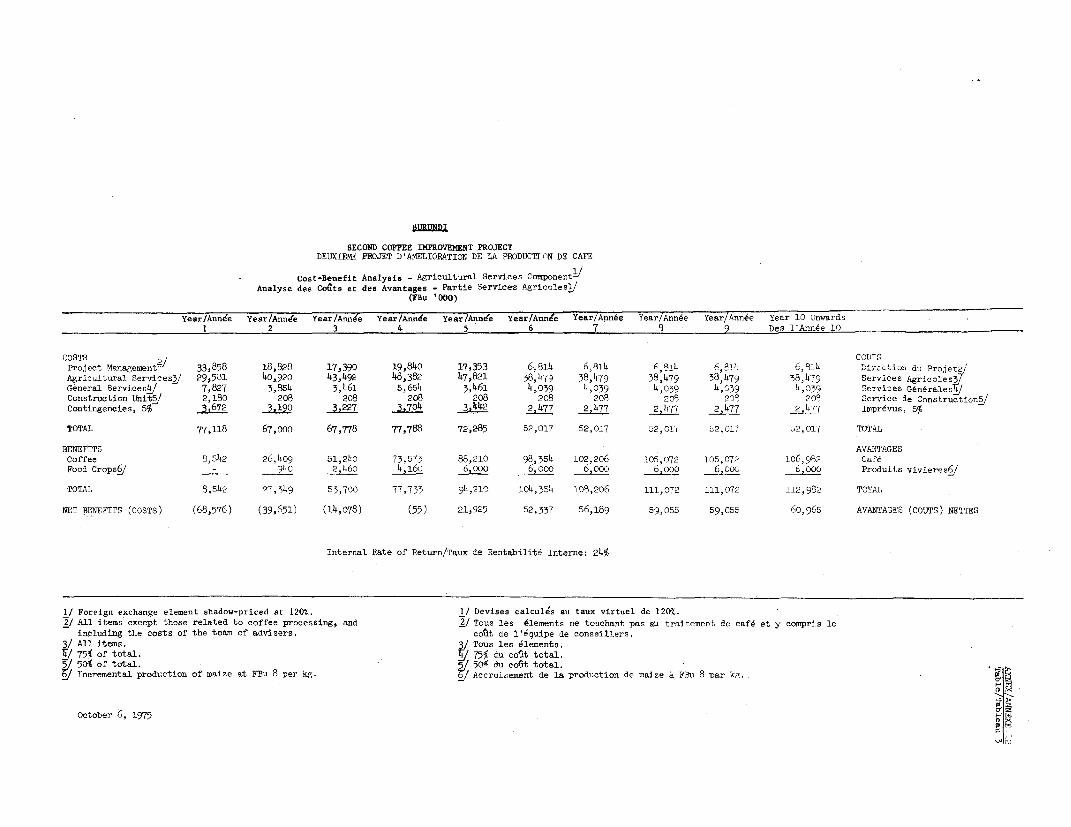
BURUNDI
SECOND COFFEE IMPROVEMENT PROJECTDEUXIEME PROJET D'AMELIORATION DE LA PRODUCTION DE CAFE
Cost-Benefit Analysis - Agricultural Services Component:/Analyse des Coûts et des Avantages - Partie Services Agicolesi/
(FBu '000)
Year/Ann e ne Year/Annee Year/Année Year/Annee Year/Année Year/Année Year/Année Year l0 Onwardsl 2 3 4 5 6 7 8 9 Des l'Année lO
COSTS COUTS
Project Management/ 33,858 18,828 17,390 19,840 17,353 6.814 6j8i14 ,qi g 2,8l4 D.ctiui-, du ProjetqAgricul turai Services3/ 29,581 40,920 43,492 43,382 47,821 38,479 38,479 38,479 38,479 58,479 Services Agricoles37General ServicesE/ 7,827 3,85s4 3,461 5,654 3,461 4,039 4,039 4,039 4,039 4,039 Services GénéralesE!Construction Unit2/ 2,180 208 208 208 208 208 208 208 20` 209 Service de Construction5/Contingencies, 5% 3,672 3,190 3,227 3,704 3,442 2,477 2,477 2,477 2,477 2,477 Imprévus, 5%
TOTAL 77,118 67,ooo 67,778 77,788 72,285 52,017 52,017 52,017 52.C17 b2,017 TOTAL
BENEFITS AVANUAGESCoffee 8,542 26,409 51,240 73,573 88,210 98,354 102,206 105,072 105,072 106,982 CaféFood Crops§/ - 94û 2,460 4,160 6,o 6o ,ooo 6,ooo 6,o 6 Produits vivieresS/
TOTAL 8,542 97,349 53,700 77,733 94,210 1014,354 l08,2O6 111,072 111,072 112,982 TOTAI
NET BNFITS (COSTS) (68,576) (39,651) (14,078) (55) 21,925 52,337 56,189 59,055 59,055 60,965 AVANTAGES (COUTS) NETTES
Internal Rate of Peturn/Taux de Rentabilité Interne: 24%
1/ Foreign exchange element shadow-priced at 120M. 1/ Devises calculés au taux virtuel de 1205X.2/ All items except those related to coffee processing, and 2/ Tous les élements ne touchant pas au traitement de café et y compris le
ineluding the costs of the team of advisers. coû1t de l'équipe de conseillers.3/ All items. 3/ Tous les élements.
. 75% of total. 7/75% du coûlt total.5/ 50X of total. 50d du co6t total.
Incremental production of maize at FBu 8 per kg. Accroisement de la production de maize à FBu 8 par kg.
October 6, 1975
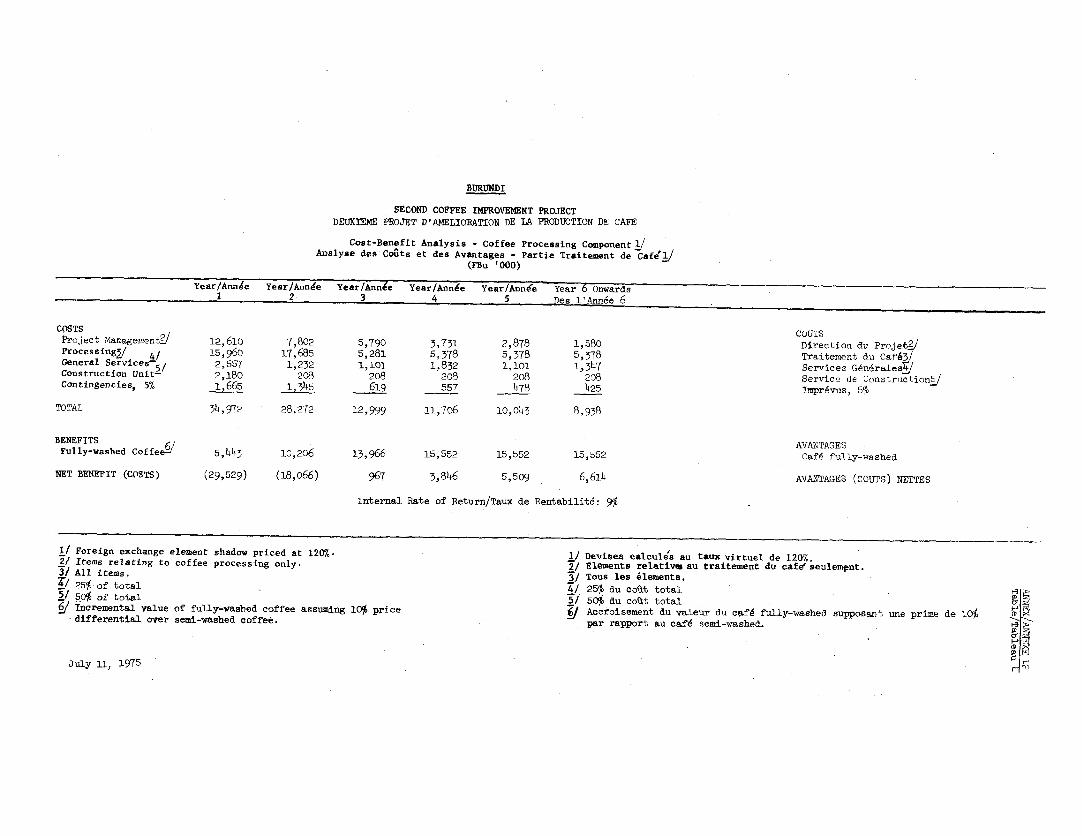
BURUNDI
SECOND COFFEE IMPROVEMENT PROJECT
DEUXIEME PROJET D'AMELIORATION DE LA PRODUCTION DE CAFE
Cost-Benefit Analysis - Coffee Processing Component /
Analyse des Coûts et des Avantages - Partie Traitement de Cafe'1j(FBu '000)
Year/Année Year/Aimée Year/Année Year/Année Year/Année Year 6 Onvards1 2 3 4 5 Des l'Année 6
COSTS COUTS
Project ManagementS/ 12,610 7,802 5,790 3,731 2,878 1,580 Direction du ProjetAJ/
Processing3/ 4/ 15,960 17,685 5,281 5,378 5,378 5,378 Traitement du Cafél
General Services-51 2,557 1,232 1,101 1,832 1,101 1,347 Services G 2néralesVConstruction Unit- 2,180 208 208 208 208 208 Service de Constrletion /
Contingencies, 5% 1,665 1,345 619 557 478 425 Imprévus, 5%
TOTAL 54,972 28,272 12,999 11,706 io,043 8,938
BENEFITS 6 AVANTAGES
Fully-washed Coffee- 5,443 10,206 13,966 15,552 15,552 15,552 Café fully--Eished
NET BENEFIT (COSTS) (29,529) (18,066) 967 3,846 5,509 6,614 AVANTAGES (COUTS) NETTES
Internal Rate of Return/Taux de Rentabilité: 9%
1/ Foreign exchange element shadow priced at 1207. 1/ Devises talcule's au taux virtuel de 120%.
2/ Items relating to coffee processing only. 2/ Elements relatives au traitement du cafe'seulement.
3/ All items. SI Tous les élements.4/ 25% Of total 4/ 25% du coût total
5/ 50% of total 5/ 50% du coût total n.
Incremental value of fully-washed coffee assumîng 10% price Accroisement du valeur du café fuly-~washed supposant une prime de 10%
-differential over semi-washed coffee. par rapport au café semi-washed.
j ,e
July ll, 1975-.M
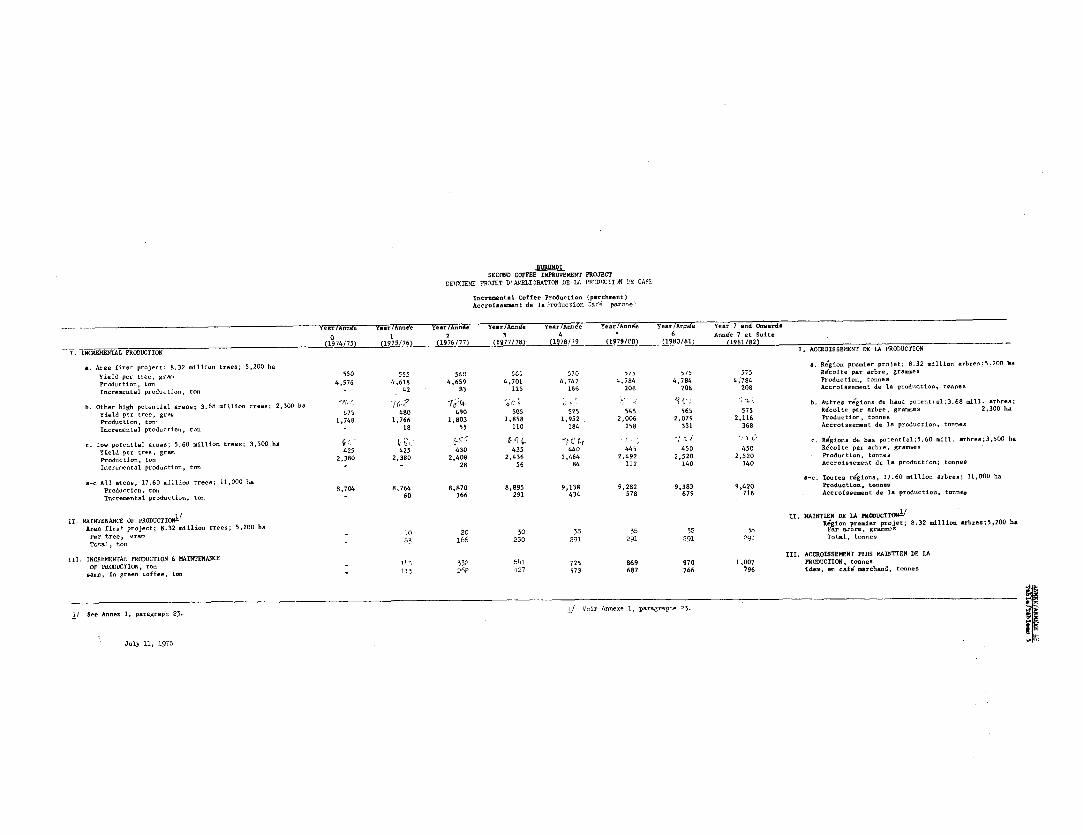
BURUNDISECOND COPPEE IMPEOVEMIENT PROJECT
DEIIXIEI7 PROJET D'A7 ELIORATION DE LA PR7DCTItON DE CAG
Anorolsammant de la froduction é004 'porche,
- mefan/Aon Yean/AocWo Yesr/AoOém Voar/Anots Ommr/Asodo YTsr/Anode Year/Annee tsar 7 and Osmardso 1 2 3 i4 6 Anne 7 etSutt
7 INCReMENTAL FRODUCTION ~~~~~~(1974/75) (1073/767 (1976/77) ('977/78) (1978/79 (1979/fo) (1980/81) (1981/821 IACOSeETD APOUTO- .INCRE8IENTAL PRODUCTIONAC8ISEEN E ÀPRDCTO
a Ares fi-t projoot; 8.32 million trocs; 5,200 ho a Region premier pro-to; 832 million - rhrtc;S,700 laYield pot troe, gros 550 555 560 SGS 57C 57 5 375 Refcolte par arbr, gr9-soosProduotion, ton 4,576 4,618 4,659 4,701 4,742 4,784 4,784 4,784 Productio, tonnesncrettontol production, non - 42 83 125 166 208 208 208 Artroîssroont do la praditon, oonno
b. Other high pootntiil 3rsos; 3.68 tillion oto; 2,300 ho r-C ; " , i b. Antr-e regios do haut pot-ntlt1;3.68 uill antres;Yield p-r t-re, grem 475 480 490 505 525 545 565 575 Rédolte par rtro, gre=suo 2,300 haProduntion, ton 1,748 1,766 1,803 1,858 1,952 2,006 2,079 2,116 Production, tonnesIncrotontel productiou, ton - 18 55 110 184 258 331 368 A--roiasse..t de la production., tonsen Loto potontiu1 eros; 5.60 million tr.sa; 3,500 ha -f' (f C 1 Regio.s de b-c ptonteil;5.60 aill. hbres;3,500 haYield pot troc, grom 425 425 430 435 440 445 450 450 Récolte par -rbr-, goasaenProduotion toc 2,380 2,380 2,408 2,436 2,464 2,492 2,520 2,520 Production, tonnesIncreeenttl prodontion, 0on - - 28 56 84 112 140 140 Aoorotscomonî do la produnolon; tosoose-r All s-oo; 17.60 nillion treea; 11,000 ha
T-c Toctsrs'gioos. 17.60 eillion arbres; 11,000 haYroduction, toV 8,704 8,764 8,870 8,895 9,138 9,282 9,383 9,420 Po-odtsntim, tmuetsIncretet prudontion, ton - 60 166 291 434 578 679 716 Aoorniaasmsot de la prootion, tanne,
Il. MAINIENANGE OF PRODUCTION-1 1I1 MAINTIEN DE LA PRODUCTIONI/Arsa first project; 8,32 million trocs 5,200 ha
Région premier projet; 8.32 mIllion arhrse;5,208 h.Per troc,s grvoo 83 1610 20 30 295 315 35 91 Patel, gestTot
l to258 6670 771 297 791 '91 Total, bne
1. INCRE14ENTAL PRODUCTION 6 MAINTNANCE III. ACCROISSEMENT PLUS EMAINTIEN DE LAOF PRODUCTION, ton b 3ECt 33? 541 725 869 970 1,007 PRODUCTION, tonness ean. En green nasffe, tc 113 262 427 573 687 766 >96 ieto, en tafe msrohsnd, toonot
S/ 8e dotoo S, paragrapo 27. Voir A.nene 1, Pprsornp 7
23.
July 11, 1975

BURUNDI
SECOND COFFEE IMPROVEMENT PROJECTDEUXIEME PROJET D'AMELIORATION DE LA PRODUCTION DE CAFE
Production of Fully-Washed CoffeeProduction de Café Fully-Washed
(ton ,tonnes)
Year/Année Year/Année Year/Année Year 4 Onwards1 2 3 Des l'Année 4
(1975-76) (1976-77) (1977-78) (1978-79)
Parchment coffeei/ Café parche 2:t4 existing stations 4ho 500 500 500 4 stations existantes4 new stations 200 400 500 4 stations nouvelles
TOTAL 4oo 700 90° 1,000 TOTAL
Green coffee?/ 324 567 729 810 Café marchand 2
2] At full production 125 ton per station per year. 1/ Pleine production 125 tonnes par station par année.2] Extraction rate 81%. 2] Rendement 81%.
July 11, 1975
H
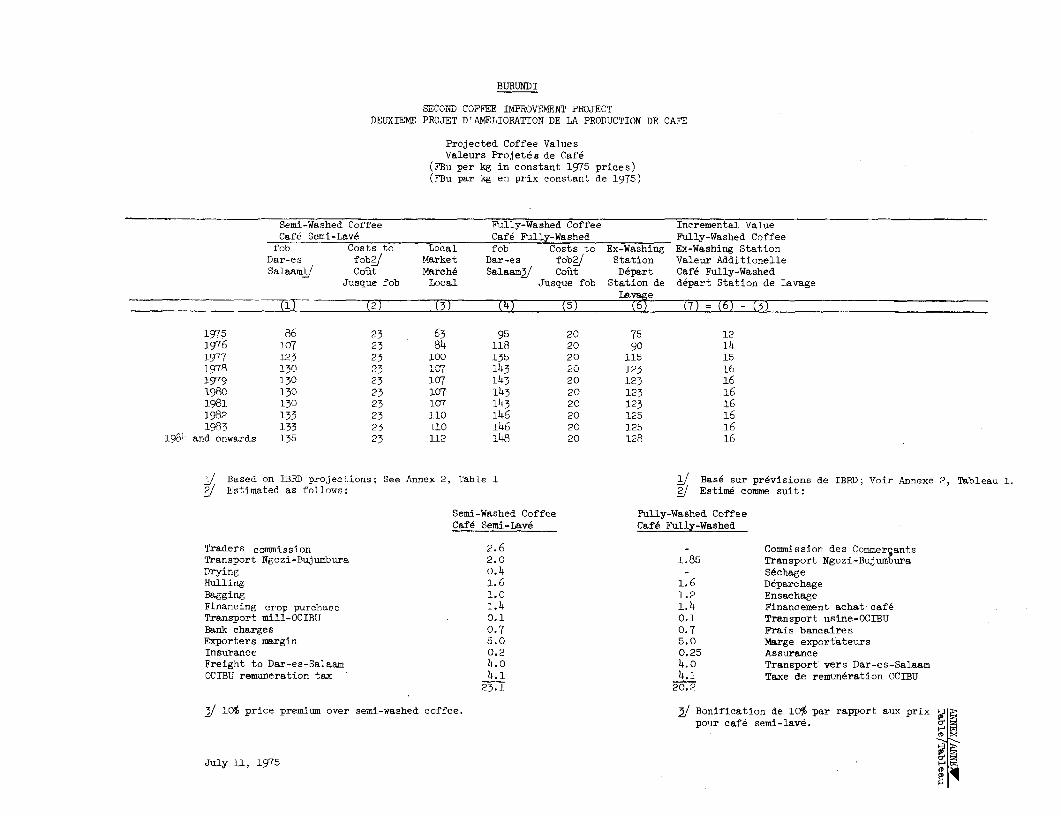
BURUNDI
SECOiiD CûFFEE IMPROVEMhNT PROJECTDEUXIEME PROJET D'AMELIORATION DE LA PRODUCTION DE CAFE
Projected Coffee ValuesValeurs Projetés de Café
(FBu per kg in constant 1975 prices)(FBu par kg en prix constant de 1975)
Semi-Washed Coffee Fully-Washed Coffee Incremental ValueCafé Semi-Lavé Café Fully-Washed Fully-Washed Coffeefob Costs to Local fob Costs to Ex-Washing Ex-Washing Station
Dar-es fob2j Market Dar-es fob ' Station Valeur AdditionelleSa1aesr Coût Marché SalaamS/ Coût Départ Café Fully-Washed
Jusque fob Local Jusque fob Station de départ Station de LavageLa M'
(1) (2) (3) (4+) (5) vase (7) = (6) - (3)_ _ = _
1975 86 23 63 95 20 75 121976 107 23 84 118 20 90 141977 123 23 100 135 20 115 151978 130 23 107 143 20 12S 161979 130 23 107 î43 20 123 161980 130 23 107 143 20 123 161981 130 23 107 1)t3 20 123 161982 133 23 110 146 20 125 161983 133 23 110 146 20 125 16
1984 and onwards 135 23 112 148 20 128 16
j Based on IBRD projections; See Annex 2, Table 1 / Basé sur prévisions de IBRD; Voir Annexe 2, Tableau 1.] Estimated as follows: / Estimé comme suit:
Semi-Washed Coffee Fui1y-Washed CoffeeCafé Semi-Lavé Café Fully-Washed
Traders commission 2.6 Commission des CommeryantsTransport Ngozi-Bujumbura 2.0 1.85 Transport Ngozi-BujumburaDrying 0.4 - SéchageHulling 1.6 1.6 DéparchageBagging 1.0 1.2 EnsachageFinancing crop purchase 1.4 i.4 Financement achat caféTransport mill-OCIBU 0.1 01 Transport usine-OCIBUBank charges 0.7 0.7 Frais bancairesExporters margin 5.0 5.0 Marge exportateursInsurance 0.2 0.25 AssuranceFreight to Dar-es-Salaam 4.0 4.0 Transport vers Dar-es-SalaamOCIBU remuneration tax 4.1 4.1 Taxe de remunération OCIBU
23.1 20.2
/ 10% price premium over semi-washed coffee. 3/ Bonification de 10% par rapport aux prix J @pour café semi-lavé.
July 11, 1975CDs
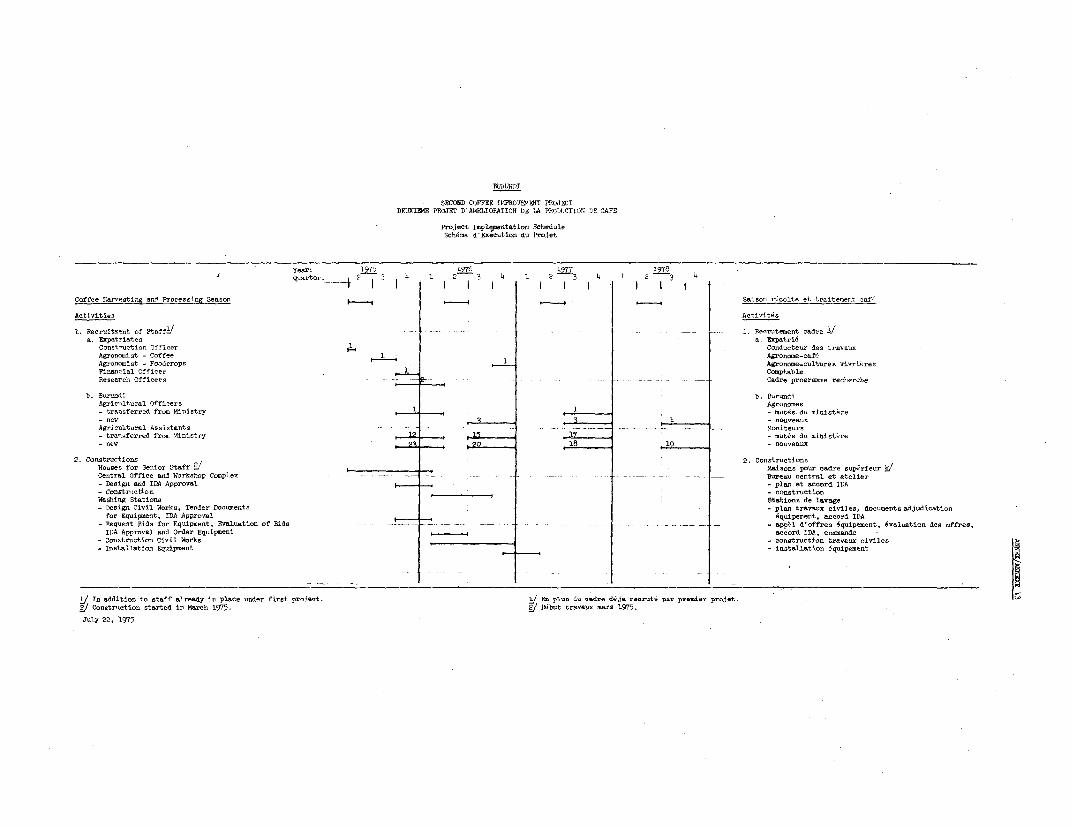
BUEUSPNI
SECOND COFFEE S! eROfflECET FROJECTDEIIXIEME PROJET DIAOMELIOBATION DE LA PP$DUCTIOr rLE CASE
projeet Imple,mentation ScheduleSchéme dEmecution du Projet
Tsar: 1975 17 1977 1970Yeart e 1
O1
2 3 4 1 2 3 I 2 3 4 1 £3 I
-I f I l I I , | I I I I
Coffee HarJesting and Processing Season . , R Saison r'co1te et traitener-t tsf'
Activities Activités
1. Recruitce.n of StaffIl - _ecrutaemnt cadre 1/
a. Expatriates a. Expatrie
Construction Officer l Conducteur des travaux
Agronomit - Coffee 1 Agronome-café
Agronomlsi - Fooderop. ' Agronome_cultures vivrtires
Financia1 Officer 1 Comptable
Researci Offirers Cadre programme recherche
b. Burund b Burundi
Agricultural Officers Agronomes
-trasferred from Ministry - mutés du ministeru
- mes , _ nouveaux
Agricultural Assistants _ _ _ _ _ Mbsoniteurs
- transferred fros Ministry 11- mudts du miîistire
-news 18 10 -nouveaux
2. Constructions 2. Constructions
House for Senior Staff ! Maisons pour cadre superieur VCentral Office and Workshop Canplec _ _ _ _ _ - Bureau central et atelier
- Design and IDA Approval - plan et accord IDA
- Construction _ construction
Wasitng Stations Stations de lavage
- Design Civil Works, Tender Documents - plan travaux civiles, documents adjudication
for Equipment. IDA Approval équipement, accord IDA
- Request Bids for Equiprent, evaluation cf Bide --- _ _ _ _ _ appel d'offres équipement, évaluation des offres,
IDA Approval and Order Equipment -accord IDA, comr ande
- Construction Civil Works - construction travaux civiles
- Installation equipsent - installation equipement
I On addition to staff already in place under first project. Ma plus Co cadre d4ja r-cruti par pr-i-or pr-jet.
g! Construction started in March 1975. Début travaux macs 1975.
JuIy S2, 1975


BURUNDISECOND COFFEE IMPROVEMENT PROJECT
ORGANIZATION CHART
Coorcdînating Çm teeMin,stry of Agriculture SBand Livestock
OC 13
| Projects Department l
Office Project Agricultural tee Process'tn Construction and AdministrationDirector l Servtces . Technical Services and Accounts
Worid Bank-15042


_~~~. (. N-<r>Ie
o N z w
f >- ¢
c:~~~~~~~~~~~~~~~~~~~~~~~~~~~~~~~~~~~~~~~~~~~~~~~~~~~~~~~Z z <j*
oe . W .4 E
-Lt
.Q \v
[ o « W - 0 ` E 0 0 S i~~~~~~~~~~~~' ol
T - §tD ,.XX ,, 0" . d~~~~~~~~~~~~~~~~~"
<0
LL~~~~~~~~~~~~~~~~~~~~~~~~~~~~~~~CU~~~~~~~~~~~~~~~~~~~~~~~~~~~~~~~U
~Z 5.z .U ",, . `,9/......
cN 381V za, Oltl'glft d H
L \ s>Sso all«W7lt / * ° 38EYZ dO Dlll`S8nd38 i~~~~~~~~~~~~~~~~~~~~~~~~~


IBRD 11434
FEBRUARY 1975
il BURUNDIPrajt Area NGOZi Province i SECOND COFFEE IMPROVEMENT PROJECT
Nationil Roads - ISABU Coffee Fertilizer TrialsT Mos
Main Roads Limit of High Potentiol Coffee Area N PROJECT AREA \ )-- Secondary Roads Exissing Proiect Area (Credit 147-BU) / ,
Rivers Q ) Coffee Woshing Stations 5 o 5 Q 15 20
- - - Provincial Boundories {Built Under Credit 147- BU) ,KLOMETEt5 -|
InterncationoIl Bouindaries ® Provincial Capital '
Birambi /
<\ LleneO S `QM*higo JbMushonge--X ge MUYIoAo
-\NGOZI~ ~~~~~~~~~~~~~~~~~~~~~~~~~~~~~~~~0 0
* BUBNZ ; ') Mona J) 'N Bugers X z,k~~~~~~~~~~~~~~~~ahk
F " 4 < t~~~~~~~AY ` X --, ,V\,
M uy o \u s e n gr o O
,t
3 :t â X Jdava _ kS / PRugazi ,g /, 0 306
ii,
Bcidanga N ' ½A
T o X \\ t>~~~~~~Bonga M;Nuningo f \" Mwkr BUR NDB BU R U N D
Mutumboa r-
2 3 1 Togoye i _/
Gatondep',''
9 O3 ol BoURAMoVYA To0GegT Grieo \ l"'fI__