file 43304
TRANSCRIPT

8/3/2019 File 43304
http://slidepdf.com/reader/full/file-43304 1/76
ENERGY TRENDSDECEMBER 2007
A NATIONAL STATISTICS PUBLICATION

8/3/2019 File 43304
http://slidepdf.com/reader/full/file-43304 2/76
Contact points
To subscribe to Energy Trends and Quarterly Energy Prices
For new subscription queries please telephone:Amey on 01633 224712 or write to:
Amey, 7th Floor, Clarence House, Clarence Place, Newport South Wales NP19 7AA
A subscription form is also available on our Internet site
www.berr.gov.uk/energy/statistics/publications/trends/index.html
Energy Trends is prepared by the Energy Strategy and International Unit in BERR.
More information on BERR energy publications is available at:
www.berr.gov.uk/energy/statistics/publications/index.html
Further information on Oil and Gas is available at: www.og.berr.gov.uk/
For enquiries please contact: Telephone
Name 020 7215 E-mail
Publication and other general Clive Sarjantson 2698 [email protected]
(Helpdesk) enquiries on energy statistic
Total energy statistics Chris Michaels 2710 [email protected]
Coal and other solid fuels David Bovill 3839 [email protected]
Natural gas consumption
Gas and petroleum investment Suhail Siddiqui 5262 [email protected]
Indicative tariffs
Natural gas production Clive Evans 5189 [email protected]
Petroleum production
Petroleum consumption and stocks Lisa Vine 6072 [email protected]
Electricity statistics Joe Ewins 5190 [email protected]
Regional and local authority Jennifer Knight 6490 [email protected]
energy statistics
All the above can be contacted by fax on 020 7215 2723
This is a National Statistics publication
National Statistics are produced to high professional standards set out in the National Statistics Code
of Practice. They undergo regular quality assurance reviews to ensure that they meet customer needs.
They are produced free from any political interference.You can find a range of National Statistics on the Internet – www.statistics.gov.uk
Explanatory notes are to be found inside the back cover

8/3/2019 File 43304
http://slidepdf.com/reader/full/file-43304 3/76
December 20071
Contents
Introduction 2
Section 1 - Total Energy 3
Section 2 - Solid Fuels and Derived Gases 6
Section 3 - Oil and Oil Products 8
Section 4 - Gas 12
Section 5 - Electricity 14
Section 6 - Special FeaturesElectricity generation and supply figures for Scotland, Wales,Northern Ireland and England, 2005 and 2006
16
Regional and local electricity consumption statistics for 2006 21Regional and local gas consumption statistics for 2006 30Regional and local estimates of non gas, non electricity and non roadtransport fuels in 2005
38
Regional and local total energy consumption statistics for 2005 39The UK road transport biofuels market 45
Statistics of the installed capacity of solar photovoltaics 492008 Update of “Energy Consumption in the UK” 50The future of “Energy- Its impact on the Environment and Society” 51Recent and forthcoming publications of interest to users of energystatistics
52
Tables1.1: Indigenous production of primary fuels 531.2: Inland energy consumption: primary fuel input basis 541.3: Supply and use of fuels 55
2.1: Supply and consumption of coal 572.2: Supply and consumption of coke oven coke, coke breeze and other
manufactured solid fuels
58
2.3: Supply and consumption of coke oven gas, blast furnace gas,benzole and tars
59
3.1: Supply and use of crude oil, natural gas liquids and feedstocks 603.2: Supply and use of petroleum products 613.3: Supply and use of petroleum products - annual data 623.4: Supply and use of petroleum products - latest quarter 633.5: Demand for key petroleum products 643.6: Stocks of petroleum at end of period 653.7: Drilling activity on the UK Continental Shelf 66
4.1: Natural gas supply and consumption 67
5.1: Fuel used in electricity generation and electricity supplied 685.2: Supply and consumption of electricity 69
List of special feature articles published in Energy Trends between June2006 and September 2007
70
The cover illustration used for Energy Trends and other BERR energy statistics publications is from aphotograph by David Askew. It was a winning entry in the DTI News Photographic Competition in 2002.

8/3/2019 File 43304
http://slidepdf.com/reader/full/file-43304 4/76
December 2007 2
IntroductionEnergy Trends and Quarterly Energy Prices are produced by the Department for Business,Enterprise & Regulatory Reform on a quarterly basis. Both periodicals are published concurrentlyin June, September, December and March. The December editions cover the third quarter of thecurrent year.
Energy Trends includes information on energy as a whole and by individual fuels. The text and
charts provide an analysis of the data in the tables. The tables are mainly in commodity balanceformat, as used in BERR’s annual Digest of UK Energy Statistics. The 2007 edition of the Digestwas published on 26 July 2007. Printed and bound copies of the 2007 Digest can be obtainedfrom The Stationery Office and an electronic version is available on our web site atwww.berr.gov.uk/energy/statistics/publications/dukes/page39771.html . The balance format showsthe flow of a commodity from its sources of supply, through to its final use. The articles in EnergyTrends provide in-depth information on current issues within the energy sector.
The text and tables included in this publication represent a snapshot of the information available atthe time of publication. However, the data collection systems operated by BERR, which producethis information, are in constant operation. New data are continually received and revisions tohistoric data made. To ensure that those who use the statistics have access to the most up-to-date information, revised data will be made available as soon as possible, via the electronicversions of these tables. The electronic versions are available free of charge from the BERR website. In addition to quarterly tables, the main monthly tables that were published in the period up toMay 2001 when Energy Trends was produced monthly, continue to be updated and are alsoavailable on the BERR web site. Both sets of tables can be obtained fromwww.berr.gov.uk/energy/statistics/source/index.html
Energy Trends does not contain information on Foreign Trade, Temperatures and Prices. ForeignTrade and Temperatures tables are, however, available on the BERR web site and information onPrices can be found in the Quarterly Energy Prices publication. Prices information is also availableon our web site at www.berr.gov.uk/energy/statistics/publications/prices/tables/page18125.html
If you have any comments on Energy Trends or Quarterly Energy Prices publications please sendthem to:
Clive Sarjantson
BERR, Energy Strategy & International Unit,Bay 299, 1 Victoria StreetLondon SW1H 0ET Tel: 020 7215 2698E-mail: [email protected] Fax: 020 7215 2723
The main points for the third quarter of 2007:
• Total energy production was 3½ per cent lower than in the third quarter of 2006.
• Oil production remained virtually unchanged when compared with the third quarter of 2006. Productionfrom older established fields continued to decline but this decline was offset by eight new fields, includingthe very large Buzzard field.
• Gas production was 11 per cent lower than the third quarter of 2006. Gas imports increased by 31½ per cent and gas exports decreased by 25 per cent. The UK was a net importer of gas in the third quarter of
2007, whereas the UK was a net exporter in the same period of 2006. Gas demand was 5 per centhigher than the third quarter of 2006.
• Total primary energy consumption for energy uses was 1½ per cent higher than during the third quarter of 2006, this is equivalent to a 2 per cent decrease when adjusted to take account of weather differencesbetween the third quarters of 2006 and 2007.
• Coal production in the third quarter of 2007 was 27 per cent higher than the third quarter of 2006. Coalimports were 22½ per cent lower and generators’ demand for coal was down by 2½ per cent.
• Gas supplied 1½ per cent more electricity than in the third quarter of 2006 while coal supplied 5 per centless and nuclear 9 per cent less. Net imports of electricity were 64 per cent higher.

8/3/2019 File 43304
http://slidepdf.com/reader/full/file-43304 5/76
Total Energy
December 20073
Section 1 - Total Energy
Chart 1.1 Production of indigenousprimary fuels
0
10
20
30
40
50
60
70
80
90
C oa l Pet ro leum N atural Gas P rim ary
Electric ity(1)
M i l l i o n t o n n e s o f o i l e q u i v a l e
n t
2006 Total
2006 Q1-Q32007 Q1-Q3
(1) Nuclear and natural flow hydro electricity.
Chart 1.2 Total inland consumption(primary fuel input basis)(1)
(1) Seasonally adjusted and temperature corrected annual rates.
• Total production in the third quarter of 2007 was41.0 million tonnes of oil equivalent, 3.6 per centlower than in third quarter of 2006.
• Production of natural gas fell by 10.9 per cent
between the third quarter of 2006 and the thirdquarter of 2007; gas production is declining asNorth Sea reserves deplete.
• Production of petroleum was 0.2 per cent lower inthe third quarter of 2007 than in the third quarter ayear earlier.
• Primary electricity output was 6.8 per cent lower,within which nuclear electricity output was 8.8 per cent lower but output from wind and natural flowhydro increased by 49.3 per cent.
• In the third quarter of 2007 production of coal andother solid fuels was 22.0 per cent higher than inthe third quarter of 2006.
• Total inland consumption on a primary fuel inputbasis was 230.7 million tonnes of oil equivalent inthird quarter of 2007 (temperature corrected,seasonally adjusted annualised rate). Theaverage temperature during the third quarter of 2007 was 14.9 degrees Celsius, 2.4 degreesCelsius cooler than the third quarter of 2006.
• Total seasonally adjusted and temperaturecorrected consumption in the third quarter of 2007was 2.1 per cent lower than the same period ayear earlier.
• Between the third quarter of 2006 and the thirdquarter of 2007 (on a seasonally adjusted andtemperature corrected basis) coal and other solidfuel consumption fell by 6.6 per cent .
• Also on a seasonally adjusted and temperaturecorrected basis, oil consumption fell by 0.4 per cent.
• On the same basis, gas consumption fell by 0.7
per cent.
215
220
225
230
235
240
245
250
255
Q1 Q2 Q3 Q4
M i l l i o n t o n n e s o f o i l e q u
i v a l e n t
2005
0
2004
2006
2007

8/3/2019 File 43304
http://slidepdf.com/reader/full/file-43304 6/76
Total Energy
December 2007 4
Chart 1.3 Final energy consumptionby user
0
5
10
15
20
25
30
35
40
45
50
Q1 Q2 Q3 Q4 Q1 Q2 Q3 Q4 Q1 Q2 Q3 Q4 Q1 Q2 Q3
M i l l i o n t o n n e s o f o i l e q
u i v a l e n t
Transport
Domestic
Industry
Services
2004 2005 2006 2007
Background
Relevant tables1.1: Indigenous production of primary fuels…………………………………………………….. Page 531.2: Inland energy consumption: primary fuel input basis………………………………………. Page 541.3: Supply and use of fuels………………………………………………………………….. Pages 55-56
Production
Indigenous production of energy was 9.1 per cent lower in 2006 than in 2005, continuing a year onyear decline for each year since 1999. Coal and other solid fuel production was lower by 9.6 per cent, gas production fell by 9.1 per cent and petroleum production by fell 9.6 per cent.Indigenous production continued to fall in 2007, with total production in each quarter of 2007 todate being lower than the same quarter in 2006. Petroleum accounted for 46.1 per cent of total
indigenous production in the third quarter of 2007 while coal and other solid fuels accounted for 8.1per cent, and natural gas 35.8 per cent. A year earlier the proportions were petroleum 44.5 per cent, coal and other solid fuels 6.4 per cent and natural gas 38.8 per cent.
Total inland consumption
In 2006 consumption of primary fuels was 1.1 per cent lower than in 2005. The largest contributionto this decrease in absolute terms was from natural gas (which decreased by 5.0 per cent). On atemperature corrected basis consumption in 2006 was 1.5 per cent lower than in 2005.
Total inland energy consumption, on a primary fuel input basis (not temperature corrected or seasonally adjusted), decreased by 8.8 per cent in the first quarter of 2007 compared with thesame period in 2006; this was followed by a 3.4 per cent reduction in the second quarter. In thethird quarter of 2007 consumption was 48.4 million tonnes of oil equivalent, which is 1.6 per cent
higher than in the corresponding period a year ago.
Consumption by final users
Final energy consumption shows a strong seasonal pattern with more energy being consumed inthe winter months and less in the summer months, particularly in the domestic and service sectors.
In the third quarter of 2007 the transport sector was responsible for the largest share of finalconsumption at 45 per cent of all energy consumed by final users. The industrial sector wasresponsible for a further 21 per cent, the domestic sector for another 17 per cent and the serviceindustries, including agriculture, consumed 11 per cent. The remaining 7 per cent was made up byfuel use for non-energy purposes.
• Total final energy consumption increased by 2.0per cent between the third quarter of 2006 and thethird quarter in 2007.
• Service sector energy consumption increased by6.2 per cent
• Domestic sector energy consumption increased by13.3 per cent.
• Transport energy consumption decreased by 1.6per cent.
• Industrial energy consumption increased by 7.4 per cent

8/3/2019 File 43304
http://slidepdf.com/reader/full/file-43304 7/76
Total Energy
December 20075
Final energy consumption rose by 2.0 per cent between the third quarter of 2006 and the thirdquarter of 2007, mainly due to increases in the domestic sector (a 13.3 per cent rise), the industrialsector (a 7.4 per cent rise) and the service sector (a 6.2 per cent rise). There was a decrease inthe transport sector of 1.6 per cent.

8/3/2019 File 43304
http://slidepdf.com/reader/full/file-43304 8/76
Solid Fuels and Derived Gases
December 2007 6
Section 2 - Solid Fuels and Derived Gases
Chart 2.1 Coal production and imports
0
2
4
6
8
10
12
14
Q1 Q2 Q3 Q4 Q1 Q2 Q3 Q4 Q1 Q2 Q3 Q4 Q1 Q2 Q3
M i l l i o n t o n n e s
Coal imports
Opencast coalDeep mined coal
20052004 2006 2007
• Provisional figures for the third quarter of 2007show that coal production (including an estimate
for slurry) was 26.8 per cent higher than the thirdquarter of 2006 at 4.6 million tonnes, with deepmined production up 35.3 per cent and opencastproduction up 20.4 per cent. These percentageincreases are high because production wasparticularly low in the third quarter of 2006 due tomine closures, geological difficulties and other one-off factors. The percentage increase from thesecond quarter of 2007 was not as high, with totalcoal production rising by only 4.3 per cent.
• Imports of coal in the third quarter of 2007 were22.7 per cent lower than in the third quarter of 2006 at 9.7 million tonnes.
• 79 per cent of the coal imported in the third quarter
of 2007 (7.7 million tonnes) was steam coal,largely for the power stations market.
Chart 2.2 Coal consumption
0
4
8
12
16
20
Q1 Q2 Q3 Q4 Q1 Q2 Q3 Q4 Q1 Q2 Q3 Q4 Q1 Q2 Q3
M i l l i o n t o n n e s
Electricity generators
Generators trend (=average of 4 quarters ending)
Collieries, coke ovens and other conversion industries
Final consumers
20052004 2006 2007
• Demand for coal in the third quarter of 2007, at13.1 million tonnes, was 1.9 per cent lower than inthe third quarter of 2006. Consumption byelectricity generators was down by 2.6 per cent to10.6 million tonnes.
• Electricity generators accounted for 81 per cent of total coal use in the third quarter of 2007, the sameproportion as a year earlier.
• Provisionally, final consumption (as measured bydisposals to final consumers) increased by 6.0 per cent in the third quarter of 2007 compared with ayear earlier, with consumption by the domesticsector increasing by 77 per cent and industrialconsumption falling by 17.5 per cent. Note that for 2007 there has been a change of methodology in
terms of the proportional allocation of coal fromtraders and this is the reason for the large increasein domestic sector consumption.

8/3/2019 File 43304
http://slidepdf.com/reader/full/file-43304 9/76
Solid Fuels and Derived Gases
December 20077
Chart 2.3 Coal stocks
0
2
4
6
8
10
12
14
16
18
20
J a n
A p r
J u l
O c t
J a n
A p r
J u l
O c t
J a n
A p r
J u l
O c t
J a n
A p r
J u l
O c t
M i l l i o n t o n n e s
UndistributedOther distributedPow er stations
20052004 2006 2007
• Coal stocks at the end of the third quarter of 2007were 0.8 million tonnes (4.4 per cent) higher thanat the end of the third quarter of 2006 and stood at18.7 million tonnes. Provisionally, by the end of October 2007 coal stocks had fallen back to 18.1million tonnes.
• The level of coal stocks at power stations were 0.5million tonnes higher than at the end of the thirdquarter of 2006 at 15.7 million tonnes, an increaseof 3.4 per cent.
• Stocks held by producers (undistributed stocks) inthe third quarter of 2007 were 0.8 million tonnes(8.4 per cent) lower than at the end of the thirdquarter of 2006.
Background
Relevant tables2.1: Supply and consumption of coal………………………………………………………………Page 572.2: Supply and consumption of coke oven coke, coke breeze
and other manufactured solid fuels………………………………………………………….. Page 582.3: Supply and consumption of coke oven gas, blast furnace gas, benzole and tars……….Page 59
Coal production and importsIn 2006 indigenous production of coal fell by 2.0 million tonnes. Deep mined production fell to arecord low of 9.4 million tonnes, while opencast coal production was at its lowest level since 1970,and 17.3 per cent lower than in 2005. In 2005, for the first time ever, opencast productionexceeded deep mined production. Deep mined production recovered towards the end of 2005 and
in the first half of 2006. However, it fell back in the second half of 2006 with the closure of Rossington at the end of March 2006 and the run down in production and eventual mothballing of Harworth in September 2006. These closures, geological difficulties and other one-off factorscontinued to suppress deep mined production in the first quarter of 2007, but in the second andthird quarters of 2007 deep mined production increased again. Opencast production has alsobeen on an upward trend since the third quarter of 2006 and remains higher than deep minedoutput. Coal imports have reached record levels in each of the last three years, but with demandfor coal lower in the first three quarters of 2007, coal import levels peaked at the end of 2006.
Coal consumptionIn 2005 coal use by electricity generators was 1.6 million tonnes higher than in 2004 as higher gasprices made coal more competitive for generation. This trend continued into 2006 with the demandfrom electricity generators up 5.3 million tonnes on 2005. With gas prices becoming morecompetitive in the first half of 2007, the trend has reversed and coal consumption by electricitygenerators in the third quarter of 2007 was down by 2.6 per cent compared with the third quarter of 2006. The use of coal for coke making and at blast furnaces increased by 6.8 per cent (nearly 0.5million tonnes) in 2006. This upward trend appears to have continued in 2007.
StocksEnd of winter stock levels have risen over the past two years from the low levels of 2004/05. Theseasonal rise in stocks over the summer periods of 2005 and 2006 was strong, boosted by recordlevels of coal imports over the period. The rise was less strong in summer 2007 and coal stockspeaked at the same level (18.7 million tonnes) as in October 2006.

8/3/2019 File 43304
http://slidepdf.com/reader/full/file-43304 10/76
Oil and Oil Products
December 2007 8
Section 3 - Oil and Oil Products
Chart 3.1 Production of crude oil andNGLs
Chart 3.2 UK trade in crude oils, NGLs
and petroleum products
• Total indigenous UK production of crude oil andNGLs in the third quarter of 2007 was virtuallyunchanged when compared with a year earlier.
• In the nine months to September 2007 eight newfields started production. This includes the verylarge Buzzard field. During this period these fieldsproduced 6.9 million tonnes of crude oil. Withoutthese new fields production in the third quarter of 2007 would have been 18.8 per cent lower than ayear ago.
• During the third quarter of 2007 the UK was a netimporter of oil and oil products by 2.0 milliontonnes, similar to the third quarter of 2006 whereby the UK was a net importer by 2.8 milliontonnes.
• The UK was a net importer of crude oil, NGLs andfeedstocks in the third quarter of 2007 (by 3.8million tonnes). Both imports and exportsincreased, by 4.8 and 9.0 per cent respectively.
• In the third quarter of 2007 the UK was a netexporter of petroleum products (by 1.8 million
tonnes).
• Both imports and exports of petroleum productsfell during the third quarter of 2007, by 13.5 and5.3 per cent respectively.
4
5
6
7
8
9
J a n
F e b
M a r
A p r
M a y
J u n
J u l
A u g
S e p
O c t
N o v
D e c
T o t a
l o i l p r o d u c t i o n ( m i l l i o n t o n n e s )
0
2004
2005
2006
2007
-30
-20
-10
0
10
20
30
Q1 Q2 Q3 Q4 Q1 Q2 Q3 Q4 Q1 Q2 Q3 Q4 Q1 Q2 Q3
M i l l i o n t o n n e s
Exports Imports Net Exports
20072004 2005 2006

8/3/2019 File 43304
http://slidepdf.com/reader/full/file-43304 11/76
Oil and Oil Products
December 20079
Chart 3.3 Demand for key transportfuels
Chart 3.4 Super/hypermarket shares of
retail deliveries
• Total deliveries of transport fuels were virtuallyunchanged in the third quarter of 2007 whencompared with the third quarter of 2006.
• Motor spirit deliveries fell by 5.5 per cent.
• Deliveries of Diesel engined road vehicle fuel(DERV) increased by 7.8 per cent.
• DERV fuel’s share of road transport fuels in thethird quarter of 2007 was 55.5 per cent comparedto 52.2 per cent in the third quarter of 2006.
• Deliveries of aviation turbine fuel were 4.1 per cent lower.
• Sales of motor spirit by super/hypermarketcompanies accounted for 42.9 per cent of retailsales of petrol in the third quarter of 2007, up from40.9 per cent in the third quarter of 2006.
• Sales of DERV by super/hypermarket companiesaccounted for 37.0 per cent of retail sales of DERV in the third quarter of 2007, compared with34.1 per cent in the third quarter of 2006.
0
1
2
3
4
5
6
Q1 Q2 Q3 Q4 Q1 Q2 Q3 Q4 Q1 Q2 Q3 Q4 Q1 Q2 Q3 D e l i v e r i e s i n t o c o n s u m p t i o n ( m i l l i o n t o n n e s )
2007
Aviation turbine fuel
DERV fuel
Unleaded motor spirit
20052004 2006
DERV fuel
0
1
2
3
4
Q1 Q2 Q3 Q4 Q1 Q2 Q3 Q4 Q1 Q2 Q3 Q4 Q1 Q2 Q3
M i l l i o n t o n n e
s
Super/hypermarkets
Other retailers
20052004 2006 2007
Petrol
0
1
2
3
4
5
6
Q1 Q2 Q3 Q4 Q1 Q2 Q3 Q4 Q1 Q2 Q3 Q4 Q1 Q2 Q3
Other retailers
Super/hypermarkets
20052004 2006 2007
M i l l i o n t o n n e s

8/3/2019 File 43304
http://slidepdf.com/reader/full/file-43304 12/76
Oil and Oil Products
December 2007 10
Chart 3.5 Stocks of key oil products(1)
(1) This includes motor spirit, DERV fuel, other gasdiesel oils, aviation turbine fuel, kerosene and fuel oils.
• Overall, stocks of crude oil and petroleum productswere 1.2 per cent higher at the end of the thirdquarter of 2007 than a year earlier.
• Crude oil and refinery process oil stocks were 4.3per cent higher, and stocks of products were 1.2per cent lower.
• Stocks at UKCS pipeline terminals fell by 47 per cent (half a million tonnes) in the third quarter of 2007. However, crude and process oil stockselsewhere increased by 0.8 million tonnes givingan overall increase of 0.3 million tonnes in the thirdquarter of 2007.
• Chart 3.5 combines stocks of products with theproduct equivalent of stocks of crude oil to give anoverall level of UK stocks of key products.
• At the end of the third quarter of 2007, the UK heldstocks equal to 75½ days of consumption of thesekey products, compared with an obligation of 67½
days (see Background for more details).
Chart 3.6 Drilling activity on the UKCS
0
20
40
60
80
100
Q1 Q2 Q3 Q4 Q1 Q2 Q3 Q4 Q1 Q2 Q3 Q4 Q1 Q2 Q3
N u m b e r o f w e l l s
Exploration & Appraisal (Offshore)Development (Off shore)
Exploration & Appraisal (Onshore)Development (Onshore)
20062004 20072005
• Drilling figures for the third quarter of 2007 showeda rise in the number of exploration and appraisalwells started offshore to 39 against 22 in thecorresponding quarter of 2006.
• The number of development wells drilled offshorefell to 35, compared with 53 in the correspondingquarter of 2006.
• 7 development wells were drilled onshore in thethird quarter of 2007, compared with 3 in thecorresponding quarter a year earlier.
• 3 exploration or appraisal wells were startedonshore in the third quarter of 2007. The samenumber of exploration or appraisals wells wasstarted onshore in third quarter of 2006.
Background
Relevant tables3.1: Supply and use of crude oil, natural gas liquids and feedstocks…………………………. Page 603.2: Supply and use of petroleum products………………………………………………………. Page 613.3: Supply and use of petroleum products - annual data……………………………………… Page 623.4: Supply and use of petroleum products - latest quarter……………………………………..Page 633.5: Demand for key petroleum products………………………………………………………….Page 643.6: Stocks of petroleum at end of period………………………………………………………… Page 653.7: Drilling activity on the UK Continental Shelf………………………………………………… Page 66
0
2
4
6
8
10
12
14
16
Q1 Q2 Q3 Q4 Q1 Q2 Q3 Q4 Q1 Q2 Q3 Q4 Q1 Q2 Q3
M i l l i o n t o n n e s
Oil Stocks Obligation
200720052004 2006

8/3/2019 File 43304
http://slidepdf.com/reader/full/file-43304 13/76
Oil and Oil Products
December 200711
Crude oil production and tradeTotal UK production of crude oil and NGLs was virtually unchanged in the third quarter of 2007when compared to the same period last year. In the nine months to September 2007, eight newfields started production, including the very large Buzzard field. The UK was a net importer of oiland oil products in the third quarter of 2007. Imports and exports of crude oil and NGLs both rose,meaning the UK remained a net importer of crude and NGLs. Both imports and exports of petroleum products fell, (by 13.5 and 5.3 per cent respectively), but exports decreased at a slower rate leading to the UK being a net exporter of petroleum products. The majority of UK production of
crude oil and NGLs is exported, as indigenous UK crude oil tends to be the more valuablelight/sweet type with lower sulphur levels and the relative modernity of UK refineries allows their use of less valuable or lower grade crude oil. Therefore the economics of crude oil markets resultsin significant volumes of crude oil being imported into the UK.
Refinery production of petroleum products and trade The net refinery output in the third quarter of 2007 was 21.7 million tonnes, 0.5 million tonnes (2.2per cent) lower than the third quarter of 2006.
Demand for petroleum productsOverall demand for petroleum products in the third quarter of 2007 was 1.2 per cent lower than inthe third quarter of 2006. Deliveries of motor spirit were lower by 5.5 per cent, however, DERVdeliveries increased by 7.8 per cent to 5.5 million tonnes. Deliveries of aviation turbine fuel fell by
4.1 per cent.
Stocks of crude oil and petroleum productsThe UK has an obligation under EU law to maintain stocks of key oil products at or above a certainlevel to ensure adequate supplies would exist for any international oil supply emergency. Theseobligations are based on the UK's annual consumption of the key products motor spirit, DERV fueland other gas diesel oils, aviation fuel and other kerosenes and fuel oils. These obligations areusually updated every 1st July as consumption data for the previous year are finalised. Chart 3.5above combines data on stocks of key oil products with the product equivalent of stocks of crude oilto give an overall level of UK stocks of key oil products to show how the UK is complying with theseobligations at an overall level. The UK's current overall obligation, based on 2006 consumptiondata, is to hold a total of 11 million tonnes of these products, equal to 67½ days of consumption.

8/3/2019 File 43304
http://slidepdf.com/reader/full/file-43304 14/76
Gas
December 2007 12
Section 4 – Gas
Chart 4.1 Production of natural gas
40
50
60
70
80
90
100
110
120
J a n
F e b
M a r
A p r
M a y
J u n
J u l
A u g
S e p
O c t
N o v
D e c
P r o d u c t i o n ( T W h )
0
2006
2004
2005
0
2007
Chart 4.2 UK trade in natural gas
• Total indigenous UK production of natural gas inthe third quarter of 2007 was 11.2 per cent lower than in the corresponding quarter a year earlier.
• Two new import pipelines were commissioned inthe fourth quarter of 2006.
• In the third quarter of 2007, compared with thesame period of 2006, exports of natural gas fell by25.0 per cent and imports rose by 31.3 per cent.
• The UK was a net importer of gas in the thirdquarter of 2007 by 21.0 TWh, whereas in the thirdquarter of 2006 the UK was a net exporter.
-130
-120
-110
-100
-90
-80
-70
-60
-50
-40
-30
-20
-10
0
10
20
30
40
50
60
Q1 Q2 Q3 Q4 Q1 Q2 Q3 Q4 Q1 Q2 Q3 Q4 Q1 Q2 Q3
2004 2005 2006 2007
T r a d e ( T W h )
Exports Impor ts Net Expor ts

8/3/2019 File 43304
http://slidepdf.com/reader/full/file-43304 15/76
Gas
December 200713
Chart 4.3 Natural gas consumption -average of four quarter ending
0
10
20
30
40
50
60
70
80
90
100
110
Q1 Q2 Q3 Q4 Q1 Q2 Q3 Q4 Q1 Q2 Q3 Q4 Q1 Q2 Q3
T W h
Iron and steelHeat sold Other final
users
Other
industries
Electricity
generators
Domestic
2004 20062005 2007 Background
Relevant table4.1: Natural gas supply and consumption………………………………………………………... Page 67
Gas production and tradeIn the third quarter of 2007, gas production was 11.2 per cent lower than a year ago. The UK was anet importer of gas in the third quarter of 2007 whereas the UK was a net exporter in the sameperiod of 2006. Imports of gas were 31.3 per cent higher than a year ago and exports were 25.0per cent lower.
The UK currently exports gas to the Netherlands from the Markham, Windermere, Grove andMinke fields, to the Irish Republic via the two Irish – UK gas interconnectors and to Belgiumthrough the Bacton-Zeebrugge interconnector. Imports to the UK are from Belgium, via theinterconnector, Norway, via the Langeled and Vesterled pipelines, and the Tampen Link (fromStatfjord to FLAGS), and Algeria, Egypt, Qatar and Trinidad (liquefied natural gas). In the thirdquarter of 2007, Norwegian gas accounted for 76 per cent of UK natural gas imports, compared to80 per cent a year ago.
Gas consumptionUntil the middle of 2000 the growth in consumption of natural gas was dominated by growth inconsumption for electricity generation, mainly in Combined Cycle Gas Turbine stations. However,high gas prices led to the use of gas for generation levelling off after 2000, rising slightly in some
years and falling back in others. While much of this switchback pattern is the result of the relativeprices of gas and coal, the 2004 growth can also be attributed to the three newest CCGT stationsoperating at high levels throughout the year, while the downturn in 2005 results from generatorspreferring coal when prices reached very high levels at the end of the year. This continued intoearly 2006. However gas use in the fourth quarter of 2006 rose back to the levels of 2003 and2004 as prices fell back. Gas use in the domestic sector is particularly dependent on temperaturesnot only during the heating season, but also in summer, when the weather can affect the amount of gas used for water heating and cooking. Temperatures in the third quarter of 2007 weresignificantly lower than a year earlier, boosting domestic consumption of gas by about 15 per centon the low levels of the third quarter of 2006.
• Demand for gas in the third quarter of 2007 was5.0 per cent higher than the level in the thirdquarter of 2006.
• Gas use for electricity generation was 0.9 per centhigher than in the third quarter of 2006.
• Provisionally, consumption in the domestic sector rose by 15.2 per cent from the low levels of a year earlier.
• In public administration, commerce and agricultureconsumption rose by 14.5 per cent compared witha year earlier. In the industrial sector gas saleswere provisionally 17.1 per cent higher than in thethird quarter of 2006.

8/3/2019 File 43304
http://slidepdf.com/reader/full/file-43304 16/76
Electricity
December 2007 14
Section 5 - Electricity
Chart 5.1 Fuel used for electricitygeneration
0
2
4
6
8
10
12
Q1 Q2 Q3 Q4 Q1 Q2 Q3 Q4 Q1 Q2 Q3 Q4 Q1 Q2 Q3
M i l l i o n t o n n e s o f o i l e q u i v a l e n t
200620052004
Coal
Gas
Nuclear
Net imports
2007
Oil, renewable and other
• Fuel used by generators in the third quarter of 2007 was, in total, 1.4 per cent lower than in the
third quarter of 2006.
• Gas use was 1.1 per cent up on the third quarter of 2006.
• Coal use in the quarter was 2.6 per cent lower thana year earlier and nuclear sources were 8.8 per cent lower.
• Hydro sources were up by 51.3 per cent on thethird quarter of 2006, due to higher rainfall andsnowfall over the winter period. Oil use fell by 6.0per cent.
Chart 5.2 Electricity supplied
• Total electricity supplied by all generators in thethird quarter of 2007 was 0.1 per cent lower (-0.1
TWh) than a year earlier.
• Indigenous supply was also 0.1 per cent lower thanin quarter 3 2006 while net imports were 64.2 per cent (+ 1.0 TWh) higher than a year earlier.
• The supply from coal fell by 4.8 per cent (-1.3TWh), while from gas fired stations supply rose by1.6 per cent (+0.6 TWh).
• The supply from nuclear stations fell by 8.8 per cent (-1.5 TWh).
• Between the third quarter of 2006 and the thirdquarter of 2007 coal’s share of electricity suppliedfell by 1.5 percentage points and nuclear’s sharefell by 1.7 percentage points while gas’s share rose
by 0.7 percentage points. The share of oil,renewables and other fuels rose by 1.3 percentagepoints.
Q3 2006Nuclear
19.9%
Oil,renew ables
and other
5.9%
Coal
31.3%
Gas
41.1%
Net imports
1.9%
Q3 2007 Nuclear
18.2%
Coal
29.8%
Gas
41.8%
Net imports
3.1%
Oil,
renewablesand other
7.2%

8/3/2019 File 43304
http://slidepdf.com/reader/full/file-43304 17/76
Electricity
December 200715
Chart 5.3 Electricity consumption
0
10
20
30
40
50
60
70
80
90
100
Q1 Q2 Q3 Q4 Q1 Q2 Q3 Q4 Q1 Q2 Q3 Q4 Q1 Q2 Q3
T W
h
2004 200720062005
Commercial and Other
Domestic
Industrial
• Final consumption of electricity fell by 1.1 per cent inthe third quarter of 2007.
• Consumption by the domestic sector rose by 1.1 per cent while industrial consumption of electricity fell by
1.3 per cent. Consumption by other final users(including transport sector use) fell by 2.7 per cent.
• In this period temperatures were on average about2½ degrees lower than in the third quarter of 2006.
Background
Relevant tables5.1: Fuel used in electricity generation and electricity supplied……………………………….. Page 685.2: Supply and consumption of electricity……………………………………………………….. Page 69
Fuel useCoal prices rose in 2004, so gas use became more attractive for generation and increased to anew record level, 3 per cent higher than 2002’s previous record. Conversely, rising gas prices over the later part of 2005 led to a preference for coal as the main fuel source for electricity generation.Generators used much more coal during 2006 as a whole, because a further rise in gas pricesmade coal fired generation more competitive. However, gas prices fell in the first quarter of 2007and continued to fall during the second and third quarters, reversing the trend with coal use fallingby 15 per cent and gas use rising 20 per cent compared with the first three quarters of 2006. Additionally, two of the oldest nuclear stations closed at the end of December 2006 and increased
coal and gas fired generation replaced these stations’ contribution.
SupplyTotal electricity supplied in the UK in 2006 was ½ per cent lower than in 2005, whereas theaverage rate of growth over the previous 5 years had been +½ per cent per year. Supply from thecoal fired power stations of all generating companies rose by 11 per cent in 2006, with electricitysupplied from gas falling 7½ per cent to be 10 per cent below 2004’s record level. Supply fromnuclear sources fell by 8 per cent in 2006 although the nuclear sector was again affected by a highlevel of outages for repairs and maintenance. Imports and exports of electricity from and tocontinental Europe are volatile with suppliers taking advantage of price differentials that havearisen during periods of extreme weather or industrial disputes. Despite a high level of electricityimports in the third quarter of 2007, imports in the first 9 months of the year were 21 per cent lower than in the corresponding period of 2006.
ConsumptionAfter the near absence of growth in 2002, electricity demand by final consumers grew by 1¼ per cent in 2003 but only by ¾ per cent in 2004 (although this rises to just above the 1½ per cent per year trend rate of growth when allowance is made for the change to reporting on a calendar year basis in 2004). In 2005, growth in electricity demand was closer to 2 per cent, the highestpercentage rise since 2000. In 2006 final consumption of electricity fell by ½ per cent, the first fallsince 1994. Consumption in 2006 was divided 29 per cent to the domestic, 28½ per cent toindustry and 27 per cent to commerce, public administration, transport and agriculture. Fuelindustries accounted for a further 8 per cent with the remaining 7½ per cent accounted for bytransmission and distribution losses.

8/3/2019 File 43304
http://slidepdf.com/reader/full/file-43304 18/76
Special feature – Sub national electricity figures
December 2007 16
Electricity generation and supply figures for Scotland, Wales, NorthernIreland and England, 2005 and 2006.
IntroductionThis article updates that published in December 2006. As before, there are confidentialityconstraints that mean that some data for generation by fuel in Northern Ireland cannot be shownseparately from those for England. The United Kingdom figures shown in the tables in this articleare taken from the Digest of United Kingdom Energy Statistics (DUKES) 2007, Chapter 5 and 7and so the definitions used are identical to those in the Digest. Tables 1 and 2 are shown in“landscape” format at the end of the main text.
Generation and net exportsIn 2005 12.4 per cent of the electricity generated in the UK was generated in Scotland, 8.7 per centin Wales, 2.4 per cent in Northern Ireland and 76.5 per cent in England. These percentages rosein 2006 to 13.5 per cent, 8.8 per cent and 2.6 per cent respectively in Scotland, Wales andNorthern Ireland, but fell in England to 75.2 per cent (Table 1).
Both Scotland and Wales are net exporters of electricity with England importing electricity fromboth countries and from continental Europe. Northern Ireland trades electricity with the Republic of Ireland to which it is a net exporter. It also imports electricity from Scotland via the Moyle
interconnector opened in 2002 but these imports are less than the net exports to the Irish Republic.In 2005 Scotland exported 14.9 per cent of the electricity generated there to consumers elsewherein the UK, but this rose to 20.4 per cent in 2006. The increase in generation in Scotland betweenthese two years was broadly equivalent to the increase in exports to England. Wales exported theequivalent of 13.0 per cent of its generation to consumers in England in 2005, falling back to 11.1per cent in 2006.
Generation by fuelTable 2 sets out the generation of electricity by the fuel categories used in Table 5.6 of the Digestof UK Energy Statistics 2007. The position in 2006 is shown in Chart 1. Unplanned outages atnuclear stations in Scotland and Wales saw reductions in output and hence nuclear’s share of generation from 38 per cent to 26 per cent in Scotland and from 23 to 20 per cent in Wales. The
Chart 1: Generation by fuel in 2006 by major power producers and other generators
0
50,000
100,000
150,000
200,000
250,000
300,000
England Scotland Wales Northern Ireland
G W h
Generators other than MPPs
Oil and renewables
Nuclear
Coal
Gas

8/3/2019 File 43304
http://slidepdf.com/reader/full/file-43304 19/76
Special feature – Sub national electricity figures
December 200717
high price of gas in 2006 meant that gas’ share of generation in England and Wales was lower than in 2005, but in Scotland the share increased because of the large reduction in nuclear’s shareof Scottish generation. In Northern Ireland gas accounted for around two thirds of generation. Correspondingly coal’s share rose in all countries compared with 2005. In Scotland coal’s share of generation was 33 per cent, up from 25 per cent. In Wales 26 per cent of generation in 2006 wasfrom coal (up from 19½ per cent) while in England the increase was from a 37 per cent share to a40 per cent share. In Northern Ireland the share of coal in generation increased by 1 percentage
point. The role of renewables is discussed in a separate section below. Combined heat andpower (CHP) forms the bulk of “Other generators” generation, although some major power producers (MPPs) also operate generators that are partially CHP. CHP statistics for 2006 on asub-national and regional basis were published in the September 2007 issue of Energy Trends.The share of generation accounted for by generators other than major power producers variesacross the UK. In Scotland in 2006 other generators had a 15 per cent share, while in England theshare was 8½ per cent, in Wales 8 per cent and in Northern Ireland 4½ per cent.
Chart 2: Electricity consumption in 2006
Wales
6.7%
Scotland
10.1%
NorthernIreland
2.4%
England
80.8%
Consumption and salesTransmission and distribution losses are notseparately available for Scotland, Wales,Northern Ireland and England so estimates
have been made using the same proportionsof electricity supplied as for the UK as awhole. Consumption figures have then beencalculated by deducting net transfers andlosses figures from the electricity suppliedfigures shown in Table 1. These show(Chart 2) that in 2006 10.1 per cent of electricity consumption in the UK was inScotland, 6.7 per cent in Wales, 2.4 per centin Northern Ireland and 80.8 per cent inEngland, all little changed from thepercentage shares in 2005.
Since 2001 separate data have beencollected for sales of electricity from thepublic supply system in Scotland, Englandand Wales, and Northern Ireland andpublished as monthly Table 5.5 on theBERR Energy Statistics web site (seereferences at the end of the article).
Because of definitional and other differences set out in the Technical Notes to Chapter 5 of theDigest of UK Energy Statistics 2007, there is a statistical difference between the calculatedconsumption and the sales data in Table 1. As part of its commitment to improving the quality of its statistics, BERR continues to examine this statistical difference and look further at thecomponent series to see where the differences might be arising and thus where improvements tothe data might be made. Statistical differences reported in Table 1 are lower than reported in last
year’s corresponding table.
RenewablesThe share of renewables in electricity generation or sales is measured in two different ways in theUK1. First there is the “headline” overall measure that shows the percentage of electricitygeneration accounted for by all renewables. Secondly there is the measure that is based on theRenewables Obligation (RO) (and the analogous Renewables Obligation (Scotland) - ROS) whichshows the percentage of electricity sales accounted for by renewables eligible under these
1There is also a third method used by the EU – a Renewables Directive basis – see Chapter 7 of the Digest of UK
Energy Statistics 2007, paragraph 7.8.

8/3/2019 File 43304
http://slidepdf.com/reader/full/file-43304 20/76
Special feature – Sub national electricity figures
December 2007 18
obligations. The main differences are the exclusion from the RO of large-scale hydro and non-biodegradable wastes2. Table 3 shows the overall measure for 2004, 2005 and 2006.
Table 3: Renewables percentagesUK Scotland Wales Northern Ireland England
2004 3.58 11.56 2.96 2.03 2.352005 4.23 13.13 3.56 2.87 2.92
Overallrenewablespercentage 2006 4.55 12.99 4.04 3.42 3.14
Scotland’s and Wales’ hydro outputs in 2003 and 2006 were affected by the dryer weather thatcaused a 34.5 per cent reduction in UK hydro generation in 2003 compared with 2002 and a 6.4per cent reduction in 2006 compared with 2005.
Under the headline measure, the high proportion of natural flow hydro in Scotland took the 2005renewables percentage to 13.13, but it fell back to 12.99 in 2006. This share is very much higher than other parts of the UK can produce. On a RO basis, the percentage measure for the UK (2.21per cent in 2003, 3.06 per cent in 2004, 3.99 per cent in 2005, and 4.15 per cent in 2006) is notmeaningful at sub-national level because electricity generated in one part of the UK can be sold ina different part of the UK. However, in Scotland the renewables target (which is to reach 31 per cent by 2011 and 50 per cent by 2050) is expressed as generation as a proportion of grosselectricity consumption (defined as generation plus transfers into Scotland less transfers out of
Scotland). In 2004 this percentage was 13.9 rising to 15.4 in 2005 and 16.3 in 20063. The amountof electricity from renewable sources transferred from Scotland or Wales to England, or fromScotland to Northern Ireland is not known. What is known from Table 2 is that the amount of ROSeligible electricity generated in Scotland in 2006 was 16½ per cent greater than in 2005 and theamount of RO eligible electricity generated in Wales in 2006 was 23 per cent more than in 2005. In England the increase was 7½ per cent and in Northern Ireland 26 per cent. In the UK as awhole RO eligible electricity production increased by 11 per cent. Renewables statistics for 2006on a sub-national and regional basis were published in the September 2007 issue of EnergyTrends.
Mike JanesEnergy Statistics and AnalysisTel: 020 7215 5186
Fax: 020 7215 2723E-mail: [email protected]
References:Digest of UK Energy Statistics 2007. Published for BERR by The Stationery Office £40.00, but also availableon the BERR web site at: www.berr.gov.uk/energy/statistics/publications/dukes/page39771.htmlEnergy Trends monthly Table 5.5: www.berr.gov.uk/energy/statistics/source/electricity/page18527.html “Combined Heat and Power in Scotland, Wales, Northern Ireland and the regions of England in 2006” –Energy Trends September 2007, page 26: www.berr.gov.uk/files/file41460.pdf “Renewable energy in Scotland, Wales, Northern Ireland and the regions of England in 2006” – EnergyTrends September 2007, page 16: : www.berr.gov.uk/files/file41460.pdf
2Specific exclusions from eligibility for the RO are existing hydro plant over 20 MW; all plant using renewable
sources built before 1990 (unless re-furbished); and energy from mixed waste combustion unless the waste is firstconverted to fuel using advanced conversion technology.3
The corresponding percentages for the UK as a whole are 3.51 in 2004, 4.15 in 2005 and 4.47 in 2006 which aresimilar to the overall renewables percentages in Table 3

8/3/2019 File 43304
http://slidepdf.com/reader/full/file-43304 21/76
Table 1: Generation and supply of electricity in Scotland, Wales, Northern Ireland and England,2005 and 2006
2005 2006
UK total Scotland WalesNorthern
Ireland England UK total Scotland Wales
Generated by Major power producers 362,212 41,848 32,201 9,239 278,925 361,656 45,525 32,203
Other generators 36,160 7,399 2,448 399 25,914 36,670 8,084 2,711
Total generated 398,372 49,246 34,649 9,638 304,838 398,326 53,609 34,914 Own use by Other generators 1,608 329 109 18 1,152 1,495 330 111
Electricity supplied (net) by Other generators 34,552 7,070 2,340 381 24,762 35,175 7,754 2,600
Used in pumping at pumped storage and other ownuse by MPPs 19,972 3,403 4,601 325 11,643 21,991 4,267 5,594
Electricity supplied (net) by MPPs 342,241 38,445 27,600 8,915 267,282 339,666 41,259 26,609
Electricity transferred to England (net of receipts) - 5,628 4,497 - -10,125 - 10,036 3,888Electricity transferred to Northern Ireland (net of receipts)
- 1,687 - -1,687 - - 905 -
Electricity transferred to Europe (net of receipts) -8,321 - - 2,073 -10,394 -7,517 - - Transfers from other generators to public supply 9,777 2,170 1,009 277 6,322 12,145 2,851 1,308
Transmission losses 5,777 573 382 134 4,688 5,736 571 380
Distribution losses 24,861 1,874 1,388 512 21,086 24,902 1,826 1,366 Consumption from public supply [A] 329,733 30,859 22,344 8,160 268,370 328,722 30,779 22,286
Consumption by autogenerators 24,744 4,894 1,329 104 18,418 22,999 4,896 1,290
Total Electricity consumption 354,476 35,753 23,672 8,264 286,788 351,720 35,675 23,576
Electricity sales (public supply) [B] 329,073 30,975 23,125 7,647 267,326 328,299 29,866 23,064 Statistical difference +660 -115 -781 +512 +1,044 +423 +913 -778
between calculated consumption [A] and sales [B]
Figures in this table do not sum exactly to the UK totals shown because of rounding
1 9
D e c
em b er 2 0 0 7

8/3/2019 File 43304
http://slidepdf.com/reader/full/file-43304 22/76
Table 2: Generation of electricity by fuel in Scotland, Wales, Northern Ireland and England, 2005 and
2005 2006
UK total Scotland WalesNorthern
Ireland England UK total Scotland WalesMajor power Coal 130,894 12,092 6,772 2,455 109,576 146,356 17,488 8,992
producers: Oil 2,716 556 - 331 1,829 2,883 890
Gas 137,483 6,250 14,984 6,454 109,795 126,637 8,347 13,272Nuclear 81,618 18,681 7,842 - 55,095 75,451 14,141 7,010
Thermal renewables 2,746 - 176 - 2,570 2,750 - 36
Hydro natural flow 3,826 3,626 196 - 4 3,727 3,476 226
Hydro pumped storage 2,930 643 2,231 - - 3,853 1,184 2,668
Total 362,212 41,848 32,201 9,239 278,925 361,656 45,525 32,203
Other Coal 3,954 51 - 3,903 3,926 30
Generators: Oil 2,419 1,346 41 1,031 2,116 1,251 105
Gas 15,227 3,121 967 11,139 14,705 3,287 802
Thermal renewables 6,291 595 60 6 5,630 6,546 714 231
Other thermal 3,683 - 585 3,089 3,615 - 648
Hydro natural flow 1,096 962 68 19 46 878 749 49
Non thermal renewables 2,912 1,281 715 253 663 4,232 2,023 867
Wastes 578 43 11 524 651 29 9Total 36,160 7,399 2,448 399 25,914 36,670 8,084 2,711
Total generation by fuel 398,372 49,246 34,649 9,638 304,838 398,326 53,609 34,914
within
which: Renewables Hydro 4,922 4,588 281 19 34 4,605 4,225 275
Wind, wave, solar 2,912 1,281 715 253 663 4,232 2,023 867
Other 9,036 595 236 4 8,200 9,296 714 267
Total 16,870 6,464 1,232 277 8,897 18,133 6,961 1,409
Renewables eligible under the renewablesobligation 13,138 4,051 1,059 277 7,751 14,554 4,576 1,286
Percentage Coal 33.9% 24.7% 19.5% 36.9% 37.7% 32.7% 25.8%
shares of Oil 1.3% 3.9% 0.1% 1.0% 1.3% 4.0% 0.3%
generation: Gas 38.3% 19.0% 46.0% 40.5% 35.5% 21.7% 40.3%
Nuclear 20.5% 37.9% 22.6% 17.5% 18.9% 26.4% 20.1%
Hydro natural flow 1.2% 9.3% 0.8% -% 1.1% 7.9% 0.8%Other renewables 3.0% 3.8% 2.8% 2.9% 3.4% 5.1% 3.2%
Other 1.8% 1.3% 8.2% 1.2% 2.0% 2.3% 9.5%
Total 100% 100% 100% 100% 100% 100% 100%
Shaded areas indicate where separate figures for Northern Ireland cannot be given and the data have been merged with data for England
Figures in this table do not sum exactly to the UK totals shown because of rounding
2 0
D e c em b er 2 0 0 7

8/3/2019 File 43304
http://slidepdf.com/reader/full/file-43304 23/76
Special feature – Regional and local electricity consumption
Regional and local electricity consumption statistics for 2006
The fourth annual exercise to collect and publish electricity consumption data at a regional andlocal level has now taken place. This has been conducted by BERR which replaced DTI in June2007. The first exercise was reported in the December 2004 edition of Energy Trends with anupdated article in the March 2005 edition of Energy Trends. The results of the second exercise
were presented in an article in the December 2005 edition of Energy Trends and the results of thethird in an article in the December 2006 edition of Energy Trends.
SummaryEstimates of final electricity consumption at both local authority (NUTS4 1) and government officeregion (NUTS1) levels assist local and regional bodies to monitor and implement the energyefficiency programmes in their own areas. Once again excellent co-operation from electricitysuppliers, distributors and data aggregators, has led to total and average consumption levels fordomestic and industrial/commercial sectors being made available here. As before, the informationhas been taken from the administrative systems of the electricity companies’ data aggregators, butwhile the quality of the data is a further improvement on that for previous years, the statistics
shown here are again classed as “experimental” while detailed comparisons are made between thefour years of data to ensure that all the shortcomings of the earlier years’ data have beenunderstood and allowed for.
MethodologyTo produce 2006 annualised data at both local authority (NUTS4) and government office regional(NUTS1) levels, data were collected for all electricity metering points and then aggregated for eachof the sub national areas. Every metering point has a unique reference number called an MPAN ormeter point administration number – which may have one or more meters. Consumption data forall MPANs are held on the systems of the data aggregators (DAs), the agents of the electricitysuppliers who collate/aggregate electricity consumption levels for each meter. To find thegeographical location of each MPAN, the services of a company called Gemserv are used.
Gemserv is the company that provides one central access point for suppliers, distributors and theiragents to obtain address and postcode information about each MPAN. By merging the DAs’consumption data with Gemserv’s postal address information, local and regional consumptionestimates were compiled. Gemserv provided BERR with the full address and postcode from theirnew on-line system ECOES2 at the end of 2006.
DAs responsible for non half hourly (NHH) meters (domestic and small commercial customers)were asked to use a standard run on their systems over the 2007 August Bank Holiday weekend togenerate annualised consumption rates for the period from 30 January 2006 to 29 January 2007. This ensured that the data generated were consistent, that the task could be easily accommodatedwithin the work schedules of the DAs, and that the costs to the electricity industry of providing thedata were minimised. The information that was provided by the data aggregators was as follows:
• Consumption data, based on either an annualised advance (AA) or an estimated annualconsumption (EAC). The AA is based on actual meter readings, whilst the EAC is anestimate of consumption based on historical information and the profile class of thecustomer. The DAs’ systems for NHH meters work around a 14-month settlement period,which ensures that around 80 per cent of the data are based on AAs after 7 months and
1 NUTS (Nomenclature of Units for Territorial Statistics) is a hierarchical classification of spatial units that
provides a breakdown of the European Union’s territory for producing regional statistics which arecomparable across the EU. NUTS1 refers to the 9 Government Office Regions in England, and separatelyWales, Scotland, (and Northern Ireland), totalling 12 UK NUTS1 regions. NUTS4 refers to the 354 individualLondon boroughs/metropolitan districts/unitary authorities/local authority districts in England, the 22individual unitary authorities in Wales, the 41 individual or groups of whole/part unitary authorities and/or
local enterprise company areas in Scotland, (and the 26 individual district unitary authorities in NorthernIreland), totalling 443 UK NUTS4 regions. NUTS5 areas are broadly Electoral Wards; there are about10,000 NUTS5 areas in Great Britain. 2 ECOES is the Electricity Central Online Enquiry Service
December 200721

8/3/2019 File 43304
http://slidepdf.com/reader/full/file-43304 24/76
Special feature – Regional and local electricity consumption
approximately 92 per cent after 14 months. So by generating the data for BERR in August2007, around 80 per cent of NHH MPAN data collected for this exercise was based onelectricity consumption taken from actual meter readings. There are around 28¾ milliondomestic, industrial and commercial NHH MPANs in Great Britain.
• For NHH meters the profile attached to each MPAN was also given and profiles 1 and 2were allocated to the Domestic sector and profiles 3 to 8 to Industrial and Commercial. AllHH meters were allocated to Industrial and Commercial.
• For half hourly (HH) meters (larger commercial customers), DAs ran a simple report ontheir systems to give the total amount of consumption for the calendar year 2006. Thereare currently around 109,000 HH meters in Great Britain (up from 105,000 in 2005).
• In addition to data linked to domestic and commercial properties, the data files alsoprovided consumption levels for unmetered sites including street lighting and electricityused by the electrified railway network, based mainly in the south of England.
For the 2003 analysis DTI used the Office for National Statistics’ (ONS) Postcode Lookup File inorder to assign postcodes first to NUTS5 areas and from there to NUTS4 areas. For 2004 and2005 the Gemserv data was matched against the All Fields Postcode Directory (AFPD) to obtain aNUTS5 code and the NUTS5 code was truncated to 7 characters, giving a NUTS4 code. The
AFPD was re-named as the NSPD (National Statistics Postcode Directory) in May 2006. For the2006 exercise the February 2007 NSPD was used. Out of the 31.1 million records in the Gemservdataset, it was not possible to allocate a NUTS code to around 900,000 records. This was due tothe postcode being incomplete, invalid or missing. A number of invalid postcodes were correctedby automated methods, for example, changing those that started 1P to IP, those ending II to LL,and standardising on postcode spacing. Where a NUTS code could not be allocated in this way,the street and post town, or just post town, was used to allocate a NUTS code. These changesresulted in reducing the number of unmatched Gemserv records to 323,000. During the last 12months, BERR/DTI has worked its way through those Gemserv data with incomplete, invalid ormissing postcodes and added complete postcodes from other sources including Royal Mail’sPostcode Address File. This work resulted in reducing the number of MPANs with consumptionthat could not be allocated to a NUTS4 area to around 30,000. Because allocation to NUTS area
is by postcode, any address containing a PO Box number will be assigned to the NUTS area of thePost Office sorting depot. This is particularly important for interpretation of data at a level belowthat of NUTS4 such as the middle layer super output area (MLSOA) analyses described below. Inallocating MPANs to MLSOAs (or Dzones in Scotland), the NSPD did not have correspondingcodes for all postcodes. In addition, on occasions it was only possible to allocate a NUTS4 codebut not a lower level MLSOA code. As a result around 570,000 MPANs did not have an MLSOAcode allocated.
Any nominally domestic MPANs with consumption over 100,000 kWh (ie profile codes 1 and 2)were allocated to the industrial and commercial sector in the same way as they had been forprevious years. Inspection of the individual data showed that there were very few recognisableprivate addresses with consumptions over 100,000 kWh, but a significant number between 50,000
and 100,000 kWh per year. Additionally, where the third to sixth variable of the address includedtext that indicated the address to be of a commercial nature by containing UNMET or UMS (ieunmetered supply) or STR (street lighting) or LAND or LLO (Landlord supply) or STAIR (staircaselighting), TEMP (temporary builders’ supply), LTD, PLC, SHOP or HOTEL consumption wasmoved to the industrial and commercial category. (This refinement was introduced for 2004 but forthat year and 2005 only the third variable of the address was searched and LTD, PLC, SHOP andHOTEL were not included in the search). The 100,000 kWh cut off is known to have classifiedsome very large domestic users to the industrial and commercial sector but this is more thanoutweighed by the number of small industrial and commercial consumers that will have beenallocated to the domestic sector. In 2006 this process has resulted in 6,000 meters being re-allocated with around 3,600 of this being due to consumption being greater than 100,000 kWh.
December 2007 22

8/3/2019 File 43304
http://slidepdf.com/reader/full/file-43304 25/76
Special feature – Regional and local electricity consumption
Regional and local estimates of final electricity consumption data Table 3 shows the amount of electricity consumed by selected local authorities within eachgovernment office region. The table is broken down by domestic and commercial/industrialcustomers and shows the total amount of electricity consumed in GWh and the number ofcustomers. Average consumption levels for domestic and non-domestic MPANs are also provided.The local authorities within each region have been selected to show those areas with the highest
and lowest average consumptions. Commercial and industrial customers may have more than oneMPAN per site. The number of domestic sector MPANs in Great Britain is larger than the numberof households by about 6 per cent, although in Scotland there are around 19 per cent moredomestic MPANs than households. This is because in Scotland it is estimated that some 280,000domestic customers are on two-rate or three-rate meters using dynamic teleswitching to control when cheaper rate electricity is made available to consumers and these customers will have twoMPANs per address. A similar system (resulting in multiple MPANs per customer) is available tohouseholds in England and Wales (“Economy 10” being one example) but this is less widespread(around 800,000 customers in total). Second homes, holiday homes and additions to the housingstock will also lead to the number of MPANs exceeding the number of households. This meansthat the sales per MPAN figures understate consumption per household for most local authorities.The full table showing all NUTS4 areas3 within these regions is available on the BERR Energy
statistics web site at:www.berr.gov.uk/energy/statistics/regional/index.html www.berr.gov.uk/files/file42925.xls
Electricity consumption not covered by the data collection exerciseThe consumption estimates provided here cover only Great Britain, and exclude those largeconsumers of electricity that are connected to the high voltage lines of the transmission system.Northern Ireland has been excluded because the structure of the electricity industry in NorthernIreland differs from the rest of the United Kingdom, where in 2006 there was a single monopolysupplier to domestic customers, Northern Ireland Electricity plc. This creates problems withdisclosure. However, any consumer of more than 500 MWh per year can select its supplier from
one of 6 licensed suppliers. In November 2007 the electricity market was further opened so thatany Northern Ireland consumer can select their supplier. BERR has been in contact with NorthernIreland about extending this analysis in time for 2007 so that the whole of the United Kingdom iscovered.
In addition, DAs do not hold information on their systems for consumption levels for those industrialconsumers, such as very large sites or plant, who receive their electricity as CVA (Central VolumeAllocation) users via the high voltage transmission system. CVA users have differentarrangements with their electricity suppliers to NHH and HH meter customers. CVA consumptionis particularly important in Wales and so the consumption figure for Wales in Table 3 is lower thanconsumption estimate given on page 25.
Also excluded is electricity used by companies that generate their own electricity and consume itwithout it passing over the public distribution network. This amounted to 24.5 TWh in the UK as awhole in 2006. Much of this “autogeneration” is from CHP schemes and an indication of theregional importance of such schemes can be obtained from an article on pages 26 to 32 of theSeptember 2007 edition of Energy Trends (“Combined Heat and Power in Scotland, Wales,Northern Ireland and the regions of England in 2006”).
Comparison with other published annual figures for 2006Table 1 compares the total figures shown in Table 3 with corresponding electricity figurespublished in Chapter 5 of the Digest of United Kingdom Energy Statistics 2007 (DUKES). Afterallowing for electricity not included in consumption in Table 3 (CVA and Northern Ireland), there is
3 The NUTS4 areas in Scotland do not match exactly the Scottish Local Authority Areas. There are moreNUTS4 areas in Scotland than Local Authorities. In the analysis in the full table Scottish Local Authorities areused in place of NUTS4 giving a total of 408 local areas in Great Britain.
December 200723

8/3/2019 File 43304
http://slidepdf.com/reader/full/file-43304 26/76
Special feature – Regional and local electricity consumption
a difference of around 4.2 TWh or just under 1½ per cent. Some of this will be due to the fact thataround 20 per cent of the data in the sub-national exercise is based on estimates rather thanactual meter readings while another factor is that the NHH records run from end January 2006 toend January 2007 and not for the calendar year 2006.
Table 1: Comparison with published UK statistics for 2006 GWh
GB Total in Table 3 - Domestic 117,817Industrial and Commercial 200,156Total for Great Britain 317,973
Plus Northern Ireland 8,063Plus Sales direct from high voltage lines (based on Ofgem data) 6,600
Implied UK Sales of electricity 332,636UK Sales of electricity (DUKES 2007 Table 5.5) 328,300Statistical difference +4,336
(+1.3% of UKSales)
Domestic sector (DUKES 2007 Table 5.2) 116,449Less Northern Ireland -3,242
Domestic sector GB 113,207GB Total in Table 3 - Domestic 117,817Statistical difference +4,610
(+3.9% of GBdomestic
consumption)
In addition the sub-national figures for domestic consumption appear to include about 4.6 TWh thatare included as non-domestic consumption in DUKES. Some of this will be due to the overall over-estimate of consumption described in the paragraph above, but some will also be due to theclassification of consumption by profile class (see ‘Methodology’ section, above) with smallcommercial and industrial consumers classified as domestic consumers.
Preliminary analysesThe lowest average domestic electricity consumptions (which is consumption per meter pointrather than per home or per household) are 3,466 kWh in Islington, 3,482 kWh in South Tynesideand 3,517 kWh in Blaenau Gwent while the highest is 7,291 kWh in the Isles of Scilly (although ona per household basis estimated average consumptions in the Orkney and Shetland Islands arehigher than this at around 9,500 and 11,300 kWh respectively). Commercial and industrial sectorelectricity consumption is a function of both the number of commercial and industrial sites in anarea and the volume of electricity they use. Commercial centres such as Westminster, Leeds,Glasgow, Manchester, Birmingham and Tower Hamlets (Docklands) have a high total overallvolume of consumption but they also have a large number of non-domestic consumers so average
consumption per commercial and industrial meter point is usually relatively low. The three areaswith the highest average consumption per commercial or industrial meter point (the City of London,Neath Port Talbot and Ellesmere Port and Neston) are of note because in those areasconsumption is shared between fewer but larger consumers of electricity. The lowest level ofindustrial and commercial consumption of electricity in total volume terms is recorded in the Isles ofScilly and the Orkney Islands. However, low average consumptions are found in rural areas suchas Penwith, Wealden, Torridge and the Western Isles, but also in some inner city areas such asHackney, Lewisham and Lambeth.
For Great Britain as a whole average domestic consumption per meter point in 2006 was 4,457kWh4, with the West Midlands being the closest to this average in Regional terms. The East, the
4 Households are not evenly distributed about this mean because households using electricity as their mainsource of heating will have much higher consumptions. However, the majority of households do not useelectricity as their main source of heating and the median MPAN recorded consumption of around 3,615kWh per year in 2006.
December 2007 24

8/3/2019 File 43304
http://slidepdf.com/reader/full/file-43304 27/76
Special feature – Regional and local electricity consumption
South East and the South West had the highest domestic sector averages and the North East thelowest. However, on an estimated consumption per household basis Scotland’s average at over5,300 kWh is the highest. For industrial and commercial use the greatest regional volume ofconsumption is in Greater London and the least in the North East. However, in terms of electricityconsumed per £ thousand of Gross Value Added, Wales ranks the highest and the North East thesecond highest with Greater London the lowest as Table 2 shows.
Table 2: Electricity consumption in 2006 in the industrial and commercial sectorcompared with economic activity
Electricity consumption(GWh)
kWh consumption per £thousand of Gross Value Added*
Wales 11,794 286.28
North East 9,315 258.53
Yorkshire and the Humber 17,157 219.67
North West 23,355 219.44
East Midlands 14,989 209.14
West Midlands 17,300 204.17
Scotland 17,452 202.19South West 15,783 185.77
East of England 16,827 179.88
South East 24,632 161.18
Greater London 29,143 143.07
Great Britain total(including unallocated)
200,156 184.76
* This uses provisional Gross Value Added in 2005 at current basic prices (workplace based) as available atwww.statistics.gov.uk/downloads/theme_economy/NUTS1_Tables_1-8.xls; Table 1.8 at 3 December 2007.
Chart 1: Average gas and electricity consumption per household, 2006
0
5,000
10,000
15,000
20,000
25,000
S c o t l a n d
E a s t o f E n g l a n d
S o u t h W e s t
S o u t h E a s t
G r e a t B r i t a i n
W e s t M i d l a n d s
E a s t M i d l a n d s
W a l e s
N o r t h W e s t
Y o r k s a n d H u m b e r
L o n d o n
N o r t h E a s t
k
W h p e r H o u s e h o l d
Electric Gas
(Corrected chart)
December 200725

8/3/2019 File 43304
http://slidepdf.com/reader/full/file-43304 28/76
Special feature – Regional and local electricity consumption
Charts 1 and 2 illustrate the data at regional level. Chart 1 shows regional consumption for thedomestic sector on a per household basis (rather than per MPAN) using the latest availablehousehold data. The regions are shown in order of average annual consumptions but annualaverage gas consumptions (see article on page 30) are also given.
Chart 2 similarly combines electricity and gas use per £ thousand of Gross Value Added. The
South West, South East and London use proportionately more electricity than gas per unit ofoutput on this basis.
Chart 2: Industrial and commercial electricity and gas consumption per £ thousandof value added, 2006
0
100
200
300
400
500
600
700
W a l e s
N o r t h E a s t
Y o r k s a n d
H u m b e r
N o r t h W e s t
E a s t
M i d l a n d s
W e s t
M i d l a n d s
S c o t l a n d
G r e a t B r i t a i n
S o u t h W e s t
E a s t o f
E n g l a n d
S o u t h E a s t
L o n d o n
k W h p e r £ t h o u s a n d G V A
Electric Gas
Improvements to the data since 2003Experimental results for 2005, 2004 and 2003 were published in the December 2006, December2005 and March 2005 editions of Energy Trends. The 2006 data are judged to be of better qualitythan those of the earlier years as the following improvements have been made:
• As described in the Methodology section, above, much more data have now been allocatedto NUTS4 areas than in earlier years. Unallocated consumption accounted for 0.8 per centof the Great Britain total compared with 1.7 per cent unallocated in 2005 and 6.5 per centunallocated in 2003. In terms of numbers of MPANs unallocated the proportion has fallenfrom 0.7 per cent in 2003 to 0.1 per cent in 2006.
• The 2003 data as submitted to DTI contained duplicated entries for a large number ofMPANs, although this was mainly confined to the North West region. Although theduplicated data were removed, it is suspected that the resultant dataset did not adherestrictly to the specification used by other datasets in other regions. There were noduplicated entry problems in 2004 and 2005. In 2006 the duplicate entries resulting from
one data aggregator providing data for a slightly later time period have been removed.• The system for moving non domestic data to the industrial and commercial sector through
identifying large non-private household use such as street lighting, other unmetered usage,and usage attributable to communal areas in multi-occupied dwellings and housing estateshas been extended in 2006 by identifying the words “Ltd”, “PLC”, “Shop” and “Hotel” withinthe address fields. From 2005 DTI/BERR was able to remove duplicated MPANs that canarise for new connections because of changes to building plans. Mostly these wereMPANs for which consumption was zero and full postcodes had not been allocated.
• Since 2003 there has been a general improvement in the statistical differences betweenthese data in aggregate and corresponding data published in the Digest of UK EnergyStatistics. The statistical difference has fallen from 3.4 per cent of UK electricity sales in2003 to 1.3 per cent in 2006. The statistical difference for domestic sector sales has fallen
from 14.2 per cent in 2003 to 3.9 per cent in 2006 (see Table 1, above).• These unallocated figures have shown a reduction in bias over the four years. For
domestic consumers the average consumption of the unallocated MPANs in 2003 was 10½
December 2007 26

8/3/2019 File 43304
http://slidepdf.com/reader/full/file-43304 29/76
Special feature – Regional and local electricity consumption
December 200727
per cent below the average for all domestic consumers but this reduced to 8 per cent belowin 2004, 5 per cent below in 2005 and 2½ per cent below in 2006. For the unallocatedMPANs in the industrial and commercial sector average consumption in 2003 was almost 4times the average consumption for all industrial and commercial MPANs (ie some verylarge consumers could not be allocated to a NUTS4 area). This rose in 2004 but in 2005fell back to less than 1½ times, but rose once again to 3 times the average in 2006.
However, each year the Royal Mail introduces changes to postcodes so that areas of the countrythat are expanding can be better covered. This can lead to discontinuities in the allocation ofMPANs to NUTS areas via the NSPD.
There was a small increase in average domestic consumption per MPAN from 4,600 kWh in 2003to 4,628 kWh in 2004 but this fell back to 4,606 kWh in 2005 and then to 4,459 kWh in 2006 at theGreat Britain level. Average industrial and commercial consumption per MPAN has shown a smallfall from 77,909 kWh in 2003 to 77,620 kWh in 2004 but rose to 78,223 kWh in 2005 and 81,876kWh in 2006. The total number of MPANs with non-zero electricity consumption recorded is shownto have risen from 28.25 million in 2003 to 28.38 million in 2004, 28.50 million in 2005 and 28.88million in 2006. Annually around one million MPANs have no electricity consumption because they
relate to new-build properties, new businesses or established businesses that have closed down.
The improvements to the data, described above, mean that changes at region and local authoritylevel between the 2003, 2004 and 2005 data are most likely to be due to data improvements. Thedata should not be used to infer that consumption in any particular area has gone up or down.
As a result of the improvements that have been made, BERR will be seeking to have the dataclassified as “National Statistics” in 2008.
Consumption information below local authority area levelFollowing a successful pilot exercise with 6 local authorities during 2005 and 2006 BERR producedan additional analysis of the 2004 Regional and Local Authority based electricity data at middlelayer super output area (MLSOA) for local authorities in England and Wales. For the 2005 data ananalysis was produced for both electricity and gas consumption at MLSOA in England and Walesand for intermediate geography zone (IGZ) for local authorities in Scotland. These analyses wereproduced after the Local Authority based data, which resulted in some minor discrepanciesbetween the two data sets. An article in the June 2007 edition of Energy Trends described themethodology undertaken to produce this information. For the 2006 data, a similar MLSOA/IGZanalysis was carried out simultaneously with the local authority based analysis, which has avoidedsuch discrepancies. However, due to the increased risk of breaching National Statistics datadisclosure rules when publishing more disaggregated information, additional checks need to beundertaken before the data can be released. It is hoped that the data will be made available inearly 2008 on the BERR website at: www.berr.gov.uk/energy/statistics/regional/index.html
Mike Janes Emma NadolnyEnergy Statistics and Analysis Energy Statistics and AnalysisTel: 020 7215 5186 Tel: 020 7215 5188Fax: 020 7215 2723 Fax: 020 7215 2723E-mail: [email protected] E-mail: [email protected]
The production of this article and the associated tables is very much a team effort. The BERR team includesJulian Prime, Jennifer Knight, Hannah Evans, and Jon Williams. The excellent co-operation in this processof data aggregators and Gemserv is also acknowledged.

8/3/2019 File 43304
http://slidepdf.com/reader/full/file-43304 30/76
Table 3: Selected regional and local electricity consumption statistics (experimental)
Domestic consumersCommercial and
industrial consumers All consumers
Government Office Regions and
selected NUTS4 Regions
Sales 2006GWh
Number ofMPANs
(thousands)
Sales 2006GWh
Number ofMPANs
(thousands)
Sales 2006GWh
Number MPANs
(thousand
Blaenau Gwent 110 31.2 186 2.2 296
Ceredigion 179 31.7 205 5.6 384
Powys 289 58.5 377 11.3 666
Neath Port Talbot 232 62.6 1,289 4.0 1,521
TOTAL WALES 5,600 1,328.5 11,794 125.1 17,394 1,4
Glasgow City 1,293 334.5 2,112 25.7 3,405 3
Renfrewshire 367 89.3 590 5.4 957
Orkney Islands 84 12.8 60 2.3 144
Clackmannanshire 103 24.4 232 1.4 335
TOTAL SCOTLAND 12,117 2,695.9 17,452 228.9 29,568 2,9
South Tyneside 240 69.0 275 4.0 515
Berwick-upon-Tweed 80 15.8 100 2.4 180
Sunderland 455 124.8 972 7.9 1,427 1
Redcar and Cleveland 242 62.4 1,018 3.8 1,260
TOTAL NORTH EAST 4,494 1,173.8 9,315 82.4 13,809 1,2
Barrow-in-Furness 125 32.4 372 2.2 497
Eden 135 23.6 316 4.4 452
Copeland 141 31.9 122 2.9 264
Ellesmere Port & Neston 146 34.9 759 2.3 905
TOTAL NORTH WEST 13,111 3,064.2 23,355 242.6 36,465 3,3
Barnsley 379 100.9 736 6.2 1,115 1
Ryedale 120 23.7 207 3.8 327
Richmondshire 110 22.3 121 2.9 231North Lincolnshire 294 69.3 1,148 5.9 1,442
TOTAL YORKSHIRE AND THE HUMBER 9,564 2,272.8 17,157 179.5 26,721 2,4
Chesterfield 178 48.2 354 4.1 532
Corby 101 24.4 425 2.1 526
East Lindsey 321 62.8 424 7.7 746
South Northamptonshire 201 35.6 236 3.0 437
D e c em b er 2 0 0 7
2 8
TOTAL EAST MIDLANDS 8,510 1,927.7 14,989 161.3 23,499 2,0

8/3/2019 File 43304
http://slidepdf.com/reader/full/file-43304 31/76
Table 3 (continued): Selected regional and local electricity consumption statistics (experimen
Domestic consumersCommercial and
industrial consumers All consumers
Government Office Regions andselected NUTS4 Regions
Sales 2006GWh
Number ofMPANs
(thousands)
Sales 2006GWh
Number ofMPANs
(thousands)
Sales 2006GWh
Number MPANs
(thousand
Stoke-on-Trent 425 110.5 711 8.7 1,136 1
Stratford-on-Avon 298 53.4 360 6.0 658
South Shropshire 110 20.1 109 3.2 218
North Warwickshire 132 26.5 416 2.5 548
TOTAL WEST MIDLANDS 10,436 2,324.8 17,300 200.9 27,736 2,5
Norwich 221 61.6 549 7.1 771
Mid Suffolk 231 39.8 281 4.2 512
Castle Point 184 37.2 97 2.3 281
Thurrock 307 64.6 791 4.4 1,099
TOTAL EAST OF ENGLAND 11,973 2,456.9 16,827 217.4 28,801 2,6
Islington 318 91.6 948 18.5 1,265 1
Barnet 682 137.1 569 11.9 1,251 1Hackney 342 93.8 438 17.1 780 1
City of London 25 5.6 2,718 7.9 2,742
TOTAL GREATER LONDON 13,701 3,267.4 29,143 415.4 42,843 3,6
Wealden 337 62.0 217 6.8 554
South Bucks 155 26.8 235 2.7 389
Portsmouth 341 86.0 699 7.3 1,040
Crawley 172 40.0 540 3.3 712
TOTAL SOUTH EAST 17,041 3,565.0 24,632 337.1 41,673 3,9
Swindon 369 86.3 925 6.0 1,294
Isles of Scilly 8 1.2 8 0.4 16
Restormel 262 45.1 545 5.2 807
Weymouth and Portland 122 30.4 122 2.8 244
TOTAL SOUTH WEST 11,181 2,336.7 15,783 244.1 26,964 2,5
Unallocated Consumption 88 20.3 2,410 9.9 2,499
2 9
D e c em b er 2 0 0 7
GREAT BRITAIN 117,816 26,433.8 200,156 2,444.6 317,972 28,8

8/3/2019 File 43304
http://slidepdf.com/reader/full/file-43304 32/76
Special feature – Regional and local gas consumption
Regional and local gas consumption statistics for 2006
IntroductionIn March 2007 DTI (whose energy responsibilities have now been absorbed by BERR) publishedthe results of exercises covering 2004 and 2005 that converted gas consumption provided by“xoserve” into estimates of gas consumption at a regional and local level (NUTS1 and NUTS4
areas
1
). xoserve delivers transportation transactional services on behalf of all the major gasnetwork transportation companies and is therefore the custodian of the Annual Quantity (AQ) data.BERR has now carried out a similar exercise for 2006 data having obtained permissions from thegas transporting companies for xoserve to release these data to BERR. These data are at MeterPoint Reference Number (MPRN) level and BERR was able to use its experience of collecting andanalysing the Meter Point Administration Number (MPAN) level data for electricity consumption(see article on pages 21 to 29) to organise and analyse the gas data at this disaggregated level.BERR has also augmented the xoserve data with data from eight groups of companies that areindependent gas transporters (companies that have installed and own the local gas distributionpipelines between the National Grid network and, usually, recently built properties). Theseindependent gas transporters account for some 850,000 customers and 16,900 GWh ofconsumption.
MethodologyThe xoserve data were allocated to NUTS5 areas using the National Statistics Postcode Directory(NSPD) compiled by the Office for National Statistics (ONS). Truncating the NUTS5 code to 7characters gives the NUTS4 code. Out of the 22.2 million records on the xoserve and independentgas transporters databases in 2006 it was not possible to allocate a NUTS code to only a verysmall number of records (just 534) because of incomplete, missing or incorrect postcodes. Thisimproved matching, compared with the 9,000 figure for 2005, was due to additional data sourcessuch as the Postcode Address File (PAF) being used to allocate data. The method of allocatingdata to NUTS areas differs from the method previously used before 2004 when the only data thatBERR had access to was National Grid (Transco) data at postcode sector level and entailedapportioning data to NUTS4 areas when postcode sectors spanned more than one Local Authority.
Additionally, to avoid disclosure of data for individual customers (which confidentiality commitmentsdid not permit) National Grid used an algorithm to combine postcode sectors. In different yearsdifferent postcodes were selected for amalgamation because the number of customers in aparticular postcode sector may have moved above or below the amalgamation threshold. Thismakes comparison between years more difficult. A corresponding dataset for 2004 has also beenprovided by xoserve and identical methodology was used to produce a NUTS4 level dataset. Thiswas analysed in the March 2007 article. However, in 2004 more records had incomplete, missingor incorrect postcodes (just under 124,000) and data for some of the independent gas transporterswere not available and had to be estimated using the 2005 data.
Because allocation to NUTS area is by postcode, any address containing a PO Box number will be
assigned to the NUTS area of the Post Office sorting depot. This is particularly important forinterpretation of data at a level below that of NUTS4 such as the Middle Layer Super Output Area(MLSOA) analyses described below. In allocating MPRNs to MLSOAs (or Dzones in Scotland),the NSPD did not have corresponding codes for all postcodes. In addition, on occasions it was
1 NUTS (Nomenclature of Units for Territorial Statistics) is a hierarchical classification of spatial units that
provides a breakdown of the European Union’s territory for producing regional statistics which arecomparable across the EU. NUTS1 refers to the 9 Government Office Regions in England, and separatelyWales, Scotland, (and Northern Ireland), totalling 12 UK NUTS1 regions. NUTS4 refers to the 354 individualLondon boroughs/metropolitan districts/unitary authorities/local authority districts in England, the 22individual unitary authorities in Wales, the 41 individual or groups of whole/part unitary authorities and/or
local enterprise company areas in Scotland, (and the 26 individual district unitary authorities in NorthernIreland), totalling 443 UK NUTS4 regions. There were 4 NUTS4 areas in Great Britain where National Gridtransmitted no gas: Isles of Scilly, Eilean Siar (Western Isles), Orkney Islands and Shetland Islands. NUTS5areas are broadly Electoral Wards; there are about 10,000 NUTS5 areas in Great Britain.
December 2007 30

8/3/2019 File 43304
http://slidepdf.com/reader/full/file-43304 33/76
Special feature – Regional and local gas consumption
only possible to allocate a NUTS4 code but not a lower level MLSOA code. As a result around200,000 MPRNs did not have an MLSOA code allocated.
CoverageThe data represent gas transported through the national distribution system that was previouslywholly owned by National Grid. The data exclude any gas passing through other transmission anddistribution systems such as those owned by North Sea producers. However, gas that passesthrough the National Transmission System and then into another independently owned localdistribution system before reaching consumers is included. The data relate only to distribution andexclude large loads fed directly from the national transmission system (such as certain powerstations and large industrial consumers). The data do include the two and a half thousand gasconsumers whose consumptions are recorded on a daily basis (Daily Metered or DM customers). As such, the total consumption of the NUTS4 areas given in this article represents around three fifths of the total UK gas consumption for 2006, as recorded in the Digest of UK Energy Statistics2007 (DUKES). Of the remaining two fifths, almost all of it is gas supplied to power stations andother larger users through the National Transmission System but about 5 per cent is gas suppliedthrough the transmission systems of others. Further work by BERR has enabled the non-xoservedata to be allocated to NUTS4 areas and hence to regions and this is set out below in Table 1.
The annual quantity (AQ) data on which the consumption for each gas meter is based is anestimate of annualised consumption between two meter readings at least 6 months apart with theclosing reading taken within the period 1st April 2006 to 31st March 2007. However, not all AQsare recalculated each year, mainly because gas shippers have not provided any new meterreadings. The number of AQs carried forward is variable but is usually around 4 million. Aweather correction factor is applied (except to sites that have daily meters) so that AQ data areadjusted to normal weather conditions based on a 17 year average. For these reasons the datacannot be exactly aligned to data in DUKES which are calendar year and not weather corrected, ordata on electricity which are partly calendar year and partly 30 January 2006 to 29 January 2007.
Regional and local estimatesTable 2 (presented in “landscape” format at the end of this article) shows gas sales via the national
distribution network for Scotland, Wales and the regions of England for 2006. Domestic sectorsales are distinguished from commercial and industrial sales and the numbers of consumers arealso given. From this information sales per consumer have been calculated. The data cannot befully disaggregated into final consumption, energy industry use and transformation use at NUTS4level.
The data received from xoserve do not currently contain a reliable profile marker to indicate if theMPRN relates to either a domestic or industrial/commercial consumer. The gas industry uses a cutoff point of 73,200 kWh (2,500 therms) and classifies consumers below that annual consumptionlevel as domestic consumers. This incorrectly allocates many small businesses to the domesticsector, and some large domestic consumers to the industrial/commercial sector. BERR iscontinuing to investigate whether a better classification can be produced, either through linking the
meter point data to external business databases through postcode or by using information on theelectricity meter point database.
In addition, Table 2 shows information for a selected number of NUTS4 areas. The full tablesshowing all 408 NUTS4 areas2 are available on the BERR Energy statistics web site at:www.berr.gov.uk/energy/statistics/regional/index.htmlwww.berr.gov.uk/files/file42926.xlsMaps showing NUTS4 areas are available from the National Statistics web site at:www.statistics.gov.uk/geography/maps.asp .
2 The NUTS4 areas in Scotland do not exactly match the Scottish Local Authority Areas. There are moreNUTS4 areas in Scotland than Local Authorities. In the analysis in the full tables Scottish Local Authoritiesare used in place of NUTS4 giving a total of 408 local areas in Great Britain.
December 200731

8/3/2019 File 43304
http://slidepdf.com/reader/full/file-43304 34/76
Special feature – Regional and local gas consumption
The NUTS4 areas (local authority areas in Scotland) selected for Table 2 have been chosen toshow some of the variation within the wider region. NUTS4s with the highest per meter point salesin 2006 are shown as well as the areas with the lowest per meter point sales.
When comparisons are made between 2006 and data for 2004 and 2005, it should be recognisedthat in the domestic sector new housing developments can substantially change the averageconsumption per consumer, as can new connections to the gas network. Similarly new industrial
and commercial establishments or the closure or run down of existing businesses can have a largeeffect on the average consumption in a NUTS4 area, particularly if that incoming or outgoingbusiness was a relatively large consumer.
Preliminary analysesThe lowest average domestic consumptions (strictly consumption per meter point rather than perhome or household) in 2006 are 12,442 kWh in Tower Hamlets, followed by Southwark (13,454) and Westminster (13,804) – all inner city areas. The highest average domestic consumptions areEast Renfrewshire (24,690 kWh), South Buckinghamshire (24,322) and Chiltern (24,058). Highaverage industrial and commercial consumptions tend to occur where a number of relatively largeconsumers dominate an area with a relatively small total number of industrial meter points. As a
result Kings Lynn and West Norfolk, Thurrock and Selby, all have an average of over 3,500,000kWh. The smallest average per meter point industrial and commercial consumptions are found infour rural areas Argyll and Bute (189,025 kWh), Elmbridge (189,194) South Buckinghamshire(190,895) and Tandridge (192,586). Areas with a large number of industrial and commercialmeters tend to be major commercial centres such as Birmingham, Westminster, and Leeds (allwith more than 5,000 meter points).
Chart 1: Average gas consumption per household, 2006
10,000
11,000
12,000
13,000
14,000
15,000
16,000
17,000
18,00019,000
20,000
S c o t l a n d
N o r t h E a s t
Y o r k s a n d H u m b e r
N o r t h W e s t
W a l e s
E a s t M i d l a n d s
S o u t h E a s t
G r e a t B r i t a i n
W e s t M i d l a n d s
E a s t o f E n g l a n d
L o n d o n
S o u t h W e s t
k W h p e r M e t e r
0
Charts 1 and 2 illustrate the data at a regional level. Chart 1 shows regional consumption for thedomestic sector on a per household (ie per MPRN) basis. Scotland, the North East of England and
December 2007 32

8/3/2019 File 43304
http://slidepdf.com/reader/full/file-43304 35/76
Special feature – Regional and local gas consumption
Yorkshire and The Humber have the highest average gas consumptions and London and theSouth West of England the lowest. Gas demand in the domestic sector is very weather sensitiveso this is as expected.
Chart 2 shows that Yorkshire and the Humber and the North East of England have the highestindustrial and commercial gas consumption per thousand pounds of Gross Value Added 3 at morethan twice the corresponding figures for London and the South East of England. Adding electricity
consumption per thousand pounds of Gross Value Added (see article on page 21) to thecorresponding gas figure, to indicate the more energy intensive regions, makes very little changeto the distribution, except to raise Wales and the North East of England, which are big electricityusers, above Yorkshire and the Humber.
Chart 2: Industrial and commercial gas and electricity consumption per £ thousand of valueadded, 2006
0
100
200
300
400
500
600
700
Y o r k s a n d
H u m b e r
N o r t h E a s t
W a l e s
N o r t h W e s t
S c o t l a n d
W e s t
M i d l a n d s
E a s t
M i d l a n d s
G r e a t B r i t a i n
E a s t o f
E n g l a n d
S o u t h W e s t
S o u t h E a s t
L o n d o n
k W h p e r £ t h o u s a n d G V A
Gas Electric
Middle layer super output area (MLSOA) and Intermediate Geography zone (IGZ)estimates of gas consumptionFollowing a successful pilot for extending the local authority electricity analysis to middle layersuper output areas4 DTI published 2005 gas consumption data at MLSOA for local authorities inEngland and Wales and at IGZ for local authorities in Scotland. Articles in the June 2007 andSeptember 2007 editions of Energy Trends provide more information on the approach to producingthis data. The exercise has been repeated, and data for 2006 has been prepared, and is currentlyundergoing disclosure checking before it can be released on the BERR website. Disclosure is aparticular issue for IGZ, as the gas network is less widespread in Scotland, and IGZ cover a
smaller number of households than MLSOAs. The publication of this data has enabled councils tomonitor and target small areas for further interventions as part of their local energy strategies, andenhance the implementation of energy efficiency programmes and reduction of CO2 emissions.
Mean and median gas consumptionThe dataset of consumption at MPRN level enables the distribution of gas consumptions to beexamined. Of particular interest are consumptions of 73,200 kWh and below covering mainly thedomestic sector but also small businesses. In 2004 mean annual consumption per MPRN for this
3Using provisional Gross Value Added in 2005 at current basic prices (workplace based) as available at
www.statistics.gov.uk/downloads/theme_economy/NUTS1_Tables_1-8.xls; Table 1.8 as at 3 December 2007.4
Middle layer super output areas are a statistical geography developed by the Office for National Statistics
(ONS) as part of the 2001 census. They are areas containing a minimum population of 5,000 or around2,000 households. MLSOA have the advantage of having more stable boundaries and are morehomogenous in terms of population when compared to NUTS5 or electoral ward areas. In Scotland, a similarsystem has been devised called data zones, which are combined to form Intermediate Geography Zones.
December 200733

8/3/2019 File 43304
http://slidepdf.com/reader/full/file-43304 36/76
Special feature – Regional and local gas consumption
category was 19,325 kWh, falling to 19,020 kWh in 2005 and to 18,240 in 2006. The medianconsumptions in each of these years were lower than this at 17,973 kWh in 2004 and 17,604 kWhin 2005 and 16,787 kWh in 2006. High gas prices and warm weather contributed to thesereductions. Certain annual consumption values are used as defaults for meters in new propertiesand for meters that for other reasons had no meter readings on which to base AQs. The values of12,100, 13,420, 15,150, 20,600, and 22,500 kWh are particular cases in point. These local “peak”values were removed from the distributions before the means and medians given above were
calculated.
Gas consumption not covered by the national datasetAs in the March 2007 article, BERR has produced a breakdown of the remaining two fifths of gasconsumption not covered by the xoserve data, subject to confidentiality constraints. In 2006,according to Table 4.3 of DUKES 2007, gas consumption in the UK amounted to 958,377 GWh. Of this, it is estimated that 295,229 GWh was accounted for by 36 power stations and byconsumers in Northern Ireland (who were supplied by a single supply company) and 96,812 GWhby around 70 large industrial sites. Clearly, the relatively small number of sites means thatassigning consumptions to NUTS4 areas would disclose the gas consumption of individual sites.BERR and xoserve have both undertaken that such commercially sensitive information would not
be disclosed. However NUTS4 areas on the full regional and local gas tables are available on theBERR energy web site at:www.berr.gov.uk/energy/statistics/regional/regional-local-gas/page36200.html and carry a marker to indicate that they contain either power stations or large industrial consumers.Table 1 gives information for the regions of England, Scotland, Wales, and Northern Ireland,although some regions are combined so as not to disclose the data for individual consumers orsuppliers. When these power station and large consumer figures are subtracted from total UK gasconsumption the balance is close to the sum of the domestic and industrial and commercial figuresshown in Table 2 (and Table 3 of the corresponding March 2007 article). The difference betweenthese estimates is accounted for by the fact that the xoserve numbers are weather corrected ratherthan actual gas sales as reported to BERR by suppliers, and by the fact that the periods covered(see Coverage, above) are slightly different.
Table 1: Sub-national gas consumption data for power stations andlarge industrial consumers GWh
2005 2006
Power stations and Northern Ireland:
East Midlands 34,360 20,481
Yorkshire and the Humber 63,932 57,178
East of England 42,875 48,007
London and the South East 50,765 47,244
North East and North West 41,257 41,084
Scotland and Northern Ireland 32,436 36,806
Wales and the South West 32,129 40,172Total 302,827 295,229
Large industrial consumers5
110,327 96,812Implied xoserve total – (calculated estimate, see textabove). This is not corrected for weather and includesstatistical differences. 597,829 566,336
UK gas consumption (Table 4.3 of DUKES 2007) 1,010,983 958,377xoserve GB totals as shown in Table 2 (weathercorrected to standard 17 year trend) – Table 3 ofMarch 2007 article for 2005 667,588 628,734Implied weather correction, calendar and otherstatistical differences. 69,759 62,398
5The 2005 data now include all consumers classed as unique sites by xoserve. This covers more
consumers than the previous National Grid/Transco classification.
December 2007 34

8/3/2019 File 43304
http://slidepdf.com/reader/full/file-43304 37/76
Special feature – Regional and local gas consumption
December 200735
ConsultationIf you have any comments on these estimates please send them to Emma Nadolny at the emailaddress below. Alternatively mail can be addressed to Ms Emma Nadolny, Bay 2101, 1 VictoriaStreet, London, SW1H 0ET.
Emma Nadolny Mike JanesEnergy Statistics and Analysis Energy Statistics and AnalysisTel: 020 7215 5188 Tel: 020 7215 5186Fax: 020 7215 2723 Fax: 020 7215 2723E-mail: [email protected] E-mail: [email protected]
The production of this article and the associated tables is very much a team effort. The BERR team includesJulian Prime, Jennifer Knight, Hannah Evans, and Jon Williams. The excellent co-operation in this processof xoserve and the independent gas transporters is also acknowledged.

8/3/2019 File 43304
http://slidepdf.com/reader/full/file-43304 38/76
Table 2: Regional and local gasconsumption statistics 2006 Domestic consumers (1)
Commercial and industrialconsumers All cons
Government Office Regions and selected NUTS4Regions
Sales 2006 -GWh
Number ofMPRNs
(thousands)
Sales 2006 -GWh
Number ofMPRNs
(thousands)
Sales 2006 -GWh
Gwynedd 449 27.69 261 0.58 710
Blaenau Gwent 635 30.20 289 0.52 925
Pembrokeshire 543 31.19 128 0.48 671
Wrexham 818 46.22 1,597 0.62 2,414
TOTAL WALES 19,599 1,059.75 12,803 15.46 32,401
Glasgow City 3,640 226.51 2,915 4.48 6,555
East Renfrewshire 794 32.15 149 0.68 943
Argyll and Bute 206 10.36 50 0.27 256
Moray 530 26.40 1,361 0.51 1,891
TOTAL SCOTLAND (2) 34,342 1,784.50 24,468 32.53 58,811
Middlesborough 1,013 56.90 406 0.81 1,420
Castle Morpeth 402 16.89 136 0.32 538Alnwick 193 9.66 60 0.20 253
Redcar and Cleveland 1,029 57.64 1,265 0.61 2,295
TOTAL NORTH EAST 20,018 1,051.0 12,317 15.71 32,335
Barrow-in-Furness 496 31.06 562 0.40 1,059
Macclesfield 1,333 59.45 680 1.54 2,013
Copeland 508 27.26 104 0.35 612
Eden 191 10.01 634 0.24 852
TOTAL NORTH WEST 51,567 2,763.99 30,642 46.56 82,209
City of Kingston upon Hull 1,713 106.20 1,306 1.75 3,020
Harrogate 1,140 54.91 584 1.40 1,724
Craven 382 19.76 135 0.47 517
Selby 447 24.13 1,260 0.35 1,707
TOTAL YORKSHIRE AND THE HUMBER 37,954 2,021.33 26,898 35.10 64,852
Lincoln 619 38.20 382 0.66 1,001
Derbyshire Dales 510 24.44 328 0.61 838
Rutland 223 11.16 71 0.26 294
Corby 429 23.54 1,027 0.42 1,456
D e c em b er 2 0 0 7
3 6
TOTAL EAST MIDLANDS 30,484 1,648.55 17,491 26.95 47,976

8/3/2019 File 43304
http://slidepdf.com/reader/full/file-43304 39/76
Table 2: Regional and local gasconsumption statistics 2006 Domestic consumers (1)
Commercial and industrialconsumers All cons
Government Office Regions and selected NUTS4Regions
Sales 2006 -GWh
Number ofMPRNs
(thousands)
Sales 2006 -GWh
Number ofMPRNs
(thousands)
Sales 2006 -GWh
Worcester 622 38.37 266 0.58 887
Bromsgrove 721 34.55 193 0.68 914
South Shropshire 133 7.70 38 0.15 171
East Staffordshire 693 39.23 798 0.64 1,490
TOTAL WEST MIDLANDS 36,676 2,013.38 21,172 34.05 57,848
Norwich 866 56.09 550 0.98 1,415
Castle Point 681 34.08 86 0.38 767
Three Rivers 695 32.29 203 0.85 897
Thurrock 894 54.44 2,649 0.64 3,543
TOTAL EAST OF ENGLAND 34,679 1,923.17 19,766 31.84 54,445
Tower Hamlets 918 73.76 803 1.39 1,720
Barnet 2,660 122.22 747 3.46 3,406Greenwich 1,479 91.21 995 1.18 2,474
Newham 1,409 89.93 1,310 1.12 2,720
TOTAL GREATER LONDON 50,943 2,923.45 26,007 58.20 76,950
Portsmouth 1,115 75.96 528 1.08 1,644
South Bucks 594 24.41 191 1.00 785
Elmbridge 1,135 48.83 385 2.04 1,520
Swale 820 48.98 955 0.59 1,775
TOTAL SOUTH EAST 55,121 3,008.46 23,669 56.03 78,790
Penwith 242 17.21 59 0.27 301
East Dorset 639 32.26 101 0.39 740
Restormel 367 22.92 773 0.42 1,139
West Somerset 123 7.74 385 0.12 508TOTAL SOUTH WEST 27,785 1,686.00 14,305 26.48 42,090
Unallocated 10 0.56 17 0.40 28
GREAT BRITAIN 399,179 21,884.18 229,555 379.29 628,733
(1) Customers with an annual consumption of less than 73,200 kWh which will include some small industrial and commercial con
3 7
D e c em b er 2 0 0 7

8/3/2019 File 43304
http://slidepdf.com/reader/full/file-43304 40/76
Special feature – Regional and local energy consumption
December 2007 38
Regional and local estimates of non gas, non electricity and non roadtransport fuels in 2005
The March 2007 edition of Energy Trends contained a short article advising readers that 2004consumption estimates of non gas, non electricity and non road transport at local authority(NUTS4) and regional (NUTS1) levels. Estimates of similar data for 2005 have now beenproduced for BERR by AEA Energy and Environment who are responsible for the National
Atmospheric Emissions Inventory (NAEI); much of the base data for the estimates was obtainedfrom the NAEI. The dataset covers consumption of a number of different fuel sources includingcoal, manufactured solid fuels, industrial and domestic use of petroleum and renewables. As withdata for 2003 and 2004, it has not been possible to produce local authority estimates for petroleumconsumption for aircraft and national navigation, as consumption cannot be sensibly allocated to aNUTS4 area. There are also no estimates of “heat sold” as the source data that is currentlyavailable is already heavily modelled at the UK level, and therefore cannot be further disaggregated. In a similar vein, robust estimates for areas below local authority level (such asMiddle Layer Super Output Area) cannot be produced.
Users should note that for the 2005 estimates AEA have implemented some methodologicalchanges to their modelling procedure. These include more sophisticated modelling of domesticand rail consumption in Northern Ireland, and the incorporation of point-source energy data frominstallations that participate in the EU Emissions Trading Scheme. Whilst methodological changesare made to improve the modelling, the statistics are classed as experimental, and theconsumption estimates should be treated as indicative. Users are advised not to directly comparethe local authority estimates for 2003, 2004 and 2005.
The AEA Energy and Environment report on how the estimates were compiled can be found at thefollowing link: www.berr.gov.uk/files/file42998.pdf The dataset of the 2005 estimates at local authority and government office regional levels can befound at the following link: www.berr.gov.uk/files/file42996.xls
Further information on the estimates including a guidance note for data users on how to interpretthe BERR local and regional energy data, and access to the 2003 to 2005 modelled datasets is
available respectively from the following web links below:www.berr.gov.uk/files/file41626.pdf www.berr.gov.uk/energy/statistics/regional/other/page36195.html
Comments or further enquiries regarding this dataset should be addressed to Julian Prime at the e-mail address below. Alternatively mail can be addressed to Julian Prime, BERR, Bay 206-212, 1Victoria Street, London, SW1H 0ET.
Julian PrimeEnergy Consumption StatisticsTel: 020 7215 6178Fax: 020 7215 2723E-mail: [email protected]

8/3/2019 File 43304
http://slidepdf.com/reader/full/file-43304 41/76
Special feature – Regional and local energy consumption
December 200739
Regional and local total energy consumption statistics for 2005
IntroductionThis article provides further details behind the 2005 estimates of total energy consumption that arepublished on the BERR regional energy consumption statistics website. This work forms part of theBERR regional energy project set up to make available energy consumption data below nationallevel. The project was initiated following the 2003 Energy White Paper, which emphasised the
importance of local and regional decision making in energy policy. As part of this project, anumber of local and regional datasets have been produced for 2005 (data are also available on theBERR website for 2003 and 2004). Estimates of 2005 consumption for electricity were released inJanuary 2007, gas in March 2007, road transport in June 2007 and remaining fuels in this editionof Energy Trends. This article combines the consumption statistics for these four datasets to givetotal energy consumption at regional and local level in 2005. Together with the aforementionedregional information, the statistics presented in this article are classed as experimental; however BERR is working towards ensuring that full National Statistics status for the data are gained byMarch 2008.
MethodologyThe individual articles on gas, electricity, road fuel and “other” fuels all contain a detaileddescription of the methodology by which the estimates were obtained. In summary, the gas data
were obtained from xoserve1 and the independent gas transporters, then mapped to NUTS4 areasusing geographical information held on the National Statistics Postcode Directory (NSPD). Theelectricity statistics were produced by collecting consumption data for all electricity meters withinGreat Britain from the electricity suppliers and then allocating these to a NUTS4 area using theNSPD and the Postcode Address File (PAF). The road transport fuels figures were produced for BERR by AEA Energy and Environment using information on emissions from the NationalAtmospheric Emissions Inventory (NAEI) combined with traffic flow data produced by theDepartment for Transport (DfT). The remaining fuels were also modelled by AEA using spatialdata produced for the NAEI.
When combined, the information from these sources covers the majority of final energyconsumption in a locality. However it was recognised that it would not be meaningful to allocateenergy consumption locally or regionally for some energy uses, in particular aviation and shipping,and so a decision was made to exclude these uses from the analysis. It was not possible to modelnon-energy use of petroleum products and natural gas; nor was it practical to allocate heat sold atlocal and regional level since the source for this information is already heavily modelled, asdescribed in Chapter 1, paragraph 1.35 of the 2007 edition of the Digest of United Kingdom EnergyStatistics (DUKES). Due to limitations of the source data, some estimates at local and regionallevel are less robust than others. This applies in particular to the non-gas, non-electricity and non-road transport fuels which are heavily modelled and often based on many different sources of information. Thus the local estimates for these fuels should be treated as indicative, and atpresent BERR wish them to be classed as experimental. The fuels and sectors which have notbeen allocated to local or regional level are shown in Table 1. The table also gives the overallquantity of fuel consumed in these sectors together with the percentage of final energyconsumption attributable to each.
The sources and fuels which have been mapped to regional and local level are shown in Table 2,together with details of where additional information about the source, methodology andcommentary can be found.
1xoserve was set up in May 2005 following the re-structuring of the gas distribution network to deliver
transportation transactional services to gas shippers on behalf of the gas transporters.

8/3/2019 File 43304
http://slidepdf.com/reader/full/file-43304 42/76
Special feature – Regional and local energy consumption
December 2007 40
Table 1: Fuels and sectors not included at regional and local level2
Fuel Consumption sector Quantity (ktoe)
Percentage of total final
energyconsumption3
Derived gases Industrial 280 0.16%Petroleum products Air transport 13,856 8.05%Petroleum products National Navigation 1,370 0.80%Heat sold All sectors 1,309 0.76%
Table 2: Sources for further information regarding fuels and sectors modelledat regional and local level
Fuel Consumption sector Source of estimates andfurther information
Electricity Industrial & commercialElectricity Domestic
Data from electricity meters:Energy Trends December 2006
Gas Industrial & commercialGas Domestic
Data from gas meters:Energy Trends March 2007
Petroleum Road transport AEA Energy and Environment,NAEI and DfT: Energy Trends June 2007
Petroleum Rail transportPetroleum Industrial & commercialPetroleum DomesticManufactured Solid Fuels IndustrialManufactured Solid Fuels DomesticCoal Industrial & commercialCoal DomesticRenewables and waste All sectors
AEA Energy and Environment,NAEI modelling: Remainingf uels - BERR Regional EnergyConsumption Website and thisedition of Energy Trends
Commercial includes the DUKES categories “Commercial”, “Public Administration”, “Miscellaneous”, and“Agriculture”
Additional information on how the sub national estimates of energy consumption were compiled isavailable in the guidance note below for data users: www.berr.gov.uk/files/file41626.pdf
There are no local authority gas and electricity data for Northern Ireland as in 2005 these marketswere dominated by single suppliers and any data released would be potentially disclosive. Toprevent disclosure, the total gas figure for Northern Ireland has been merged with the Great Britainconsumption from large industrial users and power stations. Similarly, electricity consumption inNorthern Ireland has been combined with the 0.5 per cent of total GB electricity consumption that itwas not possible to allocate to a specific local authority. Information for road transport and the
remaining fuels have been analysed to include local authorities within Northern Ireland since themajority of these figures are modelled. Individual reconciliations with published UK figures arecontained in the relevant Energy Trends articles for the individual fuels; where appropriateadjustments for the treatment of consumption in Northern Ireland are explained, together with other definitional and technical reasons for differences between the aggregated UK figures published inthe DUKES, and those obtained for combining local and regional estimates.
2 Figures are taken from Digest of United Kingdom Energy Statistics (DUKES) 2006
3Total Final Energy Consumption is taken from DUKES 2006, Table 1.1

8/3/2019 File 43304
http://slidepdf.com/reader/full/file-43304 43/76
Special feature – Regional and local energy consumption
December 200741
When preparing the regional estimates, the figures were reconciled with 2005 fuel and energy datacontained within the 2006 edition of DUKES. Some of these figures were subsequently revisedwhen the 2007 edition was published in July 2007, but the decision was taken not to revise thelocal and regional figures.
Table 3, which follows this article, shows the two local authorities in each region with the highestand lowest energy consumption by fuel source or end use. It gives a summary of the full dataset
which breaks down energy consumption by fuel and end use, and shows consumption in GWh andthousand tonnes of oil equivalent (ktoe). The full dataset can be found at:www.berr.gov.uk/energy/statistics/regional/total-final/page36187.html
Data interpretationAs mentioned earlier, different methodologies have been used to produce the estimates for different fuels. Where possible, the electricity and gas estimates are based on real consumptiondata; where this is the case the figures are good quality. However the road transport and “other”fuels are heavily modelled and as such could be subject to more variability at local and regionallevel. Readers are encouraged to familiarise themselves with the methodology sections of theindividual articles referred to in Table 2 before attempting to interpret the combined fuelconsumption results presented in this article. In each of the local authority rows, the consumptionfigures are best interpreted as indicative; the rows for many local authorities will underestimate
their consumption since it has not been possible to allocate some electricity and gas consumptionto individual local authorities. However the total unallocated data appears in the “Northern Irelandand Unallocated” row towards the foot of the table. For the gas figures there is the additionalcaveat that their industrial coverage is wider than final consumption, with some energy industry useand transformation use included at NUTS4 level.
As mentioned above, the data used in this report are currently classified as experimental and themethodology used in producing them is continually improving. For the gas and electricity data,better matching of post codes has significantly reduced the number of unallocated meters year onyear.
For the remaining fuels analysis, new data taken from the EU Emissions Trading Scheme and 1km square gas consumption statistics for the domestic sector have been used to improve the
reliability of the 2005 estimates.
BERR therefore advises that the total energy estimates for 2005 should not be directly comparedto those for 2004 or 2003 and that the consumption estimates, particularly for road transport andresidual fuels should be treated as indicative.
Hannah Evans Julian PrimeEnergy Consumption Statistics Energy Consumption StatisticsTel: 020 7215 2703 Tel: 020 7215 6178Fax : 020 7215 2723 Fax : 020 7215 2723E-mail: [email protected] E-mail: [email protected]

8/3/2019 File 43304
http://slidepdf.com/reader/full/file-43304 44/76
Table 3: Selected 2005 regional and local energy consumption statistics (experimental)
Fuel Consumed (ktoe) Cons
Selected NUTS4 Region
Coal(4)
Manufactured
fuels(5)
Petroleum
(4)
Naturalgas
ElectricityRenewables
& wasteTotal fuel
consumptionIndustry &
Commerci
Pembrokeshire 4.7 0.2 854.3 59.2 91.4 2.1 1,011.9 834
Cardiff 1.3 - 177.5 422.0 152.3 1.1 754.2 348
Blaenau Gwent 2.4 0.1 32.0 76.1 25.7 1.0 137.2 49
Merthyr Tydfil 0.8 - 40.3 62.6 22.0 0.5 126.3 41
WALES 237.9 281.1 3,642.6 2,950.2 1,510.4 59.7 8,682.0 4,201
Falkirk 4.9 3.9 1,043.2 178.4 70.0 266.6 1,566.9 1,320
Glasgow City 1.1 0.8 315.4 587.5 296.0 2.3 1,203.2 483
Eilean Siar 2.2 0.1 36.4 - 13.5 1.0 53.2 14
Orkney Islands 1.3 0.1 38.4 - 11.9 0.6 52.2 22
SCOTLAND 263.9 73.6 5,907.8 5,240.2 2,537.2 377.3 14,400.0 6,511
Redcar and Cleveland 181.4 318.7 129.8 198.1 108.6 126.4 1,062.9 888
Stockton-on-Tees 2.8 0.1 567.7 291.2 111.5 59.2 1,032.5 771
Alnwick 1.7 0.1 44.5 22.6 14.1 0.8 83.6 22
Teesdale 1.8 0.1 46.3 21.6 11.3 0.8 82.0 30
NORTH EAST 983.5 327.0 2,382.3 2,980.5 1,193.8 217.6 8,084.7 4,361
Ellesmere Port and Neston 0.3 0.2 1,052.5 190.6 61.9 38.1 1,343.4 1,233
Manchester 4.6 - 255.3 462.5 231.0 1.2 954.6 404
Rossendale 1.6 - 52.3 92.8 34.8 0.7 182.1 76
Barrow-in-Furness 0.4 - 27.5 89.2 42.3 0.4 159.7 82
NORTH WEST 126.3 23.5 6,640.0 7,679.9 3,120.9 114.9 17,705.4 7,252
North Lincolnshire 16.2 422.6 1,501.1 182.3 124.0 12.2 2,258.5 1,945
Leeds 6.6 1.2 573.9 759.6 332.3 5.1 1,678.7 566
Richmondshire 4.2 0.2 99.7 36.7 19.6 1.9 162.3 39
Craven 3.8 0.2 82.3 47.4 25.1 1.8 160.6 46
YORKSHIRE AND HUMBER 205.0 456.5 5,702.1 5,990.8 2,289.8 298.4 14,942.6
D e c em b er 2 0
0 7
4 2

8/3/2019 File 43304
http://slidepdf.com/reader/full/file-43304 45/76
Table 3 (continued): Selected 2005 regional and local energy consumption statistics (experimental)
Fuel Consumed (ktoe) Cons
Selected NUTS4 Region
Coal(4)
Manufactured
fuels(5)
Petroleum
(4)
Naturalgas
ElectricityRenewables
& wasteTotal fuel
consumptionIndustry &
Commerci
Leicester 0.7 - 127.7 344.4 144.2 1.2 618.2 297
Nottingham 0.4 - 115.5 310.3 136.1 33.7 596.1 282
Melton 0.7 - 46.0 48.1 26.0 0.3 121.1 51
Oadby and Wigston 0.2 - 24.4 55.1 19.4 0.1 99.1 34
EAST MIDLANDS 476.3 11.5 4,337.1 4,334.1 2,057.8 172.7 11,389.4 4,394
Birmingham 8.0 0.1 469.2 1,028.7 428.4 96.9 2,031.3 882
Coventry 3.6 0.7 168.4 313.6 139.7 63.6 689.7 331
South Shropshire 1.7 0.1 74.1 15.1 16.7 0.7 108.4 25
Oswestry 1.3 0.1 47.7 21.6 17.1 0.6 88.4 25
WEST MIDLANDS273.9 21.2 4,892.7 5,218.3 2,344.6 296.3 13,047.1 4,818
Thurrock 18.6 - 773.3 330.7 97.5 0.1 1,220.3 995South Cambridgeshire 32.0 0.1 257.4 105.5 71.5 12.9 479.3 165
Castle Point 0.1 - 29.8 69.5 24.2 - 123.5 19
Maldon 0.4 - 35.8 34.0 30.8 0.2 101.2 34
EAST ENGLAND 122.4 4.4 5,947.9 4,869.1 2,517.0 40.8 13,501.6 4,902
Westminster - - 130.3 374.8 348.5 0.8 854.4 579
Hillingdon 0.2 - 226.4 304.7 153.6 0.4 685.3 311
Kingston upon Thames 0.1 0.1 80.7 125.0 55.3 0.3 261.5 60
Barking and Dagenham - - 76.5 113.2 67.4 0.1 257.1 80
LONDON 2.9 2.0 3,553.7 6,865.8 3,562.9 243.9 14,231.2 5,228
New Forest 3.6 0.1 1,414.6 159.9 74.2 43.1 1,695.5 1,407
Tonbridge and Malling 7.3 - 163.4 393.4 45.5 10.0 619.6 390
Gosport 0.2 - 22.5 54.8 28.7 0.1 106.4 36
Adur 0.3 - 41.3 43.9 20.6 0.2 106.3 24
SOUTH EAST 230.8 14.9 8,820.2 7,392.6 3,590.6 144.4 20,193.4 7,193
D e c em b er 2 0 0 7
4 3

8/3/2019 File 43304
http://slidepdf.com/reader/full/file-43304 46/76
Table 3 (continued): Selected 2005 regional and local energy consumption statistics (experimental)
Fuel Consumed (ktoe) Cons
Selected NUTS4 Region
Coal(4)
Manufactured
fuels(5)
Petroleum
(4)
Naturalgas
ElectricityRenewables
& wasteTotal fuel
consumptionIndustry &
Commerci
Bristol, City of 1.3 0.3 205.2 334.2 179.8 1.0 722.0 294
South Gloucestershire 2.6 0.4 345.1 196.7 131.0 1.1 676.9 203
Christchurch 0.1 0.0 31.4 35.1 19.4 0.1 86.1 21
Isles of Scilly 0.1 0.0 3.7 0.0 1.6 0.3 5.7 4
SOUTH WEST 115.9 5.1 5,067.4 3,842.3 2,344.6 180.7 11,556.1 3,957
Belfast 6.3 3.7 294.4 .. .. 1.6 ..
Limavady 3.8 0.7 185.1 .. .. 0.5 ..
Carrickfergus 1.0 0.1 42.3 .. .. 0.4 .. Moyle
0.7 0.1 39.3 .. .. 0.2 ..
NORTHERN IRELAND 189.6 15.5 3,010.1 .. .. 26.8 ..
Great Britain 3,038.8 1,220.8 56,893.8 57,363.9 27,069.6 2,146.4 148,245.4 60,253
Northern Ireland andUnallocated .. .. .. 28,045.9 1,131.0 .. 29,176.9
UK 3,228.4 1,236.3 59,903.9 85,409.8 28,200.6 2,146.4 177,422.3
Energy Consumption as inDUKES
(3) 2,904.1 764.3 61,649.6 86,388.9
(1)28,295.3
(2)600.2 180,899.9
(1) As converted from 1,004,697GWh shown in table 4.3 of DUKES 2006(2) As converted from 329,073GWh shown in table 5.5 of DUKES 2006(3) Figures from table 1.1 of DUKES 2006 unless otherwise stated(4) Includes coal/petroleum (as appropriate) consumed in autogeneration, heat generation, energy industry use, public administration, commercial, ag(5) Includes only manufactured solid fuels and not derived gases
4
4
D e c em b er 2 0 0
7

8/3/2019 File 43304
http://slidepdf.com/reader/full/file-43304 47/76
Special feature – The UK road transport biofuels market
December 200745
The UK road transport biofuels market
BackgroundThe June 2003 edition of Energy Trends included an article titled “Recent Developments in the UKRoad Fuels Industry” which provided an introduction to biofuels and set out the latest consumptiondata for the UK. This article examines the UK’s progress since then in the use of biofuels for roadtransport.
Using biofuels as a transport fuel can help contribute to reducing carbon dioxide emissions in theatmosphere and providing fuel security for the future. As part of a wider EU commitment to reducecarbon emissions, the Renewable Transport Fuel Obligation (RTFO) will commence in the UK in2008 and requires 5 per cent by volume of all fuel sold on forecourts to come from renewablesources by 2010. In March 2007, the EU agreed a new target for biofuels to account for at least 10per cent of all automotive fuel consumption by energy content by 2020, although this will rely uponthe next generation of biofuels from non-food crops becoming viable, sustainability being assuredand the fuel quality directive being amended to allow for higher levels of biofuels blending.
Types of biofuel available for road transport useThe earlier article highlighted two main types of biofuel currently commercially available for roadtransport use – Biodiesel and Bioethanol. Whilst these are still the main fuels in terms of currentconsumption levels in the UK and elsewhere, other types of biofuel have emerged and could beviable in the future as road transport fuels
Currently, biofuels are derived by the fermentation from starch or sugar crops (bioethanol) or derived from vegetable or animal oils (biodiesel). They include:
• Biodiesel - a diesel-quality fuel generally made from oily crops such as rapeseed;
• Bioethanol - produced by the fermentation of plants rich in sugar/starch;
• Bio-ETBE (Ethyl-Tertio-Butyl-Ether) is produced from bioethanol. ETBE is used as a petroladditive to increase the octane rating and reduce knocking;
The next generation of biofuels can be made from non-food feedstocks, such as residues from
agriculture and forestry, for example straw, grasses and wood. Production relies on technologicaladvances. Two models currently in development are gasification combined with FT synthesis toproduce synthetic diesel and the pre-treatment of lignocellulosic material to release sugars fromcellulose and hemicellulose for subsequent fermentation to ethanol.
Some alternative biofuels are:
• Biomethanol: methanol produced from biomass;
• Bio-oil: an oil fuel produced by pyrolysis (molecular decomposition of biomass through theapplication of heat and in the absence of air);
• Biogas: a fuel gas produced by the fermentation of organic matter by bacterial populations inthe absence of oxygen;
• Biohydrogen is hydrogen produced from a biomass feedstock.
Currently biodiesel and bioethanol are available as a blended product at some UK filling stations.This tends to be a mix of 95 per cent regular petrol/diesel with 5 per cent biofuel and is labelled asE5 for petrol or B5 for diesel. Current warranties for cars allow for 5% biofuel blend in petrol anddiesel.
Vehicle manufacturers have introduced 'flex-fuel' models designed to run on a Bioethanol E85blend (85 per cent bioethanol 15 per cent petrol) or regular fuel, although there is currently littledemand for these vehicles in the UK.

8/3/2019 File 43304
http://slidepdf.com/reader/full/file-43304 48/76
Special feature – The UK road transport biofuels market
December 2007 46
Biofuel consumption in the UKHM Revenue and Customs (HMRC) publish clearance data on the quantity of hydrocarbon oil for which excise duty has been paid and which are effectively UK consumption1. The clearancevolumes are reported in litres and have been converted into tonnes for the table below (Table 1).Biodiesel clearances began in 2002 with 2.3 thousand tonnes, gradually growing until 2005 beforeincreasing more sharply in 2006 to 209.5 thousand tonnes. Bioethanol was introduced in 2005 andhas increased steadily to 70.1 thousand tonnes in 2006.
Consumption has increased further in 2007. In the nine months to September 2007, biodieselconsumption was 209.8 thousand tonnes and is estimated to reach 280 thousand tonnes for 2007as a whole. Bioethanol consumption during the same period was 79.2 thousand tonnes and isestimated to be 110 thousand tonnes for the whole of 2007. Chart 1 below illustrates the growth of biodiesel and bioethanol in the UK. Although biofuel use is increasing, it still only accounts for around 1 per cent by volume of overall road transport fuel consumption in the UK (Table 1).
Table 1: Consumption of Biodiesel and Bioethanol in the UKUnit: Thousand tonnes
Year Biodiesel Total Derv Biodiesel% share
Bioethanol TotalPetrol
Bioethanol% share
Total %biofuel
share of
road fuel2002 2.3 16,431 0.01 0.0 20,620 0.00 0.012003 16.2 17,378 0.09 0.0 20,172 0.00 0.042004 17.4 18,438 0.09 0.0 19,901 0.00 0.052005 27.3 19,313 0.14 62.9 18,920 0.33 0.242006 140.4 20,188 0.70 70.1 18,206 0.39 0.552007* 280.0 20,831 1.34 105.0 17,729 0.59 1.00
Source: HM Customs and Revenue (*includes BERR estimates for 2007 Q4)
Chart 1: Biofuel Consumption in the UK
Source: HM Customs and Revenue (*includes BERR estimates for 2007 Q4)
1Source: HM Revenue & Customs (www.uktradeinfo.com) - Fuel duty paid by sales volume. HMRC provide
data in litres which have been converted into tonnes using standard conversion factors of Petrol = 1,358litres per tonne and Diesel (DERV) =1,200 litres per tonne.
0
50
100
150
200
250
300
2002 2003 2004 2005 2006 2007*
T h o u s a n d T o n n e s
Bio-diesel
Bio-ethanol

8/3/2019 File 43304
http://slidepdf.com/reader/full/file-43304 49/76
Special feature – The UK road transport biofuels market
December 200747
Biofuel production in the UKPrior to 2005 the UK produced minimal biofuels and consumption was met by imports. But thesituation has moved on and although UK biofuel production has been less than other EU countries(Germany and France for example) production is increasing encouraged by the forthcoming RTFO.
With sparse information on biofuel production, BERR invited AEA Energy and Environment toconduct a study as an extension of their contract to collect and compile the UK’s renewable energy
statistics. The study surveyed companies thought to be producing biodiesel or bioethanol in the UKwith the objective to obtain an estimate of UK biofuel production in 2006, the feedstocks being usedand the markets being served.
In 2006 around 1,400 biodiesel facilities were in operation and theoretically capable of producingsufficient biofuels for the UK to be an exporter of such fuels. However, all but about 60 of thesefacilities were small scale producing less than 5,000 litres each per year and less than 500 tonnesin total.
Biodiesel production was estimated to be at least 242 thousand tonnes, equivalent to 1.2 per centby volume of UK diesel consumption, with about half of this sourced from reprocessed vegetableoil. The study also estimated 2006 biodiesel exports to be 72 thousand tonnes and thereforeimplied UK supply to be 170 thousand tonnes. The estimated supply is larger than the consumption
of 140 thousand tonnes (Table 1) reported by HMRC with the difference probably relating to stocksin storage or product in transit.
The study found that there were no operational bioethanol producers and therefore 70 thousandtonnes consumption in 2006 (0.3 per cent of UK petrol consumption) must have been sourced fromimports.
The UK compared with other European countriesIn 2005 the largest European biofuel producer was Germany2 with 2.2 million tonnes of mainlybiodiesel. France was the second largest producer at 546 thousand tonnes followed by Spain (339thousand tonnes), Sweden (207 thousand tonnes) and Italy (200 thousand tonnes). There are anumber of other European countries with either zero production or unavailable data (Chart 2).
Chart 2: European biofuel production in 2005
Source: Eurostat energy statistics database
2Source: Eurostat energy statistics database - http://epp.eurostat.ec.europa.eu
0
500
1,000
1,500
2,000
2,500
G e r m a n y
F r a n c e
S p a i n
S w e d e n
I t a l y
P o l a n d
C z e c h R e p u b l i c
U n i t e d K i n d g o m
D e n m a r k
S l o v a k i a
L i t h u a n i a
S w i t z e r l a n d
A u s t r i a
L a t v i a
L u x e m b o u r g
I r e l a n d
T h o u s a n d T o n n e s

8/3/2019 File 43304
http://slidepdf.com/reader/full/file-43304 50/76
Special feature – The UK road transport biofuels market
December 2007 48
Consumption follows a similar pattern to production, with Germany being the largest Europeanbiofuels user at 2.2 million tonnes or 4.7 per cent by volume of overall road transport fuel. Swedenhad the second highest proportion of biofuel consumption at 3 per cent, but a lower volume of 7.4thousand tonnes. Consumption in France was 485 thousand tonnes (1.2 per cent) followed bySpain 339 thousand tonnes (1.1 per cent). In contrast, the UK’s share of biofuel consumption was0.2 per cent in 2005.
Chart 3: European biofuel share of road transport fuel in 2005
Source: Eurostat Energy Statistics database
Biofuel uncertainties and risksThere is a degree of uncertainty about biofuels based on their economic viability, environmentalconcerns and technical issues. These concerns should diminish as the next generation of biofuelsare developed. This is due to the use of lignocellulosic feedstocks which can improve carbon
savings and as they do not compete with food crops, reduce the pressure for agricultural land.These biofuels offer the potential to contribute to renewable, low-carbon energy for road transport.However, these technologies are in their infancy and may not be commercially available for anumber of years.
Charanjit Ransi Lisa VineStrategic Analysis Team Strategic Analysis TeamTel: 020 7215 2718 Tel: 020 7215 6072Fax: 020 7215 2723 Fax: 020 7215 2723E-mail: [email protected] E-mail: [email protected]
0
1
2
3
4
5
G e r m a n y
S w e d e n
F r a n c e
S p a i n
P o l a n d
S l o v a k i a
I t a l y
A u s t r i a
L i t h u a n i a
L a t v i a
U n i t e d K i n d g o m
S w i t z e r l a n d
C z e c h R e p u b l i c
L u x e m b o u r g
I r e l a n d
B i o f u e l % s
h a r e o f r o a d f u e l c o n s u m p t i o n

8/3/2019 File 43304
http://slidepdf.com/reader/full/file-43304 51/76
Special feature – Installed capacity of solar photovoltaics
December 200749
Statistics of the installed capacity of solar photovoltaics
Photovoltaics (PV) is the direct conversion of solar radiation into direct current electricity by theinteraction of light with the electrons in a semiconductor device or cell. Statistics for the installedcapacity and generation from photovoltaics are given in Chapter 7 of the Digest of United KingdomEnergy Statistics, 2007 (DUKES). The Government’s Photovoltaic Demonstration Programme offeringgrants for small, medium and large-scale installations, resulted in an increase in installed capacity to
10.9 MW in 2005 and this was reported in Table 7.4 of DUKES. However, at the time when DUKESwas published it had been reported that some PV installations had been taken out of use becausethey used earlier technologies that could no longer be economically maintained. As a review of thisarea was late in starting, revised and updated data were not available for the 2007 issue of DUKES.To this end, the predicted capacity was reduced by 1 MW in 2006 to allow for this.
In reality, large levels of Government support had led to a larger than predicted number of installations- Government funding supported over three quarters of PV installations during 2006 - meaning that themarket had a net growth nearly 500 kW more than it had the previous year. In 2006 the annualincrease in installed PV capacity was 3,390 kW compared to an increase of 2,713 kW during 2005.This results in a total installed capacity at the end of 2006 of 14.26 MW representing an increase of 31per cent on the previous year rather than the reported 9 per cent decrease. The major Government
support mechanisms were either through the Major Demonstration Programme or the Low CarbonBuildings Programme.
Based on these new figures the generation of electricity from photovoltaics during 2006 will be re-assessed as part of the 2007 update of the data and published in DUKES 2008.
Mike JanesEnergy Statistics and AnalysisTel: 020 7215 5186Fax: 020 7215 2723E-mail: [email protected]

8/3/2019 File 43304
http://slidepdf.com/reader/full/file-43304 52/76
Special feature – “Energy Consumption in the UK”
December 2007 50
2008 Update of “Energy Consumption in the UK”
Background“Energy Consumption in the UK” brings together statistics from a variety of sources to produce acomprehensive review of energy consumption in the UK since the 1970s. The information ispresented in five sections covering firstly overall energy consumption, then energy consumption inthe transport, domestic, industrial and service sectors.
A hard copy was produced in 2002, and since then the consumption tables have been updatedannually without any commentary and released on the internet. The tables and 2002 commentarycan be found at: www.berr.gov.uk/energy/statistics/publications/ecuk/page17658.html
Update in 2008BERR are considering whether to produce updated commentary to accompany the consumptiontables in 2008, either as an internet only publication or as a hard copy publication. The views of data users are welcome with regards to how useful they would find such commentary, and theformat in which it should be released.
In addition, suggestions of additional data sources that could be drawn upon to supplement thedata already published or new areas that users would like to see data on are also welcome.
Please contact Jennifer Knight using the email address or telephone number below by 29 th February 2008 to express your views.
Jennifer KnightEnergy Consumption StatisticsTel: 020 7215 6490Fax: 020 7215 2723E-mail: [email protected]

8/3/2019 File 43304
http://slidepdf.com/reader/full/file-43304 53/76
Special feature – “Energy – Its Impact on the Environment and Society”
December 200751
The future of “Energy – Its Impact on the Environment and Society”
Background“Energy – Its Impact on the Environment and Society” draws on statistical information from theDigest of UK Energy Statistics and other BERR and Government statistical publications to draw apicture of the key trends in energy statistics. It includes information on emissions and other environmental consequences from energy production and supply, and the social impacts of
domestic competition, service quality issues and fuel poverty.
Hard copy publications were released in 2002 and 2005. The 2002 edition was over 160 pages,whilst the 2005 edition contained 44 pages together with an additional 250 pages of materialavailable only on the internet. In 2003, 2004 and 2006 some of the material was updated, andreleased only on the internet. In addition the 2006 update included the production of someadditional annex material. All the material can be found at:www.berr.gov.uk/energy/environment/energy-impact/page29982.html
The future Given the development of new publications such as the annual progress reports on the 2003Energy White Paper and associated UK Energy Sector Indicators, and the considerable resourcesrequired to update “Energy – Its Impact on the Environment and Society” two consultations with
users were held during 2007 to determine the demand for updates. Readers of the June 2007edition of Energy Trends were invited to send in their views on the future of this publication.However, response rates to these consultations were disappointing and as a result BERR havedecided not to update this material in the foreseeable future.
The vast majority of information previously published in “Energy – Its Impact on the Environmentand Society” is still updated elsewhere on the energy section of the BERR website. However if youare having difficulty finding it, please contact Jennifer Knight using the email address or telephonenumber below for assistance.
Jennifer KnightEnergy Consumption StatisticsTel: 020 7215 6490Fax: 020 7215 2723E-mail: [email protected]

8/3/2019 File 43304
http://slidepdf.com/reader/full/file-43304 54/76
Special feature – Recent and forthcoming publications
December 2007 52
Recent and forthcoming publications of interest to users of energystatistics
Fuel Poverty The Government’s Fifth Annual Progress Report on the UK Fuel Poverty Strategy was publishedon 6 December 2007. The report sets out progress made since the last report, highlights key areasfor attention during the coming year, and details the fuel poverty figures for 2005. As part of the
progress report, annexes have also been produced on methodology, detailed analysis, fuel povertymonitoring, company schemes and case studies. It is available on the BERR energy web site at:www.berr.gov.uk/energy/fuel-poverty/strategy/index.html

8/3/2019 File 43304
http://slidepdf.com/reader/full/file-43304 55/76
5 5 1 TOTAL ENERGY
TABLE 1.1. Indigenous production of primary fuelsMillion tonnes of oil equival
Total Coal1 Petroleum2,3 Natural gas4Nuclear
Wind and natural f
hyd
2002 272.9 20.5 127.0 104.7 20.10 0
2003 260.3 19.4 116.2 104.2 20.04 0
2004 238.4 17.2 104.5 97.9 18.16 0
2005 216.4 14.7 92.9 89.8 18.37 0
2006 196.8 13.3 84.0 81.7 17.13 0
Per cent change-9.1 -9.6 -9.6 -9.1 -6.8 +12
2006 Quarter 3 42.5 2.7 18.9 16.5 4.27 0
Quarter 4 48.1 3.2 21.1 20.2 3.28 0
2007 Quarter 1 49.4 2.9 21.8 20.8 3.49 0 5 3
Quarter 246.6 3.2 21.6 18.2 3.40 0
Quarter 3 41.0 3.3 18.9 14.7 3.89 0.
Per cent change6
-3.6 +22.0 -0.2 -10.9 -8.8 +49
1. Includes solid renewable sources (wood, straw and waste), a small amount of renewable primary heat sources
(solar, geothermal etc) and an estimate for slurry.
2. Calendar months.
3. Crude oil, offshore and land, plus condensates and petroleum gases derived at onshore treatment plants.
4. Includes colliery methane, landfill gas and sewage gas. Excludes gas flared or re-injected.
5. Includes generation by solar PV.
6. Percentage change from the most recent 3 months compared with the same period last year
Primary electricity
D e c em b er 2 0 0
7
D e c em b er 2 0 0 7

8/3/2019 File 43304
http://slidepdf.com/reader/full/file-43304 56/76

8/3/2019 File 43304
http://slidepdf.com/reader/full/file-43304 57/76

8/3/2019 File 43304
http://slidepdf.com/reader/full/file-43304 58/76

8/3/2019 File 43304
http://slidepdf.com/reader/full/file-43304 59/76

8/3/2019 File 43304
http://slidepdf.com/reader/full/file-43304 60/76
2 SOLID FUEL AND DERIVED GASES
Table 2.2 Supply and consumption of coke oven coke, coke breeze and other manufacture
2005 2005 2006 2006 2006 2006 2007
2005 2006
3rd
quarter
4th
quarter
1st
quarter
2nd
quarter
3rd
quarter
4th
quarter
1st
quarte
SUPPLY
Indigenous production 4,622 4,942 +6.9 1,213 1,212 1,222 1,248 1,236 1,236 1,186
Coke oven coke 4,105 4,384 +6.8 1,078 1,086 1,087 1,098 1,090 1,109 1,127
Coke breeze 259 298 +15 67 64 63 78 78 79 7
Other MSF 258 260 +1 68 62 72 72 68 48 52
Imports 915 1,004 +10 267 169 207 229 244 324 210
Exports 134 180 +35 29 29 43 71 34 32 36
Stock change3
-147 -215 -187 +10 +68 -17 -115 -151 38r
Transfers - - - - - - - - -Total supply 5,256 5,551 +5.6 1,264 1,361 1,455 1,389 1,330 1,376 1,398r
Statistical difference -4 -10 -4 3 -21 -4 - 15r -9r
Total demand 5,259r 5,560 +5.7 1,267 1,358 1,475 1,393 1,330 1,361 1,407r
TRANSFORMATION 4,067 4,474 +10.0 982 1,058 1,183 1,116 1,086 1,089 1,126
Coke manufacture - - - - - - - - -
Blast furnaces 4,067 4,474 +10.0 982 1,058 1,183 1,116 1,086 1,089 1,126
Energy industry use - - - - - - - - -
FINAL CONSUMPTION 1,192 1,086 -8.9 286 299 292 278 244 273 281r
Iron & steel 821 727 -11 206 203 182 190 171 184 180
Other industries 81 80 -1 18 22 20 19 13 28 28
Domestic 290 279 -4 61 74 91 68 59 61 73r
Stocks at end of period 855 1,069 +25 864 855 786 803 918 1,069 1,006 1. Percentage change in 2006 compared with a year earlier.
2. Percentage change in the third quarter of 2007 compared with a year earlier.
3. Stock fall (+), stock rise (-).
per cent
change1
5 8
D e c em b er 2 0 0 7

8/3/2019 File 43304
http://slidepdf.com/reader/full/file-43304 61/76
2 SOLID FUEL AND DERIVED GASES
Table 2.3 Supply and consumption of coke oven gas, blast furnace gas, benzole and ta
2005 2005 2006 2006 2006 2006 2007
2005 2006
3rd
quarter
4th
quarter
1st
quarter
2nd
quarter
3rd
quarter
4th
quarter
1st
quarter
SUPPLY
Indigenous production 27,238 28,144 +3.3 6,799 7,070 7,175 7,011 7,096 6,862 7,131
Coke oven gas 9,290 9,828 +5.8 2,436 2,451 2,412 2,455 2,509 2,453 2,434
Blast furnace gas 16,199 16,443 +1.5 3,890r 4,179 4,289 4,078 4,125 3,951 4,220
Benzole & tars 1,749 1,873 +7.1 473 440 474 479 462 459 476
Transfers +51 +53 +4 +15 +5 +23 +15 +7 +8 +27
Total supply 27,289 28,197 +3.3 6,814 7,075 7,198 7,026 7,102 6,870 7,157
Statistical difference -38 -43 -11 -7 -19 -11 -3 -9 -25r
Total demand 27,327 28,240 +3.3 6,825 7,082 7,217 7,037 7,106 6,880 7,183r
TRANSFORMATION 12,115 11,839 -2.3 3,136 3,068 2,929 2,933 2,979 2,998 2,857r
Electricity generation 11,517 11,241 -2.4 2,987 2,919 2,779 2,784 2,830 2,848 2,708r
Heat generation 598 598 - 149 149 149 149 149 149 149
Energy industry use 9,537 10,131 +6.2 2,383 2,469 2,625 2,486 2,529 2,491 2,599
Losses 2,456 2,061 -16.1 564 567 494 522 666 379 424
FINAL CONSUMPTION 3,219 4,209 +30.8 742 977 1,169 1,096 932 1,011 1,302r
Iron & steel 1,234 2,141 +73.6 209 475 664 561 421 495 768r
Other industries 1,985 2,068 +4.2 533 503 506 535 511 516 534
1. Percentage change in 2006 compared with a year earlier.
2. Percentage change in the third quarter of 2007 compared with a year earlier.
per cent
change1
5 9
D e c em b er 2 0 0 7

8/3/2019 File 43304
http://slidepdf.com/reader/full/file-43304 62/76

8/3/2019 File 43304
http://slidepdf.com/reader/full/file-43304 63/76

8/3/2019 File 43304
http://slidepdf.com/reader/full/file-43304 64/76

8/3/2019 File 43304
http://slidepdf.com/reader/full/file-43304 65/76

8/3/2019 File 43304
http://slidepdf.com/reader/full/file-43304 66/76
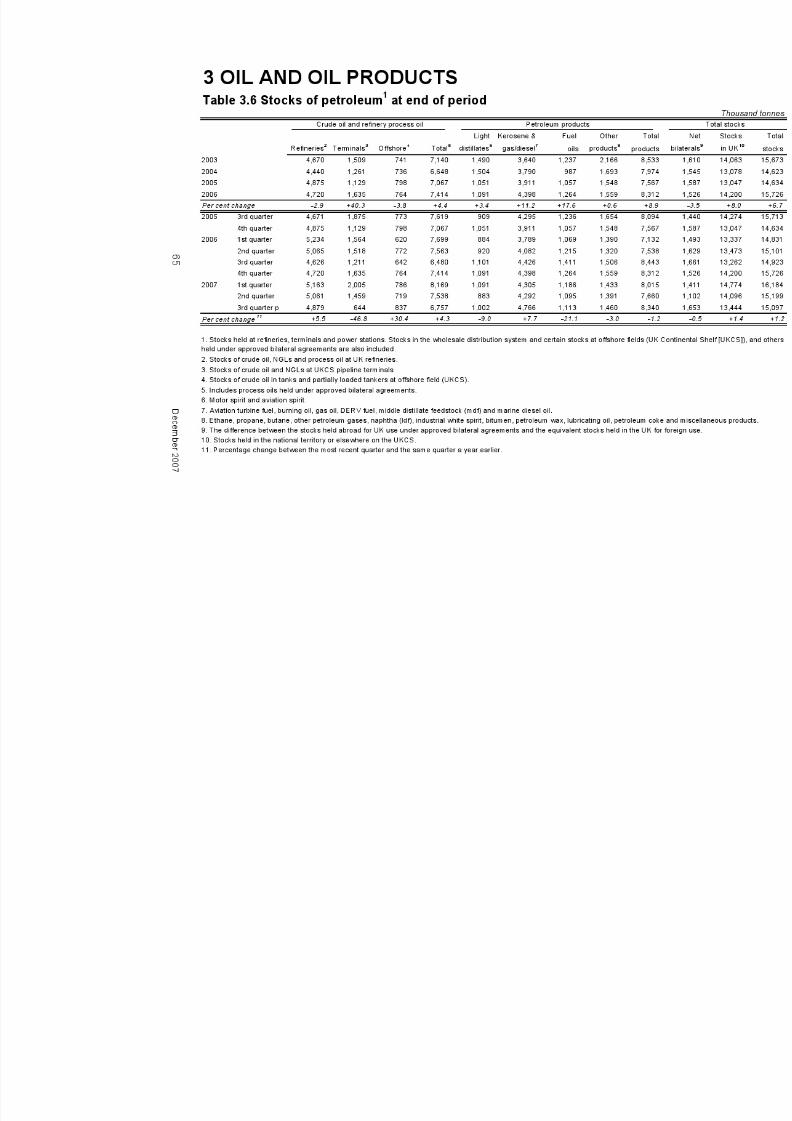
8/3/2019 File 43304
http://slidepdf.com/reader/full/file-43304 67/76

8/3/2019 File 43304
http://slidepdf.com/reader/full/file-43304 68/76
3 OIL AND OIL PRODUCTSTable 3.7 Drilling activit
1on the UKCS
Number of wells started
Offshore Onshore
2004 29 34 63 166 3 14
2005 41 37 78 227 8 21
2006 29 40 69 211 15 12
Per cent change -29.3 +8.1 -11.5 -7.0 +87.5 -42.9
2005 3rd quarter 19 11 30 65 3 5
4th quarter 8 9 17 46 3 3
2006 1st quarter 8 6 14 68 4 3
2nd quarter 7 5 12 57 2 3
3rd quarter 8 14 22 53 3 3
4th quarter 6 15 21 33 6 3
2007 1st quarter 9 7 16 47 4r -
2nd quarter 7 8 15 58 6 1r
3rd quarter p 9 30 39 35 3 7
Per cent change3 +12.5 (+) +77.3 -34.0 - (+)
1. Including sidetracked wells
2. Development wells are production or injection wells drilled after development approval has been granted.
3. Percentage change in the third quarter of 2007 compared with a year earlier
6 6
Exploration Appraisal
Exploration &
Appraisal Development2Development2Exploration &
Appraisal
D e c em b er 2 0 0 7

8/3/2019 File 43304
http://slidepdf.com/reader/full/file-43304 69/76
4 GASTable 4.1. Natural gas supply and consumption
2005 2005 2006 2006 2006 2006 2007
2005 2006
per cent
change1
3rd
quarter
4th
quarter
1st
quarter
2nd
quarter
3rd
quarter
4th
quarter
1st
quarter
SUPPLY
Indigenous production 1,025,232 929,784 -9.3 191,513 266,704 285,257 227,819 186,669 230,039 237,300r
Imports 173,328 244,029 +40.8 34,873 58,906 75,928 35,122 39,823 93,156 114,360r
Exports 96,181 120,591 +25.4 25,604 20,334 16,105 35,595 41,678 27,214 23,186r
Stock change3
+1,321 -6,435 -12,932 +6,173 +13,746 -6,156 -14,606 +581 +15,066
Transfers -51 -52 -15 -5 -23 -15 -7 -8 -27
Total supply 1,103,649 1,046,735 -5.2 187,835 311,444 358,803 221,175 170,202 296,554 343,514r
Statistical difference +960.5 +386.8 -370 +1,588 +2,772 -471 -635 -1,280 -1,541r
Total demand 1,102,689 1,046,348 -5.1 188,206 309,856 356,031 221,647 170,837 297,834 345,055r
TRANSFORMATION 350,998 331,927 -5.4 92,414 83,571 74,186 79,161 83,993 94,586 100,977
Electricity generation 328,515 309,760 -5.7 88,184 77,277 67,058 74,226 79,885 88,591 93,848r
Heat generation 22,484 22,167 -1.4 4,231 6,293 7,128 4,936 4,108 5,995 7,128
Energy industry use 86,159 79,421 -7.8 18,554 21,994 22,204 19,309 17,713 20,194 20,218
Losses 10,964 12,012 +9.6 1,888 2,742 3,852 2,643 2,319 3,198 3,322r
FINAL CONSUMPTION 654,568 622,989 -4.8 75,350 201,549 255,789 120,533 66,811 179,856 220,538r
Iron & steel 8,410 8,172 -2.8 1,784 1,928 2,133 2,208 1,850 1,981 1,951
Other industries 144,560 135,539 -6.2 24,226 38,917 54,682 28,624 20,095 32,137 46,592r
Domestic 384,009 364,555 -5.1 32,854 125,756 157,496 65,969 28,750 112,340 136,015r
Other final users 107,868 105,224 -2.5 14,056 32,518 39,269 21,301 13,686 30,967 33,550r
Non energy use 9,721 9,500 -2.3 2,430 2,430 2,209 2,430 2,430 2,430 2,375r
1. Percentage change in 2006 compared with a year earlier.
2. Percentage change in the third quarter of 2007 compared with a year earlier.
3. Stock fall (+), stock rise (-).
6 7
D e
c em b er 2 0 0 7

8/3/2019 File 43304
http://slidepdf.com/reader/full/file-43304 70/76

8/3/2019 File 43304
http://slidepdf.com/reader/full/file-43304 71/76

8/3/2019 File 43304
http://slidepdf.com/reader/full/file-43304 72/76
December 2007 70
List of special feature articles published in Energy Trends betweenJune 2006 and September 2007
EnergyJune 2006 Accessing energy statistics via the DTI websiteDecember 2006 Further developments relating to DTI sub national energy consumption dataMarch 2007 Regional and local estimates of non gas, non electricity and non road
transport fuels in 2004
March 2007 Regional and local total energy consumption statistics for 2004March 2007 High level indicators for regional and local energy data in 2004June 2007 The future of ‘Energy – Its impact on the Environment and Society’June 2007 Estimates of heat use in the UK
CO2 March 2007 CO2 emissions and energy consumption in the UK
CoalSeptember 2006 UK Coal imports 2000 to 2005September 2006 Revisions to historic coal data in the Digest of UK Energy Statistics 2006
Combined Heat and Power (CHP)September 2006 CHP in UK regions 2005September 2007 CHP in UK regions 2006
ElectricityJune 2006 High level energy indicators and quality indicators for regional and local
electricity and gas estimatesDecember 2006 Regional and local electricity consumption statistics for 2005December 2006 Electricity generation and supply figures for Scotland, Wales, Northern
Ireland and England, 2004 and 2005December 2006 Electricity transmission across Europe in 2004March 2007 Electricity, generation and supply figures for Scotland, Wales, Northern
Ireland and England, 2004 and 2005 – an updateJune 2007 Middle layer super output area (MLSOA) and intermediate geography zone
estimates of electricity and gas consumption in 2005 for Great BritainSeptember 2007 Changes in electricity generation and usage, 1976-2006September 2007 Easier access to 2005 small area electricity and gas data
Fuel PovertyJune 2007 Predicting Fuel Poverty at the local level
GasDecember 2006 Natural gas: world production, consumption, reserves and tradeDecember 2006 Update on DTI local and regional estimates of gas consumption in 2005March 2007 Regional and local gas consumption statistics for 2005
Petroleum (oil and oil products)June 2006 Regional and local use of road transport fuels 2004
March 2007 UK oil industry over the past 100 yearsJune 2007 UK oil imports since 1920June 2007 Regional and local use of road transport fuels 2005
RenewablesJune 2006 Renewable energy in 2005June 2006 Survey control report on RESTATSSeptember 2006 Renewable energy in UK regions 2005June 2007 Renewable energy in 2006September 2007 Renewable energy in UK regions 2006

8/3/2019 File 43304
http://slidepdf.com/reader/full/file-43304 73/76
December 200771
List of special feature articles published in Energy Trends betweenJune 2006 and September 2007 continued
UK Continental Shelf (UKCS)March 2007 UKCS capital expenditure survey 2006

8/3/2019 File 43304
http://slidepdf.com/reader/full/file-43304 74/76
December 2007 72

8/3/2019 File 43304
http://slidepdf.com/reader/full/file-43304 75/76
Explanatory notes
General
More detailed notes on the
methodology used to compile
the figures and data sources are
included in the annual Digest of
United Kingdom Energy Statistics.
Notes to tables
• Figures for the latest periods
and the corresponding
averages (or totals) are
provisional and are liable to
subsequent revision.
•The figures have not been
adjusted for temperature or
seasonal factors except
where noted.
• Due to rounding the sum
of the constituent items may
not equal the totals.
• Percentage changes relate to
the corresponding period a
year ago. They are calculated
from unrounded figures but
are shown only as (+) or (-)
when the percentage change
is very large.
• Quarterly figures relate to
thirteen week periods except
in the gas and petroleum
sections where they relate
to calendar quarters.
• All figures relate to the
United Kingdom unless
otherwise indicated.
Abbreviations
CCGT Combined Cycle Gas
Turbine
LRP Lead Replacement Petrol
ATF Aviation Turbine Fuel
NGLs Natural gas liquids
UKCS United Kingdom
Continental Shelf
GVA Gross Value Added
MSF Manufactured Solid Fuels
Symbols used in the tables
.. not available.
- nil or less than half the final digit shown.
p provisional.r revised; where a column or row shows ‘r’ at the beginning, most,
but not necessarily all, of the data have been revised.
e estimated; totals of which the figures form a constituent part are
therefore partly estimated.
Conversion factors1 tonne of UK crude oil = 7.55 barrels
1 tonne = 1,000 kilograms
1 gallon (UK) = 4.54609 litres
1 kilowatt (kW) = 1,000 watts
1 megawatt (MW) = 1,000 kilowatts
1 gigawatt (GW) = 1,000 megawatts
1 terawatt (TW) = 1,000 gigawatts
All conversion of fuels from
original units to units of
energy is carried out on the
basis of the gross calorific
value of the fuel. Moredetailed information on
conversion factors and
calorific values is given in
Annex A of the Digest of
UK Energy Statistics.
Conversion matrices
To convert from the units on the left hand side to the units
across the top multiply by the values in the table.
To: Thousand Terajoules GWh Million
toe thermsFrom Multiply by
Thousand toe 1 41.868 11.630 0.39683
Terajoules (TJ) 0.023885 1 0.27778 0.0094778
Gigawatt hours (GWh) 0.085985 3.6000 1 0.034121
Million therms 2.5200 105.51 29.307 1
To: Tonnes of oil Gigajoules kWh Therms
equivalent
From Multiply by
Tonnes of oil equivalent 1 41.868 11,630 396.83
Gigajoules (GJ) 0.023885 1 277.78 9.4778
Kilowatt hours (kWh) 0.000085985 0.003600 1 0.034121
Therms 0.0025200 0.105510 29.307 1
Note that all factors are quoted to 5 significant figures
Sectoral breakdowns
The categories for final consumption by user are defined by the
Standard Industrial Classification 2003, as follows:Fuel producers 10-12, 23, 40
Final consumers:
Iron and steel 27, excluding 27.4, 27.53 and 27.54
Other industry 13 to 22, 24 to 37, 41 and 45 excluding those
parts of 27 relating to Iron and Steel.
Transport & Storage 60-63
Other final usersAgriculture 01, 02, 05
Commercial 50-52, 55, 64-67, 70-74
Public administration 75, 80, 85
Other services 90-93, 99
Domestic Not covered by SIC 2003

8/3/2019 File 43304
http://slidepdf.com/reader/full/file-43304 76/76
ENERGY TRENDS
Energy is a major natural resource and a key factor in the economy and environment of the
United Kingdom. Data on energy supply and demand, energy prices and values and trade in
energy are vital components of this country’s main economic and environmental indicators.
ENERGY TRENDS, which was first published in the 1960s, is a quarterly publication produced by
the Department for Business, Enterprise & Regulatory Reform. With tables, charts and
commentary covering all the major aspects of energy, it provides a comprehensive picture of
energy production and use.
ENERGY TRENDS provides essential information for everyone involved in energy, from
economists to environmentalists, and from energy suppliers to energy users.
Quarterly Energy Prices and Energy Trends
Subscription available from BERR (020 7215 2698)
Price £40 per annum UK
www.berr.gov.uk/energy/statistics/publications/prices/index.html
and
www.berr.gov.uk/energy/statistics/publications/trends/index.html
Single copies available from the BERR Publications Orderline
priced £6 for Energy Trends and £8 for Quarterly Energy Prices.
UK Energy in Brief
Available from the BERR Publications Orderline
www.berr.gov.uk/energy/statistics/publications/in-brief/page17222.html
Energy Consumption in the UK
Available on the BERR website at:
www.berr.gov.uk/energy/statistics/publications/ecuk/page17658.html
Digest of UK Energy Statistics 2007Available from the Stationery Office (0870 600 5522)
www.berr.gov.uk/energy/statistics/publications/dukes/page39771.html