filatex india ltd€¦ · · 2017-11-08success follows diligent planning safe harbor 2 this...
TRANSCRIPT


Filatex India LimitedNext Growth Phase – 5.0
November 2017

Success Follows Diligent Planning
Safe Harbor
2
This presentation and the accompanying slides (the “Presentation”), which have been prepared by Filatex India Limited (the “Company”), have been prepared solely
for information purposes and do not constitute any offer, recommendation or invitation to purchase or subscribe for any securities, and shall not form the basis or be
relied on in connection with any contract or binding commitment what so ever. No offering of securities of the Company will be made except by means of a statutory
offering document containing detailed information about the Company.
This Presentation has been prepared by the Company based on information and data which the Company considers reliable, but the Company makes no representation
or warranty, express or implied, whatsoever, and no reliance shall be placed on, the truth, accuracy, completeness, fairness and reasonableness of the contents of this
Presentation. This Presentation may not be all inclusive and may not contain all of the information that you may consider material. Any liability in respect of the
contents of, or any omission from, this Presentation is expressly excluded
Certain matters discussed in this Presentation may contain statements regarding the Company’s market opportunity and business prospects that are individually and
collectively forward-looking statements. Such forward-looking statements are not guarantees of future performance and are subject to known and unknown risks,
uncertainties and assumptions that are difficult to predict. These risks and uncertainties include, but are not limited to, the performance of the Indian economy and of
the economies of various international markets, the performance of the industry in India and world-wide, competition, the company’s ability to successfully implement
its strategy, the Company’s future levels of growth and expansion, technological implementation, changes and advancements, changes in revenue, income or cash
flows, the Company’s market preferences and its exposure to market risks, as well as other risks. The Company’s actual results, levels of activity, performance or
achievements could differ materially and adversely from results expressed in or implied by this Presentation. The Company assumes no obligation to update any
forward-looking information contained in this Presentation. Any forward-looking statements and projections made by third parties included in this Presentation are not
adopted by the Company and the Company is not responsible for such third party statements and projections.

Success Follows Diligent Planning
H1FY18: Key Highlights
3
734845
H1FY17 H1FY18
+15.1%
Revenue (Rs. Crs)
6673
H1FY18
+10.7%
H1FY17
20
28
H1FY18H1FY17
+36.9%
EBITDA (Rs. Crs) PAT (Rs. Crs)
87,07080,435
+8.2%
H1FY17 H1FY18
Yarns Volume (MTPA)
13,18912,829
H1FY17
+2.8%
H1FY18
Chips Volume (MTPA)
Net External Debt / Equity ~1.3X

Success Follows Diligent Planning
Filatex India Limited
Journey: 1.o 4.0
4
Growth in 4.0 Phases

Success Follows Diligent Planning
Value Creation Journey So Far
5
1.0 2.0 3.0 4.0
1990-1995
Noida Plant
▪ A pioneer in manufacturing of Monofilament yarns in the Indian markets
▪ Capacity of 500 MT p.a. to manufacture Polyester, nylon and polypropylene monofilament yarns from chips
1996 - 2011
Dadra Plant
▪ Diversified into Polyester POY and Textured Yarn
▪ Polypropylene Multi filament Dope Dyed Yarns
▪ Fully Drawn Yarns (FDY)
▪ Texturizing Machines
▪ Narrow Woven Fabric Looms
2012 - 2015
Dahej Plant
▪ Fully Integrated – From Raw Material to Finished Products
▪ Poly-Condensation plant envisaging 600 TPD and 250 TPD POY and 350 TPD of Polyester Chips
2016
Dahej Plant
▪ Commenced production of 115 TPD of FDY
▪ Added 42 Texturizing Machines to improve Product Mix (Key input for DTY is POY)
▪ Commenced production of 200 TPD in Sep 2016
TransitionManufacturing
Forward Integration
Backward Integration
Product Diversification

Success Follows Diligent Planning
Success follows Diligent Planning
6
Focus on Core Business, Emergence of New Platforms and Financial Discipline
2
Increase in
Manufacturing Capacities
3
Increase in
Value Addition
1
Increase in
Product Offerings
4
Increase in
Market Reach
5
Increase in
Profitability

Success Follows Diligent Planning
Increase in Product Offerings
7

Success Follows Diligent Planning
Increase in Manufacturing Capacities
8
Dahej
Dadra
Disclaimer: Maps not to scale. All data, information, and maps are provided "as is" without warranty or any representation of accuracy, timeliness or completeness
Capacity Break-up (Plant Wise)
ProductsExisting Capacity (MTPA)
Dadra Dahej
Narrow Woven Fabric 2,500 -
Semi Dull Polyester POY* 16,700 20,000
Semi Dull Drawn Textured Yarn* 6,000 70,000
Semi Dull Polyester Chips - 64,000
Semi Dull Fully Drawn Yarn - 42,000
Bright Fully Drawn Yarn 10,500 -
Polypropylene Yarn 4,800 -
Total 40,500 196,000
Capacity increased from
500 MTPAto
236,500 MTPAManufacturing Unit
Corporate Office
Marketing Office
New Delhi
Mumbai
Surat
The manufacturing operation of Noida Plant shall be closed latest by 17th November, 2017*Total Semi Dull Polyester POY capacity is 22,700 MTPA at Dadra & 90,000 MTPA at Dahej which partially is being utilized in manufacturing Semi Dull Drawn Textured Yarn

Success Follows Diligent Planning
Increase in Value Addition
9
September 2016 - Commenced full capacity of 115 TPD of Fully Drawn Yarn (FDY) and 200 TPD of Draw Textured Yarn (DTY)
Semi Dull & Coloured
Fu
lly
Dra
wn
Yar
n
Dra
wn
Tex
ture
d Y
arn
Po
lyp
rop
len
eY
arn
PO
Y
Ch
ips
Total Production Volume for FY17 – 189,945 Metric Tonnes
13.0%
34.6%
23.9%
24.6%
2.5% 1.4%
Production Split by Volume – FY17
Polyester Chips Polyester POY
Fully Drawn Yarn Drawn Textured Yarn
Polypropylene Yarn Others
- 65,811 MT
- 46,797 MT
- 2,576 MT
- 24,601 MT
- 45,401 MT
- 4,759 MT

Success Follows Diligent Planning
Increase in Market Reach
10
Exporting to 28 countries across the GlobeH1FY18
+44%
H1FY17
150
104
Over 50% of DTY production are
exported
Exports contributed 19% to overall
Revenues as on FY17
Exports – Rs. Crs
Brazil
South Korea
BangladeshEgypt
Turkey
Poland
Sri Lanka
SyriaMorocco
Canada
USA
Israel
Portugal
Hong Kong
Peru
Nepal
Italy
Latvia
Iran
Kenya
Argentina
ColombiaThailand
Algeria
300
10292
FY16FY15 FY17
+81%
Exports Revenue including deemed exports & export incentives

Success Follows Diligent Planning
Increase in Profitability
11
Revenue
10 Year CAGR
18%
Interest Coverage Ratio
2x
EBITDA
10 Year CAGR
31%
ROCE
14%
PAT
10 Year CAGR
30%
ROE
19%

Success Follows Diligent Planning
Strong Leadership Team
12
› Gold medalist in Commerce from Shri Ram College of Commerce, Delhi
› Rich experience in Polyester Industry and President of PTA Users Association
Mr. Madhu Sudhan Bhageria - Chairman & Managing Director
› Master Degree in Business Administration from Cornell University, USA
› Member of Managing Committee of PHD Chamber of Commerce & Industry
Mr. Purrshottam Bhaggeria – Joint Managing Director
› Commerce Graduate from Hindu College, Delhi University
› Over 30 years of experience in Polyester Industry
Mr. Madhav Bhageria – Joint Managing Director
› B.E. (Mech) and Master Degree in Business Administration
› Vast experience in Marketing, Project Management, Corporate Planning & Business Strategies
Mr. Ashok Chauhan – Whole time Director
› Commerce Graduate from Shri Ram College of Commerce, Delhi, Fellow Member of ICAI
› Over 35 years experience in various field viz. Accounts, Finance, Taxation and Management
Mr. R P Gupta – Chief Financial Officer
Success Follows Diligent Planning
Filatex India Limited
5.0
13
Launch of Phase 5.0

Success Follows Diligent Planning
Phase 5.0 – Complete Product Range
14
1.0 2.0 3.0 4.0
TransitionManufacturing
Forward Integration
Backward Integration
Product Diversification
Complete Product Range
Bright Polymer Expansion at
Dahej
5.0

Success Follows Diligent Planning
Dahej Expansion – Integration & Optimization
15
PTA MEG
POY Spinning
DTY Texturing Process
FDY Spinning
DTY POY FDYPET
Chips
Quality Control
Packaging Warehouse
Polymerization
› Finished Products
• Semi Dull – DTY, POY & FDY
• Bright– DTY, POY & FDY
› Existing Polymerization Capacity to support Bright Capex
• Remaining Polyester Chips as well as Bright Chips supplied to Dadra Plant
› 42 Texturizing Machines installed to improve Product Mix
Economies of Scale
Operating Leverage Play

Success Follows Diligent Planning
Brownfield Expansion at Dahej
16
- Internal Accruals – Rs. 63.5 Crs
- Debt – Rs. 279.5 Crs• Foreign Debt – 174.5 Crs
• Rupee Debt – Rs. 105.0 Crs
• Eligible for Partial SGST refund
- Blended Interest Rate – 6-7%
Project Cost of Rs. 343.0 Crores – Fully Funded
Products (MTPA) Gross Captive Net
Bright Polyester POY 9,000 - 9,000
Bright Polyester Chips 30,600 13,000 17,600
Bright Fully Drawn Yarn 68,400 - 68,400
Total - New Expansion 1,08,000 13,000 95,000
Expansion Work near Completion

Success Follows Diligent Planning
Expansion work near Completion
17

Success Follows Diligent Planning
Post Expansion Capacities
18
Products (MTPA) Gross Captive Net %
Bright Polyester POY 9,000 - 9,000 2.7%
Bright Polyester Chips 30,600 13,000 17,600 5.3%
Bright Fully Drawn Yarn 68,400 - 68,400 20.6%
Total - New Expansion 1,08,000 13,000 95,000 28.7%
Semi Dull Polyester POY 1,12,700 76,000 36,700 11.1%
Semi Dull Polyester Chips 84,000 20,000 64,000 19.3%
Semi Dull Drawn Textured Yarn 76,000 - 76,000 22.9%
Semi Dull Fully Drawn Yarn 42,000 - 42,000 12.7%
Bright Fully Drawn Yarn 13,000 2,500 10,500 3.2%
Polypropylene Yarn 4,800 - 4,800 1.4%
Narrow Woven Fabric 2,500 - 2,500 0.8%
Total - Existing Facilities 3,35,000 98,500 2,36,500 71.3%
Total - Post Expansion 4,43,000 1,11,500 3,31,500 100.0%
SD Polyester Chips19.3%
SD Polyester POY
11.1%
SD Fully Drawn Yarn
12.7%
SD Drawn Textured Yarn
22.9%
Bright Fully Drawn Yarn
23.8%
Bright Polyester Chips5.3%
Bright Polyester POY2.7%
Polypropylene Yarn1.4%
Narrow Woven Fabric0.8%
Net Capacity (Post Expansion Net of Captive) 3,31,500 TPA

Success Follows Diligent Planning
Complete Product Range
19
Expansion will enable us to deliver all varieties of DENIERS and COLOURS
FDYPOY
Semi Dull
DTY FDYPOY
Color
DTY FDYPOY
Bright
DTY
One Stop Shop for Synthetic Filament Yarn
Filatex India Limited New Expansion

Success Follows Diligent Planning
Economics of Expansion
20
01Higher Realization
& Better Margin
03Lower Capex
Existing Land & Infrastructure
05Utilization of
Existing Polymerization
Partially
02Government Incentive Schemes
04Saving in Operating and Interest Cost

Success Follows Diligent Planning
Financial Performance
21
› Robust Business Results
› Margin Development
› Return Indicators
› Disciplined Capital Allocation
› Financials

Success Follows Diligent Planning
Robust Business Results
22
Revenue EBITDA PAT
FY16
1,551.0
1,278.2
1,572.8
FY15 FY17
9.6
FY17
41.0*
FY16FY15
26.3^
Rs. Crs Rs. Crs Rs. Crs
*FY17 - Includes Profit of Rs. 0.92 Cr on sale of land and Loss of Rs. 4.37 Cr on settlement of dispute with a supplier^FY16 - Includes Profit of Rs 6.97 Cr on sale of Land & Building# Includes Job Work SalesOn Standalone basis
Yarns Volume (MTPA)
FY17FY15
122,658
165,344
FY16
130,039
Chips Volume (MTPA) #
29,36829,072
47,053
FY17FY15 FY16
133.3
87.5
78.9
FY16FY15 FY17
Success Follows Diligent Planning
Margin Development
23
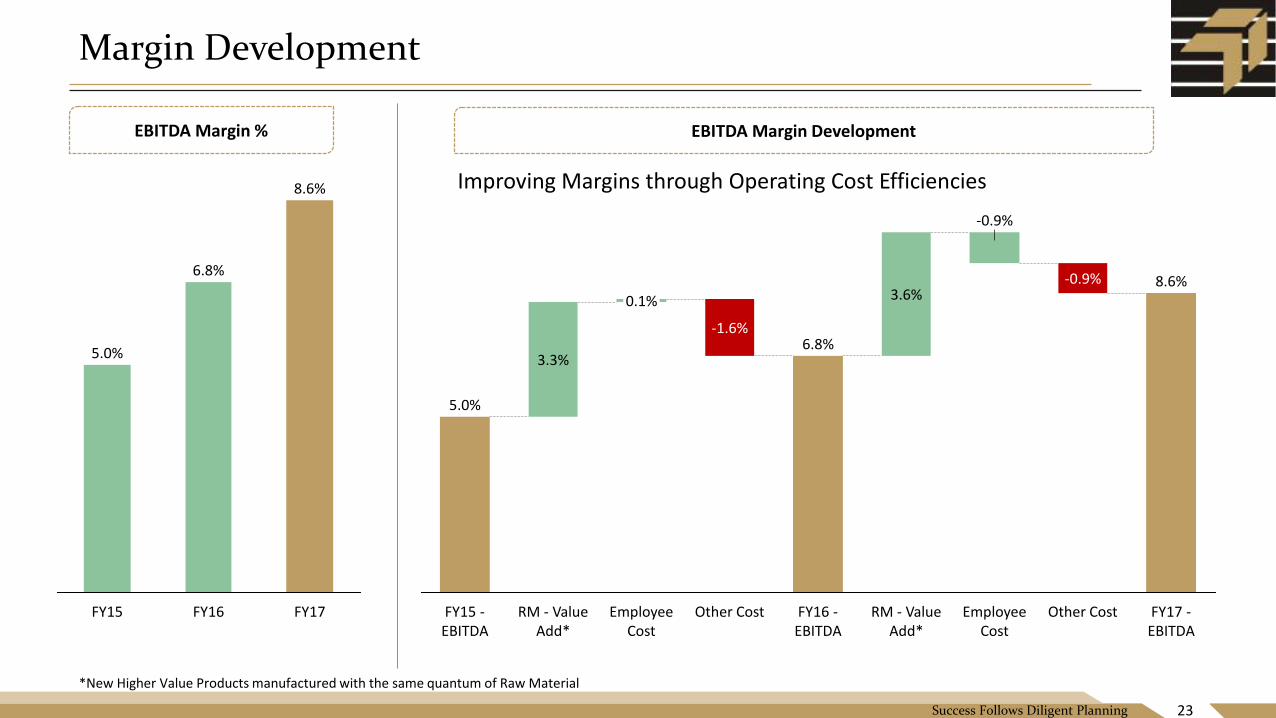
EBITDA Margin %
5.0%
6.8%
FY16 FY17FY15
8.6%
FY16 -EBITDA
-0.9%
RM - Value Add*
FY17 -EBITDA
Other CostEmployee Cost
8.6%3.6%
Other Cost
3.3%
FY15 -EBITDA
5.0%
0.1%
6.8%-1.6%
Employee Cost
RM - Value Add*
-0.9%
EBITDA Margin Development
Improving Margins through Operating Cost Efficiencies
*New Higher Value Products manufactured with the same quantum of Raw Material

Success Follows Diligent Planning
Return Indicators
24
ROE % *ROCE %
FY17
14.4%
FY15
10.5%
FY16
11.5%
FY17
18.6%
FY15
18.5%
FY16
10.3%
*Shareholders Funds = Equity Capital + Share Premium + Accumulated ProfitsOn Standalone basis
Return ratios improvement led by improved product mix and operating cost efficiencies

Success Follows Diligent Planning
Disciplined Capital Allocation
25
Net-worth
325.7
245.9
FY17FY16
Net External Debt
390
88357
70
Promoter Loan
Term Loan W. Capital TotalCash & Cash Eq.
15
On Standalone basis
Net External Debt / Equity1.1X
Estimated - Net External Debt
357
55
622
105
175
TotalRepaymentWorking Capital
Requierment
Foreign Debt
Rupee Debt
40
Net External
Debt
*Current Net Worth + Expected Future Retained Earnings
Net External Debt / Equity*~1.5-1.65X
Incremental Debt for Bright Expansion
Success Follows Diligent Planning
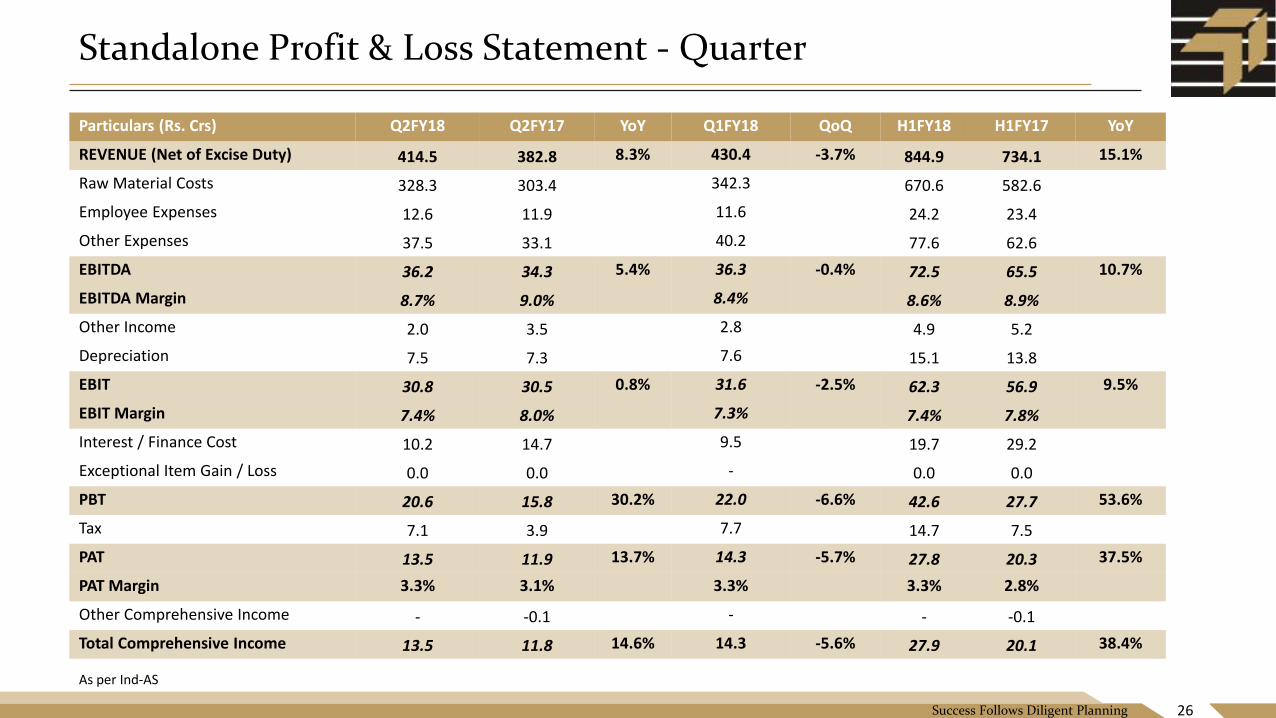
Standalone Profit & Loss Statement - Quarter
Particulars (Rs. Crs) Q2FY18 Q2FY17 YoY Q1FY18 QoQ H1FY18 H1FY17 YoY
REVENUE (Net of Excise Duty) 414.5 382.8 8.3% 430.4 -3.7% 844.9 734.1 15.1%
Raw Material Costs 328.3 303.4 342.3 670.6 582.6
Employee Expenses 12.6 11.9 11.6 24.2 23.4
Other Expenses 37.5 33.1 40.2 77.6 62.6
EBITDA 36.2 34.3 5.4% 36.3 -0.4% 72.5 65.5 10.7%
EBITDA Margin 8.7% 9.0% 8.4% 8.6% 8.9%
Other Income 2.0 3.5 2.8 4.9 5.2
Depreciation 7.5 7.3 7.6 15.1 13.8
EBIT 30.8 30.5 0.8% 31.6 -2.5% 62.3 56.9 9.5%
EBIT Margin 7.4% 8.0% 7.3% 7.4% 7.8%
Interest / Finance Cost 10.2 14.7 9.5 19.7 29.2
Exceptional Item Gain / Loss 0.0 0.0 - 0.0 0.0
PBT 20.6 15.8 30.2% 22.0 -6.6% 42.6 27.7 53.6%
Tax 7.1 3.9 7.7 14.7 7.5
PAT 13.5 11.9 13.7% 14.3 -5.7% 27.8 20.3 37.5%
PAT Margin 3.3% 3.1% 3.3% 3.3% 2.8%
Other Comprehensive Income - -0.1 - - -0.1
Total Comprehensive Income 13.5 11.8 14.6% 14.3 -5.6% 27.9 20.1 38.4%
26
As per Ind-AS

Success Follows Diligent Planning
Standalone Balance Sheet
27
Particulars (Rs. Crs) Sep-17
ASSETS
Non-Current Assets 818.8
Property, plant and equipment 621.1
Capital work-in-progress 167.2
Other Intangible Assets 0.1
Financial Assets
Investments 0.1
Loans and Advances -
Other non-current assets 30.3
Current Assets 427.7
Inventories 134.8
Financial Assets
Investments 30.0
Trade receivables 176.0
Cash and cash equivalents 25.5
Other financial assets 3.0
Other current assets 58.4
TOTAL ASSETS 1,246.4
Particulars (Rs. Crs) Sep-17
EQUITY & LIABILITIES
EQUITY 353.3
Equity Share capital 43.5
Other equity 309.8
Money received against share warrants -
LIABILITIES 893.1
Non-Current Liabilities 517.2
Financial liabilities
Borrowings 462.2
Other financial liability 5.9
Provisions 6.5
Deferred tax liabilities 33.2
Other Non-Current Liabilities 9.4
Current Liabilities 375.9
Financial liabilities
Borrowings 142.1
Trade Payables 134.2
Other financial liabilities 93.5
Provisions 1.3
Other Current Liabilities 4.8
TOTAL EQUITY AND LIABILITIES 1246.4
As per Ind-AS

Success Follows Diligent Planning
Standalone Profit & Loss Statement - Annual
28
Profit & Loss Statement for FY17 & FY16 are re-instated according to Ind-AS^Includes Profit of Rs. 0.92 Cr on sale of land and Loss of Rs. 4.37 Cr on settlement of dispute with a supplier*Includes Profit of Rs 6.97 Cr on sale of Land & Building
Particulars (Rs. Crs) FY17 FY16 FY15
REVENUE 1,551.0 1,278.2 1,572.8
Raw Material Costs 1,225.3 1,051.8 1,350.0
Employee Expenses 47.0 40.0 35.4
Other Expenses 145.5 99.0 108.5
EBITDA 133.3 87.5 78.9
EBITDA Margin 8.6% 6.8% 5.0%
Other Income 11.4 10.7 9.7
Depreciation 29.0 21.3 20.6
EBIT 115.7 76.9 68.0
EBIT Margin 7.5% 6.0% 4.3%
Interest / Finance Cost 57.6 51.2 53.6
Exceptional Item Gain / (Loss) (3.5)^ 7.0* 0.0
PBT 54.6 32.7 14.4
Tax 13.6 6.4 4.8
PAT 41.0 26.3 9.6
PAT Margin 2.6% 2.1% 0.6%

Success Follows Diligent Planning
Standalone Balance Sheet
Particulars (Rs. Crs) FY17 FY16 FY15
EQUITY & LIABILITIES
EQUITY 325.7 245.9 170.3
Equity Share capital 43.5 32.0 32.0
Other equity 282.2 201.0 138.3
Money received against share warrants - 12.9 -
LIABILITIES 735.1 678.0 546.1
Non-Current Liabilities 389.1 346.0 244.9
Financial liabilities
Borrowings 333.3 299.1 219.1
Provisions 5.6 4.7 3.7
Deferred tax liabilities 28.9 27.0 16.7
Other Non-Current Liabilities 21.3 15.2 5.3
Current Liabilities 346.1 332.1 301.3
Financial liabilities
Borrowings 144.8 139.2 157.6
Trade Payables 111.3 120.4 83.7
Provisions 1.3 1.0 0.8
Other Current Liabilities 88.7 71.5 59.2
TOTAL EQUITY AND LIABILITIES 1,060.8 924.0 716.5
29
Particulars (Rs. Crs) FY17 FY16 FY15
ASSETS
Non-Current Assets 664.2 571.6 409.4
Property, plant and equipment 628.4 549.1 388.2
Capital work-in-progress 5.7 18.0 2.4
Other Intangible Assets 0.2 0.1 0.1
Financial Assets
Investments 0.1 - -
Loans and Advances 29.0 3.3 17.9
Other non-current assets 0.9 1.1 0.8
Current Assets 396.6 352.4 307.1
Inventories 149.1 98.6 118.5
Financial Assets
Trade receivables 200.7 213.4 149.1
Cash and cash equivalents 14.8 12.5 15.4
Other financial assets 25.1 27.1 11.6
Other current assets 6.9 0.8 12.4
TOTAL ASSETS 1,060.8 924.0 716.5
Balance Sheet for FY17 & FY16 are re-instated according to Ind-AS

Success Follows Diligent Planning
Contacts
30
Filatex India LimitedCIN: L17119DN1990PLC000091
Mr. R. P. [email protected]
www.filatex.com
Strategic Growth Advisors Pvt. LimitedCIN: U74140MH2010PTC204285
Mr. Pankaj Chhaochharia / Mr. Rohan [email protected] / [email protected]+91 7977090417/ +91 98332 19522
www.sgapl.net