figure 66: standardised rates of stomach cancer, by income by
TRANSCRIPT

Cancer Trends 151
Figure 65 Standardised rates of stomach cancer for 25+ year-olds by income by sex
Figure 66 Standardised rates of stomach cancer by income by sex and age group
152 Cancer Trends
Table 63 Age- and ethnicity-standardised income rate ratios (SRR) rate differences (SRD) relative indices of inequality (RII) and slope indices of inequality (SII) of stomach cancer by sex
Age group
Cohort Males Females
Relative inequalities
Absolute inequalities
Relative inequalities
Absolute inequalities
SRR RII (95 CI) SRD SII (95 CI) SRR RII (95 CI) SRD SII (95 CI)
Stomach
25+ years 1981ndash1986 129 14 (09ndash22)
72 90 (-35ndash21)
156 16 (09ndash29)
60 70 (-01ndash14)
1986ndash1991 137 17 (11ndash26)
84 12 (35ndash21)
158 19 (12ndash31)
48 70 (28ndash11)
1991ndash1996 120 13 (09ndash19)
42 60 (13ndash99)
130 18 (06ndash59)
29 70 (-64ndash20)
1996ndash2001 139 19 (13ndash27)
62 12 (22ndash22)
126 16 (10ndash25)
23 50 (08ndash84)
2001ndash2004 135 16 (11ndash24)
55 90 (-14ndash19)
090 08 (05ndash14)
-11 -20 (-89ndash44)
P (trend) 055 048 044 098 002 015 lt01 011
Pooled 131 15 (12ndash18)
63 90 (48ndash14)
134 16 (12ndash22)
32 50 (-02ndash11)
25ndash64 years
1981ndash1986 076 06 (03ndash13)
-40 -70 (-15ndash16)
178 20 (09ndash47)
34 40 (-13ndash97)
1986ndash1991 166 22 (11ndash46)
58 80 (61ndash10)
169 20 (08ndash49)
26 40 (-08ndash81)
1991ndash1996 147 19 (10ndash36)
44 70 (23ndash11)
121 19 (07ndash50)
09 30 (-20ndash74)
1996ndash2001 109 14 (07ndash25)
09 30 (-82ndash15)
181 25 (10ndash61)
23 30 (-14ndash83)
2001ndash2004 132 18 (10ndash32)
24 50 (-19ndash12)
081 08 (04ndash17)
-10 -10 (-42ndash17)
P (trend) 075 047 097 094 021 023 014 004 Pooled 118 13
(10ndash18) 19 30
(-11ndash75) 143 18
(13ndash27) 18 30
(12ndash48)
65+ years 1981ndash1986 143 16 (09ndash29)
39 53 (-16ndash108)
167 16 (07ndash36)
26 29 (-30ndash61)
1986ndash1991 128 15 (09ndash27)
27 44 (-48ndash93)
139 19 (10ndash36)
14 25 (12ndash50)
1991ndash1996 103 11 (07ndash17)
26 50 (-12ndash21)
138 20 (04ndash94)
13 32 (-30ndash93)
1996ndash2001 147 19 (11ndash31)
27 49 (60ndash92)
106 13 (07ndash25)
22 13 (-20ndash28)
2001ndash2004 127 13 (08ndash23)
17 22 (-23ndash68)
116 14 (06ndash30)
58 13 (-34ndash60)
P (trend) 097 090 059 081 004 013 005 003 Pooled 129 14
(11ndash19) 23 34
(13ndash54) 134 17
(11ndash27) 13 24
(-22ndash51)
Notes 95 percent confidence intervals in brackets SRRs and SRDs compare low- and high-income tertiles Underlying non-linear trends mean the p for trend value must be interpreted cautiously
Cancer Trends 153
Chapter 26 Testicular Cancer There are two main subtypes of testicular cancer seminomas and non-seminomas Testicular cancer is relatively rare ndash 141 cases were diagnosed in New Zealand in 2005 ndash however it is the most common cancer among young men57 As in most developed countries the incidence of testicular cancer is increasing in New Zealand (the rate rising by 143 percent between 1956 and 1996)3 82 There are only a few well-established risk factors for testicular cancer Age is the best documented peak incidence occurs at 25ndash35 years Close relatives of men with testicular cancer are at a significantly increased risk However family clusters only account for a small proportion of total cases Ethnicity is also an important factor in the United States the rate of testicular cancer is six times higher in whites than it is in blacks83 Place of birth is also strongly linked with risk there are considerable differences in incidence rates between countries84 Cryptorchidism (undescended testes) is a well-established risk factor for testicular cancer Recently interest has focused on a possible relationship between subfertility and hypospadias cryptorchidism and testicular cancer The incidence of all these conditions has been increasing recently leading to some researchers suggesting they have a common origin As testicular cancer is commonly a disease of young men considerable research effort has focused on the prenatal environment particularly in utero exposure of the foetus to oestrogens85-88 To date research findings have been somewhat inconsistent Environmental exposures later in life are also likely to influence the development of testicular cancer Some infections may be related to increased risk possibly including infection with the mumps rubella or Epstein-Barr viruses A variety of occupational exposures have been investigated again with inconsistent results Note that the age range for testicular cancer in this report is from 15 years of age not 25 due to the cancerrsquos high incidence in the 15ndash24 year age range
261 Ethnic trends Rates among men aged 15+ years increased over the period surveyed by one-quarter among Māori and by one-half among EuropeanOther but neither trend was statistically significant (Figure 67 and Table 121 in Appendix 1) There was little apparent change in rates among Pacific and Asian males ndash although a marked imprecision of rates must be noted Pooled over time rates among Māori were 139 (95 percent confidence interval 122ndash159) times that of EuropeanOther Pacific 047 (028ndash080) times that rate and Asian 045 times (026ndash078) (Table 64) No trends over time in inequalities were evident
154 Cancer Trends
Figure 67 Standardised rates of testicular cancer for 15+ year-olds by ethnicity
Figure 68 Standardised rates of testicular cancer by ethnicity by age group
Cancer Trends 155
Table 64 Age-standardised rate ratios (SRR) of testicular cancer for Māori Pacific and Asian compared to EuropeanOther
Exposure Testicular Total ethnicity
Cohort 15+ years SRR (95 CI)
15ndash44 years SRR (95 CI)
Males
Total Māori vs European
1981ndash1986 150 (105ndash216) 140 (098ndash202) 1986ndash1991 090 (062ndash129) 111 (074ndash166) 1991ndash1996 158 (119ndash210) 184 (135ndash251) 1996ndash2001 172 (136ndash218) 183 (141ndash238) 2001ndash2004 125 (095ndash164) 138 (103ndash185) P (trend) 082 069 Pooled 139 (122ndash159) 151 (131ndash174)
Total Pacific vs European
1981ndash1986 034 (011ndash107) 037 (012ndash117) 1986ndash1991 089 (025ndash320) 044 (013ndash151) 1991ndash1996 071 (038ndash133) 067 (034ndash133) 1996ndash2001 026 (012ndash055) 030 (014ndash063) 2001ndash2004 023 (011ndash049) 026 (011ndash059) P (trend) 032 045 Pooled 047 (028ndash080) 040 (026ndash061)
Total Asian vs European
1981ndash1986 031 (008ndash129) 034 (008ndash140) 1986ndash1991 078 (020ndash302) 095 (024ndash373) 1991ndash1996 058 (024ndash141) 074 (030ndash180) 1996ndash2001 041 (022ndash075) 046 (025ndash086) 2001ndash2004 023 (011ndash047) 029 (013ndash063) P (trend) 025 031 Pooled 045 (026ndash078) 053 (031ndash092)
Notes 95 percent confidence intervals in brackets Underlying non-linear trends mean the p for trend value must be interpreted cautiously
156 Cancer Trends
Table 65 Age-standardised rate differences (SRD) of testicular cancer for Māori Pacific and Asian compared to EuropeanOther
Exposure Testicular Total ethnicity
Cohort 15+ years SRD (95 CI)
15ndash44 years SRD (95 CI)
Males
Total Māori vs European
1981ndash1986 38 (-01ndash76) 42 (-08ndash92) 1986ndash1991 -08 (-32ndash16) 10 (-30ndash50) 1991ndash1996 42 (12ndash72) 72 (27ndash12) 1996ndash2001 59 (29ndash89) 90 (43ndash14) 2001ndash2004 28 (-10ndash66) 55 (00ndash11) P (trend) 041 029 Pooled 32 (17ndash46) 54 (33ndash75)
Total Pacific vs European
1981ndash1986 -49 (-80ndash -18) -65 (-11ndash -19) 1986ndash1991 -08 (-92ndash76) -50 (-10ndash00) 1991ndash1996 -21 (-54ndash12) -28 (-69ndash12) 1996ndash2001 -60 (-79ndash -42) -76 (-11ndash -48) 2001ndash2004 -88 (-11ndash -64) -11 (-14ndash -70) P (trend) 022 024 Pooled -43 (-64ndash -22) -63 (-82ndash -44)
Total Asian vs European
1981ndash1986 -51 (-86ndash -17) -69 (-12ndash -17) 1986ndash1991 -17 (-94ndash61) -04 (-12ndash11) 1991ndash1996 -30 (-68ndash08) -23 (-80ndash34) 1996ndash2001 -48 (-71ndash -26) -58 (-92ndash -24) 2001ndash2004 -88 (-11ndash -64) -10 (-14ndash -64) P (trend) 025 039 Pooled -45 (-65ndash -24) -49 (-80ndash -18)
Notes 95 percent confidence intervals in brackets Underlying non-linear trends mean the p for trend value must be interpreted cautiously
262 Socioeconomic trends Testicular cancer rates increased over time in all income groups but none of the trends were statistically significant (Figure 69 and Table 122 in Appendix 1) Pooled over time there was an approximately 20 percent greater incidence among males of low income although confidence intervals just included the null (Table 66) There was no strong evidence of changing differences in rates by income over time
Cancer Trends 157
Figure 69 Standardised rates of testicular cancer for 15+ year-olds by income
Figure 70 Standardised rates of testicular cancer by income by age group
158 Cancer Trends
Table 66 Age- and ethnicity-standardised income rate ratios (SRR) rate differences (SRD) relative indices of inequality (RII) and slope indices of inequality (SII) of testicular cancer
Age group
Cohort Males
Relative inequalities Absolute inequalities
SRR RII (95 CI) SRD SII (95 CI)
Testicular
15+ years 1981ndash1986 138 13 (08ndash22) 27 20 (03ndash36) 1986ndash1991 110 10 (06ndash16) 06 00 (-11ndash06) 1991ndash1996 098 10 (06ndash16) -02 00 (-52ndash51) 1996ndash2001 142 17 (11ndash27) 31 40 (09ndash78) 2001ndash2004 121 15 (10ndash24) 19 40 (-13ndash98) P (trend) 093 029 077 070 Pooled 122 12 (10ndash15) 16 20 (03ndash31)
15ndash24 years
1981ndash1986 183 20 (05ndash90) 40 50 (-02ndash10) 1986ndash1991 143 10 (03ndash33) 13 00 (-65ndash59) 1991ndash1996 048 03 (01ndash22) -34 -50 (-72ndash -19) 1996ndash2001 052 05 (01ndash21) -38 -40 (-89ndash12) 2001ndash2004 104 10 (03ndash36) 02 00 (-65ndash59) P (trend) 020 038 030 035 Pooled 093 08 (05ndash15) -04 -10 (-44ndash24)
25ndash44 years
1981ndash1986 122 12 (06ndash23) 30 30 (-12ndash72) 1986ndash1991 105 10 (05ndash18) 05 00 (-25ndash16) 1991ndash1996 111 12 (07ndash21) 12 20 (-90ndash14) 1996ndash2001 202 28 (14ndash58) 11 15 (76ndash22) 2001ndash2004 121 17 (09ndash32) 33 10 (-20ndash21) P (trend) 050 023 041 025 Pooled 131 14 (11ndash19) 39 50 (20ndash81)
Notes 95 percent confidence intervals in brackets SRRs and SRDs compare low- and high-income tertiles Underlying non-linear trends mean the p for trend value must be interpreted cautiously
Cancer Trends 159
Chapter 27 Thyroid Cancer There are four main types of thyroid cancer papillary (50ndash80 percent of cases) follicular (15ndash20 percent of cases) medullary and anaplastic (both lt10 percent of cases) These subtypes differ in terms of their clinical behaviour and are also likely to differ in terms of their aetiologies Thyroid cancers are relatively uncommon ndash 166 cases were diagnosed in New Zealand in 2005 ndash although they are among the most common cancers diagnosed among children and young people57 89 In the United States there has been an increase in thyroid cancer incidence since the 1970s which is thought to be due at least partly to improvements in diagnosis89 Thyroid cancer is more common among women and peak incidence occurs at 20ndash60 years of age There are a number of inherited syndromes that increase the risk of thyroid cancer including multiple endocrine neoplasia familial medullary thyroid cancer and familial adenomatous polyposis Those with a family history of thyroid cancer are at increased risk Ionising radiation is the only fully established environmental risk factor for thyroid cancer Other possible causes include a diet either low or high in iodine a history of benign thyroid disease such as goitre reproductive factors and sudden changes in weight Smoking may be protective against thyroid cancer89
271 Ethnic trends Thyroid cancer rates increased by about two-thirds among EuropeanOther for both sexes (p for trend le005) but were unstable over time for other ethnic groups (Figure 71 and Table 123 in Appendix 1) Pooled over time Māori thyroid cancer rates were 155 (95 percent confidence interval 111ndash218) and 161 (135ndash192) times Pacific rates 127 (074ndash218) and 358 (287ndash447) times and Asian rates 146 (085ndash249) and 210 (150ndash293) times greater than EuropeanOther rates for males and females respectively (Table 67) Differences in rates between the sexes were marked but varied by ethnic group such that rates among EuropeanOther females were twice Asian and Māori females three times and Pacific females six or more times the male rate (Table 123 in Appendix 1) Pacific female rates of thyroid cancer were particularly high at 185 per 100000 (95 percent confidence interval 146ndash224) There was no evidence of changing inequalities in thyroid cancer incidence over time by ethnicity
160 Cancer Trends
Figure 71 Standardised rates of thyroid cancer for 15+ year-olds by ethnicity by sex
Table 67 Age-standardised rate ratios (SRR) and rate differences (SRD) of thyroid cancer
for Māori Pacific and Asian compared to EuropeanOther by sex
Exposure Thyroid 15+ years
Cohort Males Females
SRR (95 CI) SRD (95 CI) SRR (95 CI) SRD (95 CI)
Total Māori vs European
1981ndash1986 205 (073ndash573) 18 (-17ndash54) 214 (133ndash346) 45 (07ndash84) 1986ndash1991 155 (071ndash342) 09 (-10ndash28) 156 (102ndash239) 24 (-03ndash52) 1991ndash1996 141 (067ndash296) 09 (-13ndash30) 122 (074ndash199) 09 (-16ndash34) 1996ndash2001 163 (101ndash263) 16 (-03ndash35) 158 (118ndash212) 39 (11ndash68) 2001ndash2004 116 (065ndash207) 04 (-13ndash22) 162 (118ndash222) 42 (09ndash75) P (trend) 017 048 049 072 Pooled 155 (111ndash218) 12 (01ndash22) 161 (135ndash192) 32 (18ndash45)
Total Pacific vs European
1981ndash1986 029 (004ndash211) -12 (-23ndash -01) 552 (315ndash968) 18 (62ndash30) 1986ndash1991 067 (016ndash273) -05 (-21ndash10) 354 (203ndash615) 11 (28ndash19) 1991ndash1996 217 (075ndash625) 24 (-22ndash71) 367 (209ndash643) 11 (30ndash20) 1996ndash2001 193 (081ndash459) 23 (-18ndash65) 366 (264ndash507) 18 (11ndash25) 2001ndash2004 080 (026ndash249) -05 (-30ndash19) 201 (135ndash299) 70 (18ndash12) P (trend) 076 031 006 036 Pooled 127 (074ndash218) 06 (-09ndash20) 358 (287ndash447) 13 (94ndash17)
Total Asian vs European
1981ndash1986 358 (135ndash949) 10 (-34ndash24) 1986ndash1991 172 (042ndash705) 12 (-27ndash50) 145 (056ndash376) 19 (-40ndash79) 1991ndash1996 080 (018ndash343) -04 (-29ndash20) 123 (055ndash276) 10 (-32ndash52) 1996ndash2001 224 (086ndash585) 31 (-22ndash85) 266 (182ndash389) 11 (48ndash18) 2001ndash2004 091 (042ndash197) -03 (-22ndash17) 150 (100ndash225) 34 (-06ndash75) P (trend) 048 078 Pooled 146 (085ndash249) 10 (-07ndash27) 210 (150ndash293) 56 (21ndash92)
Notes 95 percent confidence intervals in brackets Underlying non-linear trends mean the p for trend value must be interpreted cautiously
Cancer Trends 161
272 Socioeconomic trends Thyroid cancer rates increased by about three-quarters in the high-income tertile for both males and females and by about one-half in the medium-income tertile over the period surveyed (Figure 72 and Table 124 of Appendix 1) However rates were imprecise and hence trends unstable over time Despite the pattern of varying changes over time by income in thyroid cancer there was no strong evidence of changing inequalities in incidence over time by income Although rates may have been higher in the low- compared to the high-income tertile in 1981ndash1986 they were similar across all income tertiles by 2001ndash2004 (Table 68) Pooled over time there was little evidence of any differences in rates by income Figure 72 Standardised rates of thyroid cancer for 25+ year-olds by income by sex
162 Cancer Trends
Table 68 Age- and ethnicity-standardised income rate ratios (SRR) rate differences (SRD) relative indices of inequality (RII) and slope indices of inequality (SII) of thyroid cancer by sex
Age group
Cohort Males Females
Relative inequalities
Absolute inequalities
Relative inequalities
Absolute inequalities
SRR RII (95 CI) SRD SII (95 CI) SRR RII (95 CI) SRD SII (95 CI)
Thyroid
15+ years
1981ndash1986 165 15 (05ndash43)
11 10 (-14ndash28)
183 19 (08ndash41)
32 30 (-08ndash74)
1986ndash1991 129 13 (05ndash31)
04 00 (-12ndash21)
082 07 (03ndash13)
-11 -20 (-40ndash -05)
1991ndash1996 098 09 (03ndash24)
-01 00 (-06ndash02)
118 11 (06ndash20)
06 00 (-68ndash73)
1996ndash2001 074 06 (03ndash13)
-08 -20 (-40ndash07)
116 13 (08ndash20)
13 20 (-23ndash64)
2001ndash2004 101 10 (05ndash20)
00 00 (-21ndash19)
116 13 (08ndash21)
12 20 (-29ndash74)
P (trend) 013 026 016 034 055 070 079 057 Pooled 107 10
(06ndash14) 01 00
(-11ndash09) 118 12
(09ndash15) 10 10
(-12ndash34)
Notes 95 percent confidence intervals in brackets SRRs and SRDs compare low- and high-income tertiles Underlying non-linear trends mean the p for trend value must be interpreted cautiously
Cancer Trends 163
Chapter 28 Ill-defined Sites Ill-defined cancer sites include those in which the source of the primary tumour is unclear Because of improvements over time in diagnosis and reporting the mix of cancer types included under this rubric has probably changed and may vary between ethnic and income groups rendering interpretation of trends and inequalities problematic
281 Ethnic trends Ill-defined cancer rates tended to decrease over time across ethnic groups but rates were inherently unstable (Figure 73 and Table 123 in Appendix 1) Pooled over time rates of ill-defined cancers were one-and-a-half times as high among Māori and Pacific as they were among EuropeanOther but lower among Asian (Table 69) There was no evidence that rates of Māori Pacific or Asian ill-defined cancer diagnosis were converging with EuropeanOther over time Figure 73 Standardised rates of ill-defined sites cancer for 25+ year-olds by ethnicity by sex
164 Cancer Trends
Table 69 Age-standardised rate ratios (SRR) and rate differences (SRD) of ill-defined sites cancer for Māori Pacific and Asian compared to EuropeanOther by sex
Exposure Ill-defined 25+ years
Cohort Males Females
SRR (95 CI) SRD (95 CI) SRR (95 CI) SRD (95 CI)
Total Māori vs European
1981ndash1986 205 (159ndash265) 26 (13ndash39) 127 (089ndash181) 53 (-34ndash14) 1986ndash1991 163 (124ndash213) 16 (49ndash27) 195 (155ndash246) 20 (11ndash30) 1991ndash1996 159 (124ndash204) 14 (48ndash24) 149 (115ndash193) 10 (23ndash18) 1996ndash2001 133 (104ndash169) 80 (02ndash16) 171 (139ndash209) 14 (73ndash20) 2001ndash2004 203 (160ndash258) 19 (10ndash27) 171 (132ndash221) 97 (39ndash16) P (trend) 082 051 080 097 Pooled 170 (151ndash190) 17 (12ndash21) 162 (144ndash182) 12 (84ndash15)
Total Pacific vs European
1981ndash1986 103 (055ndash192) 08 (-15ndash17) 142 (063ndash319) 81 (-14ndash31) 1986ndash1991 139 (076ndash252) 10 (-11ndash31) 102 (061ndash169) 03 (-11ndash11) 1991ndash1996 189 (124ndash287) 22 (24ndash41) 140 (088ndash221) 81 (-49ndash21) 1996ndash2001 156 (111ndash220) 14 (07ndash27) 182 (133ndash249) 16 (51ndash27) 2001ndash2004 152 (100ndash232) 95 (-20ndash21) 168 (113ndash249) 93 (04ndash18) P (trend) 052 049 014 029 Pooled 147 (118ndash183) 11 (36ndash19) 143 (113ndash182) 83 (18ndash15)
Total Asian vs European
1981ndash1986 026 (004ndash185) -18 (-31ndash -56) 090 (032ndash255) -19 (-20ndash17) 1986ndash1991 135 (069ndash262) 90 (-14ndash32) 041 (013ndash128) -13 (-23ndash -26) 1991ndash1996 038 (014ndash101) -15 (-24ndash -60) 065 (030ndash140) -71 (-17ndash31) 1996ndash2001 074 (041ndash132) -65 (-17ndash42) 082 (050ndash136) -35 (-12ndash46) 2001ndash2004 023 (009ndash061) -14 (-18ndash -97) 069 (041ndash117) -42 (-92ndash08) P (trend) 024 098 099 026 Pooled 063 (042ndash096) -87 (-15ndash -24) 069 (047ndash102) -60 (-11ndash -07)
Notes 95 percent confidence intervals in brackets Underlying non-linear trends mean the p for trend value must be interpreted cautiously
282 Socioeconomic trends Rates of ill-defined cancer tended to decrease over time across all income groups ndash but less so in the low-income tertile (Figure 74 and Table 126 in Appendix 1) Pooled over time rates of ill-defined cancer incidence were 20ndash40 percent higher among low-income people The difference in rates of male ill-defined cancer incidence by income widened over time such that by 2001ndash2004 rates among low-income people were at least one-half greater than those of high-income people (Table 70)
Cancer Trends 165
Figure 74 Standardised rates of ill-defined sites cancer for 25+ year-olds by income by sex
Table 70 Age- and ethnicity-standardised income rate ratios (SRR) rate differences (SRD)
relative indices of inequality (RII) and slope indices of inequality (SII) of ill-defined sites cancer by sex
Age group
Cohort Males Females
Relative inequalities
Absolute inequalities
Relative inequalities
Absolute inequalities
SRR RII (95 CI) SRD SII (95 CI) SRR RII (95 CI) SRD SII (95 CI)
Ill-defined
25+ years 1981ndash1986 097 09 (06ndash14)
-09 -40 (-82ndash12)
114 10 (06ndash16)
26 00 (-11ndash12)
1986ndash1991 102 12 (08ndash17)
07 50 (-08ndash11)
116 13 (09ndash18)
36 60 (-44ndash17)
1991ndash1996 131 12 (08ndash19)
78 60 (-29ndash15)
118 14 (09ndash21)
38 70 (-54ndash20)
1996ndash2001 157 19 (14ndash27)
11 17 (64ndash27)
146 18 (13ndash25)
84 13 (63ndash19)
2001ndash2004 149 16 (11ndash25)
89 10 (-34ndash24)
128 13 (09ndash18)
40 40 (-07ndash81)
P (trend) 003 005 007 003 019 038 045 094 Pooled 121 13
(11ndash15) 53 70
(36ndash10) 124 14
(12ndash17) 45 70
(20ndash12)
Notes 95 percent confidence intervals in brackets SRRs and SRDs compare low- and high-income tertiles Underlying non-linear trends mean the p for trend value must be interpreted cautiously
Part C Child and Adolescent Cancers
Chapter 29 Childhood Cancer Cancer in childhood (ages 0ndash14 years) is relatively rare About 40 percent of child cancers are leukaemias (in particular acute lymphoblastic leukaemia) and one-quarter are brain cancers (in particular neuroblastoma) with the remainder composed largely of other germ cell tumours Given this heterogeneity trends and inequalities in overall childhood cancer rates should be interpreted with caution
291 Ethnic trends There was no trend in childhood cancer incidence over time within ethnic groups (Figure 75 and Table 127 in Appendix 1)
Pooled over time Māori and EuropeanOther rates were similar but Pacific and Asian rates were elevated compared to those of EuropeanOther by over one-quarter for both Pacific (129 95 percent confidence interval 106ndash157) and Asian (122 087ndash173) (Table 71)
There were no discernable trends in ethnic inequalities in childhood cancer incidence over the 1981ndash2004 period
Figure 75 Standardised rates of childhood cancer (1ndash14 year-olds) by ethnicity
Cancer Trends 169
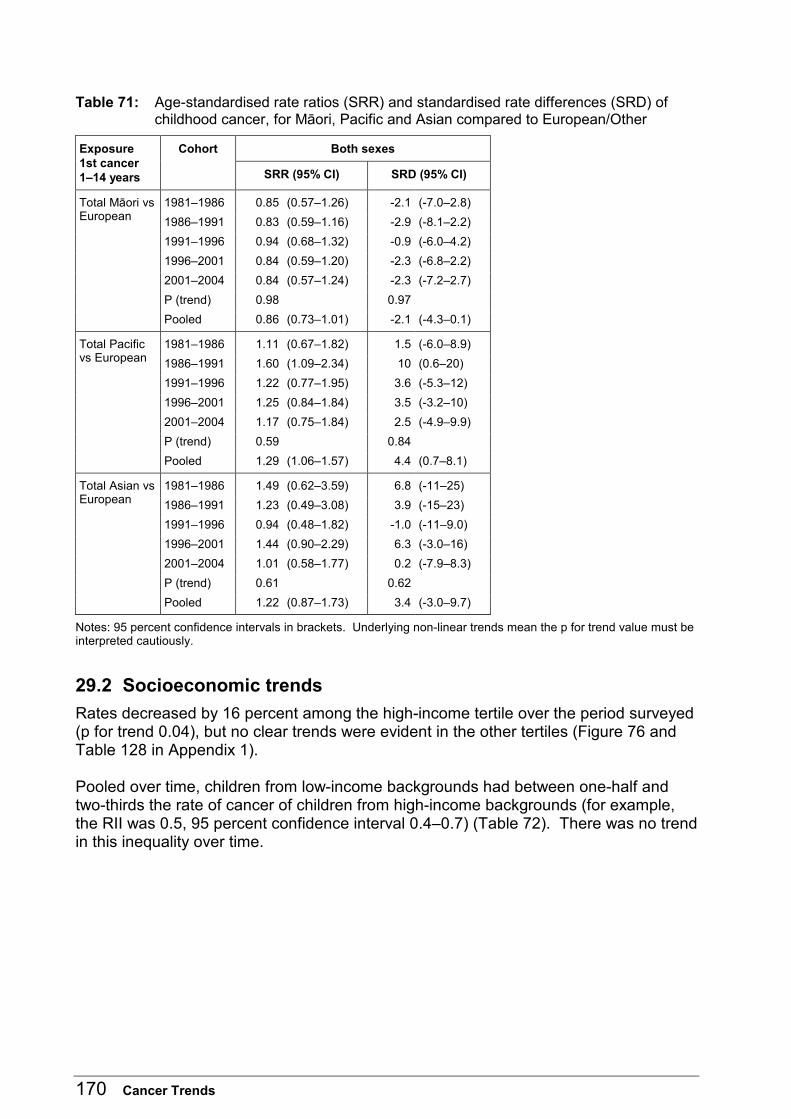
Table 71 Age-standardised rate ratios (SRR) and standardised rate differences (SRD) of childhood cancer for Māori Pacific and Asian compared to EuropeanOther
Exposure 1st cancer 1ndash14 years
Cohort Both sexes
SRR (95 CI) SRD (95 CI)
Total Māori vs 1981ndash1986 085 (057ndash126) -21 (-70ndash28) European 1986ndash1991 083 (059ndash116) -29 (-81ndash22)
1991ndash1996 094 (068ndash132) -09 (-60ndash42) 1996ndash2001 084 (059ndash120) -23 (-68ndash22) 2001ndash2004 084 (057ndash124) -23 (-72ndash27) P (trend) 098 097 Pooled 086 (073ndash101) -21 (-43ndash01)
Total Pacific 1981ndash1986 111 (067ndash182) 15 (-60ndash89) vs European 1986ndash1991 160 (109ndash234) 10 (06ndash20)
1991ndash1996 122 (077ndash195) 36 (-53ndash12) 1996ndash2001 125 (084ndash184) 35 (-32ndash10) 2001ndash2004 117 (075ndash184) 25 (-49ndash99) P (trend) 059 084 Pooled 129 (106ndash157) 44 (07ndash81)
Total Asian vs 1981ndash1986 149 (062ndash359) 68 (-11ndash25) European 1986ndash1991 123 (049ndash308) 39 (-15ndash23)
1991ndash1996 094 (048ndash182) -10 (-11ndash90) 1996ndash2001 144 (090ndash229) 63 (-30ndash16) 2001ndash2004 101 (058ndash177) 02 (-79ndash83) P (trend) 061 062 Pooled 122 (087ndash173) 34 (-30ndash97)
Notes 95 percent confidence intervals in brackets Underlying non-linear trends mean the p for trend value must be interpreted cautiously
292 Socioeconomic trends Rates decreased by 16 percent among the high-income tertile over the period surveyed (p for trend 004) but no clear trends were evident in the other tertiles (Figure 76 and Table 128 in Appendix 1)
Pooled over time children from low-income backgrounds had between one-half and two-thirds the rate of cancer of children from high-income backgrounds (for example the RII was 05 95 percent confidence interval 04ndash07) (Table 72) There was no trend in this inequality over time
170 Cancer Trends
Figure 76 Standardised rates of childhood cancer (1ndash14 year-olds) by income
Table 72 Age- and ethnicity-standardised income rate ratios (SRR) rate differences (SRD) relative indices of inequality (RII) and slope indices of inequality (SII) of childhood cancer
Age group Cohort Both sexes
Relative inequalities Absolute inequalities
SRR RII (95 CI) SRD SII (95 CI)
1st cancer
1ndash14 years 1981ndash1986 1986ndash1991 1991ndash1996 1996ndash2001 2001ndash2004 P (trend) Pooled
062 076 077 060 073 092 069
05 (02ndash12) 06 (03ndash11) 07 (04ndash14) 04 (02ndash08) 06 (03ndash12)
092 05 (04ndash07)
-71 -45 -42 -71 -42 075 -55
-90 (-16ndash -29) -90 (-18ndash -06) -50 (-14ndash41) -13 (-18ndash -78)
-70 (-10ndash -31) 078 -90 (-13ndash -57)
Notes 95 percent confidence intervals in brackets SRRs and SRDs compare low- and high-income tertiles Underlying non-linear trends mean the p for trend value must be interpreted cautiously
Cancer Trends 171
Chapter 30 Adolescent Cancer About 20 percent of adolescent (here defined as the 15ndash24 age group) cancers are lymphomas another 20 percent are germ-cell tumours and approximately 10 percent each are brain cancers melanomas and leukaemias Given this heterogeneity trends and inequalities in overall adolescent cancer rates should be interpreted with caution
301 Ethnic trends EuropeanOther adolescent cancer rates increased by 37 percent over the period surveyed Pacific rates decreased by 58 percent and Asian rates by 37 percent (Figure 77 and Table 129 in Appendix 1)
Pooled over time Māori rates were 079 times those of EuropeanOther (95 percent confidence interval 070ndash089) but there was no substantial difference in rates between Pacific Asian and EuropeanOther However due to the above-mentioned divergent trends over time in rates by ethnic group European rates were about twice Pacific and Asian rates by 2001ndash2004 (Table 73) although none of the trends in SRR or SRD had p values less than 005
Figure 77 Standardised rates of adolescent cancer (15ndash24 year-olds) by ethnicity
172 Cancer Trends
Table 73 Age-standardised rate ratios (SRR) and standardised rate differences (SRD) of adolescent cancer for Māori Pacific and Asian compared to EuropeanOther
Exposure 1st cancer 15ndash24 years
Cohort Both sexes
SRR (95 CI) SRD (95 CI)
Total Māori vs 1981ndash1986 100 (078ndash128) -01 (-70ndash68) European 1986ndash1991 081 (062ndash106) -57 (-12ndash10)
1991ndash1996 068 (052ndash088) -11 (-17ndash -43) 1996ndash2001 077 (061ndash099) -77 (-15ndash -08) 2001ndash2004 071 (054ndash093) -11 (-19ndash -30) P (trend) 012 009 Pooled 079 (070ndash089) -68 (-99ndash -37)
Total Pacific 1981ndash1986 130 (088ndash193) 84 (-57ndash22) vs European 1986ndash1991 170 (124ndash233) 21 (55ndash36)
1991ndash1996 130 (095ndash178) 10 (-34ndash23) 1996ndash2001 105 (076ndash145) 16 (-99ndash13) 2001ndash2004 040 (026ndash063) -23 (-31ndash -15) P (trend) 011 006 Pooled 115 (098ndash135) 50 (-09ndash11)
Total Asian vs 1981ndash1986 101 (040ndash252) 02 (-25ndash26) European 1986ndash1991 069 (030ndash158) -91 (-26ndash79)
1991ndash1996 097 (062ndash154) -09 (-16ndash14) 1996ndash2001 088 (061ndash128) -39 (-15ndash72) 2001ndash2004 046 (028ndash075) -20 (-30ndash -11) P (trend) 024 017 Pooled 081 (061ndash109) -61 (-14ndash16)
Notes 95 percent confidence intervals in brackets Underlying non-linear trends mean the p for trend value must be interpreted cautiously
302 Socioeconomic trends Rates increased in all income groups over the period surveyed increases ranging from 3 percent in the medium-income tertile to 35 percent in the low-income tertile (Figure 78 and Table 130 in Appendix 1)
Rates of adolescent cancer were about 20 percent to one-third lower in adolescents with low-income backgrounds with no evidence of change in this inequality over time (Table 74)
Cancer Trends 173
Figure 78 Standardised rates of adolescent cancer (15ndash24 year-olds) by income
Table 74 Age- and ethnicity-standardised income rate ratios (SRR) rate differences (SRD) relative indices of inequality (RII) and slope indices of inequality (SII) of adolescent cancer
Age group Cohort Both sexes
Relative inequalities Absolute inequalities
SRR RII (95 CI) SRD SII (95 CI)
1st cancer
15ndash24 years 1981ndash1986 1986ndash1991 1991ndash1996 1996ndash2001 2001ndash2004 P (trend) Pooled
080 079 105 065 087 096 083
08 (06ndash12) 07 (05ndash10) 10 (07ndash14) 05 (03ndash08) 09 (06ndash13)
082 07 (06ndash09)
-58 -72 17 -14
-46 081 -61
-60 (-19ndash70) -11 (-19ndash -34)
-10 (-19ndash17) -22 (-30ndash -15)
-50 (-17ndash63) 058 -10 (-13ndash -57)
Notes 95 percent confidence intervals in brackets SRRs and SRDs compare low- and high-income tertiles Underlying non-linear trends mean the p for trend value must be interpreted cautiously
174 Cancer Trends
Part D Conclusions
Cancer Trends 175
Conclusions Social inequalities in cancer incidence reflect socially patterned differences in exposure and susceptibility to environmental carcinogens (for example tobacco smoke some industrial chemicals ultraviolet radiation and certain viruses and bacteria) and lifestyles (for example drug use including alcohol and tobacco dietary carcinogens low fruit and vegetable intake sedentary behaviour obesity and sexual and reproductive behaviours) Differences in access to and quality of health services may generate inequalities in cancer survival but generally not incidence (the major exception is cervical cancer and to a much lesser extent colorectal and breast cancers for which screening can detect pre-cancerous lesions leading to a reduction in cancer incidence)
For this reason differences in cancer incidence between ethnic or income groups largely reflect differences in social conditions and lifestyles and can be used as an lsquointegratorrsquo or marker of such differences So analysis of trends in inequalities in cancer incidence can assist in evaluation of our success in reducing social inequality and in the development of health and broader social policy Such analyses also provide a planning tool with regard to future development and funding of cancer services ndash to the extent that past trends can predict future trajectories Information about trends in risk factors (in the case of those cancers for which risk factors are understood) can also be incorporated into predictive models to improve the accuracy of forecasts
This section will briefly summarise this reportrsquos findings with regard to trends in inequalities in cancer incidence Lung cancer as representative of smoking-related cancers is first reviewed followed by those non-smoking-related cancers for which this analysis has revealed potentially significant inequalities or trends in inequalities Finally implications of these findings for health monitoring and policy are briefly commented on
It should be noted that the purpose of this report is to provide a broad overview of findings rather than an in-depth interpretation of patterns for each cancer Future publications from CancerTrends data will provide more detailed analysis and interpretation for selected cancers of interest
Figures 79 and 80 summarise at a glance the underlying incidence rates over time for 15 major cancer types pooling ages and sexes and adjusting for ethnicity as regards the income analyses
Cancer Trends 177
Figure 79 Summary of incidence by ethnicity for main cancers sexes combined
178 Cancer Trends
Figure 80 Summary of incidence by income tertile for main cancers sexes combined
Cancer Trends 179
Smoking-related cancers Smoking-related cancers include the vast majority (more than 80 percent) of lung cancers but also substantial proportions of upper aerodigestive cancers as well as pancreatic and bladder cancers Here lung cancer is used to represent the wider group of smoking-related cancers
Wide ethnic differences and socioeconomic gradients in tobacco use are well recognised in New Zealand90 and are reflected in inequalities in lung cancer incidence Pooling over time and adjusting for age Māori were over twice (for males) or three times (for females) as likely to develop lung cancer as EuropeanOther people moreover the gap widened over time Pacific people (of both sexes) were also at higher risk (about 15-fold overall) and female (but not male) rates increased over time (Table 103 in Appendix 1) such that inequalities between Pacific and EuropeanOther females tended to widen over time There was no significant inequality or any trend in rates for Asian people (of both sexes)
Unsurprisingly low-income people (of both sexes) were at least 1frac12 times as likely to develop lung cancer as high-income counterparts pooling over age and time and adjusting for differences in ethnic composition The size of this gap increased over time especially among females and when measured on an absolute scale most probably reflecting the differential phasing of the tobacco epidemic by both sex and SEP
Roughly similar inequalities and trends in inequalities were seen in the other smoking-related cancers although differences were not always statistically significant This may reflect the smaller fraction of these cancers (compared to lung cancer) attributable to smoking alone such that differences in magnitude and timing of the tobacco epidemic between social groups were less clearly reflected in incidence rates Interestingly non-EuropeanOther ethnic groups had significantly lower (and stable) incidence rates of bladder cancer than the EuropeanOther group (for which rates increased over time) despite tobacco smoking being an established major risk factor for this cancer the reasons for this are unclear
Non-smoking-related cancers With some exceptions social inequalities in non-smoking related cancer incidence were smaller than those in smoking-related cancer incidence often surprisingly so in terms of income inequalities The following analysis is restricted to 12 cancers for which incidence was sufficient to generate stable group-specific rates for comparison breast cervix colorectal endometrial kidney leukaemia liver melanoma NHL ovary prostate and stomach Less emphasis has been placed on Asian inequalities as the generally low incidence rates among Asian people are thought to largely reflect a healthy migrant effect (which will wash out over time)
180 Cancer Trends
Cancers showing relatively large social inequalities in incidence Six cancers were found to exhibit large ethnic andor socioeconomic inequalities in their incidence cervix colorectal endometrial liver melanoma and stomach Note that in the case of several of these cancers (stomach cervix and colorectal) smoking may in fact make a contribution albeit minor to observed inequalities or trends in inequalities
Cervix Pooling over age and time incidence rates of invasive cervical cancer among Māori and Pacific women were at least twice those of their EuropeanOther counterparts However among younger women (aged less than 65 years) at least the gap has narrowed dramatically and steadily since 1991 coinciding with the introduction of the NCSP By contrast an inequality may now be emerging between EuropeanOther and Asian women (who have relatively low rates of participation in screening coverage rates are also lower for Māori and Pacific than EuropeanOther women but are improving) Income inequalities are also evident (approximately 15 fold-overall) again most probably reflecting differences in participation in screening between income strata These inequalities were stable over the observation period when measured on a relative scale yet absolute differences in incidence reduced over time Given the concern that screening programmes may lead to a widening of inequalities (because disadvantaged groups generally participate to a lesser extent) this finding represents a major public health success having said this inequalities in cervical cancer incidence (or participation in screening) are still a long way from being eliminated
Colorectal No income gradient is evident in colorectal cancer incidence but ethnic differences are marked Māori Pacific people and Asian people (of both sexes) are only half as likely to develop colorectal cancer as EuropeanOther people adjusting for age For Māori this gap appears to be narrowing although the trend is statistically significant only for males Contrary to earlier findings on colorectal cancer mortality40 91 this study found no evidence that inequalities in incidence are narrowing for Pacific people The reason for the lower incidence of colorectal cancer among Māori and Pacific people is not clear however the finding that this differential may be narrowing (at least for Māori) is of concern The trend appears to be driven by an absolute increase in incidence rates among Māori males but may also reflect declining rates among younger EuropeanOther males (and females) ndash possibly resulting from a cohort effect involving the latter ethnic group in particular92
Endometrial No consistent income gradient is evident in endometrial cancer incidence but large ethnic inequalities exist with Māori rates about one-and-a-half times and Pacific rates nearly twice EuropeanOther rates pooled over time and adjusting for age This inequality may have increased over the observation period for Pacific compared to EuropeanOther women although the trend did not quite reach statistical significance Obesity is a major risk factor for this cancer and may explain (part of) the ethnic inequality observed
Cancer Trends 181
Liver Primary liver cancer is relatively uncommon so group-specific rates are not particularly stable Nevertheless it is clear that moderate income inequalities exist rates are 20ndash50 percent higher among low-income compared to high-income groups pooling over age and time and adjusting for ethnicity By contrast ethnic inequalities are large (between three- and eight-fold higher than the EuropeanOther reference group depending on ethnicity and sex) which is consistent with previous research27 28
although trends in inequalities are unclear The most likely explanation for this relates to differences in rates of chronic infection with hepatitis B virus between social groups (largely antedating the introduction of immunisation against this infection) If this is the case it could be that at some future date primary liver cancer incidence rates will begin to decline in all ethnic groups and absolute inequalities will ultimately disappear
Melanoma Māori and Pacific people were one-fifth to one-tenth as likely to develop melanoma as EuropeanOther people (pooling over age and time) and trends in these relative inequalities were non-significant That is melanoma rates increased similarly in all ethnic groups over time Rates in low-income strata were about one-quarter lower than in high-income strata again with similar increases across income groups over time resulting in essentially stable relative inequalities Explanations for these inequalities most likely relate to differences in susceptibility (especially by ethnicity) and exposure (especially by socioeconomic group) to episodic ultraviolet radiation
Stomach Stomach cancer rates are falling over time but large ethnic inequalities persist Māori and Pacific peoples being two to three times as likely to develop this cancer as EuropeanOther people (pooling over age and time) Furthermore for Māori females (and possibly for Pacific females) this inequality widened over the observation period when measured on a relative scale Low-income people (of both sexes) had slightly higher rates of stomach cancer than high-income counterparts (of both sexes pooled over age and time) but for females the inequality narrowed on both absolute and relative scales driven largely by women older than 65 years Inequalities and trends in inequalities may reflect cohort differences in Helicobacter pylori infection rates among other factors (including tobacco smoking)
Cancers showing relatively small or no social inequalities in incidence All other non-smoking-related cancers showed small or no ethnic and income inequalities in incidence rates or exhibited unstable rates (due to small numbers) making inequality analysis difficult However given their relatively large numbers some mention should be made of female breast cancer and prostate cancer
182 Cancer Trends
Breast Pooling over age and time Māori women were slightly more likely to be diagnosed with breast cancer than EuropeanOther women (the SRR was 117 and the SRD 24 per 100000) Moreover Māori rates increased faster than EuropeanOther rates resulting in widening relative inequalities (an SRR of 107ndash123) but did not increase in a monotonic manner with the result that the trend was not statistically significant (p for trend 013) At the same time Māori women experienced a four-fold increase in absolute inequalities compared to EuropeanOther women (the SRD increasing from 84 to 39 per 100000 p for trend 006) By contrast Pacific women had slightly lower rates (an SRR of 090) and there was no trend towards inequality Asian women experienced moderately lower risk (an SRR of 071) which did not vary over time Low-income women were slightly less likely to develop breast cancer than high-income counterparts (with a pooled of SRR 090) this ratio did not vary over time
Explanations for these ethnic trends are unclear but most likely are unrelated to differential participation by ethnicity in the BreastScreen Aotearoa programme (which was only introduced recently) It must also be noted that most of what we know about breast cancer risk factors would predict that EuropeanOther breast cancer incidence rates should be higher than the corresponding Māori rates yet the converse is true Further research is needed in this respect
Prostate Large increases in prostate cancer incidence have occurred among all ethnic and income groups in recent times probably mostly due to opportunistic PSA testing Few differences were found in observed prostate cancer incidence rates by ethnicity (adjusting for age and time) except for a lower rate among Asian men Indeed the lsquostep-lockrsquo increases in Māori Pacific and EuropeanOther prostate cancer incidence rates might be considered surprising as although PSA testing rates have so far been lower among Māori and Pacific than European men (by one-half to one-third depending on age and period)93 no significant trends in ethnic inequalities in prostate cancer incidence have been observed except for an increasing inequality over time favouring Asian men when measured on an absolute scale
Low-income men were about 10ndash20 percent less likely to be diagnosed with this cancer than their high-income counterparts with little suggestion that the difference has changed over the past quarter-century ndash again despite the likelihood that PSA testing rates have thus far been lower among low income than high income men
Implications for policy Inequalities in cancer incidence are an important consideration in regard to health policy development service planning and resource allocation for cancer services This report indicates that the major driver of inequalities across all cancers is tobacco smoking This finding reinforces the need to refresh efforts aimed at reducing tobacco consumption by Māori and low-income groups in particular There are currently also substantial inequalities in the incidence of several cancers unrelated to exposure to tobacco smoke Some of these cancers such as endometrial cancer are linked to obesity and the observed inequalities reinforce the need to address differential
Cancer Trends 183
exposure to the lsquoobesogenicrsquo environment by ethnicity and SEP94 Inequalities in incidence of other cancers such colorectal and primary liver cancer may reflect strong cohort effects Incidence of liver cancer in particular should dissipate as birth cohorts immunised against hepatitis B replace earlier non-immunised cohorts with differentially high infection rates by ethnicity and SEP Inequalities in the incidence of cancers attributable to other infectious agents such as stomach cancer (Helicobacter pylori) and cervical cancer (oncogenic HPV) may also narrow in the future as chronic infection rates reduce overall and simultaneously converge across social groups This is already happening in the case of cervical cancer reflecting the success of the National Cervical Screening Programme in enhancing coverage across most social groups (although screening coverage still remains lower among some ethnic groups than among others) A key policy aim for the future should be to mitigate the rising trend in colorectal cancer incidence among Māori ndash a reduction in ethnic inequality here represents success if it results from falling incidence among Europeans but failure if it reflects increasing incidence among Māori (which appears to be the case currently)
Implications for monitoring Inequalities in cancer cannot be interpreted without simultaneous consideration of incidence survival and mortality (for each major cancer by age cohort and period) The NZCMS provides a means of monitoring inequalities in mortality as previously reported39 40 95 By linking cancer registrations to Census records (anonymously and probabilistically) this report performs the same function for incidence Unfortunately time series data for cancer survival with sufficient information to analyse inequalities directly or (again) by linkage to Census data have only recently become available from the NZCR In the near future it will thus be possible to monitor trends in all three epidemiological variables (cancer incidence survival and mortality) simultaneously allowing fuller interpretation of the drivers of difference Greater understanding and more robust measurement of inequalities can help to optimise cancer policy and resource allocation ensuring better sooner and more convenient cancer services for all
184 Cancer Trends
References 1 Minister of Health The New Zealand Cancer Control Strategy Wellington Ministry of Health and the
New Zealand Cancer Control Trust 2003 2 Danaei G Vander Hoorn S Lopez AD Murray CJL Ezzati M Causes of cancer in the world
comparative risk assessment of nine behavioural and environmental risk factors Lancet 2005366(9499)1784-93
3 Ministry of Health Cancer in New Zealand Trends and Projections Wellington Ministry of Health 2002
4 Jeffreys M Stevanovic V Tobias M Lewis C Ellison-Loschmann L Pearce N et al Ethnic inequalities in cancer survival in New Zealand linkage study American Journal of Public Health 200595(5)834-7
5 Cormack D Ratima M Robson B Brown R Purdie G Access to cancer services for Maumlori A report prepared for the Ministry of Health Wellington Te Rōpū Rangahau Hauora a Eru Pōmare University of Otago 2005
6 Jeffreys M Sarfati D Stevanovic V Tobias M Lewis C Pearce N et al Socioeconomic inequalities in cancer survival in New Zealand the role of extent of disease at diagnosis Cancer Epidemiology Biomarkers and Prevention 200918(3)915-21
7 Ajwani S Blakely T Robson B Bonne M Tobias M Decades of Disparity Ethnic mortality trends in New Zealand 1980-1999 (also available at httpwwwwnmedsacnznzcms-infohtml) Wellington Ministry of Health 2003
8 Blakely T Ajwani S Robson B Tobias M Bonne M Decades of Disparity Widening ethnic mortality gaps from 1980 to 1999 NZ Med J 2004117(1199)U995
9 Shaw C Blakely T Sarfati D Fawcett J Hill S Varying evolution of the New Zealand lung cancer epidemic by ethnicity and socioeconomic position (1981-1999)[see comment] NZ Med J 2005118(1213)U1411
10 Foster FH Cancer registry in New Zealand National Cancer Institute Monographs 19774741-4 11 Tukuitonga CF Solomon N Stewart A Incidence of cancer among Pacific Island people in New
Zealand[comment] NZ Med J 1992105(946)463-6 12 Newman PD Mason BH Holdaway IM Kay RG Arthur JF Hitchcock GC Incidence and clinical
features of breast cancer in the Auckland region NZ Med J 1992105(931)117-20 13 Armstrong W Borman B Breast cancer in New Zealand trends patterns and data quality NZ MedJ
1996109221-24 14 Lawes C Tukuitonga CF Scragg R K The epidemiology of breast cancer in Pacific Women in New
Zealand NZ Med J 1999112354-57 15 McCredie M Paul C Skegg DC Williams S Breast cancer in Maori and non-Maori women Int J
Epidemiol 199928189-95 16 Foster FH Colon and rectum cancer in the New Zealand population National Cancer Institute
Monographs 197747173-5 17 Sutton TD Eide TJ Jass JR Trends in colorectal cancer incidence and histologic findings in Maori
and Polynesian residents of New Zealand Cancer 199371(12)3839-45 18 Thompson AG Regional differences in incidence of gastric and colonic cancer in the Maori of New
Zealand Postgraduate Medical Journal 200278(921)419-21 19 Smith AH Pearce NE Joseph JG Major colorectal cancer aetiological hypotheses do not explain
mortality trends among Maori and non-Maori New Zealanders International Journal of Epidemiology 198514(1)79-85
20 Pearce N Bethwaite P Social class and male cancer mortality in New Zealand 1984-7 NZ Med J 1997110200-02
21 Pearce N Howard J Occupation social class and male cancer mortality in New Zealand 1974-78 Int J Epidemiol 198615456-62
22 Pearce N Sheppard R Howard J et al Time trends and occupational differences in cancer of the testis in New Zealand Cancer 198759(9)1677-82
23 Stewart RJ Stewart AW Stewart JM Isbister WH Cancer of the stomach in New Zealand 1970-74 Australian amp New Zealand Journal of Surgery 198252(4)363-9
24 Dockerty JD Marshall S Fraser J Pearce N Stomach cancer in New Zealand time trends ethnic group differences and a cancer registry-based case-control study International Journal of Epidemiology 199120(1)45-53
Cancer Trends 185
25 Dockerty JD Cox B Cockburn MG Childhood leukaemias in New Zealand time trends and ethnic differences British Journal of Cancer 199673(9)1141-7
26 Simmons GC Yeong ML Lee SP The association of hepatitis B viral infection and hepatocellular carcinoma in New Zealand NZ Med J 198396(739)669-71
27 Blakely T Bates M Garrett N Robson B The incidence of hepatocellular carcinoma in New Zealand NZ Med J 1998111471-74
28 Blakely T Bates M Baker M Tobias M Hepatitis B carriage explains the excess rate of hepatocellular carcinoma for Maori Pacific Island and Asian people compared to Europeans in New Zealand Int J Epidemiol 199928204-10
29 Blakely T Robson B Atkinson J Sporle A Kiro C Unlocking the numerator-denominator bias I Adjustment ratios by ethnicity for 1991-94 mortality data NZ Med J 200211539-43
30 Blakely T Atkinson J Unlocking the Numerator-Denominator Bias 1991-94 Deaths NZCMS Technical Report No 2 (Also at httpwwwwnmedsacnznzcms-infohtml) Wellington Department of Public Health Wellington School of Medicine University of Otago 2001
31 Ajwani S Blakely T Robson B Atkinson J Fawcett J Kiro K Unlocking the numerator-denominator bias for the 1980s and 1990s NZCMS Technical Report No 4 ISBN 0-473-09111-9 (Also at httpwwwwnmedsacnznzcms-infohtml) Wellington Department of Public Health Wellington School of Medicine and Health Sciences University of Otago 2002
32 Ajwani S Blakely T Robson B Atkinson J Kiro C Unlocking the numerator-denominator bias III adjustment ratios by ethnicity for 1981-1999 mortality data The New Zealand Census-Mortality Study NZ Med J 2004116(1175)6
33 Shaw C Atkinson J Blakely T (Mis)classification of ethnicity on the New Zealand Cancer Registry 1981-2004 NZ Med J 2009122(1294)10-22
34 Pomare E Keefe-Ormsby V Ormsby C Pearce N Reid P Robson B et al Hauora Maori Standards of Health III Wellington Eru Pomare Maori Health Research Centre 1995
35 Ministry of Health Our Health Our Future Wellington NZ Ministry of Health 1999 36 Blakely T Tobias M Robson B Ajwani S Bonne M Woodward A Widening ethnic mortality
disparities in New Zealand 1981-99 Soc Sci Med 200561(10)2233-51 37 Howden-Chapman P Tobias M editors Social Inequalities in Health New Zealand 1999 Wellington
NZ Ministry of Health 2000 38 Blakely T Fawcett J Atkinson J Tobias M Cheung J Decades of Disparity II Socioeconomic
mortality trends in New Zealand 1981-1999 Wellington Ministry of Health 2005 39 Blakely T Tobias M Atkinson J Inequalities in mortality during and after restructuring of the New
Zealand economy repeated cohort studies BMJ 2008336371-75 40 Blakely T Tobias M Atkinson J Yeh L-C Huang K Tracking Disparity Trends in ethnic and
socioeconomic inequalities in mortality 1981-2004 Wellington Ministry of Health 2007 41 Martikainen P Valkonen T Diminishing educational differences in breast cancer mortality among
Finnish women a register-based 25-year follow-up ajph 200090277-80 42 Singh GK Miller BA Hankey BF Changing Area Socioeconomic Patterns in US Cancer Mortality
1950-1998 Part II--Lung and Colorectal Cancers J Natl Cancer Inst 200294(12)916-25 43 New Zealand Health Information Service CancerNew Registrations and Deaths 1996 Wellington
Ministry of Health 2000 44 Statistics New Zealand Statistical standard for ethnicity Statistics New Zealand 2005 45 Statistics New Zealand A Report on the Post-enumeration Survey 2001 Wellington Statistics New
Zealand 2002 46 Fawcett J Atkinson J Blakely T Record linkage of census and mortality 2001-04 records New
Zealand Census-Mortality Study Technical Report No 6 Wellington Health Inequalities Research Programme University of Otago Wellington 2008
47 Blakely T Salmond C Probabilistic record linkage and a method to calculate the positive predictive value Int J Epidemiol 2002311246-52
48 Blakely T Salmond C Woodward A Anonymous linkage of New Zealand mortality and Census data Aust NZ J Public Health 20002492-95
49 Hill S Atkinson J Blakely T Anonymous record linkage of census and mortality records 1981 1986 1991 1996 census cohorts NZCMS Technical Report No 3 ISBN 0-473-09110 (Also at httpwwwwnmedsacnznzcms-infohtml) Wellington Department of Public Health Wellington School of Medicine and Health Sciences University of Otago 2002
50 Lash B Documentation of the process and results of linking cancer data with census data 1981 to 2001 Wellington Statistics New Zealand 2008
186 Cancer Trends
51 Atkinson J Shaw C Blakely T Stanley J Sloane K Linkage of Census and Cancer Registrations 1981-2004 CancerTrends Technical Report No 1 Wellington Department of Public Health University of Otago Wellington 2010
52 Jensen J Income equivalences and the estimation of family expenditure on children Wellington Department of Social Welfare (unpublished) 1988
53 Blakely T The New Zealand Census-Mortality Study Socioeconomic inequalities and adult mortality 1991-94 Also at httpwwwwnmedsacnznzcms-infohtml Wellington Ministry of Health 2002258
54 Hayes L Berry G Sampling variability of the Kunst-Mackenbach relative index of inequality J Epidemiol Community Health 200256762-65
55 Mackenbach J Kunst A Measuring the magnitude of socio-economic inequalities in health an overview of available measures illustrated with two examples from Europe Soc Sci Med 199744757-71
56 Rothman K Greenland S Lash T Modern Epidemiology 3rd ed Philadelphia Lippincott WIlliams amp Wilkins 2008
57 Ministry of Health Cancer New Registrations and Deaths 2005 Wellington Ministry of Health 2008 58 New Zealand Health Information Services Cancer Patient Survival Covering the Period 1994 to 2003
Wellington Ministry of Health 2006 59 Kogevinas M Garcia-Closas M Trichopoulos D Urinary Bladder Cancer In Adami HO Hunter D
Trichopoulos D editors Textbook of Cancer Epidemiology Second ed Oxford Oxford University Press 2008
60 World Cancer Research FundAmerican Institute for Cancer Research Food Nutrition Physical Activity and the Prevention of cancer A Global Perspective Washington DC American Institute for Cancer Research 2007
61 Savitz D Trichopoulos D Brain Cancer In Adami HO Hunter D Trichopoulos D editors Textbook of Cancer Epidemiology Second Edition New York Oxford University Press 2008
62 Hankinson S Tamimi R Hunter D Breast Cancer In Adami HO Hunter D Trichopoulos D editors Textbook of Cancer Epidemiology second edition New York Oxford University Press 2008
63 Richardson A Cox B Brown T Smale P al e The impact of breast cancer screening on breast cancer registrations in New Zealand NZ Med J 2005118(1209)U1291
64 Ylitalo N Stuver S Adami H Cervical Cancer In Adami H Hunter D trichopoulos D editors A Textbook of Cancer Epidemiology Second edition New York Oxford University Press 2008
65 Potter J Hunter D Colorectal Cancer In Adami H Hunter D Trichopoulos D editors Textbook of Cancer Epidemiology Second ed New York Oxford University Press 2008
66 Devivo I Persson I Adami H Endometrial Cancer In Adami H Hunter D trichopoulos D editors A Textbook of Cancer Epidemiology second edition New York Oxford University Press 2008
67 Stuver S Trichopoulos D Cancer of the liver and biliary tract In Adami HO Hunter D Trichopoulos D editors Textbook of Cancer Epidemiology Second Edition New York Oxford University Press 2008
68 Melbye M Smedby K Trichopoulos D Non-Hodgkin Lymphoma In Adami HO Hunter D Trichopoulos D editors Textbook of Cancer Epidemiology Second ed Oxford Oxford University Press 2008
69 Cho E Lindblad P Adami HO Kidney Cancer In Adami HO Hunter D Trichopoulos D editors Textbook of Cancer Epidemiology Second Edition New York Oxford University Press 2008
70 Boffetta P Trichopoulos D Cancer of the lung larynx and pleura In Adami H Hunter D Trichopoulos D editors Textbook of Cancer Epidemiology Second ed New York Oxford University Press 2008
71 Petridou E Pourtsidis A Trichopoulos D Leukemias In Adami HO Hunter D Trichopoulos D editors Textbook of Cancer Epidemiology Second ed Oxford Oxford University Press 2008
72 Brennan P Mucci L Adami HO Oral and Pharyngeal Cancer In Adami HO Hunter D Trichopoulos D editors Textbook of Cancer Epidemiology Second ed Oxford Oxford University Press 2008
73 Chang E Adami HO Nasopharyngeal Carcinoma In Adami HO Hunter D Trichopoulos D editors Textbook of Cancer Epidemiology Second ed Oxford Oxford University Press 2008
74 Green A Van Der Pols J Hunter D Skin cancer In Adami HO Hunter D Trichopoulos D editors Textbook of Cancer Epidemiology Second Edition New York Oxford University Press 2008
75 De Roos A Baris D Weiss NS L H Multiple Myeloma In Schottenfield D Fraumeni JF Jr editors Cancer Epidemiology and Prevention Third ed Oxford Oxford University Press 2006
76 Melbye M Hjalgrim H Adami HO Hodgkin Lymphoma In Adami HO Hunter D Trichopoulos D editors Textbook of Cancer Epidemiology Second ed Oxford Oxford University Press 2008
Cancer Trends 187
77 Nyren O Adami HO Esophageal Cancer In Adami HO Hunter D Trichopoulos D editors Textbook of Cancer Epidemiology Second ed Oxford Oxford University Press 2008
78 Webb P Gertig D Hunter D Ovarian Cancer In Adami HO Hunter D Trichopoulos D editors Textbook of Cancer Epidemiology Second Edition New York Oxford University Press 2008
79 Ekbom A Trichopoulos D Pancreatic cancer In Adami HO Hunter D Trichopoulos D editors Textbook of Cancer Epidemiology Second Edition New York Oxford University Press 2008
80 Mucci L Signorello L Adami HO Prostate Cancer In Adami HO Hunter D Trichopoulos D editors textbook of cancer Epidemiology Second ed Oxford Oxford University Press 2008
81 Nyren O Adami HO Stomach Cancer In Adami HO Hunter D Trichopoulos D editors Textbook of Cancer Epidemiology Second ed Oxford Oxford University Press 2008
82 Ministry of Health Cancer Incidence Projections 1999ndash2003 update Wellington Ministry of Health 2008
83 Richiardi L Tamimi R Adami H Testicular Cancer In Adami H Hunter D Trichopoulos D editors Textbook of Cancer Epidemiology Second ed New York Oxford University Press 2008
84 Research IAoC GLOBOCAN 2002 Lyon IARC 2005 85 Garner M Turner M Ghadirian P Krewski D Epidemiology of testicular cancer an overview
International Journal of Cancer 2005116(3)331-9 86 Coupland CAC Forman D Chilvers CED Davey G Pike MC Oliver RTD Maternal risk factors for
testicular cancer a population-based case-control study (UK) Cancer Causes amp Control 200415(3)277-83
87 Grotmol T Weiderpass E Tretli S Conditions in utero and cancer risk European Journal of Epidemiology 200621(8)561-70
88 Weir HK Marrett LD Kreiger N Darlington GA Sugar L Pre-natal and peri-natal exposures and risk of testicular germ-cell cancer International Journal of Cancer 200087(3)438-43
89 Hall P Adami HO Thyroid Cancer In Adami HO Hunter D Trichopoulos D editors Textbook of Cancer Epidemiology Second Edition New York Oxford University Press 2008
90 Ministry of Health Inhaling Inequality - Tobaccos contribution to health inequality in New Zealand Wellington Ministry of Health 2001
91 Shaw C Blakely T Sarfati D Fawcett J Peace J Trends in colorectal cancer mortality by ethnicity and socio-economic position in New Zealand 1981-99 one country many stories Aust NZ J Public Health 200630(1)64-70
92 Cox B Little J Reduced risk of colorectal cancer among recent generations in New Zealand British Journal of Cancer 199266(2)386-90
93 Ministry of Health Incidence and Prevalence of PSA Testing in New Zealand Men gt50 Years Unpublished report 2008
94 Ministry of Health Embodying Social Rank How body fat varies with social status gender and ethnicity in New Zealand Public Health Intelligence Occasional Bulletin Wellington Ministry of Health 2006
95 Tobias M Blakely T Matheson D Rasanathan K Atkinson J Changing trends in indigenous inequalities in mortality lessons from New Zealand Int J Epidemiol 200938(6)1711-22
188 Cancer Trends
Appendices
Appendix 1 Tables of Rates This appendix includes tables of all standardised rates that are graphed in figures earlier in the report The tables also include standardised rates pooled over time and p values for statistical tests of trend
Rather than list notes after every table the following is noted here bull The standard population used for the age- and ethnicity-standardised rates by
income was the World Health Organization world standard further stratified by ethnic proportions in New Zealand
bull 95 percent confidence intervals are symmetric except in cases where the lower confidence limit would be less than zero In these instances confidence intervals are determined for the log transformation of the rate then exponentiated
bull 95 percent confidence intervals are shown in parentheses bull p values for trend assume a linear trend In instances where non-linear trends are
expected (for example for rates that rise then fall) the p for trend is misleading and cohort-specific confidence intervals should be examined instead
bull p values are only presented when estimates are available for all five cohorts
Table 75 Age-standardised rates of first cancer by ethnic group
1st cancer Age group
Cohort Total Māori SR (95 CI)
Total Pacific SR (95 CI)
Total Asian SR (95 CI)
EuropeanOther SR (95 CI)
Males
25+ years 1981ndash1986 555 (512ndash598) 506 (404ndash608) 292 (219ndash365) 507 (499ndash515) 1986ndash1991 554 (515ndash592) 622 (530ndash714) 422 (344ndash501) 527 (519ndash535) 1991ndash1996 684 (644ndash724) 575 (510ndash641) 393 (329ndash457) 625 (617ndash633) 1996ndash2001 752 (717ndash787) 723 (664ndash781) 463 (415ndash512) 708 (700ndash716) 2001ndash2004 759 (722ndash797) 596 (544ndash649) 379 (342ndash415) 721 (712ndash730) change 37 18 30 42 P (trend) 002 055 060 lt01 Pooled 656 (638ndash674) 605 (570ndash640) 390 (362ndash419) 612 (609ndash616)
25ndash44 years 1981ndash1986 883 (719ndash105) 899 (614ndash118) 866 (419ndash131) 838 (780ndash895) 1986ndash1991 845 (687ndash100) 120 (92ndash148) 796 (438ndash115) 849 (794ndash903) 1991ndash1996 105 (89ndash120) 799 (588ndash101) 691 (461ndash920) 899 (844ndash955) 1996ndash2001 113 (98ndash128) 895 (703ndash109) 953 (759ndash115) 944 (886ndash100) 2001ndash2004 105 (89ndash120) 560 (406ndash713) 597 (441ndash753) 103 (96ndash110) change 18 -38 -31 23 P (trend) 011 013 045 lt01 Pooled 987 (917ndash106) 885 (780ndash991) 790 (652ndash928) 907 (880ndash933)
45ndash64 years 1981ndash1986 663 (592ndash734) 669 (513ndash825) 325 (191ndash458) 512 (497ndash527) 1986ndash1991 633 (574ndash693) 634 (504ndash763) 413 (290ndash535) 519 (505ndash533) 1991ndash1996 710 (652ndash768) 614 (519ndash709) 370 (278ndash462) 591 (576ndash606) 1996ndash2001 764 (711ndash817) 673 (588ndash758) 429 (358ndash499) 691 (675ndash708) 2001ndash2004 766 (712ndash821) 536 (461ndash610) 388 (333ndash443) 727 (709ndash744) change 16 -20 19 42 P (trend) 004 026 055 lt01 Pooled 704 (677ndash731) 629 (578ndash681) 385 (339ndash431) 602 (595ndash609)
Cancer Trends 191
1st cancer Age group
Cohort Total Māori SR (95 CI)
Total Pacific SR (95 CI)
Total Asian SR (95 CI)
EuropeanOther SR (95 CI)
65ndash74 years 1981ndash1986 1741 (1475ndash2006) 1621 (975ndash2268) 1207 (571ndash1843) 1617 (1571ndash1663) 1986ndash1991 1918 (1657ndash2179) 2398 (1746ndash3051) 1114 (610ndash1618) 1701 (1658ndash1745) 1991ndash1996 2323 (2075ndash2570) 2258 (1796ndash2720) 1307 (875ndash1738) 2095 (2049ndash2141) 1996ndash2001 2549 (2342ndash2756) 2557 (2193ndash2922) 1607 (1281ndash1932) 2488 (2437ndash2539) 2001ndash2004 2857 (2612ndash3101) 2509 (2114ndash2903) 1231 (994ndash1468) 2529 (2467ndash2591) change 64 55 2 56 P (trend) lt01 009 086 lt01 Pooled 2248 (2138ndash2359) 2257 (2019ndash2494) 1296 (1088ndash1504) 2064 (2042ndash2086)
75+ years 1981ndash1986 2189 (1731ndash2648) 1710 (440ndash2980) 786 (299ndash1274) 2389 (2316ndash2462) 1986ndash1991 2208 (1779ndash2637) 2724 (1593ndash3855) 2423 (1482ndash3365) 2537 (2471ndash2604) 1991ndash1996 2889 (2446ndash3332) 2364 (1603ndash3125) 1913 (1176ndash2651) 3063 (2994ndash3132) 1996ndash2001 3561 (3157ndash3965) 3646 (2968ndash4324) 1934 (1416ndash2453) 3325 (3258ndash3393) 2001ndash2004 3164 (2750ndash3578) 2980 (2364ndash3597) 1762 (1342ndash2183) 3346 (3266ndash3426) change 45 74 124 40 P (trend) 006 024 022 001 Pooled 2784 (2590ndash2978) 2670 (2242ndash3098) 1764 (1464ndash2064) 2911 (2880ndash2943)
Females
25+ years 1981ndash1986 499 (464ndash534) 438 (370ndash506) 266 (205ndash326) 439 (431ndash446) 1986ndash1991 568 (535ndash601) 532 (466ndash598) 333 (274ndash392) 487 (480ndash495) 1991ndash1996 635 (602ndash668) 453 (408ndash499) 327 (281ndash372) 516 (509ndash524) 1996ndash2001 667 (640ndash695) 531 (490ndash571) 425 (387ndash463) 551 (543ndash558) 2001ndash2004 677 (648ndash707) 544 (503ndash586) 367 (338ndash397) 569 (561ndash577) change 36 24 38 30 P (trend) 001 017 022 lt01 Pooled 606 (592ndash620) 497 (473ndash522) 342 (320ndash365) 510 (506ndash513)
25ndash44 years 1981ndash1986 171 (149ndash192) 164 (125ndash203) 123 (76ndash170) 155 (147ndash163) 1986ndash1991 183 (162ndash205) 197 (159ndash235) 112 (74ndash151) 173 (165ndash180) 1991ndash1996 184 (165ndash203) 171 (143ndash199) 108 (82ndash134) 159 (151ndash166) 1996ndash2001 190 (173ndash207) 190 (163ndash217) 152 (128ndash175) 171 (163ndash178) 2001ndash2004 173 (157ndash190) 137 (114ndash159) 129 (110ndash148) 173 (164ndash181) change 2 -17 5 11 P (trend) 083 033 045 028 Pooled 181 (172ndash189) 173 (159ndash188) 125 (110ndash140) 166 (162ndash169)
45ndash64 years 1981ndash1986 688 (620ndash756) 727 (573ndash880) 347 (220ndash475) 547 (532ndash563) 1986ndash1991 797 (730ndash863) 754 (624ndash883) 429 (314ndash543) 618 (602ndash634) 1991ndash1996 893 (830ndash956) 561 (476ndash647) 483 (387ndash579) 667 (651ndash683) 1996ndash2001 900 (847ndash953) 691 (610ndash771) 550 (477ndash624) 712 (695ndash728) 2001ndash2004 930 (872ndash988) 727 (645ndash808) 465 (411ndash519) 732 (715ndash749) change 35 0 34 34 P (trend) 002 078 041 lt01 Pooled 837 (809ndash865) 690 (639ndash741) 454 (409ndash499) 651 (644ndash658)
65ndash74 years 1981ndash1986 1367 (1136ndash1597) 896 (494ndash1298) 681 (261ndash1101) 1058 (1023ndash1092) 1986ndash1991 1586 (1374ndash1799) 1261 (866ndash1656) 826 (478ndash1174) 1201 (1167ndash1235) 1991ndash1996 1514 (1328ndash1699) 1388 (1088ndash1688) 637 (379ndash895) 1279 (1244ndash1313) 1996ndash2001 1827 (1659ndash1994) 1337 (1097ndash1578) 963 (743ndash1184) 1393 (1357ndash1430) 2001ndash2004 1954 (1761ndash2147) 1558 (1292ndash1824) 968 (774ndash1162) 1474 (1429ndash1519) change 43 74 42 39 P (trend) 002 004 014 lt01 Pooled 1634 (1545ndash1724) 1274 (1125ndash1424) 807 (669ndash946) 1271 (1255ndash1288)
192 Cancer Trends
1st cancer Age group
Cohort Total Māori SR (95 CI)
Total Pacific SR (95 CI)
Total Asian SR (95 CI)
EuropeanOther SR (95 CI)
75+ years 1981ndash1986 1986ndash1991 1991ndash1996 1996ndash2001 2001ndash2004 change P (trend) Pooled
1189 (873ndash1505) 1401 (1101ndash1700) 1872 (1574ndash2171) 1734 (1500ndash1969) 2005 (1708ndash2302)
69 003
1622 (1492ndash1752)
962 (383ndash1540) 1527 (804ndash2249) 965 (573ndash1358)
1485 (1127ndash1843) 1656 (1239ndash2074)
72 015
1302 (1068ndash1536)
570 (166ndash974) 764 (359ndash1170) 980 (568ndash1392)
1292 (975ndash1609) 957 (687ndash1227)
68 022
910 (742ndash1078)
1362 (1317ndash1407) 1479 (1438ndash1521) 1660 (1618ndash1701) 1735 (1694ndash1775) 1820 (1769ndash1872)
34 lt01
1601 (1581ndash1620)
Table 76 Age- and ethnicity-standardised rates of first cancer by income group
1st cancer Age group
Cohort Low income SR (95 CI)
Medium income SR (95 CI)
High income SR (95 CI)
Males
25+ years 1981ndash1986 536 (517ndash555) 535 (487ndash583) 518 (493ndash542) 1986ndash1991 569 (550ndash588) 555 (535ndash575) 523 (500ndash546) 1991ndash1996 644 (624ndash663) 650 (634ndash667) 621 (598ndash644) 1996ndash2001 733 (715ndash752) 740 (722ndash757) 714 (694ndash734) 2001ndash2004 750 (730ndash770) 732 (713ndash752) 707 (688ndash727) change 40 37 37 P (trend) lt01 002 002 Pooled 641 (633ndash650) 638 (626ndash651) 612 (602ndash622)
25ndash44 years 1981ndash1986 862 (749ndash974) 798 (704ndash891) 888 (779ndash998) 1986ndash1991 834 (737ndash931) 892 (799ndash984) 911 (785ndash104) 1991ndash1996 897 (798ndash996) 929 (834ndash102) 887 (788ndash986) 1996ndash2001 111 (100ndash122) 954 (854ndash105) 918 (825ndash101) 2001ndash2004 101 (88ndash115) 989 (874ndash110) 990 (893ndash109) change 18 24 11 P (trend) 011 001 011 Pooled 940 (891ndash989) 909 (865ndash953) 915 (867ndash963)
45ndash64 years 1981ndash1986 542 (508ndash577) 538 (505ndash571) 546 (502ndash591) 1986ndash1991 570 (539ndash601) 549 (520ndash577) 513 (476ndash550) 1991ndash1996 678 (647ndash708) 594 (565ndash623) 574 (539ndash608) 1996ndash2001 691 (660ndash721) 723 (691ndash754) 682 (653ndash712) 2001ndash2004 749 (714ndash784) 699 (666ndash732) 707 (679ndash736) change 38 30 29 P (trend) lt01 003 002 Pooled 641 (626ndash655) 617 (603ndash630) 599 (583ndash615)
65ndash74 years 1981ndash1986 1784 (1656ndash1912) 1620 (1486ndash1754) 1526 (1409ndash1644) 1986ndash1991 1831 (1724ndash1938) 1804 (1672ndash1936) 1737 (1583ndash1890) 1991ndash1996 2118 (2004ndash2232) 2229 (2127ndash2331) 2089 (1950ndash2227) 1996ndash2001 2514 (2412ndash2617) 2538 (2438ndash2639) 2539 (2417ndash2662) 2001ndash2004 2653 (2529ndash2777) 2599 (2471ndash2728) 2483 (2358ndash2608) change 49 60 63 P (trend) lt01 lt01 lt01 Pooled 2156 (2105ndash2208) 2136 (2082ndash2190) 2054 (1995ndash2114)
Cancer Trends 193
1st cancer Age group
Cohort Low income SR (95 CI)
Medium income SR (95 CI)
High income SR (95 CI)
75+ years 1981ndash1986 2414 (2245ndash2583) 2549 (1969ndash3128) 2499 (2203ndash2795) 1986ndash1991 2738 (2528ndash2948) 2699 (2492ndash2906) 2537 (2267ndash2806) 1991ndash1996 2903 (2694ndash3112) 3221 (3067ndash3375) 3171 (2889ndash3453) 1996ndash2001 3545 (3362ndash3727) 3584 (3417ndash3750) 3456 (3241ndash3671) 2001ndash2004 3434 (3253ndash3614) 3548 (3346ndash3750) 3386 (3152ndash3620) change 42 39 35 P (trend) 001 003 003 Pooled 2985 (2899ndash3071) 3099 (2957ndash3240) 2991 (2873ndash3109)
75ndash84 years 1981ndash1986 2433 (2247ndash2619) 2914 (1608ndash4220) 2395 (2083ndash2707) 1986ndash1991 2751 (2525ndash2977) 2775 (2534ndash3015) 2626 (2321ndash2931) 1991ndash1996 2903 (2673ndash3133) 3246 (3071ndash3420) 3150 (2851ndash3449) 1996ndash2001 3621 (3413ndash3828) 3530 (3352ndash3707) 3565 (3308ndash3821) 2001ndash2004 3444 (3254ndash3634) 3513 (3300ndash3726) 3372 (3116ndash3628) change 42 21 41 P (trend) 002 004 003 Pooled 3010 (2915ndash3104) 3180 (2894ndash3465) 3004 (2874ndash3134)
85+ years 1981ndash1986 2463 (2096ndash2831) 2232 (1712ndash2752) 3386 (2195ndash4578) 1986ndash1991 2728 (2193ndash3263) 2565 (2207ndash2924) 2309 (2011ndash2607) 1991ndash1996 3349 (2758ndash3939) 3325 (2942ndash3709) 3402 (2453ndash4352) 1996ndash2001 3308 (2880ndash3736) 3960 (3452ndash4468) 3266 (2732ndash3799) 2001ndash2004 3309 (2837ndash3781) 3756 (3221ndash4291) 3465 (2744ndash4186) change 34 68 2 P (trend) 002 002 011 Pooled 3017 (2799ndash3236) 3138 (2932ndash3345) 3151 (2787ndash3514)
Females
25+ years 1981ndash1986 453 (439ndash467) 457 (438ndash476) 447 (426ndash468) 1986ndash1991 499 (484ndash514) 514 (497ndash530) 520 (499ndash542) 1991ndash1996 547 (532ndash561) 533 (518ndash547) 512 (493ndash531) 1996ndash2001 586 (572ndash600) 563 (549ndash577) 555 (539ndash571) 2001ndash2004 584 (569ndash599) 600 (583ndash617) 581 (564ndash598) change 29 31 30 P (trend) lt01 lt01 001 Pooled 531 (525ndash538) 530 (523ndash537) 520 (512ndash529)
25ndash44 years 1981ndash1986 154 (141ndash167) 166 (152ndash181) 165 (148ndash181) 1986ndash1991 163 (151ndash176) 181 (167ndash194) 181 (163ndash199) 1991ndash1996 153 (141ndash164) 167 (154ndash181) 160 (147ndash174) 1996ndash2001 168 (156ndash179) 181 (168ndash194) 185 (171ndash198) 2001ndash2004 155 (143ndash168) 175 (160ndash189) 171 (158ndash184) change 1 5 4 P (trend) 079 055 066 Pooled 159 (153ndash164) 174 (168ndash180) 172 (166ndash179)
45ndash64 years 1981ndash1986 593 (560ndash625) 574 (539ndash609) 569 (525ndash613) 1986ndash1991 653 (621ndash684) 646 (615ndash678) 672 (627ndash717) 1991ndash1996 735 (706ndash763) 671 (640ndash703) 655 (618ndash691) 1996ndash2001 758 (730ndash787) 710 (680ndash741) 714 (683ndash746) 2001ndash2004 773 (742ndash805) 762 (728ndash796) 745 (713ndash777) change 30 33 31 P (trend) 001 lt01 002 Pooled 699 (685ndash713) 668 (654ndash683) 667 (650ndash685)
194 Cancer Trends
1st cancer Age group
Cohort Low income SR (95 CI)
Medium income SR (95 CI)
High income SR (95 CI)
65ndash74 years 1981ndash1986 1065 (998ndash1131) 1139 (1012ndash1266) 1038 (940ndash1136) 1986ndash1991 1234 (1162ndash1307) 1275 (1187ndash1363) 1294 (1172ndash1416) 1991ndash1996 1333 (1259ndash1408) 1343 (1270ndash1415) 1255 (1147ndash1363) 1996ndash2001 1530 (1456ndash1605) 1480 (1405ndash1555) 1282 (1195ndash1369) 2001ndash2004 1590 (1503ndash1677) 1550 (1455ndash1644) 1496 (1392ndash1600) change 49 36 44 P (trend) lt01 lt01 004 Pooled 1338 (1305ndash1372) 1348 (1306ndash1390) 1262 (1215ndash1309)
75+ years 1981ndash1986 1315 (1230ndash1401) 1431 (1249ndash1612) 1424 (1229ndash1620) 1986ndash1991 1533 (1411ndash1654) 1573 (1445ndash1700) 1588 (1392ndash1784) 1991ndash1996 1694 (1582ndash1806) 1736 (1637ndash1835) 1739 (1582ndash1897) 1996ndash2001 1866 (1747ndash1985) 1682 (1608ndash1756) 1777 (1654ndash1899) 2001ndash2004 1917 (1801ndash2033) 1965 (1829ndash2101) 1951 (1777ndash2126) change 46 37 37 P (trend) lt01 009 lt01 Pooled 1652 (1602ndash1702) 1663 (1605ndash1720) 1683 (1606ndash1760)
75ndash84 years 1981ndash1986 1355 (1252ndash1459) 1520 (1285ndash1755) 1447 (1228ndash1667) 1986ndash1991 1527 (1399ndash1656) 1571 (1423ndash1720) 1680 (1448ndash1911) 1991ndash1996 1736 (1602ndash1871) 1766 (1649ndash1883) 1743 (1565ndash1921) 1996ndash2001 1855 (1721ndash1989) 1719 (1631ndash1806) 1803 (1663ndash1943) 2001ndash2004 1879 (1752ndash2006) 1966 (1811ndash2121) 1918 (1727ndash2109) change 39 29 33 P (trend) lt01 008 lt01 Pooled 1660 (1604ndash1717) 1696 (1625ndash1766) 1708 (1620ndash1796)
85+ years 1981ndash1986 1358 (1183ndash1534) 1328 (1113ndash1543) 1370 (1066ndash1674) 1986ndash1991 1606 (1344ndash1867) 1605 (1364ndash1846) 1304 (1065ndash1543) 1991ndash1996 1716 (1483ndash1949) 1760 (1529ndash1992) 1817 (1454ndash2181) 1996ndash2001 2012 (1743ndash2282) 1692 (1529ndash1856) 1803 (1551ndash2055) 2001ndash2004 2211 (1937ndash2485) 2089 (1747ndash2431) 2189 (1734ndash2644) change 63 57 60 P (trend) lt01 005 003 Pooled 1759 (1650ndash1868) 1675 (1570ndash1781) 1672 (1529ndash1815)
Cancer Trends 195
Table 77 Age-standardised rates of bladder cancer by ethnic group
Bladder Age group
Cohort Total Māori SR (95 CI)
Total Pacific SR (95 CI)
Total Asian SR (95 CI)
EuropeanOther SR (95 CI)
Males 1981ndash1986 110 (49ndash170) 287 (16ndash559) 52 (07ndash371) 251 (233ndash268) 25+ years 1986ndash1991 155 (90ndash220) 84 (24ndash300) 160 (17ndash302) 277 (260ndash294)
1991ndash1996 142 (85ndash199) 234 (86ndash382) 244 (90ndash398) 297 (281ndash314) 1996ndash2001 212 (145ndash280) 131 (48ndash215) 231 (109ndash354) 325 (309ndash342) 2001ndash2004 187 (128ndash246) 87 (22ndash152) 152 (76ndash227) 340 (321ndash359) change 70 -70 192 35 P (trend) 007 048 034 lt01 Pooled 160 (132ndash188) 168 (97ndash240) 169 (112ndash225) 296 (288ndash304)
Females 1981ndash1986 35 (08ndash61) 31 (04ndash222) 74 (65ndash83) 25+ years 1986ndash1991 60 (16ndash104) 27 (04ndash190) 32 (05ndash227) 75 (67ndash83)
1991ndash1996 54 (19ndash90) 56 (02ndash111) 47 (14ndash157) 88 (80ndash97) 1996ndash2001 63 (36ndash90) 38 (14ndash103) 71 (15ndash127) 97 (89ndash106) 2001ndash2004 86 (48ndash124) 38 (00ndash76) 42 (05ndash79) 94 (85ndash103) change 146 23 27 P (trend) 002 064 003 Pooled 58 (43ndash74) 38 (15ndash61) 48 (24ndash73) 88 (84ndash92)
Table 78 Age- and ethnicity-standardised rates of bladder cancer by income group
Bladder Age group
Cohort Low income SR (95 CI)
Medium income SR (95 CI)
High income SR (95 CI)
Males 1981ndash1986 249 (204ndash295) 256 (211ndash301) 219 (177ndash261) 25+ years 1986ndash1991 273 (238ndash308) 258 (229ndash286) 236 (181ndash291)
1991ndash1996 249 (214ndash283) 314 (277ndash351) 257 (217ndash297) 1996ndash2001 324 (292ndash356) 317 (281ndash353) 280 (245ndash316) 2001ndash2004 319 (285ndash354) 339 (300ndash378) 314 (269ndash359) change 28 32 43 P (trend) 010 002 lt01 Pooled 281 (264ndash298) 295 (278ndash311) 259 (239ndash278)
Females 1981ndash1986 78 (61ndash96) 52 (39ndash66) 53 (39ndash68) 25+ years 1986ndash1991 77 (63ndash90) 66 (46ndash85) 63 (49ndash77)
1991ndash1996 89 (73ndash106) 85 (65ndash105) 91 (64ndash117) 1996ndash2001 93 (76ndash110) 95 (79ndash110) 84 (66ndash101) 2001ndash2004 95 (78ndash113) 90 (73ndash107) 89 (64ndash114) change 22 73 68 P (trend) 002 002 002 Pooled 86 (79ndash93) 77 (69ndash85) 75 (67ndash84)
196 Cancer Trends
Table 79 Age-standardised rates of brain cancer by ethnic group
Brain Age group
Cohort Total Māori SR (95 CI)
Total Pacific SR (95 CI)
Total Asian SR (95 CI)
EuropeanOther SR (95 CI)
Males 1981ndash1986 47 (17ndash78) 86 (04ndash168) 40 (06ndash287) 102 (89ndash115) 25+ years 1986ndash1991 79 (37ndash122) 24 (00ndash47) 46 (11ndash195) 98 (87ndash110)
1991ndash1996 65 (36ndash95) 70 (13ndash127) 62 (10ndash113) 104 (93ndash116) 1996ndash2001 70 (38ndash101) 104 (44ndash164) 86 (30ndash142) 113 (102ndash125) 2001ndash2004 119 (74ndash163) 70 (20ndash120) 89 (37ndash141) 111 (98ndash124) change 153 -19 123 9 P (trend) 012 024 lt01 008 Pooled 74 (58ndash90) 71 (45ndash97) 63 (35ndash92) 105 (100ndash111)
Females 1981ndash1986 26 (04ndash48) 87 (27ndash280) 63 (53ndash72) 25+ years 1986ndash1991 34 (13ndash56) 60 (20ndash175) 19 (03ndash132) 66 (57ndash76)
1991ndash1996 55 (25ndash84) 21 (05ndash80) 37 (11ndash123) 84 (74ndash95) 1996ndash2001 33 (14ndash52) 50 (05ndash94) 72 (19ndash125) 71 (62ndash81) 2001ndash2004 73 (43ndash104) 66 (24ndash109) 16 (05ndash53) 70 (60ndash81) change 181 -82 11 P (trend) 024 052 049 Pooled 43 (32ndash54) 48 (27ndash69) 48 (21ndash75) 71 (66ndash75)
Table 80 Age- and ethnicity-standardised rates of brain cancer by income group
Brain Age group
Cohort Low income SR (95 CI)
Medium income SR (95 CI)
High income SR (95 CI)
Males 1981ndash1986 81 (57ndash105) 93 (71ndash114) 94 (74ndash114) 25+ years 1986ndash1991 86 (67ndash104) 84 (67ndash101) 100 (75ndash125)
1991ndash1996 114 (89ndash140) 84 (67ndash102) 92 (73ndash110) 1996ndash2001 115 (92ndash139) 104 (84ndash124) 109 (89ndash128) 2001ndash2004 91 (69ndash113) 110 (87ndash134) 129 (104ndash154) change 12 18 37 P (trend) 040 020 012 Pooled 98 (87ndash108) 94 (85ndash103) 104 (94ndash113)
25+ years 1981ndash1986 44 (32ndash56) 69 (47ndash90) 49 (35ndash64) 1986ndash1991 55 (42ndash68) 75 (55ndash94) 39 (26ndash51) 1991ndash1996 80 (64ndash95) 80 (61ndash99) 71 (50ndash92) 1996ndash2001 68 (52ndash84) 61 (46ndash77) 60 (45ndash75) 2001ndash2004 81 (59ndash103) 67 (48ndash87) 70 (53ndash87) change 84 -3 43 P (trend) 005 044 014 Pooled 65 (58ndash72) 71 (62ndash79) 57 (50ndash65)
Cancer Trends 197
Table 81 Age-standardised rates of breast cancer by ethnic group
Breast Age group
Cohort Total Māori SR (95 CI)
Total Pacific SR (95 CI)
Total Asian SR (95 CI)
EuropeanOther SR (95 CI)
Females 1981ndash1986 123 (105ndash140) 112 (79ndash145) 699 (405ndash993) 114 (110ndash118) 25+ years 1986ndash1991 142 (126ndash157) 146 (115ndash177) 110 (76ndash144) 140 (136ndash144)
1991ndash1996 178 (162ndash194) 106 (86ndash126) 896 (675ndash112) 143 (139ndash147) 1996ndash2001 198 (184ndash212) 145 (126ndash165) 117 (99ndash135) 160 (156ndash164) 2001ndash2004 210 (194ndash225) 141 (121ndash161) 126 (110ndash142) 170 (166ndash175) change 71 25 80 49 P (trend) lt01 038 004 lt01 Pooled 168 (161ndash175) 129 (118ndash141) 101 (90ndash113) 144 (142ndash146)
25ndash44 years 1981ndash1986 389 (286ndash493) 583 (355ndash812) 560 (227ndash893) 471 (429ndash513) 1986ndash1991 668 (533ndash803) 792 (536ndash105) 205 (63ndash347) 573 (530ndash616) 1991ndash1996 715 (590ndash840) 683 (491ndash875) 493 (322ndash663) 545 (504ndash586) 1996ndash2001 758 (650ndash867) 638 (481ndash795) 557 (420ndash694) 575 (533ndash616) 2001ndash2004 661 (561ndash761) 455 (323ndash587) 552 (431ndash672) 590 (548ndash633) change 70 -22 -1 25 P (trend) 016 022 017 010 Pooled 637 (585ndash689) 639 (548ndash730) 469 (379ndash560) 549 (530ndash568)
45ndash64 years 1981ndash1986 179 (147ndash211) 184 (112ndash255) 845 (191ndash150) 171 (163ndash180) 1986ndash1991 237 (202ndash273) 281 (197ndash365) 167 (98ndash235) 219 (209ndash229) 1991ndash1996 285 (250ndash321) 145 (102ndash188) 133 (86ndash180) 226 (217ndash235) 1996ndash2001 321 (289ndash352) 240 (193ndash288) 193 (151ndash236) 265 (255ndash275) 2001ndash2004 341 (307ndash375) 236 (191ndash281) 199 (165ndash233) 285 (275ndash296) change 91 29 136 67 P (trend) lt01 051 005 lt01 Pooled 269 (254ndash284) 216 (189ndash244) 153 (128ndash178) 231 (226ndash235)
65+ years 1981ndash1986 276 (192ndash360) 152 (28ndash277) 911 (11ndash181) 232 (220ndash244) 1986ndash1991 227 (166ndash287) 192 (71ndash313) 287 (110ndash464) 280 (267ndash292) 1991ndash1996 343 (273ndash413) 212 (122ndash301) 113 (43ndash183) 282 (270ndash294) 1996ndash2001 365 (307ndash423) 264 (177ndash352) 180 (108ndash252) 303 (291ndash316) 2001ndash2004 430 (357ndash504) 284 (188ndash380) 230 (150ndash310) 326 (309ndash342) change 56 87 153 40 P (trend) 004 lt01 019 001 Pooled 323 (292ndash354) 218 (170ndash265) 178 (129ndash226) 282 (277ndash288)
198 Cancer Trends
Table 82 Age- and ethnicity-standardised rates of breast cancer by income group
Breast Age group
Cohort Low income SR (95 CI)
Medium income SR (95 CI)
High income SR (95 CI)
Females 1981ndash1986 114 (107ndash121) 122 (112ndash132) 122 (111ndash134) 25+ years 1986ndash1991 126 (119ndash133) 149 (141ndash158) 158 (147ndash170)
1991ndash1996 139 (132ndash147) 152 (144ndash159) 141 (133ndash150) 1996ndash2001 162 (155ndash170) 165 (157ndash172) 177 (169ndash186) 2001ndash2004 167 (159ndash174) 181 (171ndash190) 188 (179ndash197) change 47 48 54 P (trend) lt01 lt01 004 Pooled 140 (137ndash143) 152 (148ndash156) 156 (151ndash160)
25ndash44 years 1981ndash1986 467 (392ndash542) 477 (400ndash554) 514 (427ndash601) 1986ndash1991 557 (483ndash632) 602 (526ndash678) 612 (507ndash717) 1991ndash1996 530 (463ndash597) 593 (514ndash672) 618 (529ndash706) 1996ndash2001 565 (500ndash630) 648 (570ndash726) 677 (595ndash758) 2001ndash2004 546 (478ndash615) 614 (537ndash691) 641 (571ndash712) change 17 29 25 P (trend) 021 012 008 Pooled 532 (501ndash564) 585 (551ndash620) 611 (571ndash651)
45ndash64 years 1981ndash1986 164 (148ndash179) 188 (167ndash208) 177 (156ndash198) 1986ndash1991 198 (181ndash216) 228 (209ndash248) 274 (244ndash305) 1991ndash1996 224 (207ndash240) 230 (211ndash248) 231 (211ndash251) 1996ndash2001 267 (250ndash285) 264 (246ndash282) 297 (277ndash318) 2001ndash2004 284 (265ndash303) 289 (268ndash310) 307 (287ndash328) change 74 54 74 P (trend) lt01 lt01 004 Pooled 225 (217ndash232) 237 (228ndash246) 255 (245ndash265)
65ndash74 years 1981ndash1986 218 (188ndash248) 221 (186ndash257) 221 (174ndash268) 1986ndash1991 243 (213ndash273) 302 (264ndash339) 263 (228ndash297) 1991ndash1996 254 (221ndash287) 304 (271ndash338) 245 (209ndash281) 1996ndash2001 314 (280ndash347) 319 (285ndash354) 288 (246ndash330) 2001ndash2004 335 (293ndash376) 341 (299ndash383) 396 (343ndash450) change 54 54 79 P (trend) lt01 004 009 Pooled 269 (255ndash284) 295 (279ndash312) 277 (258ndash296)
75+ years 1981ndash1986 251 (217ndash285) 334 (208ndash461) 331 (200ndash462) 1986ndash1991 267 (225ndash308) 304 (255ndash354) 317 (222ndash412) 1991ndash1996 297 (251ndash344) 326 (284ndash367) 281 (228ndash335) 1996ndash2001 316 (269ndash364) 280 (251ndash309) 339 (286ndash393) 2001ndash2004 320 (272ndash368) 352 (297ndash407) 362 (267ndash458) change 28 5 9 P (trend) lt01 096 035 Pooled 289 (269ndash308) 317 (286ndash349) 324 (284ndash365)
Cancer Trends 199
Table 83 Age-standardised rates of cervical cancer by ethnic group
Cervix Age group
Cohort Total Māori SR (95 CI)
Total Pacific SR (95 CI)
Total Asian SR (95 CI)
EuropeanOther SR (95 CI)
Females 1981ndash1986 564 (462ndash666) 412 (228ndash595) 172 (35ndash309) 186 (169ndash202) 25+ years 1986ndash1991 423 (346ndash500) 518 (301ndash736) 205 (72ndash339) 186 (170ndash201)
1991ndash1996 406 (339ndash473) 340 (231ndash449) 145 (48ndash243) 162 (148ndash176) 1996ndash2001 328 (276ndash381) 183 (112ndash254) 190 (115ndash265) 144 (131ndash157) 2001ndash2004 236 (183ndash289) 150 (89ndash211) 179 (120ndash238) 112 (97ndash127) change -58 -64 4 -40 P (trend) lt01 003 085 lt01 Pooled 399 (366ndash433) 329 (263ndash396) 178 (130ndash227) 160 (154ndash167)
25ndash44 years 1981ndash1986 454 (346ndash562) 230 (74ndash386) 153 (52ndash451) 166 (143ndash190) 1986ndash1991 308 (228ndash389) 287 (128ndash446) 38 (09ndash155) 180 (158ndash203) 1991ndash1996 291 (221ndash362) 197 (92ndash301) 81 (13ndash150) 143 (122ndash163) 1996ndash2001 301 (228ndash373) 96 (41ndash152) 146 (65ndash228) 146 (125ndash167) 2001ndash2004 169 (120ndash219) 92 (37ndash147) 113 (59ndash167) 118 (95ndash142) change -63 -60 -26 -29 P (trend) 003 005 022 006 Pooled 311 (275ndash348) 185 (131ndash238) 106 (62ndash150) 152 (142ndash162)
45ndash64 years 1981ndash1986 728 (521ndash935) 100 (379ndash162) 262 (54ndash127) 214 (183ndash245) 1986ndash1991 646 (470ndash823) 505 (192ndash819) 446 (92ndash800) 197 (167ndash226) 1991ndash1996 586 (440ndash732) 566 (306ndash826) 203 (04ndash402) 195 (168ndash221) 1996ndash2001 462 (346ndash577) 228 (95ndash361) 233 (101ndash365) 150 (126ndash174) 2001ndash2004 270 (165ndash375) 188 (67ndash309) 219 (103ndash335) 106 (84ndash129) change -63 -81 -16 -50 P (trend) lt01 005 040 001 Pooled 552 (481ndash623) 513 (353ndash673) 275 (149ndash401) 176 (163ndash188)
65+ years 1981ndash1986 829 (336ndash132) 190 (27ndash135) 190 (27ndash135) 202 (166ndash238) 1986ndash1991 452 (124ndash779) 156 (44ndash267) 140 (20ndash995) 205 (171ndash239) 1991ndash1996 464 (233ndash696) 451 (40ndash861) 120 (17ndash849) 182 (151ndash213) 1996ndash2001 191 (75ndash307) 305 (38ndash572) 250 (73ndash852) 154 (124ndash183) 2001ndash2004 337 (131ndash543) 182 (03ndash361) 519 (82ndash957) 98 (71ndash125) change -59 -4 173 -51 P (trend) 022 062 023 002 Pooled 460 (321ndash600) 555 (285ndash824) 230 (86ndash374) 172 (157ndash186)
200 Cancer Trends
Table 84 Age-standardised rates of cervical cancer by income group
Cervix Age group
Cohort Low income SR (95 CI)
Medium income SR (95 CI)
High income SR (95 CI)
Females 1981ndash1986 291 (249ndash333) 244 (197ndash290) 208 (157ndash260) 25+ years 1986ndash1991
1991ndash1996 1996ndash2001 2001ndash2004 change P (trend) Pooled
285 (236ndash335) 235 (206ndash263) 199 (173ndash225) 132 (107ndash158)
-55 lt01
233 (217ndash250)
223 (181ndash265) 197 (165ndash228) 170 (144ndash197) 136 (107ndash165)
-44 lt01
197 (180ndash213)
232 (175ndash289) 148 (113ndash183) 142 (113ndash171) 119 (93ndash145)
-43 003
172 (153ndash192)
25ndash44 years 1981ndash1986 244 (192ndash297) 184 (142ndash226) 193 (118ndash269) 1986ndash1991 227 (182ndash271) 198 (155ndash241) 185 (101ndash268) 1991ndash1996 186 (149ndash222) 173 (131ndash216) 109 (74ndash144) 1996ndash2001 191 (152ndash229) 191 (146ndash235) 149 (106ndash192) 2001ndash2004 95 (68ndash123) 150 (106ndash193) 127 (89ndash166) change -61 -18 -34 P (trend) 002 025 050 Pooled 193 (175ndash212) 181 (161ndash200) 154 (127ndash181)
45ndash64 years 1981ndash1986 394 (290ndash498) 276 (187ndash365) 333 (172ndash494) 1986ndash1991 343 (262ndash424) 240 (177ndash303) 274 (164ndash385) 1991ndash1996 309 (253ndash366) 237 (174ndash300) 223 (133ndash313) 1996ndash2001 259 (206ndash313) 176 (127ndash226) 145 (94ndash197) 2001ndash2004 166 (112ndash219) 132 (66ndash197) 114 (74ndash154) change -58 -52 -66 P (trend) lt01 lt01 lt01 Pooled 301 (267ndash334) 216 (186ndash246) 223 (176ndash270)
65ndash74 years 1981ndash1986 1986ndash1991 1991ndash1996 1996ndash2001 2001ndash2004 change P (trend) Pooled
433 (235ndash631) 400 (219ndash582) 326 (208ndash444) 125 (73ndash177) 177 (82ndash271)
-59 011
298 (234ndash362)
489 (149ndash828) 446 (66ndash827) 257 (157ndash356) 182 (109ndash256) 134 (47ndash220)
-73 001
310 (199ndash421)
153 (78ndash228) 439 (69ndash810) 260 (52ndash468) 159 (42ndash275) 115 (35ndash194)
-25 057
231 (136ndash325)
75+ years 1981ndash1986 175 (103ndash248) 344 (94ndash126) 165 (64ndash266) 1986ndash1991 422 (146ndash121) 198 (83ndash313) 239 (37ndash442) 1991ndash1996 105 (39ndash171) 118 (70ndash167) 71 (18ndash124) 1996ndash2001 183 (44ndash322) 123 (79ndash167) 147 (59ndash234) 2001ndash2004 248 (55ndash441) 96 (36ndash156) 17 (04ndash70) change 42 -72 -90 P (trend) 084 018 008 Pooled 226 (121ndash330) 180 (81ndash278) 133 (81ndash186)
Cancer Trends 201
Table 85 Age-standardised rates of colorectal cancer by ethnic group
Colorectal Age group
Cohort Total Māori SR (95 CI)
Total Pacific SR (95 CI)
Total Asian SR (95 CI)
EuropeanOther SR (95 CI)
Males 1981ndash1986 433 (316ndash550) 311 (119ndash503) 677 (323ndash103) 906 (872ndash939) 25+ years 1986ndash1991 489 (382ndash596) 329 (94ndash565) 699 (398ndash100) 960 (928ndash992)
1991ndash1996 591 (482ndash701) 595 (382ndash809) 806 (484ndash113) 103 (100ndash106) 1996ndash2001 780 (662ndash899) 566 (417ndash714) 638 (460ndash816) 103 (100ndash107) 2001ndash2004 750 (635ndash865) 369 (232ndash506) 517 (378ndash656) 103 (100ndash106) change 73 19 -24 14 P (trend) 001 067 011 005 Pooled 602 (551ndash652) 437 (350ndash524) 675 (549ndash801) 991 (976ndash101)
25ndash64 years 1981ndash1986 204 (129ndash279) 306 (109ndash503) 296 (80ndash513) 513 (483ndash544) 1986ndash1991 354 (259ndash449) 138 (43ndash233) 418 (186ndash651) 574 (543ndash605) 1991ndash1996 320 (247ndash394) 305 (181ndash430) 393 (170ndash616) 576 (545ndash606) 1996ndash2001 392 (315ndash468) 392 (237ndash547) 351 (213ndash489) 557 (526ndash587) 2001ndash2004 388 (307ndash469) 129 (52ndash206) 205 (118ndash291) 479 (450ndash508) change 90 -58 -31 -7 P (trend) 005 069 018 058 Pooled 329 (293ndash365) 260 (197ndash324) 339 (251ndash427) 543 (529ndash556)
65+ years 1981ndash1986 188 (114ndash261) 239 (34ndash169) 257 (70ndash445) 320 (304ndash337) 1986ndash1991 135 (85ndash184) 158 (3ndash314) 227 (76ndash379) 331 (316ndash346) 1991ndash1996 220 (158ndash281) 249 (119ndash379) 319 (147ndash491) 382 (367ndash397) 1996ndash2001 294 (232ndash357) 179 (109ndash248) 240 (139ndash340) 395 (380ndash411) 2001ndash2004 317 (247ndash386) 174 (88ndash259) 229 (145ndash312) 431 (412ndash449) change 69 626 -11 34 P (trend) 005 005 053 lt01 Pooled 226 (198ndash255) 156 (108ndash204) 256 (189ndash323) 369 (362ndash376)
Females 1981ndash1986 343 (250ndash437) 445 (219ndash670) 340 (110ndash570) 794 (765ndash823) 25+ years 1986ndash1991 385 (296ndash475) 298 (127ndash469) 288 (104ndash472) 813 (785ndash841)
1991ndash1996 491 (391ndash592) 386 (240ndash532) 373 (207ndash540) 841 (814ndash868) 1996ndash2001 476 (399ndash554) 378 (263ndash494) 602 (449ndash755) 841 (814ndash867) 2001ndash2004 453 (374ndash533) 432 (310ndash554) 439 (328ndash550) 849 (820ndash878) change 32 -3 29 7 P (trend) 012 046 031 002 Pooled 428 (388ndash469) 386 (312ndash459) 407 (327ndash487) 827 (814ndash839)
25ndash64 years 1981ndash1986 251 (160ndash342) 225 (62ndash389) 106 (34ndash336) 483 (455ndash512) 1986ndash1991 247 (169ndash326) 113 (20ndash206) 182 (02ndash363) 486 (457ndash514) 1991ndash1996 267 (198ndash335) 245 (132ndash357) 239 (100ndash378) 498 (470ndash526) 1996ndash2001 272 (212ndash332) 177 (99ndash255) 334 (211ndash457) 474 (447ndash501) 2001ndash2004 316 (248ndash385) 218 (124ndash311) 232 (159ndash306) 423 (396ndash451) change 26 -3 119 -12 P (trend) 005 052 022 017 Pooled 268 (235ndash302) 194 (143ndash246) 218 (157ndash279) 475 (463ndash488)
65+ years 1981ndash1986 112 (60ndash165) 217 (60ndash374) 173 (7ndash338) 259 (247ndash272) 1986ndash1991 131 (84ndash178) 116 (30ndash203) 861 (103ndash162) 270 (259ndash282) 1991ndash1996 164 (114ndash215) 134 (41ndash226) 112 (30ndash194) 290 (278ndash301) 1996ndash2001 173 (131ndash214) 154 (89ndash218) 213 (134ndash293) 306 (294ndash318) 2001ndash2004 121 (85ndash157) 179 (108ndash250) 149 (91ndash207) 345 (329ndash361) change 8 -18 -14 33 P (trend) 080 050 039 lt01 Pooled 141 (120ndash162) 159 (113ndash205) 146 (100ndash192) 291 (286ndash297)
202 Cancer Trends
Table 86 Age- and ethnicity-standardised rates of colorectal cancer by income group
Colorectal Age group
Cohort Low income SR (95 CI)
Medium income SR (95 CI)
High income SR (95 CI)
Males 1981ndash1986 799 (739ndash859) 800 (735ndash866) 866 (769ndash963) 25+ years 1986ndash1991 864 (805ndash922) 946 (866ndash103) 885 (816ndash955)
1991ndash1996 974 (905ndash104) 961 (906ndash102) 920 (859ndash981) 1996ndash2001 921 (862ndash979) 104 (98ndash110) 103 (96ndash110) 2001ndash2004 102 (96ndash108) 933 (871ndash995) 966 (896ndash104) change 28 17 12 P (trend) 003 023 011 Pooled 910 (882ndash938) 937 (907ndash966) 932 (898ndash966)
25ndash44 years 1981ndash1986 76 (44ndash109) 79 (45ndash113) 101 (64ndash138) 1986ndash1991 75 (45ndash105) 69 (44ndash94) 74 (44ndash105) 1991ndash1996 65 (40ndash91) 78 (49ndash107) 66 (42ndash90) 1996ndash2001 91 (59ndash123) 82 (54ndash111) 85 (56ndash114) 2001ndash2004 46 (23ndash69) 68 (42ndash94) 109 (74ndash145) change -39 -14 8 P (trend) 032 079 068 Pooled 72 (59ndash85) 76 (63ndash89) 86 (72ndash100)
45ndash64 years 1981ndash1986 996 (856ndash114) 104 (90ndash119) 986 (814ndash116) 1986ndash1991 113 (100ndash126) 115 (103ndash127) 112 (98ndash126) 1991ndash1996 119 (107ndash131) 109 (98ndash120) 110 (98ndash123) 1996ndash2001 100 (88ndash113) 111 (99ndash122) 114 (102ndash125) 2001ndash2004 104 (91ndash117) 902 (785ndash102) 850 (753ndash947) change 5 -13 -14 P (trend) 085 029 034 Pooled 107 (102ndash113) 107 (101ndash112) 105 (99ndash111)
65ndash74 years 1981ndash1986 257 (222ndash292) 278 (233ndash323) 263 (218ndash309) 1986ndash1991 243 (215ndash270) 307 (242ndash372) 284 (242ndash326) 1991ndash1996 362 (318ndash407) 352 (313ndash392) 309 (269ndash349) 1996ndash2001 324 (290ndash358) 394 (359ndash429) 398 (347ndash449) 2001ndash2004 414 (369ndash460) 362 (317ndash407) 370 (321ndash418) change 61 30 40 P (trend) 006 006 003 Pooled 315 (299ndash332) 337 (316ndash359) 322 (302ndash343)
75+ years 1981ndash1986 326 (285ndash366) 298 (250ndash346) 398 (315ndash481) 1986ndash1991 367 (319ndash414) 415 (348ndash482) 362 (289ndash435) 1991ndash1996 309 (254ndash364) 406 (369ndash443) 380 (338ndash422) 1996ndash2001 411 (358ndash463) 451 (396ndash506) 415 (351ndash480) 2001ndash2004 493 (435ndash550) 442 (388ndash495) 533 (434ndash631) change 51 48 34 P (trend) 009 005 022 Pooled 375 (353ndash398) 400 (376ndash424) 412 (379ndash444)
Females 1981ndash1986 711 (663ndash758) 765 (699ndash831) 723 (650ndash796) 25+ years 1986ndash1991 724 (674ndash774) 749 (696ndash801) 750 (683ndash817)
1991ndash1996 825 (770ndash880) 775 (728ndash822) 754 (691ndash817) 1996ndash2001 772 (726ndash818) 778 (733ndash823) 783 (727ndash839) 2001ndash2004 763 (716ndash810) 810 (754ndash866) 790 (731ndash849) change 7 6 9 P (trend) 031 007 lt01 Pooled 759 (737ndash781) 774 (750ndash798) 759 (730ndash787)
Cancer Trends 203
Colorectal Age group
Cohort Low income SR (95 CI)
Medium income SR (95 CI)
High income SR (95 CI)
25ndash44 years 1981ndash1986 1986ndash1991 1991ndash1996 1996ndash2001 2001ndash2004 change P (trend) Pooled
98 (65ndash132) 90 (57ndash122) 64 (40ndash89) 79 (55ndash103) 79 (53ndash105)
-19 042
82 (69ndash95)
153 (103ndash204) 139 (98ndash180) 50 (29ndash70) 52 (32ndash73) 57 (24ndash91)
-63 018
92 (76ndash108)
121 (79ndash162) 108 (70ndash146) 67 (43ndash91) 84 (53ndash114) 83 (56ndash111)
-31 035
93 (78ndash108)
45ndash64 years 1981ndash1986 944 (820ndash107) 891 (763ndash102) 832 (719ndash945) 1986ndash1991 891 (782ndash100) 855 (764ndash947) 863 (733ndash994) 1991ndash1996 989 (891ndash109) 999 (889ndash111) 917 (793ndash104) 1996ndash2001 885 (789ndash980) 938 (836ndash104) 854 (756ndash952) 2001ndash2004 787 (688ndash886) 829 (722ndash936) 802 (704ndash900) change -17 -7 -4 P (trend) 022 092 059 Pooled 905 (857ndash953) 906 (857ndash955) 856 (805ndash908)
65ndash74 years 1981ndash1986 191 (166ndash216) 252 (196ndash309) 218 (171ndash265) 1986ndash1991 198 (171ndash226) 221 (194ndash248) 202 (172ndash231) 1991ndash1996 251 (220ndash282) 230 (204ndash256) 238 (188ndash287) 1996ndash2001 267 (237ndash296) 255 (227ndash282) 267 (226ndash308) 2001ndash2004 280 (248ndash312) 290 (255ndash326) 285 (241ndash328) change 47 15 30 P (trend) lt01 010 003 Pooled 235 (222ndash248) 248 (231ndash264) 240 (221ndash259)
75+ years 1981ndash1986 288 (259ndash317) 300 (245ndash355) 354 (266ndash443) 1986ndash1991 334 (284ndash384) 311 (271ndash352) 346 (270ndash422) 1991ndash1996 368 (315ndash422) 340 (305ndash374) 321 (276ndash367) 1996ndash2001 325 (284ndash365) 351 (319ndash383) 346 (302ndash391) 2001ndash2004 359 (322ndash395) 383 (337ndash429) 399 (338ndash460) change 25 28 13 P (trend) 010 lt01 034 Pooled 334 (314ndash353) 335 (316ndash353) 351 (321ndash381)
Table 87 Age-standardised rates of endometrial cancer by ethnic group
Endometrium Age group
Cohort Total Māori SR (95 CI)
Total Pacific SR (95 CI)
Total Asian SR (95 CI)
EuropeanOther SR (95 CI)
Females 25+ years
1981ndash1986 1986ndash1991 1991ndash1996 1996ndash2001 2001ndash2004 change P (trend) Pooled
295 (217ndash372) 289 (213ndash364) 280 (214ndash347) 317 (256ndash379) 307 (246ndash368)
4 030
297 (266ndash328)
375 (173ndash576) 477 (283ndash672) 357 (238ndash476) 482 (362ndash603) 697 (551ndash842)
86 015
467 (394ndash539)
154 (55ndash428) 212 (63ndash362) 167 (71ndash264) 205 (124ndash286) 229 (157ndash301)
49 010
192 (138ndash246)
191 (177ndash206) 163 (151ndash176) 167 (155ndash180) 191 (178ndash204) 185 (171ndash198)
-3 067
179 (173ndash185)
204 Cancer Trends
Table 88 Age- and ethnicity-standardised rates of endometrial cancer by income group
Endometrium Age group
Cohort Low income SR (95 CI)
Medium income SR (95 CI)
High income SR (95 CI)
Females 25+ years
1981ndash1986 1986ndash1991 1991ndash1996 1996ndash2001 2001ndash2004 change P (trend) Pooled
209 (177ndash240) 192 (165ndash220) 195 (169ndash221) 234 (205ndash263) 244 (214ndash274)
17 014
213 (200ndash226)
215 (178ndash253) 222 (179ndash265) 193 (163ndash222) 221 (191ndash251) 243 (206ndash279)
13 043
218 (202ndash234)
248 (187ndash310) 167 (132ndash201) 194 (156ndash233) 215 (183ndash247) 211 (178ndash245)
-15 059
207 (188ndash226)
Table 89 Age-standardised rates of gallbladder and bile duct cancer by ethnic group
Gallbladder Age group
Cohort Total Māori SR (95 CI)
Total Pacific SR (95 CI)
Total Asian SR (95 CI)
EuropeanOther SR (95 CI)
Males 1981ndash1986 36 (03ndash68) 117 (28ndash484) 30 (24ndash37) 25+ years 1986ndash1991
1991ndash1996 35 (10ndash124) 49 (17ndash81)
51 (16ndash167) 43 (06ndash308) 10 (02ndash39)
22 (17ndash27) 29 (24ndash34)
1996ndash2001 34 (09ndash59) 28 (08ndash94) 16 (05ndash53) 24 (19ndash28) 2001ndash2004 change P (trend)
25 (06ndash45) -31 026
70 (17ndash122) 34 (03ndash65) -71 048
27 (22ndash32) -10 096
Pooled 36 (22ndash51) 48 (26ndash70) 45 (05ndash84) 26 (24ndash29)
Females 1981ndash1986 27 (03ndash51) 42 (06ndash296) 33 (27ndash39) 25+ years 1986ndash1991 16 (05ndash50) 30 (25ndash35)
1991ndash1996 36 (10ndash62) 42 (15ndash121) 14 (02ndash101) 35 (30ndash40) 1996ndash2001 39 (17ndash61) 32 (10ndash102) 41 (03ndash80) 27 (22ndash32) 2001ndash2004 54 (21ndash87) 58 (12ndash105) 63 (20ndash105) 34 (28ndash40) change 100 50 3 P (trend) 009 089 Pooled 33 (23ndash44) 43 (24ndash61) 39 (15ndash62) 32 (30ndash35)
Cancer Trends 205
Table 90 Age- and ethnicity-standardised rates of gallbladder and bile duct cancer by income group
Gallbladder Age group
Cohort Low income SR (95 CI)
Medium income SR (95 CI)
High income SR (95 CI)
Males 1981ndash1986 31 (17ndash46) 27 (16ndash38) 32 (16ndash48) 25+ years 1986ndash1991 24 (07ndash41) 24 (13ndash35) 33 (14ndash52)
1991ndash1996 31 (19ndash42) 34 (22ndash47) 22 (14ndash29) 1996ndash2001 30 (18ndash43) 21 (12ndash31) 22 (14ndash29) 2001ndash2004 31 (18ndash44) 37 (22ndash51) 27 (18ndash36) change 0 37 -16 P (trend) 063 079 060 Pooled 29 (23ndash36) 28 (23ndash33) 27 (21ndash33)
Females 1981ndash1986 32 (23ndash41) 33 (16ndash51) 28 (18ndash38) 25+ years 1986ndash1991 34 (24ndash45) 23 (16ndash29) 26 (16ndash36)
1991ndash1996 34 (24ndash45) 44 (30ndash58) 29 (17ndash42) 1996ndash2001 29 (20ndash39) 30 (21ndash40) 17 (10ndash24) 2001ndash2004 47 (32ndash62) 43 (27ndash59) 38 (23ndash52) change 47 30 36 P (trend) 057 032 069 Pooled 35 (30ndash39) 34 (28ndash40) 27 (22ndash32)
Table 91 Age-standardised rates of Hodgkinrsquos disease by ethnic group
Hodgkinrsquos Age group
Cohort Total Māori SR (95 CI)
Total Pacific SR (95 CI)
Total Asian SR (95 CI)
EuropeanOther SR (95 CI)
Males 1981ndash1986 38 (10ndash66) 11 (02ndash80) 67 (15ndash292) 37 (29ndash44) 25+ years 1986ndash1991 11 (04ndash35) 33 (12ndash89) 10 (01ndash74) 31 (24ndash38)
1991ndash1996 31 (11ndash50) 15 (03ndash69) 25 (18ndash31) 1996ndash2001 25 (07ndash42) 24 (06ndash98) 21 (06ndash71) 26 (20ndash32) 2001ndash2004 35 (10ndash59) 05 (01ndash37) 32 (02ndash61) 41 (32ndash51) change -8 -55 -52 11 P (trend) 046 028 074 Pooled 28 (18ndash37) 19 (07ndash31) 29 (06ndash52) 32 (28ndash35)
Females 1981ndash1986 14 (03ndash55) 08 (01ndash54) 29 (21ndash36) 25+ years 1986ndash1991 15 (04ndash51) 28 (04ndash196) 18 (12ndash23)
1991ndash1996 05 (01ndash21) 11 (02ndash77) 21 (03ndash151) 16 (11ndash21) 1996ndash2001 12 (03ndash21) 13 (03ndash53) 37 (11ndash122) 21 (15ndash27) 2001ndash2004 22 (07ndash37) 29 (01ndash56) 27 (01ndash53) 27 (18ndash37) change 57 263 -7 P (trend) 050 089 Pooled 13 (07ndash20) 14 (05ndash23) 28 (09ndash48) 20 (17ndash23)
206 Cancer Trends
Table 92 Age- and ethnicity-standardised rates of Hodgkinrsquos disease by income group
Hodgkinrsquos Age group
Cohort Low income SR (95 CI)
Medium income SR (95 CI)
High income SR (95 CI)
Males 1981ndash1986 25 (12ndash38) 28 (17ndash39) 38 (20ndash55) 25+ years 1986ndash1991 42 (26ndash58) 22 (13ndash31) 29 (18ndash40)
1991ndash1996 16 (06ndash26) 24 (14ndash34) 27 (14ndash41) 1996ndash2001 31 (18ndash44) 29 (18ndash40) 22 (13ndash32) 2001ndash2004 49 (26ndash72) 27 (14ndash40) 47 (30ndash63) change 96 -4 24 P (trend) 074 063 098 Pooled 32 (25ndash38) 26 (21ndash31) 32 (26ndash38)
Females 1981ndash1986 30 (16ndash44) 23 (14ndash33) 26 (14ndash38) 25+ years 1986ndash1991 14 (07ndash20) 14 (07ndash20) 29 (09ndash49)
1991ndash1996 17 (09ndash25) 10 (04ndash16) 11 (05ndash18) 1996ndash2001 13 (07ndash19) 25 (13ndash36) 15 (07ndash24) 2001ndash2004 26 (15ndash38) 42 (21ndash63) 24 (09ndash40) change -13 83 -8 P (trend) 090 080 059 Pooled 20 (15ndash24) 22 (17ndash27) 21 (15ndash27)
Table 93 Age-standardised rates of kidney cancer by ethnic group
Kidney Age group
Cohort Total Māori SR (95 CI)
Total Pacific SR (95 CI)
Total Asian SR (95 CI)
EuropeanOther SR (95 CI)
Males 1981ndash1986 105 (58ndash153) 113 (27ndash482) 11 (01ndash75) 109 (98ndash121) 25+ years 1986ndash1991 116 (63ndash168) 19 (04ndash86) 69 (16ndash288) 110 (99ndash121)
1991ndash1996 146 (95ndash197) 58 (21ndash160) 74 (25ndash214) 150 (138ndash163) 1996ndash2001 146 (104ndash188) 73 (28ndash118) 84 (14ndash154) 167 (155ndash180) 2001ndash2004 140 (95ndash185) 137 (61ndash213) 85 (27ndash142) 172 (157ndash187) change 33 21 673 58 P (trend) 007 006 001 001 Pooled 130 (109ndash152) 77 (37ndash117) 64 (32ndash96) 140 (135ndash146)
Females 1981ndash1986 34 (10ndash58) 72 (26ndash197) 52 (45ndash59) 25+ years 1986ndash1991 38 (10ndash65) 61 (53ndash69)
1991ndash1996 114 (70ndash158) 29 (02ndash55) 46 (13ndash164) 70 (62ndash78) 1996ndash2001 65 (38ndash91) 50 (14ndash86) 20 (05ndash74) 89 (80ndash98) 2001ndash2004 90 (55ndash125) 64 (17ndash111) 33 (03ndash64) 97 (87ndash107) change 165 -11 87 P (trend) 013 lt01 Pooled 67 (53ndash81) 53 (31ndash75) 33 (14ndash52) 84 (80ndash88)
Cancer Trends 207
Table 94 Age- and ethnicity-standardised rates of kidney cancer by income group
Kidney Age group
Cohort Low income SR (95 CI)
Medium income SR (95 CI)
High income SR (95 CI)
Males 1981ndash1986 107 (85ndash128) 102 (79ndash126) 112 (78ndash145) 25+ years 1986ndash1991 102 (82ndash122) 136 (99ndash173) 77 (61ndash93)
1991ndash1996 136 (110ndash161) 154 (130ndash177) 157 (121ndash193) 1996ndash2001 172 (148ndash196) 145 (124ndash165) 151 (124ndash177) 2001ndash2004 168 (136ndash200) 180 (151ndash209) 163 (135ndash192) change 57 76 46 P (trend) 003 003 010 Pooled 135 (125ndash146) 142 (129ndash154) 130 (117ndash143)
25+ years 1981ndash1986 48 (34ndash61) 59 (44ndash74) 40 (24ndash55) 1986ndash1991 58 (45ndash70) 51 (40ndash63) 44 (26ndash62) 1991ndash1996 89 (69ndash110) 65 (51ndash78) 59 (40ndash78) 1996ndash2001 91 (74ndash108) 86 (70ndash101) 64 (50ndash78) 2001ndash2004 108 (88ndash128) 95 (74ndash115) 83 (60ndash106) change 125 61 108 P (trend) lt01 005 lt01 Pooled 77 (70ndash85) 70 (63ndash77) 57 (49ndash65)
Table 95 Age-standardised rates of larynx cancer by ethnic group
Larynx etc Age group
Cohort Total Māori SR (95 CI)
Total Pacific SR (95 CI)
Total Asian SR (95 CI)
EuropeanOther SR (95 CI)
Males 1981ndash1986 100 (34ndash165) 118 (36ndash383) 141 (45ndash441) 89 (79ndash99) 25+ years 1986ndash1991 41 (16ndash65) 126 (39ndash400) 181 (24ndash338) 83 (74ndash93)
1991ndash1996 84 (47ndash121) 66 (04ndash128) 76 (22ndash268) 65 (57ndash73) 1996ndash2001 62 (36ndash89) 75 (19ndash132) 72 (16ndash127) 62 (54ndash69) 2001ndash2004 118 (72ndash164) 51 (09ndash92) 69 (22ndash117) 51 (43ndash58) change 18 -57 -51 -43 P (trend) 035 007 014 lt01 Pooled 79 (60ndash98) 89 (43ndash135) 110 (57ndash163) 71 (67ndash75)
Females 1981ndash1986 33 (05ndash60) 56 (08ndash396) 14 (10ndash18) 25+ years 1986ndash1991 17 (06ndash46) 17 (02ndash123) 52 (07ndash371) 15 (12ndash19)
1991ndash1996 19 (03ndash34) 60 (02ndash118) 29 (06ndash137) 13 (10ndash17) 1996ndash2001 2001ndash2004 change P (trend)
25 (09ndash40) 25 (04ndash47)
-24 081
07 (01ndash49) 13 (03ndash55)
-77 055
12 (03ndash55) 15 (12ndash19) 10 (07ndash13)
-29 022
Pooled 24 (15ndash33) 31 (04ndash59) 31 (01ndash61) 14 (13ndash16)
208 Cancer Trends
Table 96 Age- and ethnicity-standardised rates of larynx cancer by income group
Larynx etc Age group
Cohort Low income SR (95 CI)
Medium income SR (95 CI)
High income SR (95 CI)
Males 1981ndash1986 104 (71ndash138) 93 (73ndash113) 74 (52ndash95) 25+ years 1986ndash1991
1991ndash1996 1996ndash2001 2001ndash2004 change P (trend) Pooled
97 (69ndash124) 87 (66ndash108) 74 (58ndash90) 80 (59ndash100)
-23 006
89 (78ndash100)
75 (59ndash92) 71 (55ndash86) 61 (48ndash73) 57 (41ndash72)
-39 lt01
72 (65ndash79)
55 (39ndash72) 42 (31ndash54) 41 (30ndash53) 41 (28ndash55)
-45 010
51 (44ndash58)
Females 1981ndash1986 17 (09ndash25) 11 (05ndash17) 13 (04ndash38) 25+ years 1986ndash1991 24 (15ndash33) 16 (05ndash28) 09 (04ndash14)
1991ndash1996 26 (11ndash40) 13 (07ndash19) 17 (04ndash30) 1996ndash2001 16 (10ndash23) 20 (11ndash29) 11 (05ndash16) 2001ndash2004 12 (06ndash18) 13 (06ndash20) 22 (01ndash43) change -29 18 69 P (trend) 023 043 051 Pooled 19 (15ndash24) 15 (11ndash18) 14 (09ndash20)
Table 97 Age-standardised rates of leukaemia by ethnic group
Leukaemia Age group
Cohort Total Māori SR (95 CI)
Total Pacific SR (95 CI)
Total Asian SR (95 CI)
EuropeanOther SR (95 CI)
Males 1981ndash1986 153 (84ndash222) 245 (73ndash418) 132 (119ndash146) 25+ years 1986ndash1991 119 (74ndash165) 157 (29ndash285) 226 (25ndash427) 163 (149ndash176)
1991ndash1996 182 (125ndash239) 182 (79ndash285) 180 (26ndash334) 184 (171ndash198) 1996ndash2001 248 (180ndash316) 191 (95ndash287) 185 (106ndash264) 224 (209ndash238) 2001ndash2004 267 (199ndash335) 234 (135ndash332) 118 (61ndash175) 267 (250ndash285) change 75 -4 102 P (trend) 004 051 lt01 Pooled 190 (163ndash218) 200 (144ndash256) 181 (117ndash245) 206 (199ndash212)
25ndash64 years 1981ndash1986 107 (56ndash157) 174 (45ndash303) 62 (50ndash73) 1986ndash1991 86 (47ndash124) 60 (11ndash109) 123 (06ndash239) 71 (60ndash82) 1991ndash1996 158 (97ndash220) 109 (42ndash175) 101 (13ndash188) 87 (74ndash99) 1996ndash2001 137 (96ndash179) 95 (35ndash156) 145 (76ndash213) 112 (98ndash125) 2001ndash2004 142 (96ndash188) 124 (61ndash186) 86 (38ndash135) 140 (124ndash156) change 33 -29 126 P (trend) 016 048 lt01 Pooled 125 (103ndash147) 112 (76ndash148) 116 (76ndash155) 100 (94ndash106)
65+ years 1981ndash1986 426 (73ndash780) 513 (127ndash207) 509 (445ndash572) 1986ndash1991 319 (95ndash544) 885 (233ndash337) 126 (24ndash657) 658 (593ndash723) 1991ndash1996 464 (202ndash727) 477 (10ndash944) 853 (206ndash353) 688 (629ndash747) 1996ndash2001 825 (475ndash118) 634 (168ndash110) 474 (22ndash926) 856 (787ndash925) 2001ndash2004 968 (603ndash133) 818 (272ndash137) 481 (38ndash924) 969 (885ndash105) change 127 59 90 P (trend) 005 028 lt01 Pooled 582 (442ndash722) 658 (324ndash991) 784 (200ndash137) 782 (751ndash812)
Cancer Trends 209
Leukaemia Age group
Cohort Total Māori SR (95 CI)
Total Pacific SR (95 CI)
Total Asian SR (95 CI)
EuropeanOther SR (95 CI)
Females 1981ndash1986 132 (74ndash189) 66 (20ndash213) 57 (13ndash239) 85 (75ndash94) 25+ years 1986ndash1991 110 (60ndash160) 136 (33ndash239) 97 (87ndash106)
1991ndash1996 163 (111ndash216) 148 (55ndash240) 82 (02ndash161) 120 (109ndash131) 1996ndash2001 123 (83ndash163) 151 (88ndash215) 86 (35ndash136) 130 (120ndash140) 2001ndash2004 187 (139ndash236) 138 (74ndash203) 89 (46ndash133) 161 (148ndash174) change 42 109 56 89 P (trend) 032 014 lt01 Pooled 141 (118ndash163) 127 (90ndash165) 78 (47ndash108) 122 (117ndash126)
25ndash64 years 1981ndash1986 91 (38ndash145) 75 (23ndash243) 23 (03ndash166) 43 (34ndash51) 1986ndash1991 66 (26ndash106) 103 (13ndash194) 53 (44ndash63) 1991ndash1996 119 (68ndash170) 101 (37ndash164) 38 (10ndash139) 66 (55ndash78) 1996ndash2001 100 (58ndash142) 93 (46ndash140) 84 (33ndash136) 65 (55ndash75) 2001ndash2004 121 (82ndash160) 94 (41ndash148) 65 (28ndash102) 83 (71ndash96) change 33 25 183 93 P (trend) 017 064 lt01 Pooled 98 (78ndash119) 93 (61ndash126) 52 (31ndash73) 63 (58ndash68)
65+ years 1981ndash1986 360 (93ndash626) 199 (28ndash141) 306 (264ndash348) 1986ndash1991 341 (102ndash580) 250 (60ndash104) 329 (290ndash369) 1991ndash1996 470 (184ndash755) 328 (95ndash114) 265 (66ndash106) 406 (364ndash448) 1996ndash2001 326 (142ndash509) 438 (119ndash757) 137 (19ndash973) 504 (455ndash552) 2001ndash2004 636 (347ndash924) 597 (61ndash113) 287 (17ndash557) 598 (534ndash662) change 77 44 95 P (trend) 043 lt01 Pooled 416 (303ndash530) 391 (214ndash568) 218 (68ndash368) 444 (423ndash466)
210 Cancer Trends
Table 98 Age- and ethnicity-standardised rates of leukaemia by income group
Leukaemia Age group
Cohort Low income SR (95 CI)
Medium income SR (95 CI)
High income SR (95 CI)
Males 1981ndash1986 122 (96ndash147) 132 (100ndash163) 120 (95ndash144) 25+ years 1986ndash1991 145 (122ndash169) 177 (144ndash209) 164 (133ndash195)
1991ndash1996 184 (152ndash216) 181 (156ndash206) 184 (151ndash217) 1996ndash2001 210 (182ndash238) 265 (229ndash301) 261 (218ndash303) 2001ndash2004 271 (235ndash308) 276 (241ndash312) 275 (232ndash318) change 122 109 129 P (trend) lt01 001 lt01 Pooled 182 (169ndash195) 203 (188ndash217) 197 (181ndash213)
25ndash64 years 1981ndash1986 62 (39ndash84) 52 (35ndash69) 65 (40ndash89) 1986ndash1991 74 (53ndash95) 65 (47ndash83) 85 (61ndash109) 1991ndash1996 102 (77ndash127) 87 (61ndash113) 112 (74ndash150) 1996ndash2001 102 (78ndash125) 136 (108ndash163) 128 (99ndash157) 2001ndash2004 144 (112ndash177) 160 (127ndash192) 127 (103ndash151) change 132 208 95 P (trend) 001 lt01 lt01 Pooled 94 (83ndash105) 97 (86ndash108) 102 (89ndash115)
65+ years 1981ndash1986 445 (332ndash557) 552 (353ndash750) 429 (329ndash530) 1986ndash1991 539 (427ndash650) 808 (555ndash106) 567 (431ndash704) 1991ndash1996 657 (507ndash807) 658 (552ndash764) 590 (481ndash699) 1996ndash2001 778 (646ndash910) 996 (818ndash118) 941 (739ndash114) 2001ndash2004 985 (810ndash116) 994 (812ndash118) 101 (79ndash123) change 121 80 136 P (trend) lt01 009 002 Pooled 666 (605ndash726) 792 (707ndash877) 692 (623ndash762)
Females 1981ndash1986 92 (73ndash110) 92 (65ndash118) 92 (63ndash121) 25+ years 1986ndash1991 102 (82ndash122) 105 (81ndash128) 99 (74ndash124)
1991ndash1996 118 (98ndash138) 143 (113ndash173) 125 (98ndash153) 1996ndash2001 140 (118ndash162) 117 (99ndash135) 136 (113ndash159) 2001ndash2004 173 (149ndash198) 180 (151ndash209) 149 (122ndash176) change 88 96 62 P (trend) lt01 013 lt01 Pooled 123 (113ndash132) 125 (113ndash136) 119 (107ndash131)
25ndash64 years 1981ndash1986 55 (38ndash72) 55 (21ndash89) 42 (24ndash60) 1986ndash1991 56 (39ndash73) 61 (40ndash81) 54 (35ndash72) 1991ndash1996 76 (58ndash94) 86 (53ndash119) 64 (42ndash86) 1996ndash2001 62 (46ndash77) 65 (47ndash83) 75 (52ndash98) 2001ndash2004 102 (79ndash125) 94 (70ndash118) 71 (51ndash90) change 85 71 69 P (trend) 017 018 002 Pooled 69 (61ndash77) 71 (59ndash83) 61 (52ndash70)
65+ years 1981ndash1986 286 (216ndash357) 337 (199ndash475) 332 (193ndash471) 1986ndash1991 343 (257ndash430) 351 (241ndash461) 324 (211ndash437) 1991ndash1996 370 (269ndash472) 440 (338ndash543) 443 (319ndash568) 1996ndash2001 585 (468ndash702) 401 (325ndash476) 486 (387ndash586) 2001ndash2004 601 (461ndash741) 650 (516ndash785) 598 (438ndash757) change 110 93 80 P (trend) 002 017 001 Pooled 429 (383ndash475) 425 (375ndash476) 429 (372ndash485)
Cancer Trends 211
Table 99 Age-standardised rates of lip mouth and pharynx cancer by ethnic group
Oropharynx Age group
Cohort Total Māori SR (95 CI)
Total Pacific SR (95 CI)
Total Asian SR (95 CI)
EuropeanOther SR (95 CI)
Males 1981ndash1986 93 (47ndash138) 281 (115ndash448) 277 (11ndash542) 187 (172ndash202) 25+ years 1986ndash1991 116 (71ndash160) 350 (134ndash565) 286 (99ndash474) 179 (165ndash193)
1991ndash1996 166 (106ndash226) 207 (85ndash330) 158 (46ndash270) 150 (138ndash163) 1996ndash2001 145 (101ndash189) 203 (112ndash295) 250 (134ndash365) 140 (129ndash152) 2001ndash2004 165 (117ndash213) 114 (51ndash177) 218 (134ndash303) 130 (117ndash143) change 77 -59 -21 -30 P (trend) 004 003 088 lt01 Pooled 136 (114ndash158) 237 (170ndash303) 239 (161ndash316) 159 (153ndash165)
Females 1981ndash1986 56 (22ndash89) 58 (04ndash113) 82 (28ndash242) 71 (61ndash80) 25+ years 1986ndash1991 48 (23ndash74) 108 (04ndash212) 103 (38ndash279) 74 (65ndash83)
1991ndash1996 41 (19ndash64) 56 (13ndash99) 52 (19ndash145) 57 (50ndash65) 1996ndash2001 66 (37ndash95) 69 (24ndash115) 83 (33ndash134) 61 (54ndash68) 2001ndash2004 48 (25ndash72) 99 (43ndash154) 80 (41ndash119) 68 (58ndash78) change -14 71 -2 -4 P (trend) 093 034 083 045 Pooled 52 (40ndash64) 77 (48ndash106) 80 (47ndash113) 66 (62ndash70)
Table 100 Age- and ethnicity-standardised rates of lip mouth and pharynx cancer by income group
Oropharynx Age group
Cohort Low income SR (95 CI)
Medium income SR (95 CI)
High income SR (95 CI)
Males 1981ndash1986 211 (178ndash244) 189 (156ndash222) 136 (103ndash169) 25+ years 1986ndash1991
1991ndash1996 1996ndash2001 2001ndash2004 change P (trend) Pooled
219 (188ndash250) 207 (171ndash244) 174 (148ndash200) 193 (164ndash222)
-9 017
201 (187ndash215)
175 (148ndash202) 144 (117ndash171) 156 (130ndash181) 122 (97ndash147)
-35 003
159 (146ndash172)
157 (119ndash195) 121 (96ndash146) 124 (97ndash152) 100 (78ndash123)
-26 008
129 (115ndash143)
Females 1981ndash1986 81 (64ndash98) 47 (34ndash59) 75 (49ndash101) 25+ years 1986ndash1991 83 (68ndash98) 75 (50ndash101) 58 (40ndash76)
1991ndash1996 72 (55ndash89) 50 (38ndash61) 42 (31ndash53) 1996ndash2001 68 (54ndash82) 67 (51ndash83) 57 (40ndash74) 2001ndash2004 76 (59ndash92) 65 (47ndash83) 64 (44ndash83) change -6 38 -15 P (trend) 023 027 095 Pooled 76 (69ndash83) 61 (53ndash68) 59 (50ndash67)
212 Cancer Trends
Table 101 Age-standardised rates of liver cancer by ethnic group
Liver Age group
Cohort Total Māori SR (95 CI)
Total Pacific SR (95 CI)
Total Asian SR (95 CI)
EuropeanOther SR (95 CI)
Males 1981ndash1986 126 (76ndash177) 237 (124ndash350) 65 (15ndash277) 29 (23ndash35) 25+ years 1986ndash1991 205 (141ndash268) 389 (217ndash561) 180 (43ndash317) 40 (34ndash47)
1991ndash1996 190 (135ndash245) 256 (136ndash376) 357 (168ndash545) 40 (34ndash46) 1996ndash2001 229 (177ndash281) 301 (202ndash401) 231 (131ndash331) 46 (40ndash52) 2001ndash2004 239 (183ndash295) 341 (227ndash455) 238 (149ndash327) 52 (45ndash60) change 90 44 266 79 P (trend) 003 034 012 lt01 Pooled 196 (171ndash221) 303 (246ndash360) 213 (154ndash272) 41 (38ndash44)
Females 1981ndash1986 80 (33ndash128) 67 (22ndash208) 17 (13ndash22) 25+ years 1986ndash1991 37 (12ndash63) 117 (08ndash226) 41 (09ndash186) 18 (14ndash22)
1991ndash1996 67 (34ndash100) 99 (38ndash159) 61 (20ndash187) 20 (16ndash25) 1996ndash2001 62 (36ndash88) 71 (24ndash118) 78 (20ndash137) 25 (20ndash29) 2001ndash2004 61 (33ndash89) 145 (74ndash215) 81 (31ndash130) 22 (18ndash27) change -24 116 29 P (trend) 065 047 007 Pooled 61 (46ndash76) 98 (64ndash132) 64 (37ndash92) 21 (19ndash23)
Table 102 Age- and ethnicity-standardised rates of liver cancer by income group
Liver Age group
Cohort Low income SR (95 CI)
Medium income SR (95 CI)
High income SR (95 CI)
Males 1981ndash1986 36 (22ndash51) 65 (41ndash89) 38 (21ndash54) 25+ years 1986ndash1991 79 (57ndash101) 64 (45ndash84) 109 (60ndash158)
1991ndash1996 84 (59ndash109) 79 (56ndash102) 65 (42ndash87) 1996ndash2001 97 (77ndash117) 89 (68ndash109) 69 (48ndash90) 2001ndash2004 115 (91ndash139) 118 (88ndash149) 72 (50ndash94) change 219 82 89 P (trend) lt01 002 017 Pooled 81 (71ndash90) 81 (71ndash92) 71 (57ndash84)
Females 1981ndash1986 32 (19ndash45) 24 (11ndash37) 21 (08ndash59) 25+ years 1986ndash1991 31 (18ndash43) 26 (14ndash38) 22 (08ndash64)
1991ndash1996 36 (24ndash49) 40 (24ndash55) 29 (13ndash45) 1996ndash2001 47 (31ndash63) 29 (19ndash38) 35 (17ndash53) 2001ndash2004 29 (19ndash39) 49 (31ndash67) 16 (08ndash25) change -9 104 -24 P (trend) 099 023 046 Pooled 35 (29ndash41) 33 (27ndash39) 25 (17ndash34)
Cancer Trends 213
Table 103 Age-standardised rates of lung cancer by ethnic group
Lung Age group
Cohort Total Māori SR (95 CI)
Total Pacific SR (95 CI)
Total Asian SR (95 CI)
EuropeanOther SR (95 CI)
Males 1981ndash1986 163 (140ndash185) 730 (375ndash109) 611 (274ndash948) 940 (907ndash973) 25+ years 1986ndash1991 157 (136ndash177) 139 (99ndash179) 896 (502ndash129) 850 (821ndash879)
1991ndash1996 173 (154ndash192) 113 (84ndash142) 463 (250ndash676) 808 (781ndash836) 1996ndash2001 151 (136ndash167) 124 (101ndash146) 572 (398ndash746) 691 (667ndash715) 2001ndash2004 147 (131ndash163) 926 (721ndash113) 482 (337ndash627) 638 (613ndash663) change -10 27 -21 -32 P (trend) 025 099 036 lt01 Pooled 159 (150ndash167) 109 (95ndash123) 611 (486ndash736) 793 (780ndash805)
25ndash64 years 1981ndash1986 928 (756ndash110) 404 (153ndash656) 250 (28ndash473) 480 (451ndash509) 1986ndash1991 865 (723ndash101) 985 (637ndash133) 518 (165ndash871) 432 (406ndash458) 1991ndash1996 107 (92ndash123) 698 (492ndash904) 144 (16ndash273) 357 (333ndash381) 1996ndash2001 868 (748ndash988) 585 (424ndash745) 279 (155ndash403) 285 (263ndash306) 2001ndash2004 743 (631ndash855) 360 (236ndash484) 170 (97ndash243) 236 (217ndash256) change -20 -11 -32 -51 P (trend) 029 040 053 lt01 Pooled 903 (838ndash968) 619 (511ndash726) 277 (181ndash373) 364 (353ndash375)
65+ years 1981ndash1986 606 (479ndash733) 249 (65ndash433) 281 (66ndash496) 373 (356ndash390) 1986ndash1991 560 (450ndash669) 511 (267ndash756) 327 (126ndash529) 343 (329ndash358) 1991ndash1996 608 (509ndash708) 393 (231ndash556) 259 (112ndash406) 341 (327ndash355) 1996ndash2001 554 (475ndash632) 476 (357ndash595) 206 (119ndash293) 302 (290ndash315) 2001ndash2004 605 (512ndash698) 457 (318ndash596) 216 (132ndash301) 293 (278ndash308) change -0 84 -23 -21 P (trend) 096 017 011 lt01 Pooled 586 (539ndash632) 415 (335ndash495) 260 (187ndash333) 332 (326ndash339)
Females 1981ndash1986 753 (609ndash897) 168 (49ndash286) 227 (57ndash397) 252 (236ndash268) 25+ years 1986ndash1991 109 (94ndash124) 381 (192ndash570) 349 (149ndash548) 305 (288ndash321)
1991ndash1996 125 (109ndash140) 312 (180ndash445) 307 (158ndash455) 362 (344ndash380) 1996ndash2001 121 (109ndash132) 423 (306ndash541) 225 (132ndash318) 362 (345ndash380) 2001ndash2004 133 (120ndash147) 579 (435ndash723) 328 (230ndash427) 390 (371ndash410) change 77 245 44 55 P (trend) 004 002 066 001 Pooled 112 (105ndash118) 362 (298ndash426) 285 (217ndash353) 331 (324ndash339)
25ndash64 years 1981ndash1986 525 (390ndash660) 123 (32ndash215) 139 (00ndash278) 158 (142ndash175) 1986ndash1991 692 (566ndash818) 196 (80ndash311) 71 (01ndash140) 181 (164ndash198) 1991ndash1996 811 (688ndash934) 151 (62ndash240) 276 (110ndash443) 207 (188ndash225) 1996ndash2001 737 (636ndash838) 243 (153ndash334) 102 (32ndash172) 196 (178ndash213) 2001ndash2004 874 (756ndash991) 306 (191ndash420) 133 (72ndash195) 216 (197ndash234) change 66 149 -4 37 P (trend) 006 005 063 003 Pooled 720 (666ndash775) 199 (154ndash243) 145 (94ndash196) 190 (183ndash198)
65+ years 1981ndash1986 259 (180ndash339) 452 (113ndash181) 578 (186ndash180) 865 (791ndash940) 1986ndash1991 405 (317ndash492) 116 (28ndash203) 158 (53ndash262) 110 (102ndash118) 1991ndash1996 406 (328ndash484) 123 (51ndash194) 701 (75ndash133) 134 (126ndash143) 1996ndash2001 440 (376ndash504) 132 (77ndash188) 956 (396ndash152) 138 (130ndash146) 2001ndash2004 471 (393ndash548) 201 (131ndash272) 134 (80ndash187) 144 (134ndash154) change 81 345 131 67 P (trend) 003 002 025 001 Pooled 392 (358ndash427) 119 (88ndash151) 101 (69ndash134) 122 (118ndash125)
214 Cancer Trends
Table 104 Age- and ethnicity-standardised rates of lung cancer by income group
Lung Age group
Cohort Low income SR (95 CI)
Medium income SR (95 CI)
High income SR (95 CI)
Males 1981ndash1986 126 (116ndash135) 959 (862ndash106) 913 (812ndash101) 25+ years 1986ndash1991
1991ndash1996 1996ndash2001 2001ndash2004 change P (trend) Pooled
113 (105ndash122) 109 (101ndash117) 105 (98ndash112)
979 (907ndash105) -22 lt01
111 (107ndash114)
107 (97ndash118) 994 (928ndash106) 908 (844ndash973) 804 (732ndash876)
-16 011
955 (918ndash992)
743 (653ndash832) 754 (659ndash849) 542 (490ndash594) 557 (494ndash621)
-39 003
709 (671ndash747)
25ndash64 years 1981ndash1986 658 (576ndash739) 511 (439ndash583) 490 (416ndash564) 1986ndash1991 565 (501ndash628) 564 (498ndash630) 389 (320ndash457) 1991ndash1996 580 (520ndash640) 459 (403ndash515) 350 (279ndash422) 1996ndash2001 467 (416ndash518) 436 (377ndash495) 236 (195ndash278) 2001ndash2004 452 (394ndash510) 299 (254ndash345) 208 (171ndash244) change -31 -41 -58 P (trend) 002 003 lt01 Pooled 549 (520ndash578) 462 (434ndash489) 341 (313ndash369)
65ndash74 years 1981ndash1986 493 (420ndash566) 364 (302ndash425) 340 (279ndash402) 1986ndash1991 458 (396ndash521) 443 (355ndash531) 287 (228ndash346) 1991ndash1996 426 (374ndash477) 396 (354ndash439) 288 (224ndash351) 1996ndash2001 417 (373ndash462) 333 (295ndash371) 197 (165ndash229) 2001ndash2004 406 (357ndash456) 325 (275ndash374) 211 (174ndash248) change -18 -11 -38 P (trend) 001 023 004 Pooled 442 (416ndash468) 375 (348ndash401) 267 (243ndash291)
75+ years 1981ndash1986 503 (437ndash570) 356 (271ndash442) 382 (280ndash484) 1986ndash1991 500 (420ndash579) 449 (357ndash541) 286 (225ndash347) 1991ndash1996 453 (376ndash530) 436 (381ndash491) 371 (280ndash462) 1996ndash2001 508 (434ndash581) 449 (383ndash514) 327 (258ndash395) 2001ndash2004 462 (392ndash531) 470 (386ndash553) 366 (276ndash455) change -8 32 -4 P (trend) 039 008 068 Pooled 486 (453ndash520) 430 (395ndash465) 345 (308ndash383)
Females 1981ndash1986 332 (293ndash371) 271 (220ndash321) 275 (213ndash336) 25+ years 1986ndash1991 448 (401ndash495) 432 (378ndash487) 351 (285ndash417)
1991ndash1996 565 (518ndash612) 433 (387ndash479) 456 (369ndash543) 1996ndash2001 569 (524ndash614) 456 (415ndash497) 358 (315ndash402) 2001ndash2004 618 (570ndash666) 488 (434ndash542) 427 (370ndash483) change 86 80 55 P (trend) 001 005 015 Pooled 501 (481ndash521) 412 (390ndash434) 371 (341ndash400)
25ndash64 years 1981ndash1986 206 (166ndash246) 216 (167ndash264) 173 (116ndash230) 1986ndash1991 259 (220ndash297) 269 (224ndash314) 183 (139ndash227) 1991ndash1996 350 (310ndash390) 265 (220ndash311) 200 (151ndash249) 1996ndash2001 324 (287ndash362) 254 (213ndash294) 208 (166ndash250) 2001ndash2004 366 (322ndash410) 261 (219ndash303) 274 (221ndash327) change 78 21 58 P (trend) 004 038 004 Pooled 298 (280ndash316) 253 (233ndash273) 204 (182ndash226)
Cancer Trends 215
Lung Age group
Cohort Low income SR (95 CI)
Medium income SR (95 CI)
High income SR (95 CI)
65ndash74 years 1981ndash1986 127 (103ndash152) 740 (409ndash107) 949 (644ndash125) 1986ndash1991 177 (148ndash206) 158 (121ndash195) 179 (113ndash245) 1991ndash1996 202 (173ndash231) 153 (126ndash181) 165 (113ndash217) 1996ndash2001 211 (183ndash239) 207 (175ndash238) 121 (94ndash149) 2001ndash2004 219 (186ndash251) 198 (157ndash238) 134 (97ndash171) change 72 167 41 P (trend) 002 003 047 Pooled 186 (173ndash198) 156 (141ndash171) 139 (119ndash160)
75+ years 1981ndash1986 104 (73ndash135) 674 (321ndash103) 882 (384ndash138) 1986ndash1991 138 (93ndash183) 140 (95ndash184) 116 (65ndash168) 1991ndash1996 183 (142ndash225) 144 (113ndash175) 246 (152ndash340) 1996ndash2001 218 (169ndash267) 136 (113ndash160) 141 (105ndash177) 2001ndash2004 279 (225ndash334) 193 (142ndash243) 186 (126ndash246) change 170 186 111 P (trend) lt01 008 019 Pooled 180 (160ndash199) 133 (117ndash150) 154 (126ndash182)
Table 105 Age-standardised rates of melanoma by ethnic group
Melanoma Age group
Cohort Total Māori SR (95 CI)
Total Pacific SR (95 CI)
Total Asian SR (95 CI)
EuropeanOther SR (95 CI)
Males 1981ndash1986 116 (59ndash172) 46 (13ndash161) 147 (14ndash280) 325 (304ndash347) 25+ years 1986ndash1991 97 (45ndash149) 105 (22ndash496) 23 (06ndash91) 441 (417ndash465)
1991ndash1996 86 (49ndash123) 55 (04ndash106) 23 (07ndash73) 611 (584ndash637) 1996ndash2001 137 (97ndash177) 73 (25ndash121) 60 (14ndash107) 737 (708ndash766) 2001ndash2004 137 (89ndash185) 46 (04ndash88) 66 (26ndash106) 833 (800ndash866) change 18 0 -55 156 P (trend) 032 100 035 lt01 Pooled 113 (92ndash135) 66 (26ndash106) 64 (32ndash95) 577 (565ndash589)
25ndash44 years 1981ndash1986 57 (20ndash95) 52 (12ndash221) 232 (68ndash792) 202 (175ndash229) 1986ndash1991 48 (05ndash92) 12 (02ndash83) 40 (10ndash159) 262 (231ndash292) 1991ndash1996 59 (24ndash94) 10 (01ndash72) 10 (01ndash68) 275 (244ndash305) 1996ndash2001 67 (26ndash109) 07 (01ndash51) 29 (09ndash99) 295 (262ndash329) 2001ndash2004 72 (33ndash112) 15 (02ndash109) 55 (02ndash108) 271 (236ndash305) change 26 -71 -76 34 P (trend) 008 053 057 010 Pooled 60 (42ndash78) 19 (01ndash37) 74 (12ndash136) 261 (247ndash274)
45ndash64 years 1981ndash1986 152 (35ndash268) 64 (09ndash453) 170 (42ndash697) 404 (361ndash447) 1986ndash1991 65 (10ndash119) 544 (495ndash592) 1991ndash1996 77 (12ndash142) 70 (17ndash287) 43 (11ndash173) 772 (717ndash827) 1996ndash2001 176 (102ndash250) 127 (13ndash240) 79 (03ndash154) 889 (830ndash947) 2001ndash2004 141 (67ndash215) 56 (13ndash243) 73 (05ndash141) 105 (98ndash112) change -7 -13 -57 160 P (trend) 030 lt01 Pooled 121 (85ndash157) 81 (32ndash129) 92 (30ndash155) 762 (737ndash787)
216 Cancer Trends
Melanoma Age group
Cohort Total Māori SR (95 CI)
Total Pacific SR (95 CI)
Total Asian SR (95 CI)
EuropeanOther SR (95 CI)
65+ years 1981ndash1986 206 (68ndash625) 554 (488ndash619) 1986ndash1991 310 (55ndash565) 655 (150ndash286) 884 (808ndash961) 1991ndash1996 236 (56ndash417) 247 (59ndash103) 140 (131ndash149) 1996ndash2001 284 (126ndash442) 224 (69ndash728) 98 (14ndash699) 188 (178ndash199) 2001ndash2004 362 (113ndash610) 127 (31ndash512) 73 (18ndash291) 224 (211ndash237) change 76 304 P (trend) 017 lt01 Pooled 275 (179ndash372) 325 (72ndash578) 87 (15ndash159) 204 (199ndash209)
Females 1981ndash1986 99 (54ndash143) 43 (11ndash179) 65 (15ndash285) 440 (414ndash465) 25+ years 1986ndash1991 110 (64ndash156) 13 (03ndash57) 131 (24ndash238) 542 (515ndash569)
1991ndash1996 101 (65ndash137) 73 (11ndash135) 146 (53ndash239) 605 (577ndash632) 1996ndash2001 157 (116ndash199) 91 (38ndash143) 63 (26ndash101) 666 (639ndash693) 2001ndash2004 161 (118ndash204) 70 (22ndash118) 25 (04ndash47) 792 (758ndash827) change 63 63 -62 80 P (trend) 007 012 011 lt01 Pooled 124 (105ndash143) 57 (34ndash81) 89 (52ndash126) 600 (587ndash612)
25ndash44 years 1981ndash1986 90 (41ndash139) 65 (09ndash459) 378 (340ndash415) 1986ndash1991 76 (35ndash117) 08 (01ndash56) 151 (02ndash301) 431 (391ndash470) 1991ndash1996 84 (41ndash128) 39 (05ndash73) 101 (37ndash280) 406 (369ndash443) 1996ndash2001 100 (62ndash139) 58 (00ndash115) 60 (10ndash110) 410 (374ndash446) 2001ndash2004 84 (44ndash123) 13 (03ndash50) 25 (00ndash51) 476 (429ndash523) change -7 -62 26 P (trend) 065 008 018 Pooled 87 (68ndash106) 31 (14ndash47) 83 (35ndash131) 417 (400ndash435)
45ndash64 years 1981ndash1986 59 (12ndash106) 108 (26ndash445) 111 (16ndash788) 511 (462ndash559) 1986ndash1991 93 (21ndash165) 46 (07ndash329) 155 (38ndash621) 645 (593ndash697) 1991ndash1996 111 (42ndash180) 183 (60ndash558) 767 (712ndash822) 1996ndash2001 178 (109ndash248) 85 (09ndash161) 98 (18ndash177) 860 (804ndash916) 2001ndash2004 246 (153ndash339) 88 (03ndash174) 976 (912ndash104) change 317 -19 91 P (trend) lt01 lt01 Pooled 132 (101ndash163) 81 (33ndash130) 137 (51ndash223) 696 (671ndash720)
65+ years 1981ndash1986 142 (45ndash451) 521 (463ndash580) 1986ndash1991 214 (25ndash404) 748 (683ndash814) 1991ndash1996 197 (32ndash362) 382 (111ndash131) 266 (61ndash117) 983 (911ndash106) 1996ndash2001 266 (100ndash431) 128 (41ndash401) 121 (113ndash129) 2001ndash2004 265 (90ndash440) 198 (63ndash618) 118 (27ndash505) 153 (142ndash164) change 87 193 P (trend) 003 lt01 Pooled 214 (137ndash292) 239 (95ndash383) 202 (59ndash345) 122 (118ndash126)
Notes Due to a 50 percent increase in melanoma registrations around 1994 (owing to changes introduced by the Cancer Registry Act 1993) the percentage increases in the table are overstated P values are not reliable and have therefore been suppressed The changes can be adjusted for by increasing the 1981ndash1986 and 1986ndash1991 rates by about 50 percent and probably disregarding 1991ndash1996 to gain an impression of change over time Trends in absolute inequalities over time are not interpretable hence pooled SRs and p for trends are not shown
Cancer Trends 217
Table 106 Age- and ethnicity-standardised rates of melanoma by income group
Melanoma Age group
Cohort Low income SR (95 CI)
Medium income SR (95 CI)
High income SR (95 CI)
Males 1981ndash1986 223 (188ndash258) 285 (250ndash321) 369 (326ndash412) 25+ years 1986ndash1991 365 (302ndash428) 361 (320ndash402) 431 (388ndash473)
1991ndash1996 400 (357ndash443) 504 (465ndash543) 582 (535ndash628) 1996ndash2001 544 (497ndash591) 625 (579ndash671) 688 (642ndash735) 2001ndash2004 556 (504ndash607) 654 (600ndash709) 806 (757ndash856) change 149 129 118 P (trend) lt01 lt01 lt01 Pooled 411 (389ndash433) 477 (458ndash496) 564 (543ndash584)
25ndash44 years 1981ndash1986 136 (93ndash180) 178 (139ndash216) 223 (174ndash273) 1986ndash1991 194 (146ndash242) 230 (184ndash276) 239 (187ndash290) 1991ndash1996 194 (147ndash241) 225 (180ndash270) 247 (202ndash292) 1996ndash2001 210 (157ndash262) 264 (209ndash319) 256 (209ndash303) 2001ndash2004 185 (131ndash238) 216 (157ndash275) 229 (187ndash271) change 36 21 3 P (trend) 020 021 070 Pooled 184 (162ndash206) 223 (201ndash245) 239 (218ndash261)
45ndash64 years 1981ndash1986 251 (185ndash316) 371 (283ndash458) 472 (379ndash564) 1986ndash1991 419 (334ndash505) 415 (351ndash479) 502 (425ndash579) 1991ndash1996 556 (471ndash642) 589 (509ndash669) 747 (646ndash847) 1996ndash2001 659 (564ndash755) 766 (672ndash859) 793 (710ndash877) 2001ndash2004 651 (555ndash748) 701 (601ndash801) 106 (95ndash116) change 159 89 124 P (trend) lt01 002 lt01 Pooled 500 (462ndash538) 562 (524ndash600) 697 (656ndash737)
65ndash74 years 1981ndash1986 429 (310ndash549) 500 (354ndash647) 512 (388ndash636) 1986ndash1991 674 (527ndash821) 593 (458ndash729) 991 (740ndash124) 1991ndash1996 839 (627ndash105) 123 (106ndash140) 138 (110ndash166) 1996ndash2001 113 (95ndash130) 142 (123ndash161) 187 (161ndash213) 2001ndash2004 117 (95ndash138) 180 (152ndash208) 208 (180ndash236) change 172 260 306 P (trend) lt01 lt01 lt01 Pooled 831 (753ndash909) 107 (99ndash116) 133 (122ndash144)
75+ years 1981ndash1986 421 (231ndash610) 469 (276ndash663) 807 (548ndash107) 1986ndash1991 111 (46ndash177) 110 (58ndash163) 961 (727ndash120) 1991ndash1996 882 (598ndash117) 132 (114ndash150) 130 (106ndash154) 1996ndash2001 188 (157ndash218) 176 (156ndash196) 211 (172ndash250) 2001ndash2004 206 (170ndash241) 256 (215ndash297) 260 (220ndash300) change 388 446 222 P (trend) 001 lt01 001 Pooled 123 (105ndash141) 139 (124ndash153) 150 (137ndash164)
Females 1981ndash1986 327 (291ndash364) 384 (341ndash427) 433 (384ndash481) 25+ years 1986ndash1991 418 (379ndash457) 453 (412ndash495) 517 (464ndash569)
1991ndash1996 449 (409ndash489) 528 (484ndash572) 543 (497ndash589) 1996ndash2001 503 (465ndash542) 577 (533ndash621) 607 (557ndash657) 2001ndash2004 513 (467ndash558) 680 (625ndash734) 722 (670ndash774) change 57 77 67 P (trend) lt01 lt01 lt01 Pooled 438 (421ndash456) 517 (497ndash537) 557 (534ndash579)
218 Cancer Trends
Melanoma Age group
Cohort Low income SR (95 CI)
Medium income SR (95 CI)
High income SR (95 CI)
25ndash44 years 1981ndash1986 238 (189ndash288) 370 (308ndash433) 383 (315ndash452) 1986ndash1991 296 (243ndash348) 370 (312ndash428) 415 (343ndash486) 1991ndash1996 276 (224ndash327) 367 (307ndash428) 381 (323ndash439) 1996ndash2001 295 (246ndash343) 360 (300ndash419) 380 (324ndash436) 2001ndash2004 286 (226ndash346) 387 (316ndash459) 389 (327ndash451) change 20 5 2 P (trend) 022 067 069 Pooled 278 (255ndash301) 370 (342ndash398) 390 (361ndash418)
45ndash64 years 1981ndash1986 418 (340ndash497) 359 (291ndash428) 469 (384ndash554) 1986ndash1991 577 (486ndash668) 477 (406ndash547) 594 (491ndash696) 1991ndash1996 632 (547ndash717) 608 (525ndash691) 641 (557ndash725) 1996ndash2001 631 (552ndash710) 663 (579ndash747) 798 (705ndash892) 2001ndash2004 652 (560ndash744) 852 (743ndash960) 915 (815ndash102) change 56 137 95 P (trend) 005 lt01 lt01 Pooled 579 (540ndash617) 579 (542ndash615) 672 (630ndash713)
65ndash74 years 1981ndash1986 432 (330ndash534) 454 (262ndash647) 582 (441ndash723) 1986ndash1991 536 (422ndash650) 724 (596ndash853) 782 (622ndash943) 1991ndash1996 690 (546ndash833) 978 (797ndash116) 100 (73ndash128) 1996ndash2001 970 (815ndash113) 109 (92ndash125) 803 (637ndash969) 2001ndash2004 102 (83ndash121) 137 (113ndash160) 141 (117ndash166) change 135 201 143 P (trend) lt01 lt01 009 Pooled 715 (652ndash777) 900 (820ndash980) 892 (802ndash982)
75+ years 1981ndash1986 469 (326ndash612) 463 (299ndash628) 343 (199ndash486) 1986ndash1991 621 (453ndash789) 838 (440ndash124) 581 (417ndash745) 1991ndash1996 738 (572ndash905) 887 (754ndash102) 882 (687ndash108) 1996ndash2001 101 (81ndash120) 122 (106ndash138) 135 (99ndash171) 2001ndash2004 115 (95ndash134) 146 (122ndash170) 156 (124ndash188) change 144 215 355 P (trend) lt01 lt01 lt01 Pooled 779 (701ndash856) 948 (841ndash106) 912 (802ndash102)
Note The same caveats apply to interpreting the data contained in this table as apply to Table 105 above
Cancer Trends 219
Table 107 Age-standardised rates of myeloma by ethnic group
Myeloma Age group
Cohort Total Māori SR (95 CI)
Total Pacific SR (95 CI)
Total Asian SR (95 CI)
EuropeanOther SR (95 CI)
Males 1981ndash1986 107 (34ndash181) 179 (30ndash327) 58 (08ndash409) 75 (65ndash85) 25+ years 1986ndash1991 117 (62ndash171) 157 (00ndash315) 09 (01ndash66) 70 (61ndash79)
1991ndash1996 89 (48ndash130) 214 (59ndash368) 76 (23ndash254) 83 (74ndash92) 1996ndash2001 216 (151ndash281) 184 (77ndash290) 65 (08ndash122) 95 (85ndash104) 2001ndash2004 147 (96ndash197) 215 (117ndash313) 29 (08ndash99) 103 (92ndash113) change 37 20 -50 37 P (trend) 037 021 034 002 Pooled 135 (108ndash161) 189 (126ndash251) 48 (15ndash82) 84 (80ndash88)
Females 1981ndash1986 52 (17ndash88) 08 (01ndash58) 45 (06ndash317) 46 (39ndash53) 25+ years 1986ndash1991 99 (45ndash153) 72 (01ndash143) 47 (41ndash54)
1991ndash1996 109 (60ndash158) 128 (46ndash209) 65 (21ndash200) 57 (50ndash64) 1996ndash2001 77 (45ndash108) 148 (80ndash217) 81 (25ndash136) 58 (51ndash64) 2001ndash2004 101 (64ndash138) 81 (32ndash131) 66 (23ndash109) 58 (50ndash65) change 94 913 47 26 P (trend) 025 007 003 Pooled 87 (68ndash106) 88 (59ndash116) 64 (33ndash95) 55 (51ndash58)
Table 108 Age- and ethnicity-standardised rates of myeloma by income group
Myeloma Age group
Cohort Low income SR (95 CI)
Medium income SR (95 CI)
High income SR (95 CI)
Males 1981ndash1986 83 (61ndash105) 78 (52ndash105) 123 (56ndash190) 25+ years 1986ndash1991 73 (55ndash92) 78 (45ndash111) 98 (55ndash142)
1991ndash1996 88 (65ndash112) 108 (75ndash141) 92 (69ndash115) 1996ndash2001 103 (81ndash125) 125 (99ndash151) 150 (99ndash201) 2001ndash2004 110 (88ndash132) 117 (93ndash140) 133 (92ndash173) change 33 50 8 P (trend) 005 004 034 Pooled 90 (81ndash100) 100 (87ndash114) 119 (97ndash140)
Females 1981ndash1986 46 (34ndash58) 33 (21ndash45) 58 (39ndash78) 25+ years 1986ndash1991 54 (39ndash70) 49 (34ndash64) 92 (49ndash135)
1991ndash1996 71 (53ndash88) 66 (48ndash83) 79 (44ndash114) 1996ndash2001 70 (53ndash88) 50 (39ndash62) 65 (48ndash81) 2001ndash2004 69 (54ndash84) 70 (53ndash86) 65 (48ndash83) change 50 112 12 P (trend) 004 010 080 Pooled 62 (55ndash69) 53 (46ndash59) 72 (59ndash85)
220 Cancer Trends
Table 109 Age-standardised rates of non-Hodgkinrsquos lymphoma by ethnic group
NHL Age group
Cohort Total Māori SR (95 CI)
Total Pacific SR (95 CI)
Total Asian SR (95 CI)
EuropeanOther SR (95 CI)
Males 1981ndash1986 127 (70ndash183) 299 (56ndash160) 100 (24ndash418) 134 (120ndash147) 25+ years 1986ndash1991 126 (74ndash179) 212 (82ndash341) 64 (19ndash220) 170 (156ndash184)
1991ndash1996 182 (109ndash255) 182 (55ndash308) 186 (54ndash319) 205 (190ndash220) 1996ndash2001 197 (150ndash245) 261 (155ndash367) 201 (107ndash295) 247 (231ndash263) 2001ndash2004 239 (170ndash308) 128 (60ndash197) 132 (59ndash204) 256 (237ndash275) change 88 -57 32 91 P (trend) lt01 026 034 lt01 Pooled 171 (144ndash198) 221 (106ndash335) 137 (87ndash187) 200 (193ndash207)
Females 1981ndash1986 113 (54ndash172) 37 (09ndash148) 95 (85ndash105) 25+ years 1986ndash1991 119 (63ndash175) 193 (58ndash329) 102 (11ndash193) 119 (108ndash130)
1991ndash1996 118 (75ndash160) 180 (82ndash278) 90 (16ndash164) 153 (141ndash166) 1996ndash2001 217 (164ndash269) 206 (124ndash288) 187 (107ndash266) 184 (170ndash197) 2001ndash2004 177 (129ndash226) 216 (128ndash304) 97 (52ndash142) 198 (183ndash213) change 57 162 108 P (trend) 015 026 lt01 Pooled 147 (124ndash171) 198 (151ndash244) 103 (70ndash135) 147 (142ndash153)
Table 110 Age- and ethnicity-standardised rates of non-Hodgkinrsquos lymphoma by income group
NHL Age group
Cohort Low income SR (95 CI)
Medium income SR (95 CI)
High income SR (95 CI)
Males 1981ndash1986 125 (101ndash148) 180 (123ndash237) 25+ years 1986ndash1991 146 (121ndash172) 173 (146ndash200) 188 (141ndash235)
1991ndash1996 219 (181ndash257) 206 (175ndash238) 202 (172ndash232) 1996ndash2001 218 (189ndash247) 239 (211ndash267) 274 (237ndash311) 2001ndash2004 251 (211ndash290) 245 (209ndash280) 253 (216ndash290) change 101 41 P (trend) lt01 007 Pooled 189 (175ndash203) 214 (200ndash227) 228 (211ndash245)
Females 1981ndash1986 86 (68ndash103) 84 (66ndash102) 89 (57ndash120) 25+ years 1986ndash1991 123 (101ndash145) 114 (89ndash140) 163 (112ndash215)
1991ndash1996 157 (134ndash181) 145 (121ndash169) 144 (118ndash169) 1996ndash2001 193 (167ndash218) 209 (179ndash238) 173 (145ndash201) 2001ndash2004 194 (167ndash222) 191 (163ndash219) 221 (184ndash257) change 126 127 148 P (trend) lt01 lt01 002 Pooled 148 (138ndash159) 146 (135ndash158) 155 (139ndash171)
Note Due to an aberrantly high rate in the middle-income male group in 1981ndash1986 pooled and trend statistics for this group are not presented
Cancer Trends 221
Table 111 Age-standardised rates of oesophageal cancer by ethnic group
Oesophagus Age group
Cohort Total Māori SR (95 CI)
Total Pacific SR (95 CI)
Total Asian SR (95 CI)
EuropeanOther SR (95 CI)
Males 1981ndash1986 168 (83ndash253) 88 (78ndash98) 25+ years 1986ndash1991 92 (46ndash137) 129 (05ndash254) 93 (83ndash103)
1991ndash1996 168 (110ndash226) 33 (10ndash106) 43 (06ndash305) 109 (99ndash119) 1996ndash2001 138 (92ndash184) 93 (34ndash151) 93 (15ndash171) 98 (89ndash107) 2001ndash2004 160 (109ndash210) 101 (27ndash174) 49 (08ndash89) 110 (100ndash121) change -5 25 P (trend) 044 012 Pooled 144 (118ndash171) 88 (52ndash125) 63 (30ndash95) 105 (101ndash110)
Females 1981ndash1986 42 (07ndash77) 27 (04ndash188) 40 (34ndash47) 25+ years 1986ndash1991 21 (08ndash59) 45 (39ndash51)
1991ndash1996 49 (21ndash78) 22 (05ndash93) 52 (46ndash58) 1996ndash2001 57 (29ndash85) 24 (00ndash47) 31 (10ndash103) 43 (37ndash48) 2001ndash2004 50 (23ndash77) 26 (08ndash81) 06 (01ndash42) 49 (42ndash55) change 19 -4 23 P (trend) 022 039 Pooled 43 (31ndash56) 25 (08ndash41) 20 (07ndash33) 46 (43ndash48)
Table 112 Age- and ethnicity-standardised rates of oesophageal cancer by income group
Oesophagus Age group
Cohort Low income SR (95 CI)
Medium income SR (95 CI)
High income SR (95 CI)
Males 1981ndash1986 96 (73ndash119) 119 (50ndash187) 90 (66ndash114) 25+ years 1986ndash1991 113 (91ndash135) 93 (72ndash113) 86 (50ndash121)
1991ndash1996 144 (118ndash170) 121 (100ndash142) 71 (57ndash85) 1996ndash2001 123 (100ndash147) 101 (83ndash118) 83 (60ndash106) 2001ndash2004 144 (120ndash169) 127 (102ndash152) 92 (68ndash115) change 50 7 2 P (trend) 008 042 091 Pooled 123 (112ndash134) 111 (95ndash128) 84 (73ndash95)
Females 1981ndash1986 36 (26ndash46) 32 (22ndash43) 41 (24ndash58) 25+ years 1986ndash1991 41 (30ndash51) 39 (28ndash49) 43 (31ndash54)
1991ndash1996 65 (50ndash80) 44 (33ndash56) 43 (29ndash58) 1996ndash2001 45 (32ndash58) 45 (33ndash58) 45 (28ndash63) 2001ndash2004 45 (34ndash56) 44 (29ndash59) 47 (33ndash62) change 25 38 15 P (trend) 046 004 lt01 Pooled 46 (41ndash52) 41 (35ndash46) 44 (37ndash51)
222 Cancer Trends
Table 113 Age-standardised rates of ovarian cancer by ethnic group
Ovary Age group
Cohort Total Māori SR (95 CI)
Total Pacific SR (95 CI)
Total Asian SR (95 CI)
EuropeanOther SR (95 CI)
Females 25+ years
1981ndash1986 1986ndash1991 1991ndash1996 1996ndash2001 2001ndash2004 change P (trend) Pooled
124 (77ndash171) 173 (121ndash225) 249 (189ndash310) 207 (165ndash250) 192 (146ndash239)
55 023
189 (166ndash212)
272 (121ndash422) 275 (147ndash404) 241 (145ndash336) 273 (183ndash363) 193 (118ndash267)
-29 016
254 (202ndash305)
77 (24ndash247) 133 (19ndash248) 253 (115ndash390) 222 (141ndash304) 150 (92ndash208)
95 043
168 (121ndash214)
169 (154ndash184) 185 (170ndash200) 197 (183ndash211) 198 (184ndash212) 188 (174ndash203)
11 021
187 (181ndash194)
Table 114 Age- and ethnicity-standardised rates of ovarian cancer by income group
Ovary Age group
Cohort Low income SR (95 CI)
Medium income SR (95 CI)
High income SR (95 CI)
Females 1981ndash1986 172 (143ndash201) 155 (128ndash183) 177 (141ndash213) 25+ years 1986ndash1991 198 (169ndash226) 192 (164ndash220) 176 (146ndash207)
1991ndash1996 202 (175ndash228) 185 (159ndash210) 257 (211ndash303) 1996ndash2001 208 (183ndash234) 212 (184ndash240) 206 (177ndash236) 2001ndash2004 214 (186ndash243) 204 (174ndash234) 160 (135ndash186) change 24 32 -10 P (trend) 003 007 082 Pooled 198 (186ndash210) 189 (176ndash201) 197 (181ndash213)
25ndash44 years 1981ndash1986 103 (65ndash140) 84 (46ndash122) 64 (33ndash95) 1986ndash1991 81 (47ndash114) 70 (41ndash99) 66 (38ndash93) 1991ndash1996 58 (36ndash80) 61 (39ndash84) 95 (56ndash134) 1996ndash2001 75 (49ndash102) 70 (44ndash97) 87 (59ndash115) 2001ndash2004 72 (48ndash97) 47 (26ndash68) 66 (38ndash94) change -30 -44 3 P (trend) 046 007 064 Pooled 78 (65ndash92) 67 (54ndash80) 76 (62ndash90)
45ndash64 years 1981ndash1986 209 (154ndash263) 189 (137ndash241) 206 (152ndash259) 1986ndash1991 288 (228ndash347) 316 (247ndash385) 296 (201ndash391) 1991ndash1996 340 (273ndash407) 261 (201ndash320) 287 (212ndash363) 1996ndash2001 310 (253ndash368) 309 (247ndash372) 289 (228ndash350) 2001ndash2004 290 (232ndash348) 279 (215ndash343) 209 (154ndash264) change 39 48 1 P (trend) 024 023 085 Pooled 287 (261ndash314) 270 (243ndash298) 260 (228ndash292)
65+ years 1981ndash1986 311 (231ndash391) 361 (266ndash456) 488 (333ndash643) 1986ndash1991 381 (306ndash455) 379 (292ndash466) 348 (261ndash435) 1991ndash1996 421 (328ndash515) 421 (342ndash500) 716 (501ndash932) 1996ndash2001 451 (346ndash556) 461 (361ndash561) 414 (309ndash519) 2001ndash2004 541 (406ndash677) 585 (449ndash721) 402 (294ndash509) change 74 62 -18 P (trend) lt01 002 099 Pooled 415 (372ndash458) 434 (390ndash478) 477 (412ndash542)
Cancer Trends 223
Table 115 Age-standardised rates of pancreatic cancer by ethnic group
Pancreas Age group
Cohort Total Māori SR (95 CI)
Total Pacific SR (95 CI)
Total Asian SR (95 CI)
EuropeanOther SR (95 CI)
Males 1981ndash1986 199 (122ndash275) 337 (40ndash633) 126 (114ndash138) 25+ years 1986ndash1991 186 (120ndash251) 212 (60ndash365) 119 (38ndash373) 139 (127ndash151)
1991ndash1996 162 (98ndash227) 108 (35ndash181) 100 (30ndash336) 126 (115ndash137) 1996ndash2001 220 (158ndash282) 189 (103ndash274) 38 (13ndash114) 128 (118ndash139) 2001ndash2004 change P (trend)
179 (120ndash238) -10 098
150 (73ndash228) -55 084
82 (32ndash132) 118 (107ndash130) -6 030
Pooled 190 (160ndash220) 202 (127ndash277) 85 (40ndash130) 128 (123ndash133)
Females 1981ndash1986 104 (47ndash161) 122 (44ndash342) 92 (21ndash397) 83 (74ndash92) 25+ years 1986ndash1991 136 (75ndash197) 186 (23ndash350) 35 (05ndash251) 83 (75ndash91)
1991ndash1996 129 (80ndash178) 118 (28ndash208) 63 (22ndash178) 100 (91ndash109) 1996ndash2001 165 (117ndash212) 73 (25ndash121) 85 (25ndash145) 102 (93ndash110) 2001ndash2004 167 (114ndash219) 59 (10ndash108) 48 (12ndash83) 93 (84ndash102) change 61 -52 -48 12 P (trend) 002 006 080 019 Pooled 139 (115ndash163) 114 (65ndash163) 65 (28ndash103) 92 (88ndash96)
Table 116 Age- and ethnicity-standardised rates of pancreatic cancer by income group
Pancreas Age group
Cohort Low income SR (95 CI)
Medium income SR (95 CI)
High income SR (95 CI)
Males 1981ndash1986 163 (114ndash213) 151 (119ndash184) 162 (93ndash230) 25+ years 1986ndash1991 130 (107ndash154) 191 (148ndash233) 157 (110ndash204)
1991ndash1996 134 (106ndash162) 137 (111ndash162) 133 (99ndash166) 1996ndash2001 160 (133ndash187) 134 (108ndash161) 133 (106ndash160) 2001ndash2004 136 (111ndash160) 139 (115ndash163) 144 (102ndash185) change -17 -8 -11 P (trend) 085 036 033 Pooled 145 (130ndash160) 151 (137ndash165) 146 (125ndash167)
Females 1981ndash1986 88 (68ndash108) 133 (85ndash180) 80 (58ndash102) 25+ years 1986ndash1991 103 (79ndash127) 79 (61ndash97) 120 (67ndash173)
1991ndash1996 117 (93ndash142) 108 (89ndash127) 94 (65ndash124) 1996ndash2001 114 (95ndash133) 106 (89ndash123) 113 (82ndash144) 2001ndash2004 127 (104ndash150) 110 (84ndash137) 88 (62ndash113) change 44 -17 10 P (trend) 001 041 053 Pooled 109 (99ndash119) 107 (94ndash120) 100 (84ndash115)
224 Cancer Trends
Table 117 Age-standardised rates of prostate cancer by ethnic group
Prostate Age group
Cohort Total Māori SR (95 CI)
Total Pacific SR (95 CI)
Total Asian SR (95 CI)
EuropeanOther SR (95 CI)
Males 1981ndash1986 573 (419ndash727) 410 (78ndash741) 116 (29ndash465) 712 (683ndash741) 25+ years 1986ndash1991 742 (587ndash897) 106 (62ndash150) 402 (149ndash656) 741 (714ndash768)
1991ndash1996 137 (116ndash158) 119 (85ndash152) 575 (327ndash824) 139 (135ndash142) 1996ndash2001 183 (165ndash202) 209 (176ndash243) 956 (727ndash119) 208 (204ndash212) 2001ndash2004 191 (172ndash211) 191 (160ndash222) 958 (769ndash115) 209 (204ndash214) change 234 366 726 193 P (trend) lt01 002 lt01 002 Pooled 125 (117ndash133) 130 (114ndash146) 584 (484ndash683) 137 (135ndash138)
25ndash64 years 1981ndash1986 217 (120ndash315) 65 (20ndash206) 151 (134ndash168) 1986ndash1991 177 (112ndash243) 329 (83ndash574) 28 (04ndash198) 148 (132ndash164) 1991ndash1996 256 (187ndash326) 452 (239ndash666) 174 (29ndash319) 362 (338ndash386) 1996ndash2001 606 (498ndash714) 451 (317ndash586) 241 (138ndash344) 770 (735ndash806) 2001ndash2004 734 (619ndash850) 592 (420ndash763) 411 (286ndash536) 991 (950ndash103) change 238 811 556 P (trend) 005 lt01 003 Pooled 381 (340ndash422) 367 (287ndash448) 201 (152ndash250) 541 (528ndash554)
65+ years 1981ndash1986 262 (176ndash348) 194 (16ndash373) 640 (160ndash256) 365 (348ndash381) 1986ndash1991 377 (288ndash466) 521 (277ndash765) 229 (78ndash380) 383 (368ndash398) 1991ndash1996 690 (573ndash808) 559 (370ndash747) 291 (127ndash456) 694 (674ndash714) 1996ndash2001 909 (805ndash1013) 1078 (883ndash1274) 503 (353ndash653) 962 (938ndash985) 2001ndash2004 874 (763ndash986) 977 (784ndash1171) 405 (299ndash510) 904 (876ndash933) change 233 403 532 148 P (trend) lt01 002 002 002 Pooled 610 (564ndash656) 650 (559ndash741) 293 (231ndash355) 649 (640ndash658)
Cancer Trends 225
Table 118 Age- and ethnicity-standardised rates of prostate cancer by income group
Prostate Age group
Cohort Low income SR (95 CI)
Medium income SR (95 CI)
High income SR (95 CI)
Males 1981ndash1986 654 (599ndash709) 740 (628ndash851) 697 (620ndash773) 25+ years 1986ndash1991 807 (724ndash890) 801 (716ndash886) 771 (687ndash856)
1991ndash1996 125 (116ndash134) 139 (131ndash146) 162 (147ndash178) 1996ndash2001 194 (184ndash203) 203 (194ndash211) 236 (225ndash247) 2001ndash2004 197 (187ndash207) 208 (198ndash218) 219 (208ndash229) change 202 181 214 P (trend) lt01 001 002 Pooled 129 (125ndash133) 137 (133ndash141) 149 (145ndash154)
25ndash64 years 1981ndash1986 153 (114ndash192) 162 (121ndash202) 156 (114ndash198) 1986ndash1991 153 (120ndash187) 168 (130ndash205) 187 (134ndash241) 1991ndash1996 382 (330ndash434) 318 (276ndash360) 383 (322ndash444) 1996ndash2001 578 (519ndash638) 737 (671ndash803) 848 (782ndash914) 2001ndash2004 795 (720ndash870) 877 (803ndash951) 108 (100ndash115) change 420 441 590 P (trend) 002 003 001 Pooled 393 (370ndash416) 431 (408ndash454) 503 (476ndash529)
65ndash74 years 1981ndash1986 260 (223ndash297) 249 (178ndash321) 265 (216ndash315) 1986ndash1991 294 (256ndash332) 281 (228ndash334) 304 (230ndash377) 1991ndash1996 442 (393ndash491) 542 (496ndash587) 645 (570ndash720) 1996ndash2001 831 (772ndash889) 860 (802ndash919) 1011 (934ndash1089) 2001ndash2004 847 (780ndash915) 908 (834ndash981) 934 (859ndash1008) change 226 264 252 P (trend) 002 lt01 001 Pooled 519 (497ndash541) 551 (524ndash578) 617 (585ndash648)
75+ years 1981ndash1986 487 (431ndash544) 596 (479ndash713) 527 (444ndash610) 1986ndash1991 709 (574ndash844) 674 (565ndash783) 602 (501ndash703) 1991ndash1996 907 (790ndash1025) 1019 (938ndash1099) 1248 (1017ndash1479) 1996ndash2001 1215 (1106ndash1324) 1142 (1056ndash1229) 1309 (1189ndash1428) 2001ndash2004 995 (891ndash1099) 1039 (926ndash1152) 965 (846ndash1084) change 104 74 83 P (trend) 003 006 009 Pooled 856 (808ndash905) 887 (841ndash932) 928 (864ndash992)
226 Cancer Trends
Table 119 Age-standardised rates of stomach cancer by ethnic group
Stomach Age group
Cohort Total Māori SR (95 CI)
Total Pacific SR (95 CI)
Total Asian SR (95 CI)
EuropeanOther SR (95 CI)
Males 1981ndash1986 385 (273ndash498) 764 (372ndash116) 123 (45ndash336) 234 (217ndash251) 25+ years 1986ndash1991 479 (359ndash600) 536 (270ndash802) 126 (44ndash359) 200 (186ndash214)
1991ndash1996 435 (337ndash533) 324 (195ndash454) 139 (35ndash242) 177 (164ndash189) 1996ndash2001 348 (280ndash417) 443 (306ndash581) 254 (144ndash363) 168 (156ndash180) 2001ndash2004 357 (278ndash437) 402 (261ndash544) 142 (65ndash218) 157 (144ndash170) change -7 -47 15 -33 P (trend) 027 060 062 001 Pooled 403 (358ndash448) 498 (389ndash608) 158 (107ndash208) 189 (182ndash195)
25ndash64 years 1981ndash1986 252 (155ndash349) 380 (127ndash634) 91 (29ndash285) 117 (103ndash132) 1986ndash1991 284 (194ndash374) 191 (92ndash290) 46 (11ndash193) 78 (67ndash89) 1991ndash1996 267 (193ndash341) 272 (151ndash393) 88 (21ndash155) 71 (61ndash82) 1996ndash2001 248 (185ndash311) 245 (139ndash351) 107 (39ndash174) 73 (63ndash84) 2001ndash2004 190 (137ndash243) 220 (117ndash323) 62 (20ndash104) 76 (64ndash87) change -25 -42 -32 -35 P (trend) 010 088 092 025 Pooled 251 (216ndash287) 264 (195ndash332) 80 (46ndash113) 83 (78ndash89)
65+ years 1981ndash1986 125 (68ndash181) 270 (74ndash465) 235 (33ndash167) 906 (822ndash990) 1986ndash1991 166 (101ndash231) 240 (79ndash402) 469 (117ndash188) 888 (814ndash962) 1991ndash1996 136 (87ndash185) 687 (137ndash124) 534 (122ndash234) 760 (697ndash824) 1996ndash2001 971 (648ndash129) 180 (100ndash261) 141 (50ndash232) 695 (635ndash756) 2001ndash2004 137 (91ndash183) 126 (60ndash191) 497 (119ndash875) 626 (557ndash695) change 10 -53 111 -31 P (trend) 060 095 045 lt01 Pooled 132 (109ndash155) 179 (121ndash237) 635 (326ndash944) 782 (751ndash814)
Females 1981ndash1986 274 (184ndash365) 274 (86ndash461) 107 (32ndash352) 113 (102ndash123) 25+ years 1986ndash1991
1991ndash1996 1996ndash2001 2001ndash2004 change P (trend) Pooled
245 (174ndash316) 263 (193ndash334) 233 (179ndash288) 271 (207ndash335)
-1 091
257 (224ndash289)
221 (81ndash360) 165 (59ndash272) 205 (124ndash285) 250 (161ndash338)
-9 076
222 (163ndash280)
180 (45ndash315) 73 (25ndash211)
105 (47ndash164) 86 (38ndash133)
-20 047
111 (67ndash156)
81 (73ndash89) 82 (74ndash90) 75 (67ndash82) 65 (58ndash73)
-42 005
84 (80ndash88)
25ndash64 years 1981ndash1986 168 (104ndash231) 127 (29ndash225) 175 (46ndash665) 42 (33ndash50) 1986ndash1991 150 (96ndash203) 189 (69ndash309) 92 (07ndash177) 29 (23ndash36) 1991ndash1996 147 (95ndash200) 113 (42ndash183) 27 (06ndash113) 32 (25ndash39) 1996ndash2001 113 (78ndash147) 113 (56ndash170) 84 (26ndash141) 26 (20ndash32) 2001ndash2004 142 (99ndash185) 152 (80ndash224) 45 (12ndash78) 29 (23ndash36) change -15 20 -74 -31 P (trend) 028 099 082 020 Pooled 144 (121ndash167) 138 (99ndash178) 87 (32ndash141) 32 (29ndash35)
65+ years 1981ndash1986 107 (52ndash163) 895 (322ndash249) 483 (432ndash534) 1986ndash1991 749 (375ndash112) 452 (113ndash181) 548 (177ndash170) 360 (319ndash401) 1991ndash1996 968 (598ndash134) 419 (124ndash142) 274 (68ndash111) 330 (295ndash366) 1996ndash2001 885 (588ndash118) 637 (244ndash103) 256 (94ndash698) 331 (291ndash371) 2001ndash2004 change P (trend)
103 (63ndash142) -4 066
771 (331ndash121) -14 049
345 (45ndash645) 257 (219ndash294) -47 003
Pooled 936 (753ndash112) 628 (349ndash907) 356 (166ndash547) 323 (306ndash341)
Cancer Trends 227
Table 120 Age- and ethnicity-standardised rates of stomach cancer by income group
Stomach Age group
Cohort Low income SR (95 CI)
Medium income SR (95 CI)
High income SR (95 CI)
Males 1981ndash1986 320 (256ndash385) 280 (223ndash336) 248 (190ndash306) 25+ years 1986ndash1991
1991ndash1996 1996ndash2001 2001ndash2004 change P (trend) Pooled
309 (259ndash359) 249 (211ndash287) 222 (189ndash254) 211 (174ndash248)
-34 001
265 (244ndash286)
221 (184ndash258) 224 (191ndash257) 225 (195ndash254) 232 (187ndash277)
-17 048
237 (218ndash255)
226 (161ndash290) 207 (156ndash257) 159 (131ndash187) 156 (127ndash185)
-37 001
201 (179ndash224)
25ndash64 years 1981ndash1986 127 (94ndash159) 122 (90ndash153) 167 (103ndash231) 1986ndash1991 146 (102ndash189) 95 (72ndash118) 88 (59ndash116) 1991ndash1996 136 (106ndash167) 99 (71ndash127) 92 (62ndash123) 1996ndash2001 111 (86ndash136) 116 (85ndash147) 102 (68ndash137) 2001ndash2004 99 (73ndash125) 112 (84ndash141) 75 (55ndash95) change -22 -8 -55 P (trend) 011 080 025 Pooled 125 (110ndash140) 109 (96ndash122) 106 (88ndash124)
65+ years 1981ndash1986 130 (97ndash164) 110 (82ndash139) 909 (616ndash120) 1986ndash1991 125 (101ndash149) 100 (74ndash126) 977 (627ndash133) 1991ndash1996 888 (703ndash107) 913 (746ndash108) 863 (587ndash114) 1996ndash2001 830 (673ndash987) 902 (742ndash106) 563 (426ndash701) 2001ndash2004 795 (610ndash979) 947 (681ndash121) 624 (465ndash783) change -39 -14 -31 P (trend) 004 014 010 Pooled 102 (92ndash113) 974 (871ndash108) 795 (677ndash914)
Females 1981ndash1986 165 (134ndash196) 153 (109ndash197) 105 (72ndash139) 25+ years 1986ndash1991 130 (106ndash155) 108 (83ndash133) 82 (61ndash103)
1991ndash1996 123 (100ndash146) 103 (81ndash124) 94 (56ndash132) 1996ndash2001 108 (87ndash129) 125 (100ndash150) 86 (63ndash109) 2001ndash2004 99 (77ndash120) 127 (98ndash157) 109 (78ndash141) change -40 -17 4 P (trend) 001 086 069 Pooled 126 (115ndash137) 123 (109ndash137) 95 (81ndash108)
25ndash64 years 1981ndash1986 78 (53ndash104) 63 (39ndash87) 44 (26ndash62) 1986ndash1991 63 (44ndash81) 57 (33ndash81) 37 (20ndash55) 1991ndash1996 53 (37ndash70) 43 (24ndash61) 44 (11ndash77) 1996ndash2001 51 (36ndash65) 46 (30ndash63) 28 (16ndash40) 2001ndash2004 44 (29ndash58) 71 (48ndash95) 54 (33ndash74) change -44 13 23 P (trend) 001 096 083 Pooled 58 (50ndash67) 55 (46ndash65) 41 (31ndash50)
65+ years 1981ndash1986 1986ndash1991 1991ndash1996 1996ndash2001 2001ndash2004 change P (trend) Pooled
660 (500ndash820) 484 (353ndash615) 479 (365ndash592) 420 (312ndash528) 426 (298ndash554)
-35 007
497 (439ndash555)
684 (397ndash972) 380 (278ndash483) 422 (313ndash531) 551 (410ndash692) 463 (268ndash659)
-32 063
502 (421ndash582)
396 (228ndash564) 349 (208ndash491) 346 (169ndash522) 398 (247ndash548) 368 (221ndash516)
-7 095
372 (300ndash443)
228 Cancer Trends
Table 121 Age-standardised rates of testicular cancer by ethnic group
Testicular Age group
Cohort Total Māori SR (95 CI)
Total Pacific SR (95 CI)
Total Asian SR (95 CI)
EuropeanOther SR (95 CI)
Males 1981ndash1986 112 (75ndash150) 26 (08ndash80) 23 (06ndash96) 75 (65ndash85) 15+ years 1986ndash1991 66 (44ndash88) 66 (18ndash234) 57 (15ndash221) 74 (64ndash83)
1991ndash1996 114 (85ndash142) 51 (19ndash82) 42 (05ndash78) 72 (63ndash81) 1996ndash2001 140 (112ndash169) 21 (05ndash37) 33 (13ndash53) 81 (71ndash92) 2001ndash2004 142 (107ndash177) 27 (07ndash46) 27 (08ndash45) 114 (100ndash128) change 27 4 17 52 P (trend) 015 067 087 021 Pooled 113 (100ndash127) 39 (19ndash59) 37 (17ndash57) 82 (77ndash86)
15ndash44 years 1981ndash1986 146 (98ndash194) 39 (12ndash120) 35 (09ndash144) 104 (89ndash119) 1986ndash1991 100 (63ndash138) 40 (12ndash135) 86 (22ndash334) 90 (77ndash104) 1991ndash1996 158 (115ndash201) 58 (19ndash96) 63 (08ndash119) 86 (73ndash99) 1996ndash2001 198 (154ndash242) 32 (08ndash56) 50 (20ndash80) 108 (93ndash123) 2001ndash2004 198 (148ndash249) 37 (07ndash67) 42 (10ndash73) 144 (123ndash164) change 36 -5 20 38 P (trend) 012 058 097 034 Pooled 158 (138ndash178) 41 (24ndash59) 56 (26ndash86) 105 (98ndash111)
Table 122 Age- and ethnicity-standardised rates of testicular cancer by income group
Testicular Age group
Cohort Low income SR (95 CI)
Medium income SR (95 CI)
High income SR (95 CI)
Males 1981ndash1986 98 (74ndash121) 79 (61ndash97) 71 (53ndash89) 15+ years 1986ndash1991 72 (55ndash89) 65 (51ndash79) 66 (50ndash82)
1991ndash1996 69 (54ndash85) 87 (70ndash104) 71 (55ndash88) 1996ndash2001 106 (85ndash126) 83 (65ndash101) 74 (59ndash90) 2001ndash2004 110 (86ndash134) 123 (98ndash147) 91 (73ndash109) change 12 56 28 P (trend) 041 017 012 Pooled 90 (81ndash99) 86 (78ndash94) 74 (66ndash81)
15ndash24 years 1981ndash1986 87 (32ndash142) 89 (42ndash137) 48 (20ndash75) 1986ndash1991 42 (12ndash71) 69 (37ndash101) 29 (07ndash52) 1991ndash1996 31 (08ndash54) 36 (11ndash60) 65 (25ndash104) 1996ndash2001 42 (15ndash68) 67 (28ndash106) 80 (35ndash125) 2001ndash2004 62 (24ndash100) 61 (20ndash102) 59 (21ndash97) change -29 -31 23 P (trend) 095 060 031 Pooled 52 (36ndash69) 65 (48ndash81) 56 (40ndash72)
25ndash44 years 1981ndash1986 170 (119ndash221) 132 (92ndash172) 140 (98ndash181) 1986ndash1991 120 (84ndash156) 102 (73ndash130) 115 (81ndash148) 1991ndash1996 126 (88ndash165) 161 (121ndash200) 114 (79ndash149) 1996ndash2001 226 (174ndash278) 157 (114ndash200) 112 (81ndash144) 2001ndash2004 186 (126ndash245) 221 (164ndash278) 153 (113ndash193) change 9 67 9 P (trend) 040 012 078 Pooled 165 (143ndash186) 151 (133ndash170) 125 (109ndash142)
Cancer Trends 229
Table 123 Age-standardised rates of thyroid cancer by ethnic group
Thyroid Age group
Cohort Total Māori SR (95 CI)
Total Pacific SR (95 CI)
Total Asian SR (95 CI)
EuropeanOther SR (95 CI)
Males 1981ndash1986 36 (00ndash71) 05 (01ndash36) 17 (13ndash22) 15+ years 1986ndash1991 25 (06ndash44) 11 (03ndash43) 28 (07ndash111) 16 (12ndash20)
1991ndash1996 29 (09ndash50) 45 (16ndash127) 17 (04ndash70) 21 (16ndash25) 1996ndash2001 41 (23ndash59) 49 (08ndash90) 57 (04ndash110) 25 (20ndash30) 2001ndash2004 31 (14ndash48) 22 (07ndash66) 24 (06ndash43) 27 (21ndash33) change -14 340 59 P (trend) 055 014 002 Pooled 32 (22ndash43) 27 (13ndash41) 32 (15ndash49) 22 (20ndash24)
Females 1981ndash1986 85 (47ndash123) 219 (102ndash337) 142 (06ndash279) 40 (33ndash46) 15+ years 1986ndash1991 68 (41ndash94) 153 (71ndash234) 62 (04ndash121) 43 (36ndash50)
1991ndash1996 52 (28ndash76) 157 (73ndash241) 53 (11ndash94) 43 (36ndash50) 1996ndash2001 106 (80ndash133) 246 (175ndash318) 179 (116ndash242) 67 (57ndash77) 2001ndash2004 111 (80ndash142) 138 (87ndash189) 103 (64ndash142) 69 (59ndash78) change 31 -37 -27 73 P (trend) 029 065 048 005 Pooled 83 (70ndash96) 185 (146ndash224) 108 (72ndash144) 52 (48ndash55)
Table 124 Age- and ethnicity-standardised rates of thyroid cancer by income group
Thyroid Age group
Cohort Low income SR (95 CI)
Medium income SR (95 CI)
High income SR (95 CI)
Males 1981ndash1986 27 (12ndash42) 19 (10ndash28) 16 (08ndash24) 15+ years 1986ndash1991 18 (11ndash26) 21 (13ndash28) 14 (07ndash21)
1991ndash1996 22 (11ndash32) 20 (13ndash28) 22 (11ndash34) 1996ndash2001 24 (15ndash33) 33 (21ndash44) 32 (21ndash43) 2001ndash2004 26 (17ndash35) 28 (17ndash39) 26 (16ndash35) change -4 47 63 P (trend) 029 014 008 Pooled 23 (18ndash28) 24 (20ndash28) 22 (18ndash26)
Females 1981ndash1986 70 (49ndash91) 58 (36ndash79) 38 (24ndash52) 15+ years 1986ndash1991 51 (37ndash64) 46 (32ndash60) 62 (41ndash82)
1991ndash1996 43 (31ndash55) 63 (44ndash83) 37 (25ndash48) 1996ndash2001 94 (73ndash114) 74 (57ndash91) 81 (61ndash101) 2001ndash2004 84 (66ndash102) 90 (70ndash111) 72 (54ndash90) change 20 55 89 P (trend) 038 005 023 Pooled 68 (60ndash75) 65 (57ndash73) 57 (50ndash65)
230 Cancer Trends
Table 125 Age-standardised rates of ill-defined cancer by ethnic group
Ill-defined Age group
Cohort Total Māori SR (95 CI)
Total Pacific SR (95 CI)
Total Asian SR (95 CI)
EuropeanOther SR (95 CI)
Males 1981ndash1986 508 (383ndash633) 256 (98ndash413) 64 (09ndash457) 248 (230ndash265) 25+ years 1986ndash1991 418 (307ndash529) 357 (146ndash568) 347 (118ndash577) 257 (241ndash274)
1991ndash1996 386 (293ndash479) 458 (268ndash649) 92 (02ndash181) 243 (228ndash258) 1996ndash2001 325 (249ndash401) 383 (254ndash513) 181 (75ndash286) 245 (231ndash260) 2001ndash2004 368 (285ndash451) 276 (161ndash390) 42 (01ndash82) 181 (167ndash195) change -28 8 -34 -27 P (trend) 010 099 043 012 Pooled 403 (357ndash448) 350 (274ndash425) 150 (88ndash213) 237 (230ndash245)
Females 1981ndash1986 249 (163ndash335) 277 (53ndash501) 177 (63ndash497) 196 (182ndash210) 25+ years 1986ndash1991 416 (323ndash509) 217 (107ndash326) 87 (28ndash272) 213 (199ndash227)
1991ndash1996 304 (228ndash380) 285 (156ndash415) 133 (32ndash235) 204 (191ndash217) 1996ndash2001 335 (271ndash400) 358 (248ndash467) 162 (82ndash242) 197 (184ndash209) 2001ndash2004 234 (177ndash290) 229 (141ndash318) 94 (45ndash143) 137 (126ndash147) change -6 -17 -47 -30 P (trend) 055 092 057 015 Pooled 311 (276ndash346) 275 (210ndash340) 132 (80ndash184) 192 (186ndash198)
Table 126 Age- and ethnicity-standardised rates of ill-defined cancer by income group
Ill-defined Age group
Cohort Low income SR (95 CI)
Medium income SR (95 CI)
High income SR (95 CI)
Males 1981ndash1986 284 (243ndash326) 305 (247ndash363) 294 (221ndash367) 25+ years 1986ndash1991 314 (271ndash358) 270 (233ndash307) 307 (236ndash379)
1991ndash1996 329 (279ndash379) 286 (240ndash333) 251 (203ndash300) 1996ndash2001 299 (261ndash337) 287 (251ndash322) 190 (164ndash216) 2001ndash2004 271 (230ndash313) 195 (159ndash231) 182 (147ndash217) change -5 -36 -38 P (trend) 064 018 002 Pooled 301 (281ndash320) 272 (253ndash292) 248 (223ndash273)
Females 1981ndash1986 210 (175ndash245) 221 (174ndash267) 184 (150ndash218) 25+ years 1986ndash1991
1991ndash1996 1996ndash2001 2001ndash2004 change P (trend) Pooled
256 (222ndash290) 242 (209ndash275) 264 (230ndash297) 183 (157ndash209)
-13 051
233 (219ndash248)
257 (220ndash294) 230 (198ndash262) 209 (182ndash235) 146 (122ndash170)
-34 007
216 (200ndash232)
220 (175ndash266) 204 (166ndash243) 180 (152ndash208) 143 (114ndash172)
-22 020
188 (172ndash205)
Cancer Trends 231
Table 127 Age-standardised rates of childhood cancers by ethnic group
1st cancer Age group
Cohort Total Māori SR (95 CI)
Total Pacific SR (95 CI)
Total Asian SR (95 CI)
EuropeanOther SR (95 CI)
Both sexes 1ndash14 years
1981ndash1986 1986ndash1991 1991ndash1996 1996ndash2001 2001ndash2004 change P (trend) Pooled
117 (81ndash154) 143 (103ndash184) 151 (109ndash192) 121 (84ndash158) 121 (80ndash162)
3 087
131 (113ndash149)
153 (86ndash220) 276 (184ndash368) 195 (112ndash278) 180 (117ndash242) 169 (100ndash237)
10 088
196 (162ndash230)
206 (32ndash381) 212 (21ndash403) 149 (54ndash244) 207 (118ndash296) 146 (70ndash221)
-29 044
186 (124ndash248)
138 (106ndash171) 173 (141ndash204) 159 (129ndash189) 144 (119ndash170) 144 (116ndash171)
4 066
152 (139ndash165)
Table 128 Age- and ethnicity-standardised rates of childhood cancers by income group
1st cancer Age group
Cohort Low income SR (95 CI)
Medium income SR (95 CI)
High income SR (95 CI)
Both sexes 1ndash14 years
1981ndash1986 1986ndash1991 1991ndash1996 1996ndash2001 2001ndash2004 change P (trend) Pooled
116 (64ndash168) 146 (95ndash196) 137 (99ndash174) 106 (74ndash138) 115 (74ndash156)
-1 040
124 (105ndash144)
107 (78ndash137) 180 (141ndash219) 177 (116ndash238) 155 (111ndash199) 113 (72ndash154)
6 083
148 (128ndash168)
187 (110ndash264) 191 (118ndash264) 179 (130ndash227) 177 (135ndash219) 157 (116ndash198)
-16 004
179 (152ndash206)
Table 129 Age-standardised rates of adolescent cancers by ethnic group
1st cancer Age group
Cohort Total Māori SR (95 CI)
Total Pacific SR (95 CI)
Total Asian SR (95 CI)
EuropeanOther SR (95 CI)
Both sexes 15ndash24 years
1981ndash1986 1986ndash1991 1991ndash1996 1996ndash2001 2001ndash2004 change P (trend) Pooled
276 (214ndash337) 240 (182ndash298) 226 (173ndash279) 264 (207ndash320) 267 (203ndash331)
-3 093
254 (228ndash280)
360 (223ndash497) 505 (356ndash653) 434 (306ndash563) 356 (249ndash464) 152 (88ndash216)
-58 009
372 (316ndash428)
278 (24ndash532) 206 (38ndash373) 326 (182ndash470) 301 (197ndash405) 174 (93ndash255)
-37 037
261 (186ndash336)
276 (246ndash307) 297 (264ndash330) 334 (296ndash373) 340 (300ndash381) 377 (329ndash425)
37 lt01
322 (305ndash339)
Table 130 Age- and ethnicity-standardised rates of adolescent cancers by income group
1st cancer Age group
Cohort Low income SR (95 CI)
Medium income SR (95 CI)
High income SR (95 CI)
Both sexes 15ndash24 years
1981ndash1986 1986ndash1991 1991ndash1996 1996ndash2001 2001ndash2004 change P (trend) Pooled
234 (180ndash288) 265 (204ndash326) 365 (296ndash434) 261 (205ndash316) 315 (245ndash384)
35 038
287 (259ndash314)
334 (276ndash392) 311 (258ndash363) 317 (258ndash377) 327 (262ndash392) 344 (264ndash424)
3 063
326 (298ndash354)
292 (238ndash346) 337 (274ndash399) 348 (284ndash413) 403 (333ndash473) 360 (289ndash432)
23 008
347 (319ndash376)
232 Cancer Trends
Appendix 2 Miscellaneous
A21 Income thresholds
Table 131 Income tertile cut points for each five-year age group
Low income Medium income High income
0ndash4 years lt$20926 $20926 ndash lt$34548 ge$34549 5ndash9 years lt$21298 $21298 ndash lt$35785 ge$35787 10ndash14 years lt$23547 $23549 ndash lt$39449 ge$39450 15ndash19 years lt$28461 $28461 ndash lt$46773 ge$46774 20ndash24 years lt$31683 $31684 ndash lt$53335 ge$53335 25ndash29 years lt$29924 $29924 ndash lt$53597 ge$53597 30ndash34 years lt$27549 $27551 ndash lt$47141 ge$47141 35ndash39 years lt$28425 $28426 ndash lt$46868 ge$46869 40ndash44 years lt$32103 $32104 ndash lt$52046 ge$52047 45ndash49 years lt$36102 $36102 ndash lt$57565 ge$57565 50ndash54 years lt$36297 $36297 ndash lt$58787 ge$58788 55ndash59 years lt$31236 $31236 ndash lt$53335 ge$53335 60ndash64 years lt$23493 $23494 ndash lt$42850 ge$42851 65ndash69 years lt$20930 $20930 ndash lt$34548 ge$34549 70ndash74 years lt$20774 $20778 ndash lt$34548 ge$34549 ge 75 years lt$20332 $20337 ndash lt$34548 ge$34549
Table 132 Income quintile cut points for each five-year age group
Quintile 1 Quintile 2 Quintile 3 Quintile 4 Quintile 5
0ndash4 years lt$15591 $15591 ndash lt$23371 $23371 ndash lt$31064 $31064 ndash lt$43438 ge$43438 5ndash9 years lt$15849 $15850 ndash lt$24053 $24054 ndash lt$32492 $32495 ndash lt$44594 ge$44594 10ndash14 years lt$17394 $17396 ndash lt$26558 $26559 ndash lt$35849 $35849 ndash lt$49174 ge$49174 15ndash19 years lt$21062 $21062 ndash lt$31986 $31986 ndash lt$42689 $42690 ndash lt$57017 ge$57017 20ndash24 years lt$22948 $22949 ndash lt$35930 $35930 ndash lt$48572 $48572 ndash lt$63483 ge$63484 25ndash29 years lt$22207 $22208 ndash lt$33674 $33674 ndash lt$48133 $48135 ndash lt$66543 ge$66547 30ndash34 years lt$20924 $20926 ndash lt$30837 $30837 ndash lt$42345 $42347 ndash lt$62001 ge$62002 35ndash39 years lt$21588 $21589 ndash lt$31684 $31684 ndash lt$42345 $42346 ndash lt$59166 ge$59167 40ndash44 years lt$24384 $24384 ndash lt$35764 $35764 ndash lt$47189 $47190 ndash lt$64220 ge$64220 45ndash49 years lt$27047 $27048 ndash lt$40267 $40267 ndash lt$53057 $53057 ndash lt$70908 ge$70909 50ndash54 years lt$26953 $26954 ndash lt$40443 $40446 ndash lt$53596 $53597 ndash lt$72173 ge$72175 55ndash59 years lt$22371 $22373 ndash lt$35590 $35591 ndash lt$48022 $48024 ndash lt$66402 ge$66405 60ndash64 years lt$19347 $19350 ndash lt$27011 $27011 ndash lt$37998 $38003 ndash lt$55277 ge$55278 65ndash69 years lt$18454 $18467 ndash lt$22063 $22064 ndash lt$29523 $29523 ndash lt$43757 ge$43758 70ndash74 years lt$18448 $18454 ndash lt$20938 $20939 ndash lt$27639 $27642 ndash lt$40069 ge$40071 ge75 years lt$18056 $18071 ndash lt$20928 $20930 ndash lt$27011 $27011 ndash lt$38260 ge$38269
Cancer Trends 233
A22 Pooled over time measures of rates and measures of association
Standardised rates (SR) rate differences (SRD) and rate ratios (SRR) were calculated directly on unit-level data for each Census-cancer cohort Slope indices of inequality (SIIs) and relative indices of inequality (RIIs) were calculated on SRs brought out of the data laboratory but for each cohort separately
Given the small and sometimes unstable differences in cancer inequalities over cohorts it is useful to provide pooled over time estimates with some measure of statistical imprecision (that is confidence intervals) However in this case it was not feasible to calculate these pooled estimates and measures of statistical imprecision directly on unit record data The five separate Census-cohorts were not merged in the data laboratory at Statistics New Zealand and analyses on such pooled data would have been extremely time-consuming given the added processes necessarily involved
This section outlines the methods and approximations used to calculate the pooled estimates and their measures of imprecision
The pooled estimates in this report were intended to provide the lsquoaveragersquo over time Given that ethnic proportions varied over time while rates were also changing it was possible that a direct pooled estimate (not done) or Mantel-Haenszel would be confounded by time Standardisation by time was therefore decided on Each of the first four cohorts comprised five years of time but the last cohort comprised 382 years (March 2001 to December 2004) Thus the proportion of time occupied by each cohort was 021 021 021 021 and 016 respectively These proportions were the weights used (as outlined below) to standardise further over time here called wt as opposed to the standard nomenclature for such weights wi In this case the value refers to World Health Organization standard population weights and their derivations to include ethnicity used in the standardisation within cohorts
A221 Pooled standardised rates The pooled over time SR is simply the weighted average over time using the above weights
The variance of these pooled SRs (strictly standardised SRs) is approximated by the following formula
sum sum =
( (2Var
)t
tt
wSRw )
Var(SR)
where SR is the pooled SR over time wt the weight or proportion of time occupied by each cohort and SRt the SR in each cohort
For example assume each cohort has a rate of 200 per 100000 each with the same variance of 100 (which equates to a se of 10 and a 95 percent confidence interval of 1804ndash2196) The pooled SR is obviously 200 The variance of this pooled SR is 4times(0212 times100) + 0162times100 = 202 Thus the se of the pooled SR is 449
234 Cancer Trends
Table 133 below shows some mock data for standardised rates by cohort (SRt) and their variances (Var(SRt)) The pooled SR SR among the exposed is the weighted sum of the SRt that is 16165 per 100000 Among the unexposed it is 8865 per 100000 The variance of each of these SR is the sum of the cohort-specific variances of SRt each multiplied by wt
2 1840 among the exposed and 997 among the unexposed Thus the 95 percent confidence interval for SR among the exposed is 16165 plusmn (196times 1840) =15324 minus17006 per 100000
Table 133 Mock data for demonstrating calculation of pooled SR (per 100000)
Cohort (t) Wt
Exposed Unexposed
SRt Var(SRt) SRt times wt Var(SRt) times wt 2 SRt Var(SRt) SRt times wt Var(SRt) times wt
2
1981ndash1986 021 150 100 3150 441 100 60 2100 265 1986ndash1991 021 140 110 2940 485 90 45 1890 198 1991ndash1996 021 175 80 3675 353 85 40 1785 176 1996ndash2001 021 160 75 3360 331 90 55 1890 243 2001ndash2004 016 190 90 3040 230 75 45 1200 115
Sum 16165 1840 8865 997
A222 Pooled SRD and SRR
The pooled over time SRD SRD is the wt weighted average of the SRDt over time Alternatively it is just the difference between two stratum-specific pooled SR (for example Māori and EuropeanOther)
The variance of SRD is just the sum of the variance of the pooled SR for the unexposed (Var(SR 0 ) ) and exposed ( Var(SR1 ) )
The pooled over time SRR SRR is just the ratio of the pooled SR of the exposed ( SR1 ) to the unexposed ( SR0 ) The variance of ln( SRR ) is approximated by the following formula
Var(SR1 ) Var(SR 0 )Var[ln( SRR)] = 2 2+ SR1 SR 0
Extending the mock example in Table 133 the pooled SRD SRD is 7300 per 100000 with a variance of 2837 (that is 1840 + 997) The pooled SRR SRR is 182 The variance of ln( SRR ) is 0001973 (that is 1840161652 + 99788652) Calculating the confidence intervals in natural logarithm transformations then exponentiating the 95 percent confidence interval for SRR is 174ndash191
Cancer Trends 235
A223 Pooled SII and RII
Note that a variance calculated for SRD using a weight-squared sum of the variance of each cohort-specific SRD is mathematically identical to that given above using the sum of the variance of the pooled SRs Therefore it seems reasonable to calculate the pooled SII SII as simply the wt-weighted average of the SIIt over time The variance of SII is just the weighted sum of the variances of each cohort SII SIIt where the weights are the wt squared
However the calculation of a pooled RII using just the cohort-specific RII is not straightforward Further as the SII like the RII is a regression-based estimate it is not implausible that a lsquoproperlyrsquo calculated SII for all cohorts pooled might differ slightly from the above weighted average SII
Thus pooled SRs ( SR ) were first generated across all five cohorts for each quintile of income using data already exported from the Statistics New Zealand data laboratory then the standard methods used in the NZCMS and CancerTrends38 54 were applied to calculate the SIIs and RIIs directly on the pooled quintile SR This also required person time in each quintile (pooled over time) as both the weights in the regression and to calculate the central point on the cumulative proportion scale for ranked household income However as all five cohorts were actually pooled to determine quintile cut points each quintile group actually comprises exactly (or very close to) 20 percent Thus the regression did not need to be weighted and the ridit scores (central values of each quintile on the cumulative proportion scale) points could simply be fixed as 01 03 05 07 and 09
236 Cancer Trends

152 Cancer Trends
Table 63 Age- and ethnicity-standardised income rate ratios (SRR) rate differences (SRD) relative indices of inequality (RII) and slope indices of inequality (SII) of stomach cancer by sex
Age group
Cohort Males Females
Relative inequalities
Absolute inequalities
Relative inequalities
Absolute inequalities
SRR RII (95 CI) SRD SII (95 CI) SRR RII (95 CI) SRD SII (95 CI)
Stomach
25+ years 1981ndash1986 129 14 (09ndash22)
72 90 (-35ndash21)
156 16 (09ndash29)
60 70 (-01ndash14)
1986ndash1991 137 17 (11ndash26)
84 12 (35ndash21)
158 19 (12ndash31)
48 70 (28ndash11)
1991ndash1996 120 13 (09ndash19)
42 60 (13ndash99)
130 18 (06ndash59)
29 70 (-64ndash20)
1996ndash2001 139 19 (13ndash27)
62 12 (22ndash22)
126 16 (10ndash25)
23 50 (08ndash84)
2001ndash2004 135 16 (11ndash24)
55 90 (-14ndash19)
090 08 (05ndash14)
-11 -20 (-89ndash44)
P (trend) 055 048 044 098 002 015 lt01 011
Pooled 131 15 (12ndash18)
63 90 (48ndash14)
134 16 (12ndash22)
32 50 (-02ndash11)
25ndash64 years
1981ndash1986 076 06 (03ndash13)
-40 -70 (-15ndash16)
178 20 (09ndash47)
34 40 (-13ndash97)
1986ndash1991 166 22 (11ndash46)
58 80 (61ndash10)
169 20 (08ndash49)
26 40 (-08ndash81)
1991ndash1996 147 19 (10ndash36)
44 70 (23ndash11)
121 19 (07ndash50)
09 30 (-20ndash74)
1996ndash2001 109 14 (07ndash25)
09 30 (-82ndash15)
181 25 (10ndash61)
23 30 (-14ndash83)
2001ndash2004 132 18 (10ndash32)
24 50 (-19ndash12)
081 08 (04ndash17)
-10 -10 (-42ndash17)
P (trend) 075 047 097 094 021 023 014 004 Pooled 118 13
(10ndash18) 19 30
(-11ndash75) 143 18
(13ndash27) 18 30
(12ndash48)
65+ years 1981ndash1986 143 16 (09ndash29)
39 53 (-16ndash108)
167 16 (07ndash36)
26 29 (-30ndash61)
1986ndash1991 128 15 (09ndash27)
27 44 (-48ndash93)
139 19 (10ndash36)
14 25 (12ndash50)
1991ndash1996 103 11 (07ndash17)
26 50 (-12ndash21)
138 20 (04ndash94)
13 32 (-30ndash93)
1996ndash2001 147 19 (11ndash31)
27 49 (60ndash92)
106 13 (07ndash25)
22 13 (-20ndash28)
2001ndash2004 127 13 (08ndash23)
17 22 (-23ndash68)
116 14 (06ndash30)
58 13 (-34ndash60)
P (trend) 097 090 059 081 004 013 005 003 Pooled 129 14
(11ndash19) 23 34
(13ndash54) 134 17
(11ndash27) 13 24
(-22ndash51)
Notes 95 percent confidence intervals in brackets SRRs and SRDs compare low- and high-income tertiles Underlying non-linear trends mean the p for trend value must be interpreted cautiously
Cancer Trends 153
Chapter 26 Testicular Cancer There are two main subtypes of testicular cancer seminomas and non-seminomas Testicular cancer is relatively rare ndash 141 cases were diagnosed in New Zealand in 2005 ndash however it is the most common cancer among young men57 As in most developed countries the incidence of testicular cancer is increasing in New Zealand (the rate rising by 143 percent between 1956 and 1996)3 82 There are only a few well-established risk factors for testicular cancer Age is the best documented peak incidence occurs at 25ndash35 years Close relatives of men with testicular cancer are at a significantly increased risk However family clusters only account for a small proportion of total cases Ethnicity is also an important factor in the United States the rate of testicular cancer is six times higher in whites than it is in blacks83 Place of birth is also strongly linked with risk there are considerable differences in incidence rates between countries84 Cryptorchidism (undescended testes) is a well-established risk factor for testicular cancer Recently interest has focused on a possible relationship between subfertility and hypospadias cryptorchidism and testicular cancer The incidence of all these conditions has been increasing recently leading to some researchers suggesting they have a common origin As testicular cancer is commonly a disease of young men considerable research effort has focused on the prenatal environment particularly in utero exposure of the foetus to oestrogens85-88 To date research findings have been somewhat inconsistent Environmental exposures later in life are also likely to influence the development of testicular cancer Some infections may be related to increased risk possibly including infection with the mumps rubella or Epstein-Barr viruses A variety of occupational exposures have been investigated again with inconsistent results Note that the age range for testicular cancer in this report is from 15 years of age not 25 due to the cancerrsquos high incidence in the 15ndash24 year age range
261 Ethnic trends Rates among men aged 15+ years increased over the period surveyed by one-quarter among Māori and by one-half among EuropeanOther but neither trend was statistically significant (Figure 67 and Table 121 in Appendix 1) There was little apparent change in rates among Pacific and Asian males ndash although a marked imprecision of rates must be noted Pooled over time rates among Māori were 139 (95 percent confidence interval 122ndash159) times that of EuropeanOther Pacific 047 (028ndash080) times that rate and Asian 045 times (026ndash078) (Table 64) No trends over time in inequalities were evident
154 Cancer Trends
Figure 67 Standardised rates of testicular cancer for 15+ year-olds by ethnicity
Figure 68 Standardised rates of testicular cancer by ethnicity by age group
Cancer Trends 155
Table 64 Age-standardised rate ratios (SRR) of testicular cancer for Māori Pacific and Asian compared to EuropeanOther
Exposure Testicular Total ethnicity
Cohort 15+ years SRR (95 CI)
15ndash44 years SRR (95 CI)
Males
Total Māori vs European
1981ndash1986 150 (105ndash216) 140 (098ndash202) 1986ndash1991 090 (062ndash129) 111 (074ndash166) 1991ndash1996 158 (119ndash210) 184 (135ndash251) 1996ndash2001 172 (136ndash218) 183 (141ndash238) 2001ndash2004 125 (095ndash164) 138 (103ndash185) P (trend) 082 069 Pooled 139 (122ndash159) 151 (131ndash174)
Total Pacific vs European
1981ndash1986 034 (011ndash107) 037 (012ndash117) 1986ndash1991 089 (025ndash320) 044 (013ndash151) 1991ndash1996 071 (038ndash133) 067 (034ndash133) 1996ndash2001 026 (012ndash055) 030 (014ndash063) 2001ndash2004 023 (011ndash049) 026 (011ndash059) P (trend) 032 045 Pooled 047 (028ndash080) 040 (026ndash061)
Total Asian vs European
1981ndash1986 031 (008ndash129) 034 (008ndash140) 1986ndash1991 078 (020ndash302) 095 (024ndash373) 1991ndash1996 058 (024ndash141) 074 (030ndash180) 1996ndash2001 041 (022ndash075) 046 (025ndash086) 2001ndash2004 023 (011ndash047) 029 (013ndash063) P (trend) 025 031 Pooled 045 (026ndash078) 053 (031ndash092)
Notes 95 percent confidence intervals in brackets Underlying non-linear trends mean the p for trend value must be interpreted cautiously
156 Cancer Trends
Table 65 Age-standardised rate differences (SRD) of testicular cancer for Māori Pacific and Asian compared to EuropeanOther
Exposure Testicular Total ethnicity
Cohort 15+ years SRD (95 CI)
15ndash44 years SRD (95 CI)
Males
Total Māori vs European
1981ndash1986 38 (-01ndash76) 42 (-08ndash92) 1986ndash1991 -08 (-32ndash16) 10 (-30ndash50) 1991ndash1996 42 (12ndash72) 72 (27ndash12) 1996ndash2001 59 (29ndash89) 90 (43ndash14) 2001ndash2004 28 (-10ndash66) 55 (00ndash11) P (trend) 041 029 Pooled 32 (17ndash46) 54 (33ndash75)
Total Pacific vs European
1981ndash1986 -49 (-80ndash -18) -65 (-11ndash -19) 1986ndash1991 -08 (-92ndash76) -50 (-10ndash00) 1991ndash1996 -21 (-54ndash12) -28 (-69ndash12) 1996ndash2001 -60 (-79ndash -42) -76 (-11ndash -48) 2001ndash2004 -88 (-11ndash -64) -11 (-14ndash -70) P (trend) 022 024 Pooled -43 (-64ndash -22) -63 (-82ndash -44)
Total Asian vs European
1981ndash1986 -51 (-86ndash -17) -69 (-12ndash -17) 1986ndash1991 -17 (-94ndash61) -04 (-12ndash11) 1991ndash1996 -30 (-68ndash08) -23 (-80ndash34) 1996ndash2001 -48 (-71ndash -26) -58 (-92ndash -24) 2001ndash2004 -88 (-11ndash -64) -10 (-14ndash -64) P (trend) 025 039 Pooled -45 (-65ndash -24) -49 (-80ndash -18)
Notes 95 percent confidence intervals in brackets Underlying non-linear trends mean the p for trend value must be interpreted cautiously
262 Socioeconomic trends Testicular cancer rates increased over time in all income groups but none of the trends were statistically significant (Figure 69 and Table 122 in Appendix 1) Pooled over time there was an approximately 20 percent greater incidence among males of low income although confidence intervals just included the null (Table 66) There was no strong evidence of changing differences in rates by income over time
Cancer Trends 157
Figure 69 Standardised rates of testicular cancer for 15+ year-olds by income
Figure 70 Standardised rates of testicular cancer by income by age group
158 Cancer Trends
Table 66 Age- and ethnicity-standardised income rate ratios (SRR) rate differences (SRD) relative indices of inequality (RII) and slope indices of inequality (SII) of testicular cancer
Age group
Cohort Males
Relative inequalities Absolute inequalities
SRR RII (95 CI) SRD SII (95 CI)
Testicular
15+ years 1981ndash1986 138 13 (08ndash22) 27 20 (03ndash36) 1986ndash1991 110 10 (06ndash16) 06 00 (-11ndash06) 1991ndash1996 098 10 (06ndash16) -02 00 (-52ndash51) 1996ndash2001 142 17 (11ndash27) 31 40 (09ndash78) 2001ndash2004 121 15 (10ndash24) 19 40 (-13ndash98) P (trend) 093 029 077 070 Pooled 122 12 (10ndash15) 16 20 (03ndash31)
15ndash24 years
1981ndash1986 183 20 (05ndash90) 40 50 (-02ndash10) 1986ndash1991 143 10 (03ndash33) 13 00 (-65ndash59) 1991ndash1996 048 03 (01ndash22) -34 -50 (-72ndash -19) 1996ndash2001 052 05 (01ndash21) -38 -40 (-89ndash12) 2001ndash2004 104 10 (03ndash36) 02 00 (-65ndash59) P (trend) 020 038 030 035 Pooled 093 08 (05ndash15) -04 -10 (-44ndash24)
25ndash44 years
1981ndash1986 122 12 (06ndash23) 30 30 (-12ndash72) 1986ndash1991 105 10 (05ndash18) 05 00 (-25ndash16) 1991ndash1996 111 12 (07ndash21) 12 20 (-90ndash14) 1996ndash2001 202 28 (14ndash58) 11 15 (76ndash22) 2001ndash2004 121 17 (09ndash32) 33 10 (-20ndash21) P (trend) 050 023 041 025 Pooled 131 14 (11ndash19) 39 50 (20ndash81)
Notes 95 percent confidence intervals in brackets SRRs and SRDs compare low- and high-income tertiles Underlying non-linear trends mean the p for trend value must be interpreted cautiously
Cancer Trends 159
Chapter 27 Thyroid Cancer There are four main types of thyroid cancer papillary (50ndash80 percent of cases) follicular (15ndash20 percent of cases) medullary and anaplastic (both lt10 percent of cases) These subtypes differ in terms of their clinical behaviour and are also likely to differ in terms of their aetiologies Thyroid cancers are relatively uncommon ndash 166 cases were diagnosed in New Zealand in 2005 ndash although they are among the most common cancers diagnosed among children and young people57 89 In the United States there has been an increase in thyroid cancer incidence since the 1970s which is thought to be due at least partly to improvements in diagnosis89 Thyroid cancer is more common among women and peak incidence occurs at 20ndash60 years of age There are a number of inherited syndromes that increase the risk of thyroid cancer including multiple endocrine neoplasia familial medullary thyroid cancer and familial adenomatous polyposis Those with a family history of thyroid cancer are at increased risk Ionising radiation is the only fully established environmental risk factor for thyroid cancer Other possible causes include a diet either low or high in iodine a history of benign thyroid disease such as goitre reproductive factors and sudden changes in weight Smoking may be protective against thyroid cancer89
271 Ethnic trends Thyroid cancer rates increased by about two-thirds among EuropeanOther for both sexes (p for trend le005) but were unstable over time for other ethnic groups (Figure 71 and Table 123 in Appendix 1) Pooled over time Māori thyroid cancer rates were 155 (95 percent confidence interval 111ndash218) and 161 (135ndash192) times Pacific rates 127 (074ndash218) and 358 (287ndash447) times and Asian rates 146 (085ndash249) and 210 (150ndash293) times greater than EuropeanOther rates for males and females respectively (Table 67) Differences in rates between the sexes were marked but varied by ethnic group such that rates among EuropeanOther females were twice Asian and Māori females three times and Pacific females six or more times the male rate (Table 123 in Appendix 1) Pacific female rates of thyroid cancer were particularly high at 185 per 100000 (95 percent confidence interval 146ndash224) There was no evidence of changing inequalities in thyroid cancer incidence over time by ethnicity
160 Cancer Trends
Figure 71 Standardised rates of thyroid cancer for 15+ year-olds by ethnicity by sex
Table 67 Age-standardised rate ratios (SRR) and rate differences (SRD) of thyroid cancer
for Māori Pacific and Asian compared to EuropeanOther by sex
Exposure Thyroid 15+ years
Cohort Males Females
SRR (95 CI) SRD (95 CI) SRR (95 CI) SRD (95 CI)
Total Māori vs European
1981ndash1986 205 (073ndash573) 18 (-17ndash54) 214 (133ndash346) 45 (07ndash84) 1986ndash1991 155 (071ndash342) 09 (-10ndash28) 156 (102ndash239) 24 (-03ndash52) 1991ndash1996 141 (067ndash296) 09 (-13ndash30) 122 (074ndash199) 09 (-16ndash34) 1996ndash2001 163 (101ndash263) 16 (-03ndash35) 158 (118ndash212) 39 (11ndash68) 2001ndash2004 116 (065ndash207) 04 (-13ndash22) 162 (118ndash222) 42 (09ndash75) P (trend) 017 048 049 072 Pooled 155 (111ndash218) 12 (01ndash22) 161 (135ndash192) 32 (18ndash45)
Total Pacific vs European
1981ndash1986 029 (004ndash211) -12 (-23ndash -01) 552 (315ndash968) 18 (62ndash30) 1986ndash1991 067 (016ndash273) -05 (-21ndash10) 354 (203ndash615) 11 (28ndash19) 1991ndash1996 217 (075ndash625) 24 (-22ndash71) 367 (209ndash643) 11 (30ndash20) 1996ndash2001 193 (081ndash459) 23 (-18ndash65) 366 (264ndash507) 18 (11ndash25) 2001ndash2004 080 (026ndash249) -05 (-30ndash19) 201 (135ndash299) 70 (18ndash12) P (trend) 076 031 006 036 Pooled 127 (074ndash218) 06 (-09ndash20) 358 (287ndash447) 13 (94ndash17)
Total Asian vs European
1981ndash1986 358 (135ndash949) 10 (-34ndash24) 1986ndash1991 172 (042ndash705) 12 (-27ndash50) 145 (056ndash376) 19 (-40ndash79) 1991ndash1996 080 (018ndash343) -04 (-29ndash20) 123 (055ndash276) 10 (-32ndash52) 1996ndash2001 224 (086ndash585) 31 (-22ndash85) 266 (182ndash389) 11 (48ndash18) 2001ndash2004 091 (042ndash197) -03 (-22ndash17) 150 (100ndash225) 34 (-06ndash75) P (trend) 048 078 Pooled 146 (085ndash249) 10 (-07ndash27) 210 (150ndash293) 56 (21ndash92)
Notes 95 percent confidence intervals in brackets Underlying non-linear trends mean the p for trend value must be interpreted cautiously
Cancer Trends 161
272 Socioeconomic trends Thyroid cancer rates increased by about three-quarters in the high-income tertile for both males and females and by about one-half in the medium-income tertile over the period surveyed (Figure 72 and Table 124 of Appendix 1) However rates were imprecise and hence trends unstable over time Despite the pattern of varying changes over time by income in thyroid cancer there was no strong evidence of changing inequalities in incidence over time by income Although rates may have been higher in the low- compared to the high-income tertile in 1981ndash1986 they were similar across all income tertiles by 2001ndash2004 (Table 68) Pooled over time there was little evidence of any differences in rates by income Figure 72 Standardised rates of thyroid cancer for 25+ year-olds by income by sex
162 Cancer Trends
Table 68 Age- and ethnicity-standardised income rate ratios (SRR) rate differences (SRD) relative indices of inequality (RII) and slope indices of inequality (SII) of thyroid cancer by sex
Age group
Cohort Males Females
Relative inequalities
Absolute inequalities
Relative inequalities
Absolute inequalities
SRR RII (95 CI) SRD SII (95 CI) SRR RII (95 CI) SRD SII (95 CI)
Thyroid
15+ years
1981ndash1986 165 15 (05ndash43)
11 10 (-14ndash28)
183 19 (08ndash41)
32 30 (-08ndash74)
1986ndash1991 129 13 (05ndash31)
04 00 (-12ndash21)
082 07 (03ndash13)
-11 -20 (-40ndash -05)
1991ndash1996 098 09 (03ndash24)
-01 00 (-06ndash02)
118 11 (06ndash20)
06 00 (-68ndash73)
1996ndash2001 074 06 (03ndash13)
-08 -20 (-40ndash07)
116 13 (08ndash20)
13 20 (-23ndash64)
2001ndash2004 101 10 (05ndash20)
00 00 (-21ndash19)
116 13 (08ndash21)
12 20 (-29ndash74)
P (trend) 013 026 016 034 055 070 079 057 Pooled 107 10
(06ndash14) 01 00
(-11ndash09) 118 12
(09ndash15) 10 10
(-12ndash34)
Notes 95 percent confidence intervals in brackets SRRs and SRDs compare low- and high-income tertiles Underlying non-linear trends mean the p for trend value must be interpreted cautiously
Cancer Trends 163
Chapter 28 Ill-defined Sites Ill-defined cancer sites include those in which the source of the primary tumour is unclear Because of improvements over time in diagnosis and reporting the mix of cancer types included under this rubric has probably changed and may vary between ethnic and income groups rendering interpretation of trends and inequalities problematic
281 Ethnic trends Ill-defined cancer rates tended to decrease over time across ethnic groups but rates were inherently unstable (Figure 73 and Table 123 in Appendix 1) Pooled over time rates of ill-defined cancers were one-and-a-half times as high among Māori and Pacific as they were among EuropeanOther but lower among Asian (Table 69) There was no evidence that rates of Māori Pacific or Asian ill-defined cancer diagnosis were converging with EuropeanOther over time Figure 73 Standardised rates of ill-defined sites cancer for 25+ year-olds by ethnicity by sex
164 Cancer Trends
Table 69 Age-standardised rate ratios (SRR) and rate differences (SRD) of ill-defined sites cancer for Māori Pacific and Asian compared to EuropeanOther by sex
Exposure Ill-defined 25+ years
Cohort Males Females
SRR (95 CI) SRD (95 CI) SRR (95 CI) SRD (95 CI)
Total Māori vs European
1981ndash1986 205 (159ndash265) 26 (13ndash39) 127 (089ndash181) 53 (-34ndash14) 1986ndash1991 163 (124ndash213) 16 (49ndash27) 195 (155ndash246) 20 (11ndash30) 1991ndash1996 159 (124ndash204) 14 (48ndash24) 149 (115ndash193) 10 (23ndash18) 1996ndash2001 133 (104ndash169) 80 (02ndash16) 171 (139ndash209) 14 (73ndash20) 2001ndash2004 203 (160ndash258) 19 (10ndash27) 171 (132ndash221) 97 (39ndash16) P (trend) 082 051 080 097 Pooled 170 (151ndash190) 17 (12ndash21) 162 (144ndash182) 12 (84ndash15)
Total Pacific vs European
1981ndash1986 103 (055ndash192) 08 (-15ndash17) 142 (063ndash319) 81 (-14ndash31) 1986ndash1991 139 (076ndash252) 10 (-11ndash31) 102 (061ndash169) 03 (-11ndash11) 1991ndash1996 189 (124ndash287) 22 (24ndash41) 140 (088ndash221) 81 (-49ndash21) 1996ndash2001 156 (111ndash220) 14 (07ndash27) 182 (133ndash249) 16 (51ndash27) 2001ndash2004 152 (100ndash232) 95 (-20ndash21) 168 (113ndash249) 93 (04ndash18) P (trend) 052 049 014 029 Pooled 147 (118ndash183) 11 (36ndash19) 143 (113ndash182) 83 (18ndash15)
Total Asian vs European
1981ndash1986 026 (004ndash185) -18 (-31ndash -56) 090 (032ndash255) -19 (-20ndash17) 1986ndash1991 135 (069ndash262) 90 (-14ndash32) 041 (013ndash128) -13 (-23ndash -26) 1991ndash1996 038 (014ndash101) -15 (-24ndash -60) 065 (030ndash140) -71 (-17ndash31) 1996ndash2001 074 (041ndash132) -65 (-17ndash42) 082 (050ndash136) -35 (-12ndash46) 2001ndash2004 023 (009ndash061) -14 (-18ndash -97) 069 (041ndash117) -42 (-92ndash08) P (trend) 024 098 099 026 Pooled 063 (042ndash096) -87 (-15ndash -24) 069 (047ndash102) -60 (-11ndash -07)
Notes 95 percent confidence intervals in brackets Underlying non-linear trends mean the p for trend value must be interpreted cautiously
282 Socioeconomic trends Rates of ill-defined cancer tended to decrease over time across all income groups ndash but less so in the low-income tertile (Figure 74 and Table 126 in Appendix 1) Pooled over time rates of ill-defined cancer incidence were 20ndash40 percent higher among low-income people The difference in rates of male ill-defined cancer incidence by income widened over time such that by 2001ndash2004 rates among low-income people were at least one-half greater than those of high-income people (Table 70)
Cancer Trends 165
Figure 74 Standardised rates of ill-defined sites cancer for 25+ year-olds by income by sex
Table 70 Age- and ethnicity-standardised income rate ratios (SRR) rate differences (SRD)
relative indices of inequality (RII) and slope indices of inequality (SII) of ill-defined sites cancer by sex
Age group
Cohort Males Females
Relative inequalities
Absolute inequalities
Relative inequalities
Absolute inequalities
SRR RII (95 CI) SRD SII (95 CI) SRR RII (95 CI) SRD SII (95 CI)
Ill-defined
25+ years 1981ndash1986 097 09 (06ndash14)
-09 -40 (-82ndash12)
114 10 (06ndash16)
26 00 (-11ndash12)
1986ndash1991 102 12 (08ndash17)
07 50 (-08ndash11)
116 13 (09ndash18)
36 60 (-44ndash17)
1991ndash1996 131 12 (08ndash19)
78 60 (-29ndash15)
118 14 (09ndash21)
38 70 (-54ndash20)
1996ndash2001 157 19 (14ndash27)
11 17 (64ndash27)
146 18 (13ndash25)
84 13 (63ndash19)
2001ndash2004 149 16 (11ndash25)
89 10 (-34ndash24)
128 13 (09ndash18)
40 40 (-07ndash81)
P (trend) 003 005 007 003 019 038 045 094 Pooled 121 13
(11ndash15) 53 70
(36ndash10) 124 14
(12ndash17) 45 70
(20ndash12)
Notes 95 percent confidence intervals in brackets SRRs and SRDs compare low- and high-income tertiles Underlying non-linear trends mean the p for trend value must be interpreted cautiously
Part C Child and Adolescent Cancers
Chapter 29 Childhood Cancer Cancer in childhood (ages 0ndash14 years) is relatively rare About 40 percent of child cancers are leukaemias (in particular acute lymphoblastic leukaemia) and one-quarter are brain cancers (in particular neuroblastoma) with the remainder composed largely of other germ cell tumours Given this heterogeneity trends and inequalities in overall childhood cancer rates should be interpreted with caution
291 Ethnic trends There was no trend in childhood cancer incidence over time within ethnic groups (Figure 75 and Table 127 in Appendix 1)
Pooled over time Māori and EuropeanOther rates were similar but Pacific and Asian rates were elevated compared to those of EuropeanOther by over one-quarter for both Pacific (129 95 percent confidence interval 106ndash157) and Asian (122 087ndash173) (Table 71)
There were no discernable trends in ethnic inequalities in childhood cancer incidence over the 1981ndash2004 period
Figure 75 Standardised rates of childhood cancer (1ndash14 year-olds) by ethnicity
Cancer Trends 169
Table 71 Age-standardised rate ratios (SRR) and standardised rate differences (SRD) of childhood cancer for Māori Pacific and Asian compared to EuropeanOther
Exposure 1st cancer 1ndash14 years
Cohort Both sexes
SRR (95 CI) SRD (95 CI)
Total Māori vs 1981ndash1986 085 (057ndash126) -21 (-70ndash28) European 1986ndash1991 083 (059ndash116) -29 (-81ndash22)
1991ndash1996 094 (068ndash132) -09 (-60ndash42) 1996ndash2001 084 (059ndash120) -23 (-68ndash22) 2001ndash2004 084 (057ndash124) -23 (-72ndash27) P (trend) 098 097 Pooled 086 (073ndash101) -21 (-43ndash01)
Total Pacific 1981ndash1986 111 (067ndash182) 15 (-60ndash89) vs European 1986ndash1991 160 (109ndash234) 10 (06ndash20)
1991ndash1996 122 (077ndash195) 36 (-53ndash12) 1996ndash2001 125 (084ndash184) 35 (-32ndash10) 2001ndash2004 117 (075ndash184) 25 (-49ndash99) P (trend) 059 084 Pooled 129 (106ndash157) 44 (07ndash81)
Total Asian vs 1981ndash1986 149 (062ndash359) 68 (-11ndash25) European 1986ndash1991 123 (049ndash308) 39 (-15ndash23)
1991ndash1996 094 (048ndash182) -10 (-11ndash90) 1996ndash2001 144 (090ndash229) 63 (-30ndash16) 2001ndash2004 101 (058ndash177) 02 (-79ndash83) P (trend) 061 062 Pooled 122 (087ndash173) 34 (-30ndash97)
Notes 95 percent confidence intervals in brackets Underlying non-linear trends mean the p for trend value must be interpreted cautiously
292 Socioeconomic trends Rates decreased by 16 percent among the high-income tertile over the period surveyed (p for trend 004) but no clear trends were evident in the other tertiles (Figure 76 and Table 128 in Appendix 1)
Pooled over time children from low-income backgrounds had between one-half and two-thirds the rate of cancer of children from high-income backgrounds (for example the RII was 05 95 percent confidence interval 04ndash07) (Table 72) There was no trend in this inequality over time
170 Cancer Trends
Figure 76 Standardised rates of childhood cancer (1ndash14 year-olds) by income
Table 72 Age- and ethnicity-standardised income rate ratios (SRR) rate differences (SRD) relative indices of inequality (RII) and slope indices of inequality (SII) of childhood cancer
Age group Cohort Both sexes
Relative inequalities Absolute inequalities
SRR RII (95 CI) SRD SII (95 CI)
1st cancer
1ndash14 years 1981ndash1986 1986ndash1991 1991ndash1996 1996ndash2001 2001ndash2004 P (trend) Pooled
062 076 077 060 073 092 069
05 (02ndash12) 06 (03ndash11) 07 (04ndash14) 04 (02ndash08) 06 (03ndash12)
092 05 (04ndash07)
-71 -45 -42 -71 -42 075 -55
-90 (-16ndash -29) -90 (-18ndash -06) -50 (-14ndash41) -13 (-18ndash -78)
-70 (-10ndash -31) 078 -90 (-13ndash -57)
Notes 95 percent confidence intervals in brackets SRRs and SRDs compare low- and high-income tertiles Underlying non-linear trends mean the p for trend value must be interpreted cautiously
Cancer Trends 171
Chapter 30 Adolescent Cancer About 20 percent of adolescent (here defined as the 15ndash24 age group) cancers are lymphomas another 20 percent are germ-cell tumours and approximately 10 percent each are brain cancers melanomas and leukaemias Given this heterogeneity trends and inequalities in overall adolescent cancer rates should be interpreted with caution
301 Ethnic trends EuropeanOther adolescent cancer rates increased by 37 percent over the period surveyed Pacific rates decreased by 58 percent and Asian rates by 37 percent (Figure 77 and Table 129 in Appendix 1)
Pooled over time Māori rates were 079 times those of EuropeanOther (95 percent confidence interval 070ndash089) but there was no substantial difference in rates between Pacific Asian and EuropeanOther However due to the above-mentioned divergent trends over time in rates by ethnic group European rates were about twice Pacific and Asian rates by 2001ndash2004 (Table 73) although none of the trends in SRR or SRD had p values less than 005
Figure 77 Standardised rates of adolescent cancer (15ndash24 year-olds) by ethnicity
172 Cancer Trends
Table 73 Age-standardised rate ratios (SRR) and standardised rate differences (SRD) of adolescent cancer for Māori Pacific and Asian compared to EuropeanOther
Exposure 1st cancer 15ndash24 years
Cohort Both sexes
SRR (95 CI) SRD (95 CI)
Total Māori vs 1981ndash1986 100 (078ndash128) -01 (-70ndash68) European 1986ndash1991 081 (062ndash106) -57 (-12ndash10)
1991ndash1996 068 (052ndash088) -11 (-17ndash -43) 1996ndash2001 077 (061ndash099) -77 (-15ndash -08) 2001ndash2004 071 (054ndash093) -11 (-19ndash -30) P (trend) 012 009 Pooled 079 (070ndash089) -68 (-99ndash -37)
Total Pacific 1981ndash1986 130 (088ndash193) 84 (-57ndash22) vs European 1986ndash1991 170 (124ndash233) 21 (55ndash36)
1991ndash1996 130 (095ndash178) 10 (-34ndash23) 1996ndash2001 105 (076ndash145) 16 (-99ndash13) 2001ndash2004 040 (026ndash063) -23 (-31ndash -15) P (trend) 011 006 Pooled 115 (098ndash135) 50 (-09ndash11)
Total Asian vs 1981ndash1986 101 (040ndash252) 02 (-25ndash26) European 1986ndash1991 069 (030ndash158) -91 (-26ndash79)
1991ndash1996 097 (062ndash154) -09 (-16ndash14) 1996ndash2001 088 (061ndash128) -39 (-15ndash72) 2001ndash2004 046 (028ndash075) -20 (-30ndash -11) P (trend) 024 017 Pooled 081 (061ndash109) -61 (-14ndash16)
Notes 95 percent confidence intervals in brackets Underlying non-linear trends mean the p for trend value must be interpreted cautiously
302 Socioeconomic trends Rates increased in all income groups over the period surveyed increases ranging from 3 percent in the medium-income tertile to 35 percent in the low-income tertile (Figure 78 and Table 130 in Appendix 1)
Rates of adolescent cancer were about 20 percent to one-third lower in adolescents with low-income backgrounds with no evidence of change in this inequality over time (Table 74)
Cancer Trends 173
Figure 78 Standardised rates of adolescent cancer (15ndash24 year-olds) by income
Table 74 Age- and ethnicity-standardised income rate ratios (SRR) rate differences (SRD) relative indices of inequality (RII) and slope indices of inequality (SII) of adolescent cancer
Age group Cohort Both sexes
Relative inequalities Absolute inequalities
SRR RII (95 CI) SRD SII (95 CI)
1st cancer
15ndash24 years 1981ndash1986 1986ndash1991 1991ndash1996 1996ndash2001 2001ndash2004 P (trend) Pooled
080 079 105 065 087 096 083
08 (06ndash12) 07 (05ndash10) 10 (07ndash14) 05 (03ndash08) 09 (06ndash13)
082 07 (06ndash09)
-58 -72 17 -14
-46 081 -61
-60 (-19ndash70) -11 (-19ndash -34)
-10 (-19ndash17) -22 (-30ndash -15)
-50 (-17ndash63) 058 -10 (-13ndash -57)
Notes 95 percent confidence intervals in brackets SRRs and SRDs compare low- and high-income tertiles Underlying non-linear trends mean the p for trend value must be interpreted cautiously
174 Cancer Trends
Part D Conclusions
Cancer Trends 175
Conclusions Social inequalities in cancer incidence reflect socially patterned differences in exposure and susceptibility to environmental carcinogens (for example tobacco smoke some industrial chemicals ultraviolet radiation and certain viruses and bacteria) and lifestyles (for example drug use including alcohol and tobacco dietary carcinogens low fruit and vegetable intake sedentary behaviour obesity and sexual and reproductive behaviours) Differences in access to and quality of health services may generate inequalities in cancer survival but generally not incidence (the major exception is cervical cancer and to a much lesser extent colorectal and breast cancers for which screening can detect pre-cancerous lesions leading to a reduction in cancer incidence)
For this reason differences in cancer incidence between ethnic or income groups largely reflect differences in social conditions and lifestyles and can be used as an lsquointegratorrsquo or marker of such differences So analysis of trends in inequalities in cancer incidence can assist in evaluation of our success in reducing social inequality and in the development of health and broader social policy Such analyses also provide a planning tool with regard to future development and funding of cancer services ndash to the extent that past trends can predict future trajectories Information about trends in risk factors (in the case of those cancers for which risk factors are understood) can also be incorporated into predictive models to improve the accuracy of forecasts
This section will briefly summarise this reportrsquos findings with regard to trends in inequalities in cancer incidence Lung cancer as representative of smoking-related cancers is first reviewed followed by those non-smoking-related cancers for which this analysis has revealed potentially significant inequalities or trends in inequalities Finally implications of these findings for health monitoring and policy are briefly commented on
It should be noted that the purpose of this report is to provide a broad overview of findings rather than an in-depth interpretation of patterns for each cancer Future publications from CancerTrends data will provide more detailed analysis and interpretation for selected cancers of interest
Figures 79 and 80 summarise at a glance the underlying incidence rates over time for 15 major cancer types pooling ages and sexes and adjusting for ethnicity as regards the income analyses
Cancer Trends 177
Figure 79 Summary of incidence by ethnicity for main cancers sexes combined
178 Cancer Trends
Figure 80 Summary of incidence by income tertile for main cancers sexes combined
Cancer Trends 179
Smoking-related cancers Smoking-related cancers include the vast majority (more than 80 percent) of lung cancers but also substantial proportions of upper aerodigestive cancers as well as pancreatic and bladder cancers Here lung cancer is used to represent the wider group of smoking-related cancers
Wide ethnic differences and socioeconomic gradients in tobacco use are well recognised in New Zealand90 and are reflected in inequalities in lung cancer incidence Pooling over time and adjusting for age Māori were over twice (for males) or three times (for females) as likely to develop lung cancer as EuropeanOther people moreover the gap widened over time Pacific people (of both sexes) were also at higher risk (about 15-fold overall) and female (but not male) rates increased over time (Table 103 in Appendix 1) such that inequalities between Pacific and EuropeanOther females tended to widen over time There was no significant inequality or any trend in rates for Asian people (of both sexes)
Unsurprisingly low-income people (of both sexes) were at least 1frac12 times as likely to develop lung cancer as high-income counterparts pooling over age and time and adjusting for differences in ethnic composition The size of this gap increased over time especially among females and when measured on an absolute scale most probably reflecting the differential phasing of the tobacco epidemic by both sex and SEP
Roughly similar inequalities and trends in inequalities were seen in the other smoking-related cancers although differences were not always statistically significant This may reflect the smaller fraction of these cancers (compared to lung cancer) attributable to smoking alone such that differences in magnitude and timing of the tobacco epidemic between social groups were less clearly reflected in incidence rates Interestingly non-EuropeanOther ethnic groups had significantly lower (and stable) incidence rates of bladder cancer than the EuropeanOther group (for which rates increased over time) despite tobacco smoking being an established major risk factor for this cancer the reasons for this are unclear
Non-smoking-related cancers With some exceptions social inequalities in non-smoking related cancer incidence were smaller than those in smoking-related cancer incidence often surprisingly so in terms of income inequalities The following analysis is restricted to 12 cancers for which incidence was sufficient to generate stable group-specific rates for comparison breast cervix colorectal endometrial kidney leukaemia liver melanoma NHL ovary prostate and stomach Less emphasis has been placed on Asian inequalities as the generally low incidence rates among Asian people are thought to largely reflect a healthy migrant effect (which will wash out over time)
180 Cancer Trends
Cancers showing relatively large social inequalities in incidence Six cancers were found to exhibit large ethnic andor socioeconomic inequalities in their incidence cervix colorectal endometrial liver melanoma and stomach Note that in the case of several of these cancers (stomach cervix and colorectal) smoking may in fact make a contribution albeit minor to observed inequalities or trends in inequalities
Cervix Pooling over age and time incidence rates of invasive cervical cancer among Māori and Pacific women were at least twice those of their EuropeanOther counterparts However among younger women (aged less than 65 years) at least the gap has narrowed dramatically and steadily since 1991 coinciding with the introduction of the NCSP By contrast an inequality may now be emerging between EuropeanOther and Asian women (who have relatively low rates of participation in screening coverage rates are also lower for Māori and Pacific than EuropeanOther women but are improving) Income inequalities are also evident (approximately 15 fold-overall) again most probably reflecting differences in participation in screening between income strata These inequalities were stable over the observation period when measured on a relative scale yet absolute differences in incidence reduced over time Given the concern that screening programmes may lead to a widening of inequalities (because disadvantaged groups generally participate to a lesser extent) this finding represents a major public health success having said this inequalities in cervical cancer incidence (or participation in screening) are still a long way from being eliminated
Colorectal No income gradient is evident in colorectal cancer incidence but ethnic differences are marked Māori Pacific people and Asian people (of both sexes) are only half as likely to develop colorectal cancer as EuropeanOther people adjusting for age For Māori this gap appears to be narrowing although the trend is statistically significant only for males Contrary to earlier findings on colorectal cancer mortality40 91 this study found no evidence that inequalities in incidence are narrowing for Pacific people The reason for the lower incidence of colorectal cancer among Māori and Pacific people is not clear however the finding that this differential may be narrowing (at least for Māori) is of concern The trend appears to be driven by an absolute increase in incidence rates among Māori males but may also reflect declining rates among younger EuropeanOther males (and females) ndash possibly resulting from a cohort effect involving the latter ethnic group in particular92
Endometrial No consistent income gradient is evident in endometrial cancer incidence but large ethnic inequalities exist with Māori rates about one-and-a-half times and Pacific rates nearly twice EuropeanOther rates pooled over time and adjusting for age This inequality may have increased over the observation period for Pacific compared to EuropeanOther women although the trend did not quite reach statistical significance Obesity is a major risk factor for this cancer and may explain (part of) the ethnic inequality observed
Cancer Trends 181
Liver Primary liver cancer is relatively uncommon so group-specific rates are not particularly stable Nevertheless it is clear that moderate income inequalities exist rates are 20ndash50 percent higher among low-income compared to high-income groups pooling over age and time and adjusting for ethnicity By contrast ethnic inequalities are large (between three- and eight-fold higher than the EuropeanOther reference group depending on ethnicity and sex) which is consistent with previous research27 28
although trends in inequalities are unclear The most likely explanation for this relates to differences in rates of chronic infection with hepatitis B virus between social groups (largely antedating the introduction of immunisation against this infection) If this is the case it could be that at some future date primary liver cancer incidence rates will begin to decline in all ethnic groups and absolute inequalities will ultimately disappear
Melanoma Māori and Pacific people were one-fifth to one-tenth as likely to develop melanoma as EuropeanOther people (pooling over age and time) and trends in these relative inequalities were non-significant That is melanoma rates increased similarly in all ethnic groups over time Rates in low-income strata were about one-quarter lower than in high-income strata again with similar increases across income groups over time resulting in essentially stable relative inequalities Explanations for these inequalities most likely relate to differences in susceptibility (especially by ethnicity) and exposure (especially by socioeconomic group) to episodic ultraviolet radiation
Stomach Stomach cancer rates are falling over time but large ethnic inequalities persist Māori and Pacific peoples being two to three times as likely to develop this cancer as EuropeanOther people (pooling over age and time) Furthermore for Māori females (and possibly for Pacific females) this inequality widened over the observation period when measured on a relative scale Low-income people (of both sexes) had slightly higher rates of stomach cancer than high-income counterparts (of both sexes pooled over age and time) but for females the inequality narrowed on both absolute and relative scales driven largely by women older than 65 years Inequalities and trends in inequalities may reflect cohort differences in Helicobacter pylori infection rates among other factors (including tobacco smoking)
Cancers showing relatively small or no social inequalities in incidence All other non-smoking-related cancers showed small or no ethnic and income inequalities in incidence rates or exhibited unstable rates (due to small numbers) making inequality analysis difficult However given their relatively large numbers some mention should be made of female breast cancer and prostate cancer
182 Cancer Trends
Breast Pooling over age and time Māori women were slightly more likely to be diagnosed with breast cancer than EuropeanOther women (the SRR was 117 and the SRD 24 per 100000) Moreover Māori rates increased faster than EuropeanOther rates resulting in widening relative inequalities (an SRR of 107ndash123) but did not increase in a monotonic manner with the result that the trend was not statistically significant (p for trend 013) At the same time Māori women experienced a four-fold increase in absolute inequalities compared to EuropeanOther women (the SRD increasing from 84 to 39 per 100000 p for trend 006) By contrast Pacific women had slightly lower rates (an SRR of 090) and there was no trend towards inequality Asian women experienced moderately lower risk (an SRR of 071) which did not vary over time Low-income women were slightly less likely to develop breast cancer than high-income counterparts (with a pooled of SRR 090) this ratio did not vary over time
Explanations for these ethnic trends are unclear but most likely are unrelated to differential participation by ethnicity in the BreastScreen Aotearoa programme (which was only introduced recently) It must also be noted that most of what we know about breast cancer risk factors would predict that EuropeanOther breast cancer incidence rates should be higher than the corresponding Māori rates yet the converse is true Further research is needed in this respect
Prostate Large increases in prostate cancer incidence have occurred among all ethnic and income groups in recent times probably mostly due to opportunistic PSA testing Few differences were found in observed prostate cancer incidence rates by ethnicity (adjusting for age and time) except for a lower rate among Asian men Indeed the lsquostep-lockrsquo increases in Māori Pacific and EuropeanOther prostate cancer incidence rates might be considered surprising as although PSA testing rates have so far been lower among Māori and Pacific than European men (by one-half to one-third depending on age and period)93 no significant trends in ethnic inequalities in prostate cancer incidence have been observed except for an increasing inequality over time favouring Asian men when measured on an absolute scale
Low-income men were about 10ndash20 percent less likely to be diagnosed with this cancer than their high-income counterparts with little suggestion that the difference has changed over the past quarter-century ndash again despite the likelihood that PSA testing rates have thus far been lower among low income than high income men
Implications for policy Inequalities in cancer incidence are an important consideration in regard to health policy development service planning and resource allocation for cancer services This report indicates that the major driver of inequalities across all cancers is tobacco smoking This finding reinforces the need to refresh efforts aimed at reducing tobacco consumption by Māori and low-income groups in particular There are currently also substantial inequalities in the incidence of several cancers unrelated to exposure to tobacco smoke Some of these cancers such as endometrial cancer are linked to obesity and the observed inequalities reinforce the need to address differential
Cancer Trends 183
exposure to the lsquoobesogenicrsquo environment by ethnicity and SEP94 Inequalities in incidence of other cancers such colorectal and primary liver cancer may reflect strong cohort effects Incidence of liver cancer in particular should dissipate as birth cohorts immunised against hepatitis B replace earlier non-immunised cohorts with differentially high infection rates by ethnicity and SEP Inequalities in the incidence of cancers attributable to other infectious agents such as stomach cancer (Helicobacter pylori) and cervical cancer (oncogenic HPV) may also narrow in the future as chronic infection rates reduce overall and simultaneously converge across social groups This is already happening in the case of cervical cancer reflecting the success of the National Cervical Screening Programme in enhancing coverage across most social groups (although screening coverage still remains lower among some ethnic groups than among others) A key policy aim for the future should be to mitigate the rising trend in colorectal cancer incidence among Māori ndash a reduction in ethnic inequality here represents success if it results from falling incidence among Europeans but failure if it reflects increasing incidence among Māori (which appears to be the case currently)
Implications for monitoring Inequalities in cancer cannot be interpreted without simultaneous consideration of incidence survival and mortality (for each major cancer by age cohort and period) The NZCMS provides a means of monitoring inequalities in mortality as previously reported39 40 95 By linking cancer registrations to Census records (anonymously and probabilistically) this report performs the same function for incidence Unfortunately time series data for cancer survival with sufficient information to analyse inequalities directly or (again) by linkage to Census data have only recently become available from the NZCR In the near future it will thus be possible to monitor trends in all three epidemiological variables (cancer incidence survival and mortality) simultaneously allowing fuller interpretation of the drivers of difference Greater understanding and more robust measurement of inequalities can help to optimise cancer policy and resource allocation ensuring better sooner and more convenient cancer services for all
184 Cancer Trends
References 1 Minister of Health The New Zealand Cancer Control Strategy Wellington Ministry of Health and the
New Zealand Cancer Control Trust 2003 2 Danaei G Vander Hoorn S Lopez AD Murray CJL Ezzati M Causes of cancer in the world
comparative risk assessment of nine behavioural and environmental risk factors Lancet 2005366(9499)1784-93
3 Ministry of Health Cancer in New Zealand Trends and Projections Wellington Ministry of Health 2002
4 Jeffreys M Stevanovic V Tobias M Lewis C Ellison-Loschmann L Pearce N et al Ethnic inequalities in cancer survival in New Zealand linkage study American Journal of Public Health 200595(5)834-7
5 Cormack D Ratima M Robson B Brown R Purdie G Access to cancer services for Maumlori A report prepared for the Ministry of Health Wellington Te Rōpū Rangahau Hauora a Eru Pōmare University of Otago 2005
6 Jeffreys M Sarfati D Stevanovic V Tobias M Lewis C Pearce N et al Socioeconomic inequalities in cancer survival in New Zealand the role of extent of disease at diagnosis Cancer Epidemiology Biomarkers and Prevention 200918(3)915-21
7 Ajwani S Blakely T Robson B Bonne M Tobias M Decades of Disparity Ethnic mortality trends in New Zealand 1980-1999 (also available at httpwwwwnmedsacnznzcms-infohtml) Wellington Ministry of Health 2003
8 Blakely T Ajwani S Robson B Tobias M Bonne M Decades of Disparity Widening ethnic mortality gaps from 1980 to 1999 NZ Med J 2004117(1199)U995
9 Shaw C Blakely T Sarfati D Fawcett J Hill S Varying evolution of the New Zealand lung cancer epidemic by ethnicity and socioeconomic position (1981-1999)[see comment] NZ Med J 2005118(1213)U1411
10 Foster FH Cancer registry in New Zealand National Cancer Institute Monographs 19774741-4 11 Tukuitonga CF Solomon N Stewart A Incidence of cancer among Pacific Island people in New
Zealand[comment] NZ Med J 1992105(946)463-6 12 Newman PD Mason BH Holdaway IM Kay RG Arthur JF Hitchcock GC Incidence and clinical
features of breast cancer in the Auckland region NZ Med J 1992105(931)117-20 13 Armstrong W Borman B Breast cancer in New Zealand trends patterns and data quality NZ MedJ
1996109221-24 14 Lawes C Tukuitonga CF Scragg R K The epidemiology of breast cancer in Pacific Women in New
Zealand NZ Med J 1999112354-57 15 McCredie M Paul C Skegg DC Williams S Breast cancer in Maori and non-Maori women Int J
Epidemiol 199928189-95 16 Foster FH Colon and rectum cancer in the New Zealand population National Cancer Institute
Monographs 197747173-5 17 Sutton TD Eide TJ Jass JR Trends in colorectal cancer incidence and histologic findings in Maori
and Polynesian residents of New Zealand Cancer 199371(12)3839-45 18 Thompson AG Regional differences in incidence of gastric and colonic cancer in the Maori of New
Zealand Postgraduate Medical Journal 200278(921)419-21 19 Smith AH Pearce NE Joseph JG Major colorectal cancer aetiological hypotheses do not explain
mortality trends among Maori and non-Maori New Zealanders International Journal of Epidemiology 198514(1)79-85
20 Pearce N Bethwaite P Social class and male cancer mortality in New Zealand 1984-7 NZ Med J 1997110200-02
21 Pearce N Howard J Occupation social class and male cancer mortality in New Zealand 1974-78 Int J Epidemiol 198615456-62
22 Pearce N Sheppard R Howard J et al Time trends and occupational differences in cancer of the testis in New Zealand Cancer 198759(9)1677-82
23 Stewart RJ Stewart AW Stewart JM Isbister WH Cancer of the stomach in New Zealand 1970-74 Australian amp New Zealand Journal of Surgery 198252(4)363-9
24 Dockerty JD Marshall S Fraser J Pearce N Stomach cancer in New Zealand time trends ethnic group differences and a cancer registry-based case-control study International Journal of Epidemiology 199120(1)45-53
Cancer Trends 185
25 Dockerty JD Cox B Cockburn MG Childhood leukaemias in New Zealand time trends and ethnic differences British Journal of Cancer 199673(9)1141-7
26 Simmons GC Yeong ML Lee SP The association of hepatitis B viral infection and hepatocellular carcinoma in New Zealand NZ Med J 198396(739)669-71
27 Blakely T Bates M Garrett N Robson B The incidence of hepatocellular carcinoma in New Zealand NZ Med J 1998111471-74
28 Blakely T Bates M Baker M Tobias M Hepatitis B carriage explains the excess rate of hepatocellular carcinoma for Maori Pacific Island and Asian people compared to Europeans in New Zealand Int J Epidemiol 199928204-10
29 Blakely T Robson B Atkinson J Sporle A Kiro C Unlocking the numerator-denominator bias I Adjustment ratios by ethnicity for 1991-94 mortality data NZ Med J 200211539-43
30 Blakely T Atkinson J Unlocking the Numerator-Denominator Bias 1991-94 Deaths NZCMS Technical Report No 2 (Also at httpwwwwnmedsacnznzcms-infohtml) Wellington Department of Public Health Wellington School of Medicine University of Otago 2001
31 Ajwani S Blakely T Robson B Atkinson J Fawcett J Kiro K Unlocking the numerator-denominator bias for the 1980s and 1990s NZCMS Technical Report No 4 ISBN 0-473-09111-9 (Also at httpwwwwnmedsacnznzcms-infohtml) Wellington Department of Public Health Wellington School of Medicine and Health Sciences University of Otago 2002
32 Ajwani S Blakely T Robson B Atkinson J Kiro C Unlocking the numerator-denominator bias III adjustment ratios by ethnicity for 1981-1999 mortality data The New Zealand Census-Mortality Study NZ Med J 2004116(1175)6
33 Shaw C Atkinson J Blakely T (Mis)classification of ethnicity on the New Zealand Cancer Registry 1981-2004 NZ Med J 2009122(1294)10-22
34 Pomare E Keefe-Ormsby V Ormsby C Pearce N Reid P Robson B et al Hauora Maori Standards of Health III Wellington Eru Pomare Maori Health Research Centre 1995
35 Ministry of Health Our Health Our Future Wellington NZ Ministry of Health 1999 36 Blakely T Tobias M Robson B Ajwani S Bonne M Woodward A Widening ethnic mortality
disparities in New Zealand 1981-99 Soc Sci Med 200561(10)2233-51 37 Howden-Chapman P Tobias M editors Social Inequalities in Health New Zealand 1999 Wellington
NZ Ministry of Health 2000 38 Blakely T Fawcett J Atkinson J Tobias M Cheung J Decades of Disparity II Socioeconomic
mortality trends in New Zealand 1981-1999 Wellington Ministry of Health 2005 39 Blakely T Tobias M Atkinson J Inequalities in mortality during and after restructuring of the New
Zealand economy repeated cohort studies BMJ 2008336371-75 40 Blakely T Tobias M Atkinson J Yeh L-C Huang K Tracking Disparity Trends in ethnic and
socioeconomic inequalities in mortality 1981-2004 Wellington Ministry of Health 2007 41 Martikainen P Valkonen T Diminishing educational differences in breast cancer mortality among
Finnish women a register-based 25-year follow-up ajph 200090277-80 42 Singh GK Miller BA Hankey BF Changing Area Socioeconomic Patterns in US Cancer Mortality
1950-1998 Part II--Lung and Colorectal Cancers J Natl Cancer Inst 200294(12)916-25 43 New Zealand Health Information Service CancerNew Registrations and Deaths 1996 Wellington
Ministry of Health 2000 44 Statistics New Zealand Statistical standard for ethnicity Statistics New Zealand 2005 45 Statistics New Zealand A Report on the Post-enumeration Survey 2001 Wellington Statistics New
Zealand 2002 46 Fawcett J Atkinson J Blakely T Record linkage of census and mortality 2001-04 records New
Zealand Census-Mortality Study Technical Report No 6 Wellington Health Inequalities Research Programme University of Otago Wellington 2008
47 Blakely T Salmond C Probabilistic record linkage and a method to calculate the positive predictive value Int J Epidemiol 2002311246-52
48 Blakely T Salmond C Woodward A Anonymous linkage of New Zealand mortality and Census data Aust NZ J Public Health 20002492-95
49 Hill S Atkinson J Blakely T Anonymous record linkage of census and mortality records 1981 1986 1991 1996 census cohorts NZCMS Technical Report No 3 ISBN 0-473-09110 (Also at httpwwwwnmedsacnznzcms-infohtml) Wellington Department of Public Health Wellington School of Medicine and Health Sciences University of Otago 2002
50 Lash B Documentation of the process and results of linking cancer data with census data 1981 to 2001 Wellington Statistics New Zealand 2008
186 Cancer Trends
51 Atkinson J Shaw C Blakely T Stanley J Sloane K Linkage of Census and Cancer Registrations 1981-2004 CancerTrends Technical Report No 1 Wellington Department of Public Health University of Otago Wellington 2010
52 Jensen J Income equivalences and the estimation of family expenditure on children Wellington Department of Social Welfare (unpublished) 1988
53 Blakely T The New Zealand Census-Mortality Study Socioeconomic inequalities and adult mortality 1991-94 Also at httpwwwwnmedsacnznzcms-infohtml Wellington Ministry of Health 2002258
54 Hayes L Berry G Sampling variability of the Kunst-Mackenbach relative index of inequality J Epidemiol Community Health 200256762-65
55 Mackenbach J Kunst A Measuring the magnitude of socio-economic inequalities in health an overview of available measures illustrated with two examples from Europe Soc Sci Med 199744757-71
56 Rothman K Greenland S Lash T Modern Epidemiology 3rd ed Philadelphia Lippincott WIlliams amp Wilkins 2008
57 Ministry of Health Cancer New Registrations and Deaths 2005 Wellington Ministry of Health 2008 58 New Zealand Health Information Services Cancer Patient Survival Covering the Period 1994 to 2003
Wellington Ministry of Health 2006 59 Kogevinas M Garcia-Closas M Trichopoulos D Urinary Bladder Cancer In Adami HO Hunter D
Trichopoulos D editors Textbook of Cancer Epidemiology Second ed Oxford Oxford University Press 2008
60 World Cancer Research FundAmerican Institute for Cancer Research Food Nutrition Physical Activity and the Prevention of cancer A Global Perspective Washington DC American Institute for Cancer Research 2007
61 Savitz D Trichopoulos D Brain Cancer In Adami HO Hunter D Trichopoulos D editors Textbook of Cancer Epidemiology Second Edition New York Oxford University Press 2008
62 Hankinson S Tamimi R Hunter D Breast Cancer In Adami HO Hunter D Trichopoulos D editors Textbook of Cancer Epidemiology second edition New York Oxford University Press 2008
63 Richardson A Cox B Brown T Smale P al e The impact of breast cancer screening on breast cancer registrations in New Zealand NZ Med J 2005118(1209)U1291
64 Ylitalo N Stuver S Adami H Cervical Cancer In Adami H Hunter D trichopoulos D editors A Textbook of Cancer Epidemiology Second edition New York Oxford University Press 2008
65 Potter J Hunter D Colorectal Cancer In Adami H Hunter D Trichopoulos D editors Textbook of Cancer Epidemiology Second ed New York Oxford University Press 2008
66 Devivo I Persson I Adami H Endometrial Cancer In Adami H Hunter D trichopoulos D editors A Textbook of Cancer Epidemiology second edition New York Oxford University Press 2008
67 Stuver S Trichopoulos D Cancer of the liver and biliary tract In Adami HO Hunter D Trichopoulos D editors Textbook of Cancer Epidemiology Second Edition New York Oxford University Press 2008
68 Melbye M Smedby K Trichopoulos D Non-Hodgkin Lymphoma In Adami HO Hunter D Trichopoulos D editors Textbook of Cancer Epidemiology Second ed Oxford Oxford University Press 2008
69 Cho E Lindblad P Adami HO Kidney Cancer In Adami HO Hunter D Trichopoulos D editors Textbook of Cancer Epidemiology Second Edition New York Oxford University Press 2008
70 Boffetta P Trichopoulos D Cancer of the lung larynx and pleura In Adami H Hunter D Trichopoulos D editors Textbook of Cancer Epidemiology Second ed New York Oxford University Press 2008
71 Petridou E Pourtsidis A Trichopoulos D Leukemias In Adami HO Hunter D Trichopoulos D editors Textbook of Cancer Epidemiology Second ed Oxford Oxford University Press 2008
72 Brennan P Mucci L Adami HO Oral and Pharyngeal Cancer In Adami HO Hunter D Trichopoulos D editors Textbook of Cancer Epidemiology Second ed Oxford Oxford University Press 2008
73 Chang E Adami HO Nasopharyngeal Carcinoma In Adami HO Hunter D Trichopoulos D editors Textbook of Cancer Epidemiology Second ed Oxford Oxford University Press 2008
74 Green A Van Der Pols J Hunter D Skin cancer In Adami HO Hunter D Trichopoulos D editors Textbook of Cancer Epidemiology Second Edition New York Oxford University Press 2008
75 De Roos A Baris D Weiss NS L H Multiple Myeloma In Schottenfield D Fraumeni JF Jr editors Cancer Epidemiology and Prevention Third ed Oxford Oxford University Press 2006
76 Melbye M Hjalgrim H Adami HO Hodgkin Lymphoma In Adami HO Hunter D Trichopoulos D editors Textbook of Cancer Epidemiology Second ed Oxford Oxford University Press 2008
Cancer Trends 187
77 Nyren O Adami HO Esophageal Cancer In Adami HO Hunter D Trichopoulos D editors Textbook of Cancer Epidemiology Second ed Oxford Oxford University Press 2008
78 Webb P Gertig D Hunter D Ovarian Cancer In Adami HO Hunter D Trichopoulos D editors Textbook of Cancer Epidemiology Second Edition New York Oxford University Press 2008
79 Ekbom A Trichopoulos D Pancreatic cancer In Adami HO Hunter D Trichopoulos D editors Textbook of Cancer Epidemiology Second Edition New York Oxford University Press 2008
80 Mucci L Signorello L Adami HO Prostate Cancer In Adami HO Hunter D Trichopoulos D editors textbook of cancer Epidemiology Second ed Oxford Oxford University Press 2008
81 Nyren O Adami HO Stomach Cancer In Adami HO Hunter D Trichopoulos D editors Textbook of Cancer Epidemiology Second ed Oxford Oxford University Press 2008
82 Ministry of Health Cancer Incidence Projections 1999ndash2003 update Wellington Ministry of Health 2008
83 Richiardi L Tamimi R Adami H Testicular Cancer In Adami H Hunter D Trichopoulos D editors Textbook of Cancer Epidemiology Second ed New York Oxford University Press 2008
84 Research IAoC GLOBOCAN 2002 Lyon IARC 2005 85 Garner M Turner M Ghadirian P Krewski D Epidemiology of testicular cancer an overview
International Journal of Cancer 2005116(3)331-9 86 Coupland CAC Forman D Chilvers CED Davey G Pike MC Oliver RTD Maternal risk factors for
testicular cancer a population-based case-control study (UK) Cancer Causes amp Control 200415(3)277-83
87 Grotmol T Weiderpass E Tretli S Conditions in utero and cancer risk European Journal of Epidemiology 200621(8)561-70
88 Weir HK Marrett LD Kreiger N Darlington GA Sugar L Pre-natal and peri-natal exposures and risk of testicular germ-cell cancer International Journal of Cancer 200087(3)438-43
89 Hall P Adami HO Thyroid Cancer In Adami HO Hunter D Trichopoulos D editors Textbook of Cancer Epidemiology Second Edition New York Oxford University Press 2008
90 Ministry of Health Inhaling Inequality - Tobaccos contribution to health inequality in New Zealand Wellington Ministry of Health 2001
91 Shaw C Blakely T Sarfati D Fawcett J Peace J Trends in colorectal cancer mortality by ethnicity and socio-economic position in New Zealand 1981-99 one country many stories Aust NZ J Public Health 200630(1)64-70
92 Cox B Little J Reduced risk of colorectal cancer among recent generations in New Zealand British Journal of Cancer 199266(2)386-90
93 Ministry of Health Incidence and Prevalence of PSA Testing in New Zealand Men gt50 Years Unpublished report 2008
94 Ministry of Health Embodying Social Rank How body fat varies with social status gender and ethnicity in New Zealand Public Health Intelligence Occasional Bulletin Wellington Ministry of Health 2006
95 Tobias M Blakely T Matheson D Rasanathan K Atkinson J Changing trends in indigenous inequalities in mortality lessons from New Zealand Int J Epidemiol 200938(6)1711-22
188 Cancer Trends
Appendices
Appendix 1 Tables of Rates This appendix includes tables of all standardised rates that are graphed in figures earlier in the report The tables also include standardised rates pooled over time and p values for statistical tests of trend
Rather than list notes after every table the following is noted here bull The standard population used for the age- and ethnicity-standardised rates by
income was the World Health Organization world standard further stratified by ethnic proportions in New Zealand
bull 95 percent confidence intervals are symmetric except in cases where the lower confidence limit would be less than zero In these instances confidence intervals are determined for the log transformation of the rate then exponentiated
bull 95 percent confidence intervals are shown in parentheses bull p values for trend assume a linear trend In instances where non-linear trends are
expected (for example for rates that rise then fall) the p for trend is misleading and cohort-specific confidence intervals should be examined instead
bull p values are only presented when estimates are available for all five cohorts
Table 75 Age-standardised rates of first cancer by ethnic group
1st cancer Age group
Cohort Total Māori SR (95 CI)
Total Pacific SR (95 CI)
Total Asian SR (95 CI)
EuropeanOther SR (95 CI)
Males
25+ years 1981ndash1986 555 (512ndash598) 506 (404ndash608) 292 (219ndash365) 507 (499ndash515) 1986ndash1991 554 (515ndash592) 622 (530ndash714) 422 (344ndash501) 527 (519ndash535) 1991ndash1996 684 (644ndash724) 575 (510ndash641) 393 (329ndash457) 625 (617ndash633) 1996ndash2001 752 (717ndash787) 723 (664ndash781) 463 (415ndash512) 708 (700ndash716) 2001ndash2004 759 (722ndash797) 596 (544ndash649) 379 (342ndash415) 721 (712ndash730) change 37 18 30 42 P (trend) 002 055 060 lt01 Pooled 656 (638ndash674) 605 (570ndash640) 390 (362ndash419) 612 (609ndash616)
25ndash44 years 1981ndash1986 883 (719ndash105) 899 (614ndash118) 866 (419ndash131) 838 (780ndash895) 1986ndash1991 845 (687ndash100) 120 (92ndash148) 796 (438ndash115) 849 (794ndash903) 1991ndash1996 105 (89ndash120) 799 (588ndash101) 691 (461ndash920) 899 (844ndash955) 1996ndash2001 113 (98ndash128) 895 (703ndash109) 953 (759ndash115) 944 (886ndash100) 2001ndash2004 105 (89ndash120) 560 (406ndash713) 597 (441ndash753) 103 (96ndash110) change 18 -38 -31 23 P (trend) 011 013 045 lt01 Pooled 987 (917ndash106) 885 (780ndash991) 790 (652ndash928) 907 (880ndash933)
45ndash64 years 1981ndash1986 663 (592ndash734) 669 (513ndash825) 325 (191ndash458) 512 (497ndash527) 1986ndash1991 633 (574ndash693) 634 (504ndash763) 413 (290ndash535) 519 (505ndash533) 1991ndash1996 710 (652ndash768) 614 (519ndash709) 370 (278ndash462) 591 (576ndash606) 1996ndash2001 764 (711ndash817) 673 (588ndash758) 429 (358ndash499) 691 (675ndash708) 2001ndash2004 766 (712ndash821) 536 (461ndash610) 388 (333ndash443) 727 (709ndash744) change 16 -20 19 42 P (trend) 004 026 055 lt01 Pooled 704 (677ndash731) 629 (578ndash681) 385 (339ndash431) 602 (595ndash609)
Cancer Trends 191
1st cancer Age group
Cohort Total Māori SR (95 CI)
Total Pacific SR (95 CI)
Total Asian SR (95 CI)
EuropeanOther SR (95 CI)
65ndash74 years 1981ndash1986 1741 (1475ndash2006) 1621 (975ndash2268) 1207 (571ndash1843) 1617 (1571ndash1663) 1986ndash1991 1918 (1657ndash2179) 2398 (1746ndash3051) 1114 (610ndash1618) 1701 (1658ndash1745) 1991ndash1996 2323 (2075ndash2570) 2258 (1796ndash2720) 1307 (875ndash1738) 2095 (2049ndash2141) 1996ndash2001 2549 (2342ndash2756) 2557 (2193ndash2922) 1607 (1281ndash1932) 2488 (2437ndash2539) 2001ndash2004 2857 (2612ndash3101) 2509 (2114ndash2903) 1231 (994ndash1468) 2529 (2467ndash2591) change 64 55 2 56 P (trend) lt01 009 086 lt01 Pooled 2248 (2138ndash2359) 2257 (2019ndash2494) 1296 (1088ndash1504) 2064 (2042ndash2086)
75+ years 1981ndash1986 2189 (1731ndash2648) 1710 (440ndash2980) 786 (299ndash1274) 2389 (2316ndash2462) 1986ndash1991 2208 (1779ndash2637) 2724 (1593ndash3855) 2423 (1482ndash3365) 2537 (2471ndash2604) 1991ndash1996 2889 (2446ndash3332) 2364 (1603ndash3125) 1913 (1176ndash2651) 3063 (2994ndash3132) 1996ndash2001 3561 (3157ndash3965) 3646 (2968ndash4324) 1934 (1416ndash2453) 3325 (3258ndash3393) 2001ndash2004 3164 (2750ndash3578) 2980 (2364ndash3597) 1762 (1342ndash2183) 3346 (3266ndash3426) change 45 74 124 40 P (trend) 006 024 022 001 Pooled 2784 (2590ndash2978) 2670 (2242ndash3098) 1764 (1464ndash2064) 2911 (2880ndash2943)
Females
25+ years 1981ndash1986 499 (464ndash534) 438 (370ndash506) 266 (205ndash326) 439 (431ndash446) 1986ndash1991 568 (535ndash601) 532 (466ndash598) 333 (274ndash392) 487 (480ndash495) 1991ndash1996 635 (602ndash668) 453 (408ndash499) 327 (281ndash372) 516 (509ndash524) 1996ndash2001 667 (640ndash695) 531 (490ndash571) 425 (387ndash463) 551 (543ndash558) 2001ndash2004 677 (648ndash707) 544 (503ndash586) 367 (338ndash397) 569 (561ndash577) change 36 24 38 30 P (trend) 001 017 022 lt01 Pooled 606 (592ndash620) 497 (473ndash522) 342 (320ndash365) 510 (506ndash513)
25ndash44 years 1981ndash1986 171 (149ndash192) 164 (125ndash203) 123 (76ndash170) 155 (147ndash163) 1986ndash1991 183 (162ndash205) 197 (159ndash235) 112 (74ndash151) 173 (165ndash180) 1991ndash1996 184 (165ndash203) 171 (143ndash199) 108 (82ndash134) 159 (151ndash166) 1996ndash2001 190 (173ndash207) 190 (163ndash217) 152 (128ndash175) 171 (163ndash178) 2001ndash2004 173 (157ndash190) 137 (114ndash159) 129 (110ndash148) 173 (164ndash181) change 2 -17 5 11 P (trend) 083 033 045 028 Pooled 181 (172ndash189) 173 (159ndash188) 125 (110ndash140) 166 (162ndash169)
45ndash64 years 1981ndash1986 688 (620ndash756) 727 (573ndash880) 347 (220ndash475) 547 (532ndash563) 1986ndash1991 797 (730ndash863) 754 (624ndash883) 429 (314ndash543) 618 (602ndash634) 1991ndash1996 893 (830ndash956) 561 (476ndash647) 483 (387ndash579) 667 (651ndash683) 1996ndash2001 900 (847ndash953) 691 (610ndash771) 550 (477ndash624) 712 (695ndash728) 2001ndash2004 930 (872ndash988) 727 (645ndash808) 465 (411ndash519) 732 (715ndash749) change 35 0 34 34 P (trend) 002 078 041 lt01 Pooled 837 (809ndash865) 690 (639ndash741) 454 (409ndash499) 651 (644ndash658)
65ndash74 years 1981ndash1986 1367 (1136ndash1597) 896 (494ndash1298) 681 (261ndash1101) 1058 (1023ndash1092) 1986ndash1991 1586 (1374ndash1799) 1261 (866ndash1656) 826 (478ndash1174) 1201 (1167ndash1235) 1991ndash1996 1514 (1328ndash1699) 1388 (1088ndash1688) 637 (379ndash895) 1279 (1244ndash1313) 1996ndash2001 1827 (1659ndash1994) 1337 (1097ndash1578) 963 (743ndash1184) 1393 (1357ndash1430) 2001ndash2004 1954 (1761ndash2147) 1558 (1292ndash1824) 968 (774ndash1162) 1474 (1429ndash1519) change 43 74 42 39 P (trend) 002 004 014 lt01 Pooled 1634 (1545ndash1724) 1274 (1125ndash1424) 807 (669ndash946) 1271 (1255ndash1288)
192 Cancer Trends
1st cancer Age group
Cohort Total Māori SR (95 CI)
Total Pacific SR (95 CI)
Total Asian SR (95 CI)
EuropeanOther SR (95 CI)
75+ years 1981ndash1986 1986ndash1991 1991ndash1996 1996ndash2001 2001ndash2004 change P (trend) Pooled
1189 (873ndash1505) 1401 (1101ndash1700) 1872 (1574ndash2171) 1734 (1500ndash1969) 2005 (1708ndash2302)
69 003
1622 (1492ndash1752)
962 (383ndash1540) 1527 (804ndash2249) 965 (573ndash1358)
1485 (1127ndash1843) 1656 (1239ndash2074)
72 015
1302 (1068ndash1536)
570 (166ndash974) 764 (359ndash1170) 980 (568ndash1392)
1292 (975ndash1609) 957 (687ndash1227)
68 022
910 (742ndash1078)
1362 (1317ndash1407) 1479 (1438ndash1521) 1660 (1618ndash1701) 1735 (1694ndash1775) 1820 (1769ndash1872)
34 lt01
1601 (1581ndash1620)
Table 76 Age- and ethnicity-standardised rates of first cancer by income group
1st cancer Age group
Cohort Low income SR (95 CI)
Medium income SR (95 CI)
High income SR (95 CI)
Males
25+ years 1981ndash1986 536 (517ndash555) 535 (487ndash583) 518 (493ndash542) 1986ndash1991 569 (550ndash588) 555 (535ndash575) 523 (500ndash546) 1991ndash1996 644 (624ndash663) 650 (634ndash667) 621 (598ndash644) 1996ndash2001 733 (715ndash752) 740 (722ndash757) 714 (694ndash734) 2001ndash2004 750 (730ndash770) 732 (713ndash752) 707 (688ndash727) change 40 37 37 P (trend) lt01 002 002 Pooled 641 (633ndash650) 638 (626ndash651) 612 (602ndash622)
25ndash44 years 1981ndash1986 862 (749ndash974) 798 (704ndash891) 888 (779ndash998) 1986ndash1991 834 (737ndash931) 892 (799ndash984) 911 (785ndash104) 1991ndash1996 897 (798ndash996) 929 (834ndash102) 887 (788ndash986) 1996ndash2001 111 (100ndash122) 954 (854ndash105) 918 (825ndash101) 2001ndash2004 101 (88ndash115) 989 (874ndash110) 990 (893ndash109) change 18 24 11 P (trend) 011 001 011 Pooled 940 (891ndash989) 909 (865ndash953) 915 (867ndash963)
45ndash64 years 1981ndash1986 542 (508ndash577) 538 (505ndash571) 546 (502ndash591) 1986ndash1991 570 (539ndash601) 549 (520ndash577) 513 (476ndash550) 1991ndash1996 678 (647ndash708) 594 (565ndash623) 574 (539ndash608) 1996ndash2001 691 (660ndash721) 723 (691ndash754) 682 (653ndash712) 2001ndash2004 749 (714ndash784) 699 (666ndash732) 707 (679ndash736) change 38 30 29 P (trend) lt01 003 002 Pooled 641 (626ndash655) 617 (603ndash630) 599 (583ndash615)
65ndash74 years 1981ndash1986 1784 (1656ndash1912) 1620 (1486ndash1754) 1526 (1409ndash1644) 1986ndash1991 1831 (1724ndash1938) 1804 (1672ndash1936) 1737 (1583ndash1890) 1991ndash1996 2118 (2004ndash2232) 2229 (2127ndash2331) 2089 (1950ndash2227) 1996ndash2001 2514 (2412ndash2617) 2538 (2438ndash2639) 2539 (2417ndash2662) 2001ndash2004 2653 (2529ndash2777) 2599 (2471ndash2728) 2483 (2358ndash2608) change 49 60 63 P (trend) lt01 lt01 lt01 Pooled 2156 (2105ndash2208) 2136 (2082ndash2190) 2054 (1995ndash2114)
Cancer Trends 193
1st cancer Age group
Cohort Low income SR (95 CI)
Medium income SR (95 CI)
High income SR (95 CI)
75+ years 1981ndash1986 2414 (2245ndash2583) 2549 (1969ndash3128) 2499 (2203ndash2795) 1986ndash1991 2738 (2528ndash2948) 2699 (2492ndash2906) 2537 (2267ndash2806) 1991ndash1996 2903 (2694ndash3112) 3221 (3067ndash3375) 3171 (2889ndash3453) 1996ndash2001 3545 (3362ndash3727) 3584 (3417ndash3750) 3456 (3241ndash3671) 2001ndash2004 3434 (3253ndash3614) 3548 (3346ndash3750) 3386 (3152ndash3620) change 42 39 35 P (trend) 001 003 003 Pooled 2985 (2899ndash3071) 3099 (2957ndash3240) 2991 (2873ndash3109)
75ndash84 years 1981ndash1986 2433 (2247ndash2619) 2914 (1608ndash4220) 2395 (2083ndash2707) 1986ndash1991 2751 (2525ndash2977) 2775 (2534ndash3015) 2626 (2321ndash2931) 1991ndash1996 2903 (2673ndash3133) 3246 (3071ndash3420) 3150 (2851ndash3449) 1996ndash2001 3621 (3413ndash3828) 3530 (3352ndash3707) 3565 (3308ndash3821) 2001ndash2004 3444 (3254ndash3634) 3513 (3300ndash3726) 3372 (3116ndash3628) change 42 21 41 P (trend) 002 004 003 Pooled 3010 (2915ndash3104) 3180 (2894ndash3465) 3004 (2874ndash3134)
85+ years 1981ndash1986 2463 (2096ndash2831) 2232 (1712ndash2752) 3386 (2195ndash4578) 1986ndash1991 2728 (2193ndash3263) 2565 (2207ndash2924) 2309 (2011ndash2607) 1991ndash1996 3349 (2758ndash3939) 3325 (2942ndash3709) 3402 (2453ndash4352) 1996ndash2001 3308 (2880ndash3736) 3960 (3452ndash4468) 3266 (2732ndash3799) 2001ndash2004 3309 (2837ndash3781) 3756 (3221ndash4291) 3465 (2744ndash4186) change 34 68 2 P (trend) 002 002 011 Pooled 3017 (2799ndash3236) 3138 (2932ndash3345) 3151 (2787ndash3514)
Females
25+ years 1981ndash1986 453 (439ndash467) 457 (438ndash476) 447 (426ndash468) 1986ndash1991 499 (484ndash514) 514 (497ndash530) 520 (499ndash542) 1991ndash1996 547 (532ndash561) 533 (518ndash547) 512 (493ndash531) 1996ndash2001 586 (572ndash600) 563 (549ndash577) 555 (539ndash571) 2001ndash2004 584 (569ndash599) 600 (583ndash617) 581 (564ndash598) change 29 31 30 P (trend) lt01 lt01 001 Pooled 531 (525ndash538) 530 (523ndash537) 520 (512ndash529)
25ndash44 years 1981ndash1986 154 (141ndash167) 166 (152ndash181) 165 (148ndash181) 1986ndash1991 163 (151ndash176) 181 (167ndash194) 181 (163ndash199) 1991ndash1996 153 (141ndash164) 167 (154ndash181) 160 (147ndash174) 1996ndash2001 168 (156ndash179) 181 (168ndash194) 185 (171ndash198) 2001ndash2004 155 (143ndash168) 175 (160ndash189) 171 (158ndash184) change 1 5 4 P (trend) 079 055 066 Pooled 159 (153ndash164) 174 (168ndash180) 172 (166ndash179)
45ndash64 years 1981ndash1986 593 (560ndash625) 574 (539ndash609) 569 (525ndash613) 1986ndash1991 653 (621ndash684) 646 (615ndash678) 672 (627ndash717) 1991ndash1996 735 (706ndash763) 671 (640ndash703) 655 (618ndash691) 1996ndash2001 758 (730ndash787) 710 (680ndash741) 714 (683ndash746) 2001ndash2004 773 (742ndash805) 762 (728ndash796) 745 (713ndash777) change 30 33 31 P (trend) 001 lt01 002 Pooled 699 (685ndash713) 668 (654ndash683) 667 (650ndash685)
194 Cancer Trends
1st cancer Age group
Cohort Low income SR (95 CI)
Medium income SR (95 CI)
High income SR (95 CI)
65ndash74 years 1981ndash1986 1065 (998ndash1131) 1139 (1012ndash1266) 1038 (940ndash1136) 1986ndash1991 1234 (1162ndash1307) 1275 (1187ndash1363) 1294 (1172ndash1416) 1991ndash1996 1333 (1259ndash1408) 1343 (1270ndash1415) 1255 (1147ndash1363) 1996ndash2001 1530 (1456ndash1605) 1480 (1405ndash1555) 1282 (1195ndash1369) 2001ndash2004 1590 (1503ndash1677) 1550 (1455ndash1644) 1496 (1392ndash1600) change 49 36 44 P (trend) lt01 lt01 004 Pooled 1338 (1305ndash1372) 1348 (1306ndash1390) 1262 (1215ndash1309)
75+ years 1981ndash1986 1315 (1230ndash1401) 1431 (1249ndash1612) 1424 (1229ndash1620) 1986ndash1991 1533 (1411ndash1654) 1573 (1445ndash1700) 1588 (1392ndash1784) 1991ndash1996 1694 (1582ndash1806) 1736 (1637ndash1835) 1739 (1582ndash1897) 1996ndash2001 1866 (1747ndash1985) 1682 (1608ndash1756) 1777 (1654ndash1899) 2001ndash2004 1917 (1801ndash2033) 1965 (1829ndash2101) 1951 (1777ndash2126) change 46 37 37 P (trend) lt01 009 lt01 Pooled 1652 (1602ndash1702) 1663 (1605ndash1720) 1683 (1606ndash1760)
75ndash84 years 1981ndash1986 1355 (1252ndash1459) 1520 (1285ndash1755) 1447 (1228ndash1667) 1986ndash1991 1527 (1399ndash1656) 1571 (1423ndash1720) 1680 (1448ndash1911) 1991ndash1996 1736 (1602ndash1871) 1766 (1649ndash1883) 1743 (1565ndash1921) 1996ndash2001 1855 (1721ndash1989) 1719 (1631ndash1806) 1803 (1663ndash1943) 2001ndash2004 1879 (1752ndash2006) 1966 (1811ndash2121) 1918 (1727ndash2109) change 39 29 33 P (trend) lt01 008 lt01 Pooled 1660 (1604ndash1717) 1696 (1625ndash1766) 1708 (1620ndash1796)
85+ years 1981ndash1986 1358 (1183ndash1534) 1328 (1113ndash1543) 1370 (1066ndash1674) 1986ndash1991 1606 (1344ndash1867) 1605 (1364ndash1846) 1304 (1065ndash1543) 1991ndash1996 1716 (1483ndash1949) 1760 (1529ndash1992) 1817 (1454ndash2181) 1996ndash2001 2012 (1743ndash2282) 1692 (1529ndash1856) 1803 (1551ndash2055) 2001ndash2004 2211 (1937ndash2485) 2089 (1747ndash2431) 2189 (1734ndash2644) change 63 57 60 P (trend) lt01 005 003 Pooled 1759 (1650ndash1868) 1675 (1570ndash1781) 1672 (1529ndash1815)
Cancer Trends 195
Table 77 Age-standardised rates of bladder cancer by ethnic group
Bladder Age group
Cohort Total Māori SR (95 CI)
Total Pacific SR (95 CI)
Total Asian SR (95 CI)
EuropeanOther SR (95 CI)
Males 1981ndash1986 110 (49ndash170) 287 (16ndash559) 52 (07ndash371) 251 (233ndash268) 25+ years 1986ndash1991 155 (90ndash220) 84 (24ndash300) 160 (17ndash302) 277 (260ndash294)
1991ndash1996 142 (85ndash199) 234 (86ndash382) 244 (90ndash398) 297 (281ndash314) 1996ndash2001 212 (145ndash280) 131 (48ndash215) 231 (109ndash354) 325 (309ndash342) 2001ndash2004 187 (128ndash246) 87 (22ndash152) 152 (76ndash227) 340 (321ndash359) change 70 -70 192 35 P (trend) 007 048 034 lt01 Pooled 160 (132ndash188) 168 (97ndash240) 169 (112ndash225) 296 (288ndash304)
Females 1981ndash1986 35 (08ndash61) 31 (04ndash222) 74 (65ndash83) 25+ years 1986ndash1991 60 (16ndash104) 27 (04ndash190) 32 (05ndash227) 75 (67ndash83)
1991ndash1996 54 (19ndash90) 56 (02ndash111) 47 (14ndash157) 88 (80ndash97) 1996ndash2001 63 (36ndash90) 38 (14ndash103) 71 (15ndash127) 97 (89ndash106) 2001ndash2004 86 (48ndash124) 38 (00ndash76) 42 (05ndash79) 94 (85ndash103) change 146 23 27 P (trend) 002 064 003 Pooled 58 (43ndash74) 38 (15ndash61) 48 (24ndash73) 88 (84ndash92)
Table 78 Age- and ethnicity-standardised rates of bladder cancer by income group
Bladder Age group
Cohort Low income SR (95 CI)
Medium income SR (95 CI)
High income SR (95 CI)
Males 1981ndash1986 249 (204ndash295) 256 (211ndash301) 219 (177ndash261) 25+ years 1986ndash1991 273 (238ndash308) 258 (229ndash286) 236 (181ndash291)
1991ndash1996 249 (214ndash283) 314 (277ndash351) 257 (217ndash297) 1996ndash2001 324 (292ndash356) 317 (281ndash353) 280 (245ndash316) 2001ndash2004 319 (285ndash354) 339 (300ndash378) 314 (269ndash359) change 28 32 43 P (trend) 010 002 lt01 Pooled 281 (264ndash298) 295 (278ndash311) 259 (239ndash278)
Females 1981ndash1986 78 (61ndash96) 52 (39ndash66) 53 (39ndash68) 25+ years 1986ndash1991 77 (63ndash90) 66 (46ndash85) 63 (49ndash77)
1991ndash1996 89 (73ndash106) 85 (65ndash105) 91 (64ndash117) 1996ndash2001 93 (76ndash110) 95 (79ndash110) 84 (66ndash101) 2001ndash2004 95 (78ndash113) 90 (73ndash107) 89 (64ndash114) change 22 73 68 P (trend) 002 002 002 Pooled 86 (79ndash93) 77 (69ndash85) 75 (67ndash84)
196 Cancer Trends
Table 79 Age-standardised rates of brain cancer by ethnic group
Brain Age group
Cohort Total Māori SR (95 CI)
Total Pacific SR (95 CI)
Total Asian SR (95 CI)
EuropeanOther SR (95 CI)
Males 1981ndash1986 47 (17ndash78) 86 (04ndash168) 40 (06ndash287) 102 (89ndash115) 25+ years 1986ndash1991 79 (37ndash122) 24 (00ndash47) 46 (11ndash195) 98 (87ndash110)
1991ndash1996 65 (36ndash95) 70 (13ndash127) 62 (10ndash113) 104 (93ndash116) 1996ndash2001 70 (38ndash101) 104 (44ndash164) 86 (30ndash142) 113 (102ndash125) 2001ndash2004 119 (74ndash163) 70 (20ndash120) 89 (37ndash141) 111 (98ndash124) change 153 -19 123 9 P (trend) 012 024 lt01 008 Pooled 74 (58ndash90) 71 (45ndash97) 63 (35ndash92) 105 (100ndash111)
Females 1981ndash1986 26 (04ndash48) 87 (27ndash280) 63 (53ndash72) 25+ years 1986ndash1991 34 (13ndash56) 60 (20ndash175) 19 (03ndash132) 66 (57ndash76)
1991ndash1996 55 (25ndash84) 21 (05ndash80) 37 (11ndash123) 84 (74ndash95) 1996ndash2001 33 (14ndash52) 50 (05ndash94) 72 (19ndash125) 71 (62ndash81) 2001ndash2004 73 (43ndash104) 66 (24ndash109) 16 (05ndash53) 70 (60ndash81) change 181 -82 11 P (trend) 024 052 049 Pooled 43 (32ndash54) 48 (27ndash69) 48 (21ndash75) 71 (66ndash75)
Table 80 Age- and ethnicity-standardised rates of brain cancer by income group
Brain Age group
Cohort Low income SR (95 CI)
Medium income SR (95 CI)
High income SR (95 CI)
Males 1981ndash1986 81 (57ndash105) 93 (71ndash114) 94 (74ndash114) 25+ years 1986ndash1991 86 (67ndash104) 84 (67ndash101) 100 (75ndash125)
1991ndash1996 114 (89ndash140) 84 (67ndash102) 92 (73ndash110) 1996ndash2001 115 (92ndash139) 104 (84ndash124) 109 (89ndash128) 2001ndash2004 91 (69ndash113) 110 (87ndash134) 129 (104ndash154) change 12 18 37 P (trend) 040 020 012 Pooled 98 (87ndash108) 94 (85ndash103) 104 (94ndash113)
25+ years 1981ndash1986 44 (32ndash56) 69 (47ndash90) 49 (35ndash64) 1986ndash1991 55 (42ndash68) 75 (55ndash94) 39 (26ndash51) 1991ndash1996 80 (64ndash95) 80 (61ndash99) 71 (50ndash92) 1996ndash2001 68 (52ndash84) 61 (46ndash77) 60 (45ndash75) 2001ndash2004 81 (59ndash103) 67 (48ndash87) 70 (53ndash87) change 84 -3 43 P (trend) 005 044 014 Pooled 65 (58ndash72) 71 (62ndash79) 57 (50ndash65)
Cancer Trends 197
Table 81 Age-standardised rates of breast cancer by ethnic group
Breast Age group
Cohort Total Māori SR (95 CI)
Total Pacific SR (95 CI)
Total Asian SR (95 CI)
EuropeanOther SR (95 CI)
Females 1981ndash1986 123 (105ndash140) 112 (79ndash145) 699 (405ndash993) 114 (110ndash118) 25+ years 1986ndash1991 142 (126ndash157) 146 (115ndash177) 110 (76ndash144) 140 (136ndash144)
1991ndash1996 178 (162ndash194) 106 (86ndash126) 896 (675ndash112) 143 (139ndash147) 1996ndash2001 198 (184ndash212) 145 (126ndash165) 117 (99ndash135) 160 (156ndash164) 2001ndash2004 210 (194ndash225) 141 (121ndash161) 126 (110ndash142) 170 (166ndash175) change 71 25 80 49 P (trend) lt01 038 004 lt01 Pooled 168 (161ndash175) 129 (118ndash141) 101 (90ndash113) 144 (142ndash146)
25ndash44 years 1981ndash1986 389 (286ndash493) 583 (355ndash812) 560 (227ndash893) 471 (429ndash513) 1986ndash1991 668 (533ndash803) 792 (536ndash105) 205 (63ndash347) 573 (530ndash616) 1991ndash1996 715 (590ndash840) 683 (491ndash875) 493 (322ndash663) 545 (504ndash586) 1996ndash2001 758 (650ndash867) 638 (481ndash795) 557 (420ndash694) 575 (533ndash616) 2001ndash2004 661 (561ndash761) 455 (323ndash587) 552 (431ndash672) 590 (548ndash633) change 70 -22 -1 25 P (trend) 016 022 017 010 Pooled 637 (585ndash689) 639 (548ndash730) 469 (379ndash560) 549 (530ndash568)
45ndash64 years 1981ndash1986 179 (147ndash211) 184 (112ndash255) 845 (191ndash150) 171 (163ndash180) 1986ndash1991 237 (202ndash273) 281 (197ndash365) 167 (98ndash235) 219 (209ndash229) 1991ndash1996 285 (250ndash321) 145 (102ndash188) 133 (86ndash180) 226 (217ndash235) 1996ndash2001 321 (289ndash352) 240 (193ndash288) 193 (151ndash236) 265 (255ndash275) 2001ndash2004 341 (307ndash375) 236 (191ndash281) 199 (165ndash233) 285 (275ndash296) change 91 29 136 67 P (trend) lt01 051 005 lt01 Pooled 269 (254ndash284) 216 (189ndash244) 153 (128ndash178) 231 (226ndash235)
65+ years 1981ndash1986 276 (192ndash360) 152 (28ndash277) 911 (11ndash181) 232 (220ndash244) 1986ndash1991 227 (166ndash287) 192 (71ndash313) 287 (110ndash464) 280 (267ndash292) 1991ndash1996 343 (273ndash413) 212 (122ndash301) 113 (43ndash183) 282 (270ndash294) 1996ndash2001 365 (307ndash423) 264 (177ndash352) 180 (108ndash252) 303 (291ndash316) 2001ndash2004 430 (357ndash504) 284 (188ndash380) 230 (150ndash310) 326 (309ndash342) change 56 87 153 40 P (trend) 004 lt01 019 001 Pooled 323 (292ndash354) 218 (170ndash265) 178 (129ndash226) 282 (277ndash288)
198 Cancer Trends
Table 82 Age- and ethnicity-standardised rates of breast cancer by income group
Breast Age group
Cohort Low income SR (95 CI)
Medium income SR (95 CI)
High income SR (95 CI)
Females 1981ndash1986 114 (107ndash121) 122 (112ndash132) 122 (111ndash134) 25+ years 1986ndash1991 126 (119ndash133) 149 (141ndash158) 158 (147ndash170)
1991ndash1996 139 (132ndash147) 152 (144ndash159) 141 (133ndash150) 1996ndash2001 162 (155ndash170) 165 (157ndash172) 177 (169ndash186) 2001ndash2004 167 (159ndash174) 181 (171ndash190) 188 (179ndash197) change 47 48 54 P (trend) lt01 lt01 004 Pooled 140 (137ndash143) 152 (148ndash156) 156 (151ndash160)
25ndash44 years 1981ndash1986 467 (392ndash542) 477 (400ndash554) 514 (427ndash601) 1986ndash1991 557 (483ndash632) 602 (526ndash678) 612 (507ndash717) 1991ndash1996 530 (463ndash597) 593 (514ndash672) 618 (529ndash706) 1996ndash2001 565 (500ndash630) 648 (570ndash726) 677 (595ndash758) 2001ndash2004 546 (478ndash615) 614 (537ndash691) 641 (571ndash712) change 17 29 25 P (trend) 021 012 008 Pooled 532 (501ndash564) 585 (551ndash620) 611 (571ndash651)
45ndash64 years 1981ndash1986 164 (148ndash179) 188 (167ndash208) 177 (156ndash198) 1986ndash1991 198 (181ndash216) 228 (209ndash248) 274 (244ndash305) 1991ndash1996 224 (207ndash240) 230 (211ndash248) 231 (211ndash251) 1996ndash2001 267 (250ndash285) 264 (246ndash282) 297 (277ndash318) 2001ndash2004 284 (265ndash303) 289 (268ndash310) 307 (287ndash328) change 74 54 74 P (trend) lt01 lt01 004 Pooled 225 (217ndash232) 237 (228ndash246) 255 (245ndash265)
65ndash74 years 1981ndash1986 218 (188ndash248) 221 (186ndash257) 221 (174ndash268) 1986ndash1991 243 (213ndash273) 302 (264ndash339) 263 (228ndash297) 1991ndash1996 254 (221ndash287) 304 (271ndash338) 245 (209ndash281) 1996ndash2001 314 (280ndash347) 319 (285ndash354) 288 (246ndash330) 2001ndash2004 335 (293ndash376) 341 (299ndash383) 396 (343ndash450) change 54 54 79 P (trend) lt01 004 009 Pooled 269 (255ndash284) 295 (279ndash312) 277 (258ndash296)
75+ years 1981ndash1986 251 (217ndash285) 334 (208ndash461) 331 (200ndash462) 1986ndash1991 267 (225ndash308) 304 (255ndash354) 317 (222ndash412) 1991ndash1996 297 (251ndash344) 326 (284ndash367) 281 (228ndash335) 1996ndash2001 316 (269ndash364) 280 (251ndash309) 339 (286ndash393) 2001ndash2004 320 (272ndash368) 352 (297ndash407) 362 (267ndash458) change 28 5 9 P (trend) lt01 096 035 Pooled 289 (269ndash308) 317 (286ndash349) 324 (284ndash365)
Cancer Trends 199
Table 83 Age-standardised rates of cervical cancer by ethnic group
Cervix Age group
Cohort Total Māori SR (95 CI)
Total Pacific SR (95 CI)
Total Asian SR (95 CI)
EuropeanOther SR (95 CI)
Females 1981ndash1986 564 (462ndash666) 412 (228ndash595) 172 (35ndash309) 186 (169ndash202) 25+ years 1986ndash1991 423 (346ndash500) 518 (301ndash736) 205 (72ndash339) 186 (170ndash201)
1991ndash1996 406 (339ndash473) 340 (231ndash449) 145 (48ndash243) 162 (148ndash176) 1996ndash2001 328 (276ndash381) 183 (112ndash254) 190 (115ndash265) 144 (131ndash157) 2001ndash2004 236 (183ndash289) 150 (89ndash211) 179 (120ndash238) 112 (97ndash127) change -58 -64 4 -40 P (trend) lt01 003 085 lt01 Pooled 399 (366ndash433) 329 (263ndash396) 178 (130ndash227) 160 (154ndash167)
25ndash44 years 1981ndash1986 454 (346ndash562) 230 (74ndash386) 153 (52ndash451) 166 (143ndash190) 1986ndash1991 308 (228ndash389) 287 (128ndash446) 38 (09ndash155) 180 (158ndash203) 1991ndash1996 291 (221ndash362) 197 (92ndash301) 81 (13ndash150) 143 (122ndash163) 1996ndash2001 301 (228ndash373) 96 (41ndash152) 146 (65ndash228) 146 (125ndash167) 2001ndash2004 169 (120ndash219) 92 (37ndash147) 113 (59ndash167) 118 (95ndash142) change -63 -60 -26 -29 P (trend) 003 005 022 006 Pooled 311 (275ndash348) 185 (131ndash238) 106 (62ndash150) 152 (142ndash162)
45ndash64 years 1981ndash1986 728 (521ndash935) 100 (379ndash162) 262 (54ndash127) 214 (183ndash245) 1986ndash1991 646 (470ndash823) 505 (192ndash819) 446 (92ndash800) 197 (167ndash226) 1991ndash1996 586 (440ndash732) 566 (306ndash826) 203 (04ndash402) 195 (168ndash221) 1996ndash2001 462 (346ndash577) 228 (95ndash361) 233 (101ndash365) 150 (126ndash174) 2001ndash2004 270 (165ndash375) 188 (67ndash309) 219 (103ndash335) 106 (84ndash129) change -63 -81 -16 -50 P (trend) lt01 005 040 001 Pooled 552 (481ndash623) 513 (353ndash673) 275 (149ndash401) 176 (163ndash188)
65+ years 1981ndash1986 829 (336ndash132) 190 (27ndash135) 190 (27ndash135) 202 (166ndash238) 1986ndash1991 452 (124ndash779) 156 (44ndash267) 140 (20ndash995) 205 (171ndash239) 1991ndash1996 464 (233ndash696) 451 (40ndash861) 120 (17ndash849) 182 (151ndash213) 1996ndash2001 191 (75ndash307) 305 (38ndash572) 250 (73ndash852) 154 (124ndash183) 2001ndash2004 337 (131ndash543) 182 (03ndash361) 519 (82ndash957) 98 (71ndash125) change -59 -4 173 -51 P (trend) 022 062 023 002 Pooled 460 (321ndash600) 555 (285ndash824) 230 (86ndash374) 172 (157ndash186)
200 Cancer Trends
Table 84 Age-standardised rates of cervical cancer by income group
Cervix Age group
Cohort Low income SR (95 CI)
Medium income SR (95 CI)
High income SR (95 CI)
Females 1981ndash1986 291 (249ndash333) 244 (197ndash290) 208 (157ndash260) 25+ years 1986ndash1991
1991ndash1996 1996ndash2001 2001ndash2004 change P (trend) Pooled
285 (236ndash335) 235 (206ndash263) 199 (173ndash225) 132 (107ndash158)
-55 lt01
233 (217ndash250)
223 (181ndash265) 197 (165ndash228) 170 (144ndash197) 136 (107ndash165)
-44 lt01
197 (180ndash213)
232 (175ndash289) 148 (113ndash183) 142 (113ndash171) 119 (93ndash145)
-43 003
172 (153ndash192)
25ndash44 years 1981ndash1986 244 (192ndash297) 184 (142ndash226) 193 (118ndash269) 1986ndash1991 227 (182ndash271) 198 (155ndash241) 185 (101ndash268) 1991ndash1996 186 (149ndash222) 173 (131ndash216) 109 (74ndash144) 1996ndash2001 191 (152ndash229) 191 (146ndash235) 149 (106ndash192) 2001ndash2004 95 (68ndash123) 150 (106ndash193) 127 (89ndash166) change -61 -18 -34 P (trend) 002 025 050 Pooled 193 (175ndash212) 181 (161ndash200) 154 (127ndash181)
45ndash64 years 1981ndash1986 394 (290ndash498) 276 (187ndash365) 333 (172ndash494) 1986ndash1991 343 (262ndash424) 240 (177ndash303) 274 (164ndash385) 1991ndash1996 309 (253ndash366) 237 (174ndash300) 223 (133ndash313) 1996ndash2001 259 (206ndash313) 176 (127ndash226) 145 (94ndash197) 2001ndash2004 166 (112ndash219) 132 (66ndash197) 114 (74ndash154) change -58 -52 -66 P (trend) lt01 lt01 lt01 Pooled 301 (267ndash334) 216 (186ndash246) 223 (176ndash270)
65ndash74 years 1981ndash1986 1986ndash1991 1991ndash1996 1996ndash2001 2001ndash2004 change P (trend) Pooled
433 (235ndash631) 400 (219ndash582) 326 (208ndash444) 125 (73ndash177) 177 (82ndash271)
-59 011
298 (234ndash362)
489 (149ndash828) 446 (66ndash827) 257 (157ndash356) 182 (109ndash256) 134 (47ndash220)
-73 001
310 (199ndash421)
153 (78ndash228) 439 (69ndash810) 260 (52ndash468) 159 (42ndash275) 115 (35ndash194)
-25 057
231 (136ndash325)
75+ years 1981ndash1986 175 (103ndash248) 344 (94ndash126) 165 (64ndash266) 1986ndash1991 422 (146ndash121) 198 (83ndash313) 239 (37ndash442) 1991ndash1996 105 (39ndash171) 118 (70ndash167) 71 (18ndash124) 1996ndash2001 183 (44ndash322) 123 (79ndash167) 147 (59ndash234) 2001ndash2004 248 (55ndash441) 96 (36ndash156) 17 (04ndash70) change 42 -72 -90 P (trend) 084 018 008 Pooled 226 (121ndash330) 180 (81ndash278) 133 (81ndash186)
Cancer Trends 201
Table 85 Age-standardised rates of colorectal cancer by ethnic group
Colorectal Age group
Cohort Total Māori SR (95 CI)
Total Pacific SR (95 CI)
Total Asian SR (95 CI)
EuropeanOther SR (95 CI)
Males 1981ndash1986 433 (316ndash550) 311 (119ndash503) 677 (323ndash103) 906 (872ndash939) 25+ years 1986ndash1991 489 (382ndash596) 329 (94ndash565) 699 (398ndash100) 960 (928ndash992)
1991ndash1996 591 (482ndash701) 595 (382ndash809) 806 (484ndash113) 103 (100ndash106) 1996ndash2001 780 (662ndash899) 566 (417ndash714) 638 (460ndash816) 103 (100ndash107) 2001ndash2004 750 (635ndash865) 369 (232ndash506) 517 (378ndash656) 103 (100ndash106) change 73 19 -24 14 P (trend) 001 067 011 005 Pooled 602 (551ndash652) 437 (350ndash524) 675 (549ndash801) 991 (976ndash101)
25ndash64 years 1981ndash1986 204 (129ndash279) 306 (109ndash503) 296 (80ndash513) 513 (483ndash544) 1986ndash1991 354 (259ndash449) 138 (43ndash233) 418 (186ndash651) 574 (543ndash605) 1991ndash1996 320 (247ndash394) 305 (181ndash430) 393 (170ndash616) 576 (545ndash606) 1996ndash2001 392 (315ndash468) 392 (237ndash547) 351 (213ndash489) 557 (526ndash587) 2001ndash2004 388 (307ndash469) 129 (52ndash206) 205 (118ndash291) 479 (450ndash508) change 90 -58 -31 -7 P (trend) 005 069 018 058 Pooled 329 (293ndash365) 260 (197ndash324) 339 (251ndash427) 543 (529ndash556)
65+ years 1981ndash1986 188 (114ndash261) 239 (34ndash169) 257 (70ndash445) 320 (304ndash337) 1986ndash1991 135 (85ndash184) 158 (3ndash314) 227 (76ndash379) 331 (316ndash346) 1991ndash1996 220 (158ndash281) 249 (119ndash379) 319 (147ndash491) 382 (367ndash397) 1996ndash2001 294 (232ndash357) 179 (109ndash248) 240 (139ndash340) 395 (380ndash411) 2001ndash2004 317 (247ndash386) 174 (88ndash259) 229 (145ndash312) 431 (412ndash449) change 69 626 -11 34 P (trend) 005 005 053 lt01 Pooled 226 (198ndash255) 156 (108ndash204) 256 (189ndash323) 369 (362ndash376)
Females 1981ndash1986 343 (250ndash437) 445 (219ndash670) 340 (110ndash570) 794 (765ndash823) 25+ years 1986ndash1991 385 (296ndash475) 298 (127ndash469) 288 (104ndash472) 813 (785ndash841)
1991ndash1996 491 (391ndash592) 386 (240ndash532) 373 (207ndash540) 841 (814ndash868) 1996ndash2001 476 (399ndash554) 378 (263ndash494) 602 (449ndash755) 841 (814ndash867) 2001ndash2004 453 (374ndash533) 432 (310ndash554) 439 (328ndash550) 849 (820ndash878) change 32 -3 29 7 P (trend) 012 046 031 002 Pooled 428 (388ndash469) 386 (312ndash459) 407 (327ndash487) 827 (814ndash839)
25ndash64 years 1981ndash1986 251 (160ndash342) 225 (62ndash389) 106 (34ndash336) 483 (455ndash512) 1986ndash1991 247 (169ndash326) 113 (20ndash206) 182 (02ndash363) 486 (457ndash514) 1991ndash1996 267 (198ndash335) 245 (132ndash357) 239 (100ndash378) 498 (470ndash526) 1996ndash2001 272 (212ndash332) 177 (99ndash255) 334 (211ndash457) 474 (447ndash501) 2001ndash2004 316 (248ndash385) 218 (124ndash311) 232 (159ndash306) 423 (396ndash451) change 26 -3 119 -12 P (trend) 005 052 022 017 Pooled 268 (235ndash302) 194 (143ndash246) 218 (157ndash279) 475 (463ndash488)
65+ years 1981ndash1986 112 (60ndash165) 217 (60ndash374) 173 (7ndash338) 259 (247ndash272) 1986ndash1991 131 (84ndash178) 116 (30ndash203) 861 (103ndash162) 270 (259ndash282) 1991ndash1996 164 (114ndash215) 134 (41ndash226) 112 (30ndash194) 290 (278ndash301) 1996ndash2001 173 (131ndash214) 154 (89ndash218) 213 (134ndash293) 306 (294ndash318) 2001ndash2004 121 (85ndash157) 179 (108ndash250) 149 (91ndash207) 345 (329ndash361) change 8 -18 -14 33 P (trend) 080 050 039 lt01 Pooled 141 (120ndash162) 159 (113ndash205) 146 (100ndash192) 291 (286ndash297)
202 Cancer Trends
Table 86 Age- and ethnicity-standardised rates of colorectal cancer by income group
Colorectal Age group
Cohort Low income SR (95 CI)
Medium income SR (95 CI)
High income SR (95 CI)
Males 1981ndash1986 799 (739ndash859) 800 (735ndash866) 866 (769ndash963) 25+ years 1986ndash1991 864 (805ndash922) 946 (866ndash103) 885 (816ndash955)
1991ndash1996 974 (905ndash104) 961 (906ndash102) 920 (859ndash981) 1996ndash2001 921 (862ndash979) 104 (98ndash110) 103 (96ndash110) 2001ndash2004 102 (96ndash108) 933 (871ndash995) 966 (896ndash104) change 28 17 12 P (trend) 003 023 011 Pooled 910 (882ndash938) 937 (907ndash966) 932 (898ndash966)
25ndash44 years 1981ndash1986 76 (44ndash109) 79 (45ndash113) 101 (64ndash138) 1986ndash1991 75 (45ndash105) 69 (44ndash94) 74 (44ndash105) 1991ndash1996 65 (40ndash91) 78 (49ndash107) 66 (42ndash90) 1996ndash2001 91 (59ndash123) 82 (54ndash111) 85 (56ndash114) 2001ndash2004 46 (23ndash69) 68 (42ndash94) 109 (74ndash145) change -39 -14 8 P (trend) 032 079 068 Pooled 72 (59ndash85) 76 (63ndash89) 86 (72ndash100)
45ndash64 years 1981ndash1986 996 (856ndash114) 104 (90ndash119) 986 (814ndash116) 1986ndash1991 113 (100ndash126) 115 (103ndash127) 112 (98ndash126) 1991ndash1996 119 (107ndash131) 109 (98ndash120) 110 (98ndash123) 1996ndash2001 100 (88ndash113) 111 (99ndash122) 114 (102ndash125) 2001ndash2004 104 (91ndash117) 902 (785ndash102) 850 (753ndash947) change 5 -13 -14 P (trend) 085 029 034 Pooled 107 (102ndash113) 107 (101ndash112) 105 (99ndash111)
65ndash74 years 1981ndash1986 257 (222ndash292) 278 (233ndash323) 263 (218ndash309) 1986ndash1991 243 (215ndash270) 307 (242ndash372) 284 (242ndash326) 1991ndash1996 362 (318ndash407) 352 (313ndash392) 309 (269ndash349) 1996ndash2001 324 (290ndash358) 394 (359ndash429) 398 (347ndash449) 2001ndash2004 414 (369ndash460) 362 (317ndash407) 370 (321ndash418) change 61 30 40 P (trend) 006 006 003 Pooled 315 (299ndash332) 337 (316ndash359) 322 (302ndash343)
75+ years 1981ndash1986 326 (285ndash366) 298 (250ndash346) 398 (315ndash481) 1986ndash1991 367 (319ndash414) 415 (348ndash482) 362 (289ndash435) 1991ndash1996 309 (254ndash364) 406 (369ndash443) 380 (338ndash422) 1996ndash2001 411 (358ndash463) 451 (396ndash506) 415 (351ndash480) 2001ndash2004 493 (435ndash550) 442 (388ndash495) 533 (434ndash631) change 51 48 34 P (trend) 009 005 022 Pooled 375 (353ndash398) 400 (376ndash424) 412 (379ndash444)
Females 1981ndash1986 711 (663ndash758) 765 (699ndash831) 723 (650ndash796) 25+ years 1986ndash1991 724 (674ndash774) 749 (696ndash801) 750 (683ndash817)
1991ndash1996 825 (770ndash880) 775 (728ndash822) 754 (691ndash817) 1996ndash2001 772 (726ndash818) 778 (733ndash823) 783 (727ndash839) 2001ndash2004 763 (716ndash810) 810 (754ndash866) 790 (731ndash849) change 7 6 9 P (trend) 031 007 lt01 Pooled 759 (737ndash781) 774 (750ndash798) 759 (730ndash787)
Cancer Trends 203
Colorectal Age group
Cohort Low income SR (95 CI)
Medium income SR (95 CI)
High income SR (95 CI)
25ndash44 years 1981ndash1986 1986ndash1991 1991ndash1996 1996ndash2001 2001ndash2004 change P (trend) Pooled
98 (65ndash132) 90 (57ndash122) 64 (40ndash89) 79 (55ndash103) 79 (53ndash105)
-19 042
82 (69ndash95)
153 (103ndash204) 139 (98ndash180) 50 (29ndash70) 52 (32ndash73) 57 (24ndash91)
-63 018
92 (76ndash108)
121 (79ndash162) 108 (70ndash146) 67 (43ndash91) 84 (53ndash114) 83 (56ndash111)
-31 035
93 (78ndash108)
45ndash64 years 1981ndash1986 944 (820ndash107) 891 (763ndash102) 832 (719ndash945) 1986ndash1991 891 (782ndash100) 855 (764ndash947) 863 (733ndash994) 1991ndash1996 989 (891ndash109) 999 (889ndash111) 917 (793ndash104) 1996ndash2001 885 (789ndash980) 938 (836ndash104) 854 (756ndash952) 2001ndash2004 787 (688ndash886) 829 (722ndash936) 802 (704ndash900) change -17 -7 -4 P (trend) 022 092 059 Pooled 905 (857ndash953) 906 (857ndash955) 856 (805ndash908)
65ndash74 years 1981ndash1986 191 (166ndash216) 252 (196ndash309) 218 (171ndash265) 1986ndash1991 198 (171ndash226) 221 (194ndash248) 202 (172ndash231) 1991ndash1996 251 (220ndash282) 230 (204ndash256) 238 (188ndash287) 1996ndash2001 267 (237ndash296) 255 (227ndash282) 267 (226ndash308) 2001ndash2004 280 (248ndash312) 290 (255ndash326) 285 (241ndash328) change 47 15 30 P (trend) lt01 010 003 Pooled 235 (222ndash248) 248 (231ndash264) 240 (221ndash259)
75+ years 1981ndash1986 288 (259ndash317) 300 (245ndash355) 354 (266ndash443) 1986ndash1991 334 (284ndash384) 311 (271ndash352) 346 (270ndash422) 1991ndash1996 368 (315ndash422) 340 (305ndash374) 321 (276ndash367) 1996ndash2001 325 (284ndash365) 351 (319ndash383) 346 (302ndash391) 2001ndash2004 359 (322ndash395) 383 (337ndash429) 399 (338ndash460) change 25 28 13 P (trend) 010 lt01 034 Pooled 334 (314ndash353) 335 (316ndash353) 351 (321ndash381)
Table 87 Age-standardised rates of endometrial cancer by ethnic group
Endometrium Age group
Cohort Total Māori SR (95 CI)
Total Pacific SR (95 CI)
Total Asian SR (95 CI)
EuropeanOther SR (95 CI)
Females 25+ years
1981ndash1986 1986ndash1991 1991ndash1996 1996ndash2001 2001ndash2004 change P (trend) Pooled
295 (217ndash372) 289 (213ndash364) 280 (214ndash347) 317 (256ndash379) 307 (246ndash368)
4 030
297 (266ndash328)
375 (173ndash576) 477 (283ndash672) 357 (238ndash476) 482 (362ndash603) 697 (551ndash842)
86 015
467 (394ndash539)
154 (55ndash428) 212 (63ndash362) 167 (71ndash264) 205 (124ndash286) 229 (157ndash301)
49 010
192 (138ndash246)
191 (177ndash206) 163 (151ndash176) 167 (155ndash180) 191 (178ndash204) 185 (171ndash198)
-3 067
179 (173ndash185)
204 Cancer Trends
Table 88 Age- and ethnicity-standardised rates of endometrial cancer by income group
Endometrium Age group
Cohort Low income SR (95 CI)
Medium income SR (95 CI)
High income SR (95 CI)
Females 25+ years
1981ndash1986 1986ndash1991 1991ndash1996 1996ndash2001 2001ndash2004 change P (trend) Pooled
209 (177ndash240) 192 (165ndash220) 195 (169ndash221) 234 (205ndash263) 244 (214ndash274)
17 014
213 (200ndash226)
215 (178ndash253) 222 (179ndash265) 193 (163ndash222) 221 (191ndash251) 243 (206ndash279)
13 043
218 (202ndash234)
248 (187ndash310) 167 (132ndash201) 194 (156ndash233) 215 (183ndash247) 211 (178ndash245)
-15 059
207 (188ndash226)
Table 89 Age-standardised rates of gallbladder and bile duct cancer by ethnic group
Gallbladder Age group
Cohort Total Māori SR (95 CI)
Total Pacific SR (95 CI)
Total Asian SR (95 CI)
EuropeanOther SR (95 CI)
Males 1981ndash1986 36 (03ndash68) 117 (28ndash484) 30 (24ndash37) 25+ years 1986ndash1991
1991ndash1996 35 (10ndash124) 49 (17ndash81)
51 (16ndash167) 43 (06ndash308) 10 (02ndash39)
22 (17ndash27) 29 (24ndash34)
1996ndash2001 34 (09ndash59) 28 (08ndash94) 16 (05ndash53) 24 (19ndash28) 2001ndash2004 change P (trend)
25 (06ndash45) -31 026
70 (17ndash122) 34 (03ndash65) -71 048
27 (22ndash32) -10 096
Pooled 36 (22ndash51) 48 (26ndash70) 45 (05ndash84) 26 (24ndash29)
Females 1981ndash1986 27 (03ndash51) 42 (06ndash296) 33 (27ndash39) 25+ years 1986ndash1991 16 (05ndash50) 30 (25ndash35)
1991ndash1996 36 (10ndash62) 42 (15ndash121) 14 (02ndash101) 35 (30ndash40) 1996ndash2001 39 (17ndash61) 32 (10ndash102) 41 (03ndash80) 27 (22ndash32) 2001ndash2004 54 (21ndash87) 58 (12ndash105) 63 (20ndash105) 34 (28ndash40) change 100 50 3 P (trend) 009 089 Pooled 33 (23ndash44) 43 (24ndash61) 39 (15ndash62) 32 (30ndash35)
Cancer Trends 205
Table 90 Age- and ethnicity-standardised rates of gallbladder and bile duct cancer by income group
Gallbladder Age group
Cohort Low income SR (95 CI)
Medium income SR (95 CI)
High income SR (95 CI)
Males 1981ndash1986 31 (17ndash46) 27 (16ndash38) 32 (16ndash48) 25+ years 1986ndash1991 24 (07ndash41) 24 (13ndash35) 33 (14ndash52)
1991ndash1996 31 (19ndash42) 34 (22ndash47) 22 (14ndash29) 1996ndash2001 30 (18ndash43) 21 (12ndash31) 22 (14ndash29) 2001ndash2004 31 (18ndash44) 37 (22ndash51) 27 (18ndash36) change 0 37 -16 P (trend) 063 079 060 Pooled 29 (23ndash36) 28 (23ndash33) 27 (21ndash33)
Females 1981ndash1986 32 (23ndash41) 33 (16ndash51) 28 (18ndash38) 25+ years 1986ndash1991 34 (24ndash45) 23 (16ndash29) 26 (16ndash36)
1991ndash1996 34 (24ndash45) 44 (30ndash58) 29 (17ndash42) 1996ndash2001 29 (20ndash39) 30 (21ndash40) 17 (10ndash24) 2001ndash2004 47 (32ndash62) 43 (27ndash59) 38 (23ndash52) change 47 30 36 P (trend) 057 032 069 Pooled 35 (30ndash39) 34 (28ndash40) 27 (22ndash32)
Table 91 Age-standardised rates of Hodgkinrsquos disease by ethnic group
Hodgkinrsquos Age group
Cohort Total Māori SR (95 CI)
Total Pacific SR (95 CI)
Total Asian SR (95 CI)
EuropeanOther SR (95 CI)
Males 1981ndash1986 38 (10ndash66) 11 (02ndash80) 67 (15ndash292) 37 (29ndash44) 25+ years 1986ndash1991 11 (04ndash35) 33 (12ndash89) 10 (01ndash74) 31 (24ndash38)
1991ndash1996 31 (11ndash50) 15 (03ndash69) 25 (18ndash31) 1996ndash2001 25 (07ndash42) 24 (06ndash98) 21 (06ndash71) 26 (20ndash32) 2001ndash2004 35 (10ndash59) 05 (01ndash37) 32 (02ndash61) 41 (32ndash51) change -8 -55 -52 11 P (trend) 046 028 074 Pooled 28 (18ndash37) 19 (07ndash31) 29 (06ndash52) 32 (28ndash35)
Females 1981ndash1986 14 (03ndash55) 08 (01ndash54) 29 (21ndash36) 25+ years 1986ndash1991 15 (04ndash51) 28 (04ndash196) 18 (12ndash23)
1991ndash1996 05 (01ndash21) 11 (02ndash77) 21 (03ndash151) 16 (11ndash21) 1996ndash2001 12 (03ndash21) 13 (03ndash53) 37 (11ndash122) 21 (15ndash27) 2001ndash2004 22 (07ndash37) 29 (01ndash56) 27 (01ndash53) 27 (18ndash37) change 57 263 -7 P (trend) 050 089 Pooled 13 (07ndash20) 14 (05ndash23) 28 (09ndash48) 20 (17ndash23)
206 Cancer Trends
Table 92 Age- and ethnicity-standardised rates of Hodgkinrsquos disease by income group
Hodgkinrsquos Age group
Cohort Low income SR (95 CI)
Medium income SR (95 CI)
High income SR (95 CI)
Males 1981ndash1986 25 (12ndash38) 28 (17ndash39) 38 (20ndash55) 25+ years 1986ndash1991 42 (26ndash58) 22 (13ndash31) 29 (18ndash40)
1991ndash1996 16 (06ndash26) 24 (14ndash34) 27 (14ndash41) 1996ndash2001 31 (18ndash44) 29 (18ndash40) 22 (13ndash32) 2001ndash2004 49 (26ndash72) 27 (14ndash40) 47 (30ndash63) change 96 -4 24 P (trend) 074 063 098 Pooled 32 (25ndash38) 26 (21ndash31) 32 (26ndash38)
Females 1981ndash1986 30 (16ndash44) 23 (14ndash33) 26 (14ndash38) 25+ years 1986ndash1991 14 (07ndash20) 14 (07ndash20) 29 (09ndash49)
1991ndash1996 17 (09ndash25) 10 (04ndash16) 11 (05ndash18) 1996ndash2001 13 (07ndash19) 25 (13ndash36) 15 (07ndash24) 2001ndash2004 26 (15ndash38) 42 (21ndash63) 24 (09ndash40) change -13 83 -8 P (trend) 090 080 059 Pooled 20 (15ndash24) 22 (17ndash27) 21 (15ndash27)
Table 93 Age-standardised rates of kidney cancer by ethnic group
Kidney Age group
Cohort Total Māori SR (95 CI)
Total Pacific SR (95 CI)
Total Asian SR (95 CI)
EuropeanOther SR (95 CI)
Males 1981ndash1986 105 (58ndash153) 113 (27ndash482) 11 (01ndash75) 109 (98ndash121) 25+ years 1986ndash1991 116 (63ndash168) 19 (04ndash86) 69 (16ndash288) 110 (99ndash121)
1991ndash1996 146 (95ndash197) 58 (21ndash160) 74 (25ndash214) 150 (138ndash163) 1996ndash2001 146 (104ndash188) 73 (28ndash118) 84 (14ndash154) 167 (155ndash180) 2001ndash2004 140 (95ndash185) 137 (61ndash213) 85 (27ndash142) 172 (157ndash187) change 33 21 673 58 P (trend) 007 006 001 001 Pooled 130 (109ndash152) 77 (37ndash117) 64 (32ndash96) 140 (135ndash146)
Females 1981ndash1986 34 (10ndash58) 72 (26ndash197) 52 (45ndash59) 25+ years 1986ndash1991 38 (10ndash65) 61 (53ndash69)
1991ndash1996 114 (70ndash158) 29 (02ndash55) 46 (13ndash164) 70 (62ndash78) 1996ndash2001 65 (38ndash91) 50 (14ndash86) 20 (05ndash74) 89 (80ndash98) 2001ndash2004 90 (55ndash125) 64 (17ndash111) 33 (03ndash64) 97 (87ndash107) change 165 -11 87 P (trend) 013 lt01 Pooled 67 (53ndash81) 53 (31ndash75) 33 (14ndash52) 84 (80ndash88)
Cancer Trends 207
Table 94 Age- and ethnicity-standardised rates of kidney cancer by income group
Kidney Age group
Cohort Low income SR (95 CI)
Medium income SR (95 CI)
High income SR (95 CI)
Males 1981ndash1986 107 (85ndash128) 102 (79ndash126) 112 (78ndash145) 25+ years 1986ndash1991 102 (82ndash122) 136 (99ndash173) 77 (61ndash93)
1991ndash1996 136 (110ndash161) 154 (130ndash177) 157 (121ndash193) 1996ndash2001 172 (148ndash196) 145 (124ndash165) 151 (124ndash177) 2001ndash2004 168 (136ndash200) 180 (151ndash209) 163 (135ndash192) change 57 76 46 P (trend) 003 003 010 Pooled 135 (125ndash146) 142 (129ndash154) 130 (117ndash143)
25+ years 1981ndash1986 48 (34ndash61) 59 (44ndash74) 40 (24ndash55) 1986ndash1991 58 (45ndash70) 51 (40ndash63) 44 (26ndash62) 1991ndash1996 89 (69ndash110) 65 (51ndash78) 59 (40ndash78) 1996ndash2001 91 (74ndash108) 86 (70ndash101) 64 (50ndash78) 2001ndash2004 108 (88ndash128) 95 (74ndash115) 83 (60ndash106) change 125 61 108 P (trend) lt01 005 lt01 Pooled 77 (70ndash85) 70 (63ndash77) 57 (49ndash65)
Table 95 Age-standardised rates of larynx cancer by ethnic group
Larynx etc Age group
Cohort Total Māori SR (95 CI)
Total Pacific SR (95 CI)
Total Asian SR (95 CI)
EuropeanOther SR (95 CI)
Males 1981ndash1986 100 (34ndash165) 118 (36ndash383) 141 (45ndash441) 89 (79ndash99) 25+ years 1986ndash1991 41 (16ndash65) 126 (39ndash400) 181 (24ndash338) 83 (74ndash93)
1991ndash1996 84 (47ndash121) 66 (04ndash128) 76 (22ndash268) 65 (57ndash73) 1996ndash2001 62 (36ndash89) 75 (19ndash132) 72 (16ndash127) 62 (54ndash69) 2001ndash2004 118 (72ndash164) 51 (09ndash92) 69 (22ndash117) 51 (43ndash58) change 18 -57 -51 -43 P (trend) 035 007 014 lt01 Pooled 79 (60ndash98) 89 (43ndash135) 110 (57ndash163) 71 (67ndash75)
Females 1981ndash1986 33 (05ndash60) 56 (08ndash396) 14 (10ndash18) 25+ years 1986ndash1991 17 (06ndash46) 17 (02ndash123) 52 (07ndash371) 15 (12ndash19)
1991ndash1996 19 (03ndash34) 60 (02ndash118) 29 (06ndash137) 13 (10ndash17) 1996ndash2001 2001ndash2004 change P (trend)
25 (09ndash40) 25 (04ndash47)
-24 081
07 (01ndash49) 13 (03ndash55)
-77 055
12 (03ndash55) 15 (12ndash19) 10 (07ndash13)
-29 022
Pooled 24 (15ndash33) 31 (04ndash59) 31 (01ndash61) 14 (13ndash16)
208 Cancer Trends
Table 96 Age- and ethnicity-standardised rates of larynx cancer by income group
Larynx etc Age group
Cohort Low income SR (95 CI)
Medium income SR (95 CI)
High income SR (95 CI)
Males 1981ndash1986 104 (71ndash138) 93 (73ndash113) 74 (52ndash95) 25+ years 1986ndash1991
1991ndash1996 1996ndash2001 2001ndash2004 change P (trend) Pooled
97 (69ndash124) 87 (66ndash108) 74 (58ndash90) 80 (59ndash100)
-23 006
89 (78ndash100)
75 (59ndash92) 71 (55ndash86) 61 (48ndash73) 57 (41ndash72)
-39 lt01
72 (65ndash79)
55 (39ndash72) 42 (31ndash54) 41 (30ndash53) 41 (28ndash55)
-45 010
51 (44ndash58)
Females 1981ndash1986 17 (09ndash25) 11 (05ndash17) 13 (04ndash38) 25+ years 1986ndash1991 24 (15ndash33) 16 (05ndash28) 09 (04ndash14)
1991ndash1996 26 (11ndash40) 13 (07ndash19) 17 (04ndash30) 1996ndash2001 16 (10ndash23) 20 (11ndash29) 11 (05ndash16) 2001ndash2004 12 (06ndash18) 13 (06ndash20) 22 (01ndash43) change -29 18 69 P (trend) 023 043 051 Pooled 19 (15ndash24) 15 (11ndash18) 14 (09ndash20)
Table 97 Age-standardised rates of leukaemia by ethnic group
Leukaemia Age group
Cohort Total Māori SR (95 CI)
Total Pacific SR (95 CI)
Total Asian SR (95 CI)
EuropeanOther SR (95 CI)
Males 1981ndash1986 153 (84ndash222) 245 (73ndash418) 132 (119ndash146) 25+ years 1986ndash1991 119 (74ndash165) 157 (29ndash285) 226 (25ndash427) 163 (149ndash176)
1991ndash1996 182 (125ndash239) 182 (79ndash285) 180 (26ndash334) 184 (171ndash198) 1996ndash2001 248 (180ndash316) 191 (95ndash287) 185 (106ndash264) 224 (209ndash238) 2001ndash2004 267 (199ndash335) 234 (135ndash332) 118 (61ndash175) 267 (250ndash285) change 75 -4 102 P (trend) 004 051 lt01 Pooled 190 (163ndash218) 200 (144ndash256) 181 (117ndash245) 206 (199ndash212)
25ndash64 years 1981ndash1986 107 (56ndash157) 174 (45ndash303) 62 (50ndash73) 1986ndash1991 86 (47ndash124) 60 (11ndash109) 123 (06ndash239) 71 (60ndash82) 1991ndash1996 158 (97ndash220) 109 (42ndash175) 101 (13ndash188) 87 (74ndash99) 1996ndash2001 137 (96ndash179) 95 (35ndash156) 145 (76ndash213) 112 (98ndash125) 2001ndash2004 142 (96ndash188) 124 (61ndash186) 86 (38ndash135) 140 (124ndash156) change 33 -29 126 P (trend) 016 048 lt01 Pooled 125 (103ndash147) 112 (76ndash148) 116 (76ndash155) 100 (94ndash106)
65+ years 1981ndash1986 426 (73ndash780) 513 (127ndash207) 509 (445ndash572) 1986ndash1991 319 (95ndash544) 885 (233ndash337) 126 (24ndash657) 658 (593ndash723) 1991ndash1996 464 (202ndash727) 477 (10ndash944) 853 (206ndash353) 688 (629ndash747) 1996ndash2001 825 (475ndash118) 634 (168ndash110) 474 (22ndash926) 856 (787ndash925) 2001ndash2004 968 (603ndash133) 818 (272ndash137) 481 (38ndash924) 969 (885ndash105) change 127 59 90 P (trend) 005 028 lt01 Pooled 582 (442ndash722) 658 (324ndash991) 784 (200ndash137) 782 (751ndash812)
Cancer Trends 209
Leukaemia Age group
Cohort Total Māori SR (95 CI)
Total Pacific SR (95 CI)
Total Asian SR (95 CI)
EuropeanOther SR (95 CI)
Females 1981ndash1986 132 (74ndash189) 66 (20ndash213) 57 (13ndash239) 85 (75ndash94) 25+ years 1986ndash1991 110 (60ndash160) 136 (33ndash239) 97 (87ndash106)
1991ndash1996 163 (111ndash216) 148 (55ndash240) 82 (02ndash161) 120 (109ndash131) 1996ndash2001 123 (83ndash163) 151 (88ndash215) 86 (35ndash136) 130 (120ndash140) 2001ndash2004 187 (139ndash236) 138 (74ndash203) 89 (46ndash133) 161 (148ndash174) change 42 109 56 89 P (trend) 032 014 lt01 Pooled 141 (118ndash163) 127 (90ndash165) 78 (47ndash108) 122 (117ndash126)
25ndash64 years 1981ndash1986 91 (38ndash145) 75 (23ndash243) 23 (03ndash166) 43 (34ndash51) 1986ndash1991 66 (26ndash106) 103 (13ndash194) 53 (44ndash63) 1991ndash1996 119 (68ndash170) 101 (37ndash164) 38 (10ndash139) 66 (55ndash78) 1996ndash2001 100 (58ndash142) 93 (46ndash140) 84 (33ndash136) 65 (55ndash75) 2001ndash2004 121 (82ndash160) 94 (41ndash148) 65 (28ndash102) 83 (71ndash96) change 33 25 183 93 P (trend) 017 064 lt01 Pooled 98 (78ndash119) 93 (61ndash126) 52 (31ndash73) 63 (58ndash68)
65+ years 1981ndash1986 360 (93ndash626) 199 (28ndash141) 306 (264ndash348) 1986ndash1991 341 (102ndash580) 250 (60ndash104) 329 (290ndash369) 1991ndash1996 470 (184ndash755) 328 (95ndash114) 265 (66ndash106) 406 (364ndash448) 1996ndash2001 326 (142ndash509) 438 (119ndash757) 137 (19ndash973) 504 (455ndash552) 2001ndash2004 636 (347ndash924) 597 (61ndash113) 287 (17ndash557) 598 (534ndash662) change 77 44 95 P (trend) 043 lt01 Pooled 416 (303ndash530) 391 (214ndash568) 218 (68ndash368) 444 (423ndash466)
210 Cancer Trends
Table 98 Age- and ethnicity-standardised rates of leukaemia by income group
Leukaemia Age group
Cohort Low income SR (95 CI)
Medium income SR (95 CI)
High income SR (95 CI)
Males 1981ndash1986 122 (96ndash147) 132 (100ndash163) 120 (95ndash144) 25+ years 1986ndash1991 145 (122ndash169) 177 (144ndash209) 164 (133ndash195)
1991ndash1996 184 (152ndash216) 181 (156ndash206) 184 (151ndash217) 1996ndash2001 210 (182ndash238) 265 (229ndash301) 261 (218ndash303) 2001ndash2004 271 (235ndash308) 276 (241ndash312) 275 (232ndash318) change 122 109 129 P (trend) lt01 001 lt01 Pooled 182 (169ndash195) 203 (188ndash217) 197 (181ndash213)
25ndash64 years 1981ndash1986 62 (39ndash84) 52 (35ndash69) 65 (40ndash89) 1986ndash1991 74 (53ndash95) 65 (47ndash83) 85 (61ndash109) 1991ndash1996 102 (77ndash127) 87 (61ndash113) 112 (74ndash150) 1996ndash2001 102 (78ndash125) 136 (108ndash163) 128 (99ndash157) 2001ndash2004 144 (112ndash177) 160 (127ndash192) 127 (103ndash151) change 132 208 95 P (trend) 001 lt01 lt01 Pooled 94 (83ndash105) 97 (86ndash108) 102 (89ndash115)
65+ years 1981ndash1986 445 (332ndash557) 552 (353ndash750) 429 (329ndash530) 1986ndash1991 539 (427ndash650) 808 (555ndash106) 567 (431ndash704) 1991ndash1996 657 (507ndash807) 658 (552ndash764) 590 (481ndash699) 1996ndash2001 778 (646ndash910) 996 (818ndash118) 941 (739ndash114) 2001ndash2004 985 (810ndash116) 994 (812ndash118) 101 (79ndash123) change 121 80 136 P (trend) lt01 009 002 Pooled 666 (605ndash726) 792 (707ndash877) 692 (623ndash762)
Females 1981ndash1986 92 (73ndash110) 92 (65ndash118) 92 (63ndash121) 25+ years 1986ndash1991 102 (82ndash122) 105 (81ndash128) 99 (74ndash124)
1991ndash1996 118 (98ndash138) 143 (113ndash173) 125 (98ndash153) 1996ndash2001 140 (118ndash162) 117 (99ndash135) 136 (113ndash159) 2001ndash2004 173 (149ndash198) 180 (151ndash209) 149 (122ndash176) change 88 96 62 P (trend) lt01 013 lt01 Pooled 123 (113ndash132) 125 (113ndash136) 119 (107ndash131)
25ndash64 years 1981ndash1986 55 (38ndash72) 55 (21ndash89) 42 (24ndash60) 1986ndash1991 56 (39ndash73) 61 (40ndash81) 54 (35ndash72) 1991ndash1996 76 (58ndash94) 86 (53ndash119) 64 (42ndash86) 1996ndash2001 62 (46ndash77) 65 (47ndash83) 75 (52ndash98) 2001ndash2004 102 (79ndash125) 94 (70ndash118) 71 (51ndash90) change 85 71 69 P (trend) 017 018 002 Pooled 69 (61ndash77) 71 (59ndash83) 61 (52ndash70)
65+ years 1981ndash1986 286 (216ndash357) 337 (199ndash475) 332 (193ndash471) 1986ndash1991 343 (257ndash430) 351 (241ndash461) 324 (211ndash437) 1991ndash1996 370 (269ndash472) 440 (338ndash543) 443 (319ndash568) 1996ndash2001 585 (468ndash702) 401 (325ndash476) 486 (387ndash586) 2001ndash2004 601 (461ndash741) 650 (516ndash785) 598 (438ndash757) change 110 93 80 P (trend) 002 017 001 Pooled 429 (383ndash475) 425 (375ndash476) 429 (372ndash485)
Cancer Trends 211
Table 99 Age-standardised rates of lip mouth and pharynx cancer by ethnic group
Oropharynx Age group
Cohort Total Māori SR (95 CI)
Total Pacific SR (95 CI)
Total Asian SR (95 CI)
EuropeanOther SR (95 CI)
Males 1981ndash1986 93 (47ndash138) 281 (115ndash448) 277 (11ndash542) 187 (172ndash202) 25+ years 1986ndash1991 116 (71ndash160) 350 (134ndash565) 286 (99ndash474) 179 (165ndash193)
1991ndash1996 166 (106ndash226) 207 (85ndash330) 158 (46ndash270) 150 (138ndash163) 1996ndash2001 145 (101ndash189) 203 (112ndash295) 250 (134ndash365) 140 (129ndash152) 2001ndash2004 165 (117ndash213) 114 (51ndash177) 218 (134ndash303) 130 (117ndash143) change 77 -59 -21 -30 P (trend) 004 003 088 lt01 Pooled 136 (114ndash158) 237 (170ndash303) 239 (161ndash316) 159 (153ndash165)
Females 1981ndash1986 56 (22ndash89) 58 (04ndash113) 82 (28ndash242) 71 (61ndash80) 25+ years 1986ndash1991 48 (23ndash74) 108 (04ndash212) 103 (38ndash279) 74 (65ndash83)
1991ndash1996 41 (19ndash64) 56 (13ndash99) 52 (19ndash145) 57 (50ndash65) 1996ndash2001 66 (37ndash95) 69 (24ndash115) 83 (33ndash134) 61 (54ndash68) 2001ndash2004 48 (25ndash72) 99 (43ndash154) 80 (41ndash119) 68 (58ndash78) change -14 71 -2 -4 P (trend) 093 034 083 045 Pooled 52 (40ndash64) 77 (48ndash106) 80 (47ndash113) 66 (62ndash70)
Table 100 Age- and ethnicity-standardised rates of lip mouth and pharynx cancer by income group
Oropharynx Age group
Cohort Low income SR (95 CI)
Medium income SR (95 CI)
High income SR (95 CI)
Males 1981ndash1986 211 (178ndash244) 189 (156ndash222) 136 (103ndash169) 25+ years 1986ndash1991
1991ndash1996 1996ndash2001 2001ndash2004 change P (trend) Pooled
219 (188ndash250) 207 (171ndash244) 174 (148ndash200) 193 (164ndash222)
-9 017
201 (187ndash215)
175 (148ndash202) 144 (117ndash171) 156 (130ndash181) 122 (97ndash147)
-35 003
159 (146ndash172)
157 (119ndash195) 121 (96ndash146) 124 (97ndash152) 100 (78ndash123)
-26 008
129 (115ndash143)
Females 1981ndash1986 81 (64ndash98) 47 (34ndash59) 75 (49ndash101) 25+ years 1986ndash1991 83 (68ndash98) 75 (50ndash101) 58 (40ndash76)
1991ndash1996 72 (55ndash89) 50 (38ndash61) 42 (31ndash53) 1996ndash2001 68 (54ndash82) 67 (51ndash83) 57 (40ndash74) 2001ndash2004 76 (59ndash92) 65 (47ndash83) 64 (44ndash83) change -6 38 -15 P (trend) 023 027 095 Pooled 76 (69ndash83) 61 (53ndash68) 59 (50ndash67)
212 Cancer Trends
Table 101 Age-standardised rates of liver cancer by ethnic group
Liver Age group
Cohort Total Māori SR (95 CI)
Total Pacific SR (95 CI)
Total Asian SR (95 CI)
EuropeanOther SR (95 CI)
Males 1981ndash1986 126 (76ndash177) 237 (124ndash350) 65 (15ndash277) 29 (23ndash35) 25+ years 1986ndash1991 205 (141ndash268) 389 (217ndash561) 180 (43ndash317) 40 (34ndash47)
1991ndash1996 190 (135ndash245) 256 (136ndash376) 357 (168ndash545) 40 (34ndash46) 1996ndash2001 229 (177ndash281) 301 (202ndash401) 231 (131ndash331) 46 (40ndash52) 2001ndash2004 239 (183ndash295) 341 (227ndash455) 238 (149ndash327) 52 (45ndash60) change 90 44 266 79 P (trend) 003 034 012 lt01 Pooled 196 (171ndash221) 303 (246ndash360) 213 (154ndash272) 41 (38ndash44)
Females 1981ndash1986 80 (33ndash128) 67 (22ndash208) 17 (13ndash22) 25+ years 1986ndash1991 37 (12ndash63) 117 (08ndash226) 41 (09ndash186) 18 (14ndash22)
1991ndash1996 67 (34ndash100) 99 (38ndash159) 61 (20ndash187) 20 (16ndash25) 1996ndash2001 62 (36ndash88) 71 (24ndash118) 78 (20ndash137) 25 (20ndash29) 2001ndash2004 61 (33ndash89) 145 (74ndash215) 81 (31ndash130) 22 (18ndash27) change -24 116 29 P (trend) 065 047 007 Pooled 61 (46ndash76) 98 (64ndash132) 64 (37ndash92) 21 (19ndash23)
Table 102 Age- and ethnicity-standardised rates of liver cancer by income group
Liver Age group
Cohort Low income SR (95 CI)
Medium income SR (95 CI)
High income SR (95 CI)
Males 1981ndash1986 36 (22ndash51) 65 (41ndash89) 38 (21ndash54) 25+ years 1986ndash1991 79 (57ndash101) 64 (45ndash84) 109 (60ndash158)
1991ndash1996 84 (59ndash109) 79 (56ndash102) 65 (42ndash87) 1996ndash2001 97 (77ndash117) 89 (68ndash109) 69 (48ndash90) 2001ndash2004 115 (91ndash139) 118 (88ndash149) 72 (50ndash94) change 219 82 89 P (trend) lt01 002 017 Pooled 81 (71ndash90) 81 (71ndash92) 71 (57ndash84)
Females 1981ndash1986 32 (19ndash45) 24 (11ndash37) 21 (08ndash59) 25+ years 1986ndash1991 31 (18ndash43) 26 (14ndash38) 22 (08ndash64)
1991ndash1996 36 (24ndash49) 40 (24ndash55) 29 (13ndash45) 1996ndash2001 47 (31ndash63) 29 (19ndash38) 35 (17ndash53) 2001ndash2004 29 (19ndash39) 49 (31ndash67) 16 (08ndash25) change -9 104 -24 P (trend) 099 023 046 Pooled 35 (29ndash41) 33 (27ndash39) 25 (17ndash34)
Cancer Trends 213
Table 103 Age-standardised rates of lung cancer by ethnic group
Lung Age group
Cohort Total Māori SR (95 CI)
Total Pacific SR (95 CI)
Total Asian SR (95 CI)
EuropeanOther SR (95 CI)
Males 1981ndash1986 163 (140ndash185) 730 (375ndash109) 611 (274ndash948) 940 (907ndash973) 25+ years 1986ndash1991 157 (136ndash177) 139 (99ndash179) 896 (502ndash129) 850 (821ndash879)
1991ndash1996 173 (154ndash192) 113 (84ndash142) 463 (250ndash676) 808 (781ndash836) 1996ndash2001 151 (136ndash167) 124 (101ndash146) 572 (398ndash746) 691 (667ndash715) 2001ndash2004 147 (131ndash163) 926 (721ndash113) 482 (337ndash627) 638 (613ndash663) change -10 27 -21 -32 P (trend) 025 099 036 lt01 Pooled 159 (150ndash167) 109 (95ndash123) 611 (486ndash736) 793 (780ndash805)
25ndash64 years 1981ndash1986 928 (756ndash110) 404 (153ndash656) 250 (28ndash473) 480 (451ndash509) 1986ndash1991 865 (723ndash101) 985 (637ndash133) 518 (165ndash871) 432 (406ndash458) 1991ndash1996 107 (92ndash123) 698 (492ndash904) 144 (16ndash273) 357 (333ndash381) 1996ndash2001 868 (748ndash988) 585 (424ndash745) 279 (155ndash403) 285 (263ndash306) 2001ndash2004 743 (631ndash855) 360 (236ndash484) 170 (97ndash243) 236 (217ndash256) change -20 -11 -32 -51 P (trend) 029 040 053 lt01 Pooled 903 (838ndash968) 619 (511ndash726) 277 (181ndash373) 364 (353ndash375)
65+ years 1981ndash1986 606 (479ndash733) 249 (65ndash433) 281 (66ndash496) 373 (356ndash390) 1986ndash1991 560 (450ndash669) 511 (267ndash756) 327 (126ndash529) 343 (329ndash358) 1991ndash1996 608 (509ndash708) 393 (231ndash556) 259 (112ndash406) 341 (327ndash355) 1996ndash2001 554 (475ndash632) 476 (357ndash595) 206 (119ndash293) 302 (290ndash315) 2001ndash2004 605 (512ndash698) 457 (318ndash596) 216 (132ndash301) 293 (278ndash308) change -0 84 -23 -21 P (trend) 096 017 011 lt01 Pooled 586 (539ndash632) 415 (335ndash495) 260 (187ndash333) 332 (326ndash339)
Females 1981ndash1986 753 (609ndash897) 168 (49ndash286) 227 (57ndash397) 252 (236ndash268) 25+ years 1986ndash1991 109 (94ndash124) 381 (192ndash570) 349 (149ndash548) 305 (288ndash321)
1991ndash1996 125 (109ndash140) 312 (180ndash445) 307 (158ndash455) 362 (344ndash380) 1996ndash2001 121 (109ndash132) 423 (306ndash541) 225 (132ndash318) 362 (345ndash380) 2001ndash2004 133 (120ndash147) 579 (435ndash723) 328 (230ndash427) 390 (371ndash410) change 77 245 44 55 P (trend) 004 002 066 001 Pooled 112 (105ndash118) 362 (298ndash426) 285 (217ndash353) 331 (324ndash339)
25ndash64 years 1981ndash1986 525 (390ndash660) 123 (32ndash215) 139 (00ndash278) 158 (142ndash175) 1986ndash1991 692 (566ndash818) 196 (80ndash311) 71 (01ndash140) 181 (164ndash198) 1991ndash1996 811 (688ndash934) 151 (62ndash240) 276 (110ndash443) 207 (188ndash225) 1996ndash2001 737 (636ndash838) 243 (153ndash334) 102 (32ndash172) 196 (178ndash213) 2001ndash2004 874 (756ndash991) 306 (191ndash420) 133 (72ndash195) 216 (197ndash234) change 66 149 -4 37 P (trend) 006 005 063 003 Pooled 720 (666ndash775) 199 (154ndash243) 145 (94ndash196) 190 (183ndash198)
65+ years 1981ndash1986 259 (180ndash339) 452 (113ndash181) 578 (186ndash180) 865 (791ndash940) 1986ndash1991 405 (317ndash492) 116 (28ndash203) 158 (53ndash262) 110 (102ndash118) 1991ndash1996 406 (328ndash484) 123 (51ndash194) 701 (75ndash133) 134 (126ndash143) 1996ndash2001 440 (376ndash504) 132 (77ndash188) 956 (396ndash152) 138 (130ndash146) 2001ndash2004 471 (393ndash548) 201 (131ndash272) 134 (80ndash187) 144 (134ndash154) change 81 345 131 67 P (trend) 003 002 025 001 Pooled 392 (358ndash427) 119 (88ndash151) 101 (69ndash134) 122 (118ndash125)
214 Cancer Trends
Table 104 Age- and ethnicity-standardised rates of lung cancer by income group
Lung Age group
Cohort Low income SR (95 CI)
Medium income SR (95 CI)
High income SR (95 CI)
Males 1981ndash1986 126 (116ndash135) 959 (862ndash106) 913 (812ndash101) 25+ years 1986ndash1991
1991ndash1996 1996ndash2001 2001ndash2004 change P (trend) Pooled
113 (105ndash122) 109 (101ndash117) 105 (98ndash112)
979 (907ndash105) -22 lt01
111 (107ndash114)
107 (97ndash118) 994 (928ndash106) 908 (844ndash973) 804 (732ndash876)
-16 011
955 (918ndash992)
743 (653ndash832) 754 (659ndash849) 542 (490ndash594) 557 (494ndash621)
-39 003
709 (671ndash747)
25ndash64 years 1981ndash1986 658 (576ndash739) 511 (439ndash583) 490 (416ndash564) 1986ndash1991 565 (501ndash628) 564 (498ndash630) 389 (320ndash457) 1991ndash1996 580 (520ndash640) 459 (403ndash515) 350 (279ndash422) 1996ndash2001 467 (416ndash518) 436 (377ndash495) 236 (195ndash278) 2001ndash2004 452 (394ndash510) 299 (254ndash345) 208 (171ndash244) change -31 -41 -58 P (trend) 002 003 lt01 Pooled 549 (520ndash578) 462 (434ndash489) 341 (313ndash369)
65ndash74 years 1981ndash1986 493 (420ndash566) 364 (302ndash425) 340 (279ndash402) 1986ndash1991 458 (396ndash521) 443 (355ndash531) 287 (228ndash346) 1991ndash1996 426 (374ndash477) 396 (354ndash439) 288 (224ndash351) 1996ndash2001 417 (373ndash462) 333 (295ndash371) 197 (165ndash229) 2001ndash2004 406 (357ndash456) 325 (275ndash374) 211 (174ndash248) change -18 -11 -38 P (trend) 001 023 004 Pooled 442 (416ndash468) 375 (348ndash401) 267 (243ndash291)
75+ years 1981ndash1986 503 (437ndash570) 356 (271ndash442) 382 (280ndash484) 1986ndash1991 500 (420ndash579) 449 (357ndash541) 286 (225ndash347) 1991ndash1996 453 (376ndash530) 436 (381ndash491) 371 (280ndash462) 1996ndash2001 508 (434ndash581) 449 (383ndash514) 327 (258ndash395) 2001ndash2004 462 (392ndash531) 470 (386ndash553) 366 (276ndash455) change -8 32 -4 P (trend) 039 008 068 Pooled 486 (453ndash520) 430 (395ndash465) 345 (308ndash383)
Females 1981ndash1986 332 (293ndash371) 271 (220ndash321) 275 (213ndash336) 25+ years 1986ndash1991 448 (401ndash495) 432 (378ndash487) 351 (285ndash417)
1991ndash1996 565 (518ndash612) 433 (387ndash479) 456 (369ndash543) 1996ndash2001 569 (524ndash614) 456 (415ndash497) 358 (315ndash402) 2001ndash2004 618 (570ndash666) 488 (434ndash542) 427 (370ndash483) change 86 80 55 P (trend) 001 005 015 Pooled 501 (481ndash521) 412 (390ndash434) 371 (341ndash400)
25ndash64 years 1981ndash1986 206 (166ndash246) 216 (167ndash264) 173 (116ndash230) 1986ndash1991 259 (220ndash297) 269 (224ndash314) 183 (139ndash227) 1991ndash1996 350 (310ndash390) 265 (220ndash311) 200 (151ndash249) 1996ndash2001 324 (287ndash362) 254 (213ndash294) 208 (166ndash250) 2001ndash2004 366 (322ndash410) 261 (219ndash303) 274 (221ndash327) change 78 21 58 P (trend) 004 038 004 Pooled 298 (280ndash316) 253 (233ndash273) 204 (182ndash226)
Cancer Trends 215
Lung Age group
Cohort Low income SR (95 CI)
Medium income SR (95 CI)
High income SR (95 CI)
65ndash74 years 1981ndash1986 127 (103ndash152) 740 (409ndash107) 949 (644ndash125) 1986ndash1991 177 (148ndash206) 158 (121ndash195) 179 (113ndash245) 1991ndash1996 202 (173ndash231) 153 (126ndash181) 165 (113ndash217) 1996ndash2001 211 (183ndash239) 207 (175ndash238) 121 (94ndash149) 2001ndash2004 219 (186ndash251) 198 (157ndash238) 134 (97ndash171) change 72 167 41 P (trend) 002 003 047 Pooled 186 (173ndash198) 156 (141ndash171) 139 (119ndash160)
75+ years 1981ndash1986 104 (73ndash135) 674 (321ndash103) 882 (384ndash138) 1986ndash1991 138 (93ndash183) 140 (95ndash184) 116 (65ndash168) 1991ndash1996 183 (142ndash225) 144 (113ndash175) 246 (152ndash340) 1996ndash2001 218 (169ndash267) 136 (113ndash160) 141 (105ndash177) 2001ndash2004 279 (225ndash334) 193 (142ndash243) 186 (126ndash246) change 170 186 111 P (trend) lt01 008 019 Pooled 180 (160ndash199) 133 (117ndash150) 154 (126ndash182)
Table 105 Age-standardised rates of melanoma by ethnic group
Melanoma Age group
Cohort Total Māori SR (95 CI)
Total Pacific SR (95 CI)
Total Asian SR (95 CI)
EuropeanOther SR (95 CI)
Males 1981ndash1986 116 (59ndash172) 46 (13ndash161) 147 (14ndash280) 325 (304ndash347) 25+ years 1986ndash1991 97 (45ndash149) 105 (22ndash496) 23 (06ndash91) 441 (417ndash465)
1991ndash1996 86 (49ndash123) 55 (04ndash106) 23 (07ndash73) 611 (584ndash637) 1996ndash2001 137 (97ndash177) 73 (25ndash121) 60 (14ndash107) 737 (708ndash766) 2001ndash2004 137 (89ndash185) 46 (04ndash88) 66 (26ndash106) 833 (800ndash866) change 18 0 -55 156 P (trend) 032 100 035 lt01 Pooled 113 (92ndash135) 66 (26ndash106) 64 (32ndash95) 577 (565ndash589)
25ndash44 years 1981ndash1986 57 (20ndash95) 52 (12ndash221) 232 (68ndash792) 202 (175ndash229) 1986ndash1991 48 (05ndash92) 12 (02ndash83) 40 (10ndash159) 262 (231ndash292) 1991ndash1996 59 (24ndash94) 10 (01ndash72) 10 (01ndash68) 275 (244ndash305) 1996ndash2001 67 (26ndash109) 07 (01ndash51) 29 (09ndash99) 295 (262ndash329) 2001ndash2004 72 (33ndash112) 15 (02ndash109) 55 (02ndash108) 271 (236ndash305) change 26 -71 -76 34 P (trend) 008 053 057 010 Pooled 60 (42ndash78) 19 (01ndash37) 74 (12ndash136) 261 (247ndash274)
45ndash64 years 1981ndash1986 152 (35ndash268) 64 (09ndash453) 170 (42ndash697) 404 (361ndash447) 1986ndash1991 65 (10ndash119) 544 (495ndash592) 1991ndash1996 77 (12ndash142) 70 (17ndash287) 43 (11ndash173) 772 (717ndash827) 1996ndash2001 176 (102ndash250) 127 (13ndash240) 79 (03ndash154) 889 (830ndash947) 2001ndash2004 141 (67ndash215) 56 (13ndash243) 73 (05ndash141) 105 (98ndash112) change -7 -13 -57 160 P (trend) 030 lt01 Pooled 121 (85ndash157) 81 (32ndash129) 92 (30ndash155) 762 (737ndash787)
216 Cancer Trends
Melanoma Age group
Cohort Total Māori SR (95 CI)
Total Pacific SR (95 CI)
Total Asian SR (95 CI)
EuropeanOther SR (95 CI)
65+ years 1981ndash1986 206 (68ndash625) 554 (488ndash619) 1986ndash1991 310 (55ndash565) 655 (150ndash286) 884 (808ndash961) 1991ndash1996 236 (56ndash417) 247 (59ndash103) 140 (131ndash149) 1996ndash2001 284 (126ndash442) 224 (69ndash728) 98 (14ndash699) 188 (178ndash199) 2001ndash2004 362 (113ndash610) 127 (31ndash512) 73 (18ndash291) 224 (211ndash237) change 76 304 P (trend) 017 lt01 Pooled 275 (179ndash372) 325 (72ndash578) 87 (15ndash159) 204 (199ndash209)
Females 1981ndash1986 99 (54ndash143) 43 (11ndash179) 65 (15ndash285) 440 (414ndash465) 25+ years 1986ndash1991 110 (64ndash156) 13 (03ndash57) 131 (24ndash238) 542 (515ndash569)
1991ndash1996 101 (65ndash137) 73 (11ndash135) 146 (53ndash239) 605 (577ndash632) 1996ndash2001 157 (116ndash199) 91 (38ndash143) 63 (26ndash101) 666 (639ndash693) 2001ndash2004 161 (118ndash204) 70 (22ndash118) 25 (04ndash47) 792 (758ndash827) change 63 63 -62 80 P (trend) 007 012 011 lt01 Pooled 124 (105ndash143) 57 (34ndash81) 89 (52ndash126) 600 (587ndash612)
25ndash44 years 1981ndash1986 90 (41ndash139) 65 (09ndash459) 378 (340ndash415) 1986ndash1991 76 (35ndash117) 08 (01ndash56) 151 (02ndash301) 431 (391ndash470) 1991ndash1996 84 (41ndash128) 39 (05ndash73) 101 (37ndash280) 406 (369ndash443) 1996ndash2001 100 (62ndash139) 58 (00ndash115) 60 (10ndash110) 410 (374ndash446) 2001ndash2004 84 (44ndash123) 13 (03ndash50) 25 (00ndash51) 476 (429ndash523) change -7 -62 26 P (trend) 065 008 018 Pooled 87 (68ndash106) 31 (14ndash47) 83 (35ndash131) 417 (400ndash435)
45ndash64 years 1981ndash1986 59 (12ndash106) 108 (26ndash445) 111 (16ndash788) 511 (462ndash559) 1986ndash1991 93 (21ndash165) 46 (07ndash329) 155 (38ndash621) 645 (593ndash697) 1991ndash1996 111 (42ndash180) 183 (60ndash558) 767 (712ndash822) 1996ndash2001 178 (109ndash248) 85 (09ndash161) 98 (18ndash177) 860 (804ndash916) 2001ndash2004 246 (153ndash339) 88 (03ndash174) 976 (912ndash104) change 317 -19 91 P (trend) lt01 lt01 Pooled 132 (101ndash163) 81 (33ndash130) 137 (51ndash223) 696 (671ndash720)
65+ years 1981ndash1986 142 (45ndash451) 521 (463ndash580) 1986ndash1991 214 (25ndash404) 748 (683ndash814) 1991ndash1996 197 (32ndash362) 382 (111ndash131) 266 (61ndash117) 983 (911ndash106) 1996ndash2001 266 (100ndash431) 128 (41ndash401) 121 (113ndash129) 2001ndash2004 265 (90ndash440) 198 (63ndash618) 118 (27ndash505) 153 (142ndash164) change 87 193 P (trend) 003 lt01 Pooled 214 (137ndash292) 239 (95ndash383) 202 (59ndash345) 122 (118ndash126)
Notes Due to a 50 percent increase in melanoma registrations around 1994 (owing to changes introduced by the Cancer Registry Act 1993) the percentage increases in the table are overstated P values are not reliable and have therefore been suppressed The changes can be adjusted for by increasing the 1981ndash1986 and 1986ndash1991 rates by about 50 percent and probably disregarding 1991ndash1996 to gain an impression of change over time Trends in absolute inequalities over time are not interpretable hence pooled SRs and p for trends are not shown
Cancer Trends 217
Table 106 Age- and ethnicity-standardised rates of melanoma by income group
Melanoma Age group
Cohort Low income SR (95 CI)
Medium income SR (95 CI)
High income SR (95 CI)
Males 1981ndash1986 223 (188ndash258) 285 (250ndash321) 369 (326ndash412) 25+ years 1986ndash1991 365 (302ndash428) 361 (320ndash402) 431 (388ndash473)
1991ndash1996 400 (357ndash443) 504 (465ndash543) 582 (535ndash628) 1996ndash2001 544 (497ndash591) 625 (579ndash671) 688 (642ndash735) 2001ndash2004 556 (504ndash607) 654 (600ndash709) 806 (757ndash856) change 149 129 118 P (trend) lt01 lt01 lt01 Pooled 411 (389ndash433) 477 (458ndash496) 564 (543ndash584)
25ndash44 years 1981ndash1986 136 (93ndash180) 178 (139ndash216) 223 (174ndash273) 1986ndash1991 194 (146ndash242) 230 (184ndash276) 239 (187ndash290) 1991ndash1996 194 (147ndash241) 225 (180ndash270) 247 (202ndash292) 1996ndash2001 210 (157ndash262) 264 (209ndash319) 256 (209ndash303) 2001ndash2004 185 (131ndash238) 216 (157ndash275) 229 (187ndash271) change 36 21 3 P (trend) 020 021 070 Pooled 184 (162ndash206) 223 (201ndash245) 239 (218ndash261)
45ndash64 years 1981ndash1986 251 (185ndash316) 371 (283ndash458) 472 (379ndash564) 1986ndash1991 419 (334ndash505) 415 (351ndash479) 502 (425ndash579) 1991ndash1996 556 (471ndash642) 589 (509ndash669) 747 (646ndash847) 1996ndash2001 659 (564ndash755) 766 (672ndash859) 793 (710ndash877) 2001ndash2004 651 (555ndash748) 701 (601ndash801) 106 (95ndash116) change 159 89 124 P (trend) lt01 002 lt01 Pooled 500 (462ndash538) 562 (524ndash600) 697 (656ndash737)
65ndash74 years 1981ndash1986 429 (310ndash549) 500 (354ndash647) 512 (388ndash636) 1986ndash1991 674 (527ndash821) 593 (458ndash729) 991 (740ndash124) 1991ndash1996 839 (627ndash105) 123 (106ndash140) 138 (110ndash166) 1996ndash2001 113 (95ndash130) 142 (123ndash161) 187 (161ndash213) 2001ndash2004 117 (95ndash138) 180 (152ndash208) 208 (180ndash236) change 172 260 306 P (trend) lt01 lt01 lt01 Pooled 831 (753ndash909) 107 (99ndash116) 133 (122ndash144)
75+ years 1981ndash1986 421 (231ndash610) 469 (276ndash663) 807 (548ndash107) 1986ndash1991 111 (46ndash177) 110 (58ndash163) 961 (727ndash120) 1991ndash1996 882 (598ndash117) 132 (114ndash150) 130 (106ndash154) 1996ndash2001 188 (157ndash218) 176 (156ndash196) 211 (172ndash250) 2001ndash2004 206 (170ndash241) 256 (215ndash297) 260 (220ndash300) change 388 446 222 P (trend) 001 lt01 001 Pooled 123 (105ndash141) 139 (124ndash153) 150 (137ndash164)
Females 1981ndash1986 327 (291ndash364) 384 (341ndash427) 433 (384ndash481) 25+ years 1986ndash1991 418 (379ndash457) 453 (412ndash495) 517 (464ndash569)
1991ndash1996 449 (409ndash489) 528 (484ndash572) 543 (497ndash589) 1996ndash2001 503 (465ndash542) 577 (533ndash621) 607 (557ndash657) 2001ndash2004 513 (467ndash558) 680 (625ndash734) 722 (670ndash774) change 57 77 67 P (trend) lt01 lt01 lt01 Pooled 438 (421ndash456) 517 (497ndash537) 557 (534ndash579)
218 Cancer Trends
Melanoma Age group
Cohort Low income SR (95 CI)
Medium income SR (95 CI)
High income SR (95 CI)
25ndash44 years 1981ndash1986 238 (189ndash288) 370 (308ndash433) 383 (315ndash452) 1986ndash1991 296 (243ndash348) 370 (312ndash428) 415 (343ndash486) 1991ndash1996 276 (224ndash327) 367 (307ndash428) 381 (323ndash439) 1996ndash2001 295 (246ndash343) 360 (300ndash419) 380 (324ndash436) 2001ndash2004 286 (226ndash346) 387 (316ndash459) 389 (327ndash451) change 20 5 2 P (trend) 022 067 069 Pooled 278 (255ndash301) 370 (342ndash398) 390 (361ndash418)
45ndash64 years 1981ndash1986 418 (340ndash497) 359 (291ndash428) 469 (384ndash554) 1986ndash1991 577 (486ndash668) 477 (406ndash547) 594 (491ndash696) 1991ndash1996 632 (547ndash717) 608 (525ndash691) 641 (557ndash725) 1996ndash2001 631 (552ndash710) 663 (579ndash747) 798 (705ndash892) 2001ndash2004 652 (560ndash744) 852 (743ndash960) 915 (815ndash102) change 56 137 95 P (trend) 005 lt01 lt01 Pooled 579 (540ndash617) 579 (542ndash615) 672 (630ndash713)
65ndash74 years 1981ndash1986 432 (330ndash534) 454 (262ndash647) 582 (441ndash723) 1986ndash1991 536 (422ndash650) 724 (596ndash853) 782 (622ndash943) 1991ndash1996 690 (546ndash833) 978 (797ndash116) 100 (73ndash128) 1996ndash2001 970 (815ndash113) 109 (92ndash125) 803 (637ndash969) 2001ndash2004 102 (83ndash121) 137 (113ndash160) 141 (117ndash166) change 135 201 143 P (trend) lt01 lt01 009 Pooled 715 (652ndash777) 900 (820ndash980) 892 (802ndash982)
75+ years 1981ndash1986 469 (326ndash612) 463 (299ndash628) 343 (199ndash486) 1986ndash1991 621 (453ndash789) 838 (440ndash124) 581 (417ndash745) 1991ndash1996 738 (572ndash905) 887 (754ndash102) 882 (687ndash108) 1996ndash2001 101 (81ndash120) 122 (106ndash138) 135 (99ndash171) 2001ndash2004 115 (95ndash134) 146 (122ndash170) 156 (124ndash188) change 144 215 355 P (trend) lt01 lt01 lt01 Pooled 779 (701ndash856) 948 (841ndash106) 912 (802ndash102)
Note The same caveats apply to interpreting the data contained in this table as apply to Table 105 above
Cancer Trends 219
Table 107 Age-standardised rates of myeloma by ethnic group
Myeloma Age group
Cohort Total Māori SR (95 CI)
Total Pacific SR (95 CI)
Total Asian SR (95 CI)
EuropeanOther SR (95 CI)
Males 1981ndash1986 107 (34ndash181) 179 (30ndash327) 58 (08ndash409) 75 (65ndash85) 25+ years 1986ndash1991 117 (62ndash171) 157 (00ndash315) 09 (01ndash66) 70 (61ndash79)
1991ndash1996 89 (48ndash130) 214 (59ndash368) 76 (23ndash254) 83 (74ndash92) 1996ndash2001 216 (151ndash281) 184 (77ndash290) 65 (08ndash122) 95 (85ndash104) 2001ndash2004 147 (96ndash197) 215 (117ndash313) 29 (08ndash99) 103 (92ndash113) change 37 20 -50 37 P (trend) 037 021 034 002 Pooled 135 (108ndash161) 189 (126ndash251) 48 (15ndash82) 84 (80ndash88)
Females 1981ndash1986 52 (17ndash88) 08 (01ndash58) 45 (06ndash317) 46 (39ndash53) 25+ years 1986ndash1991 99 (45ndash153) 72 (01ndash143) 47 (41ndash54)
1991ndash1996 109 (60ndash158) 128 (46ndash209) 65 (21ndash200) 57 (50ndash64) 1996ndash2001 77 (45ndash108) 148 (80ndash217) 81 (25ndash136) 58 (51ndash64) 2001ndash2004 101 (64ndash138) 81 (32ndash131) 66 (23ndash109) 58 (50ndash65) change 94 913 47 26 P (trend) 025 007 003 Pooled 87 (68ndash106) 88 (59ndash116) 64 (33ndash95) 55 (51ndash58)
Table 108 Age- and ethnicity-standardised rates of myeloma by income group
Myeloma Age group
Cohort Low income SR (95 CI)
Medium income SR (95 CI)
High income SR (95 CI)
Males 1981ndash1986 83 (61ndash105) 78 (52ndash105) 123 (56ndash190) 25+ years 1986ndash1991 73 (55ndash92) 78 (45ndash111) 98 (55ndash142)
1991ndash1996 88 (65ndash112) 108 (75ndash141) 92 (69ndash115) 1996ndash2001 103 (81ndash125) 125 (99ndash151) 150 (99ndash201) 2001ndash2004 110 (88ndash132) 117 (93ndash140) 133 (92ndash173) change 33 50 8 P (trend) 005 004 034 Pooled 90 (81ndash100) 100 (87ndash114) 119 (97ndash140)
Females 1981ndash1986 46 (34ndash58) 33 (21ndash45) 58 (39ndash78) 25+ years 1986ndash1991 54 (39ndash70) 49 (34ndash64) 92 (49ndash135)
1991ndash1996 71 (53ndash88) 66 (48ndash83) 79 (44ndash114) 1996ndash2001 70 (53ndash88) 50 (39ndash62) 65 (48ndash81) 2001ndash2004 69 (54ndash84) 70 (53ndash86) 65 (48ndash83) change 50 112 12 P (trend) 004 010 080 Pooled 62 (55ndash69) 53 (46ndash59) 72 (59ndash85)
220 Cancer Trends
Table 109 Age-standardised rates of non-Hodgkinrsquos lymphoma by ethnic group
NHL Age group
Cohort Total Māori SR (95 CI)
Total Pacific SR (95 CI)
Total Asian SR (95 CI)
EuropeanOther SR (95 CI)
Males 1981ndash1986 127 (70ndash183) 299 (56ndash160) 100 (24ndash418) 134 (120ndash147) 25+ years 1986ndash1991 126 (74ndash179) 212 (82ndash341) 64 (19ndash220) 170 (156ndash184)
1991ndash1996 182 (109ndash255) 182 (55ndash308) 186 (54ndash319) 205 (190ndash220) 1996ndash2001 197 (150ndash245) 261 (155ndash367) 201 (107ndash295) 247 (231ndash263) 2001ndash2004 239 (170ndash308) 128 (60ndash197) 132 (59ndash204) 256 (237ndash275) change 88 -57 32 91 P (trend) lt01 026 034 lt01 Pooled 171 (144ndash198) 221 (106ndash335) 137 (87ndash187) 200 (193ndash207)
Females 1981ndash1986 113 (54ndash172) 37 (09ndash148) 95 (85ndash105) 25+ years 1986ndash1991 119 (63ndash175) 193 (58ndash329) 102 (11ndash193) 119 (108ndash130)
1991ndash1996 118 (75ndash160) 180 (82ndash278) 90 (16ndash164) 153 (141ndash166) 1996ndash2001 217 (164ndash269) 206 (124ndash288) 187 (107ndash266) 184 (170ndash197) 2001ndash2004 177 (129ndash226) 216 (128ndash304) 97 (52ndash142) 198 (183ndash213) change 57 162 108 P (trend) 015 026 lt01 Pooled 147 (124ndash171) 198 (151ndash244) 103 (70ndash135) 147 (142ndash153)
Table 110 Age- and ethnicity-standardised rates of non-Hodgkinrsquos lymphoma by income group
NHL Age group
Cohort Low income SR (95 CI)
Medium income SR (95 CI)
High income SR (95 CI)
Males 1981ndash1986 125 (101ndash148) 180 (123ndash237) 25+ years 1986ndash1991 146 (121ndash172) 173 (146ndash200) 188 (141ndash235)
1991ndash1996 219 (181ndash257) 206 (175ndash238) 202 (172ndash232) 1996ndash2001 218 (189ndash247) 239 (211ndash267) 274 (237ndash311) 2001ndash2004 251 (211ndash290) 245 (209ndash280) 253 (216ndash290) change 101 41 P (trend) lt01 007 Pooled 189 (175ndash203) 214 (200ndash227) 228 (211ndash245)
Females 1981ndash1986 86 (68ndash103) 84 (66ndash102) 89 (57ndash120) 25+ years 1986ndash1991 123 (101ndash145) 114 (89ndash140) 163 (112ndash215)
1991ndash1996 157 (134ndash181) 145 (121ndash169) 144 (118ndash169) 1996ndash2001 193 (167ndash218) 209 (179ndash238) 173 (145ndash201) 2001ndash2004 194 (167ndash222) 191 (163ndash219) 221 (184ndash257) change 126 127 148 P (trend) lt01 lt01 002 Pooled 148 (138ndash159) 146 (135ndash158) 155 (139ndash171)
Note Due to an aberrantly high rate in the middle-income male group in 1981ndash1986 pooled and trend statistics for this group are not presented
Cancer Trends 221
Table 111 Age-standardised rates of oesophageal cancer by ethnic group
Oesophagus Age group
Cohort Total Māori SR (95 CI)
Total Pacific SR (95 CI)
Total Asian SR (95 CI)
EuropeanOther SR (95 CI)
Males 1981ndash1986 168 (83ndash253) 88 (78ndash98) 25+ years 1986ndash1991 92 (46ndash137) 129 (05ndash254) 93 (83ndash103)
1991ndash1996 168 (110ndash226) 33 (10ndash106) 43 (06ndash305) 109 (99ndash119) 1996ndash2001 138 (92ndash184) 93 (34ndash151) 93 (15ndash171) 98 (89ndash107) 2001ndash2004 160 (109ndash210) 101 (27ndash174) 49 (08ndash89) 110 (100ndash121) change -5 25 P (trend) 044 012 Pooled 144 (118ndash171) 88 (52ndash125) 63 (30ndash95) 105 (101ndash110)
Females 1981ndash1986 42 (07ndash77) 27 (04ndash188) 40 (34ndash47) 25+ years 1986ndash1991 21 (08ndash59) 45 (39ndash51)
1991ndash1996 49 (21ndash78) 22 (05ndash93) 52 (46ndash58) 1996ndash2001 57 (29ndash85) 24 (00ndash47) 31 (10ndash103) 43 (37ndash48) 2001ndash2004 50 (23ndash77) 26 (08ndash81) 06 (01ndash42) 49 (42ndash55) change 19 -4 23 P (trend) 022 039 Pooled 43 (31ndash56) 25 (08ndash41) 20 (07ndash33) 46 (43ndash48)
Table 112 Age- and ethnicity-standardised rates of oesophageal cancer by income group
Oesophagus Age group
Cohort Low income SR (95 CI)
Medium income SR (95 CI)
High income SR (95 CI)
Males 1981ndash1986 96 (73ndash119) 119 (50ndash187) 90 (66ndash114) 25+ years 1986ndash1991 113 (91ndash135) 93 (72ndash113) 86 (50ndash121)
1991ndash1996 144 (118ndash170) 121 (100ndash142) 71 (57ndash85) 1996ndash2001 123 (100ndash147) 101 (83ndash118) 83 (60ndash106) 2001ndash2004 144 (120ndash169) 127 (102ndash152) 92 (68ndash115) change 50 7 2 P (trend) 008 042 091 Pooled 123 (112ndash134) 111 (95ndash128) 84 (73ndash95)
Females 1981ndash1986 36 (26ndash46) 32 (22ndash43) 41 (24ndash58) 25+ years 1986ndash1991 41 (30ndash51) 39 (28ndash49) 43 (31ndash54)
1991ndash1996 65 (50ndash80) 44 (33ndash56) 43 (29ndash58) 1996ndash2001 45 (32ndash58) 45 (33ndash58) 45 (28ndash63) 2001ndash2004 45 (34ndash56) 44 (29ndash59) 47 (33ndash62) change 25 38 15 P (trend) 046 004 lt01 Pooled 46 (41ndash52) 41 (35ndash46) 44 (37ndash51)
222 Cancer Trends
Table 113 Age-standardised rates of ovarian cancer by ethnic group
Ovary Age group
Cohort Total Māori SR (95 CI)
Total Pacific SR (95 CI)
Total Asian SR (95 CI)
EuropeanOther SR (95 CI)
Females 25+ years
1981ndash1986 1986ndash1991 1991ndash1996 1996ndash2001 2001ndash2004 change P (trend) Pooled
124 (77ndash171) 173 (121ndash225) 249 (189ndash310) 207 (165ndash250) 192 (146ndash239)
55 023
189 (166ndash212)
272 (121ndash422) 275 (147ndash404) 241 (145ndash336) 273 (183ndash363) 193 (118ndash267)
-29 016
254 (202ndash305)
77 (24ndash247) 133 (19ndash248) 253 (115ndash390) 222 (141ndash304) 150 (92ndash208)
95 043
168 (121ndash214)
169 (154ndash184) 185 (170ndash200) 197 (183ndash211) 198 (184ndash212) 188 (174ndash203)
11 021
187 (181ndash194)
Table 114 Age- and ethnicity-standardised rates of ovarian cancer by income group
Ovary Age group
Cohort Low income SR (95 CI)
Medium income SR (95 CI)
High income SR (95 CI)
Females 1981ndash1986 172 (143ndash201) 155 (128ndash183) 177 (141ndash213) 25+ years 1986ndash1991 198 (169ndash226) 192 (164ndash220) 176 (146ndash207)
1991ndash1996 202 (175ndash228) 185 (159ndash210) 257 (211ndash303) 1996ndash2001 208 (183ndash234) 212 (184ndash240) 206 (177ndash236) 2001ndash2004 214 (186ndash243) 204 (174ndash234) 160 (135ndash186) change 24 32 -10 P (trend) 003 007 082 Pooled 198 (186ndash210) 189 (176ndash201) 197 (181ndash213)
25ndash44 years 1981ndash1986 103 (65ndash140) 84 (46ndash122) 64 (33ndash95) 1986ndash1991 81 (47ndash114) 70 (41ndash99) 66 (38ndash93) 1991ndash1996 58 (36ndash80) 61 (39ndash84) 95 (56ndash134) 1996ndash2001 75 (49ndash102) 70 (44ndash97) 87 (59ndash115) 2001ndash2004 72 (48ndash97) 47 (26ndash68) 66 (38ndash94) change -30 -44 3 P (trend) 046 007 064 Pooled 78 (65ndash92) 67 (54ndash80) 76 (62ndash90)
45ndash64 years 1981ndash1986 209 (154ndash263) 189 (137ndash241) 206 (152ndash259) 1986ndash1991 288 (228ndash347) 316 (247ndash385) 296 (201ndash391) 1991ndash1996 340 (273ndash407) 261 (201ndash320) 287 (212ndash363) 1996ndash2001 310 (253ndash368) 309 (247ndash372) 289 (228ndash350) 2001ndash2004 290 (232ndash348) 279 (215ndash343) 209 (154ndash264) change 39 48 1 P (trend) 024 023 085 Pooled 287 (261ndash314) 270 (243ndash298) 260 (228ndash292)
65+ years 1981ndash1986 311 (231ndash391) 361 (266ndash456) 488 (333ndash643) 1986ndash1991 381 (306ndash455) 379 (292ndash466) 348 (261ndash435) 1991ndash1996 421 (328ndash515) 421 (342ndash500) 716 (501ndash932) 1996ndash2001 451 (346ndash556) 461 (361ndash561) 414 (309ndash519) 2001ndash2004 541 (406ndash677) 585 (449ndash721) 402 (294ndash509) change 74 62 -18 P (trend) lt01 002 099 Pooled 415 (372ndash458) 434 (390ndash478) 477 (412ndash542)
Cancer Trends 223
Table 115 Age-standardised rates of pancreatic cancer by ethnic group
Pancreas Age group
Cohort Total Māori SR (95 CI)
Total Pacific SR (95 CI)
Total Asian SR (95 CI)
EuropeanOther SR (95 CI)
Males 1981ndash1986 199 (122ndash275) 337 (40ndash633) 126 (114ndash138) 25+ years 1986ndash1991 186 (120ndash251) 212 (60ndash365) 119 (38ndash373) 139 (127ndash151)
1991ndash1996 162 (98ndash227) 108 (35ndash181) 100 (30ndash336) 126 (115ndash137) 1996ndash2001 220 (158ndash282) 189 (103ndash274) 38 (13ndash114) 128 (118ndash139) 2001ndash2004 change P (trend)
179 (120ndash238) -10 098
150 (73ndash228) -55 084
82 (32ndash132) 118 (107ndash130) -6 030
Pooled 190 (160ndash220) 202 (127ndash277) 85 (40ndash130) 128 (123ndash133)
Females 1981ndash1986 104 (47ndash161) 122 (44ndash342) 92 (21ndash397) 83 (74ndash92) 25+ years 1986ndash1991 136 (75ndash197) 186 (23ndash350) 35 (05ndash251) 83 (75ndash91)
1991ndash1996 129 (80ndash178) 118 (28ndash208) 63 (22ndash178) 100 (91ndash109) 1996ndash2001 165 (117ndash212) 73 (25ndash121) 85 (25ndash145) 102 (93ndash110) 2001ndash2004 167 (114ndash219) 59 (10ndash108) 48 (12ndash83) 93 (84ndash102) change 61 -52 -48 12 P (trend) 002 006 080 019 Pooled 139 (115ndash163) 114 (65ndash163) 65 (28ndash103) 92 (88ndash96)
Table 116 Age- and ethnicity-standardised rates of pancreatic cancer by income group
Pancreas Age group
Cohort Low income SR (95 CI)
Medium income SR (95 CI)
High income SR (95 CI)
Males 1981ndash1986 163 (114ndash213) 151 (119ndash184) 162 (93ndash230) 25+ years 1986ndash1991 130 (107ndash154) 191 (148ndash233) 157 (110ndash204)
1991ndash1996 134 (106ndash162) 137 (111ndash162) 133 (99ndash166) 1996ndash2001 160 (133ndash187) 134 (108ndash161) 133 (106ndash160) 2001ndash2004 136 (111ndash160) 139 (115ndash163) 144 (102ndash185) change -17 -8 -11 P (trend) 085 036 033 Pooled 145 (130ndash160) 151 (137ndash165) 146 (125ndash167)
Females 1981ndash1986 88 (68ndash108) 133 (85ndash180) 80 (58ndash102) 25+ years 1986ndash1991 103 (79ndash127) 79 (61ndash97) 120 (67ndash173)
1991ndash1996 117 (93ndash142) 108 (89ndash127) 94 (65ndash124) 1996ndash2001 114 (95ndash133) 106 (89ndash123) 113 (82ndash144) 2001ndash2004 127 (104ndash150) 110 (84ndash137) 88 (62ndash113) change 44 -17 10 P (trend) 001 041 053 Pooled 109 (99ndash119) 107 (94ndash120) 100 (84ndash115)
224 Cancer Trends
Table 117 Age-standardised rates of prostate cancer by ethnic group
Prostate Age group
Cohort Total Māori SR (95 CI)
Total Pacific SR (95 CI)
Total Asian SR (95 CI)
EuropeanOther SR (95 CI)
Males 1981ndash1986 573 (419ndash727) 410 (78ndash741) 116 (29ndash465) 712 (683ndash741) 25+ years 1986ndash1991 742 (587ndash897) 106 (62ndash150) 402 (149ndash656) 741 (714ndash768)
1991ndash1996 137 (116ndash158) 119 (85ndash152) 575 (327ndash824) 139 (135ndash142) 1996ndash2001 183 (165ndash202) 209 (176ndash243) 956 (727ndash119) 208 (204ndash212) 2001ndash2004 191 (172ndash211) 191 (160ndash222) 958 (769ndash115) 209 (204ndash214) change 234 366 726 193 P (trend) lt01 002 lt01 002 Pooled 125 (117ndash133) 130 (114ndash146) 584 (484ndash683) 137 (135ndash138)
25ndash64 years 1981ndash1986 217 (120ndash315) 65 (20ndash206) 151 (134ndash168) 1986ndash1991 177 (112ndash243) 329 (83ndash574) 28 (04ndash198) 148 (132ndash164) 1991ndash1996 256 (187ndash326) 452 (239ndash666) 174 (29ndash319) 362 (338ndash386) 1996ndash2001 606 (498ndash714) 451 (317ndash586) 241 (138ndash344) 770 (735ndash806) 2001ndash2004 734 (619ndash850) 592 (420ndash763) 411 (286ndash536) 991 (950ndash103) change 238 811 556 P (trend) 005 lt01 003 Pooled 381 (340ndash422) 367 (287ndash448) 201 (152ndash250) 541 (528ndash554)
65+ years 1981ndash1986 262 (176ndash348) 194 (16ndash373) 640 (160ndash256) 365 (348ndash381) 1986ndash1991 377 (288ndash466) 521 (277ndash765) 229 (78ndash380) 383 (368ndash398) 1991ndash1996 690 (573ndash808) 559 (370ndash747) 291 (127ndash456) 694 (674ndash714) 1996ndash2001 909 (805ndash1013) 1078 (883ndash1274) 503 (353ndash653) 962 (938ndash985) 2001ndash2004 874 (763ndash986) 977 (784ndash1171) 405 (299ndash510) 904 (876ndash933) change 233 403 532 148 P (trend) lt01 002 002 002 Pooled 610 (564ndash656) 650 (559ndash741) 293 (231ndash355) 649 (640ndash658)
Cancer Trends 225
Table 118 Age- and ethnicity-standardised rates of prostate cancer by income group
Prostate Age group
Cohort Low income SR (95 CI)
Medium income SR (95 CI)
High income SR (95 CI)
Males 1981ndash1986 654 (599ndash709) 740 (628ndash851) 697 (620ndash773) 25+ years 1986ndash1991 807 (724ndash890) 801 (716ndash886) 771 (687ndash856)
1991ndash1996 125 (116ndash134) 139 (131ndash146) 162 (147ndash178) 1996ndash2001 194 (184ndash203) 203 (194ndash211) 236 (225ndash247) 2001ndash2004 197 (187ndash207) 208 (198ndash218) 219 (208ndash229) change 202 181 214 P (trend) lt01 001 002 Pooled 129 (125ndash133) 137 (133ndash141) 149 (145ndash154)
25ndash64 years 1981ndash1986 153 (114ndash192) 162 (121ndash202) 156 (114ndash198) 1986ndash1991 153 (120ndash187) 168 (130ndash205) 187 (134ndash241) 1991ndash1996 382 (330ndash434) 318 (276ndash360) 383 (322ndash444) 1996ndash2001 578 (519ndash638) 737 (671ndash803) 848 (782ndash914) 2001ndash2004 795 (720ndash870) 877 (803ndash951) 108 (100ndash115) change 420 441 590 P (trend) 002 003 001 Pooled 393 (370ndash416) 431 (408ndash454) 503 (476ndash529)
65ndash74 years 1981ndash1986 260 (223ndash297) 249 (178ndash321) 265 (216ndash315) 1986ndash1991 294 (256ndash332) 281 (228ndash334) 304 (230ndash377) 1991ndash1996 442 (393ndash491) 542 (496ndash587) 645 (570ndash720) 1996ndash2001 831 (772ndash889) 860 (802ndash919) 1011 (934ndash1089) 2001ndash2004 847 (780ndash915) 908 (834ndash981) 934 (859ndash1008) change 226 264 252 P (trend) 002 lt01 001 Pooled 519 (497ndash541) 551 (524ndash578) 617 (585ndash648)
75+ years 1981ndash1986 487 (431ndash544) 596 (479ndash713) 527 (444ndash610) 1986ndash1991 709 (574ndash844) 674 (565ndash783) 602 (501ndash703) 1991ndash1996 907 (790ndash1025) 1019 (938ndash1099) 1248 (1017ndash1479) 1996ndash2001 1215 (1106ndash1324) 1142 (1056ndash1229) 1309 (1189ndash1428) 2001ndash2004 995 (891ndash1099) 1039 (926ndash1152) 965 (846ndash1084) change 104 74 83 P (trend) 003 006 009 Pooled 856 (808ndash905) 887 (841ndash932) 928 (864ndash992)
226 Cancer Trends
Table 119 Age-standardised rates of stomach cancer by ethnic group
Stomach Age group
Cohort Total Māori SR (95 CI)
Total Pacific SR (95 CI)
Total Asian SR (95 CI)
EuropeanOther SR (95 CI)
Males 1981ndash1986 385 (273ndash498) 764 (372ndash116) 123 (45ndash336) 234 (217ndash251) 25+ years 1986ndash1991 479 (359ndash600) 536 (270ndash802) 126 (44ndash359) 200 (186ndash214)
1991ndash1996 435 (337ndash533) 324 (195ndash454) 139 (35ndash242) 177 (164ndash189) 1996ndash2001 348 (280ndash417) 443 (306ndash581) 254 (144ndash363) 168 (156ndash180) 2001ndash2004 357 (278ndash437) 402 (261ndash544) 142 (65ndash218) 157 (144ndash170) change -7 -47 15 -33 P (trend) 027 060 062 001 Pooled 403 (358ndash448) 498 (389ndash608) 158 (107ndash208) 189 (182ndash195)
25ndash64 years 1981ndash1986 252 (155ndash349) 380 (127ndash634) 91 (29ndash285) 117 (103ndash132) 1986ndash1991 284 (194ndash374) 191 (92ndash290) 46 (11ndash193) 78 (67ndash89) 1991ndash1996 267 (193ndash341) 272 (151ndash393) 88 (21ndash155) 71 (61ndash82) 1996ndash2001 248 (185ndash311) 245 (139ndash351) 107 (39ndash174) 73 (63ndash84) 2001ndash2004 190 (137ndash243) 220 (117ndash323) 62 (20ndash104) 76 (64ndash87) change -25 -42 -32 -35 P (trend) 010 088 092 025 Pooled 251 (216ndash287) 264 (195ndash332) 80 (46ndash113) 83 (78ndash89)
65+ years 1981ndash1986 125 (68ndash181) 270 (74ndash465) 235 (33ndash167) 906 (822ndash990) 1986ndash1991 166 (101ndash231) 240 (79ndash402) 469 (117ndash188) 888 (814ndash962) 1991ndash1996 136 (87ndash185) 687 (137ndash124) 534 (122ndash234) 760 (697ndash824) 1996ndash2001 971 (648ndash129) 180 (100ndash261) 141 (50ndash232) 695 (635ndash756) 2001ndash2004 137 (91ndash183) 126 (60ndash191) 497 (119ndash875) 626 (557ndash695) change 10 -53 111 -31 P (trend) 060 095 045 lt01 Pooled 132 (109ndash155) 179 (121ndash237) 635 (326ndash944) 782 (751ndash814)
Females 1981ndash1986 274 (184ndash365) 274 (86ndash461) 107 (32ndash352) 113 (102ndash123) 25+ years 1986ndash1991
1991ndash1996 1996ndash2001 2001ndash2004 change P (trend) Pooled
245 (174ndash316) 263 (193ndash334) 233 (179ndash288) 271 (207ndash335)
-1 091
257 (224ndash289)
221 (81ndash360) 165 (59ndash272) 205 (124ndash285) 250 (161ndash338)
-9 076
222 (163ndash280)
180 (45ndash315) 73 (25ndash211)
105 (47ndash164) 86 (38ndash133)
-20 047
111 (67ndash156)
81 (73ndash89) 82 (74ndash90) 75 (67ndash82) 65 (58ndash73)
-42 005
84 (80ndash88)
25ndash64 years 1981ndash1986 168 (104ndash231) 127 (29ndash225) 175 (46ndash665) 42 (33ndash50) 1986ndash1991 150 (96ndash203) 189 (69ndash309) 92 (07ndash177) 29 (23ndash36) 1991ndash1996 147 (95ndash200) 113 (42ndash183) 27 (06ndash113) 32 (25ndash39) 1996ndash2001 113 (78ndash147) 113 (56ndash170) 84 (26ndash141) 26 (20ndash32) 2001ndash2004 142 (99ndash185) 152 (80ndash224) 45 (12ndash78) 29 (23ndash36) change -15 20 -74 -31 P (trend) 028 099 082 020 Pooled 144 (121ndash167) 138 (99ndash178) 87 (32ndash141) 32 (29ndash35)
65+ years 1981ndash1986 107 (52ndash163) 895 (322ndash249) 483 (432ndash534) 1986ndash1991 749 (375ndash112) 452 (113ndash181) 548 (177ndash170) 360 (319ndash401) 1991ndash1996 968 (598ndash134) 419 (124ndash142) 274 (68ndash111) 330 (295ndash366) 1996ndash2001 885 (588ndash118) 637 (244ndash103) 256 (94ndash698) 331 (291ndash371) 2001ndash2004 change P (trend)
103 (63ndash142) -4 066
771 (331ndash121) -14 049
345 (45ndash645) 257 (219ndash294) -47 003
Pooled 936 (753ndash112) 628 (349ndash907) 356 (166ndash547) 323 (306ndash341)
Cancer Trends 227
Table 120 Age- and ethnicity-standardised rates of stomach cancer by income group
Stomach Age group
Cohort Low income SR (95 CI)
Medium income SR (95 CI)
High income SR (95 CI)
Males 1981ndash1986 320 (256ndash385) 280 (223ndash336) 248 (190ndash306) 25+ years 1986ndash1991
1991ndash1996 1996ndash2001 2001ndash2004 change P (trend) Pooled
309 (259ndash359) 249 (211ndash287) 222 (189ndash254) 211 (174ndash248)
-34 001
265 (244ndash286)
221 (184ndash258) 224 (191ndash257) 225 (195ndash254) 232 (187ndash277)
-17 048
237 (218ndash255)
226 (161ndash290) 207 (156ndash257) 159 (131ndash187) 156 (127ndash185)
-37 001
201 (179ndash224)
25ndash64 years 1981ndash1986 127 (94ndash159) 122 (90ndash153) 167 (103ndash231) 1986ndash1991 146 (102ndash189) 95 (72ndash118) 88 (59ndash116) 1991ndash1996 136 (106ndash167) 99 (71ndash127) 92 (62ndash123) 1996ndash2001 111 (86ndash136) 116 (85ndash147) 102 (68ndash137) 2001ndash2004 99 (73ndash125) 112 (84ndash141) 75 (55ndash95) change -22 -8 -55 P (trend) 011 080 025 Pooled 125 (110ndash140) 109 (96ndash122) 106 (88ndash124)
65+ years 1981ndash1986 130 (97ndash164) 110 (82ndash139) 909 (616ndash120) 1986ndash1991 125 (101ndash149) 100 (74ndash126) 977 (627ndash133) 1991ndash1996 888 (703ndash107) 913 (746ndash108) 863 (587ndash114) 1996ndash2001 830 (673ndash987) 902 (742ndash106) 563 (426ndash701) 2001ndash2004 795 (610ndash979) 947 (681ndash121) 624 (465ndash783) change -39 -14 -31 P (trend) 004 014 010 Pooled 102 (92ndash113) 974 (871ndash108) 795 (677ndash914)
Females 1981ndash1986 165 (134ndash196) 153 (109ndash197) 105 (72ndash139) 25+ years 1986ndash1991 130 (106ndash155) 108 (83ndash133) 82 (61ndash103)
1991ndash1996 123 (100ndash146) 103 (81ndash124) 94 (56ndash132) 1996ndash2001 108 (87ndash129) 125 (100ndash150) 86 (63ndash109) 2001ndash2004 99 (77ndash120) 127 (98ndash157) 109 (78ndash141) change -40 -17 4 P (trend) 001 086 069 Pooled 126 (115ndash137) 123 (109ndash137) 95 (81ndash108)
25ndash64 years 1981ndash1986 78 (53ndash104) 63 (39ndash87) 44 (26ndash62) 1986ndash1991 63 (44ndash81) 57 (33ndash81) 37 (20ndash55) 1991ndash1996 53 (37ndash70) 43 (24ndash61) 44 (11ndash77) 1996ndash2001 51 (36ndash65) 46 (30ndash63) 28 (16ndash40) 2001ndash2004 44 (29ndash58) 71 (48ndash95) 54 (33ndash74) change -44 13 23 P (trend) 001 096 083 Pooled 58 (50ndash67) 55 (46ndash65) 41 (31ndash50)
65+ years 1981ndash1986 1986ndash1991 1991ndash1996 1996ndash2001 2001ndash2004 change P (trend) Pooled
660 (500ndash820) 484 (353ndash615) 479 (365ndash592) 420 (312ndash528) 426 (298ndash554)
-35 007
497 (439ndash555)
684 (397ndash972) 380 (278ndash483) 422 (313ndash531) 551 (410ndash692) 463 (268ndash659)
-32 063
502 (421ndash582)
396 (228ndash564) 349 (208ndash491) 346 (169ndash522) 398 (247ndash548) 368 (221ndash516)
-7 095
372 (300ndash443)
228 Cancer Trends
Table 121 Age-standardised rates of testicular cancer by ethnic group
Testicular Age group
Cohort Total Māori SR (95 CI)
Total Pacific SR (95 CI)
Total Asian SR (95 CI)
EuropeanOther SR (95 CI)
Males 1981ndash1986 112 (75ndash150) 26 (08ndash80) 23 (06ndash96) 75 (65ndash85) 15+ years 1986ndash1991 66 (44ndash88) 66 (18ndash234) 57 (15ndash221) 74 (64ndash83)
1991ndash1996 114 (85ndash142) 51 (19ndash82) 42 (05ndash78) 72 (63ndash81) 1996ndash2001 140 (112ndash169) 21 (05ndash37) 33 (13ndash53) 81 (71ndash92) 2001ndash2004 142 (107ndash177) 27 (07ndash46) 27 (08ndash45) 114 (100ndash128) change 27 4 17 52 P (trend) 015 067 087 021 Pooled 113 (100ndash127) 39 (19ndash59) 37 (17ndash57) 82 (77ndash86)
15ndash44 years 1981ndash1986 146 (98ndash194) 39 (12ndash120) 35 (09ndash144) 104 (89ndash119) 1986ndash1991 100 (63ndash138) 40 (12ndash135) 86 (22ndash334) 90 (77ndash104) 1991ndash1996 158 (115ndash201) 58 (19ndash96) 63 (08ndash119) 86 (73ndash99) 1996ndash2001 198 (154ndash242) 32 (08ndash56) 50 (20ndash80) 108 (93ndash123) 2001ndash2004 198 (148ndash249) 37 (07ndash67) 42 (10ndash73) 144 (123ndash164) change 36 -5 20 38 P (trend) 012 058 097 034 Pooled 158 (138ndash178) 41 (24ndash59) 56 (26ndash86) 105 (98ndash111)
Table 122 Age- and ethnicity-standardised rates of testicular cancer by income group
Testicular Age group
Cohort Low income SR (95 CI)
Medium income SR (95 CI)
High income SR (95 CI)
Males 1981ndash1986 98 (74ndash121) 79 (61ndash97) 71 (53ndash89) 15+ years 1986ndash1991 72 (55ndash89) 65 (51ndash79) 66 (50ndash82)
1991ndash1996 69 (54ndash85) 87 (70ndash104) 71 (55ndash88) 1996ndash2001 106 (85ndash126) 83 (65ndash101) 74 (59ndash90) 2001ndash2004 110 (86ndash134) 123 (98ndash147) 91 (73ndash109) change 12 56 28 P (trend) 041 017 012 Pooled 90 (81ndash99) 86 (78ndash94) 74 (66ndash81)
15ndash24 years 1981ndash1986 87 (32ndash142) 89 (42ndash137) 48 (20ndash75) 1986ndash1991 42 (12ndash71) 69 (37ndash101) 29 (07ndash52) 1991ndash1996 31 (08ndash54) 36 (11ndash60) 65 (25ndash104) 1996ndash2001 42 (15ndash68) 67 (28ndash106) 80 (35ndash125) 2001ndash2004 62 (24ndash100) 61 (20ndash102) 59 (21ndash97) change -29 -31 23 P (trend) 095 060 031 Pooled 52 (36ndash69) 65 (48ndash81) 56 (40ndash72)
25ndash44 years 1981ndash1986 170 (119ndash221) 132 (92ndash172) 140 (98ndash181) 1986ndash1991 120 (84ndash156) 102 (73ndash130) 115 (81ndash148) 1991ndash1996 126 (88ndash165) 161 (121ndash200) 114 (79ndash149) 1996ndash2001 226 (174ndash278) 157 (114ndash200) 112 (81ndash144) 2001ndash2004 186 (126ndash245) 221 (164ndash278) 153 (113ndash193) change 9 67 9 P (trend) 040 012 078 Pooled 165 (143ndash186) 151 (133ndash170) 125 (109ndash142)
Cancer Trends 229
Table 123 Age-standardised rates of thyroid cancer by ethnic group
Thyroid Age group
Cohort Total Māori SR (95 CI)
Total Pacific SR (95 CI)
Total Asian SR (95 CI)
EuropeanOther SR (95 CI)
Males 1981ndash1986 36 (00ndash71) 05 (01ndash36) 17 (13ndash22) 15+ years 1986ndash1991 25 (06ndash44) 11 (03ndash43) 28 (07ndash111) 16 (12ndash20)
1991ndash1996 29 (09ndash50) 45 (16ndash127) 17 (04ndash70) 21 (16ndash25) 1996ndash2001 41 (23ndash59) 49 (08ndash90) 57 (04ndash110) 25 (20ndash30) 2001ndash2004 31 (14ndash48) 22 (07ndash66) 24 (06ndash43) 27 (21ndash33) change -14 340 59 P (trend) 055 014 002 Pooled 32 (22ndash43) 27 (13ndash41) 32 (15ndash49) 22 (20ndash24)
Females 1981ndash1986 85 (47ndash123) 219 (102ndash337) 142 (06ndash279) 40 (33ndash46) 15+ years 1986ndash1991 68 (41ndash94) 153 (71ndash234) 62 (04ndash121) 43 (36ndash50)
1991ndash1996 52 (28ndash76) 157 (73ndash241) 53 (11ndash94) 43 (36ndash50) 1996ndash2001 106 (80ndash133) 246 (175ndash318) 179 (116ndash242) 67 (57ndash77) 2001ndash2004 111 (80ndash142) 138 (87ndash189) 103 (64ndash142) 69 (59ndash78) change 31 -37 -27 73 P (trend) 029 065 048 005 Pooled 83 (70ndash96) 185 (146ndash224) 108 (72ndash144) 52 (48ndash55)
Table 124 Age- and ethnicity-standardised rates of thyroid cancer by income group
Thyroid Age group
Cohort Low income SR (95 CI)
Medium income SR (95 CI)
High income SR (95 CI)
Males 1981ndash1986 27 (12ndash42) 19 (10ndash28) 16 (08ndash24) 15+ years 1986ndash1991 18 (11ndash26) 21 (13ndash28) 14 (07ndash21)
1991ndash1996 22 (11ndash32) 20 (13ndash28) 22 (11ndash34) 1996ndash2001 24 (15ndash33) 33 (21ndash44) 32 (21ndash43) 2001ndash2004 26 (17ndash35) 28 (17ndash39) 26 (16ndash35) change -4 47 63 P (trend) 029 014 008 Pooled 23 (18ndash28) 24 (20ndash28) 22 (18ndash26)
Females 1981ndash1986 70 (49ndash91) 58 (36ndash79) 38 (24ndash52) 15+ years 1986ndash1991 51 (37ndash64) 46 (32ndash60) 62 (41ndash82)
1991ndash1996 43 (31ndash55) 63 (44ndash83) 37 (25ndash48) 1996ndash2001 94 (73ndash114) 74 (57ndash91) 81 (61ndash101) 2001ndash2004 84 (66ndash102) 90 (70ndash111) 72 (54ndash90) change 20 55 89 P (trend) 038 005 023 Pooled 68 (60ndash75) 65 (57ndash73) 57 (50ndash65)
230 Cancer Trends
Table 125 Age-standardised rates of ill-defined cancer by ethnic group
Ill-defined Age group
Cohort Total Māori SR (95 CI)
Total Pacific SR (95 CI)
Total Asian SR (95 CI)
EuropeanOther SR (95 CI)
Males 1981ndash1986 508 (383ndash633) 256 (98ndash413) 64 (09ndash457) 248 (230ndash265) 25+ years 1986ndash1991 418 (307ndash529) 357 (146ndash568) 347 (118ndash577) 257 (241ndash274)
1991ndash1996 386 (293ndash479) 458 (268ndash649) 92 (02ndash181) 243 (228ndash258) 1996ndash2001 325 (249ndash401) 383 (254ndash513) 181 (75ndash286) 245 (231ndash260) 2001ndash2004 368 (285ndash451) 276 (161ndash390) 42 (01ndash82) 181 (167ndash195) change -28 8 -34 -27 P (trend) 010 099 043 012 Pooled 403 (357ndash448) 350 (274ndash425) 150 (88ndash213) 237 (230ndash245)
Females 1981ndash1986 249 (163ndash335) 277 (53ndash501) 177 (63ndash497) 196 (182ndash210) 25+ years 1986ndash1991 416 (323ndash509) 217 (107ndash326) 87 (28ndash272) 213 (199ndash227)
1991ndash1996 304 (228ndash380) 285 (156ndash415) 133 (32ndash235) 204 (191ndash217) 1996ndash2001 335 (271ndash400) 358 (248ndash467) 162 (82ndash242) 197 (184ndash209) 2001ndash2004 234 (177ndash290) 229 (141ndash318) 94 (45ndash143) 137 (126ndash147) change -6 -17 -47 -30 P (trend) 055 092 057 015 Pooled 311 (276ndash346) 275 (210ndash340) 132 (80ndash184) 192 (186ndash198)
Table 126 Age- and ethnicity-standardised rates of ill-defined cancer by income group
Ill-defined Age group
Cohort Low income SR (95 CI)
Medium income SR (95 CI)
High income SR (95 CI)
Males 1981ndash1986 284 (243ndash326) 305 (247ndash363) 294 (221ndash367) 25+ years 1986ndash1991 314 (271ndash358) 270 (233ndash307) 307 (236ndash379)
1991ndash1996 329 (279ndash379) 286 (240ndash333) 251 (203ndash300) 1996ndash2001 299 (261ndash337) 287 (251ndash322) 190 (164ndash216) 2001ndash2004 271 (230ndash313) 195 (159ndash231) 182 (147ndash217) change -5 -36 -38 P (trend) 064 018 002 Pooled 301 (281ndash320) 272 (253ndash292) 248 (223ndash273)
Females 1981ndash1986 210 (175ndash245) 221 (174ndash267) 184 (150ndash218) 25+ years 1986ndash1991
1991ndash1996 1996ndash2001 2001ndash2004 change P (trend) Pooled
256 (222ndash290) 242 (209ndash275) 264 (230ndash297) 183 (157ndash209)
-13 051
233 (219ndash248)
257 (220ndash294) 230 (198ndash262) 209 (182ndash235) 146 (122ndash170)
-34 007
216 (200ndash232)
220 (175ndash266) 204 (166ndash243) 180 (152ndash208) 143 (114ndash172)
-22 020
188 (172ndash205)
Cancer Trends 231
Table 127 Age-standardised rates of childhood cancers by ethnic group
1st cancer Age group
Cohort Total Māori SR (95 CI)
Total Pacific SR (95 CI)
Total Asian SR (95 CI)
EuropeanOther SR (95 CI)
Both sexes 1ndash14 years
1981ndash1986 1986ndash1991 1991ndash1996 1996ndash2001 2001ndash2004 change P (trend) Pooled
117 (81ndash154) 143 (103ndash184) 151 (109ndash192) 121 (84ndash158) 121 (80ndash162)
3 087
131 (113ndash149)
153 (86ndash220) 276 (184ndash368) 195 (112ndash278) 180 (117ndash242) 169 (100ndash237)
10 088
196 (162ndash230)
206 (32ndash381) 212 (21ndash403) 149 (54ndash244) 207 (118ndash296) 146 (70ndash221)
-29 044
186 (124ndash248)
138 (106ndash171) 173 (141ndash204) 159 (129ndash189) 144 (119ndash170) 144 (116ndash171)
4 066
152 (139ndash165)
Table 128 Age- and ethnicity-standardised rates of childhood cancers by income group
1st cancer Age group
Cohort Low income SR (95 CI)
Medium income SR (95 CI)
High income SR (95 CI)
Both sexes 1ndash14 years
1981ndash1986 1986ndash1991 1991ndash1996 1996ndash2001 2001ndash2004 change P (trend) Pooled
116 (64ndash168) 146 (95ndash196) 137 (99ndash174) 106 (74ndash138) 115 (74ndash156)
-1 040
124 (105ndash144)
107 (78ndash137) 180 (141ndash219) 177 (116ndash238) 155 (111ndash199) 113 (72ndash154)
6 083
148 (128ndash168)
187 (110ndash264) 191 (118ndash264) 179 (130ndash227) 177 (135ndash219) 157 (116ndash198)
-16 004
179 (152ndash206)
Table 129 Age-standardised rates of adolescent cancers by ethnic group
1st cancer Age group
Cohort Total Māori SR (95 CI)
Total Pacific SR (95 CI)
Total Asian SR (95 CI)
EuropeanOther SR (95 CI)
Both sexes 15ndash24 years
1981ndash1986 1986ndash1991 1991ndash1996 1996ndash2001 2001ndash2004 change P (trend) Pooled
276 (214ndash337) 240 (182ndash298) 226 (173ndash279) 264 (207ndash320) 267 (203ndash331)
-3 093
254 (228ndash280)
360 (223ndash497) 505 (356ndash653) 434 (306ndash563) 356 (249ndash464) 152 (88ndash216)
-58 009
372 (316ndash428)
278 (24ndash532) 206 (38ndash373) 326 (182ndash470) 301 (197ndash405) 174 (93ndash255)
-37 037
261 (186ndash336)
276 (246ndash307) 297 (264ndash330) 334 (296ndash373) 340 (300ndash381) 377 (329ndash425)
37 lt01
322 (305ndash339)
Table 130 Age- and ethnicity-standardised rates of adolescent cancers by income group
1st cancer Age group
Cohort Low income SR (95 CI)
Medium income SR (95 CI)
High income SR (95 CI)
Both sexes 15ndash24 years
1981ndash1986 1986ndash1991 1991ndash1996 1996ndash2001 2001ndash2004 change P (trend) Pooled
234 (180ndash288) 265 (204ndash326) 365 (296ndash434) 261 (205ndash316) 315 (245ndash384)
35 038
287 (259ndash314)
334 (276ndash392) 311 (258ndash363) 317 (258ndash377) 327 (262ndash392) 344 (264ndash424)
3 063
326 (298ndash354)
292 (238ndash346) 337 (274ndash399) 348 (284ndash413) 403 (333ndash473) 360 (289ndash432)
23 008
347 (319ndash376)
232 Cancer Trends
Appendix 2 Miscellaneous
A21 Income thresholds
Table 131 Income tertile cut points for each five-year age group
Low income Medium income High income
0ndash4 years lt$20926 $20926 ndash lt$34548 ge$34549 5ndash9 years lt$21298 $21298 ndash lt$35785 ge$35787 10ndash14 years lt$23547 $23549 ndash lt$39449 ge$39450 15ndash19 years lt$28461 $28461 ndash lt$46773 ge$46774 20ndash24 years lt$31683 $31684 ndash lt$53335 ge$53335 25ndash29 years lt$29924 $29924 ndash lt$53597 ge$53597 30ndash34 years lt$27549 $27551 ndash lt$47141 ge$47141 35ndash39 years lt$28425 $28426 ndash lt$46868 ge$46869 40ndash44 years lt$32103 $32104 ndash lt$52046 ge$52047 45ndash49 years lt$36102 $36102 ndash lt$57565 ge$57565 50ndash54 years lt$36297 $36297 ndash lt$58787 ge$58788 55ndash59 years lt$31236 $31236 ndash lt$53335 ge$53335 60ndash64 years lt$23493 $23494 ndash lt$42850 ge$42851 65ndash69 years lt$20930 $20930 ndash lt$34548 ge$34549 70ndash74 years lt$20774 $20778 ndash lt$34548 ge$34549 ge 75 years lt$20332 $20337 ndash lt$34548 ge$34549
Table 132 Income quintile cut points for each five-year age group
Quintile 1 Quintile 2 Quintile 3 Quintile 4 Quintile 5
0ndash4 years lt$15591 $15591 ndash lt$23371 $23371 ndash lt$31064 $31064 ndash lt$43438 ge$43438 5ndash9 years lt$15849 $15850 ndash lt$24053 $24054 ndash lt$32492 $32495 ndash lt$44594 ge$44594 10ndash14 years lt$17394 $17396 ndash lt$26558 $26559 ndash lt$35849 $35849 ndash lt$49174 ge$49174 15ndash19 years lt$21062 $21062 ndash lt$31986 $31986 ndash lt$42689 $42690 ndash lt$57017 ge$57017 20ndash24 years lt$22948 $22949 ndash lt$35930 $35930 ndash lt$48572 $48572 ndash lt$63483 ge$63484 25ndash29 years lt$22207 $22208 ndash lt$33674 $33674 ndash lt$48133 $48135 ndash lt$66543 ge$66547 30ndash34 years lt$20924 $20926 ndash lt$30837 $30837 ndash lt$42345 $42347 ndash lt$62001 ge$62002 35ndash39 years lt$21588 $21589 ndash lt$31684 $31684 ndash lt$42345 $42346 ndash lt$59166 ge$59167 40ndash44 years lt$24384 $24384 ndash lt$35764 $35764 ndash lt$47189 $47190 ndash lt$64220 ge$64220 45ndash49 years lt$27047 $27048 ndash lt$40267 $40267 ndash lt$53057 $53057 ndash lt$70908 ge$70909 50ndash54 years lt$26953 $26954 ndash lt$40443 $40446 ndash lt$53596 $53597 ndash lt$72173 ge$72175 55ndash59 years lt$22371 $22373 ndash lt$35590 $35591 ndash lt$48022 $48024 ndash lt$66402 ge$66405 60ndash64 years lt$19347 $19350 ndash lt$27011 $27011 ndash lt$37998 $38003 ndash lt$55277 ge$55278 65ndash69 years lt$18454 $18467 ndash lt$22063 $22064 ndash lt$29523 $29523 ndash lt$43757 ge$43758 70ndash74 years lt$18448 $18454 ndash lt$20938 $20939 ndash lt$27639 $27642 ndash lt$40069 ge$40071 ge75 years lt$18056 $18071 ndash lt$20928 $20930 ndash lt$27011 $27011 ndash lt$38260 ge$38269
Cancer Trends 233
A22 Pooled over time measures of rates and measures of association
Standardised rates (SR) rate differences (SRD) and rate ratios (SRR) were calculated directly on unit-level data for each Census-cancer cohort Slope indices of inequality (SIIs) and relative indices of inequality (RIIs) were calculated on SRs brought out of the data laboratory but for each cohort separately
Given the small and sometimes unstable differences in cancer inequalities over cohorts it is useful to provide pooled over time estimates with some measure of statistical imprecision (that is confidence intervals) However in this case it was not feasible to calculate these pooled estimates and measures of statistical imprecision directly on unit record data The five separate Census-cohorts were not merged in the data laboratory at Statistics New Zealand and analyses on such pooled data would have been extremely time-consuming given the added processes necessarily involved
This section outlines the methods and approximations used to calculate the pooled estimates and their measures of imprecision
The pooled estimates in this report were intended to provide the lsquoaveragersquo over time Given that ethnic proportions varied over time while rates were also changing it was possible that a direct pooled estimate (not done) or Mantel-Haenszel would be confounded by time Standardisation by time was therefore decided on Each of the first four cohorts comprised five years of time but the last cohort comprised 382 years (March 2001 to December 2004) Thus the proportion of time occupied by each cohort was 021 021 021 021 and 016 respectively These proportions were the weights used (as outlined below) to standardise further over time here called wt as opposed to the standard nomenclature for such weights wi In this case the value refers to World Health Organization standard population weights and their derivations to include ethnicity used in the standardisation within cohorts
A221 Pooled standardised rates The pooled over time SR is simply the weighted average over time using the above weights
The variance of these pooled SRs (strictly standardised SRs) is approximated by the following formula
sum sum =
( (2Var
)t
tt
wSRw )
Var(SR)
where SR is the pooled SR over time wt the weight or proportion of time occupied by each cohort and SRt the SR in each cohort
For example assume each cohort has a rate of 200 per 100000 each with the same variance of 100 (which equates to a se of 10 and a 95 percent confidence interval of 1804ndash2196) The pooled SR is obviously 200 The variance of this pooled SR is 4times(0212 times100) + 0162times100 = 202 Thus the se of the pooled SR is 449
234 Cancer Trends
Table 133 below shows some mock data for standardised rates by cohort (SRt) and their variances (Var(SRt)) The pooled SR SR among the exposed is the weighted sum of the SRt that is 16165 per 100000 Among the unexposed it is 8865 per 100000 The variance of each of these SR is the sum of the cohort-specific variances of SRt each multiplied by wt
2 1840 among the exposed and 997 among the unexposed Thus the 95 percent confidence interval for SR among the exposed is 16165 plusmn (196times 1840) =15324 minus17006 per 100000
Table 133 Mock data for demonstrating calculation of pooled SR (per 100000)
Cohort (t) Wt
Exposed Unexposed
SRt Var(SRt) SRt times wt Var(SRt) times wt 2 SRt Var(SRt) SRt times wt Var(SRt) times wt
2
1981ndash1986 021 150 100 3150 441 100 60 2100 265 1986ndash1991 021 140 110 2940 485 90 45 1890 198 1991ndash1996 021 175 80 3675 353 85 40 1785 176 1996ndash2001 021 160 75 3360 331 90 55 1890 243 2001ndash2004 016 190 90 3040 230 75 45 1200 115
Sum 16165 1840 8865 997
A222 Pooled SRD and SRR
The pooled over time SRD SRD is the wt weighted average of the SRDt over time Alternatively it is just the difference between two stratum-specific pooled SR (for example Māori and EuropeanOther)
The variance of SRD is just the sum of the variance of the pooled SR for the unexposed (Var(SR 0 ) ) and exposed ( Var(SR1 ) )
The pooled over time SRR SRR is just the ratio of the pooled SR of the exposed ( SR1 ) to the unexposed ( SR0 ) The variance of ln( SRR ) is approximated by the following formula
Var(SR1 ) Var(SR 0 )Var[ln( SRR)] = 2 2+ SR1 SR 0
Extending the mock example in Table 133 the pooled SRD SRD is 7300 per 100000 with a variance of 2837 (that is 1840 + 997) The pooled SRR SRR is 182 The variance of ln( SRR ) is 0001973 (that is 1840161652 + 99788652) Calculating the confidence intervals in natural logarithm transformations then exponentiating the 95 percent confidence interval for SRR is 174ndash191
Cancer Trends 235
A223 Pooled SII and RII
Note that a variance calculated for SRD using a weight-squared sum of the variance of each cohort-specific SRD is mathematically identical to that given above using the sum of the variance of the pooled SRs Therefore it seems reasonable to calculate the pooled SII SII as simply the wt-weighted average of the SIIt over time The variance of SII is just the weighted sum of the variances of each cohort SII SIIt where the weights are the wt squared
However the calculation of a pooled RII using just the cohort-specific RII is not straightforward Further as the SII like the RII is a regression-based estimate it is not implausible that a lsquoproperlyrsquo calculated SII for all cohorts pooled might differ slightly from the above weighted average SII
Thus pooled SRs ( SR ) were first generated across all five cohorts for each quintile of income using data already exported from the Statistics New Zealand data laboratory then the standard methods used in the NZCMS and CancerTrends38 54 were applied to calculate the SIIs and RIIs directly on the pooled quintile SR This also required person time in each quintile (pooled over time) as both the weights in the regression and to calculate the central point on the cumulative proportion scale for ranked household income However as all five cohorts were actually pooled to determine quintile cut points each quintile group actually comprises exactly (or very close to) 20 percent Thus the regression did not need to be weighted and the ridit scores (central values of each quintile on the cumulative proportion scale) points could simply be fixed as 01 03 05 07 and 09
236 Cancer Trends