fighting poverty, profitably - bill & melinda gates...
TRANSCRIPT
1
SPECIAL REPORT ANNEX: Country-specific data on payments systems and financial inclusion
Fighting poverty, profitably Transforming the economics of payments to build sustainable, inclusive financial systems
Nigeria

FIGHTING POVERTY THROUGH PAYMENTS SEPTEMBER 2013 www.gatesfoundation.org 2
About the Gates Foundation’s Financial Services for the Poor program
Poor people do not live in a static state of poverty. Every year, many millions transition out of poverty by successfully
adopting new farming technologies, investing in new business opportunities, or finding new jobs. At the same time, large
numbers of people fall back into poverty due to health problems, financial setbacks, and other shocks. However, it is
costly to serve poor people with financial services, in part because most of their transactions are conducted in cash.
Storing, transporting, and processing cash is expensive for banks, insurance companies, utility companies, and other
institutions, and they pass on those costs to customers.
The Gates Foundation’s Financial Services for the Poor program aims to play a catalytic role in broadening the
reach of digital payment systems, particularly in poor and rural areas, and expanding the range of services available on
these systems. Until the infrastructure and customer base are well established, this might involve a combination of mobile
money services that are accessible via cell phones and brick-and-mortar stores, where subscribers can convert cash they
earn into digital money (and vice-versa).
Our approach has three mutually reinforcing objectives:
▪ Reducing the amount of time and money that poor people must spend to conduct financial transactions
▪ Increasing poor people’s capacity to weather financial shocks and capture income-generating opportunities
▪ Generating economy-wide efficiencies by digitally connecting large numbers of poor people to one another,
to other consumers, to financial services providers, to government services, and to businesses.
We are not focused on a particular product or distribution channel, but rather on innovative ways to expand
access and encourage markets. At the same time, we are aware that interventions in this and other areas too often
involve technologies that are made available to the intended users, but are not adopted. To address this demand-side
challenge, we are supporting research and product design experiments to identify design features, price incentives, and
marketing messages that will encourage poor people to adopt and actively use digital financial services. We are also
supporting policymakers as they work
to develop policies and regulations that facilitate these developments.
We believe that the combined effect of interventions to expand and encourage markets will accelerate the rate at
which poor people transition out of poverty and decrease the rate at which they fall back into poverty. Our strategy
also recognizes that countries are at different stages in developing an inclusive digital financial system, and that we must
tailor our interventions accordingly.
FIGHTING POVERTY THROUGH PAYMENTS SEPTEMBER 2013 www.gatesfoundation.org 3
About this document
Our goal: create a holistic view of payment system economics. The Gates Foundation’s Financial Services for the
Poor program conducted this research because we believe that there is a gap in the fact base and understanding of how
payment systems can extend digital services to low income consumers in developing markets. This is a complex topic,
with fragmented information and a high degree of country-by-country variability. A complete view across the entire global
payment system has been missing, limiting how system providers, policy makers, and regulators (groups we refer to
collectively as financial inclusion stakeholders) evaluate decisions and take actions. With a holistic view of the system,
we believe that interventions can have higher impact, and stakeholders can better understand and address the ripple
effects that changes to one part of the system can have. In this report, we focus on the economics of payment systems to
understand how they can be transformed to serve poor people in a way that is profitable and sustainable in aggregate.
Factors to keep in mind as you consider this report. The data available to evaluate individual payment systems is
limited. Even in highly advanced economies, complete and comparable information is difficult to obtain. In the
developing world, much of this data simply does not exist. Given that there are limited examples showing how providers
make money from providing financial services to the poor at scale, we looked at payment systems in both the developed
and developing worlds, and tried to learn how to apply lessons from both to reach the poor. In this report, we present a
complete set of analyses and estimates based on the strongest collection of data that we could assemble. Readers
should understand this base of data as a “best efforts” attempt to provide a full picture of payment system costs and
revenues, rather than a definitive source. We have focused on evaluating formal payment flows that have available data
and benchmarks. We recognize that there are large payment flows over informal channels, such as unlicensed money
transmitters, that are outside the scope of our analysis.
What we analyzed. As part of our work, we conducted a thorough assessment of the payment systems in six significant
economies – Nigeria, Kenya, India, China, the U.S., and the Netherlands – to understand their elements, changes over
time, and the economics for providers. McKinsey & Company’s Global Payments Map – a structured and consistent
dataset on payment systems – provided a critical pillar. We also interviewed more than 100 industry experts across the
countries profiled.
Structure of this pack. This pack summarizes our findings across the countries we analyzed. For each country, we
provide an overview of the payment system and the level of financial inclusion, followed by specific country analyses
pertaining to the four main elements of the payment system: accounts, cash in-cash out (CICO), transactions, and
adjacencies.
FIGHTING POVERTY THROUGH PAYMENTS SEPTEMBER 2013 www.gatesfoundation.org 4
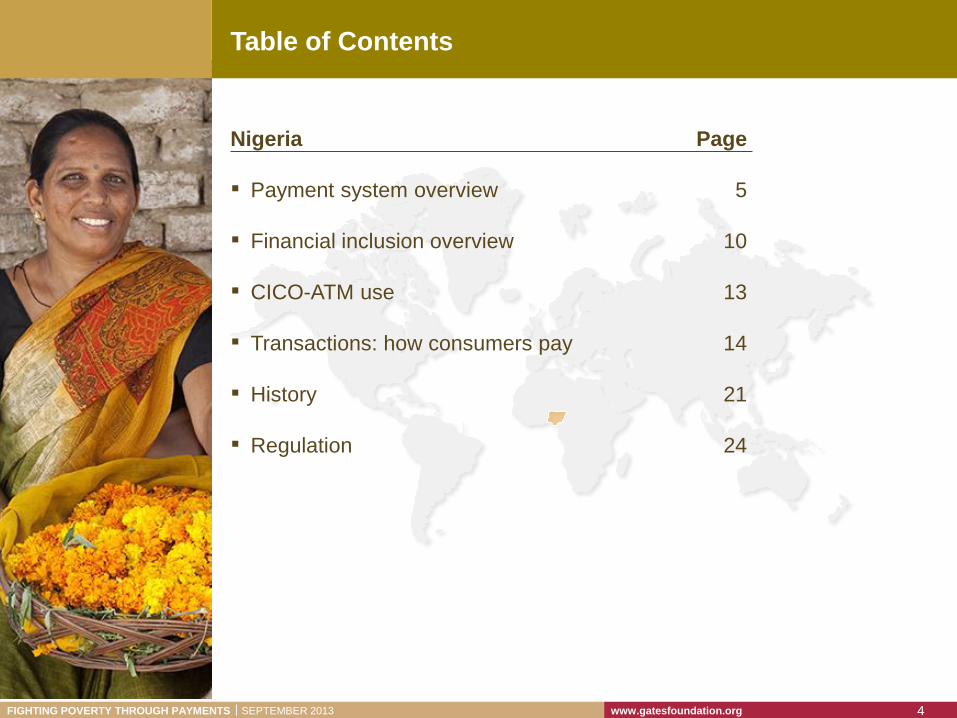
Table of Contents
Nigeria
▪ Payment system overview
▪ Financial inclusion overview
▪ CICO-ATM use
▪ Transactions: how consumers pay
▪ History
▪ Regulation
Page
5
10
13
14
21
24

FIGHTING POVERTY THROUGH PAYMENTS SEPTEMBER 2013 www.gatesfoundation.org 5
Implications for financial inclusion
▪ Bank-led test case – The regulator
may stimulate a bank-led mobile
money model with much broader
payments usage than remittance and
non-payment financial services; if
successful this will provide lessons for
other developing markets
▪ Core Infrastructure – Reminder that
basic infrastructure will limit
opportunities in many markets that are
still struggling to establish reliable
electricity and telecoms
▪ A good example of how early
adoption economics may function –
Generating public awareness of non-
cash alternatives; economics of POS
rollout and investment recovery;
convincing merchants to accept card
payments; structuring value chain
profitability to align incentives
▪ Substantial financial exclusion in
urban areas – There is a major
opportunity to expand inclusion,
focusing on urban centers and more
traditional infrastructure, given
proximity to branches, ATMs, and POS
Characteristics
▪ An established banking system, with a handful of particularly strong
players, administers non-cash payment instruments, and focuses mostly
on corporate and wealthy retail customers
▪ The economy is heavily cash-based with corresponding high costs of
cash, carried largely by banks. The unbanked use cash exclusively; even
the banked must carry cash in case of service outages and a lack of digital
acceptance at merchants; banks still cover cash management costs so
merchants see no need to change
▪ A consolidated, locally led payments infrastructure: Domestic
infrastructure players (NIBSS, InterSwitch) lead the market
▪ The regulator (Central Bank) plays an active role in shaping the
payments system, e.g., “Cashless” initiative, mobile money licenses,
routing most payments via NIBSS
▪ The Central Bank’s “Cashless” initiative applies multiple levers to
drive non-cash usage; offering a case-study on electronification of
payments in developing markets
▪ Mobile money growth is seen as complementary to traditional bank
offerings; and expanding traditional bank distribution channels is seen as
complementary to mobile money expansion (ATM cardless cashout, POS-
enabled cashback, customer migration and cross-sell)
▪ The bank-led model for mobile money has a clear goal to be a major
part of the financial system; it’s unclear if demand will be sufficient to
drive usage at scale. Mobile money is seen as an accelerator to bringing
customers into formal banking
The payment system in Nigeria
PAYMENT SYSTEM OVERVIEW
FIGHTING POVERTY THROUGH PAYMENTS SEPTEMBER 2013 www.gatesfoundation.org 6
Payments in Nigeria by the numbers
Instrument
usage
Financial
inclusion
Network
infrastructure
Regulation
Banking
system reach
Mobile &
telecoms
Other market
infrastructure
Economic
environment
Demographics
& geography
Usag
e &
In
clu
sio
n
Paym
en
t syste
m
En
vir
on
men
t
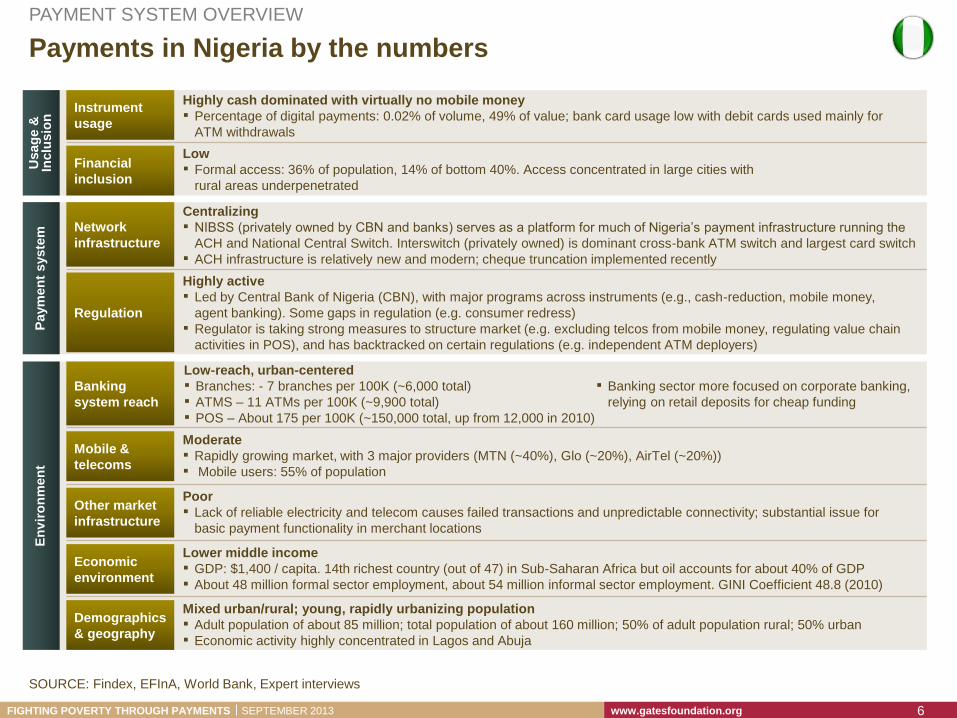
Highly cash dominated with virtually no mobile money
▪ Percentage of digital payments: 0.02% of volume, 49% of value; bank card usage low with debit cards used mainly for
ATM withdrawals
Low
▪ Formal access: 36% of population, 14% of bottom 40%. Access concentrated in large cities with
rural areas underpenetrated
Centralizing
▪ NIBSS (privately owned by CBN and banks) serves as a platform for much of Nigeria’s payment infrastructure running the
ACH and National Central Switch. Interswitch (privately owned) is dominant cross-bank ATM switch and largest card switch
▪ ACH infrastructure is relatively new and modern; cheque truncation implemented recently
Highly active
▪ Led by Central Bank of Nigeria (CBN), with major programs across instruments (e.g., cash-reduction, mobile money,
agent banking). Some gaps in regulation (e.g. consumer redress)
▪ Regulator is taking strong measures to structure market (e.g. excluding telcos from mobile money, regulating value chain
activities in POS), and has backtracked on certain regulations (e.g. independent ATM deployers)
Moderate
▪ Rapidly growing market, with 3 major providers (MTN (~40%), Glo (~20%), AirTel (~20%))
▪ Mobile users: 55% of population
Poor
▪ Lack of reliable electricity and telecom causes failed transactions and unpredictable connectivity; substantial issue for
basic payment functionality in merchant locations
Lower middle income
▪ GDP: $1,400 / capita. 14th richest country (out of 47) in Sub-Saharan Africa but oil accounts for about 40% of GDP
▪ About 48 million formal sector employment, about 54 million informal sector employment. GINI Coefficient 48.8 (2010)
Mixed urban/rural; young, rapidly urbanizing population
▪ Adult population of about 85 million; total population of about 160 million; 50% of adult population rural; 50% urban
▪ Economic activity highly concentrated in Lagos and Abuja
Low-reach, urban-centered
▪ Branches: - 7 branches per 100K (~6,000 total)
▪ ATMS – 11 ATMs per 100K (~9,900 total)
▪ POS – About 175 per 100K (~150,000 total, up from 12,000 in 2010)
▪ Banking sector more focused on corporate banking,
relying on retail deposits for cheap funding
SOURCE: Findex, EFInA, World Bank, Expert interviews
PAYMENT SYSTEM OVERVIEW
FIGHTING POVERTY THROUGH PAYMENTS SEPTEMBER 2013 www.gatesfoundation.org 7
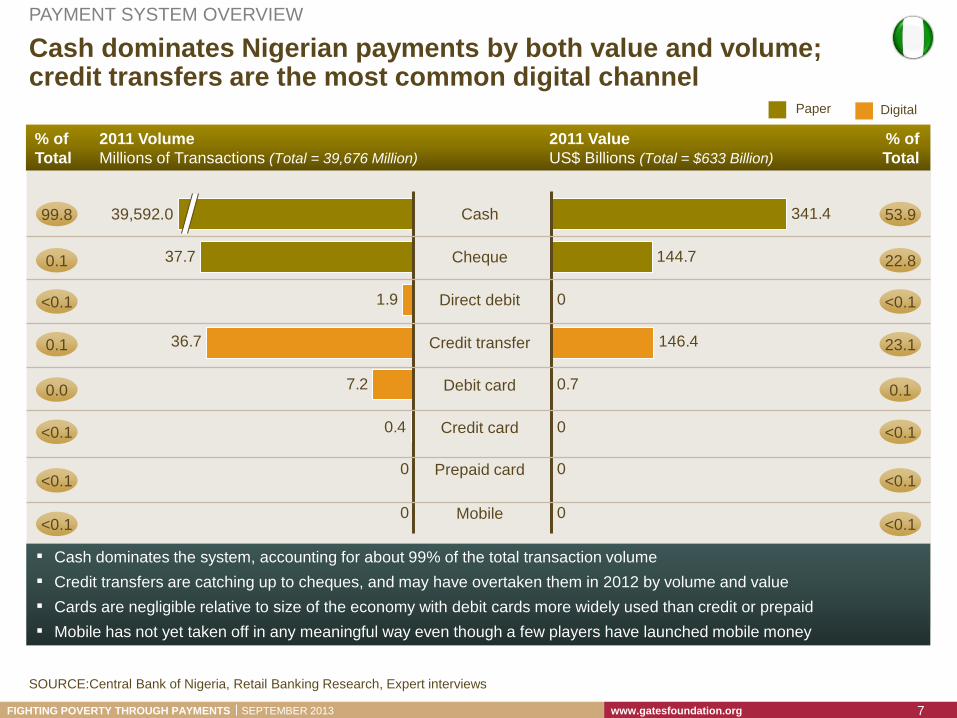
▪ Cash dominates the system, accounting for about 99% of the total transaction volume
▪ Credit transfers are catching up to cheques, and may have overtaken them in 2012 by volume and value
▪ Cards are negligible relative to size of the economy with debit cards more widely used than credit or prepaid
▪ Mobile has not yet taken off in any meaningful way even though a few players have launched mobile money
144.7
0
0
0
341.4
0
0.7
146.4
0.4
0
0
7.2
36.7
1.9
37.7
Mobile
Prepaid card
Credit card
Debit card
Credit transfer
Direct debit
Cheque
Cash 39,592.0
2011 Value
US$ Billions (Total = $633 Billion)
2011 Volume
Millions of Transactions (Total = 39,676 Million)
99.8
% of
Total
% of
Total
53.9
0.1 22.8
<0.1
0.1 23.1
0.0 0.1
<0.1
<0.1
<0.1
SOURCE:Central Bank of Nigeria, Retail Banking Research, Expert interviews
<0.1
<0.1
<0.1
<0.1
Paper Digital
Cash dominates Nigerian payments by both value and volume; credit transfers are the most common digital channel
PAYMENT SYSTEM OVERVIEW
FIGHTING POVERTY THROUGH PAYMENTS SEPTEMBER 2013 www.gatesfoundation.org 8
Area of
focus
Consumer
Business
Government
Consumer Business Government
To
Fro
m
Other financial
institution payments
Other trade
payments
C2C, C2B, B2C
1,394
761
315
318
49
78
31 35 5
191
1
214
29
SOURCE: CBN Annual Reports; RBR Research, National Bureau of Statistics, Press Search
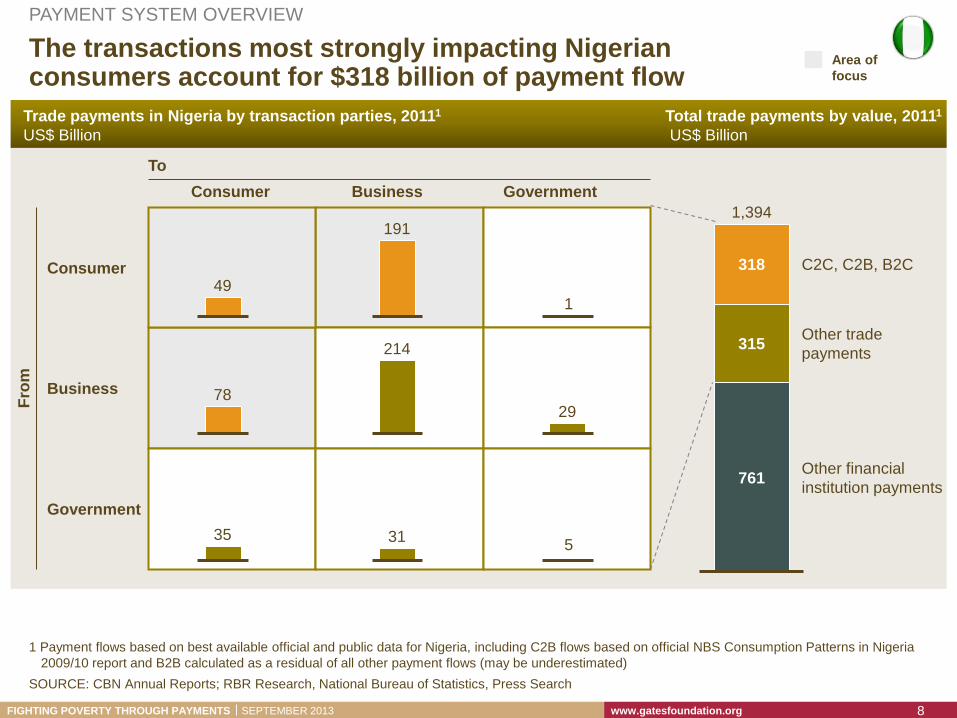
Trade payments in Nigeria by transaction parties, 20111
US$ Billion
Total trade payments by value, 20111
US$ Billion
The transactions most strongly impacting Nigerian consumers account for $318 billion of payment flow
1 Payment flows based on best available official and public data for Nigeria, including C2B flows based on official NBS Consumption Patterns in Nigeria
2009/10 report and B2B calculated as a residual of all other payment flows (may be underestimated)
PAYMENT SYSTEM OVERVIEW
FIGHTING POVERTY THROUGH PAYMENTS SEPTEMBER 2013 www.gatesfoundation.org 9
Major instruments used by
transaction type
B2C C2B C2C
Cash
Cheque
Direct debit
Credit transfer
Debit card
Credit card
Mobile
Consumer
Business1
Consumer Business
To
Fro
m
100% = 78
32%
32%
37%
100% = 49
0% 0%
99%
100% = 191
0%
0%
1% 10%
89%
ESTIMATES
SOURCE: National Bureau of Statistics, Expert interviews
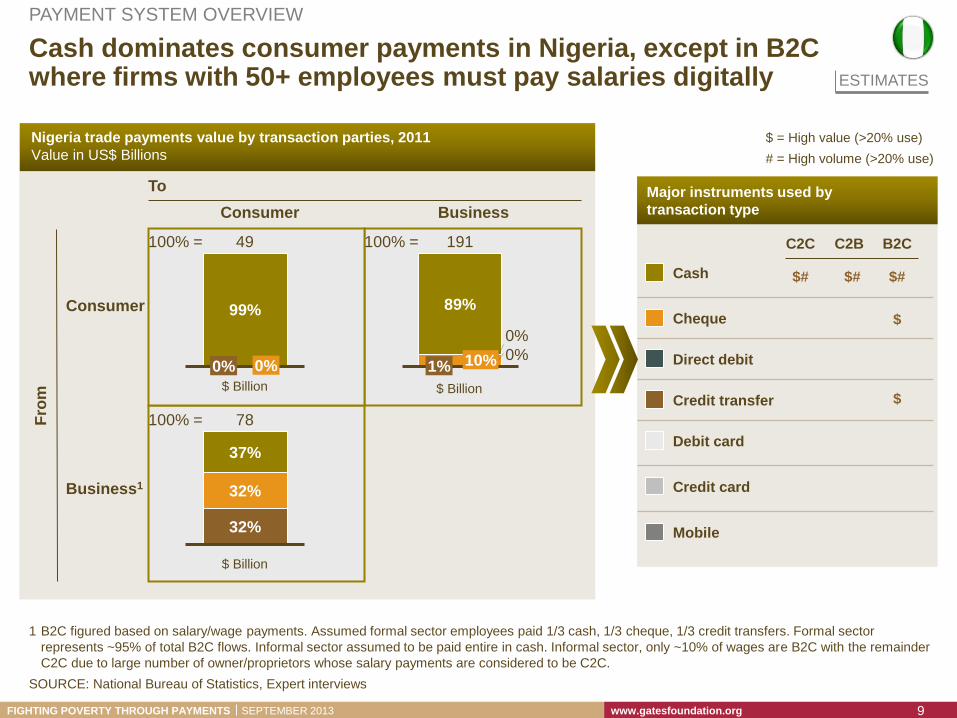
Nigeria trade payments value by transaction parties, 2011
Value in US$ Billions
$# $# $#
$
$ $ Billion
$ Billion
$ Billion
$ = High value (>20% use)
# = High volume (>20% use)
Cash dominates consumer payments in Nigeria, except in B2C where firms with 50+ employees must pay salaries digitally
1 B2C figured based on salary/wage payments. Assumed formal sector employees paid 1/3 cash, 1/3 cheque, 1/3 credit transfers. Formal sector
represents ~95% of total B2C flows. Informal sector assumed to be paid entire in cash. Informal sector, only ~10% of wages are B2C with the remainder
C2C due to large number of owner/proprietors whose salary payments are considered to be C2C.
PAYMENT SYSTEM OVERVIEW

FIGHTING POVERTY THROUGH PAYMENTS SEPTEMBER 2013 www.gatesfoundation.org 10
Financial inclusion in Nigeria
Key takeaways Overall financial inclusion performance: low
Percent with an account at a formal financial institution
Overall -- 30%
Top 60% -- 40%
Bottom 40% -- 14%
Women -- 23% have formal financial accounts
Payment services access – Bottom 40% (Top 60%):
Debit card access -- 7% (27%)
Credit card access -- less than1% (less than 1%)
Wages received in formal account -- 3% (18%)
Distribution access (per 100,000 people)
Bank branches -- 6.8
ATMs -- 11.8
POS terminals -- about 175
Mobile payment agents -- 0
Mobile access -- 55% of population
Additional comments:
Nigeria ranks 88th globally in access to an account at a
formal financial institution, but is above the average for
Sub-Saharan Africa (24%) and for low income countries
(24%).
About 24% of people report that they do not have a bank
account because banks are far away
The bank branch network remains very uneven
and does not reach large segments of the
population, especially in the north and rural areas
Banking remains generally expensive for the
majority of people, despite some product
innovation towards affordability (e.g. lower account
balances)
Some consumer segments perceive limited
relevance for traditional branch banking
products due to low or irregular income, high cost
of banking and intimidating bank processes
Financial literacy is a major concern as the less
educated find account opening, deposits and
withdrawals intimidating and stressful
Recent developments such as the CBN
Financial Inclusion Strategy may pave the way
for improving reach and relevance while decreasing
cost
SOURCE: EFInA Access to Financial Services in Nigeria 2010, Findex Global Database
FINANCIAL INCLUSION OVERVIEW
FIGHTING POVERTY THROUGH PAYMENTS SEPTEMBER 2013 www.gatesfoundation.org 11
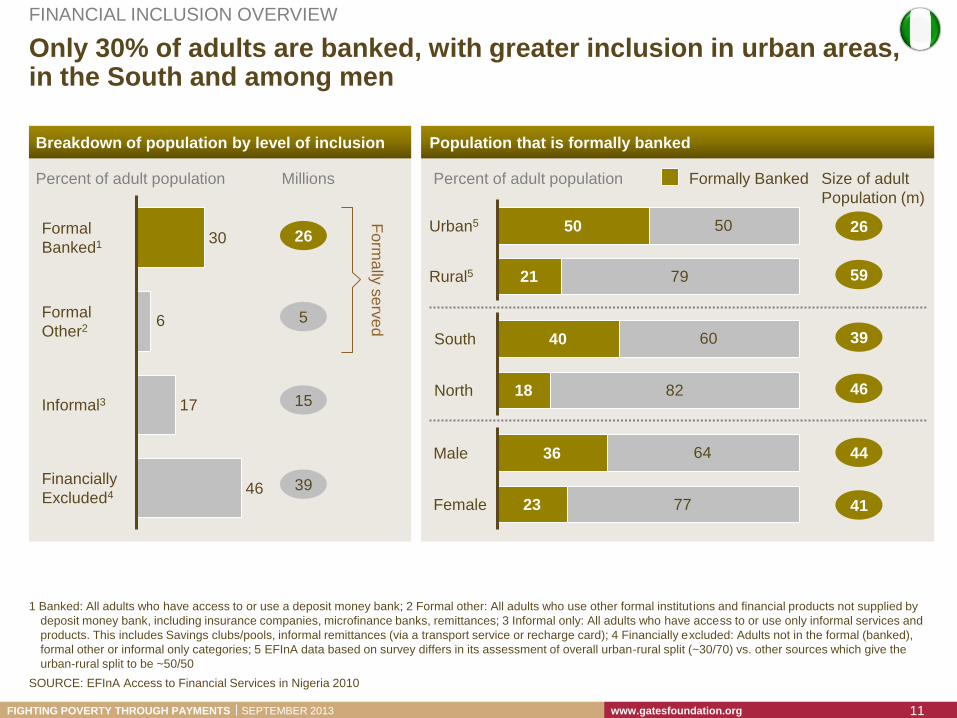
Only 30% of adults are banked, with greater inclusion in urban areas, in the South and among men
SOURCE: EFInA Access to Financial Services in Nigeria 2010
1 Banked: All adults who have access to or use a deposit money bank; 2 Formal other: All adults who use other formal institutions and financial products not supplied by
deposit money bank, including insurance companies, microfinance banks, remittances; 3 Informal only: All adults who have access to or use only informal services and
products. This includes Savings clubs/pools, informal remittances (via a transport service or recharge card); 4 Financially excluded: Adults not in the formal (banked),
formal other or informal only categories; 5 EFInA data based on survey differs in its assessment of overall urban-rural split (~30/70) vs. other sources which give the
urban-rural split to be ~50/50
FINANCIAL INCLUSION OVERVIEW
6
Financially
Excluded4 46
Informal3 17
Formal
Other2
Formal
Banked1 30
Percent of adult population
26
Millions
5
15
39
Form
ally
se
rve
d
50
79Rural5 21
Urban5 50 26
Size of adult
Population (m)
59
60
82North 18
South 40 39
46
64
77Female 23
Male 36 44
41
Percent of adult population
Breakdown of population by level of inclusion Population that is formally banked
Formally Banked
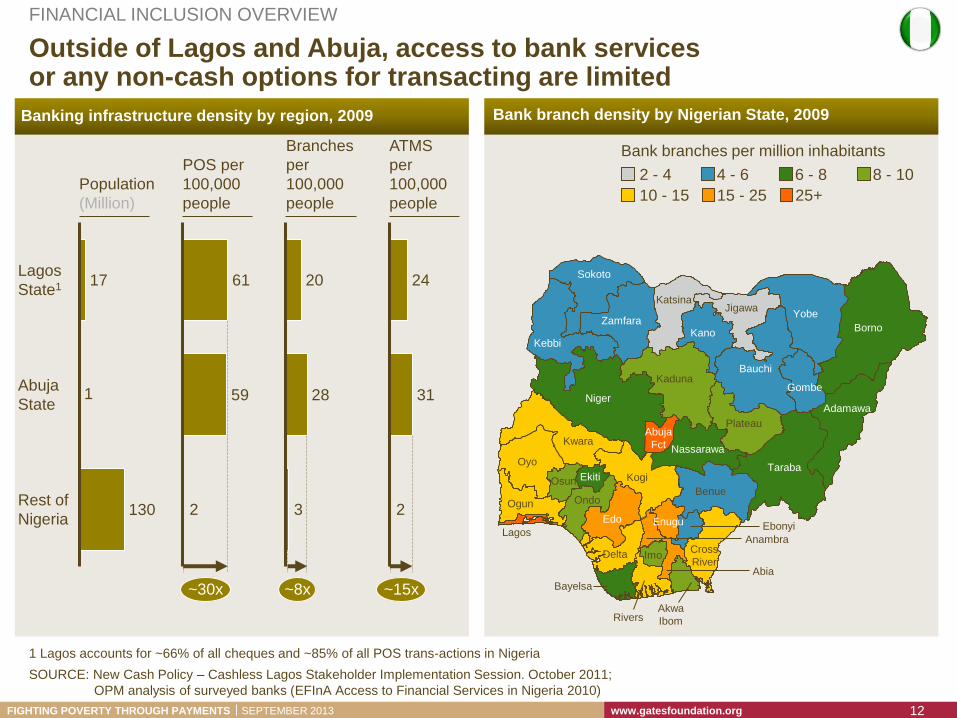
FIGHTING POVERTY THROUGH PAYMENTS SEPTEMBER 2013 www.gatesfoundation.org 12
Outside of Lagos and Abuja, access to bank services or any non-cash options for transacting are limited
SOURCE: New Cash Policy – Cashless Lagos Stakeholder Implementation Session. October 2011;
OPM analysis of surveyed banks (EFInA Access to Financial Services in Nigeria 2010)
1 Lagos accounts for ~66% of all cheques and ~85% of all POS trans-actions in Nigeria
1
Rest of
Nigeria 130
Abuja
State
Lagos
State1 17
2
~30x
59
61
3
~8x
28
20
2
~15x
24
31
Population
(Million)
POS per
100,000
people
Branches
per
100,000
people
ATMS
per
100,000
people
Bank branches per million inhabitants
8 - 10 2 - 4
10 - 15
4 - 6
15 - 25
6 - 8
25+
Lagos
Bayelsa
Rivers
Imo
Abia
Akwa
Ibom
Adamawa
Bauchi
Gombe Kaduna
Abuja
Fct Nassarawa
Plateau
Taraba
Benue
Cross
River
Enugu Ebonyi
Anambra
Delta
Edo
Kogi
Oyo
Ogun
Osun Ekiti
Ondo
Kwara
Niger
Sokoto
Kebbi
Zamfara
Katsina
Kano
Yobe Jigawa
Borno
Banking infrastructure density by region, 2009 Bank branch density by Nigerian State, 2009
FINANCIAL INCLUSION OVERVIEW

FIGHTING POVERTY THROUGH PAYMENTS SEPTEMBER 2013 www.gatesfoundation.org 13
ATM usage is growing rapidly with withdrawal sizes shrinking
6
4
3
0
1
2
3
4
5
6
7
8
9
10
11
Total value of all ATM transactions USD Billion
2011
101
2010 2009 2008
0
5
10
15
20
25
30
35
40
45
Average withdrawal value USD
CAGR
Percent
80
-12
SOURCE: Central Bank of Nigeria; NIBSS
1 3% of total cash transaction value in Nigeria (vs. ~10% in the Netherlands)
CICO
FIGHTING POVERTY THROUGH PAYMENTS SEPTEMBER 2013 www.gatesfoundation.org 14
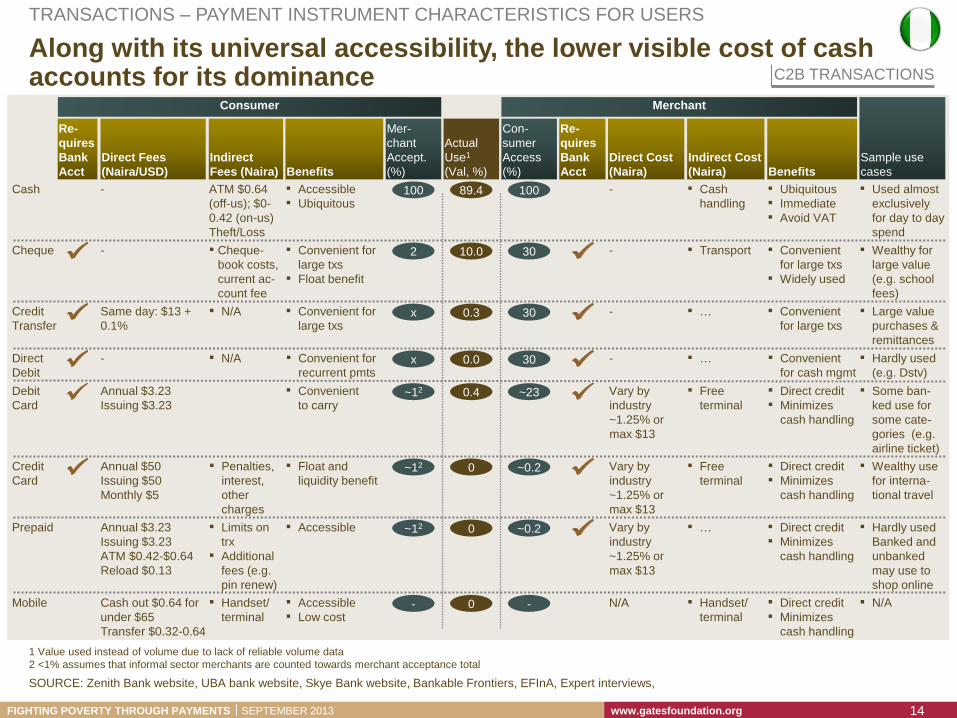
Along with its universal accessibility, the lower visible cost of cash accounts for its dominance C2B TRANSACTIONS
SOURCE: Zenith Bank website, UBA bank website, Skye Bank website, Bankable Frontiers, EFInA, Expert interviews,
1 Value used instead of volume due to lack of reliable volume data
2 <1% assumes that informal sector merchants are counted towards merchant acceptance total
TRANSACTIONS – PAYMENT INSTRUMENT CHARACTERISTICS FOR USERS
Merchant Consumer
Re-
quires
Bank
Acct
Direct Cost
(Naira) Benefits
Mer-
chant
Accept.
(%)
Actual
Use1
(Val, %)
Indirect
Fees (Naira)
Indirect Cost
(Naira)
Re-
quires
Bank
Acct
Direct Fees
(Naira/USD)
Con-
sumer
Access
(%) Benefits
Sample use
cases
Cash - ▪ Accessible
▪ Ubiquitous
ATM $0.64
(off-us); $0-
0.42 (on-us)
Theft/Loss
▪ Cash
handling 100 100 89.4 - ▪ Ubiquitous
▪ Immediate
▪ Avoid VAT
▪ Used almost
exclusively
for day to day
spend
Cheque - ▪ Convenient for
large txs
▪ Float benefit
▪ Cheque-
book costs,
current ac-
count fee
▪ Transport 30 2 10.0 - ▪ Convenient
for large txs
▪ Widely used
▪ Wealthy for
large value
(e.g. school
fees)
Credit
Transfer
- ▪ Convenient for
large txs
▪ N/A ▪ … 30 x 0.3 Same day: $13 +
0.1%
▪ Convenient
for large txs
▪ Large value
purchases &
remittances
Direct
Debit
- ▪ Convenient for
recurrent pmts
▪ N/A ▪ … 30 x 0.0 - ▪ Convenient
for cash mgmt
▪ Hardly used
(e.g. Dstv)
Debit
Card
Vary by
industry
~1.25% or
max $13
▪ Convenient
to carry
▪ Free
terminal ~23 ~12 0.4 Annual $3.23
Issuing $3.23
▪ Direct credit
▪ Minimizes
cash handling
▪ Some ban-
ked use for
some cate-
gories (e.g.
airline ticket)
Credit
Card
▪ Float and
liquidity benefit
▪ Penalties,
interest,
other
charges
▪ Free
terminal ~0.2 ~12 0 Vary by
industry
~1.25% or
max $13
Annual $50
Issuing $50
Monthly $5
▪ Direct credit
▪ Minimizes
cash handling
▪ Wealthy use
for interna-
tional travel
Prepaid ▪ Accessible ▪ Limits on
trx
▪ Additional
fees (e.g.
pin renew)
▪ … ~0.2 ~12 0 Vary by
industry
~1.25% or
max $13
Annual $3.23
Issuing $3.23
ATM $0.42-$0.64
Reload $0.13
▪ Direct credit
▪ Minimizes
cash handling
▪ Hardly used
Banked and
unbanked
may use to
shop online
Cash out $0.64 for
under $65
Transfer $0.32-0.64
Mobile N/A ▪ Accessible
▪ Low cost
▪ Handset/
terminal
▪ Handset/
terminal
▪ Direct credit
▪ Minimizes
cash handling
- - 0 ▪ N/A

FIGHTING POVERTY THROUGH PAYMENTS SEPTEMBER 2013 www.gatesfoundation.org 15
NIBSS serves as a platform for much of Nigeria’s payment infrastructure
SOURCE: NIBSS, Expert interviews
1 POS aggregation runs on top of existing NCS.
2 Mobile aggregation not yet implemented but regulatory mandate has been issued that all mobile money transactions will route through NIBSS
TRANSACTIONS – HOW THE SYSTEM WORKS
Nigerian Interbank Settlement System (NIBSS) Background and Processing Infrastructure Platforms
Platform
Products/
Services
NIBSS
National Automated
Clearing System (NACS)
National Central Switch (NCS)
POS
Aggregation1
Instant
Payments
Mobile
Aggregation2
ACH Electronic Transfers
1
2
▪ NIBSS was established in 1994 under mandate to make
payments more efficient in Nigeria and to develop an
integrated nationwide network for electronic transfers
and settlements. NIBSS is owned by the CBN and the
banks.
▪ NACS, established in 2002, was the first ACH in Nigeria.
It is used for cheque, direct debit and credit transfers.
Transfers run under the Nigeria Electronic Funds
Transfer (NEFT) platform
▪ The National Central Switch (NCS) was implemented in
2010 and serves as a platform for multiple products and
services.
– The main purpose of NCS was to provide
interconnectivity and interoperability for card
payment schemes which it achieved via POS
aggregation
– NCS also offers NIBSS Instant Payments, a faster
and more efficient method of funds transfer than
NEFT
– The NSC will also serve as an aggregator for mobile
money schemes
1
2
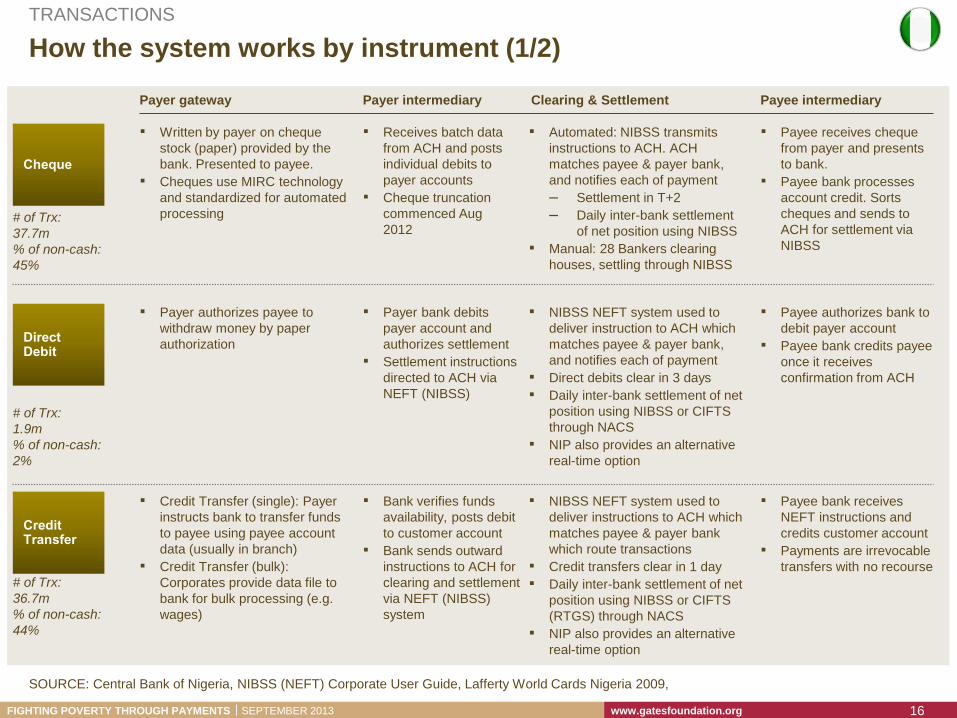
FIGHTING POVERTY THROUGH PAYMENTS SEPTEMBER 2013 www.gatesfoundation.org 16
How the system works by instrument (1/2)
▪ Written by payer on cheque
stock (paper) provided by the
bank. Presented to payee.
▪ Cheques use MIRC technology
and standardized for automated
processing
▪ Receives batch data
from ACH and posts
individual debits to
payer accounts
▪ Cheque truncation
commenced Aug
2012
▪ Automated: NIBSS transmits
instructions to ACH. ACH
matches payee & payer bank,
and notifies each of payment
– Settlement in T+2
– Daily inter-bank settlement
of net position using NIBSS
▪ Manual: 28 Bankers clearing
houses, settling through NIBSS
▪ Payee receives cheque
from payer and presents
to bank.
▪ Payee bank processes
account credit. Sorts
cheques and sends to
ACH for settlement via
NIBSS
▪ Payer authorizes payee to
withdraw money by paper
authorization
▪ Payer bank debits
payer account and
authorizes settlement
▪ Settlement instructions
directed to ACH via
NEFT (NIBSS)
▪ NIBSS NEFT system used to
deliver instruction to ACH which
matches payee & payer bank,
and notifies each of payment
▪ Direct debits clear in 3 days
▪ Daily inter-bank settlement of net
position using NIBSS or CIFTS
through NACS
▪ NIP also provides an alternative
real-time option
▪ Payee authorizes bank to
debit payer account
▪ Payee bank credits payee
once it receives
confirmation from ACH
▪ Credit Transfer (single): Payer
instructs bank to transfer funds
to payee using payee account
data (usually in branch)
▪ Credit Transfer (bulk):
Corporates provide data file to
bank for bulk processing (e.g.
wages)
▪ Bank verifies funds
availability, posts debit
to customer account
▪ Bank sends outward
instructions to ACH for
clearing and settlement
via NEFT (NIBSS)
system
▪ NIBSS NEFT system used to
deliver instructions to ACH which
matches payee & payer bank
which route transactions
▪ Credit transfers clear in 1 day
▪ Daily inter-bank settlement of net
position using NIBSS or CIFTS
(RTGS) through NACS
▪ NIP also provides an alternative
real-time option
▪ Payee bank receives
NEFT instructions and
credits customer account
▪ Payments are irrevocable
transfers with no recourse
Payer intermediary Clearing & Settlement Payer gateway Payee intermediary
# of Trx:
37.7m
% of non-cash:
45%
# of Trx:
1.9m
% of non-cash:
2%
# of Trx:
36.7m
% of non-cash:
44%
SOURCE: Central Bank of Nigeria, NIBSS (NEFT) Corporate User Guide, Lafferty World Cards Nigeria 2009,
TRANSACTIONS

FIGHTING POVERTY THROUGH PAYMENTS SEPTEMBER 2013 www.gatesfoundation.org 17
How the system works by instrument (2/2)
Payer intermediary Clearing & Settlement Payer gateway
▪ Payer presents card or details
through POS, internet or mobile
channel
▪ POS Infrastructure: increased
from ~12,000 in 2010 to
~150,000 in 2012
▪ Card Brands: Visa, MasterCard
and Verve (Interswitch) branded
cards offered by major banks.
▪ Debit cards: Issued to all with
bank account. Mainly used for
ATM transactions. New cards are
EMV compliant with chip and pin
since 2010
▪ Credit cards: Single or dual
currency cards. Some cards still
require collateral of up to 125%
of limit. Limited local use of credit
cards
▪ Prepaid cards: Offered by some
banks (e.g. UBA). Negates need
for formal bank account.
Prefunded and reloadable.
Usable at ATM, Web, POS
▪ Issuer processer (e.g.
Interswitch) authenticates
and notifies payer bank
▪ Payer bank authorizes
payment and posts debit to
payer account
▪ ATM network: bank owned
and Independent ATM
Deployers (IAD)
▪ All transactions first routed to
National Central Switch at
NIBSS before routing to local
card networks.
▪ Local card networks
(Interswitch and Unified
Payments) request and notify
payee bank, perform
authorization and settlement
▪ Payer bank settles payee
bank on a net basis after 1
day via accounts at NIBSS or
CBN
▪ Card networks: Interswitch
and Unified Payments provide
issuing and acquiring
processing. All issuing banks
connected to Interswitch,
Unified Payments or both.
Card networks or PTSPs
deploy and manage POS
systems (hardware &
software)
▪ Payee swipes card at
POS device or receives
details
▪ POS device or internet
gateway forwards details
to NIBSS and then from
NIBSS to card network for
processing
▪ Merchant Acquiring:
Banks are the main
merchant acquirers with
the top 4 banks
accounting for ~85-90%
▪ Consumer initiates transaction
on mobile phone via USSD
channel or via Java app
▪ Difference between mobile
banking applications and new
mobile money apps not linked to
bank account
▪ MMO to authenticate and
authorize payment
▪ “On-us” MM transactions
cleared and settled
▪ “Off-us” MM transactions
to be routed via NIBSS
▪ Inter-MM or inter-bank MM
transactions to be routed
through NIBSS
▪ Payee issues
confirmation or sends
verification that
transaction has been
accepted
Payee intermediary
# of Trx:
7.2m
% of non-
cash: 9%
# of Trx:
0.4m
% of non-
cash: 0%
# of Trx: n.a
# of Trx: n.a
SOURCE: Central Bank of Nigeria, NIBSS (NEFT) Corporate User Guide, Lafferty World Cards Nigeria 2009,
Further details follow
TRANSACTIONS

FIGHTING POVERTY THROUGH PAYMENTS SEPTEMBER 2013 www.gatesfoundation.org 18
How clearing and settlement works by instrument
Large Value
Transfer System
Cheque
Prepaid
Credit card
Automated Clearing
House
Card Payment
Network
Public1 Private Public1 Private Public Private
Network CIFTS
NIP3
NACS2;
NEFT2
N/A Local card switches6
N/A
Time to settle
Net/Gross
Instant
Gross Net
1 day
Net
Netw
ork
Desig
n
Cle
ari
ng
& S
ett
lem
en
t b
y in
str
um
en
t4
1-3 day
Net
Credit Transfer
Debit card
Mobile
Direct debit
C
C S
Comments
S
C S
C S
Public
infrastructure
Clearing
Settlement
C
S
C S
C S
▪ Automated clearing centers in Abuja and Lagos account for bulk of volume
▪ 28 manual clearing houses remain in other states
▪ NIBSS Instant Payment (NIP) used by both consumers and banks for some net settlement
▪ NIP payee gets instant value but settlement takes 1 day which present risk to payor bank
▪ CIFTS used for market side securities settlements and some net settlement between banks
▪ Private switches (e.g. Interswitch, Unified
Payments, eTranzact) all have to route via NIBSS
for final settlement
▪ ATM transactions using Interswitch
▪ International transactions routed via Visa and
Mastercard internationally
▪ Off-us inter-scheme mobile money transfers to
route through NIBSS
SOURCE: Central Bank of Nigeria, NIBSS, Citi Bank Nigeria
1 NIBSS is semi-public as it is owned by both the Central Bank and the banks. CIFTS is the only RTGS system exclusively owned by the Central Bank; 2 The Nigeria
Automated Clearing System (NACS) used for cheques, NEFT system used for credit transfers and direct debits. Both fall under NIBSS umbrella; 3 NIBSS Instant
Payment (NIP) used by both consumers and banks in lieu of CIFTS for both small and large value transfers; 4 Final net settlement by banks done through settlement
accounts at the CBN or at NIBSS; 5 Quasi-public since the CBN has an ownership share and chairs the Board; 6 Valucard,Interswitch,CTL,eTranzact,3Line
Further details follow
TRANSACTIONS – CLEARING AND SETTLEMENT
C S
C S

FIGHTING POVERTY THROUGH PAYMENTS SEPTEMBER 2013 www.gatesfoundation.org 19
Card information flow – NIBSS requires all card transactions to route via its central switch, imposing interoperability and aggregating data
SOURCE: NIBSS, Expert interviews
TRANSACTIONS – CARD
Card Networks
Merchant
Acquirers
Local Switches &
3rd Party
Processors
Verve
MasterCard
Visa
Acquiring
Banks
ValuCard
Interswitch
ValuCard
CTL2
Issu
ing B
an
ks
Verve
MasterCard
Visa
Acquiring
Banks
Interswitch
Unified
Payments1 N
IBS
S
CTL2
Before
NIBSS
After
NIBSS
Issu
ing B
an
ks
Have multiple
POS
terminals, one
for each
scheme
Have a single
POS terminal
accepting all
cards
Merchants
2 1
Effectively imposed interoperability among card schemes,
eliminating the need for multiple POS terminals
Note: Many merchants still have multiple terminals for
different telcos to ensure a working connection at any time
Introduced an additional
step in the flow of a
transaction that serves as
a data aggregation point
Simplified schematic – Flow of information when a consumer swipes a card at a merchant
1 Unified Payments (formerly ValueCard, also a 3rd party provider), PayMaster, CITISERVE, E-Top, Itex; 2 Valucard,Interswitch,CTL,eTranzact,3Line
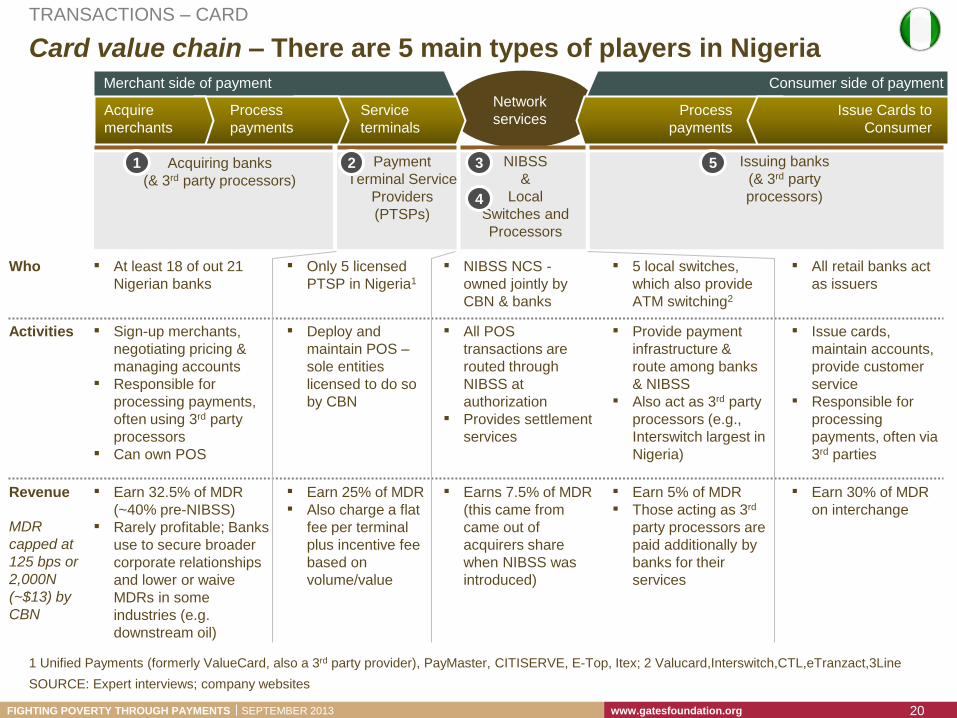
FIGHTING POVERTY THROUGH PAYMENTS SEPTEMBER 2013 www.gatesfoundation.org 20
Card value chain – There are 5 main types of players in Nigeria
SOURCE: Expert interviews; company websites
1 Unified Payments (formerly ValueCard, also a 3rd party provider), PayMaster, CITISERVE, E-Top, Itex; 2 Valucard,Interswitch,CTL,eTranzact,3Line
TRANSACTIONS – CARD
Acquiring banks
(& 3rd party processors)
Payment
Terminal Service
Providers
(PTSPs)
NIBSS
&
Local
Switches and
Processors
Issuing banks
(& 3rd party
processors)
Network
services
Merchant side of payment
Acquire
merchants
Process
payments
Service
terminals
Consumer side of payment
Issue Cards to
Consumer
Process
payments
Who ▪ At least 18 of out 21
Nigerian banks
▪ Only 5 licensed
PTSP in Nigeria1
▪ NIBSS NCS -
owned jointly by
CBN & banks
▪ 5 local switches,
which also provide
ATM switching2
▪ All retail banks act
as issuers
Activities ▪ Sign-up merchants,
negotiating pricing &
managing accounts
▪ Responsible for
processing payments,
often using 3rd party
processors
▪ Can own POS
▪ Deploy and
maintain POS –
sole entities
licensed to do so
by CBN
▪ All POS
transactions are
routed through
NIBSS at
authorization
▪ Provides settlement
services
▪ Provide payment
infrastructure &
route among banks
& NIBSS
▪ Also act as 3rd party
processors (e.g.,
Interswitch largest in
Nigeria)
▪ Issue cards,
maintain accounts,
provide customer
service
▪ Responsible for
processing
payments, often via
3rd parties
▪ Earn 32.5% of MDR
(~40% pre-NIBSS)
▪ Rarely profitable; Banks
use to secure broader
corporate relationships
and lower or waive
MDRs in some
industries (e.g.
downstream oil)
Revenue ▪ Earn 25% of MDR
▪ Also charge a flat
fee per terminal
plus incentive fee
based on
volume/value
▪ Earns 7.5% of MDR
(this came from
came out of
acquirers share
when NIBSS was
introduced)
▪ Earn 5% of MDR
▪ Those acting as 3rd
party processors are
paid additionally by
banks for their
services
▪ Earn 30% of MDR
on interchange MDR
capped at
125 bps or
2,000N
(~$13) by
CBN
1 2 3
4
5
FIGHTING POVERTY THROUGH PAYMENTS SEPTEMBER 2013 www.gatesfoundation.org 21
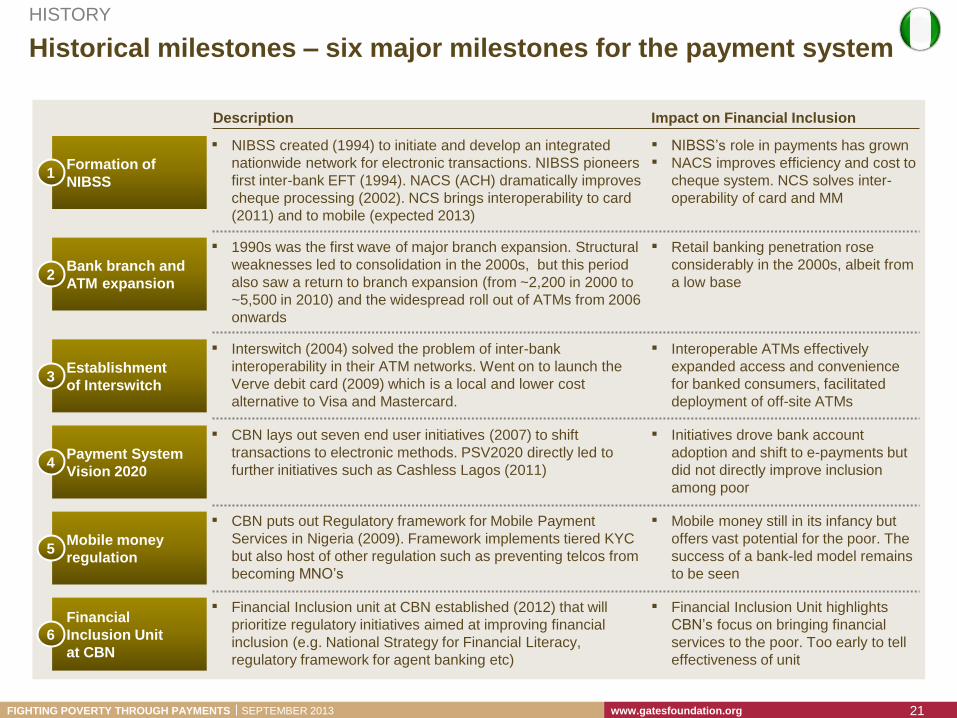
Historical milestones – six major milestones for the payment system
HISTORY
Description Impact on Financial Inclusion
Financial
Inclusion Unit
at CBN
6
▪ Financial Inclusion unit at CBN established (2012) that will
prioritize regulatory initiatives aimed at improving financial
inclusion (e.g. National Strategy for Financial Literacy,
regulatory framework for agent banking etc)
▪ Financial Inclusion Unit highlights
CBN’s focus on bringing financial
services to the poor. Too early to tell
effectiveness of unit
Mobile money
regulation 5
▪ CBN puts out Regulatory framework for Mobile Payment
Services in Nigeria (2009). Framework implements tiered KYC
but also host of other regulation such as preventing telcos from
becoming MNO’s
▪ Mobile money still in its infancy but
offers vast potential for the poor. The
success of a bank-led model remains
to be seen
Bank branch and
ATM expansion 2
▪ 1990s was the first wave of major branch expansion. Structural
weaknesses led to consolidation in the 2000s, but this period
also saw a return to branch expansion (from ~2,200 in 2000 to
~5,500 in 2010) and the widespread roll out of ATMs from 2006
onwards
▪ Retail banking penetration rose
considerably in the 2000s, albeit from
a low base
Establishment
of Interswitch 3
▪ Interswitch (2004) solved the problem of inter-bank
interoperability in their ATM networks. Went on to launch the
Verve debit card (2009) which is a local and lower cost
alternative to Visa and Mastercard.
▪ Interoperable ATMs effectively
expanded access and convenience
for banked consumers, facilitated
deployment of off-site ATMs
Payment System
Vision 2020 4
▪ CBN lays out seven end user initiatives (2007) to shift
transactions to electronic methods. PSV2020 directly led to
further initiatives such as Cashless Lagos (2011)
▪ Initiatives drove bank account
adoption and shift to e-payments but
did not directly improve inclusion
among poor
Formation of
NIBSS 1
▪ NIBSS created (1994) to initiate and develop an integrated
nationwide network for electronic transactions. NIBSS pioneers
first inter-bank EFT (1994). NACS (ACH) dramatically improves
cheque processing (2002). NCS brings interoperability to card
(2011) and to mobile (expected 2013)
▪ NIBSS’s role in payments has grown
▪ NACS improves efficiency and cost to
cheque system. NCS solves inter-
operability of card and MM
FIGHTING POVERTY THROUGH PAYMENTS SEPTEMBER 2013 www.gatesfoundation.org 22
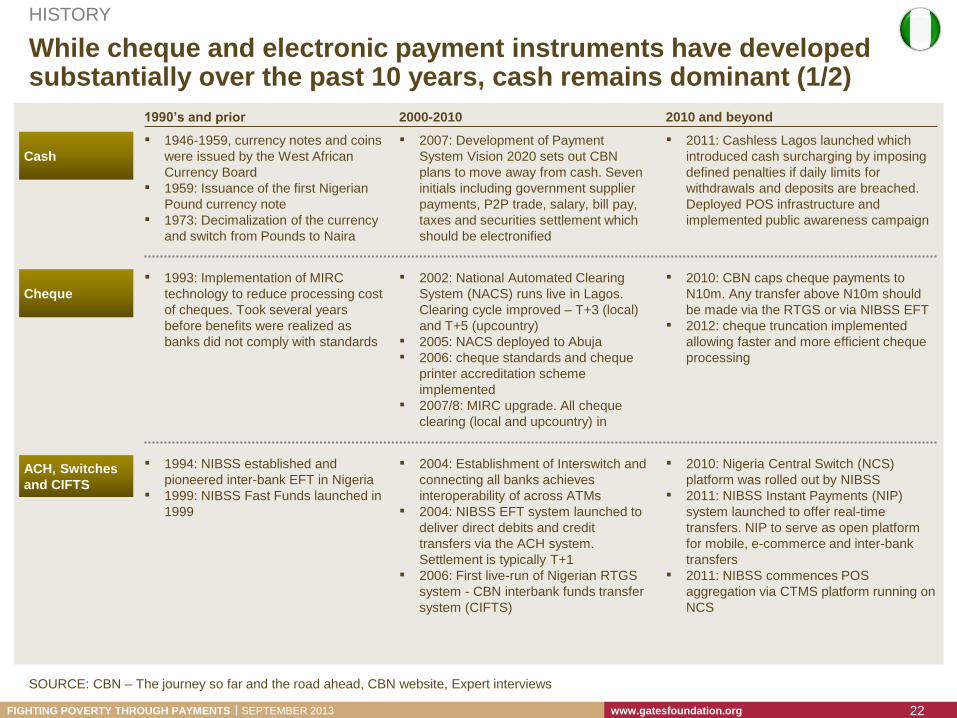
While cheque and electronic payment instruments have developed substantially over the past 10 years, cash remains dominant (1/2)
1990’s and prior 2010 and beyond 2000-2010
Cash
▪ 1946-1959, currency notes and coins
were issued by the West African
Currency Board
▪ 1959: Issuance of the first Nigerian
Pound currency note
▪ 1973: Decimalization of the currency
and switch from Pounds to Naira
▪ 2011: Cashless Lagos launched which
introduced cash surcharging by imposing
defined penalties if daily limits for
withdrawals and deposits are breached.
Deployed POS infrastructure and
implemented public awareness campaign
▪ 2007: Development of Payment
System Vision 2020 sets out CBN
plans to move away from cash. Seven
initials including government supplier
payments, P2P trade, salary, bill pay,
taxes and securities settlement which
should be electronified
Cheque
▪ 1993: Implementation of MIRC
technology to reduce processing cost
of cheques. Took several years
before benefits were realized as
banks did not comply with standards
▪ 2010: CBN caps cheque payments to
N10m. Any transfer above N10m should
be made via the RTGS or via NIBSS EFT
▪ 2012: cheque truncation implemented
allowing faster and more efficient cheque
processing
▪ 2002: National Automated Clearing
System (NACS) runs live in Lagos.
Clearing cycle improved – T+3 (local)
and T+5 (upcountry)
▪ 2005: NACS deployed to Abuja
▪ 2006: cheque standards and cheque
printer accreditation scheme
implemented
▪ 2007/8: MIRC upgrade. All cheque
clearing (local and upcountry) in
ACH, Switches
and CIFTS
▪ 1994: NIBSS established and
pioneered inter-bank EFT in Nigeria
▪ 1999: NIBSS Fast Funds launched in
1999
▪ 2010: Nigeria Central Switch (NCS)
platform was rolled out by NIBSS
▪ 2011: NIBSS Instant Payments (NIP)
system launched to offer real-time
transfers. NIP to serve as open platform
for mobile, e-commerce and inter-bank
transfers
▪ 2011: NIBSS commences POS
aggregation via CTMS platform running on
NCS
▪ 2004: Establishment of Interswitch and
connecting all banks achieves
interoperability of across ATMs
▪ 2004: NIBSS EFT system launched to
deliver direct debits and credit
transfers via the ACH system.
Settlement is typically T+1
▪ 2006: First live-run of Nigerian RTGS
system - CBN interbank funds transfer
system (CIFTS)
SOURCE: CBN – The journey so far and the road ahead, CBN website, Expert interviews
HISTORY

FIGHTING POVERTY THROUGH PAYMENTS SEPTEMBER 2013 www.gatesfoundation.org 23
1990’s and prior 2010 and beyond 2000-2010
While cheque and electronic payment instruments have developed substantially over the past 10 years, cash remains dominant (2/2)
General history
(non-instrument
specific)
▪ 1959: CBN is established
▪ 1961: First clearing house opens in
Lagos
▪ 1990s: Period of significant bank
branch expansion
▪ 2012: CBN develops Financial Inclusion
Strategy and appoints Financial Inclusion
Unit
▪ 2013: New National Identity Number to be
basis for new KYC verification
▪ 2003: Guidelines issued for e-banking
▪ 2003-2007: Consolidation of the
banking sector from 89 to 24 banks
▪ 2009: Nigerian Banking Sector Crisis.
Down to 20 banks and regulatory
overhaul
Mobile
▪ 2012+: CBN close to issuing agent
banking guidelines
▪ 2009: CBN puts out Regulatory
framework for Mobile Payment
Services in Nigeria. CBN stipulates
that telco’s cannot be MMOs. Mobile
regulations establish tiered KYC
SOURCE: CBN – The journey so far and the road ahead, CBN website, Expert interviews
HISTORY
Cards
▪ 2010: Switch to EMV standard on all
cards. Market set back from ~34m in 2006
to ~20m cards in 2012
▪ 2011: All POS transactions are routed via
NIBSS achieving interoperability of
terminals
▪ 2012: CBN “encourages” POS expansion.
POS increase from ~12,000 to ~150,000
▪ 2000: First local card issued
▪ 2003: Mastercard enters Nigeria even
though first card issued only in 2005
▪ 2009: The Central Bank granted
license for first credit bureau potentially
allowing banks to do better credit
underwriting in the future
FIGHTING POVERTY THROUGH PAYMENTS SEPTEMBER 2013 www.gatesfoundation.org 24
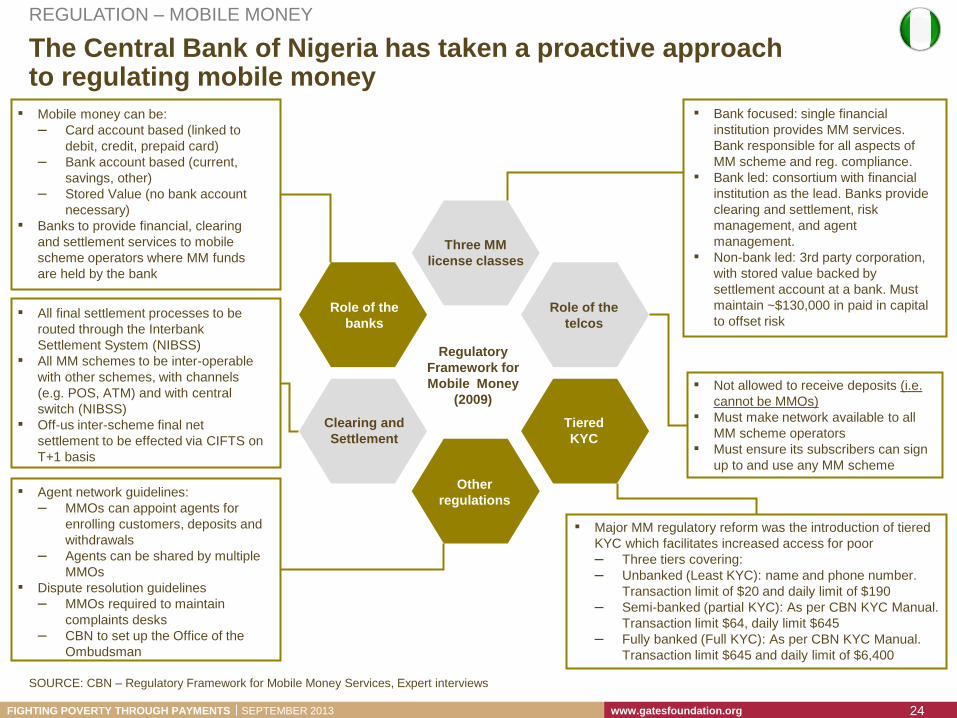
The Central Bank of Nigeria has taken a proactive approach to regulating mobile money
SOURCE: CBN – Regulatory Framework for Mobile Money Services, Expert interviews
REGULATION – MOBILE MONEY
Regulatory
Framework for
Mobile Money
(2009)
Three MM
license classes
Role of the
banks
Clearing and
Settlement
Role of the
telcos
Tiered
KYC
Other
regulations
▪ All final settlement processes to be
routed through the Interbank
Settlement System (NIBSS)
▪ All MM schemes to be inter-operable
with other schemes, with channels
(e.g. POS, ATM) and with central
switch (NIBSS)
▪ Off-us inter-scheme final net
settlement to be effected via CIFTS on
T+1 basis
▪ Mobile money can be:
– Card account based (linked to
debit, credit, prepaid card)
– Bank account based (current,
savings, other)
– Stored Value (no bank account
necessary)
▪ Banks to provide financial, clearing
and settlement services to mobile
scheme operators where MM funds
are held by the bank
▪ Agent network guidelines:
– MMOs can appoint agents for
enrolling customers, deposits and
withdrawals
– Agents can be shared by multiple
MMOs
▪ Dispute resolution guidelines
– MMOs required to maintain
complaints desks
– CBN to set up the Office of the
Ombudsman
▪ Bank focused: single financial
institution provides MM services.
Bank responsible for all aspects of
MM scheme and reg. compliance.
▪ Bank led: consortium with financial
institution as the lead. Banks provide
clearing and settlement, risk
management, and agent
management.
▪ Non-bank led: 3rd party corporation,
with stored value backed by
settlement account at a bank. Must
maintain ~$130,000 in paid in capital
to offset risk
▪ Not allowed to receive deposits (i.e.
cannot be MMOs)
▪ Must make network available to all
MM scheme operators
▪ Must ensure its subscribers can sign
up to and use any MM scheme
▪ Major MM regulatory reform was the introduction of tiered
KYC which facilitates increased access for poor
– Three tiers covering:
– Unbanked (Least KYC): name and phone number.
Transaction limit of $20 and daily limit of $190
– Semi-banked (partial KYC): As per CBN KYC Manual.
Transaction limit $64, daily limit $645
– Fully banked (Full KYC): As per CBN KYC Manual.
Transaction limit $645 and daily limit of $6,400
FIGHTING POVERTY THROUGH PAYMENTS SEPTEMBER 2013 www.gatesfoundation.org 25
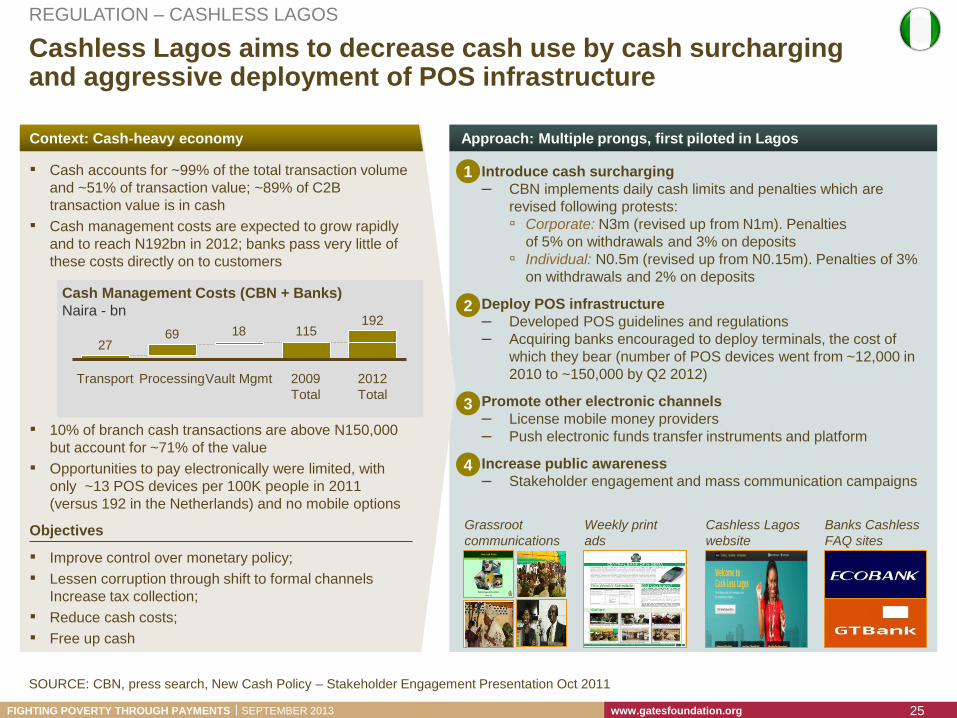
Cashless Lagos aims to decrease cash use by cash surcharging and aggressive deployment of POS infrastructure
▪ Cash accounts for ~99% of the total transaction volume
and ~51% of transaction value; ~89% of C2B
transaction value is in cash
▪ Cash management costs are expected to grow rapidly
and to reach N192bn in 2012; banks pass very little of
these costs directly on to customers
▪ 10% of branch cash transactions are above N150,000
but account for ~71% of the value
▪ Opportunities to pay electronically were limited, with
only ~13 POS devices per 100K people in 2011
(versus 192 in the Netherlands) and no mobile options
Objectives
▪ Improve control over monetary policy;
▪ Lessen corruption through shift to formal channels
Increase tax collection;
▪ Reduce cash costs;
▪ Free up cash
Cash Management Costs (CBN + Banks)
Naira - bn
▪ Introduce cash surcharging
– CBN implements daily cash limits and penalties which are
revised following protests:
▫ Corporate: N3m (revised up from N1m). Penalties
of 5% on withdrawals and 3% on deposits
▫ Individual: N0.5m (revised up from N0.15m). Penalties of 3%
on withdrawals and 2% on deposits
▪ Deploy POS infrastructure
– Developed POS guidelines and regulations
– Acquiring banks encouraged to deploy terminals, the cost of
which they bear (number of POS devices went from ~12,000 in
2010 to ~150,000 by Q2 2012)
▪ Promote other electronic channels
– License mobile money providers
– Push electronic funds transfer instruments and platform
▪ Increase public awareness
– Stakeholder engagement and mass communication campaigns
Grassroot
communications
Weekly print
ads
Cashless Lagos
website
Banks Cashless
FAQ sites
1
2
3
4
115186927
2012
Total
192
2009
Total
Vault Mgmt Processing Transport
SOURCE: CBN, press search, New Cash Policy – Stakeholder Engagement Presentation Oct 2011
REGULATION – CASHLESS LAGOS
Context: Cash-heavy economy Approach: Multiple prongs, first piloted in Lagos
FIGHTING POVERTY THROUGH PAYMENTS SEPTEMBER 2013 www.gatesfoundation.org 26
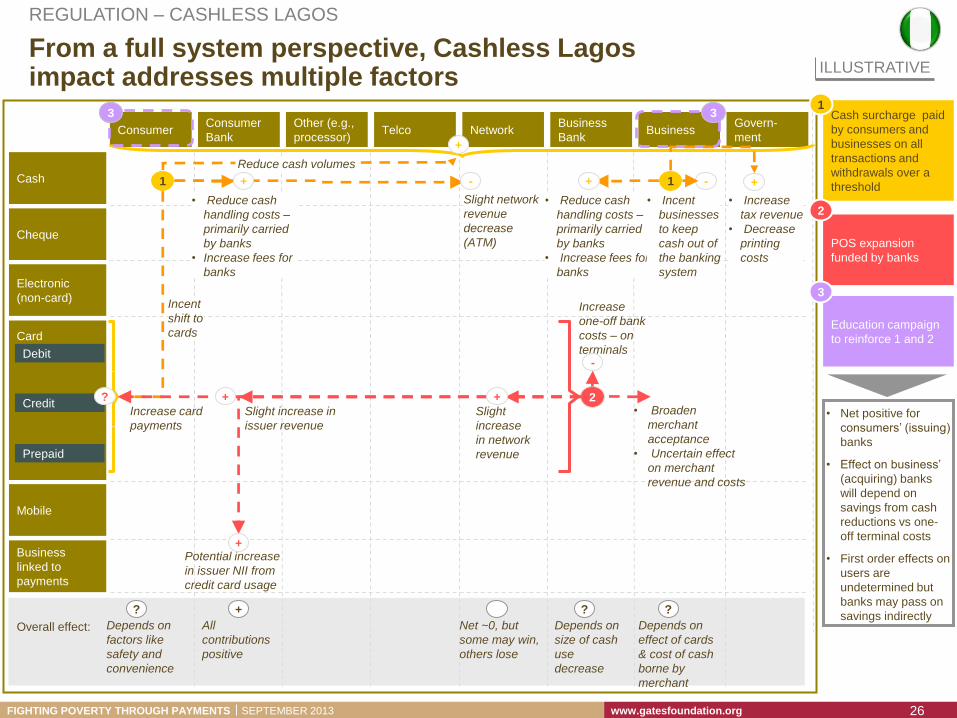
From a full system perspective, Cashless Lagos impact addresses multiple factors
Cash surcharge paid
by consumers and
businesses on all
transactions and
withdrawals over a
threshold 1
Consumer
Cheque
Electronic
(non-card)
Card
Debit
Cash
Consumer
Bank Telco Network
Mobile
Business Other (e.g.,
processor)
Business
linked to
payments
Govern-
ment
Business
Bank
Credit
Prepaid
Incent
shift to
cards
• Reduce cash
handling costs –
primarily carried
by banks
• Increase fees for
banks
Reduce cash volumes
• Broaden
merchant
acceptance
• Uncertain effect
on merchant
revenue and costs
2 Slight
increase
in network
revenue
Slight increase in
issuer revenue
Increase card
payments
Increase
one-off bank
costs – on
terminals
1
Potential increase
in issuer NII from
credit card usage
Slight network
revenue
decreas
e (ATM) Slight network
revenue
decrease
(ATM)
+
+ -
+ +
+
-
• Reduce cash
handling costs –
primarily carried
by banks
• Increase fees for
banks
Overall effect:
+
Depends on
size of cash
use
decrease
Net ~0, but
some may win,
others lose
?
Depends on
effect of cards
& cost of cash
borne by
merchant
?
Depends on
factors like
safety and
convenience
?
?
POS expansion
funded by banks
2
Education campaign
to reinforce 1 and 2
3
• Net positive for
consumers’ (issuing)
banks
• Effect on business’
(acquiring) banks
will depend on
savings from cash
reductions vs one-
off terminal costs
• First order effects on
users are
undetermined but
banks may pass on
savings indirectly All
contributions
positive
1 +
• Incent
businesses
to keep
cash out of
the banking
system
-
3 3
+
• Increase
tax revenue
• Decrease
printing
costs
ILLUSTRATIVE
REGULATION – CASHLESS LAGOS
Slide updated