fighting identity theft: big data analytics to the rescue
TRANSCRIPT

Fighting Identity Theft
Big Data Analytics to the Rescue
Seshika FernandoWSO2

Quantified● $2.5m per Enterprise
● #1 Consumer Complaint
● Every 2 seconds
● 51% Enterprises use Big Data Analytics
Sources: Javelin Strategy & Research, PwC 2016 GSISS, FTC 2015 Report
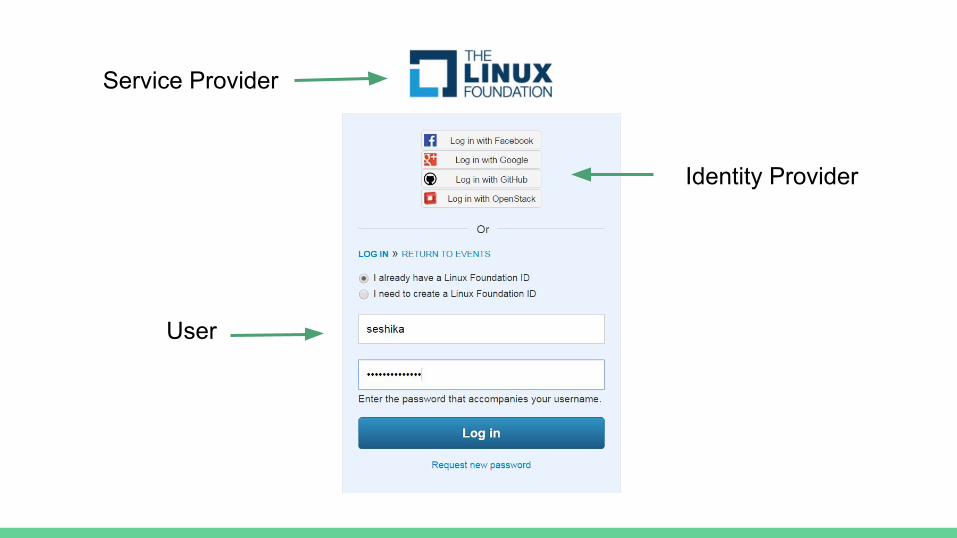
Service Provider
Identity Provider
User

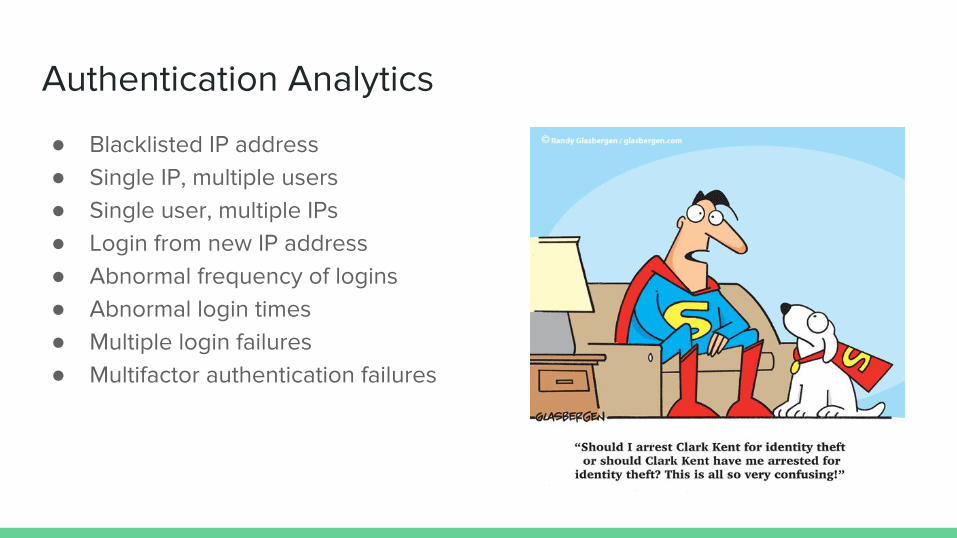
Authentication Analytics
● Blacklisted IP address● Single IP, multiple users● Single user, multiple IPs● Login from new IP address● Abnormal frequency of logins● Abnormal login times● Multiple login failures● Multifactor authentication failures

● User/Role accessing a new resource● Abnormal resource access frequency● Access denied for multiple resources, for the same user● Abnormal usage frequency of high privilege accounts● High risk privilege escalation
Authorization Analytics

Complex Event Processing

Blacklists define table BlacklistedIPTable (ipAddress string);
from loginStream[ (ip == BlacklistedIPTable.ip) in BlacklistedIPTable ]select *insert into alertStream;
define table IPTable (ipAddress string);
from loginStream[ not(ip == IPTable.ip) in IPTable ]select *insert into alertStream;
Whitelists

Countingfrom loginFailureStream#window.time(1 hour)select username, count(timestamp) as loginFailCountgroup by usernamehaving loginFailCount > 30insert into alertStream;
from e1 = loginStream ->e2 = loginStream[(e1.ip == e2.ip) and (e1.username != e2.username)] <2:>within 1 day
select e1.ip, e1.username, e2[0].username, e2[1].usernameinsert into alertStream;
1 to many relationships

Adaptive Analytics
User Profiling
○ Time ○ IP/Geo-location○ Frequency○ Typing Patterns○ Service Provider(s) ○ Identity Provider(s)
Wonka usually logs in between 8am - 10am, from an IP address in Chicago, and logs into Redmine and Concur, using his Google Credentials

Rules
● Behavioural Rules○ Time○ Login Frequency○ Geo Location ○ List of Service Providers○ List of IDPs
● Scoring ○ Use combination of rules○ Give weights to each rule○ Single number to represent suspicion through multiple indicators○ Use a threshold to identify anomalies

ClusteringFeatures
● Time● Geo Region● IdP● SP Type

Markov Models
Classify Events Update Probability Matrix
Compare Incoming
Sequences
Probability Matrix
Events Alerts

Audit Trail Analytics
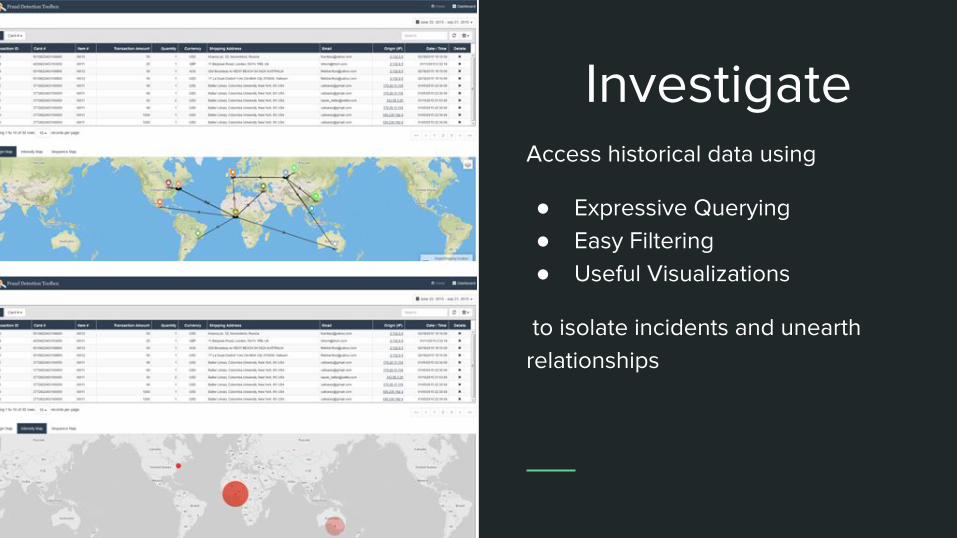
InvestigateAccess historical data using
● Expressive Querying ● Easy Filtering● Useful Visualizations
to isolate incidents and unearth relationships

Deployment
Persisted Storage
DashboardAlertsIdentity Provider Events

Challenges
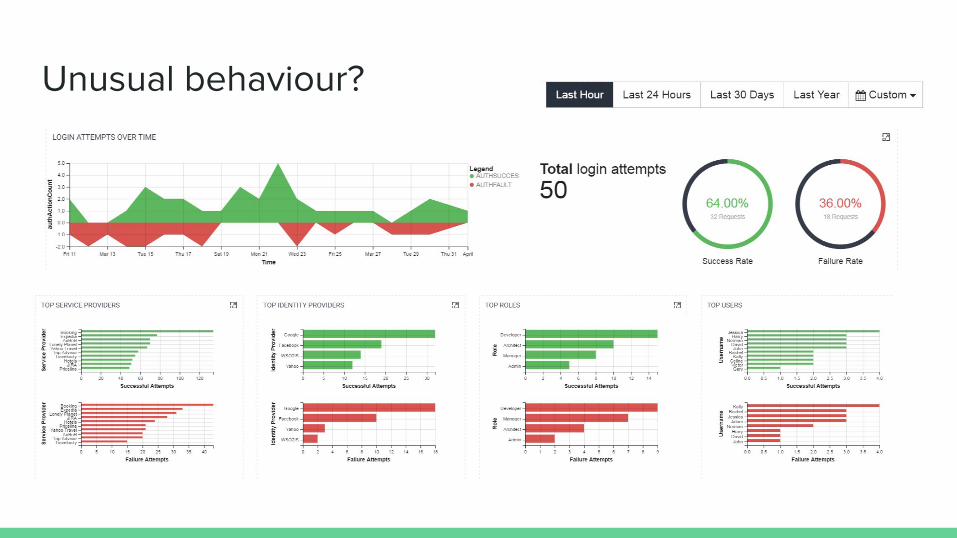
Unusual behaviour?

Big Data Challenge
● Millions of Events● Highly Dimensional
● Real-time Dashboards
EventID Timestamp Auth Success Username Roles Service Provider IDP IP
1 1420092114000 True Norman Dev; Admin Expedia Google 100.3.2.88
2 1420092114200 True John Dev Concur Facebook 10.13.2.15
3 1420092115500 False Mary QA Ebay Facebook 20.3.2.132

Fight against Time
1s 1s
1h
1m 1m 1m 1m
1h
1d
1s 1s 1s 1s 1s 1s CEP
Spark

Siddhi & Spark
from AuthEventStream#window.TimeBatch(1 sec)select sum(AuthCount), year, month, date, hour, min, secinsert into PerSecAuthCountStream
from PerSecAuthCountStream#window.TimeBatch(1 min)select sum(AuthCount), year, month, date, hour, mininsert into PerMinAuthCountTable
insert into PerHourAuthCountTableselect sum(AuthCount), year, month, date, hourfrom PerMinAuthCountTablegroup by year, month, date, hour
insert into PerDayAuthCountTableselect sum(AuthCount), year, month, datefrom PerHourAuthCountTablegroup by year, month, date
Siddhi
Spark
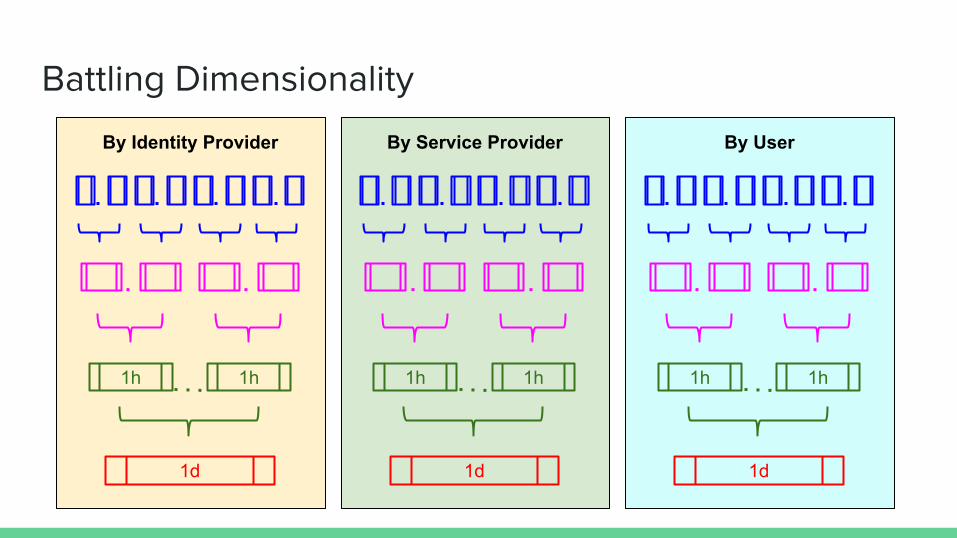
Battling Dimensionality
1h 1h
1d
1h 1h
1d
1h 1h
1d
By Identity Provider By Service Provider By User
