fifty-third annual report - central bank of malta
TRANSCRIPT

FIFTY-THIRD ANNUAL REPORTAND
STATEMENT OF ACCOUNTS2020

© Central Bank of Malta, 2021
AddressPjazza KastiljaValletta VLT 1060Malta
Telephone(+356) 2550 0000
Fax(+356) 2550 2500
Website www.centralbankmalta.org
E-mail [email protected]
Printed byGutenberg Press LtdGudja RoadTarxien GXQ 2902Malta
All rights reserved. Reproduction is permitted provided that the source is acknowledged.
The cut-off date for information published in this Report is 1 March 2021 except where otherwise indicated. Figures in tables may not add up due to rounding.
ISSN 0577-0653 (print)ISSN 1811-1262 (online)
MISSION STATEMENT
The Central Bank of Malta is an independent institution, which forms an integral part of the Eurosystem and, as a member of the European System of Central Banks (ESCB), has the primary objective of maintaining price stability. The Bank is entrusted with all major central banking tasks, particularly that of ensuring the stability of the financial system.
It seeks to carry out its statutory responsibilities in the public interest and is committed to performing its func-tions effectively, efficiently and economically to the highest level of integrity, competence and transparency. In this regard it will continue to:
i. undertake economic and financial analysis and research to support the Governor’s partici-pation in the decision-making process of the Governing Council of the European Central Bank (ECB) and provide independent advice to Government on economic and financial policy issues;
ii. implement the ECB’s monetary policy through market operations conducted within the opera-tional framework of the Eurosystem;
iii. contribute effectively to the stability of the financial system by identifying and assessing systemic risks and imbalances, and making the appropriate policy recommendations;
iv. formulate and implement a macroprudential policy to fulfil the tasks of the Bank as the national macroprudential authority;
v. promote and support the development and integration of financial markets in Malta through oversight of market infrastructures and by ensuring the availability of cost-efficient securities settlement and payment systems;
vi. provide an adequate supply of banknotes and coin (the latter on behalf of Government) to meet the demands of the public, while ensuring high quality and authenticity of the currency in circulation;
vii. collect, compile and publish economic and financial statistics in line with international standards;
viii. act as banker to Government and to the banking system;
ix. hold and actively manage financial assets with the aim of optimising returns, subject to prudent risk management practices;
x. actively participate in the ESCB, the Eurosystem and other relevant European Union bodies, including their sub-structures.
As a member of the Eurosystem, the Bank subscribes to the Eurosystem’s mission, strategic intents and organisational principles.
Executive Committee*
Professor Edward SciclunaGovernor and Chairman
Mr Alexander DemarcoDeputy Governor
Mr Oliver Bonello Deputy Governor
Mr Daniele RomanoChief Operating Officer
Mr Francis BugejaChief OfficerInternal Audit
Mr Alan CassarChief OfficerFinancial Stability
Mr Paul FarrugiaChief OfficerHuman Resources
Mr Raymond FillettiChief OfficerFinancial Control and Risk
Mr Jesmond GattChief OfficerBanking Operations
Dr Aaron G. GrechChief OfficerEconomics
Investments Policy Committee*
Professor Edward SciclunaGovernor and Chairman
Mr Alexander DemarcoDeputy Governor and Vice-Chairman
Mr Oliver BonelloDeputy Governor
Mr Raymond FillettiChief Officer Financial Control and Risk
Ms Maryanne AttardHead Financial Control Department
Mr Denis MicallefHead Risk Management Department
Mr André PsailaHeadInvestments and Government Securities Department
Ms Valerie CutajarManagerFinancial Risk Management Office
Mr Colin AttardPortfolio ManagerInternational Asset Management Office
Mr Ian SapianoPortfolio ManagerInternational Asset Management Office
Mr Damien FerritoManagerFinance Office
Audit Committee*
Professor Peter J. BaldacchinoChairman
Professor Frank BezzinaMember
Dr Romina CuschieriMember
BOARD OF DIRECTORS*Professor Edward Scicluna
Governor and Chairman
Mr Alexander Demarco Mr Oliver Bonello Deputy Governor Deputy Governor Monetary Policy Financial Stability
Ms Philomena Meli Director Professor Peter J. Baldacchino Director
Dr Romina Cuschieri DirectorProfessor Frank Bezzina Director
*as at 30 March 2021
Management Committee*
Chief Operating OfficerMr Daniele Romano (Chairman)
Heads of DepartmentsMr Stephen AttardPolicy, Crisis Management and Stress Testing
Ms Maryanne AttardFinancial Control
Mr Alexander BorgProperty and Procurement
Mr Saviour BusuttilInnovation, Technology & Knowledge Services
Mr John CaruanaMonetary Policy & Operations and Eurosystem Relations
Mr Silvio GaleaCorporate Strategic Planning
Ms Sylvana GattPayments and Banking
Dr Pauline LanzonLegal
Mr Aidan MassaInternal Audit
Ms Vanessa MacdonaldCommunications
Mr Denis MicallefRisk Management
Mr André PsailaInvestments and Government Securities
Mr Jesmond Pulé Statistics
Ms Rita SchembriEconomic Analysis
Mr Peter Paul TaboneCurrency Services and Security
Ms Wendy ZammitFinancial Stability Surveillance and Research

THE BOARD OF DIRECTORS*
(left to right) Top row: Mr Oliver Bonello (Deputy Governor), Professor Edward Scicluna (Governor and Chairman),
Mr Alexander Demarco (Deputy Governor)Bottom row: Professor Peter J. Baldacchino (Director), Ms Philomena Meli (Director), Professor Frank Bezzina
(Director), Dr Romina Cuschieri (Director), Mr Herbert Zammit LaFerla (Secretary).
*as at 30 March 2021
CommunicationsDepartment
Policy, Crisis Management and Stress
Testing Department
Financial Stability
Surveillance and Research
Department
Statistics Department
Financial Control
Department
Risk Management Department
Innovation, Technology &
Knowledge Services
Department
Property & Procurement Department
Economic Research
Department
Economic Analysis
Department
Monetary Policy & Operations
and Eurosystem Relations
Department
Investments and
Government Securities
Department
Currency Services and
Security Department
Payments and Banking
Department
Human Resources Department
Internal Audit Department
Legal Department
Monetary and Financial
Statistics and CCR Office
Finance Office
Operational Risk
Management Office
End User Technology & Infrastructure
Office
Monetary Operations and
Collateral Management
Office
International Asset
Management Office
Currency Operations
Office
Payment and Banking
Operations Office
External, Payments and
Securities Statistics Office
Financial Risk Management
Office
Core Applications
Office
Market Analysis Office
International Economic Research
Office
Modelling Office
Security Control Office
Regulation and Oversight
Office
Statistical Collection and
Information Management
Office
Application Development and Project
Delivery Office
Government Securities
Office
Knowledge Services Office
Deputy Governor Financial StabilityMr Oliver Bonello
Investments Division
Audit Committee
Division
GovernorProfessor Edward Scicluna
Board
Chief OfficerJesmond Gatt
Banking Operations Division
Deputy Governor Monetary PolicyMr Alexander Demarco
Chief OfficerAaron G. Grech
Economics Division
Chief OfficerRaymond Filletti
Financial Control and RiskDivision
Chief OfficerAlan Cassar
Financial Stability and Statistics Division
International Relations
Department
International Organisations
Office
Non-EU & Commonwealth
Countries Office
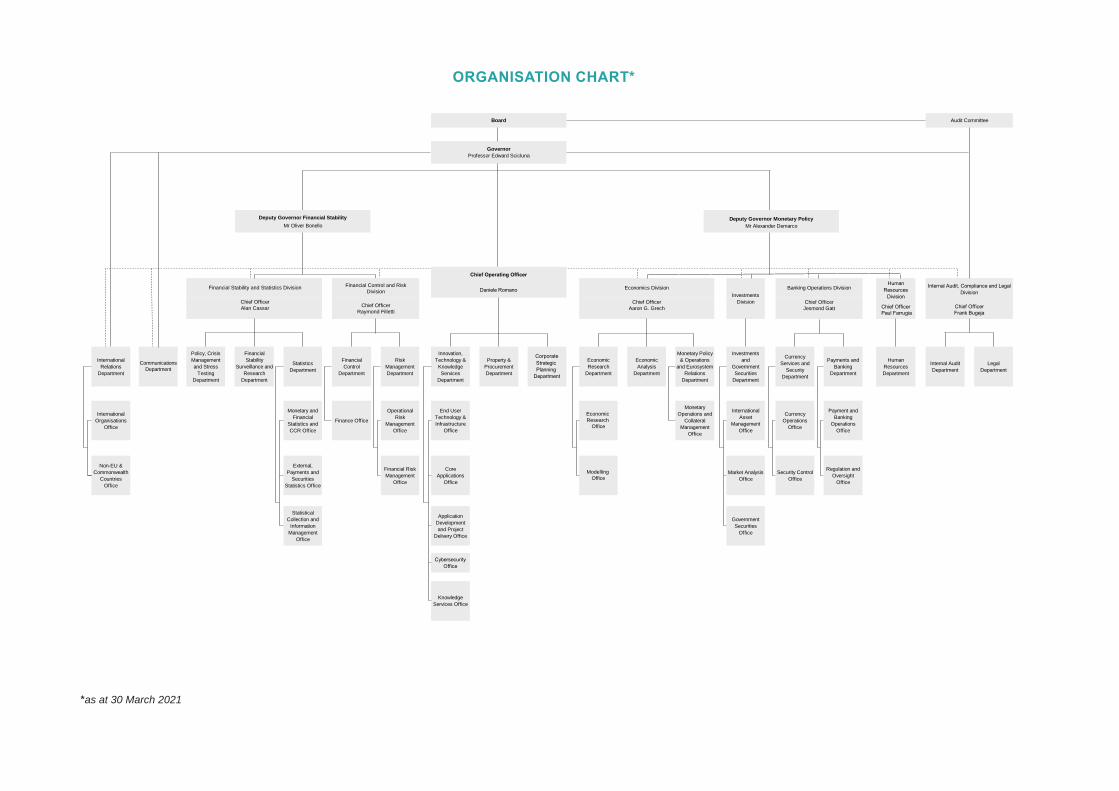
ORGANISATION CHART*
*as at 30 March 2021

Bank Ċentrali ta’ Malta
Eurosistema
Il-Gvernatur
Central Bank of Malta Eurosystem
The Governor
30 March 2021 The Hon Clyde Caruana Minister for Finance and Employment Maison Demandols South Street Valletta VLT 1102
Dear Minister,
LETTER OF TRANSMITTAL
In terms of article 21 of the Central Bank of Malta Act (Cap. 204), I have the honour to transmit to you, in your capacity as Minister responsible for finance, a copy of the Annual Report of the Bank for the financial year ended 31 December 2020.
Yours sincerely, Professor Edward Scicluna
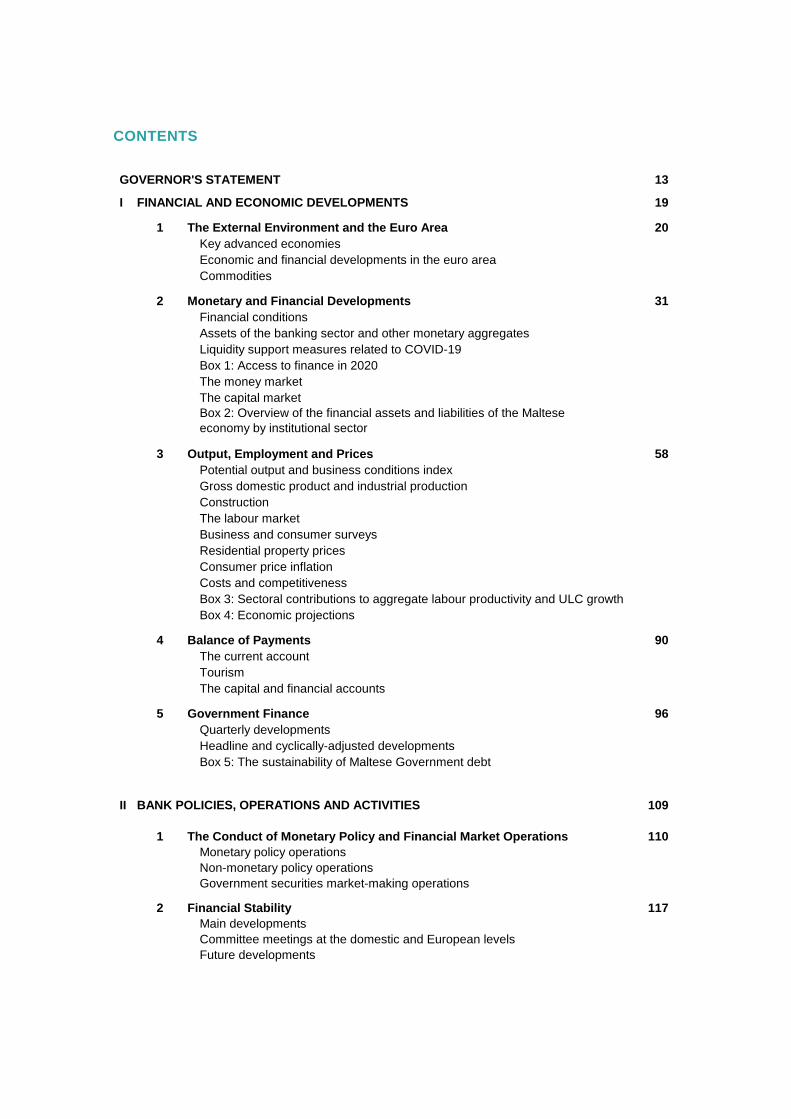
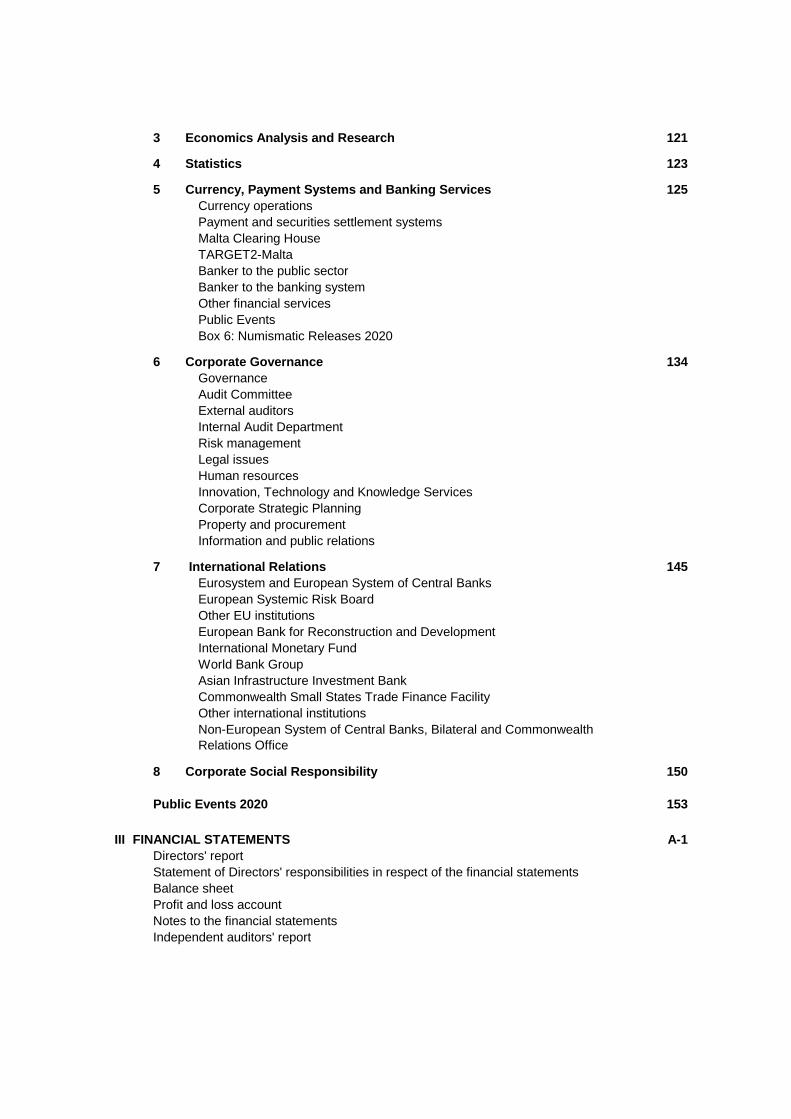
CONTENTS
13 I 19
1 20 Key advanced economies
Economic and financial developments in the euro area Commodities 2 31
Financial conditionsAssets of the banking sector and other monetary aggregatesLiquidity support measures related to COVID-19Box 1: Access to finance in 2020
The money marketThe capital marketBox 2: Overview of the financial assets and liabilities of the Maltese economy by institutional sector
3 Output, Employment and Prices 58Potential output and business conditions indexGross domestic product and industrial productionConstruction The labour marketBusiness and consumer surveysResidential property pricesConsumer price inflationCosts and competitivenessBox 3: Sectoral contributions to aggregate labour productivity and ULC growthBox 4: Economic projections
4 Balance of Payments 90The current accountTourismThe capital and financial accounts
5 Government Finance 96Quarterly developmentsHeadline and cyclically-adjusted developmentsBox 5: The sustainability of Maltese Government debt
II 109
1 110 Monetary policy operations
Non-monetary policy operationsGovernment securities market-making operations
2 117Main developmentsCommittee meetings at the domestic and European levelsFuture developments
The Conduct of Monetary Policy and Financial Market Operations
Financial Stability
GOVERNOR'S STATEMENT
FINANCIAL AND ECONOMIC DEVELOPMENTS
The External Environment and the Euro Area
Monetary and Financial Developments
BANK POLICIES, OPERATIONS AND ACTIVITIES
3 121
4 123
5 125 Currency operations
Payment and securities settlement systemsMalta Clearing HouseTARGET2-Malta
Banker to the public sector Banker to the banking system
Other financial servicesPublic EventsBox 6: Numismatic Releases 2020
6 134 Governance
Audit Committee External auditorsInternal Audit Department
Risk management Legal issues
Human resources Innovation, Technology and Knowledge Services Corporate Strategic PlanningProperty and procurement Information and public relations
7 145 Eurosystem and European System of Central Banks
European Systemic Risk Board Other EU institutions
European Bank for Reconstruction and DevelopmentInternational Monetary FundWorld Bank GroupAsian Infrastructure Investment BankCommonwealth Small States Trade Finance FacilityOther international institutionsNon-European System of Central Banks, Bilateral and Commonwealth Relations Office
8 150
153
III A-1
Notes to the financial statementsIndependent auditors' report
Economics Analysis and Research
Statistics
Corporate Social Responsibility
Statement of Directors' responsibilities in respect of the financial statements
Profit and loss accountBalance sheet
Directors' reportFINANCIAL STATEMENTS
Currency, Payment Systems and Banking Services
Corporate Governance
International Relations
Public Events 2020
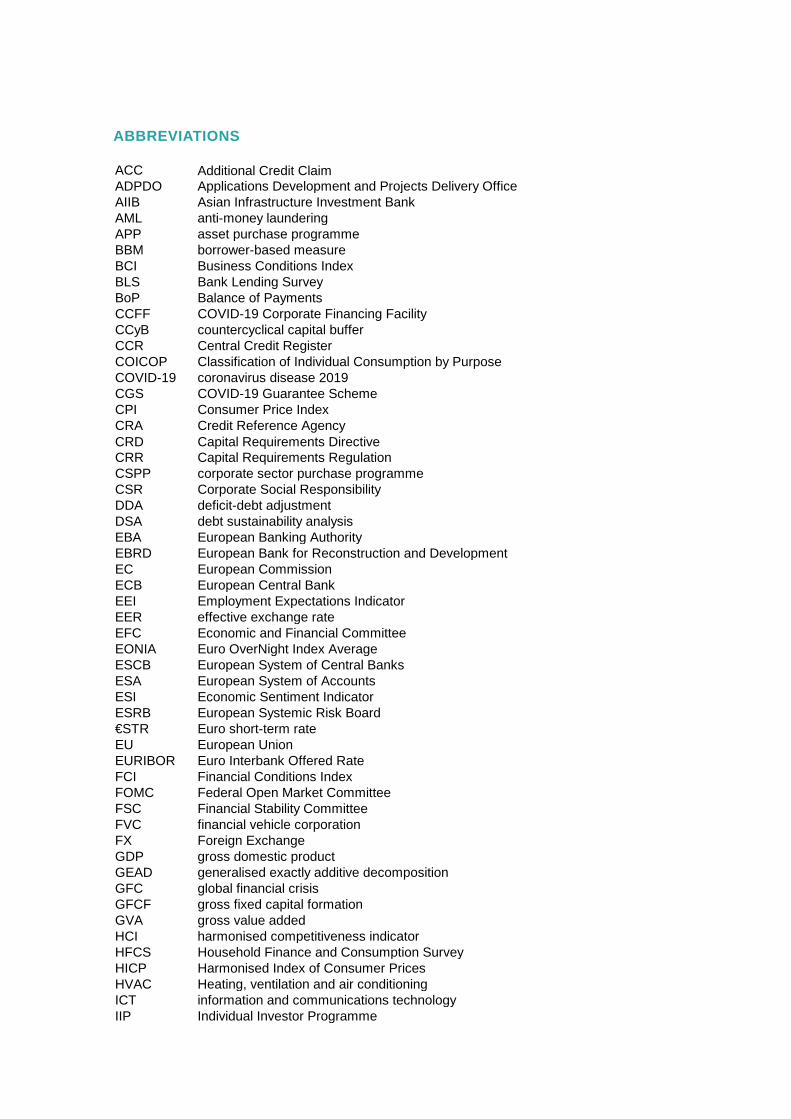
ABBREVIATIONS
ACC Additional Credit ClaimADPDO Applications Development and Projects Delivery OfficeAIIB Asian Infrastructure Investment Bank AML anti-money laundering APP asset purchase programmeBBM borrower-based measureBCI Business Conditions IndexBLS Bank Lending SurveyBoP Balance of PaymentsCCFF COVID-19 Corporate Financing FacilityCCyB countercyclical capital buffer CCR Central Credit RegisterCOICOP Classification of Individual Consumption by PurposeCOVID-19 coronavirus disease 2019CGS COVID-19 Guarantee SchemeCPI Consumer Price IndexCRA Credit Reference AgencyCRD Capital Requirements DirectiveCRR Capital Requirements Regulation CSPP corporate sector purchase programmeCSR Corporate Social ResponsibilityDDA deficit-debt adjustmentDSA debt sustainability analysisEBA European Banking AuthorityEBRD European Bank for Reconstruction and DevelopmentEC European CommissionECB European Central BankEEI Employment Expectations IndicatorEER effective exchange rateEFC Economic and Financial Committee EONIA Euro OverNight Index AverageESCB European System of Central BanksESA European System of AccountsESI Economic Sentiment IndicatorESRB European Systemic Risk Board€STR Euro short-term rateEU European UnionEURIBOR Euro Interbank Offered RateFCI Financial Conditions IndexFOMC Federal Open Market CommitteeFSC Financial Stability CommitteeFVC financial vehicle corporationFX Foreign ExchangeGDP gross domestic productGEAD generalised exactly additive decompositionGFC global financial crisisGFCF gross fixed capital formationGVA gross value addedHCI harmonised competitiveness indicatorHFCS Household Finance and Consumption SurveyHICP Harmonised Index of Consumer PricesHVAC Heating, ventilation and air conditioningICT information and communications technologyIIP Individual Investor Programme
IMF International Monetary FundIAC Internal Auditors CommitteeIPC Investment Policy CommitteeIReF integrated reporting frameworkJFSB Joint Financial Stability BoardLFS Labour Force SurveyLTRO longer-term refinancing operationMBA Malta Bankers' Association MDB Malta Development BankMCAST Malta College of Arts, Science and Technology MCCFF Malta Community Chest Fund FoundationMCESD Malta Council for Economic and Social Development MCH Malta Clearing House MFI monetary financial institutionMFSA Malta Financial Services AuthorityMGS Malta Government StocksMIA Malta International AirportMIP Macroeconomic Imbalance ProcedureMPO Malta Philharmonic OrchestraMQF Malta Qualifications Framework MRO main refinancing operationMSE Malta Stock ExchangeNCB national central bankNEIG non-energy industrial goodsNFC non-financial corporationNGEU Next Generation EUNGFS Network for Greening of the Financial SystemNHPAB Numismatics and Historical Publications Advisory BoardNPISH non-profit institutions serving householdsNPL non-performing loanNSO National Statistics OfficeOPEC Organization of the Petroleum Exporting CountriesORM Operational Risk ManagementO-SII other systemically important institutionPELTRO pandemic emergency longer-term refinancing operationPEPP pandemic emergency purchase programmePPI Property Price IndexPSPP public sector purchase programmeQMUL Queen Mary University of LondonRPI Retail Price IndexSAFE Survey on Access to Finance of EnterprisesSBA Small Business ActSDR Special Drawing RightSEPA Single Euro Payments AreaSME small and medium-sized enterpriseSSM Single Supervisory MechanismSSS securities settlement systemSWIFT Society for Worldwide Interbank Financial TelecommunicationT2S TARGET2-SecuritiesTARGET2 Trans-European Automated Real-time Gross settlement Express Transfer system 2TIPS TARGET Instant Payment Settlement TLTRO targeted longer-term refinancing operationUK United KingdomULC unit labour costUS United StatesVAT value added tax

13
CENTRAL BANK OF MALTA Annual Report 2020
GOVERNOR’S STATEMENT
In 2020, the global economy was hit by a severe economic shock as a result of the COVID-19 pandemic and the related restrictions that were introduced to curb the spread of the virus. In the vast majority of countries, activity contracted at an unprecedented pace and by far more than experienced during the global financial crisis (GFC) of 2008-2009. Another striking feature of the 2020 downturn in activity was that it predominantly hit parts of the services sector. Other sec-tors, though showing greater resilience, were also negatively affected by restrictions at borders, quarantine requirements and disruptions to global value chains. The slump in activity and uncertainty brought about by the evolution of the pandemic also created financial market volatility. Damage to the financial sector, though, was limited – partly because of the regulatory changes in the post-GFC period, which had strengthened the capital position of banks, but also as a result of unprecedented liquidity support to the banking sector and temporary relief from certain regulatory requirements by the relevant authorities. Indeed, the banking sector was instrumental in supporting the private sector by means of moratoria and the contin-ued smooth flow of credit through the liquidity injected by central banks. Although the successful production of vaccines in the final quarter of 2020 brought hope of a resolution to the medical crisis, nevertheless the near-term outlook remains overshadowed by rising infection rates and lingering uncertainty from new vari-ants of the virus, that led to renewed lockdown measures in several countries.
In the euro area, real gross domestic product (GDP) contracted by 6.6% in 2020, mostly because of lower private consumption and investment. Notwithstanding this sharp decline in activity, the labour market showed resilience, supported by fiscal policy measures. Although the number of persons in employment decreased by 1.6%, job losses were relatively moderate when gauged against the very sharp fall in activity. This partly reflects the introduction of several schemes aimed at protecting employment. In fact, the average unemploy-ment rate in the euro area rose modestly – from 7.6% in 2019 to 7.9% in 2020. The impact of the pandemic was instead reflected in lower hours worked and a reduction in labour participation. Against this background, wage negotiations were generally put on hold or concluded with modest increases. Meanwhile, the annual average rate of inflation based on the Harmonised Index of Consumer Prices (HICP) in the euro area fell to 0.3% from 1.2% in 2019, with this moderation largely driven by developments in energy inflation and weak consumption. HICP inflation excluding energy and food also eased, averaging 0.7% during the year under review.
In light of these developments, the European Central Bank (ECB) eased its monetary stance and introduced a number of measures to ensure a continued steady flow of liquidity to the economy in these challenging circumstances. The interest rate on main refinancing operations (MROs) and the rate on the marginal lend-ing facility were held at 0.00% and 0.25%, respectively, while the rate on the deposit facility rate was kept at -0.50%. On several occasions, the Governing Council reiterated that it expects the key ECB interest rates to remain at their present or lower levels until it has seen the inflation outlook robustly converge to a level suf-ficiently close to, but below 2% within the projection horizon. It said that purchases under the asset purchase programme (APP) will continue as long as necessary to reinforce the accommodative impact of policy rates. It also confirmed its intention to reinvest in full the principal payments from maturing securities under this programme for an extended period of time past the date when it starts raising the key ECB interest rates, and for as long as needed.
In March, the Governing Council announced a package of monetary policy measures to counter the serious risks to the monetary policy transmission mechanism and to the economic outlook posed by the pandemic – some of which were expanded later during the year.
The package included a significant expansion in asset purchases, partly by means of a temporary envelope of additional net asset purchases under the APP, of €120.0 billion until the end of 2020. More significantly,

14
CENTRAL BANK OF MALTA Annual Report 2020
a new pandemic emergency purchase programme (PEPP) was launched, with an initial overall envelope of €750.0 billion that was later revised to a maximum of €1,850.0 billion, accompanied by great flexibility in its implementation to cater for heterogeneity in the impact of the pandemic within the euro area. The horizon and reinvestment phase of PEPP purchases were also extended.
The March package also included additional longer-term refinancing operations (LTROs) and more favour-able terms on the targeted long-term refinancing operations (TLTRO-III) for the period from June 2020 to June 2021. The interest rate on TLTRO-III was lowered further in April – for credit institutions meeting certain lending thresholds to as low as -1.0%. TLTRO-III conditions were further recalibrated in December and the period over which considerably more favourable terms will apply was extended by 12 months, to June 2022.
The year under review also saw the announcement of a new series of non-targeted pandemic emergency longer-term refinancing operations (PELTROs) carrying an interest rate that is below the average rate on MROs prevailing over the life of each such operation. Collateral requirements were eased and several swap and repo facilities with non-euro area central banks were extended.
The pandemic interrupted the pattern of strong growth that had characterised the Maltese economy in recent years. In 2020, the Maltese economy contracted by 7.0%, mostly on account of lower net exports. Domestic demand was also hit, although its contribution was much less negative than that of net exports, as consider-able fiscal support sustained consumption. As in the euro area, most of the contraction in domestic demand was driven by lower household expenditure, as containment measures forced households to increase their rate of saving, and by lower private investment.
Employment continued to increase – though at a slower rate than in previous years – with the Government’s Wage Supplement Scheme effective at preventing large-scale layoffs. Growth in employment may also reflect an element of labour hoarding by firms following a period of skills shortages. Although the unemploy-ment rate edged up to 4.3%, it remained close to its historical low and well below the average rate in the euro area.
Public finances deteriorated sharply in 2020, partly reflecting the decline in economic activity, as well as the introduction of COVID-19 related fiscal support. The Bank estimates that the fiscal balance will show a defi-cit of close to 9.5% of GDP in 2020, after four years in surplus, while the general government debt rose to around 55.3% of GDP, though remaining well below the euro area average. The pandemic also left its mark on the current account balance, which is estimated to have registered a deficit for the first time since 2016.
Annual HICP inflation fell to 0.8% in 2020, from 1.5% in 2019, mainly reflecting slower growth in services prices and falling energy prices. At the same time, food prices rose at a slower pace, while non-energy indus-trial goods (NEIG) inflation turned negative. Inflation based on the Retail Price Index (RPI) showed a similar development, easing to 0.6% from 1.6% in 2019.
The fact that the country’s productive capacity remained relatively unchanged, with investment still strong by historical standards and with the employment rate remaining elevated, means that once foreign demand recovers and the lingering uncertainty surrounding the medical crisis dissipates, the Maltese economy can be expected to rebound from the COVID-19 shock. The Bank therefore expects that GDP will grow by 5.0% in 2021, by 5.5% in 2022, and by 4.7% in 2023, with pre-pandemic GDP levels recouped by the end of 2022, conditional on the successful rollout of a vaccine in 2021. Inflationary pressures are expected to remain very subdued this year but should start to pick up from 2022 as demand conditions improve. The general govern-ment balance is expected to remain in deficit until the end of the projection horizon, although narrowing to 3.9% of GDP by 2023 as COVID-related support measures are gradually withdrawn. Government debt is set to reach 60.3% of GDP by 2023.
Since the production of these projections, COVID-19 infection rates have increased again, both in Malta and in its key trading partners, leading to tighter containment measures. This presents a downside risk to activity in the near term and to public finances. Risks are assessed to be more balanced after 2021, as the
15
CENTRAL BANK OF MALTA Annual Report 2020
implementation of vaccination programmes should allow a broader economic recovery in line with the Bank’s expectations.
As regards operational activities, the Bank continued to implement the Eurosystem’s monetary policy deci-sions in Malta through standing facilities, liquidity-providing operations and asset purchases. Credit institu-tions established in Malta participated only once in the MROs with an amount of €1.0 million, similar to 2019. However, whereas in 2019 they had not used LTROs, in 2020 the banking system participated with an aggregate amount of €60.0 million in such operations and with €45.0 million in the new PELTROs. Borrowing through TLTROs increased – to €63.5 million – as did recourse to the ECB’s US dollar liquidity operations. As in 2019, Maltese credit institutions did not use the marginal lending facility. Recourse to the deposit facility decreased, as credit institutions shifted some of their excess reserves held with the ECB to current accounts held with the Bank.
During the year, the Bank purchased €85.0 million worth of Maltese sovereign bonds under the public sector purchase programme (PSPP) – a higher amount compared to 2019, mainly owing to the increased rate of purchase arising from the additional temporary APP envelope worth €120.0 billion introduced by the ECB. Meanwhile, purchases of sovereign bonds under the PEPP reached €235.9 million. Apart from purchas-ing sovereign bonds for its PSPP and PEPP portfolios, the Bank made additional purchases for the ECB’s portfolios.
The Bank’s balance sheet continued to expand, reaching €10,035.4 million at the end of 2020 from €9,288.2 million a year earlier. Operating profit before transfer to provisions decreased to €42.8 million from €49.5 million in 2019. Following the transfer of €9.8 million to provisions, the amount of €33.0 million is payable to the Government of Malta, up from €31.5 million a year earlier.
The Bank continued to advise government on legislative and regulatory developments related to financial stability. It carried out regular assessments of financial sector conditions, also through stress tests and sensi-tivity analysis, and through the Bank Lending Survey (BLS). On the basis of its macroprudential policy man-date, the Bank was very active in terms of policies aimed at ensuring that the local financial system could better support the economy during the pandemic. Following the issue of a Legal Notice on the Moratorium on Credit Facilities Regulations in Exceptional Circumstances, which directed credit and financial institutions licensed by the Malta Financial Services Authority (MFSA) to offer a moratorium on repayments on capital and interest for borrowers negatively affected by COVID-19, the Bank issued Directive No. 18 to define the eligibility for the moratorium and the prudential treatment of loans subject to moratoria.
Certain requirements on borrower-based measures (BBMs) laid down in Directive No. 16 were also tem-porarily relaxed or suspended to avoid a further drain on liquidity, while the stress testing framework was enhanced with additional pandemic-related scenarios. However, the capital conservation buffer for banks remained in force and Directive No. 11 on Macroprudential Policy was amended to transpose elements of the revised Capital Requirements Directive (CRD) V that are in the Bank’s remit.
Apart from participating in ECB and European Systemic Risk Board (ESRB) meetings related to the financial sector, the Bank participated actively in the Joint Financial Stability Board (JFSB), the Forum for Financial Stability as well as the Domestic Standing Committee and its Crisis Management Task Force – which met more frequently than in past years in view of the pandemic. Financial stability issues and the general eco-nomic situation were regularly discussed with the European Commission, the International Monetary Fund (IMF) and the rating agencies. The Bank participated in the National Coordinating Committee on Combating Money Laundering and Funding of Terrorism and continued to monitor developments in these areas as the different stakeholders continued their work in addressing the recommendations made by the Council of Europe’s anti-money laundering body – MONEYVAL.
The Bank again offered, but on an online platform, public lectures in economics and finance, as well as its Annual Research Symposium, which focused on migration. It continued to work with the National Statistics Office (NSO) on the fourth round of the Household Finance and Consumption Survey (HFCS). In light of the
16
CENTRAL BANK OF MALTA Annual Report 2020
uncertainty caused by the pandemic, the Bank’s projections were enhanced, with all projection publications issued since March featuring two scenarios rather than one. The Bank also remained active in domestic fora, such as the National Productivity Board, the Building Industry Consultative Council and an expert group set up by the Housing Authority on the private residential rental market. Following the onset of the pandemic and the need for more sectoral information, the Bank increased its contacts with private and public institutions to a weekly – and at times even a daily – frequency.
The Bank continued to compile and disseminate a variety of statistics for official institutions and the general public. The range of statistics published on the Bank’s website was expanded to show the aggregated state-ment of assets and liabilities of Financial Vehicle Corporations (FVCs). Considering the exceptional circum-stances triggered by the pandemic, derogations were granted to certain categories of reporting financial sectors – while additional statistics were collected, such as on moratoria on loans granted by credit institu-tions to their clients, and regular information from the Malta Development Bank (MDB) on participation in its COVID-19 Guarantee Scheme (CGS).
During 2020, Directive No. 15 was published to affirm the role of the Bank as the supervisory authority of credit reference agencies (CRAs) and pension funds statistics were collected for the first time. The Bank also began to participate in the ESCB Integrated Reporting Framework (IReF) and initiated work on a new reporting survey on payment statistics.
To ensure the continuity of the local cash cycle and assist the public during the pandemic, the Bank issued Directive No. 17 regarding business continuity measures concerning deposit and withdrawal of cash, deposit and encashment of paper-based instruments, and provision of services through alternative delivery chan-nels. Training sessions to schools and cash handlers continued but moved online. During 2020, the Bank also implemented a new payments infrastructure and started offering agency services to credit and financial institutions for the settlement of euro retail payments. Meanwhile, the Bank monitored the implementation of strong customer authentication in the local market in fulfilment of the requirements on authentication laid out in the Payment Services Directive (PSD) No. 2.
Despite the COVID-19 restrictions, the Bank remained as active as possible in all spheres of Corporate Social Responsibility (CSR). It provided philanthropic support to several institutions and began to update its website to ensure that it is as accessible as possible to all users. In 2020, the Bank also adopted an Equality, Diversity, and Inclusion Policy.
As part of its efforts to support transition towards a sustainable global economy, the Bank has increasingly been exploring ways to incorporate sustainable and responsible investment principles in the manage-ment of its portfolios. The Bank invested in an Environmental, Social and Governance Fund in the second quarter of 2020 and increased exposure to green and social bonds in its internally-managed portfolios. Moreover, the Bank requested the provision of Environmental, Social and Governance metrics for each externally-managed portfolio. The Bank, meanwhile, continued to participate in the Network for Greening the Financial System (NGFS), which brings together several of the global systemically-important banks and insurers.
Other environmentally-friendly initiatives were implemented to reduce the Bank’s ecological footprint, includ-ing the installation of new equipment to improve the Bank’s energy efficiency and measures aimed at reduc-ing waste and making better use of recycled products.
During most of 2020, the Bank was focused on the adoption of measures to preserve business continuity in a pandemic context. As a result, there was substantial investment to ensure a healthy and safe environment for Bank staff as well as information technology to enable remote working. The Bank is committed to ensure that it can continue to provide essential services, as it successfully did in 2020, to its stakeholders even in these challenging times.
17
CENTRAL BANK OF MALTA Annual Report 2020
Looking ahead, the Bank will continue to monitor closely the economy and the financial system and to disseminate its knowledge to the general public. In 2021, it will continue to participate in Eurosystem discussions on the review of the ECB’s monetary strategy and to contribute, within its remit, to strengthen Malta’s Anti-Money Laundering/Combating the Financing of Terrorism framework.
On behalf of the Board, I would like to thank the Bank’s staff for their continued effort and dedication, espe-cially in light of the various challenges created by the pandemic.
Professor Edward Scicluna

I. Financial and Economic Developments
20
CENTRAL BANK OF MALTA Annual Report 2020
1. THE EXTERNAL ENVIRONMENT AND THE EURO AREA
During 2020, economic activity contracted sharply in the United States (US) and the United Kingdom (UK) as the spread of COVID-19 hampered economic activity. Unemployment rose in both economies while price pressures eased, largely reflecting developments in energy prices. The annual rate of consumer price infla-tion averaged 1.2% in the United States and 0.9% in the United Kingdom. Although in the former inflation edged up in the second half of 2020, it remained moderate from a historical perspective. During the year, both the Federal Reserve and the Bank of England lowered their key interest rates and introduced various liquidity support measures aimed at ensuring the smooth functioning of financial markets and the flow of credit to the economy, to mitigate the negative economic effects of COVID-19.
In the euro area, real growth in GDP contracted by 6.6% in 2020, after increasing by 1.3% in 2019. Employ-ment also decreased, although job losses were limited considering the extent of economic contraction, with the unemployment rate rising to 7.9%, from 7.6% a year earlier. Consumer price inflation, measured on the basis of the HICP, fell to an average of 0.3% in 2020, reflecting lower energy prices as well as weak con-sumer demand.
During 2020, the ECB’s Governing Council reinforced its monetary policy stance and took measures to support favourable financing conditions for the real economy and the smooth provision of credit. The inter-est rates on the MROs, on the marginal lending facility and on the deposit facility were held unchanged at 0.00%, 0.25%, and -0.50% respectively throughout the year. Furthermore, the Governing Council reiterated that it expects the key ECB interest rates to remain at their present or lower levels until it has seen the infla-tion outlook robustly converge to a level sufficiently close to, but below, 2% within its projection horizon, and such convergence has been consistently reflected in underlying inflation dynamics.
The Governing Council also reiterated its intention to reinvest in full the principal payments from maturing securities under the APP for an extended period of time past the date when it starts raising the key ECB inter-est rates and in any case for as long as necessary to maintain favourable liquidity conditions and an ample degree of monetary accommodation.
Furthermore, in order to combat the economic disruption and heightened uncertainty brought about by the pandemic, the Governing Council announced a package of monetary policy measures. It announced that considerably more favourable terms will be applied during the period from June 2020 to June 2021 to all TLTRO III operations outstanding during that time. It eased the conditions on the TLTRO III, partly by reduc-ing the interest rates on these operations between June 2020 and June 2021, with this period later extended to June 2022. A temporary envelope of additional net asset purchases of €120.0 billion under the APP was added. The Governing Council also launched a new series of non-targeted PELTROs.
More importantly, the ECB’s Governing Council launched the PEPP with an initial overall envelope of €750.0 billion that was later increased to a maximum of €1,850.0 billion, and expanded the range of eligible assets under the corporate sector purchase programme (CSPP) to include non-financial commercial paper. The horizon and reinvestment phase of PEPP purchases were extended.
21
CENTRAL BANK OF MALTA Annual Report 2020
The fall in activity caused by the pandemic was reflected in lower global oil demand which resulted in oil prices falling sharply in April. Thereafter, oil prices regained some of their losses as several countries began to lift some lockdown measures and restrictions on mobility. Nevertheless, the price of Brent crude oil ended 2020 at USD 50.87 per barrel, 26.2% below its level at end-2019.
Key advanced economies
US economic activity falls During 2020, real GDP contracted in the United States, mainly reflecting the containment measures in response to the spread of COVID-19, as various lockdown orders were put in place, forcing consumers and businesses to cancel or restrict their spending. Real GDP decreased by 3.5% in 2020, following an increase of 2.2% in 2019 (see Table 1.1).
Growth in personal consumption expenditure turned negative, as did growth in gross private domestic investment. Government consumption continued to grow, although at a slower pace than before. Net exports continued to dampen economic growth, but their contribution was marginally less negative than in 2019.
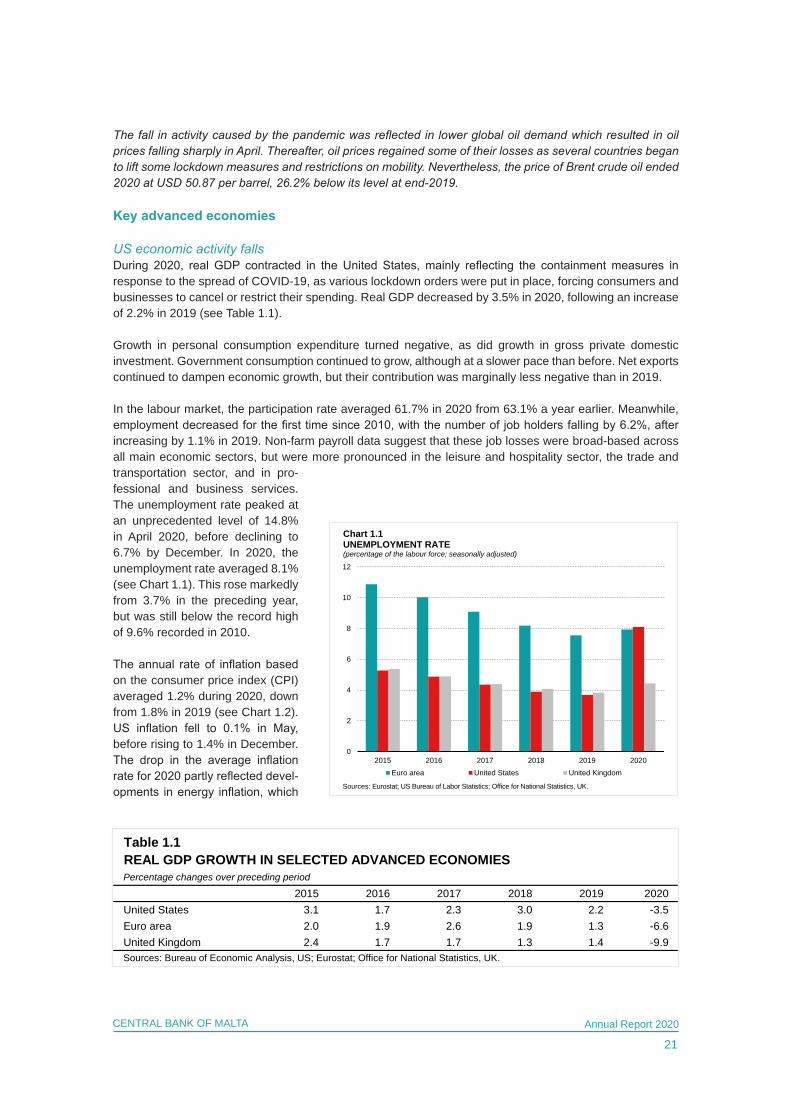
In the labour market, the participation rate averaged 61.7% in 2020 from 63.1% a year earlier. Meanwhile, employment decreased for the first time since 2010, with the number of job holders falling by 6.2%, after increasing by 1.1% in 2019. Non-farm payroll data suggest that these job losses were broad-based across all main economic sectors, but were more pronounced in the leisure and hospitality sector, the trade and transportation sector, and in pro-fessional and business services. The unemployment rate peaked at an unprecedented level of 14.8% in April 2020, before declining to 6.7% by December. In 2020, the unemployment rate averaged 8.1% (see Chart 1.1). This rose markedly from 3.7% in the preceding year, but was still below the record high of 9.6% recorded in 2010.
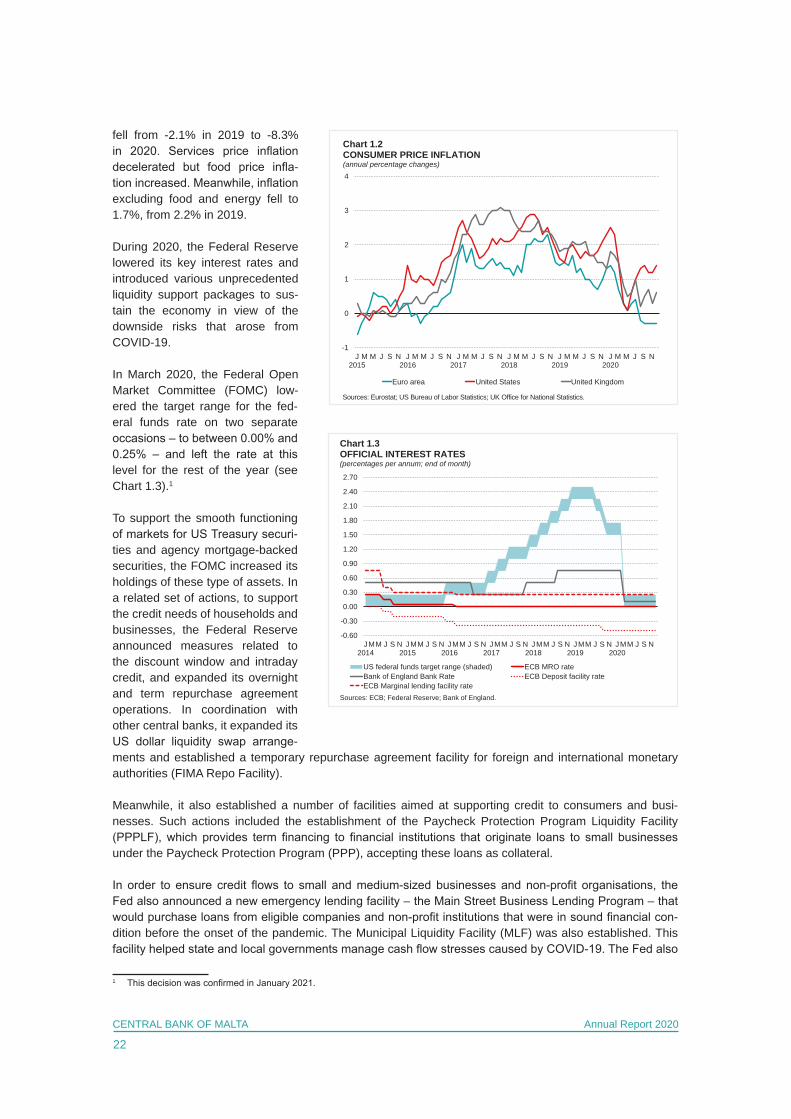
The annual rate of inflation based on the consumer price index (CPI) averaged 1.2% during 2020, down from 1.8% in 2019 (see Chart 1.2). US inflation fell to 0.1% in May, before rising to 1.4% in December. The drop in the average inflation rate for 2020 partly reflected devel-opments in energy inflation, which
0
2
4
6
8
10
12
2015 2016 2017 2018 2019 2020Euro area United States United Kingdom
Chart 1.1UNEMPLOYMENT RATE (percentage of the labour force; seasonally adjusted)
Sources: Eurostat; US Bureau of Labor Statistics; Office for National Statistics, UK.
Table 1.1REAL GDP GROWTH IN SELECTED ADVANCED ECONOMIESPercentage changes over preceding period
2015 2016 2017 2018 2019 2020United States 3.1 1.7 2.3 3.0 2.2 -3.5Euro area 2.0 1.9 2.6 1.9 1.3 -6.6United Kingdom 2.4 1.7 1.7 1.3 1.4 -9.9Sources: Bureau of Economic Analysis, US; Eurostat; Office for National Statistics, UK.
22
CENTRAL BANK OF MALTA Annual Report 2020
fell from -2.1% in 2019 to -8.3% in 2020. Services price inflation decelerated but food price infla-tion increased. Meanwhile, inflation excluding food and energy fell to 1.7%, from 2.2% in 2019. During 2020, the Federal Reserve lowered its key interest rates and introduced various unprecedented liquidity support packages to sus-tain the economy in view of the downside risks that arose from COVID-19.
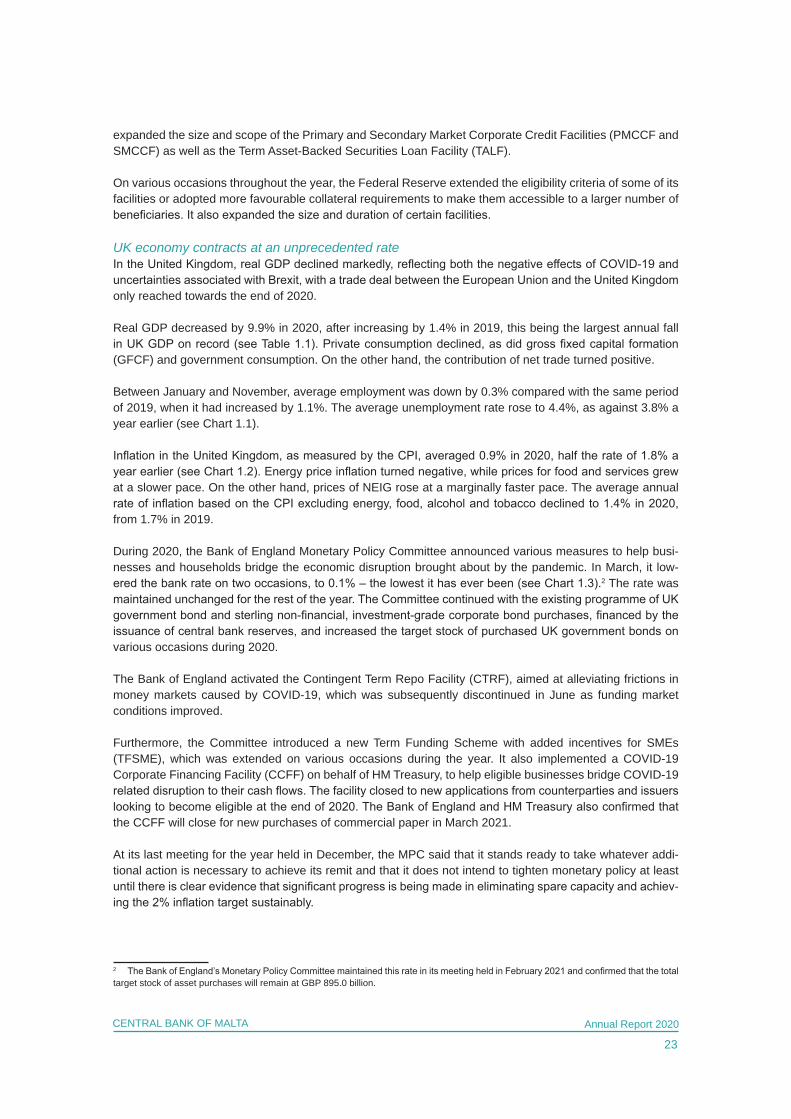
In March 2020, the Federal Open Market Committee (FOMC) low-ered the target range for the fed-eral funds rate on two separate occasions – to between 0.00% and 0.25% – and left the rate at this level for the rest of the year (see Chart 1.3).1
To support the smooth functioning of markets for US Treasury securi-ties and agency mortgage-backed securities, the FOMC increased its holdings of these type of assets. In a related set of actions, to support the credit needs of households and businesses, the Federal Reserve announced measures related to the discount window and intraday credit, and expanded its overnight and term repurchase agreement operations. In coordination with other central banks, it expanded its US dollar liquidity swap arrange-ments and established a temporary repurchase agreement facility for foreign and international monetary authorities (FIMA Repo Facility).
Meanwhile, it also established a number of facilities aimed at supporting credit to consumers and busi-nesses. Such actions included the establishment of the Paycheck Protection Program Liquidity Facility (PPPLF), which provides term financing to financial institutions that originate loans to small businesses under the Paycheck Protection Program (PPP), accepting these loans as collateral.
In order to ensure credit flows to small and medium-sized businesses and non-profit organisations, the Fed also announced a new emergency lending facility – the Main Street Business Lending Program – that would purchase loans from eligible companies and non-profit institutions that were in sound financial con-dition before the onset of the pandemic. The Municipal Liquidity Facility (MLF) was also established. This facility helped state and local governments manage cash flow stresses caused by COVID-19. The Fed also
1 This decision was confirmed in January 2021.
-1
0
1
2
3
4
J2015
M M J S N J2016
M M J S N J2017
M M J S N J2018
M M J S N J2019
M M J S N J2020
M M J S N
Euro area United States United Kingdom
Chart 1.2CONSUMER PRICE INFLATION(annual percentage changes)
Sources: Eurostat; US Bureau of Labor Statistics; UK Office for National Statistics.
-0.60
-0.30
0.00
0.30
0.60
0.90
1.20
1.50
1.80
2.10
2.40
2.70
J2014
MM J S N J2015
MM J S N J2016
MM J S N J2017
MM J S N J2018
MM J S N J2019
MM J S N J2020
MM J S N
US federal funds target range (shaded) ECB MRO rateBank of England Bank Rate ECB Deposit facility rateECB Marginal lending facility rate
Chart 1.3OFFICIAL INTEREST RATES (percentages per annum; end of month)
Sources: ECB; Federal Reserve; Bank of England.
23
CENTRAL BANK OF MALTA Annual Report 2020
expanded the size and scope of the Primary and Secondary Market Corporate Credit Facilities (PMCCF and SMCCF) as well as the Term Asset-Backed Securities Loan Facility (TALF).
On various occasions throughout the year, the Federal Reserve extended the eligibility criteria of some of its facilities or adopted more favourable collateral requirements to make them accessible to a larger number of beneficiaries. It also expanded the size and duration of certain facilities.
UK economy contracts at an unprecedented rateIn the United Kingdom, real GDP declined markedly, reflecting both the negative effects of COVID-19 and uncertainties associated with Brexit, with a trade deal between the European Union and the United Kingdom only reached towards the end of 2020.
Real GDP decreased by 9.9% in 2020, after increasing by 1.4% in 2019, this being the largest annual fall in UK GDP on record (see Table 1.1). Private consumption declined, as did gross fixed capital formation (GFCF) and government consumption. On the other hand, the contribution of net trade turned positive.
Between January and November, average employment was down by 0.3% compared with the same period of 2019, when it had increased by 1.1%. The average unemployment rate rose to 4.4%, as against 3.8% a year earlier (see Chart 1.1).
Inflation in the United Kingdom, as measured by the CPI, averaged 0.9% in 2020, half the rate of 1.8% a year earlier (see Chart 1.2). Energy price inflation turned negative, while prices for food and services grew at a slower pace. On the other hand, prices of NEIG rose at a marginally faster pace. The average annual rate of inflation based on the CPI excluding energy, food, alcohol and tobacco declined to 1.4% in 2020, from 1.7% in 2019.
During 2020, the Bank of England Monetary Policy Committee announced various measures to help busi-nesses and households bridge the economic disruption brought about by the pandemic. In March, it low-ered the bank rate on two occasions, to 0.1% – the lowest it has ever been (see Chart 1.3).2 The rate was maintained unchanged for the rest of the year. The Committee continued with the existing programme of UK government bond and sterling non-financial, investment-grade corporate bond purchases, financed by the issuance of central bank reserves, and increased the target stock of purchased UK government bonds on various occasions during 2020.
The Bank of England activated the Contingent Term Repo Facility (CTRF), aimed at alleviating frictions in money markets caused by COVID-19, which was subsequently discontinued in June as funding market conditions improved.
Furthermore, the Committee introduced a new Term Funding Scheme with added incentives for SMEs (TFSME), which was extended on various occasions during the year. It also implemented a COVID-19 Corporate Financing Facility (CCFF) on behalf of HM Treasury, to help eligible businesses bridge COVID-19 related disruption to their cash flows. The facility closed to new applications from counterparties and issuers looking to become eligible at the end of 2020. The Bank of England and HM Treasury also confirmed that the CCFF will close for new purchases of commercial paper in March 2021.
At its last meeting for the year held in December, the MPC said that it stands ready to take whatever addi-tional action is necessary to achieve its remit and that it does not intend to tighten monetary policy at least until there is clear evidence that significant progress is being made in eliminating spare capacity and achiev-ing the 2% inflation target sustainably.
2 The Bank of England’s Monetary Policy Committee maintained this rate in its meeting held in February 2021 and confirmed that the total target stock of asset purchases will remain at GBP 895.0 billion.
24
CENTRAL BANK OF MALTA Annual Report 2020
Economic and financial developments in the euro area
Euro area GDP contracts3 After having expanded by 1.3% in 2019, real GDP in the euro area shrank by 6.6% in 2020, the lowest rate ever recorded (see Table 1.2). This unprecedented contraction occurred as governments in the euro area, as in the rest of the world, implemented measures to contain the spread of COVID-19 with adverse effects on economic activity.
This contraction was largely driven by lower domestic demand. Private consumption was the main domestic demand component dampening economic activity, as it contributed a negative 4.3 percentage points to GDP growth and fell by 8.0% over the previous year. This took place amid the introduction of lockdown measures across the euro area to curb the spread of COVID-19 and a sharp fall in consumer confidence. The drop in private consumption was followed by one in GFCF, which also contracted amid disruptions to production, weak demand and elevated uncertainty, pushing GDP growth down by a further 1.8 percentage points. While changes in inventories also dampened economic activity, they did so to a lesser extent. In contrast, govern-ment consumption expanded and contributed a marginal 0.2 percentage point to GDP growth. Meanwhile, net exports reduced GDP growth by 0.4 percentage point, as exports fell faster than imports, reflecting the impact containment measures had on foreign demand as well as disruptions to supply.
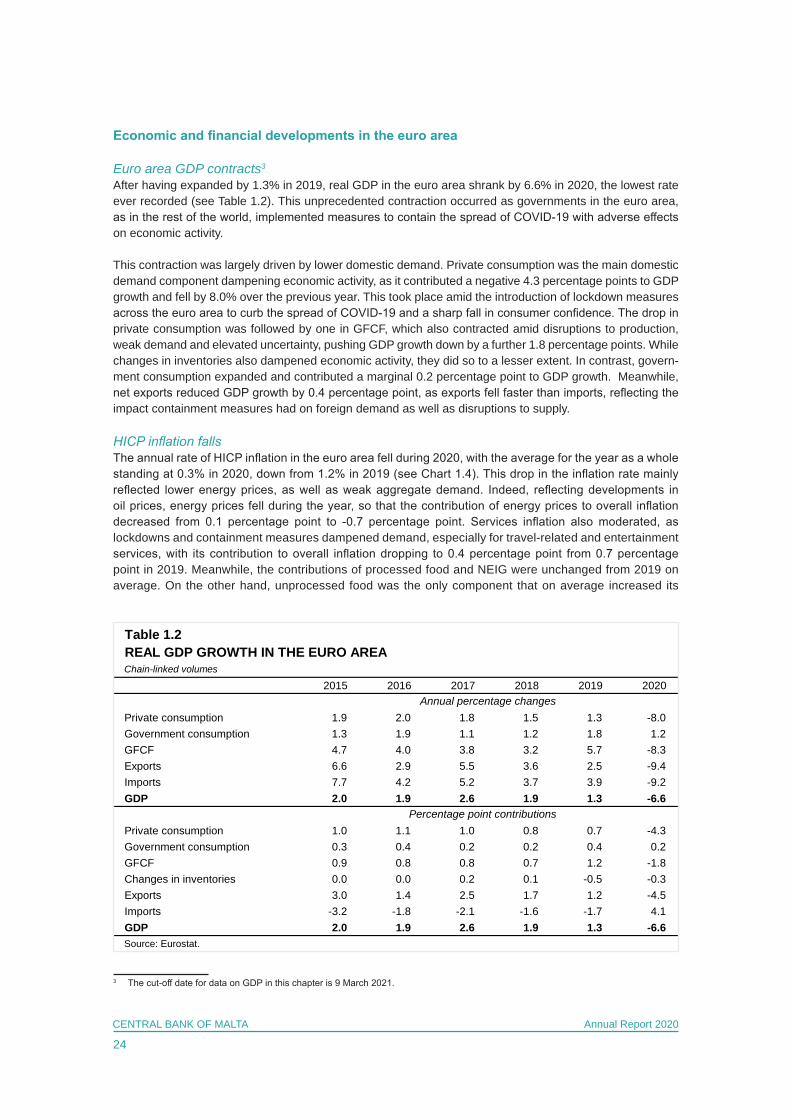
HICP inflation falls The annual rate of HICP inflation in the euro area fell during 2020, with the average for the year as a whole standing at 0.3% in 2020, down from 1.2% in 2019 (see Chart 1.4). This drop in the inflation rate mainly reflected lower energy prices, as well as weak aggregate demand. Indeed, reflecting developments in oil prices, energy prices fell during the year, so that the contribution of energy prices to overall inflation decreased from 0.1 percentage point to -0.7 percentage point. Services inflation also moderated, as lockdowns and containment measures dampened demand, especially for travel-related and entertainment services, with its contribution to overall inflation dropping to 0.4 percentage point from 0.7 percentage point in 2019. Meanwhile, the contributions of processed food and NEIG were unchanged from 2019 on average. On the other hand, unprocessed food was the only component that on average increased its
3 The cut-off date for data on GDP in this chapter is 9 March 2021.
Table 1.2REAL GDP GROWTH IN THE EURO AREAChain-linked volumes
2015 2016 2017 2018 2019 2020
Private consumption 1.9 2.0 1.8 1.5 1.3 -8.0Government consumption 1.3 1.9 1.1 1.2 1.8 1.2GFCF 4.7 4.0 3.8 3.2 5.7 -8.3Exports 6.6 2.9 5.5 3.6 2.5 -9.4Imports 7.7 4.2 5.2 3.7 3.9 -9.2GDP 2.0 1.9 2.6 1.9 1.3 -6.6
Private consumption 1.0 1.1 1.0 0.8 0.7 -4.3Government consumption 0.3 0.4 0.2 0.2 0.4 0.2GFCF 0.9 0.8 0.8 0.7 1.2 -1.8Changes in inventories 0.0 0.0 0.2 0.1 -0.5 -0.3Exports 3.0 1.4 2.5 1.7 1.2 -4.5Imports -3.2 -1.8 -2.1 -1.6 -1.7 4.1GDP 2.0 1.9 2.6 1.9 1.3 -6.6Source: Eurostat.
Annual percentage changes
Percentage point contributions
25
CENTRAL BANK OF MALTA Annual Report 2020
contribution – though marginally – as the prices of unprocessed food surged at the onset of the pandemic in the context of the various COVID-19 containment measures and supply disruptions.
The overall inflation rate hovered around 1.3% in the first two months of 2020 and started to decline in March with the onset of the COVID-19 pandemic. It then turned nega-tive in August, and edged down to -0.3% in September, a level not reached since April 2016. It remained at that level for the rest of the year.
HICP excluding energy and food inflation averaged 0.7% during 2020 as a whole, 0.3 percentage point lower than that recorded in 2019. This measure of inflation declined over the course of the year, partly as a result of a temporary reduction of the VAT rate in Germany. After hovering around 1.0% between January and July, it then dropped to 0.4% in August, before falling further to 0.2% for the remaining four months of 2020.
Labour market conditions deteriorate As a result of the COVID-19 pandemic, labour market conditions in the euro area deteriorated significantly during 2020. Nonetheless, the labour market situation would have been much worse were it not for pol-icy measures aimed at safeguarding employment by preventing redundancies and supporting workers in response to the outbreak of the pandemic.
Employment declined on average by 1.6% in 2020, compared to an average increase of 1.2% in 2019. Seasonally-adjusted data imply that during the final quarter of 2020, 3.1 million fewer people were employed in the euro area, when compared with a year earlier. Consequently, the general downward trend in unem-ployment observed in recent years came to a halt. Indeed, the seasonally-adjusted unemployment rate averaged 7.9% during the year, up from 7.6% in 2019 (see Chart 1.1). In December 2020, it stood at 8.1%, as against 7.4% a year earlier. Cross-country data show that the unemployment rate rose in most euro area countries, with the highest increase recorded in Lithuania. Nevertheless, wide disparities across countries remain, with the unemployment rate standing above 16.0% in Spain, but only 3.9% in the Netherlands at the end of the year.
ECB staff projections point towards a recovery in activity in 20214
According to the ECB staff macroeconomic projections published in March 2021, real GDP in the euro area is expected to rise by 4.0% in 2021, after contracting in 2020. Growth is set to rise slightly further to 4.1% in 2022, before moderating to 2.1% in 2023 (see Table 1.3).
Domestic demand, which was the main driver behind the contraction in 2020, is projected to be the main contributor to euro area GDP growth over the projection horizon. The contribution of net exports is expected to turn positive in 2021 and be broadly neutral thereafter.
4 The ECB staff projections were finalised on 24 February 2021 and thus do not include the Biden Administration’s American Rescue Plan which the US Congress passed on 10 March 2021, which should also have some positive spillover effects on the euro area. The cut-off date for oil prices and other technical assumptions was 16 February 2021.
-1.5
-1.0
-0.5
0.0
0.5
1.0
1.5
2.0
2.5
J2015
M M J S N J2016
M M J S N J2017
M M J S N J2018
M M J S N J2019
M M J S N J2020
M M J S N
Services (overall index excluding goods) Unprocessed foodProcessed food including alcohol and tobacco NEIGEnergy All-items HICP
Source: Eurostat.
Chart 1.4CONTRIBUTIONS TO YEAR-ON-YEAR HICP INFLATION IN THE EURO AREA(percentage points; annual percentage change)
`̀
26
CENTRAL BANK OF MALTA Annual Report 2020
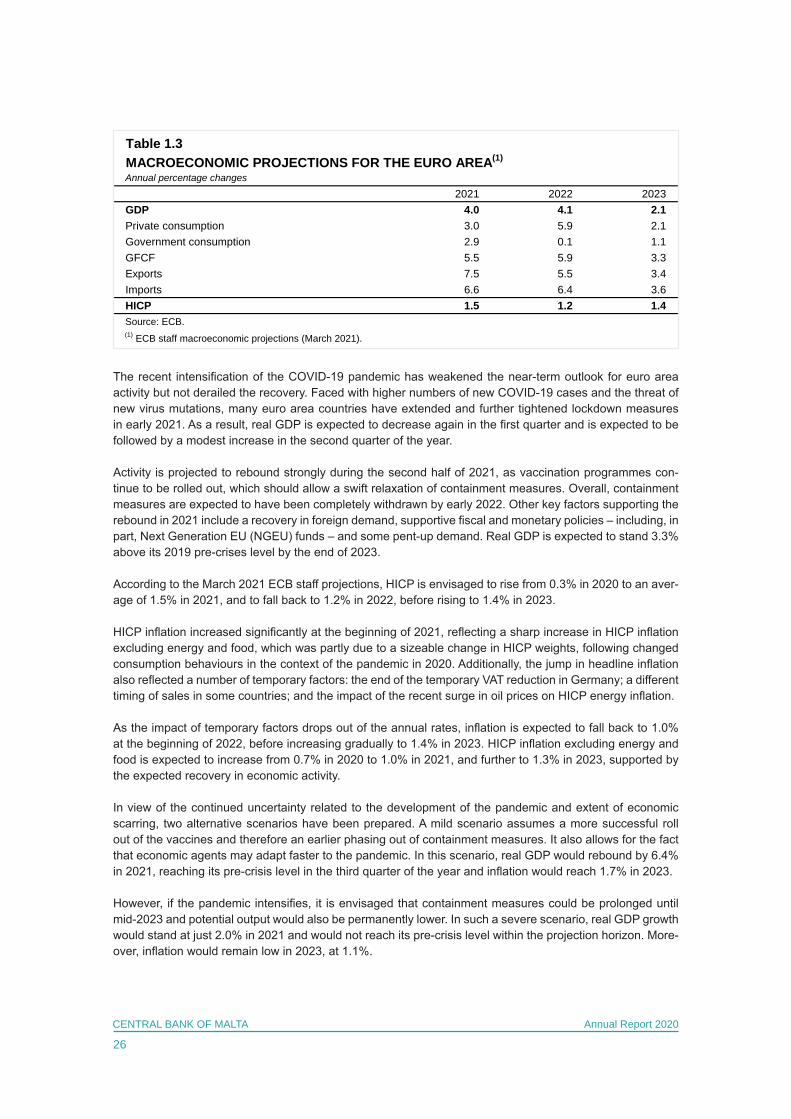
The recent intensification of the COVID-19 pandemic has weakened the near-term outlook for euro area activity but not derailed the recovery. Faced with higher numbers of new COVID-19 cases and the threat of new virus mutations, many euro area countries have extended and further tightened lockdown measures in early 2021. As a result, real GDP is expected to decrease again in the first quarter and is expected to be followed by a modest increase in the second quarter of the year.
Activity is projected to rebound strongly during the second half of 2021, as vaccination programmes con-tinue to be rolled out, which should allow a swift relaxation of containment measures. Overall, containment measures are expected to have been completely withdrawn by early 2022. Other key factors supporting the rebound in 2021 include a recovery in foreign demand, supportive fiscal and monetary policies – including, in part, Next Generation EU (NGEU) funds – and some pent-up demand. Real GDP is expected to stand 3.3% above its 2019 pre-crises level by the end of 2023.
According to the March 2021 ECB staff projections, HICP is envisaged to rise from 0.3% in 2020 to an aver-age of 1.5% in 2021, and to fall back to 1.2% in 2022, before rising to 1.4% in 2023.
HICP inflation increased significantly at the beginning of 2021, reflecting a sharp increase in HICP inflation excluding energy and food, which was partly due to a sizeable change in HICP weights, following changed consumption behaviours in the context of the pandemic in 2020. Additionally, the jump in headline inflation also reflected a number of temporary factors: the end of the temporary VAT reduction in Germany; a different timing of sales in some countries; and the impact of the recent surge in oil prices on HICP energy inflation.
As the impact of temporary factors drops out of the annual rates, inflation is expected to fall back to 1.0% at the beginning of 2022, before increasing gradually to 1.4% in 2023. HICP inflation excluding energy and food is expected to increase from 0.7% in 2020 to 1.0% in 2021, and further to 1.3% in 2023, supported by the expected recovery in economic activity.
In view of the continued uncertainty related to the development of the pandemic and extent of economic scarring, two alternative scenarios have been prepared. A mild scenario assumes a more successful roll out of the vaccines and therefore an earlier phasing out of containment measures. It also allows for the fact that economic agents may adapt faster to the pandemic. In this scenario, real GDP would rebound by 6.4% in 2021, reaching its pre-crisis level in the third quarter of the year and inflation would reach 1.7% in 2023.
However, if the pandemic intensifies, it is envisaged that containment measures could be prolonged until mid-2023 and potential output would also be permanently lower. In such a severe scenario, real GDP growth would stand at just 2.0% in 2021 and would not reach its pre-crisis level within the projection horizon. More-over, inflation would remain low in 2023, at 1.1%.
Table 1.3MACROECONOMIC PROJECTIONS FOR THE EURO AREA(1)
Annual percentage changes
2021 2022 2023GDP 4.0 4.1 2.1Private consumption 3.0 5.9 2.1Government consumption 2.9 0.1 1.1GFCF 5.5 5.9 3.3Exports 7.5 5.5 3.4Imports 6.6 6.4 3.6HICP 1.5 1.2 1.4Source: ECB.(1) ECB staff macroeconomic projections (March 2021).

27
CENTRAL BANK OF MALTA Annual Report 2020
In both scenarios, monetary, fiscal and prudential policies are assumed to be effective in containing very severe financial amplification effects.
ECB reinforces its accommodative monetary policy stanceThe ECB’s Governing Council eased its monetary policy stance during 2020. The interest rates on the MROs, on the marginal lending facility and on the deposit facility were held unchanged at 0.00%, 0.25%, and -0.50% respectively throughout the year (see Chart 1.3). Furthermore, the Governing Council reiterated that it expects the key ECB interest rates to remain at their present or lower levels until it has seen the inflation outlook robustly converge to a level sufficiently close to, but below, 2% within its projection horizon, and such convergence has been consistently reflected in underlying inflation dynamics. It also reiterated its intention to reinvest in full the principal payments from maturing securities under the APP for an extended period of time past the date when it starts raising the key ECB interest rates and in any case for as long as necessary to maintain favourable liquidity conditions and an ample degree of monetary accommodation.
On 12 March, as part of its attempt to combat the economic disruption and heightened uncertainty brought about by the pandemic, the Governing Council announced a package of monetary policy measures. These included additional longer-term refinancing operations (LTROs) to provide immediate liquidity to the euro area financial system until the TLTRO-III in June 2020. The Governing Council also announced that consid-erably more favourable terms will be applied during the period from June 2020 to June 2021 to all TLTRO-III operations outstanding during that time. This measure is aimed at supporting bank lending to those mostly affected by COVID-19. Lastly, the Governing Council also stated that a temporary envelope of additional net asset purchases of €120.0 billion would be added until the end of the year. These measures are aimed at supporting favourable financing conditions for the real economy and at ensuring the smooth provision of credit.
With the pandemic spreading rapidly and financial markets showing high volatility, on 18 March, the Govern-ing Council also decided to launch a new temporary asset purchase programme of private and public sector securities to counter the serious risks to the monetary policy transmission mechanism and the outlook for the euro area posed by the pandemic. The PEPP was launched with an initial overall envelope of €750.0 billion. Purchases were to be conducted until the end of 2020 and were to include all the asset categories eligible under the existing APP. In addition, the Governing Council decided to expand the range of eligible assets under the CSPP to include non-financial commercial paper. It also eased the collateral standards by adjusting the main risk parameters of the collateral framework.
On 30 April, to continue supporting the euro area economy in the face of economic disruption and height-ened uncertainty, the Governing Council announced an additional package of monetary policy measures. These included a further easing of the conditions on the TLTRO III – especially by reducing the interest rates on these operations during the period from June 2020 to June 2021 and the launching of a new series of seven non-targeted PELTROs. The interest rate on these operations will be 25 basis points below the aver-age rate on the MROs prevailing over the life of each PELTRO.
On 4 June, the Governing Council also decided to increase the envelope for the PEPP by €600.0 billion to a total of €1,350.0 billion. In addition, the horizon for net purchases under the PEPP was extended to at least the end of June 2021. It also announced that the maturing principal payments from securities purchased under the PEPP will be reinvested at least until the end of 2022.
On 10 December, the Governing Council introduced several monetary policy measures to contribute to preserving favourable financing conditions over the pandemic period, thereby supporting the flow of credit to all sectors of the economy, underpinning economic activity and safeguarding medium-term price stability.
28
CENTRAL BANK OF MALTA Annual Report 2020
These included increasing the envelope of the PEPP by €500.0 billion to a total of €1,850.0 billion and extending the horizon for net purchases under the PEPP to at least the end of March 2022. The Governing Council also decided to extend the reinvestment of principal payments from maturing securities purchased under the PEPP until at least the end of 2023.
In addition, the Governing Council further recalibrated the conditions of the TLTRO III. Specifically, it decided to extend the period over which considerably more favourable terms will apply by 12 months to June 2022. Three additional operations will also be conducted between June and December 2021. Moreover, the Gov-erning Council decided to raise the total amount that counterparties will be entitled to borrow in these opera-tions from 50% to 55% of their stock of eligible loans.
Moreover, the Governing Council decided to extend the duration of the set of collateral easing measures it had adopted in April until June 2022. It also decided to offer four additional PELTROs in 2021 to provide an effective liquidity backstop. The Eurosystem repo facility for central banks (EUREP) and all temporary swap and repo lines with non-euro area central banks were extended until March 2022.5
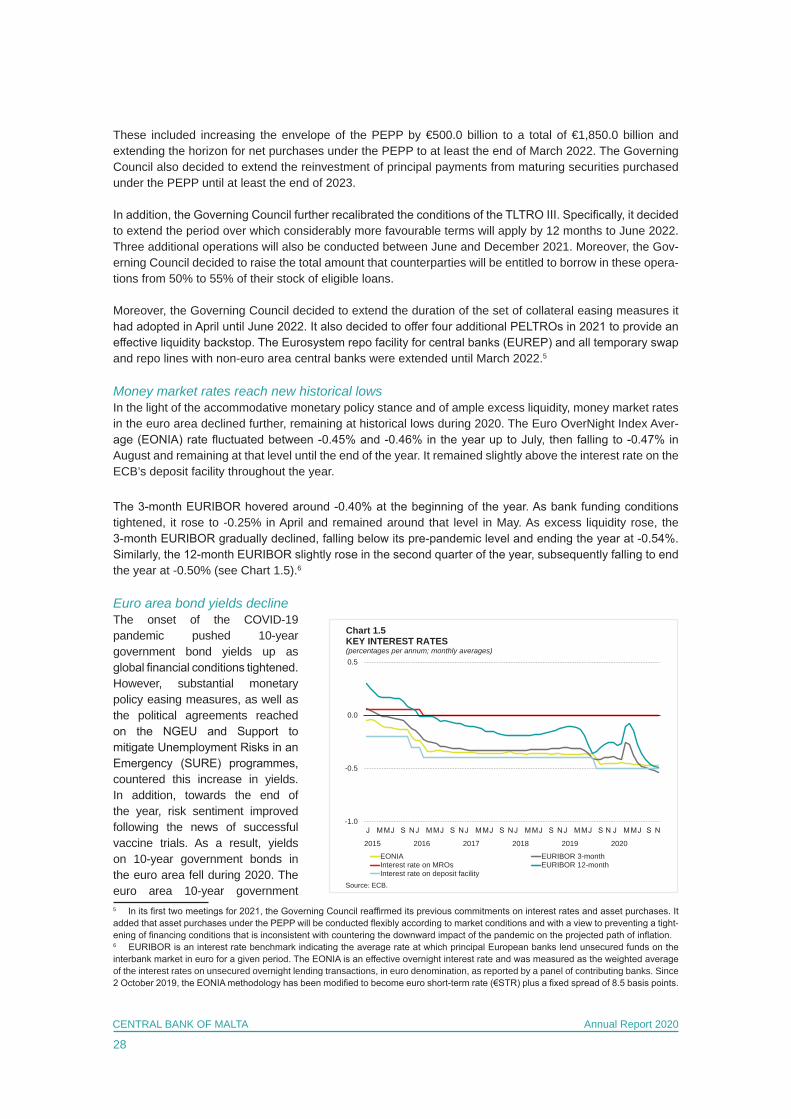
Money market rates reach new historical lowsIn the light of the accommodative monetary policy stance and of ample excess liquidity, money market rates in the euro area declined further, remaining at historical lows during 2020. The Euro OverNight Index Aver-age (EONIA) rate fluctuated between -0.45% and -0.46% in the year up to July, then falling to -0.47% in August and remaining at that level until the end of the year. It remained slightly above the interest rate on the ECB’s deposit facility throughout the year.
The 3-month EURIBOR hovered around -0.40% at the beginning of the year. As bank funding conditions tightened, it rose to -0.25% in April and remained around that level in May. As excess liquidity rose, the 3-month EURIBOR gradually declined, falling below its pre-pandemic level and ending the year at -0.54%. Similarly, the 12-month EURIBOR slightly rose in the second quarter of the year, subsequently falling to end the year at -0.50% (see Chart 1.5).6
Euro area bond yields declineThe onset of the COVID-19 pandemic pushed 10-year government bond yields up as global financial conditions tightened. However, substantial monetary policy easing measures, as well as the political agreements reached on the NGEU and Support to mitigate Unemployment Risks in an Emergency (SURE) programmes, countered this increase in yields. In addition, towards the end of the year, risk sentiment improved following the news of successful vaccine trials. As a result, yields on 10-year government bonds in the euro area fell during 2020. The euro area 10-year government 5 In its first two meetings for 2021, the Governing Council reaffirmed its previous commitments on interest rates and asset purchases. It added that asset purchases under the PEPP will be conducted flexibly according to market conditions and with a view to preventing a tight-ening of financing conditions that is inconsistent with countering the downward impact of the pandemic on the projected path of inflation.6 EURIBOR is an interest rate benchmark indicating the average rate at which principal European banks lend unsecured funds on the interbank market in euro for a given period. The EONIA is an effective overnight interest rate and was measured as the weighted average of the interest rates on unsecured overnight lending transactions, in euro denomination, as reported by a panel of contributing banks. Since 2 October 2019, the EONIA methodology has been modified to become euro short-term rate (€STR) plus a fixed spread of 8.5 basis points.
-1.0
-0.5
0.0
0.5
2015 2016 2017 2018 2019 2020
EONIA EURIBOR 3-monthInterest rate on MROs EURIBOR 12-monthInterest rate on deposit facility
Chart 1.5KEY INTEREST RATES (percentages per annum; monthly averages)
Source: ECB.
29
CENTRAL BANK OF MALTA Annual Report 2020
benchmark bond yield decreased from 0.37% in December 2019 to -0.09% in December 2020.
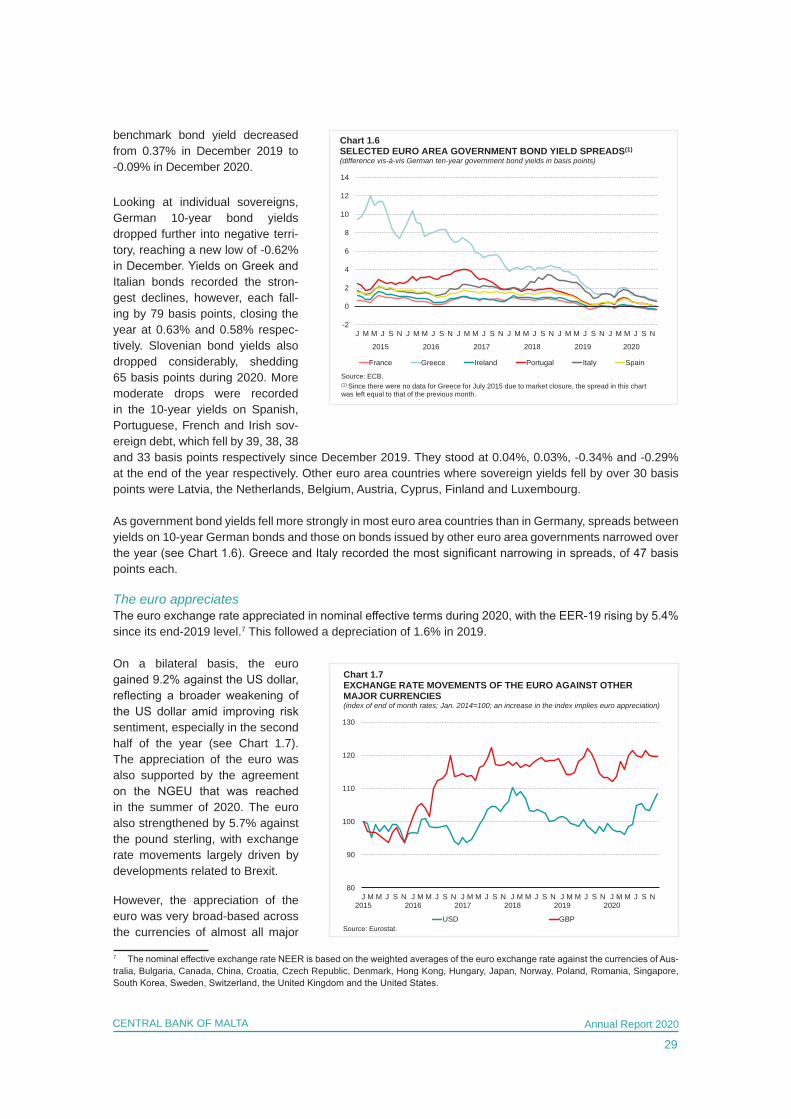
Looking at individual sovereigns, German 10-year bond yields dropped further into negative terri-tory, reaching a new low of -0.62% in December. Yields on Greek and Italian bonds recorded the stron-gest declines, however, each fall-ing by 79 basis points, closing the year at 0.63% and 0.58% respec-tively. Slovenian bond yields also dropped considerably, shedding 65 basis points during 2020. More moderate drops were recorded in the 10-year yields on Spanish, Portuguese, French and Irish sov-ereign debt, which fell by 39, 38, 38 and 33 basis points respectively since December 2019. They stood at 0.04%, 0.03%, -0.34% and -0.29% at the end of the year respectively. Other euro area countries where sovereign yields fell by over 30 basis points were Latvia, the Netherlands, Belgium, Austria, Cyprus, Finland and Luxembourg.
As government bond yields fell more strongly in most euro area countries than in Germany, spreads between yields on 10-year German bonds and those on bonds issued by other euro area governments narrowed over the year (see Chart 1.6). Greece and Italy recorded the most significant narrowing in spreads, of 47 basis points each.
The euro appreciates The euro exchange rate appreciated in nominal effective terms during 2020, with the EER-19 rising by 5.4% since its end-2019 level.7 This followed a depreciation of 1.6% in 2019.
On a bilateral basis, the euro gained 9.2% against the US dollar, reflecting a broader weakening of the US dollar amid improving risk sentiment, especially in the second half of the year (see Chart 1.7). The appreciation of the euro was also supported by the agreement on the NGEU that was reached in the summer of 2020. The euro also strengthened by 5.7% against the pound sterling, with exchange rate movements largely driven by developments related to Brexit. However, the appreciation of the euro was very broad-based across the currencies of almost all major
7 The nominal effective exchange rate NEER is based on the weighted averages of the euro exchange rate against the currencies of Aus-tralia, Bulgaria, Canada, China, Croatia, Czech Republic, Denmark, Hong Kong, Hungary, Japan, Norway, Poland, Romania, Singapore, South Korea, Sweden, Switzerland, the United Kingdom and the United States.
-2
0
2
4
6
8
10
12
14
J M M J S N J M M J S N J M M J S N J M M J S N J M M J S N J M M J S N
2015 2016 2017 2018 2019 2020
France Greece Ireland Portugal Italy Spain
Chart 1.6SELECTED EURO AREA GOVERNMENT BOND YIELD SPREADS(1)
(difference vis-à-vis German ten-year government bond yields in basis points)
(1) Since there were no data for Greece for July 2015 due to market closure, the spread in this chart was left equal to that of the previous month.
Source: ECB.
80
90
100
110
120
130
J2015
M M J S N J2016
M M J S N J2017
M M J S N J2018
M M J S N J2019
M M J S N J2020
M M J S N
USD GBP
Chart 1.7 EXCHANGE RATE MOVEMENTS OF THE EURO AGAINST OTHER MAJOR CURRENCIES(index of end of month rates; Jan. 2014=100; an increase in the index implies euro appreciation)
Source: Eurostat.
30
CENTRAL BANK OF MALTA Annual Report 2020
trading partners of the euro area. This, in particular, largely reflected a strengthening against the currencies of countries that were more heavily affected by the economic and financial market impact of the COVID-19 pandemic. Over the year as a whole, the euro gained significant ground against a number of other curren-cies, including the Japanese yen, the Hong Kong dollar, the Hungarian forint, the Singapore dollar, the Cana-dian dollar, the Norwegian krone and the Polish zloty. To a lesser extent, it weakened against the Swedish krona and the Swiss franc.
Commodities
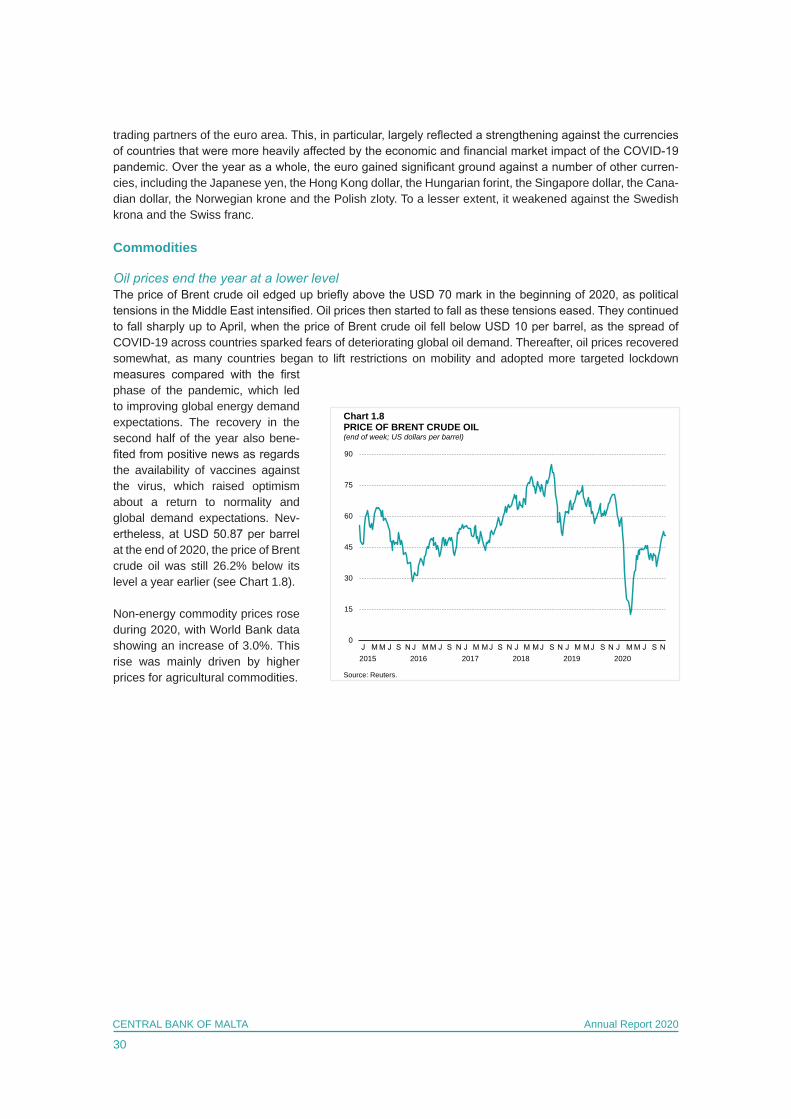
Oil prices end the year at a lower levelThe price of Brent crude oil edged up briefly above the USD 70 mark in the beginning of 2020, as political tensions in the Middle East intensified. Oil prices then started to fall as these tensions eased. They continued to fall sharply up to April, when the price of Brent crude oil fell below USD 10 per barrel, as the spread of COVID-19 across countries sparked fears of deteriorating global oil demand. Thereafter, oil prices recovered somewhat, as many countries began to lift restrictions on mobility and adopted more targeted lockdown measures compared with the first phase of the pandemic, which led to improving global energy demand expectations. The recovery in the second half of the year also bene-fited from positive news as regards the availability of vaccines against the virus, which raised optimism about a return to normality and global demand expectations. Nev-ertheless, at USD 50.87 per barrel at the end of 2020, the price of Brent crude oil was still 26.2% below its level a year earlier (see Chart 1.8).
Non-energy commodity prices rose during 2020, with World Bank data showing an increase of 3.0%. This rise was mainly driven by higher prices for agricultural commodities.
0
15
30
45
60
75
90
2015 2016 2017 2018 2019 2020
Chart 1.8PRICE OF BRENT CRUDE OIL(end of week; US dollars per barrel)
Source: Reuters.

31
CENTRAL BANK OF MALTA Annual Report 2020
2. MONETARY AND FINANCIAL DEVELOPMENTS
According to the Bank’s Financial Conditions Index (FCI), in 2020 financing conditions tightened significantly when compared to 2019, though they were still more favourable compared to the GFC.
The total assets of domestic monetary financial institutions (MFI) in Malta rose during 2020, contrasting with a drop in the asset holdings of international banks. Meanwhile, Maltese residents’ deposits contin-ued to expand, remaining the main source of funding for resident MFIs. The shift away from longer-term deposits towards more liquid overnight deposits persisted in an environment of very low interest rates. Meanwhile, growth in credit to residents expanded further, driven by robust growth in credit to general gov-ernment, and a somewhat more modest increase in credit to the private sector. Lending to households rose at a slower pace, reflecting moderating growth in loans for house purchases, while lending to non-financial corporations (NFCs) grew at a faster pace, partly aided by the extension of credit in terms of the MDB CGS. Compared with 2019, NFCs’ net issuance of corporate debt turned negative as elevated uncertainty in the context of the pandemic put several investment plans on hold. By contrast, net issuance of MGS increased substantially, as the Government sought to raise funding to finance fiscal support introduced in response to the pandemic.
Interest rates on both deposits and loans to Maltese residents fell slightly during the year, with the spread remaining broadly stable, albeit at elevated levels compared with the euro area.
In the primary market, domestic yields fell during 2020. Similarly, yields on 5-year and 10-year Maltese government bonds decreased, mirroring downward movements in the corresponding euro area yields. In the equity market, the Malta Stock Exchange (MSE) Equity Price Index fell when compared with the level registered at the end of December 2019.
The outstanding amount of loans subject to a moratorium peaked in July at €1.8 billion, or 15.9% of total loans outstanding to Maltese residents. It started to decline thereafter, which suggests that some busi-nesses and households have recommenced regular loan repayments as containment measures were relaxed and economic activity resumed. By the end of the year, there were €695.9 million in loans covered by moratoria, with more than half of covered amounts held in the accommodation and food services activi-ties sector, and real estate. Meanwhile, firms’ recourse to guarantees in terms of the MDB CGS continued to increase throughout the year, with sanctioned amounts under this scheme reaching €408.1 million at the end of December.
Financial conditions
FCI drops sharplyThe Bank monitors domestic financial conditions through a summary measure which combines a number of domestic and international financial variables that influence economic activity.1
Financial conditions in 2020 weakened significantly when compared with 2019. This primarily reflected a deterioration in domestic factors, although foreign influences also contributed to the tightening of financial 1 The analysis in this section is based on the Bank’s FCI, as described in Micallef, B., and Borg, I., “A Financial Conditions Index for the Maltese Economy”, in Grech, A.G., & Zerafa, S. (eds.), Challenges and Opportunities of Sustainable Economic Growth: the case of Malta, Central Bank of Malta, 2017, and later updated in the Central Bank of Malta – Annual Report 2017.
32
CENTRAL BANK OF MALTA Annual Report 2020
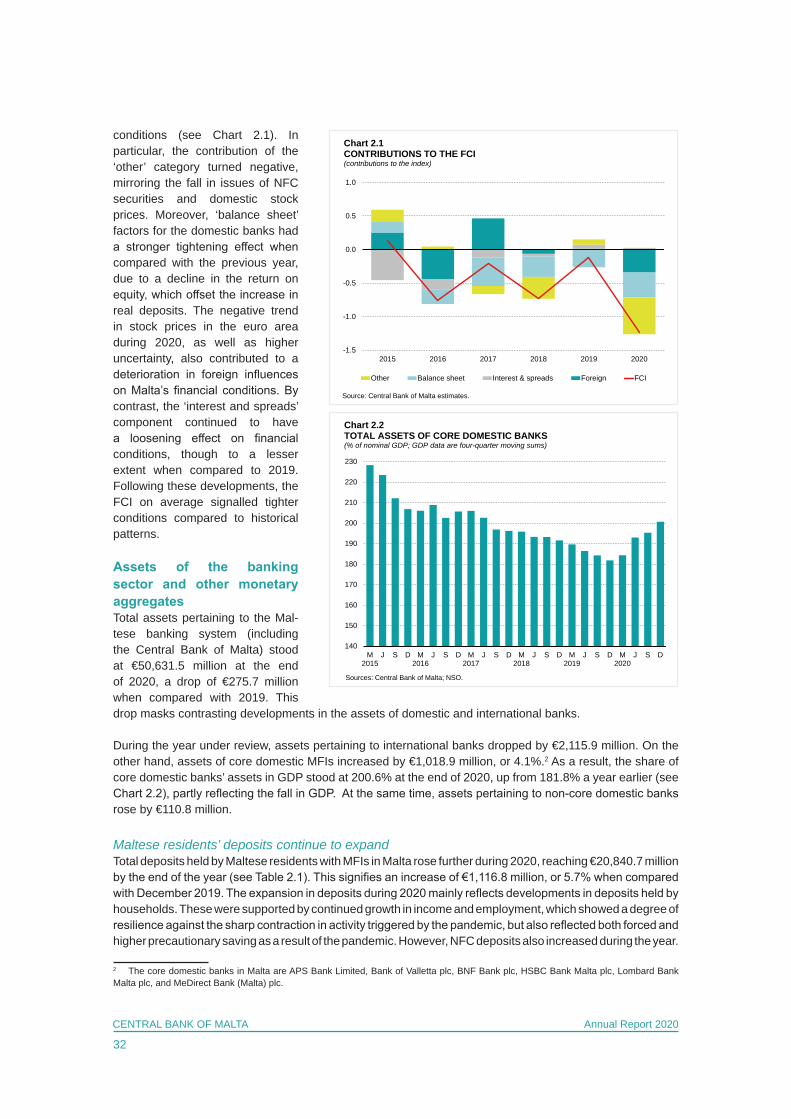
conditions (see Chart 2.1). In particular, the contribution of the ‘other’ category turned negative, mirroring the fall in issues of NFC securities and domestic stock prices. Moreover, ‘balance sheet’ factors for the domestic banks had a stronger tightening effect when compared with the previous year, due to a decline in the return on equity, which offset the increase in real deposits. The negative trend in stock prices in the euro area during 2020, as well as higher uncertainty, also contributed to a deterioration in foreign influences on Malta’s financial conditions. By contrast, the ‘interest and spreads’ component continued to have a loosening effect on financial conditions, though to a lesser extent when compared to 2019. Following these developments, the FCI on average signalled tighter conditions compared to historical patterns.
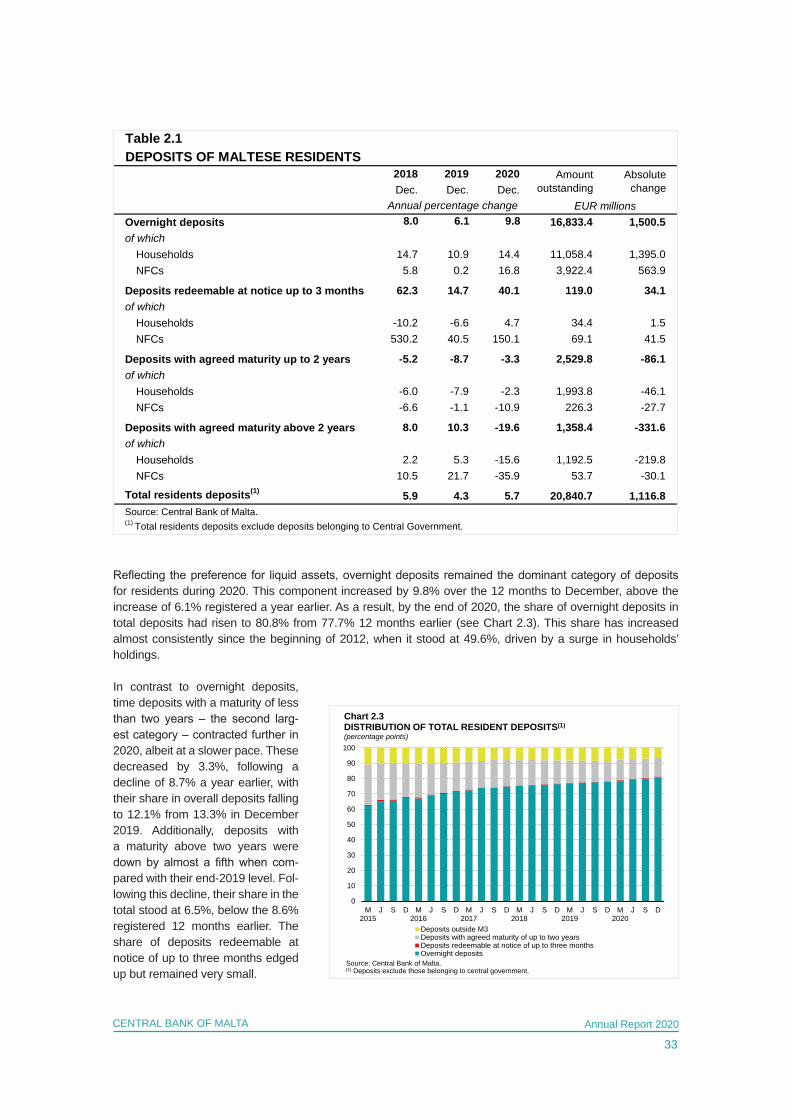
Assets of the banking sector and other monetary aggregatesTotal assets pertaining to the Mal-tese banking system (including the Central Bank of Malta) stood at €50,631.5 million at the end of 2020, a drop of €275.7 million when compared with 2019. This drop masks contrasting developments in the assets of domestic and international banks.
During the year under review, assets pertaining to international banks dropped by €2,115.9 million. On the other hand, assets of core domestic MFIs increased by €1,018.9 million, or 4.1%.2 As a result, the share of core domestic banks’ assets in GDP stood at 200.6% at the end of 2020, up from 181.8% a year earlier (see Chart 2.2), partly reflecting the fall in GDP. At the same time, assets pertaining to non-core domestic banks rose by €110.8 million.
Maltese residents’ deposits continue to expandTotal deposits held by Maltese residents with MFIs in Malta rose further during 2020, reaching €20,840.7 million by the end of the year (see Table 2.1). This signifies an increase of €1,116.8 million, or 5.7% when compared with December 2019. The expansion in deposits during 2020 mainly reflects developments in deposits held by households. These were supported by continued growth in income and employment, which showed a degree of resilience against the sharp contraction in activity triggered by the pandemic, but also reflected both forced and higher precautionary saving as a result of the pandemic. However, NFC deposits also increased during the year.
2 The core domestic banks in Malta are APS Bank Limited, Bank of Valletta plc, BNF Bank plc, HSBC Bank Malta plc, Lombard Bank Malta plc, and MeDirect Bank (Malta) plc.
-1.5
-1.0
-0.5
0.0
0.5
1.0
2015 2016 2017 2018 2019 2020
Chart 2.1CONTRIBUTIONS TO THE FCI(contributions to the index)
Other Balance sheet Interest & spreads Foreign FCI
Source: Central Bank of Malta estimates.
140
150
160
170
180
190
200
210
220
230
M2015
J S D M2016
J S D M2017
J S D M2018
J S D M2019
J S D M2020
J S D
Sources: Central Bank of Malta; NSO.
Chart 2.2TOTAL ASSETS OF CORE DOMESTIC BANKS (% of nominal GDP; GDP data are four-quarter moving sums)
33
CENTRAL BANK OF MALTA Annual Report 2020
Reflecting the preference for liquid assets, overnight deposits remained the dominant category of deposits for residents during 2020. This component increased by 9.8% over the 12 months to December, above the increase of 6.1% registered a year earlier. As a result, by the end of 2020, the share of overnight deposits in total deposits had risen to 80.8% from 77.7% 12 months earlier (see Chart 2.3). This share has increased almost consistently since the beginning of 2012, when it stood at 49.6%, driven by a surge in households’ holdings.
In contrast to overnight deposits, time deposits with a maturity of less than two years – the second larg-est category – contracted further in 2020, albeit at a slower pace. These decreased by 3.3%, following a decline of 8.7% a year earlier, with their share in overall deposits falling to 12.1% from 13.3% in December 2019. Additionally, deposits with a maturity above two years were down by almost a fifth when com-pared with their end-2019 level. Fol-lowing this decline, their share in the total stood at 6.5%, below the 8.6% registered 12 months earlier. The share of deposits redeemable at notice of up to three months edged up but remained very small.
Table 2.1
2018 2019 2020Dec. Dec. Dec.
Overnight deposits 8.0 6.1 9.8 16,833.4 1,500.5of which
Households 14.7 10.9 14.4 11,058.4 1,395.0NFCs 5.8 0.2 16.8 3,922.4 563.9
Deposits redeemable at notice up to 3 months 62.3 14.7 40.1 119.0 34.1of which
Households -10.2 -6.6 4.7 34.4 1.5NFCs 530.2 40.5 150.1 69.1 41.5
Deposits with agreed maturity up to 2 years -5.2 -8.7 -3.3 2,529.8 -86.1of which
Households -6.0 -7.9 -2.3 1,993.8 -46.1NFCs -6.6 -1.1 -10.9 226.3 -27.7
Deposits with agreed maturity above 2 years 8.0 10.3 -19.6 1,358.4 -331.6of which
Households 2.2 5.3 -15.6 1,192.5 -219.8NFCs 10.5 21.7 -35.9 53.7 -30.1
Total residents deposits(1) 5.9 4.3 5.7 20,840.7 1,116.8Source: Central Bank of Malta.(1) Total residents deposits exclude deposits belonging to Central Government.
DEPOSITS OF MALTESE RESIDENTSAmount
outstandingAbsolute
changeAnnual percentage change EUR millions
0
10
20
30
40
50
60
70
80
90
100
M2015
J S D M2016
J S D M2017
J S D M2018
J S D M2019
J S D M2020
J S D
Chart 2.3DISTRIBUTION OF TOTAL RESIDENT DEPOSITS(1)
(percentage points)
Deposits outside M3Deposits with agreed maturity of up to two yearsDeposits redeemable at notice of up to three monthsOvernight deposits
Source: Central Bank of Malta.(1) Deposits exclude those belonging to central government.
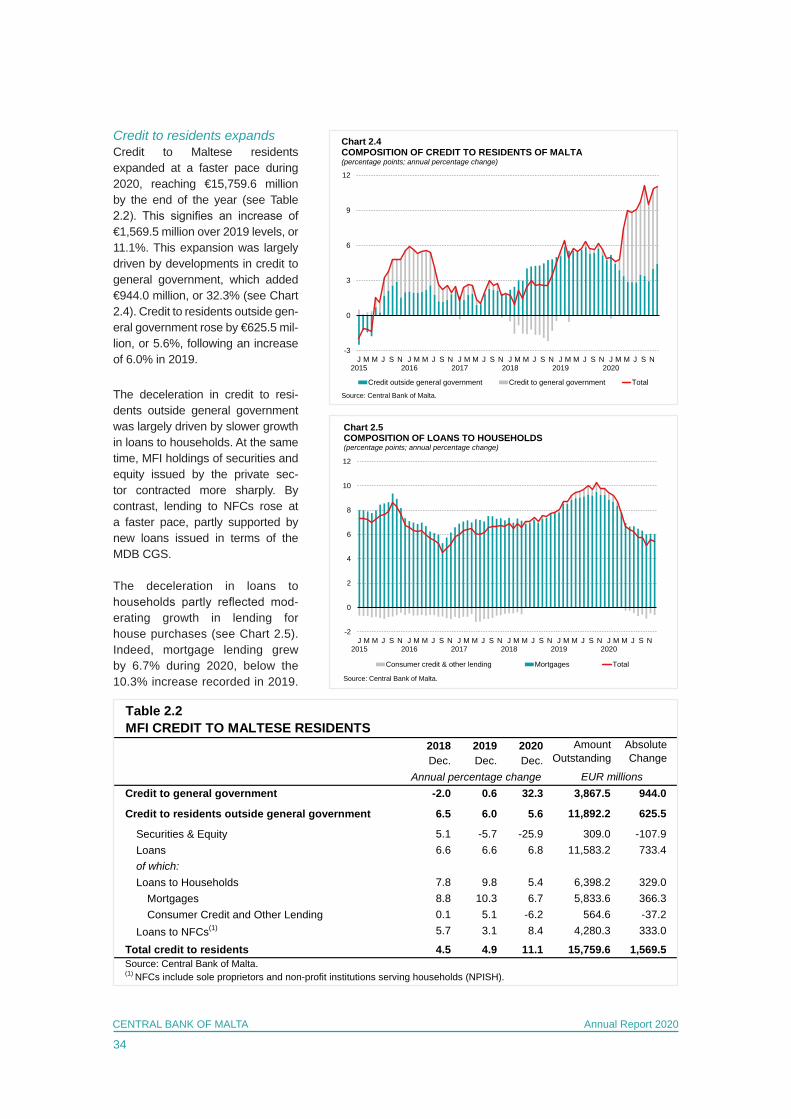
34
CENTRAL BANK OF MALTA Annual Report 2020
Credit to residents expands Credit to Maltese residents expanded at a faster pace during 2020, reaching €15,759.6 million by the end of the year (see Table 2.2). This signifies an increase of €1,569.5 million over 2019 levels, or 11.1%. This expansion was largely driven by developments in credit to general government, which added €944.0 million, or 32.3% (see Chart 2.4). Credit to residents outside gen-eral government rose by €625.5 mil-lion, or 5.6%, following an increase of 6.0% in 2019.
The deceleration in credit to resi-dents outside general government was largely driven by slower growth in loans to households. At the same time, MFI holdings of securities and equity issued by the private sec-tor contracted more sharply. By contrast, lending to NFCs rose at a faster pace, partly supported by new loans issued in terms of the MDB CGS. The deceleration in loans to households partly reflected mod-erating growth in lending for house purchases (see Chart 2.5). Indeed, mortgage lending grew by 6.7% during 2020, below the 10.3% increase recorded in 2019.
Table 2.2MFI CREDIT TO MALTESE RESIDENTS
2018 2019 2020Dec. Dec. Dec.
Credit to general government -2.0 0.6 32.3 3,867.5 944.0
Credit to residents outside general government 6.5 6.0 5.6 11,892.2 625.5
Securities & Equity 5.1 -5.7 -25.9 309.0 -107.9Loans 6.6 6.6 6.8 11,583.2 733.4of which: Loans to Households 7.8 9.8 5.4 6,398.2 329.0
Mortgages 8.8 10.3 6.7 5,833.6 366.3Consumer Credit and Other Lending 0.1 5.1 -6.2 564.6 -37.2
Loans to NFCs(1) 5.7 3.1 8.4 4,280.3 333.0
Total credit to residents 4.5 4.9 11.1 15,759.6 1,569.5Source: Central Bank of Malta.(1) NFCs include sole proprietors and non-profit institutions serving households (NPISH).
Amount Outstanding
Absolute Change
Annual percentage change EUR millions
-3
0
3
6
9
12
J2015
M M J S N J2016
M M J S N J2017
M M J S N J2018
M M J S N J2019
M M J S N J2020
M M J S N
Credit outside general government Credit to general government Total
Chart 2.4COMPOSITION OF CREDIT TO RESIDENTS OF MALTA(percentage points; annual percentage change)
Source: Central Bank of Malta.
-2
0
2
4
6
8
10
12
J2015
M M J S N J2016
M M J S N J2017
M M J S N J2018
M M J S N J2019
M M J S N J2020
M M J S N
Consumer credit & other lending Mortgages Total
Chart 2.5COMPOSITION OF LOANS TO HOUSEHOLDS(percentage points; annual percentage change)
Source: Central Bank of Malta.
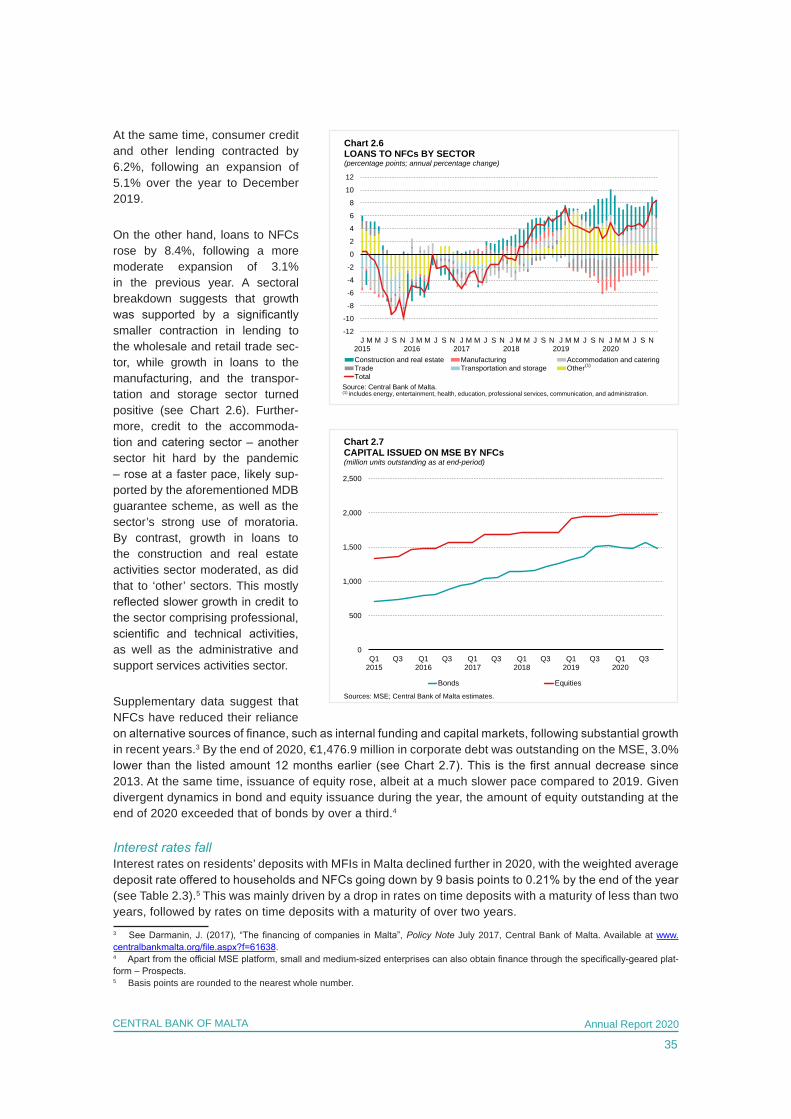
35
CENTRAL BANK OF MALTA Annual Report 2020
At the same time, consumer credit and other lending contracted by 6.2%, following an expansion of 5.1% over the year to December 2019.
On the other hand, loans to NFCs rose by 8.4%, following a more moderate expansion of 3.1% in the previous year. A sectoral breakdown suggests that growth was supported by a significantly smaller contraction in lending to the wholesale and retail trade sec-tor, while growth in loans to the manufacturing, and the transpor-tation and storage sector turned positive (see Chart 2.6). Further-more, credit to the accommoda-tion and catering sector – another sector hit hard by the pandemic – rose at a faster pace, likely sup-ported by the aforementioned MDB guarantee scheme, as well as the sector’s strong use of moratoria. By contrast, growth in loans to the construction and real estate activities sector moderated, as did that to ‘other’ sectors. This mostly reflected slower growth in credit to the sector comprising professional, scientific and technical activities, as well as the administrative and support services activities sector.
Supplementary data suggest that NFCs have reduced their reliance on alternative sources of finance, such as internal funding and capital markets, following substantial growth in recent years.3 By the end of 2020, €1,476.9 million in corporate debt was outstanding on the MSE, 3.0% lower than the listed amount 12 months earlier (see Chart 2.7). This is the first annual decrease since 2013. At the same time, issuance of equity rose, albeit at a much slower pace compared to 2019. Given divergent dynamics in bond and equity issuance during the year, the amount of equity outstanding at the end of 2020 exceeded that of bonds by over a third.4
Interest rates fallInterest rates on residents’ deposits with MFIs in Malta declined further in 2020, with the weighted average deposit rate offered to households and NFCs going down by 9 basis points to 0.21% by the end of the year (see Table 2.3).5 This was mainly driven by a drop in rates on time deposits with a maturity of less than two years, followed by rates on time deposits with a maturity of over two years. 3 See Darmanin, J. (2017), “The financing of companies in Malta”, Policy Note July 2017, Central Bank of Malta. Available at www.centralbankmalta.org/file.aspx?f=61638.4 Apart from the official MSE platform, small and medium-sized enterprises can also obtain finance through the specifically-geared plat-form – Prospects.5 Basis points are rounded to the nearest whole number.
-12
-10
-8
-6
-4
-2
0
2
4
6
8
10
12
J2015
M M J S N J2016
M M J S N J2017
M M J S N J2018
M M J S N J2019
M M J S N J2020
M M J S N
Construction and real estate Manufacturing Accommodation and cateringTrade Transportation and storage OtherTotal
Chart 2.6LOANS TO NFCs BY SECTOR(percentage points; annual percentage change)
Source: Central Bank of Malta.(1) includes energy, entertainment, health, education, professional services, communication, and administration.
(1)
0
500
1,000
1,500
2,000
2,500
Q12015
Q3 Q12016
Q3 Q12017
Q3 Q12018
Q3 Q12019
Q3 Q12020
Q3
Bonds Equities
Chart 2.7CAPITAL ISSUED ON MSE BY NFCs(million units outstanding as at end-period)
Sources: MSE; Central Bank of Malta estimates.

36
CENTRAL BANK OF MALTA Annual Report 2020
Meanwhile, the weighted average lending rate paid by households and NFCs to resident MFIs fell by 10 basis points, reaching 3.36%. The largest decline was registered in rates paid by NFCs, though these remained above those charged to households, possibly reflecting differences in credit risk. As regards household loans, the lending rate on consumer credit and other lending decreased more strongly than that on mortgages.
The spread between the weighted average lending rate and the deposit rate closed the year under review at 315 basis points, marginally below the 316 basis points recorded at the end of 2019.
Liquidity support measures related to COVID-19In response to the COVID-19 pandemic and subsequent containment measures, the Central Bank of Malta issued Directive No.18 in order to regulate the moratorium on credit facilities in exceptional cir-cumstances. The Directive regulates the temporary suspension of debt repayment on credit facilities advanced by credit institutions to borrowers prior to 14 April 2020.6 A number of businesses and house-holds that were faced with liquidity challenges applied with MFIs in Malta for a moratorium on loan repay-ments (see Table 2.4).7 6 This Directive was issued in consultation with the MFSA and the Malta Bankers’ Association (MBA) and entered into force on 13 April 2020. A number of banks had already started to provide moratorium facilities voluntarily in March 2020. In view of the protracted impact of the COVID-19 pandemic, on 14 January 2021, the Minister for Health, in consultation with the Ministry for Finance issued Legal Notice (LN) 15 of 2021 on ‘Moratorium on Credit Facilities in Exceptional Circumstances’, which relates to the reactivation of moratoria in Malta. This reactivation allows borrowers to submit their applications for new moratoria or to extend their existing moratoria subject to a number of conditions, before 31 March 2021.7 Data on moratoria include both pre and post the Legal Notice 142 of 2020 on the Moratorium on Credit Facilities Regulations in Exceptional Circumstances (see www.justiceservices.gov.mt/DownloadDocument.aspx?app=lp&itemid=30087&l=1) and Central Bank of Malta Directive No. 18. Data on moratoria refer to loans that were issued before the onset of the pandemic and which became subject to a moratorium as a result of COVID-19 before Central Bank of Malta Directive No. 18 of 2020, or in terms of the same Directive. Data on moratoria are as at 2 March 2021.
Percentages per annum to residents of Malta; weighted average rates as at end of period
2017 2018 2019Dec. Dec. Dec. Mar. June Sep. Dec.
Total deposits(1) 0.38 0.33 0.30 0.27 0.25 0.23 0.21of which
Overnight depositsHouseholds 0.07 0.05 0.05 0.03 0.03 0.02 0.02NFCs 0.04 0.02 0.03 0.02 0.02 0.02 0.01
Time deposits (less than 2 years)Households 0.78 0.75 0.71 0.71 0.67 0.59 0.57NFCs 0.54 0.76 0.72 0.70 0.73 0.68 0.58
Time deposits (more than 2 years)Households 2.41 2.13 1.97 1.95 1.92 1.89 1.87NFCs 1.98 1.88 1.53 1.37 1.47 1.59 1.39
Total Loans(1) 3.64 3.55 3.46 3.44 3.43 3.39 3.36of which
Households and NPISH 3.48 3.38 3.29 3.26 3.26 3.25 3.21Lending for house purchses 3.13 3.09 3.03 3.01 3.02 3.02 2.98Consumer credit and other lending 5.33 5.14 4.87 4.83 4.82 4.79 4.77
NFCs 3.91 3.83 3.76 3.75 3.73 3.62 3.61
Spread(2) 3.26 3.22 3.16 3.17 3.18 3.16 3.15ECB MROs rate 0.00 0.00 0.00 0.00 0.00 0.00 0.00Source: Central Bank of Malta.
(2) Difference between composite lending rate and composite deposit rate.
Table 2.3INTEREST RATES ON DEPOSITS AND LOANS
(1) Annualised agreed rates on outstanding euro-denominated amounts belonging to households (incl. NPISH) and NFCs.
2020
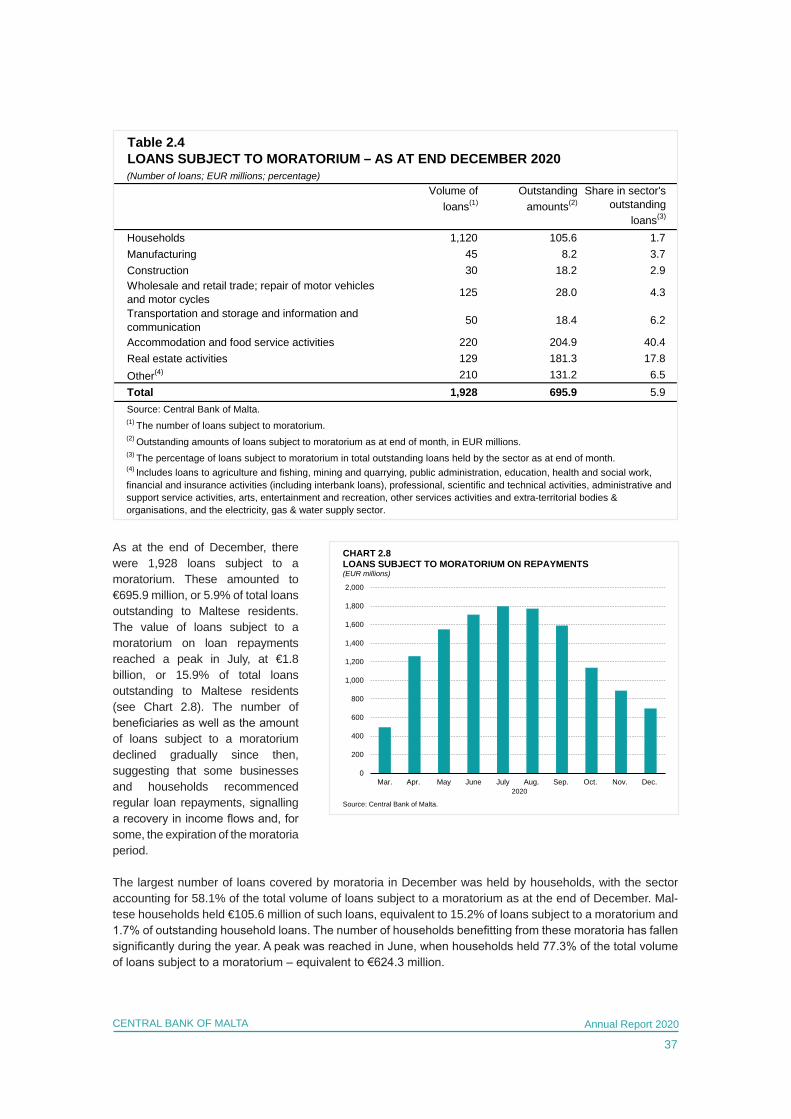
37
CENTRAL BANK OF MALTA Annual Report 2020
As at the end of December, there were 1,928 loans subject to a moratorium. These amounted to €695.9 million, or 5.9% of total loans outstanding to Maltese residents. The value of loans subject to a moratorium on loan repayments reached a peak in July, at €1.8 billion, or 15.9% of total loans outstanding to Maltese residents (see Chart 2.8). The number of beneficiaries as well as the amount of loans subject to a moratorium declined gradually since then, suggesting that some businesses and households recommenced regular loan repayments, signalling a recovery in income flows and, for some, the expiration of the moratoria period.
The largest number of loans covered by moratoria in December was held by households, with the sector accounting for 58.1% of the total volume of loans subject to a moratorium as at the end of December. Mal-tese households held €105.6 million of such loans, equivalent to 15.2% of loans subject to a moratorium and 1.7% of outstanding household loans. The number of households benefitting from these moratoria has fallen significantly during the year. A peak was reached in June, when households held 77.3% of the total volume of loans subject to a moratorium – equivalent to €624.3 million.
0
200
400
600
800
1,000
1,200
1,400
1,600
1,800
2,000
Mar. Apr. May June July Aug. Sep. Oct. Nov. Dec.
CHART 2.8LOANS SUBJECT TO MORATORIUM ON REPAYMENTS(EUR millions)
Source: Central Bank of Malta.
2020
Table 2.4
(Number of loans; EUR millions; percentage)Volume of
loans(1)Outstanding
amounts(2)Share in sector's
outstanding loans(3)
Households 1,120 105.6 1.7Manufacturing 45 8.2 3.7Construction 30 18.2 2.9Wholesale and retail trade; repair of motor vehicles and motor cycles 125 28.0 4.3
Transportation and storage and information and communication 50 18.4 6.2
Accommodation and food service activities 220 204.9 40.4Real estate activities 129 181.3 17.8Other(4) 210 131.2 6.5Total 1,928 695.9 5.9Source: Central Bank of Malta.
(3) The percentage of loans subject to moratorium in total outstanding loans held by the sector as at end of month.(4) Includes loans to agriculture and fishing, mining and quarrying, public administration, education, health and social work, financial and insurance activities (including interbank loans), professional, scientific and technical activities, administrative and support service activities, arts, entertainment and recreation, other services activities and extra-territorial bodies & organisations, and the electricity, gas & water supply sector.
LOANS SUBJECT TO MORATORIUM – AS AT END DECEMBER 2020
(1) The number of loans subject to moratorium.(2) Outstanding amounts of loans subject to moratorium as at end of month, in EUR millions.
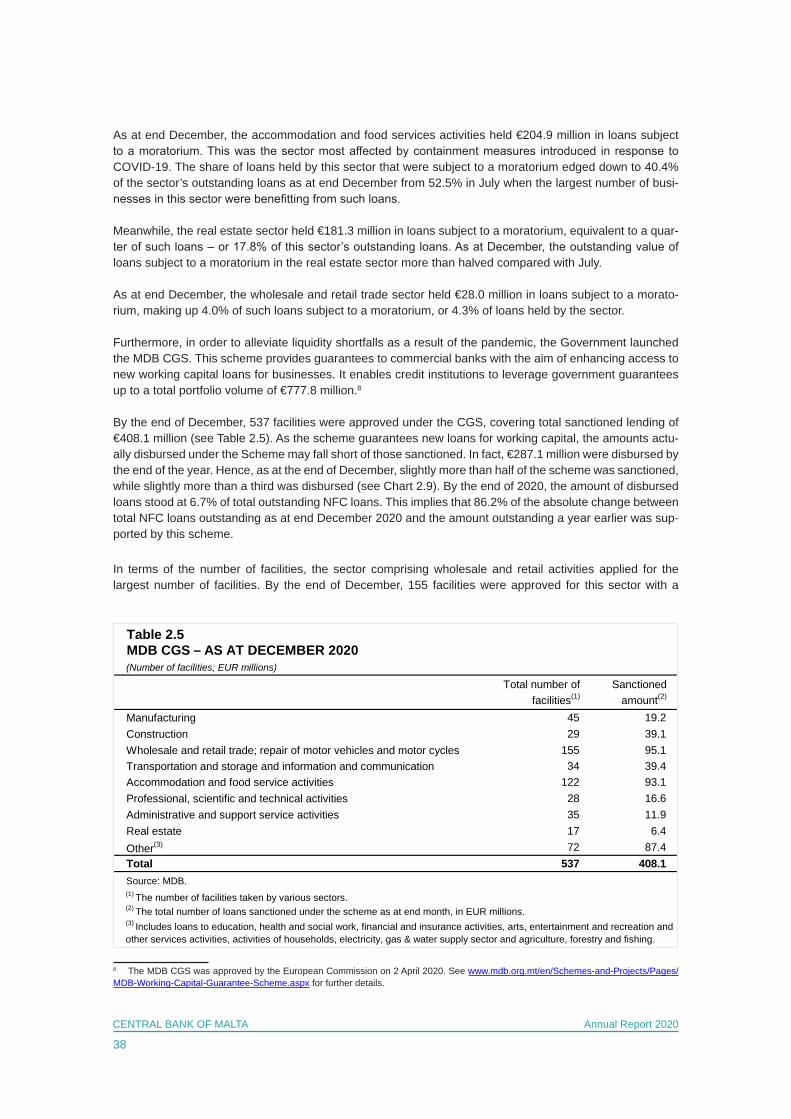
38
CENTRAL BANK OF MALTA Annual Report 2020
As at end December, the accommodation and food services activities held €204.9 million in loans subject to a moratorium. This was the sector most affected by containment measures introduced in response to COVID-19. The share of loans held by this sector that were subject to a moratorium edged down to 40.4% of the sector’s outstanding loans as at end December from 52.5% in July when the largest number of busi-nesses in this sector were benefitting from such loans.
Meanwhile, the real estate sector held €181.3 million in loans subject to a moratorium, equivalent to a quar-ter of such loans – or 17.8% of this sector’s outstanding loans. As at December, the outstanding value of loans subject to a moratorium in the real estate sector more than halved compared with July.
As at end December, the wholesale and retail trade sector held €28.0 million in loans subject to a morato-rium, making up 4.0% of such loans subject to a moratorium, or 4.3% of loans held by the sector.
Furthermore, in order to alleviate liquidity shortfalls as a result of the pandemic, the Government launched the MDB CGS. This scheme provides guarantees to commercial banks with the aim of enhancing access to new working capital loans for businesses. It enables credit institutions to leverage government guarantees up to a total portfolio volume of €777.8 million.8
By the end of December, 537 facilities were approved under the CGS, covering total sanctioned lending of €408.1 million (see Table 2.5). As the scheme guarantees new loans for working capital, the amounts actu-ally disbursed under the Scheme may fall short of those sanctioned. In fact, €287.1 million were disbursed by the end of the year. Hence, as at the end of December, slightly more than half of the scheme was sanctioned, while slightly more than a third was disbursed (see Chart 2.9). By the end of 2020, the amount of disbursed loans stood at 6.7% of total outstanding NFC loans. This implies that 86.2% of the absolute change between total NFC loans outstanding as at end December 2020 and the amount outstanding a year earlier was sup-ported by this scheme.
In terms of the number of facilities, the sector comprising wholesale and retail activities applied for the largest number of facilities. By the end of December, 155 facilities were approved for this sector with a
8 The MDB CGS was approved by the European Commission on 2 April 2020. See www.mdb.org.mt/en/Schemes-and-Projects/Pages/MDB-Working-Capital-Guarantee-Scheme.aspx for further details.
Table 2.5
(Number of facilities; EUR millions)
Total number of facilities(1)
Sanctioned amount(2)
Manufacturing 45 19.2Construction 29 39.1Wholesale and retail trade; repair of motor vehicles and motor cycles 155 95.1Transportation and storage and information and communication 34 39.4Accommodation and food service activities 122 93.1Professional, scientific and technical activities 28 16.6Administrative and support service activities 35 11.9Real estate 17 6.4Other(3) 72 87.4Total 537 408.1Source: MDB.(1) The number of facilities taken by various sectors.(2) The total number of loans sanctioned under the scheme as at end month, in EUR millions.(3) Includes loans to education, health and social work, financial and insurance activities, arts, entertainment and recreation and other services activities, activities of households, electricity, gas & water supply sector and agriculture, forestry and fishing.
MDB CGS – AS AT DECEMBER 2020
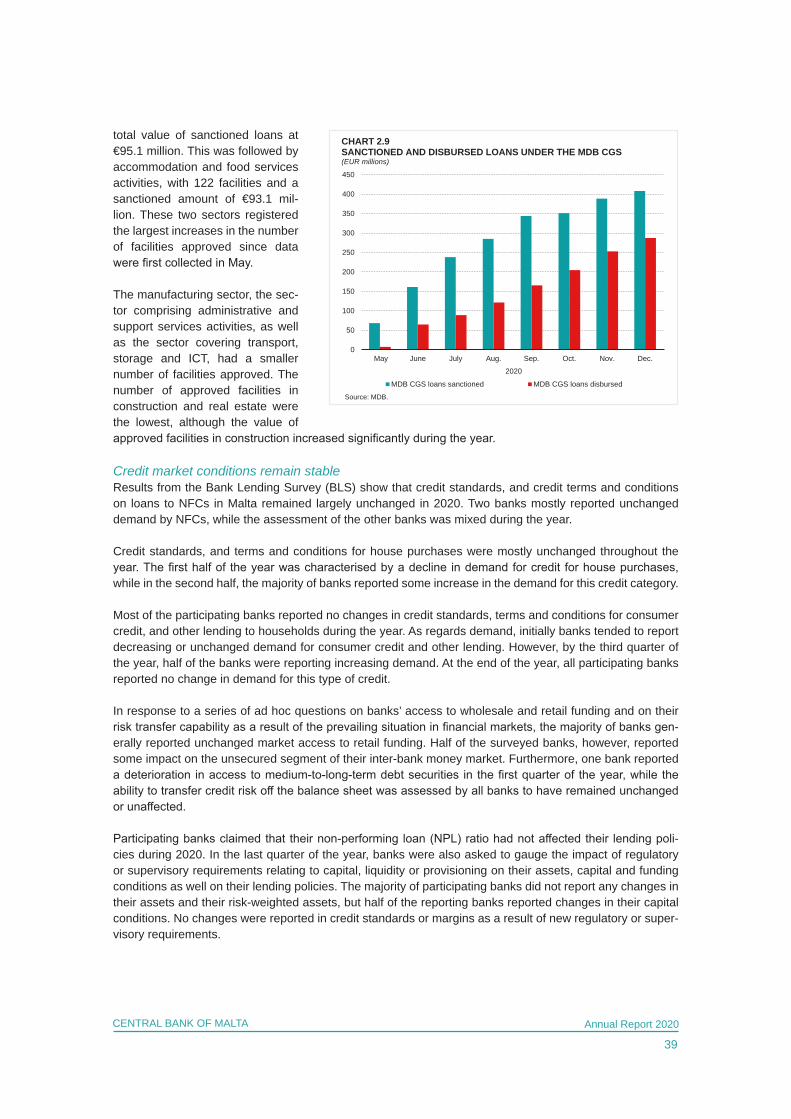
39
CENTRAL BANK OF MALTA Annual Report 2020
total value of sanctioned loans at €95.1 million. This was followed by accommodation and food services activities, with 122 facilities and a sanctioned amount of €93.1 mil-lion. These two sectors registered the largest increases in the number of facilities approved since data were first collected in May.
The manufacturing sector, the sec-tor comprising administrative and support services activities, as well as the sector covering transport, storage and ICT, had a smaller number of facilities approved. The number of approved facilities in construction and real estate were the lowest, although the value of approved facilities in construction increased significantly during the year.
Credit market conditions remain stable Results from the Bank Lending Survey (BLS) show that credit standards, and credit terms and conditions on loans to NFCs in Malta remained largely unchanged in 2020. Two banks mostly reported unchanged demand by NFCs, while the assessment of the other banks was mixed during the year.
Credit standards, and terms and conditions for house purchases were mostly unchanged throughout the year. The first half of the year was characterised by a decline in demand for credit for house purchases, while in the second half, the majority of banks reported some increase in the demand for this credit category.
Most of the participating banks reported no changes in credit standards, terms and conditions for consumer credit, and other lending to households during the year. As regards demand, initially banks tended to report decreasing or unchanged demand for consumer credit and other lending. However, by the third quarter of the year, half of the banks were reporting increasing demand. At the end of the year, all participating banks reported no change in demand for this type of credit.
In response to a series of ad hoc questions on banks’ access to wholesale and retail funding and on their risk transfer capability as a result of the prevailing situation in financial markets, the majority of banks gen-erally reported unchanged market access to retail funding. Half of the surveyed banks, however, reported some impact on the unsecured segment of their inter-bank money market. Furthermore, one bank reported a deterioration in access to medium-to-long-term debt securities in the first quarter of the year, while the ability to transfer credit risk off the balance sheet was assessed by all banks to have remained unchanged or unaffected.
Participating banks claimed that their non-performing loan (NPL) ratio had not affected their lending poli-cies during 2020. In the last quarter of the year, banks were also asked to gauge the impact of regulatory or supervisory requirements relating to capital, liquidity or provisioning on their assets, capital and funding conditions as well on their lending policies. The majority of participating banks did not report any changes in their assets and their risk-weighted assets, but half of the reporting banks reported changes in their capital conditions. No changes were reported in credit standards or margins as a result of new regulatory or super-visory requirements.
0
50
100
150
200
250
300
350
400
450
May June July Aug. Sep. Oct. Nov. Dec.
MDB CGS loans sanctioned MDB CGS loans disbursed
CHART 2.9SANCTIONED AND DISBURSED LOANS UNDER THE MDB CGS(EUR millions)
Source: MDB.
2020
40
CENTRAL BANK OF MALTA Annual Report 2020
Banks were also asked to assess the impact of the ECB’s APP and PEPP on their financial situation, assets and lending behaviour. The majority of surveyed banks said that these programmes had no impact on their assets. However, one bank reported some decline in its holdings of euro area sovereign bonds. This same bank also reported some positive impact on its liquidity position despite a deterioration in its overall market financing conditions. No impact on net interest income was reported in the first half of the year. However, in the second half of the year, half of the respondent banks also reported a negative impact on net interest income, with one bank noting some increase in capital gains. None of the participating banks reported any changes in their credit standards, lending volumes, and terms and conditions.
With regard to the ECB’s negative deposit facility rate, the majority of banks reported that this had caused a decline in their net interest income. Half of the participating banks also reported a decrease in their deposit rates, though this decline was mostly mentioned in the first half of the year. One bank also experienced a decline in its lending rates in the second part of 2020. Meanwhile, this same bank stated that lending and deposit volumes increased. As regards non-interest rate charges, developments were mixed in the first half of the year but in the second half of the year all banks reported unchanged charges.
Respondent banks were also asked about the impact of the ECB’s two-tier system for remunerating excess liquidity holdings on their financial situation, lending and deposit rates. In the first half of the year, most of the banks reported an improvement in their overall profitability on account of higher net interest income. The number of banks reporting such improvement declined as the year progressed. Some banks also reported lower interest rates on deposits held by households and enterprises.
All respondent banks stated that they did not participate in the Eurosystem’s TLTROs that took place in March and September 2020. Their financial situation, lending policy and lending volumes were not affected by these operations.
Respondent banks were asked to state how their credit standards, terms and conditions on new loans, and the demand for loans had changed across the main sectors of economic activity – namely manufac-turing, construction, services, wholesale and retail trade, and real estate. All banks reported unchanged credit standards. With regards to terms and conditions, while in the first half of the year most banks reported unchanged terms and conditions, as the year progressed, half of the banks reported tighter terms and conditions for most sectors. Replies regarding demand for loans were more mixed across participat-ing banks and sectors. However, all banks said that demand from the real estate sector declined in the final quarter of the year.
In the final quarter of the year, surveyed banks were also asked to assess the impact on their credit stan-dards, and terms and conditions on loans benefitting from COVID-19 related government guarantees and those without these guarantees. With regards to credit standards, half of the participating banks reported some easing in credit standards as well as terms and conditions compared with the preceding six months for loans with COVID-19 related government guarantees. The majority of banks, however, said that loans without government guarantees were not affected.
All banks reported higher demand for loans backed by government guarantees. These loans primarily were used to cover acute liquidity needs. All banks apart from one experienced no change in demand for loans without government-related guarantees.
41
CENTRAL BANK OF MALTA Annual Report 2020
BOX 1: ACCESS TO FINANCE IN 20201
Small and medium-sized enterprises (SMEs) face challenges that vary from those of large scale enterprises, especially when it comes to complying with regulations and access of information, markets and finance. In particular, SMEs typically have very limited opportunities for capital market financing.
In addition to these challenges, SMEs are facing a difficult economic environment brought about by the COVID-19 pandemic. According to the Survey on Access to Finance of Enterprises (SAFE) which was conducted by the European Commission in cooperation with the ECB between 7 September and 16 October 2020 across 14,055 enterprises in the European Union (EU), EU SMEs recorded significant declines in turnover, profits and employment amid a sharp fall in economic activity, despite accommo-dative financing conditions and improved access to public financial support such as guarantees. The balance sheets of enterprises deteriorated for the first time since the GFC.
The SAFE provides valuable information on the financial situation of SMEs in Malta and across the EU, with specific emphasis on the need for and availability of external financing.2 This box reports on the financing conditions and related challenges that SMEs faced during 2020.
The financial situation of SMEsSurvey results show that between April and September 2020 – the reference period for the latest survey – SMEs in Malta and in the European Union experienced a sharp deterioration in activity and financial performance, because of the difficult economic environment brought about by the COVID-19 pandemic and the related containment measures. This deterioration occurred despite generally accommodative financing conditions. Turnover and profits decreased, reflecting the sharp fall in eco-nomic activity. On balance, 64% of SMEs in Malta and 44% in the EU reported a decline in turnover, while profits fell for 70% of domestic SMEs and 45% of SMEs across the EU.3 In Malta, the decline in turnover was the strongest recorded since 2011, when a net 40% and 63% of SMEs reported a decline in turnover and profits, respectively.4 The higher incidence of companies reporting lower turnover and profits in Malta may reflect the larger share of respondents in trade and services, which include the sectors hit hardest by the pandemic.5
The decline in economic activity and profits also impacted the investment and hiring decisions of SMEs. On balance, 20% of SMEs in Malta reported a decline in investment in plant, machinery or equipment, compared with 8% of SMEs in the EU. Meanwhile, on balance, 13% of domestic SMEs reported a decline in the number of employees, compared with 10% in the EU. These developments are a sharp turnaround from 2019 when 35% and 28% of SMEs in Malta had reported a net increase in investment and in the number of employees. At the same time, the survey confirms that the labour market has been relatively resilient given the scale of contraction in activity, as the net share of firms reporting lower employment was much smaller than that reporting lower turnover. Furthermore, the share of firms reporting a lower staff complement was similar to that in the EU, even if the survey reveals a much stronger incidence of firms with decreasing turnover in Malta.
1 Prepared by Sandra Zerafa. Ms. Zerafa is the coordinator of economic publications within the Economic Analysis Department of the Central Bank of Malta. The views expressed are those of the author and do not necessarily reflect the views of the Central Bank of Malta. Any errors are the author’s own. 2 According to the 2019 SBA Fact Sheet, 2018 estimates for SMEs in Malta show that these were responsible for 77.7% of employed persons and 81.8% of value added generated. In the EU28 these were responsible for 66.6% of persons employed and 56.4% of value added. SMEs in Malta and in the EU make up 99.8% of all enterprises https://ec.europa.eu/docsroom/docu-ments/38662/attachments/20/translations/en/renditions/native3 According to SAFE 2020, the financial state of SMEs in the EU has deteriorated in recent survey results, though the sharp decline in the last year is to a large extent the result of the COVID-19 pandemic. 4 Figures from SAFE are rounded, in line with the approach followed by the ECB when commenting on SAFE results.5 In Malta, 88% of participating firms were classified in these sectors, compared to 75% in the EU.
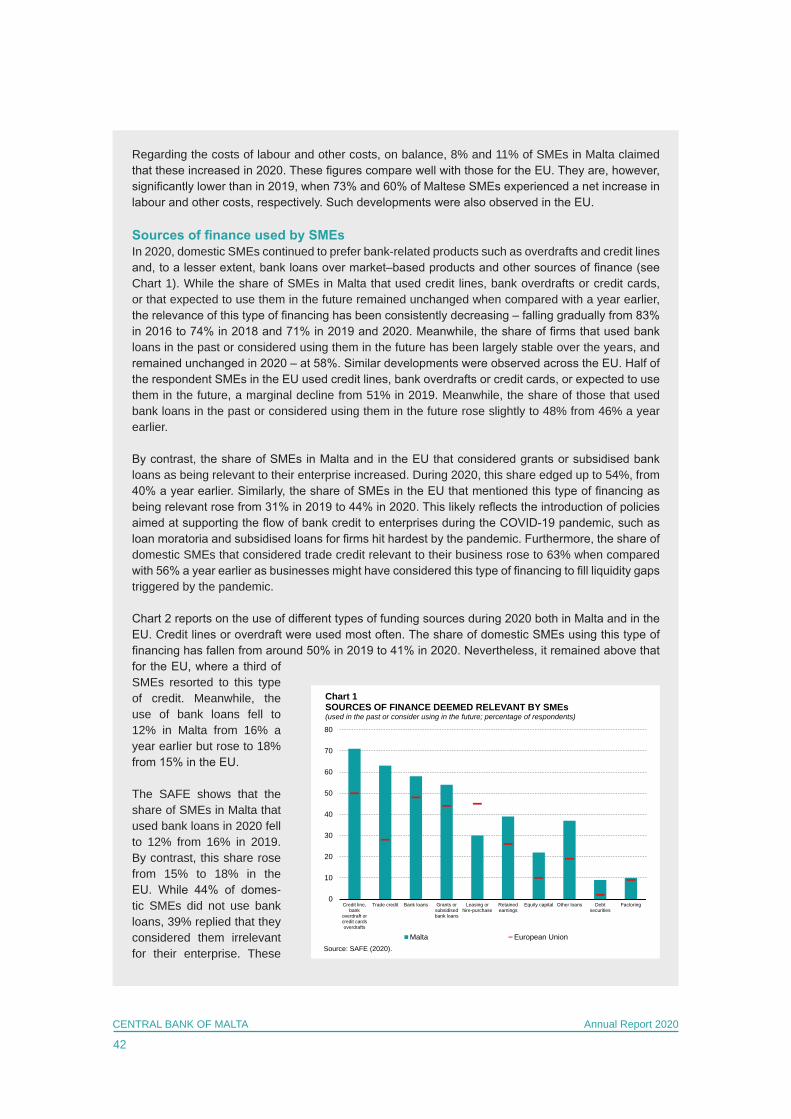
42
CENTRAL BANK OF MALTA Annual Report 2020
Regarding the costs of labour and other costs, on balance, 8% and 11% of SMEs in Malta claimed that these increased in 2020. These figures compare well with those for the EU. They are, however, significantly lower than in 2019, when 73% and 60% of Maltese SMEs experienced a net increase in labour and other costs, respectively. Such developments were also observed in the EU.
Sources of finance used by SMEsIn 2020, domestic SMEs continued to prefer bank-related products such as overdrafts and credit lines and, to a lesser extent, bank loans over market–based products and other sources of finance (see Chart 1). While the share of SMEs in Malta that used credit lines, bank overdrafts or credit cards, or that expected to use them in the future remained unchanged when compared with a year earlier, the relevance of this type of financing has been consistently decreasing – falling gradually from 83% in 2016 to 74% in 2018 and 71% in 2019 and 2020. Meanwhile, the share of firms that used bank loans in the past or considered using them in the future has been largely stable over the years, and remained unchanged in 2020 – at 58%. Similar developments were observed across the EU. Half of the respondent SMEs in the EU used credit lines, bank overdrafts or credit cards, or expected to use them in the future, a marginal decline from 51% in 2019. Meanwhile, the share of those that used bank loans in the past or considered using them in the future rose slightly to 48% from 46% a year earlier.
By contrast, the share of SMEs in Malta and in the EU that considered grants or subsidised bank loans as being relevant to their enterprise increased. During 2020, this share edged up to 54%, from 40% a year earlier. Similarly, the share of SMEs in the EU that mentioned this type of financing as being relevant rose from 31% in 2019 to 44% in 2020. This likely reflects the introduction of policies aimed at supporting the flow of bank credit to enterprises during the COVID-19 pandemic, such as loan moratoria and subsidised loans for firms hit hardest by the pandemic. Furthermore, the share of domestic SMEs that considered trade credit relevant to their business rose to 63% when compared with 56% a year earlier as businesses might have considered this type of financing to fill liquidity gaps triggered by the pandemic.
Chart 2 reports on the use of different types of funding sources during 2020 both in Malta and in the EU. Credit lines or overdraft were used most often. The share of domestic SMEs using this type of financing has fallen from around 50% in 2019 to 41% in 2020. Nevertheless, it remained above that for the EU, where a third of SMEs resorted to this type of credit. Meanwhile, the use of bank loans fell to 12% in Malta from 16% a year earlier but rose to 18% from 15% in the EU.
The SAFE shows that the share of SMEs in Malta that used bank loans in 2020 fell to 12% from 16% in 2019. By contrast, this share rose from 15% to 18% in the EU. While 44% of domes-tic SMEs did not use bank loans, 39% replied that they considered them irrelevant for their enterprise. These
0
10
20
30
40
50
60
70
80
Credit line,bank
overdraft orcredit cardsoverdrafts
Trade credit Bank loans Grants orsubsidisedbank loans
Leasing orhire-purchase
Retainedearnings
Equity capital Other loans Debtsecurities
Factoring
Chart 1SOURCES OF FINANCE DEEMED RELEVANT BY SMEs(used in the past or consider using in the future; percentage of respondents)
Malta European UnionSource: SAFE (2020).
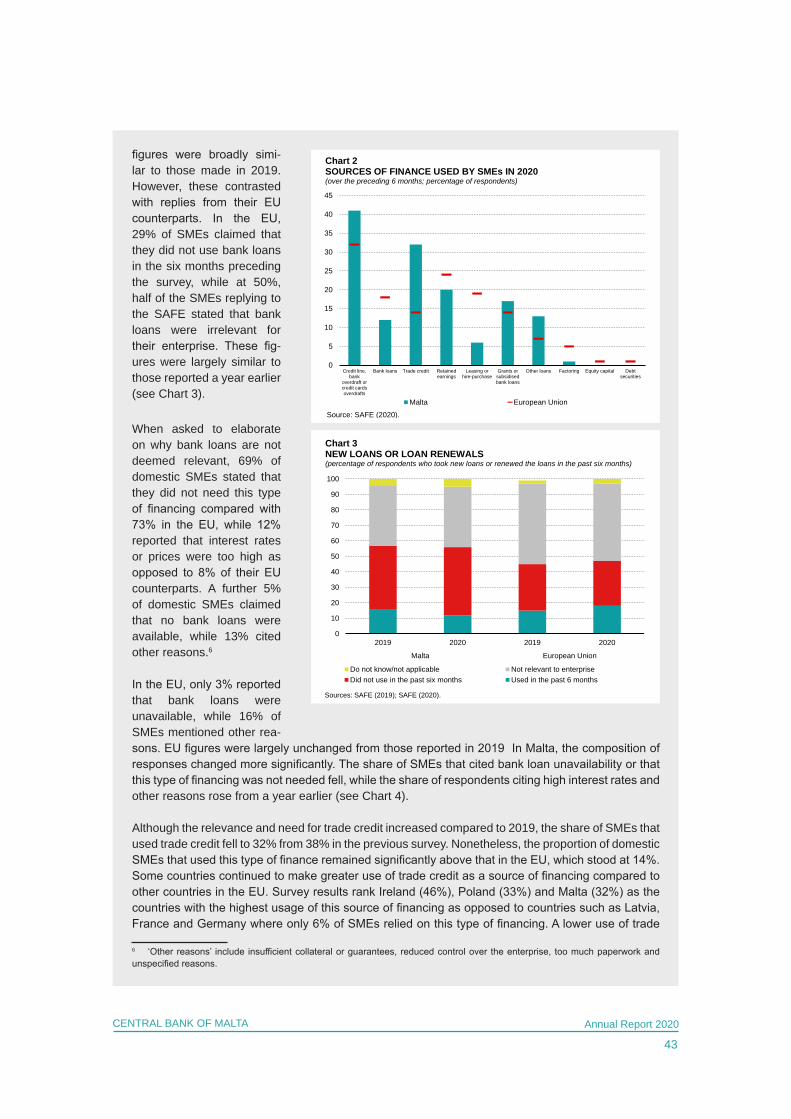
43
CENTRAL BANK OF MALTA Annual Report 2020
figures were broadly simi-lar to those made in 2019. However, these contrasted with replies from their EU counterparts. In the EU, 29% of SMEs claimed that they did not use bank loans in the six months preceding the survey, while at 50%, half of the SMEs replying to the SAFE stated that bank loans were irrelevant for their enterprise. These fig-ures were largely similar to those reported a year earlier (see Chart 3).
When asked to elaborate on why bank loans are not deemed relevant, 69% of domestic SMEs stated that they did not need this type of financing compared with 73% in the EU, while 12% reported that interest rates or prices were too high as opposed to 8% of their EU counterparts. A further 5% of domestic SMEs claimed that no bank loans were available, while 13% cited other reasons.6
In the EU, only 3% reported that bank loans were unavailable, while 16% of SMEs mentioned other rea-sons. EU figures were largely unchanged from those reported in 2019 In Malta, the composition of responses changed more significantly. The share of SMEs that cited bank loan unavailability or that this type of financing was not needed fell, while the share of respondents citing high interest rates and other reasons rose from a year earlier (see Chart 4).
Although the relevance and need for trade credit increased compared to 2019, the share of SMEs that used trade credit fell to 32% from 38% in the previous survey. Nonetheless, the proportion of domestic SMEs that used this type of finance remained significantly above that in the EU, which stood at 14%. Some countries continued to make greater use of trade credit as a source of financing compared to other countries in the EU. Survey results rank Ireland (46%), Poland (33%) and Malta (32%) as the countries with the highest usage of this source of financing as opposed to countries such as Latvia, France and Germany where only 6% of SMEs relied on this type of financing. A lower use of trade
6 ‘Other reasons’ include insufficient collateral or guarantees, reduced control over the enterprise, too much paperwork and unspecified reasons.
0
10
20
30
40
50
60
70
80
90
100
2019 2020 2019 2020
Malta European Union
Do not know/not applicable Not relevant to enterpriseDid not use in the past six months Used in the past 6 months
Chart 3NEW LOANS OR LOAN RENEWALS(percentage of respondents who took new loans or renewed the loans in the past six months)
Sources: SAFE (2019); SAFE (2020).
0
5
10
15
20
25
30
35
40
45
Credit line,bank
overdraft orcredit cardsoverdrafts
Bank loans Trade credit Retainedearnings
Leasing orhire-purchase
Grants orsubsidisedbank loans
Other loans Factoring Equity capital Debtsecurities
Chart 2SOURCES OF FINANCE USED BY SMEs IN 2020(over the preceding 6 months; percentage of respondents)
Malta European UnionSource: SAFE (2020).
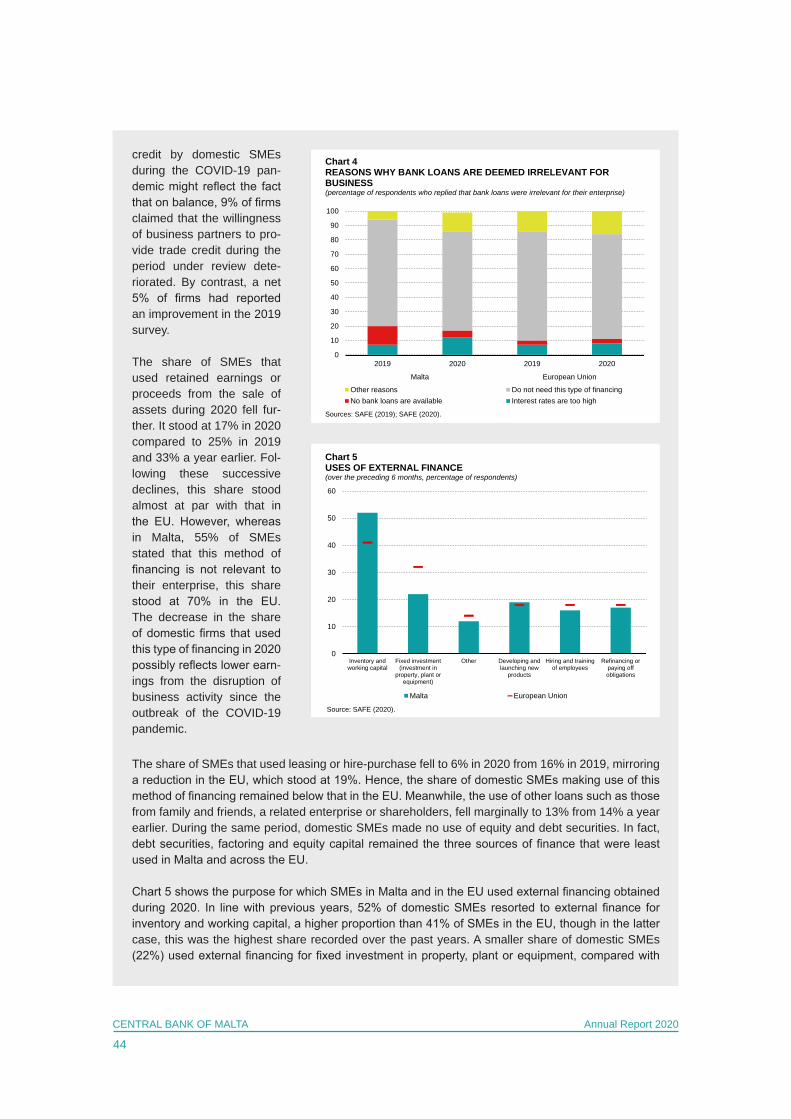
44
CENTRAL BANK OF MALTA Annual Report 2020
credit by domestic SMEs during the COVID-19 pan-demic might reflect the fact that on balance, 9% of firms claimed that the willingness of business partners to pro-vide trade credit during the period under review dete-riorated. By contrast, a net 5% of firms had reported an improvement in the 2019 survey.
The share of SMEs that used retained earnings or proceeds from the sale of assets during 2020 fell fur-ther. It stood at 17% in 2020 compared to 25% in 2019 and 33% a year earlier. Fol-lowing these successive declines, this share stood almost at par with that in the EU. However, whereas in Malta, 55% of SMEs stated that this method of financing is not relevant to their enterprise, this share stood at 70% in the EU. The decrease in the share of domestic firms that used this type of financing in 2020 possibly reflects lower earn-ings from the disruption of business activity since the outbreak of the COVID-19 pandemic.
The share of SMEs that used leasing or hire-purchase fell to 6% in 2020 from 16% in 2019, mirroring a reduction in the EU, which stood at 19%. Hence, the share of domestic SMEs making use of this method of financing remained below that in the EU. Meanwhile, the use of other loans such as those from family and friends, a related enterprise or shareholders, fell marginally to 13% from 14% a year earlier. During the same period, domestic SMEs made no use of equity and debt securities. In fact, debt securities, factoring and equity capital remained the three sources of finance that were least used in Malta and across the EU.
Chart 5 shows the purpose for which SMEs in Malta and in the EU used external financing obtained during 2020. In line with previous years, 52% of domestic SMEs resorted to external finance for inventory and working capital, a higher proportion than 41% of SMEs in the EU, though in the latter case, this was the highest share recorded over the past years. A smaller share of domestic SMEs (22%) used external financing for fixed investment in property, plant or equipment, compared with
0
10
20
30
40
50
60
70
80
90
100
2019 2020 2019 2020
Malta European Union
Other reasons Do not need this type of financingNo bank loans are available Interest rates are too high
Chart 4REASONS WHY BANK LOANS ARE DEEMED IRRELEVANT FOR BUSINESS(percentage of respondents who replied that bank loans were irrelevant for their enterprise)
Sources: SAFE (2019); SAFE (2020).
0
10
20
30
40
50
60
Inventory andworking capital
Fixed investment(investment in
property, plant orequipment)
Other Developing andlaunching new
products
Hiring and trainingof employees
Refinancing orpaying offobligations
Chart 5USES OF EXTERNAL FINANCE(over the preceding 6 months, percentage of respondents)
Malta European Union
Source: SAFE (2020).
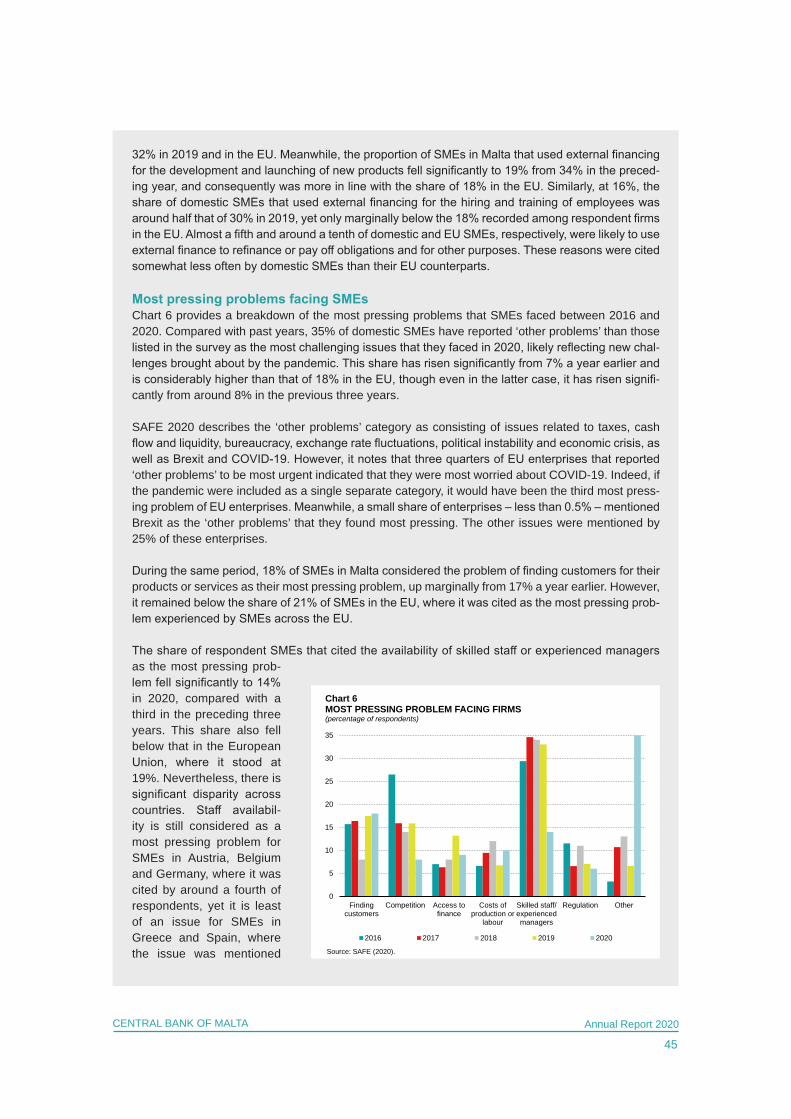
45
CENTRAL BANK OF MALTA Annual Report 2020
32% in 2019 and in the EU. Meanwhile, the proportion of SMEs in Malta that used external financing for the development and launching of new products fell significantly to 19% from 34% in the preced-ing year, and consequently was more in line with the share of 18% in the EU. Similarly, at 16%, the share of domestic SMEs that used external financing for the hiring and training of employees was around half that of 30% in 2019, yet only marginally below the 18% recorded among respondent firms in the EU. Almost a fifth and around a tenth of domestic and EU SMEs, respectively, were likely to use external finance to refinance or pay off obligations and for other purposes. These reasons were cited somewhat less often by domestic SMEs than their EU counterparts.
Most pressing problems facing SMEsChart 6 provides a breakdown of the most pressing problems that SMEs faced between 2016 and 2020. Compared with past years, 35% of domestic SMEs have reported ‘other problems’ than those listed in the survey as the most challenging issues that they faced in 2020, likely reflecting new chal-lenges brought about by the pandemic. This share has risen significantly from 7% a year earlier and is considerably higher than that of 18% in the EU, though even in the latter case, it has risen signifi-cantly from around 8% in the previous three years.
SAFE 2020 describes the ‘other problems’ category as consisting of issues related to taxes, cash flow and liquidity, bureaucracy, exchange rate fluctuations, political instability and economic crisis, as well as Brexit and COVID-19. However, it notes that three quarters of EU enterprises that reported ‘other problems’ to be most urgent indicated that they were most worried about COVID-19. Indeed, if the pandemic were included as a single separate category, it would have been the third most press-ing problem of EU enterprises. Meanwhile, a small share of enterprises – less than 0.5% – mentioned Brexit as the ‘other problems’ that they found most pressing. The other issues were mentioned by 25% of these enterprises.
During the same period, 18% of SMEs in Malta considered the problem of finding customers for their products or services as their most pressing problem, up marginally from 17% a year earlier. However, it remained below the share of 21% of SMEs in the EU, where it was cited as the most pressing prob-lem experienced by SMEs across the EU.
The share of respondent SMEs that cited the availability of skilled staff or experienced managers as the most pressing prob-lem fell significantly to 14% in 2020, compared with a third in the preceding three years. This share also fell below that in the European Union, where it stood at 19%. Nevertheless, there is significant disparity across countries. Staff availabil-ity is still considered as a most pressing problem for SMEs in Austria, Belgium and Germany, where it was cited by around a fourth of respondents, yet it is least of an issue for SMEs in Greece and Spain, where the issue was mentioned
0
5
10
15
20
25
30
35
Findingcustomers
Competition Access tofinance
Costs ofproduction or
labour
Skilled staff/experiencedmanagers
Regulation Other
Chart 6MOST PRESSING PROBLEM FACING FIRMS(percentage of respondents)
2016 2017 2018 2019 2020
Source: SAFE (2020).
46
CENTRAL BANK OF MALTA Annual Report 2020
by a tenth of respondents. The declining importance of this problem in Malta and across the EU over the past year was corroborated by the European Investment Bank Survey on Investment and Investment Finance 2020.
Other non-financial barriers that undermine firm growth include costs of production and labour, a burdensome regulatory framework as well as competition. The share of SMEs in Malta that con-sider costs of production or labour as a most pressing problem rose from 7% in 2019 to 10% in 2020. Such costs were mentioned as a most urgent problem by 12% of SMEs in the EU, with this share remaining fairly constant since 2015.
By contrast, the proportion of domestic SMEs that considered competition as the most pressing problem halved in 2020 when compared with a year earlier. This share also dropped for SMEs in the EU, such that in 2020 competition was considered as the least important problem.
Meanwhile, access to finance was considered among the least important obstacles. The share of SMEs in Malta that considered access to finance as a most pressing problem declined from 13% in 2019 to 9% in 2020 – a rate that is close to that reported in 2018 and the rate of 10% reported by SMEs in the EU. According to SAFE 2020, access to finance remains a very pressing problem to SMEs in Greece, where as last year it was mentioned by around a fifth of participating firms, and least of a problem in Luxembourg (5%).
Terms and conditions of bank loan financing Survey results show that 71% of domestic SMEs believe that the availability of bank loan financing remained unchanged during 2020, as against 58% across the EU. Meanwhile, 16% of domestic SMEs claimed that the availability of bank loans improved, as opposed to 13% which claimed that the availability of bank loans deteriorated. Consequently, a net share of 2% reported improved access to this source of funding in Malta, an improvement over a negative net balance of -8% recorded in the previous year. By contrast, in the EU the net share reporting an improvement decreased to 4% from 9% a year earlier.
At the time of the survey, 80% of domestic SMEs anticipated unchanged availability of bank loans in the six months ahead compared with 51% of SMEs in the EU. While 7% of domestic SMEs antici-pated an improvement, 12% expected the availability of bank loans to deteriorate, such that on bal-ance, 4% of surveyed SMEs predicted a deterioration. This compares favourably with a net negative balance of 8% in 2019 and of 15% in the EU.
Table 1 shows firms’ assessment of interest rates and other costs of financing. The proportion of domestic SMEs which reported a net decrease in interest rates stood at 14%, a turnaround from 8% which reported a net increase a year earlier. During the year under review, 14% of domestic SMEs reported a decrease in rates, while none of those interviewed reported an increase. Meanwhile, 84% of participating firms claimed that interest rates were unchanged during 2020, compared with 56% in the EU. On balance, at -4%, a smaller share of SMEs in the EU reported a fall in interest rates, as 17% of SMEs reported an increase in the level of interest rates, whereas 21% were faced with lower rates.
With regard to developments in the cost of financing other than interest rates, 69% of SMEs reported an unchanged level of costs such as charges, fees and commissions, a significant increase from 37% of SMEs in 2019. By contrast, the share that reported higher costs fell from 63% in 2019 to 10% in 2020, while those that reported declining costs rose from 0% in 2019 to 21% in 2020. Results for 2020 diverge from those observed in the EU, where 28% reported an increase in non-interest rate costs and only 7% reported a decrease, resulting in a net positive balance of 20%. This was the first
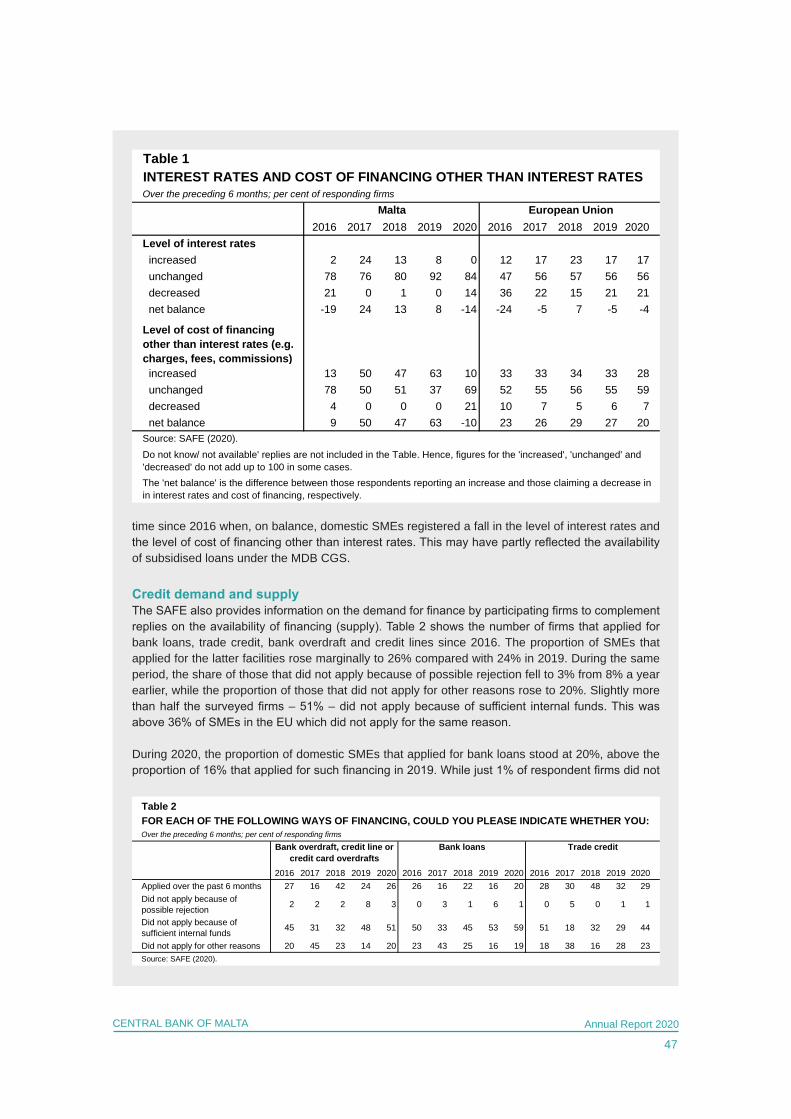
47
CENTRAL BANK OF MALTA Annual Report 2020
time since 2016 when, on balance, domestic SMEs registered a fall in the level of interest rates and the level of cost of financing other than interest rates. This may have partly reflected the availability of subsidised loans under the MDB CGS.
Credit demand and supplyThe SAFE also provides information on the demand for finance by participating firms to complement replies on the availability of financing (supply). Table 2 shows the number of firms that applied for bank loans, trade credit, bank overdraft and credit lines since 2016. The proportion of SMEs that applied for the latter facilities rose marginally to 26% compared with 24% in 2019. During the same period, the share of those that did not apply because of possible rejection fell to 3% from 8% a year earlier, while the proportion of those that did not apply for other reasons rose to 20%. Slightly more than half the surveyed firms – 51% – did not apply because of sufficient internal funds. This was above 36% of SMEs in the EU which did not apply for the same reason.
During 2020, the proportion of domestic SMEs that applied for bank loans stood at 20%, above the proportion of 16% that applied for such financing in 2019. While just 1% of respondent firms did not
Table 1INTEREST RATES AND COST OF FINANCING OTHER THAN INTEREST RATESOver the preceding 6 months; per cent of responding firms
2016 2017 2018 2019 2020 2016 2017 2018 2019 2020Level of interest rates increased 2 24 13 8 0 12 17 23 17 17 unchanged 78 76 80 92 84 47 56 57 56 56 decreased 21 0 1 0 14 36 22 15 21 21 net balance -19 24 13 8 -14 -24 -5 7 -5 -4
Level of cost of financing other than interest rates (e.g. charges, fees, commissions) increased 13 50 47 63 10 33 33 34 33 28 unchanged 78 50 51 37 69 52 55 56 55 59 decreased 4 0 0 0 21 10 7 5 6 7 net balance 9 50 47 63 -10 23 26 29 27 20
Malta European Union
Do not know/ not available' replies are not included in the Table. Hence, figures for the 'increased', 'unchanged' and 'decreased' do not add up to 100 in some cases. The 'net balance' is the difference between those respondents reporting an increase and those claiming a decrease in in interest rates and cost of financing, respectively.
Source: SAFE (2020).
Table 2
Over the preceding 6 months; per cent of responding firms
2016 2017 2018 2019 2020 2016 2017 2018 2019 2020 2016 2017 2018 2019 2020Applied over the past 6 months 27 16 42 24 26 26 16 22 16 20 28 30 48 32 29Did not apply because of possible rejection 2 2 2 8 3 0 3 1 6 1 0 5 0 1 1
Did not apply because of sufficient internal funds 45 31 32 48 51 50 33 45 53 59 51 18 32 29 44
Did not apply for other reasons 20 45 23 14 20 23 43 25 16 19 18 38 16 28 23Source: SAFE (2020).
Bank overdraft, credit line or credit card overdrafts
Bank loans Trade credit
FOR EACH OF THE FOLLOWING WAYS OF FINANCING, COULD YOU PLEASE INDICATE WHETHER YOU:
48
CENTRAL BANK OF MALTA Annual Report 2020
apply because of possible rejection, almost a fifth failed to apply for other reasons. A higher share of 59% – compared with 53% in 2019, and 35% of SMEs in the EU – did not seek bank loans due to sufficient internal funds.
The percentage of respondents that applied for trade credit declined for the second consecutive year, and stood at 29%, marginally below that of 31% in the EU. Survey results show that a significantly higher share of respondents (44%) did not apply because of sufficient internal funds compared with 29% a year earlier. Only 1% did not apply for fear of rejection, while 23% did not apply for other reasons.
ConclusionThe SAFE 2020 reports on the financial situation of SMEs in the midst of the COVID-19 pandemic. It notes that turnover and profits of SMEs in Malta and in the EU were severely impacted by adverse economic activity, even though financing conditions were generally accommodative. For the first time since 2016, the number of domestic SMEs that reported lower levels of interest rates and other costs of financing exceeded those that reported an increase.
Bank financing remained the most used source of external financing. While usage rates surpassed those in the EU, the share of respondents that resorted to this type of financing fell. Similarly, the pro-portion of those that resorted to retained earnings and trade credit declined, despite a higher percep-tion that the latter type of financing could help fill liquidity shortages. The majority of Maltese SMEs reported that they had enough internal funds not to require loans, as against a minority of EU firms.
Survey results show that during the period under review, SMEs in Malta and in the EU made higher use of grants or subsidised bank loans. This reflects measures taken by the Government and the Central Bank of Malta to alleviate liquidity shortfalls as a result of the pandemic. As at end December 2020, 1,928 loans were subject to a moratorium on loan repayments, amounting to €695.9 million, or 5.9% of total outstanding loans to Maltese residents. Meanwhile, 537 facilities, covering total sanc-tioned lending of €408.1 million, were approved under the MDB CGS, with the aim of providing loans for working capital.
Access to finance was among the least pressing of obstacles during the period under review, largely surpassed by ‘other problems’ such as the pandemic and Brexit. As could be expected, in a period of low demand, the previously pressing problem of labour shortages dampened considerably, though it remained the third largest issue for Maltese firms.

49
CENTRAL BANK OF MALTA Annual Report 2020
The money marketDuring 2020, the ECB maintained an accommodative monetary pol-icy stance. The interest rate on the MROs and the interest rates on the marginal lending facility and the deposit facility were kept unchanged at 0.00%, 0.25% and -0.50%, respectively. During the year, the Governing Council intro-duced various monetary policy measures, aimed at combating the economic disruption and height-ened uncertainty brought about by the pandemic.
Money market rates in the euro area moved further into negative territory with the 3-month EURI-BOR ending 2020 at -0.54%, below the rate of -0.39% at the end of 2019 (see Chart 2.10).
Meanwhile, in the domestic primary market, the yield on 3-month Treasury bills also fell to -0.50% at the end of 2020, from -0.43% 12 months earlier.
In total, the Treasury issued €1,992.0 million worth of bills in 2020, a significantly larger amount compared with issues of €1,193.9 million in 2019. The majority of bills issued had a maturity of three months, fol-lowed by those with a maturity of six months. New bills issued with a longer maturity made up around 14.1% of all bills. The amount of Treasury bills issued in 2020 was higher than the amount of maturing bills, which stood at €1,648.0 million.
In the secondary market, the yield on 3-month German government securities, which acts as a benchmark for euro area yields, decreased by 11 basis points – to -0.85% in December 2020 from -0.74% in Decem-ber 2019. Consequently, the spread between the domestic rate and the euro benchmark widened to 35 basis points from 31 basis points a year earlier.
The capital market In the capital market, total issues of long-term debt by the Government and the private sector more than doubled, rising to €1,511.0 million in 2020, from €727.6 million in 2019. Taking into account the amount of redemptions and roll-overs made over the year, positive net issues of long-term debt were recorded in 2020. These stood at €754.3 million, as against €123.8 million in 2019, as the Government increased substantially its issuance of MGS to finance the unprecedented fiscal support measures introduced in response to COVID-19. Meanwhile, net issues by the private sector turned negative, likely as a result of the elevated uncertainty caused by the pandemic, which put many business investment plans on hold.
New issues of MGS exceed redemptionsIn 2020, the Government issued €1,335.0 million in long-term debt, and redeemed €519.9 million, such that net issues for the year turned positive for the first time since 2016 (see Table 2.6). According to information published by the Treasury, 17 new bond issues took place, with maturity dates ranging from
-1.0
-0.8
-0.6
-0.4
-0.2
0.0
0.2
J M M J S N J M M J S N J M M J S N J M M J S N J M M J S N J M M J S N
2015 2016 2017 2018 2019 2020
Chart 2.10MONEY MARKET INTEREST RATES(percentages per annum; end of month rates)
ECB MRO 3m EURIBOR3m secondary bund yield (euro benchmark) 3m Primary T-bill yield
Sources: Central Bank of Malta; ECB; Reuters.
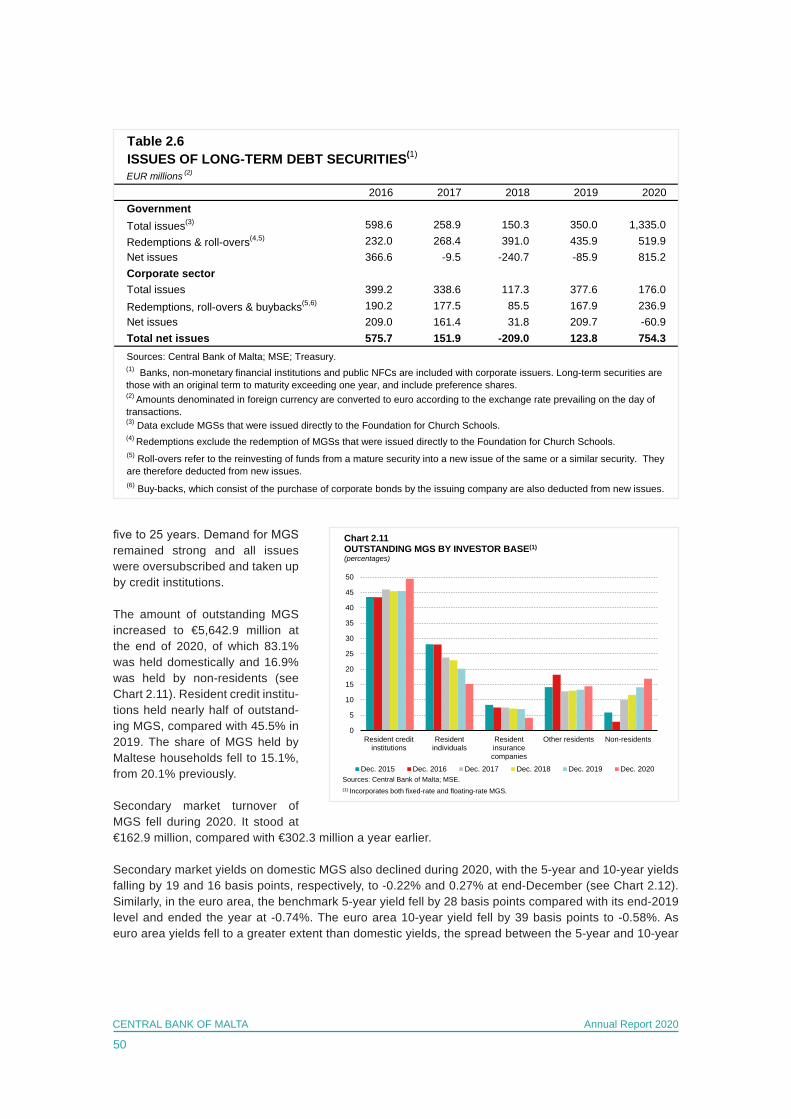
50
CENTRAL BANK OF MALTA Annual Report 2020
five to 25 years. Demand for MGS remained strong and all issues were oversubscribed and taken up by credit institutions.
The amount of outstanding MGS increased to €5,642.9 million at the end of 2020, of which 83.1% was held domestically and 16.9% was held by non-residents (see Chart 2.11). Resident credit institu-tions held nearly half of outstand-ing MGS, compared with 45.5% in 2019. The share of MGS held by Maltese households fell to 15.1%, from 20.1% previously.
Secondary market turnover of MGS fell during 2020. It stood at €162.9 million, compared with €302.3 million a year earlier.
Secondary market yields on domestic MGS also declined during 2020, with the 5-year and 10-year yields falling by 19 and 16 basis points, respectively, to -0.22% and 0.27% at end-December (see Chart 2.12). Similarly, in the euro area, the benchmark 5-year yield fell by 28 basis points compared with its end-2019 level and ended the year at -0.74%. The euro area 10-year yield fell by 39 basis points to -0.58%. As euro area yields fell to a greater extent than domestic yields, the spread between the 5-year and 10-year
2016 2017 2018 2019 2020GovernmentTotal issues(3) 598.6 258.9 150.3 350.0 1,335.0Redemptions & roll-overs(4,5) 232.0 268.4 391.0 435.9 519.9Net issues 366.6 -9.5 -240.7 -85.9 815.2Corporate sectorTotal issues 399.2 338.6 117.3 377.6 176.0Redemptions, roll-overs & buybacks(5,6) 190.2 177.5 85.5 167.9 236.9Net issues 209.0 161.4 31.8 209.7 -60.9Total net issues 575.7 151.9 -209.0 123.8 754.3
(1) Banks, non-monetary financial institutions and public NFCs are included with corporate issuers. Long-term securities are those with an original term to maturity exceeding one year, and include preference shares.
Sources: Central Bank of Malta; MSE; Treasury.
(2) Amounts denominated in foreign currency are converted to euro according to the exchange rate prevailing on the day of transactions.
(4) Redemptions exclude the redemption of MGSs that were issued directly to the Foundation for Church Schools. (5) Roll-overs refer to the reinvesting of funds from a mature security into a new issue of the same or a similar security. They are therefore deducted from new issues. (6) Buy-backs, which consist of the purchase of corporate bonds by the issuing company are also deducted from new issues.
(3) Data exclude MGSs that were issued directly to the Foundation for Church Schools.
ISSUES OF LONG-TERM DEBT SECURITIES(1)Table 2.6
EUR millions (2)
0
5
10
15
20
25
30
35
40
45
50
Resident creditinstitutions
Residentindividuals
Residentinsurancecompanies
Other residents Non-residents
Chart 2.11OUTSTANDING MGS BY INVESTOR BASE(1)
(percentages)
Dec. 2015 Dec. 2016 Dec. 2017 Dec. 2018 Dec. 2019 Dec. 2020Sources: Central Bank of Malta; MSE.(1) Incorporates both fixed-rate and floating-rate MGS.
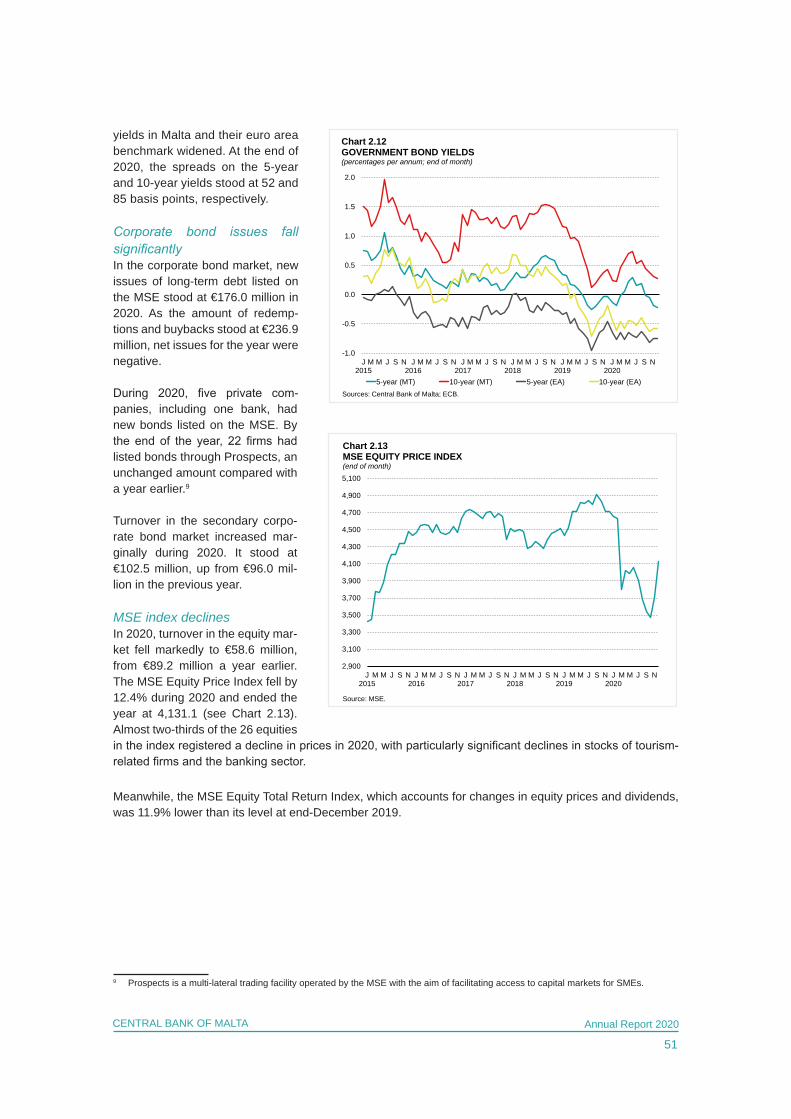
51
CENTRAL BANK OF MALTA Annual Report 2020
yields in Malta and their euro area benchmark widened. At the end of 2020, the spreads on the 5-year and 10-year yields stood at 52 and 85 basis points, respectively.
Corporate bond issues fall significantlyIn the corporate bond market, new issues of long-term debt listed on the MSE stood at €176.0 million in 2020. As the amount of redemp-tions and buybacks stood at €236.9 million, net issues for the year were negative.
During 2020, five private com-panies, including one bank, had new bonds listed on the MSE. By the end of the year, 22 firms had listed bonds through Prospects, an unchanged amount compared with a year earlier.9
Turnover in the secondary corpo-rate bond market increased mar-ginally during 2020. It stood at €102.5 million, up from €96.0 mil-lion in the previous year.
MSE index declinesIn 2020, turnover in the equity mar-ket fell markedly to €58.6 million, from €89.2 million a year earlier. The MSE Equity Price Index fell by 12.4% during 2020 and ended the year at 4,131.1 (see Chart 2.13). Almost two-thirds of the 26 equities in the index registered a decline in prices in 2020, with particularly significant declines in stocks of tourism-related firms and the banking sector.
Meanwhile, the MSE Equity Total Return Index, which accounts for changes in equity prices and dividends, was 11.9% lower than its level at end-December 2019.
9 Prospects is a multi-lateral trading facility operated by the MSE with the aim of facilitating access to capital markets for SMEs.
-1.0
-0.5
0.0
0.5
1.0
1.5
2.0
J2015
M M J S N J2016
M M J S N J2017
M M J S N J2018
M M J S N J2019
M M J S N J2020
M M J S N
5-year (MT) 10-year (MT) 5-year (EA) 10-year (EA)
Chart 2.12GOVERNMENT BOND YIELDS(percentages per annum; end of month)
Sources: Central Bank of Malta; ECB.
2,900
3,100
3,300
3,500
3,700
3,900
4,100
4,300
4,500
4,700
4,900
5,100
J2015
M M J S N J2016
M M J S N J2017
M M J S N J2018
M M J S N J2019
M M J S N J2020
M M J S N
Chart 2.13MSE EQUITY PRICE INDEX(end of month)
Source: MSE.
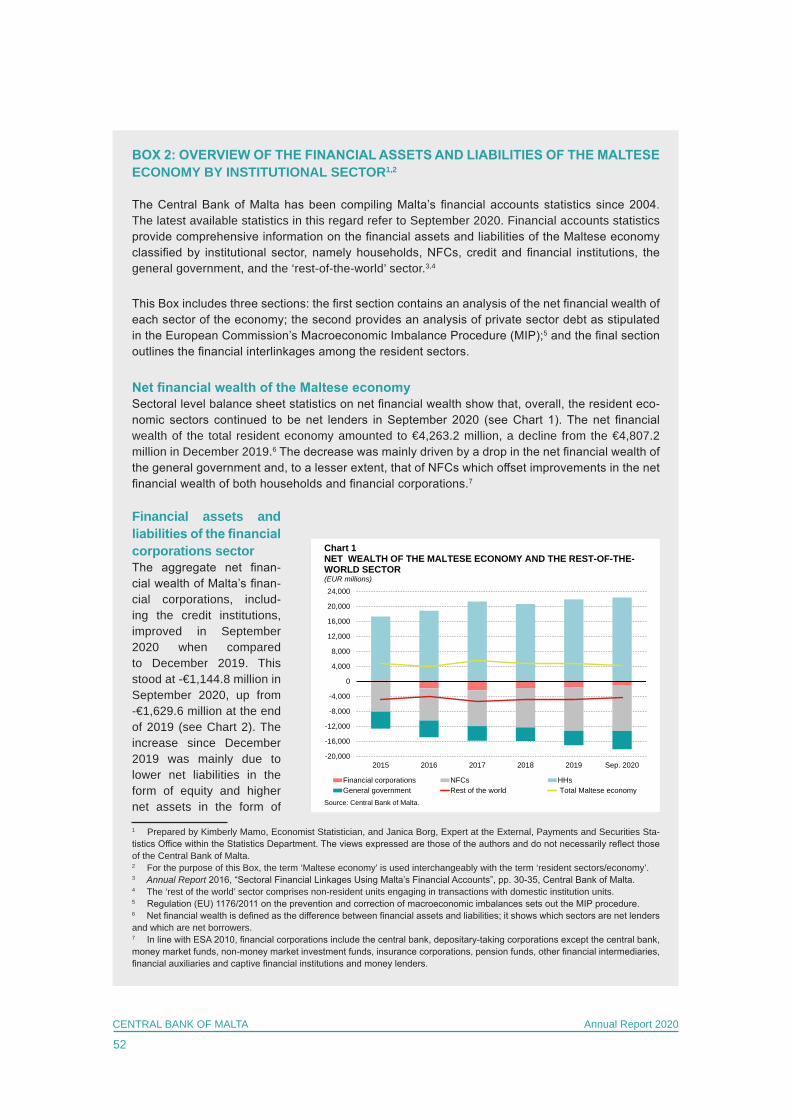
52
CENTRAL BANK OF MALTA Annual Report 2020
BOX 2: OVERVIEW OF THE FINANCIAL ASSETS AND LIABILITIES OF THE MALTESE ECONOMY BY INSTITUTIONAL SECTOR1,2
The Central Bank of Malta has been compiling Malta’s financial accounts statistics since 2004. The latest available statistics in this regard refer to September 2020. Financial accounts statistics provide comprehensive information on the financial assets and liabilities of the Maltese economy classified by institutional sector, namely households, NFCs, credit and financial institutions, the general government, and the ‘rest-of-the-world’ sector.3,4
This Box includes three sections: the first section contains an analysis of the net financial wealth of each sector of the economy; the second provides an analysis of private sector debt as stipulated in the European Commission’s Macroeconomic Imbalance Procedure (MIP);5 and the final section outlines the financial interlinkages among the resident sectors.
Net financial wealth of the Maltese economySectoral level balance sheet statistics on net financial wealth show that, overall, the resident eco-nomic sectors continued to be net lenders in September 2020 (see Chart 1). The net financial wealth of the total resident economy amounted to €4,263.2 million, a decline from the €4,807.2 million in December 2019.6 The decrease was mainly driven by a drop in the net financial wealth of the general government and, to a lesser extent, that of NFCs which offset improvements in the net financial wealth of both households and financial corporations.7
Financial assets and liabilities of the financial corporations sectorThe aggregate net finan-cial wealth of Malta’s finan-cial corporations, includ-ing the credit institutions, improved in September 2020 when compared to December 2019. This stood at -€1,144.8 million in September 2020, up from -€1,629.6 million at the end of 2019 (see Chart 2). The increase since December 2019 was mainly due to lower net liabilities in the form of equity and higher net assets in the form of
1 Prepared by Kimberly Mamo, Economist Statistician, and Janica Borg, Expert at the External, Payments and Securities Sta-tistics Office within the Statistics Department. The views expressed are those of the authors and do not necessarily reflect those of the Central Bank of Malta.2 For the purpose of this Box, the term ‘Maltese economy’ is used interchangeably with the term ‘resident sectors/economy’.3 Annual Report 2016, “Sectoral Financial Linkages Using Malta’s Financial Accounts”, pp. 30-35, Central Bank of Malta.4 The ‘rest of the world’ sector comprises non-resident units engaging in transactions with domestic institution units.5 Regulation (EU) 1176/2011 on the prevention and correction of macroeconomic imbalances sets out the MIP procedure.6 Net financial wealth is defined as the difference between financial assets and liabilities; it shows which sectors are net lenders and which are net borrowers.7 In line with ESA 2010, financial corporations include the central bank, depositary-taking corporations except the central bank, money market funds, non-money market investment funds, insurance corporations, pension funds, other financial intermediaries, financial auxiliaries and captive financial institutions and money lenders.
-20,000
-16,000
-12,000
-8,000
-4,000
0
4,000
8,000
12,000
16,000
20,000
24,000
2015 2016 2017 2018 2019 Sep. 2020
Financial corporations NFCs HHsGeneral government Rest of the world Total Maltese economy
Source: Central Bank of Malta.
Chart 1NET WEALTH OF THE MALTESE ECONOMY AND THE REST-OF-THE-WORLD SECTOR(EUR millions)
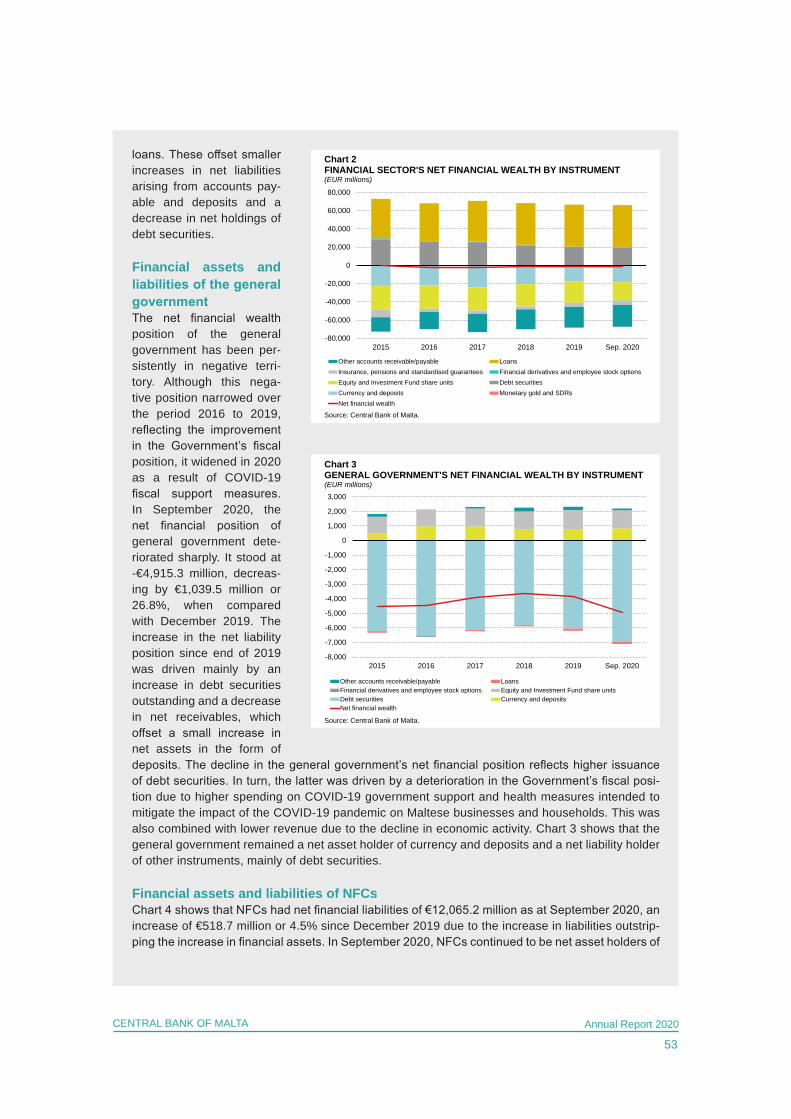
53
CENTRAL BANK OF MALTA Annual Report 2020
loans. These offset smaller increases in net liabilities arising from accounts pay-able and deposits and a decrease in net holdings of debt securities.
Financial assets and liabilities of the general governmentThe net financial wealth position of the general government has been per-sistently in negative terri-tory. Although this nega-tive position narrowed over the period 2016 to 2019, reflecting the improvement in the Government’s fiscal position, it widened in 2020 as a result of COVID-19 fiscal support measures. In September 2020, the net financial position of general government dete-riorated sharply. It stood at -€4,915.3 million, decreas-ing by €1,039.5 million or 26.8%, when compared with December 2019. The increase in the net liability position since end of 2019 was driven mainly by an increase in debt securities outstanding and a decrease in net receivables, which offset a small increase in net assets in the form of deposits. The decline in the general government’s net financial position reflects higher issuance of debt securities. In turn, the latter was driven by a deterioration in the Government’s fiscal posi-tion due to higher spending on COVID-19 government support and health measures intended to mitigate the impact of the COVID-19 pandemic on Maltese businesses and households. This was also combined with lower revenue due to the decline in economic activity. Chart 3 shows that the general government remained a net asset holder of currency and deposits and a net liability holder of other instruments, mainly of debt securities.
Financial assets and liabilities of NFCsChart 4 shows that NFCs had net financial liabilities of €12,065.2 million as at September 2020, an increase of €518.7 million or 4.5% since December 2019 due to the increase in liabilities outstrip-ping the increase in financial assets. In September 2020, NFCs continued to be net asset holders of
-80,000
-60,000
-40,000
-20,000
0
20,000
40,000
60,000
80,000
2015 2016 2017 2018 2019 Sep. 2020
Other accounts receivable/payable LoansInsurance, pensions and standardised guarantees Financial derivatives and employee stock optionsEquity and Investment Fund share units Debt securitiesCurrency and deposits Monetary gold and SDRsNet financial wealth
Source: Central Bank of Malta.
Chart 2FINANCIAL SECTOR'S NET FINANCIAL WEALTH BY INSTRUMENT(EUR millions)
-8,000
-7,000
-6,000
-5,000
-4,000
-3,000
-2,000
-1,000
0
1,000
2,000
3,000
2015 2016 2017 2018 2019 Sep. 2020
Other accounts receivable/payable LoansFinancial derivatives and employee stock options Equity and Investment Fund share unitsDebt securities Currency and depositsNet financial wealth
Source: Central Bank of Malta.
Chart 3GENERAL GOVERNMENT'S NET FINANCIAL WEALTH BY INSTRUMENT(EUR millions)
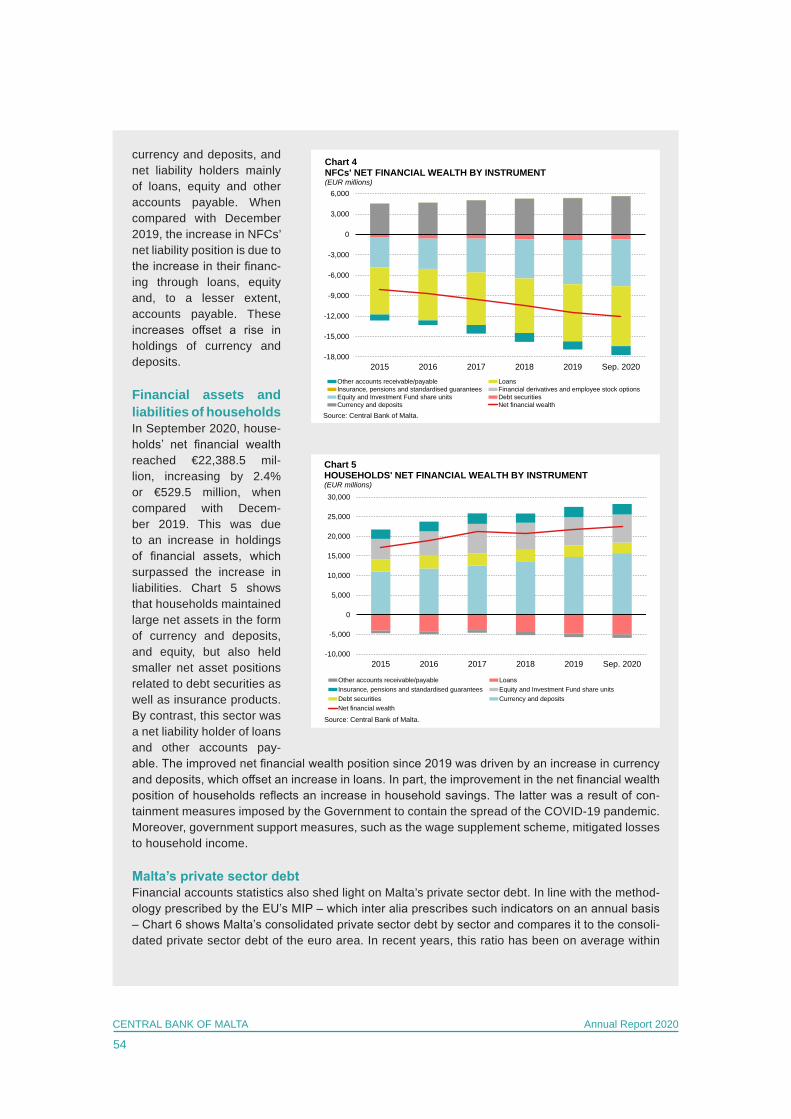
54
CENTRAL BANK OF MALTA Annual Report 2020
currency and deposits, and net liability holders mainly of loans, equity and other accounts payable. When compared with December 2019, the increase in NFCs’ net liability position is due to the increase in their financ-ing through loans, equity and, to a lesser extent, accounts payable. These increases offset a rise in holdings of currency and deposits.
Financial assets and liabilities of householdsIn September 2020, house-holds’ net financial wealth reached €22,388.5 mil-lion, increasing by 2.4% or €529.5 million, when compared with Decem-ber 2019. This was due to an increase in holdings of financial assets, which surpassed the increase in liabilities. Chart 5 shows that households maintained large net assets in the form of currency and deposits, and equity, but also held smaller net asset positions related to debt securities as well as insurance products. By contrast, this sector was a net liability holder of loans and other accounts pay-able. The improved net financial wealth position since 2019 was driven by an increase in currency and deposits, which offset an increase in loans. In part, the improvement in the net financial wealth position of households reflects an increase in household savings. The latter was a result of con-tainment measures imposed by the Government to contain the spread of the COVID-19 pandemic. Moreover, government support measures, such as the wage supplement scheme, mitigated losses to household income.
Malta’s private sector debtFinancial accounts statistics also shed light on Malta’s private sector debt. In line with the method-ology prescribed by the EU’s MIP – which inter alia prescribes such indicators on an annual basis – Chart 6 shows Malta’s consolidated private sector debt by sector and compares it to the consoli-dated private sector debt of the euro area. In recent years, this ratio has been on average within
-10,000
-5,000
0
5,000
10,000
15,000
20,000
25,000
30,000
2015 2016 2017 2018 2019 Sep. 2020
Other accounts receivable/payable LoansInsurance, pensions and standardised guarantees Equity and Investment Fund share unitsDebt securities Currency and depositsNet financial wealth
Source: Central Bank of Malta.
Chart 5HOUSEHOLDS' NET FINANCIAL WEALTH BY INSTRUMENT(EUR millions)
-18,000
-15,000
-12,000
-9,000
-6,000
-3,000
0
3,000
6,000
2015 2016 2017 2018 2019 Sep. 2020
Chart 4NFCs' NET FINANCIAL WEALTH BY INSTRUMENT(EUR millions)
Other accounts receivable/payable LoansInsurance, pensions and standardised guarantees Financial derivatives and employee stock optionsEquity and Investment Fund share units Debt securitiesCurrency and deposits Net financial wealth
Source: Central Bank of Malta.

55
CENTRAL BANK OF MALTA Annual Report 2020
the debt-to-GDP threshold of 133% set by the MIP.8,9
As at September 2020, the indicator stood at 135.4%, exceeding the threshold by 2.4% and its end-2019 level of 123.0%. Notwith-standing this increase, the indicator stood 10.3 per-centage points lower than the euro area average (see Chart 6).10
The latest increase was brought about by a 4.4% increase in NFCs’ debt, a 3.6% rise in households’ debt, and a decrease of 5.4% in GDP – reflecting the impact of COVID-19 on eco-nomic activity.
Corporate debt constitutes on average 60.7% of the consolidated private sec-tor debt. Chart 7 shows the unconsolidated debt of NFCs in the form of debt securities and loans by creditor sectors, the latter constituting the financial corporations, households, NFCs, general government, and the rest of the world sector. From this perspec-tive, the largest exposures stemmed from liabilities to financial corporations and the NFC sector itself.
Firms in Malta rely significantly more on loans than on debt securities. Even though the issuance of debt securities increased over the years, this still remained relatively low, amounting to 4.4% of total NFCs’ debt in the third quarter of 2020. Over the years, bank credit has been one of the main sources of financing for NFCs although the importance of this source of funding has been declining over time. In turn, non-bank financing became more significant, particularly taking the form of intra-group lending 8 The private sector debt is the stock of liabilities in the form of loans and securities other than shares held by NFCs and House-holds and NPISH. Transactions within sectors are eliminated (i.e. statistics are thus consolidated). The threshold of 133% of GDP is derived from the upper quartile of the statistical distribution of the indicator. Annual data for the period 1995-2007 were used to establish the threshold. The definition of private sector debt is in line with the EU’s MIP definitions.9 In terms of EU Regulation No. 1176/2011 of the European Parliament and of the Council of 16 November 2011 on the preven-tion and correction of macroeconomic imbalances.10 Eurostat statistics for the euro area are only available annually. On the other hand, the ECB statistical data warehouse con-tains quarterly data. There are discrepancies between the two sources due to different vintages. For this analysis, Eurostat data are used until 2019, while ECB data were utilised to obtain the September 2020 data.
0
20
40
60
80
100
120
140
160
2015 2016 2017 2018 2019 Sep. 2020
Consolidated debt of NFC Debt of householdsEA − Consolidated private sector debt MIP scoreboard indicators threshold
Sources: Central Bank of Malta; Eurostat; ECB.
Chart 6PRIVATE SECTOR'S DEBT AS % OF GDP (CONSOLIDATED)(per cent)
0
2,000
4,000
6,000
8,000
10,000
12,000
14,000
16,000
18,000
20,000
2015 2016 2017 2018 2019 Sep. 2020
Chart 7NFC DEBT by creditor sector(EUR millions)
Financial corporations NFCs Households General government Rest of the world
Source: Central Bank of Malta.
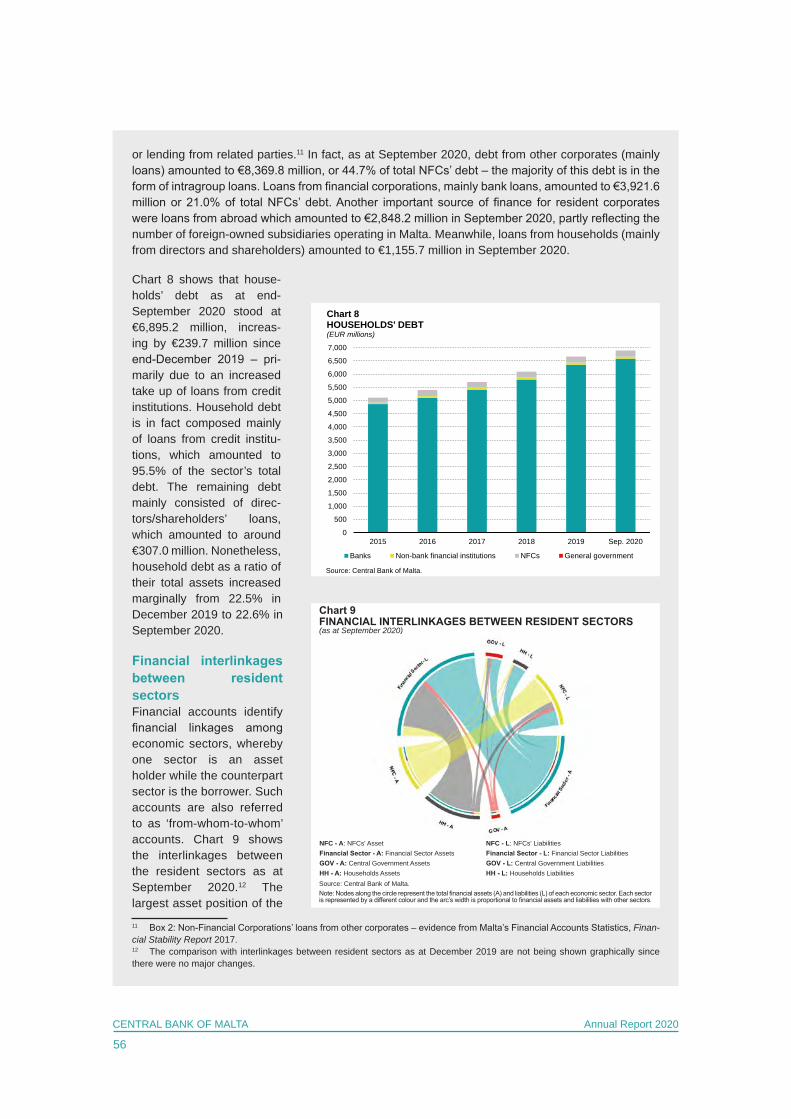
56
CENTRAL BANK OF MALTA Annual Report 2020
or lending from related parties.11 In fact, as at September 2020, debt from other corporates (mainly loans) amounted to €8,369.8 million, or 44.7% of total NFCs’ debt – the majority of this debt is in the form of intragroup loans. Loans from financial corporations, mainly bank loans, amounted to €3,921.6 million or 21.0% of total NFCs’ debt. Another important source of finance for resident corporates were loans from abroad which amounted to €2,848.2 million in September 2020, partly reflecting the number of foreign-owned subsidiaries operating in Malta. Meanwhile, loans from households (mainly from directors and shareholders) amounted to €1,155.7 million in September 2020.
Chart 8 shows that house-holds’ debt as at end-September 2020 stood at €6,895.2 million, increas-ing by €239.7 million since end-December 2019 – pri-marily due to an increased take up of loans from credit institutions. Household debt is in fact composed mainly of loans from credit institu-tions, which amounted to 95.5% of the sector’s total debt. The remaining debt mainly consisted of direc-tors/shareholders’ loans, which amounted to around €307.0 million. Nonetheless, household debt as a ratio of their total assets increased marginally from 22.5% in December 2019 to 22.6% in September 2020.
Financial interlinkages between resident sectorsFinancial accounts identify financial linkages among economic sectors, whereby one sector is an asset holder while the counterpart sector is the borrower. Such accounts are also referred to as ‘from-whom-to-whom’ accounts. Chart 9 shows the interlinkages between the resident sectors as at September 2020.12 The largest asset position of the
11 Box 2: Non-Financial Corporations’ loans from other corporates – evidence from Malta’s Financial Accounts Statistics, Finan-cial Stability Report 2017.12 The comparison with interlinkages between resident sectors as at December 2019 are not being shown graphically since there were no major changes.
0
500
1,000
1,500
2,000
2,500
3,000
3,500
4,000
4,500
5,000
5,500
6,000
6,500
7,000
2015 2016 2017 2018 2019 Sep. 2020
Chart 8HOUSEHOLDS' DEBT (EUR millions)
Banks Non-bank financial institutions NFCs General government
Source: Central Bank of Malta.
Chart 9FINANCIAL INTERLINKAGES BETWEEN RESIDENT SECTORS(as at September 2020)
Source: Central Bank of Malta.Note: Nodes along the circle represent the total financial assets (A) and liabilities (L) of each economic sector. Each sector is represented by a different colour and the arc’s width is proportional to financial assets and liabilities with other sectors.
NFC - A: NFCs' AssetFinancial Sector - A: Financial Sector AssetsGOV - A: Central Government AssetsHH - A: Households Assets
NFC - L: NFCs' LiabilitiesFinancial Sector - L: Financial Sector LiabilitiesGOV - L: Central Government LiabilitiesHH - L: Households Liabilities
57
CENTRAL BANK OF MALTA Annual Report 2020
financial sector, including the credit institutions, reflects intra-sectoral holdings – that is, holdings with other credit and financial corporations, mainly in the form of equity and investments funds, and deposits. These amounted to 59.1% of their total domestic holdings in the third quarter of 2020, a marginal decrease from 61.6% in December 2019. Chart 9 also shows that the financial sector has significant interlinkages with households and NFCs mainly through banks’ funding. Moreover, the general government holds around 45.3% of its total domestic financial assets with the financial sector, primarily in the form of deposits. This share decreased from 48.4% in December 2019. With regards to NFCs, most of their assets are held by other NFCs. They decreased marginally to 66.8% of their total domestic assets from 67.7% over the period December 2019 to September 2020. Finally, households’ domestic asset holdings continued to be held mainly with the financial sector. Households’ domestic financial asset holdings increased to 81.4% in September 2020, from 80.9% in December 2019.
Further statistical information can be found on the website of the Central Bank of Malta at: www.centralbankmalta.org/financial-accounts.
58
CENTRAL BANK OF MALTA Annual Report 2020
3. OUTPUT, EMPLOYMENT AND PRICES
In the context of the containment measures introduced by governments worldwide to stem the spread of COVID-19, the Bank’s Business Conditions Index declined to -3.2 in 2020 from -0.3 in 2019. At the same time, the output gap turned negative as the pandemic brought about a large degree of underutilisation of the economy’s productive capacity.
Real GDP fell by 7.0% in 2020, following an increase of 5.5% a year earlier. The contraction in economic activity was primarily driven by net exports. Domestic demand also contributed negatively, but to a lesser extent. Real gross value added (GVA) data show that the decline in real GDP was largely driven by the services sector. This reflects the fact that the COVID-19 containment measures mostly hit the sector com-prising wholesale and retail trade, transportation, and accommodation and food service activities. The sec-tor was impacted strongly by travel disruptions during the year, the temporary shutdown of non-essential services and other COVID-19 related containment measures. The GVA of firms involved in professional, technical and scientific activities as well as the real estate sector also contracted on a year earlier, but to a much lesser extent. Meanwhile, activity in the manufacturing sector was broadly unchanged from 2019, while digital sectors such as remote gaming, and information and communication grew significantly.
Labour Force Survey (LFS) data for the first three quarters of 2020 show that although the labour market was negatively affected by the COVID-19 pandemic, employment showed a strong degree of resilience considering the sharp contraction in activity. Both the labour force and employment rose at a slower rate when compared to the previous year, while the unemployment rate increased. The latter also rose above the Bank’s estimate of structural unemployment for the first time since 2015. However, the unemployment rate remained low from a historical perspective and well below that in the euro area.
Administrative data show that in 2020, the average number of registered unemployed rose by 1,464, to 3,162 persons. However, this mostly reflects increasing unemployment between March and May, as the number of registered unemployed persons decreased to 2,765 by December.
Annual inflation based on the Harmonised Index of Consumer Prices (HICP) fell to 0.8% in 2020, from 1.5% in 2019. The Retail Price Index (RPI) shows too that inflation moderated over this period – falling to 0.6%, from 1.6%. The drop in inflation in 2020 extends the downward trend exhibited since mid-2019. Moreover, the decline in economic activity due to COVID-19 has likely put further downward pressure on prices in 2020, though this might have been partly mitigated by supply-chain disruptions and costs related to compliance with containment measures, particularly in services and food.
Meanwhile, the annual average rate of change in the producer price index fell to 0.3% in 2020. By con-trast, Malta’s Harmonised Competitiveness Indicators (HCIs) pointed to a deterioration in international price competitiveness, on account of unfavourable exchange rate and relative price movements. On the other hand, Malta’s Unit Labour Cost (ULC ) index (per person) accelerated to 10.5% in 2020, following 3.4% growth in 2019.
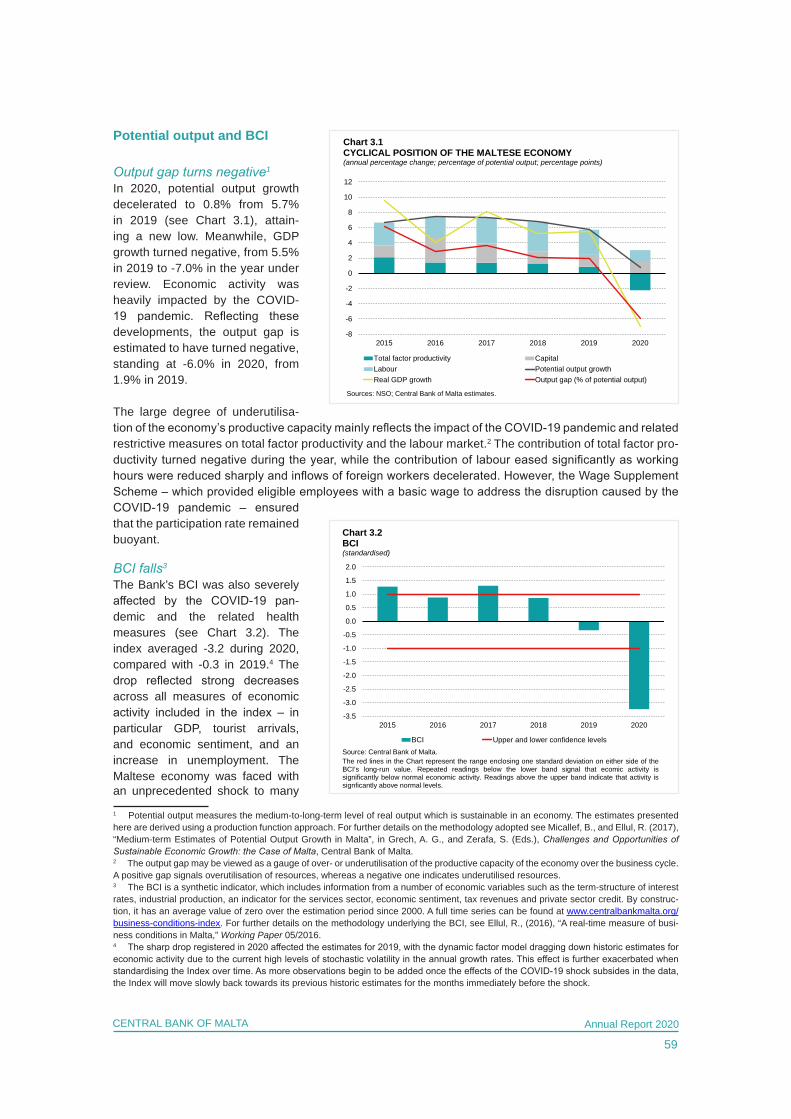
59
CENTRAL BANK OF MALTA Annual Report 2020
Potential output and BCI
Output gap turns negative1
In 2020, potential output growth decelerated to 0.8% from 5.7% in 2019 (see Chart 3.1), attain-ing a new low. Meanwhile, GDP growth turned negative, from 5.5% in 2019 to -7.0% in the year under review. Economic activity was heavily impacted by the COVID-19 pandemic. Reflecting these developments, the output gap is estimated to have turned negative, standing at -6.0% in 2020, from 1.9% in 2019.
The large degree of underutilisa-tion of the economy’s productive capacity mainly reflects the impact of the COVID-19 pandemic and related restrictive measures on total factor productivity and the labour market.2 The contribution of total factor pro-ductivity turned negative during the year, while the contribution of labour eased significantly as working hours were reduced sharply and inflows of foreign workers decelerated. However, the Wage Supplement Scheme – which provided eligible employees with a basic wage to address the disruption caused by the COVID-19 pandemic – ensured that the participation rate remained buoyant.
BCI falls3
The Bank’s BCI was also severely affected by the COVID-19 pan-demic and the related health measures (see Chart 3.2). The index averaged -3.2 during 2020, compared with -0.3 in 2019.4 The drop reflected strong decreases across all measures of economic activity included in the index – in particular GDP, tourist arrivals, and economic sentiment, and an increase in unemployment. The Maltese economy was faced with an unprecedented shock to many
1 Potential output measures the medium-to-long-term level of real output which is sustainable in an economy. The estimates presented here are derived using a production function approach. For further details on the methodology adopted see Micallef, B., and Ellul, R. (2017), “Medium-term Estimates of Potential Output Growth in Malta”, in Grech, A. G., and Zerafa, S. (Eds.), Challenges and Opportunities of Sustainable Economic Growth: the Case of Malta, Central Bank of Malta.2 The output gap may be viewed as a gauge of over- or underutilisation of the productive capacity of the economy over the business cycle. A positive gap signals overutilisation of resources, whereas a negative one indicates underutilised resources.3 The BCI is a synthetic indicator, which includes information from a number of economic variables such as the term-structure of interest rates, industrial production, an indicator for the services sector, economic sentiment, tax revenues and private sector credit. By construc-tion, it has an average value of zero over the estimation period since 2000. A full time series can be found at www.centralbankmalta.org/business-conditions-index. For further details on the methodology underlying the BCI, see Ellul, R., (2016), “A real-time measure of busi-ness conditions in Malta,” Working Paper 05/2016.4 The sharp drop registered in 2020 affected the estimates for 2019, with the dynamic factor model dragging down historic estimates for economic activity due to the current high levels of stochastic volatility in the annual growth rates. This effect is further exacerbated when standardising the Index over time. As more observations begin to be added once the effects of the COVID-19 shock subsides in the data, the Index will move slowly back towards its previous historic estimates for the months immediately before the shock.
-3.5
-3.0
-2.5
-2.0
-1.5
-1.0
-0.5
0.0
0.5
1.0
1.5
2.0
2015 2016 2017 2018 2019 2020
BCI Upper and lower confidence levels
Chart 3.2 BCI(standardised)
Source: Central Bank of Malta.The red lines in the Chart represent the range enclosing one standard deviation on either side of theBCI’s long-run value. Repeated readings below the lower band signal that ecomic activity issignificantly below normal economic activity. Readings above the upper band indicate that activity issignficantly above normal levels.
-8
-6
-4
-2
0
2
4
6
8
10
12
2015 2016 2017 2018 2019 2020
Total factor productivity CapitalLabour Potential output growthReal GDP growth Output gap (% of potential output)
Sources: NSO; Central Bank of Malta estimates.
Chart 3.1CYCLICAL POSITION OF THE MALTESE ECONOMY (annual percentage change; percentage of potential output; percentage points)
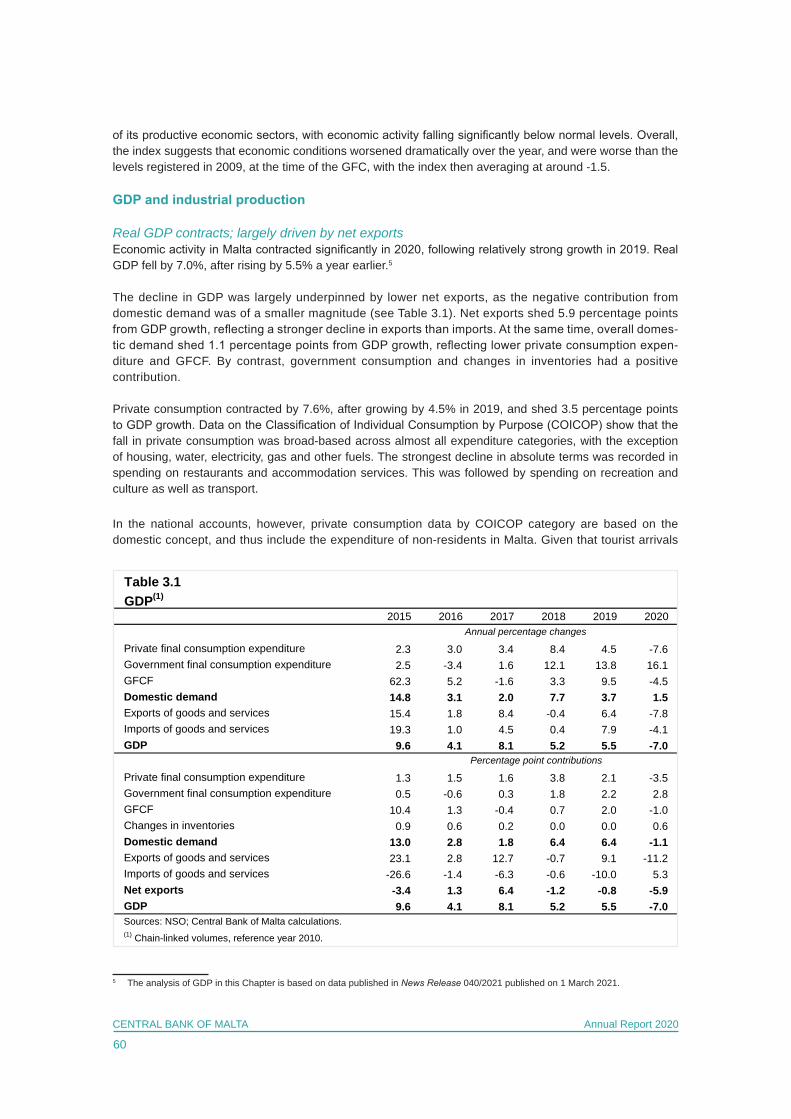
60
CENTRAL BANK OF MALTA Annual Report 2020
of its productive economic sectors, with economic activity falling significantly below normal levels. Overall, the index suggests that economic conditions worsened dramatically over the year, and were worse than the levels registered in 2009, at the time of the GFC, with the index then averaging at around -1.5.
GDP and industrial production
Real GDP contracts; largely driven by net exportsEconomic activity in Malta contracted significantly in 2020, following relatively strong growth in 2019. Real GDP fell by 7.0%, after rising by 5.5% a year earlier.5 The decline in GDP was largely underpinned by lower net exports, as the negative contribution from domestic demand was of a smaller magnitude (see Table 3.1). Net exports shed 5.9 percentage points from GDP growth, reflecting a stronger decline in exports than imports. At the same time, overall domes-tic demand shed 1.1 percentage points from GDP growth, reflecting lower private consumption expen-diture and GFCF. By contrast, government consumption and changes in inventories had a positive contribution.
Private consumption contracted by 7.6%, after growing by 4.5% in 2019, and shed 3.5 percentage points to GDP growth. Data on the Classification of Individual Consumption by Purpose (COICOP) show that the fall in private consumption was broad-based across almost all expenditure categories, with the exception of housing, water, electricity, gas and other fuels. The strongest decline in absolute terms was recorded in spending on restaurants and accommodation services. This was followed by spending on recreation and culture as well as transport.
In the national accounts, however, private consumption data by COICOP category are based on the domestic concept, and thus include the expenditure of non-residents in Malta. Given that tourist arrivals
5 The analysis of GDP in this Chapter is based on data published in News Release 040/2021 published on 1 March 2021.
Table 3.1GDP(1)
2015 2016 2017 2018 2019 2020
Private final consumption expenditure 2.3 3.0 3.4 8.4 4.5 -7.6Government final consumption expenditure 2.5 -3.4 1.6 12.1 13.8 16.1GFCF 62.3 5.2 -1.6 3.3 9.5 -4.5Domestic demand 14.8 3.1 2.0 7.7 3.7 1.5Exports of goods and services 15.4 1.8 8.4 -0.4 6.4 -7.8Imports of goods and services 19.3 1.0 4.5 0.4 7.9 -4.1GDP 9.6 4.1 8.1 5.2 5.5 -7.0
Private final consumption expenditure 1.3 1.5 1.6 3.8 2.1 -3.5Government final consumption expenditure 0.5 -0.6 0.3 1.8 2.2 2.8GFCF 10.4 1.3 -0.4 0.7 2.0 -1.0Changes in inventories 0.9 0.6 0.2 0.0 0.0 0.6Domestic demand 13.0 2.8 1.8 6.4 6.4 -1.1Exports of goods and services 23.1 2.8 12.7 -0.7 9.1 -11.2Imports of goods and services -26.6 -1.4 -6.3 -0.6 -10.0 5.3Net exports -3.4 1.3 6.4 -1.2 -0.8 -5.9GDP 9.6 4.1 8.1 5.2 5.5 -7.0
(1) Chain-linked volumes, reference year 2010.
Annual percentage changes
Percentage point contributions
Sources: NSO; Central Bank of Malta calculations.

61
CENTRAL BANK OF MALTA Annual Report 2020
were very low compared to last year’s levels, certain categories of expenditure were severely affected by the decrease in non-residents’ expenditure in Malta when the domestic concept is applied. Indeed, the decrease in national private consumption, which includes solely the expenditure of residents of Malta, both in Malta and abroad, declined less sharply, with this drop largely reflecting lower expenditure abroad.
In 2020, government consumption grew by 16.1%, mainly due to higher intermediate consumption. In part, this reflects higher expenditure related to COVID-19 health and support measures. At the same time, outlays on compensation of employees rose. Meanwhile, revenue from sales – which is netted against expenditure – declined. Overall, government consumption added 2.8 percentage points to annual GDP growth.
Following an increase of 9.5% in 2019, GFCF fell by 4.5% in 2020, shedding 1.0 percentage point from GDP growth. This primarily reflected a significant decrease in investment in machinery and equipment, and in dwelling investment. These developments offset a strong increase in non-residential investment as well as in intellectual property.
Meanwhile, changes in inventories added 0.6 percentage point to GDP growth in 2020.
During 2020, exports declined by 7.8%, reflecting lower foreign demand for goods and services, supply-chain disruptions and travel restrictions. Imports fell by 4.1% on a year earlier, which mirrors the drop in demand. As exports declined more strongly than imports, net exports shed 5.9 percentage points from GDP growth. A smaller deficit from trade in goods was offset by a narrower surplus on services.
The contributions shown in Table 3.1 are consistent with the approach usually followed in official databases and economic publications. However, this approach does not account for the fact that the import content varies across the different expenditure components. Consequently, they fail to represent the true underlying relative contribution of domestic and external demand to economic growth.
Table 3.2 presents import-adjusted contributions, which address this limitation by apportioning imports to the respective domestic demand components and exports. In line with the sharp fall in imports in the year under review, the majority of import-adjusted contributions are larger than those based on the traditional approach, as reported in Table 3.1. This is particularly the case for exports and, to a lesser extent, private consumption and investment.
Similar to the analysis that emerges from the previous table, the main drivers behind the contraction of real GDP in 2020 were exports and private final consumption. However, import-adjusted exports were
Table 3.2
2015 2016 2017 2018 2019 2020
Private final consumption expenditure 0.2 1.1 1.4 2.5 1.0 -2.6Government final consumption expenditure 0.3 -0.4 0.3 1.5 1.8 2.2GFCF 4.3 0.8 0.1 0.5 0.8 -0.8Changes in inventories 0.2 0.3 0.1 0.0 0.1 0.4Domestic demand 5.1 1.7 1.8 4.4 3.7 -0.7Exports of goods and services 4.5 2.4 6.3 0.7 1.8 -6.3GDP 9.6 4.1 8.1 5.2 5.5 -7.0Source: Central Bank of Malta estimates.(1) Chain-linked volumes, reference year 2010.
Percentage point contributions
IMPORT-ADJUSTED CONTRIBUTIONS TO GDP GROWTH(1)
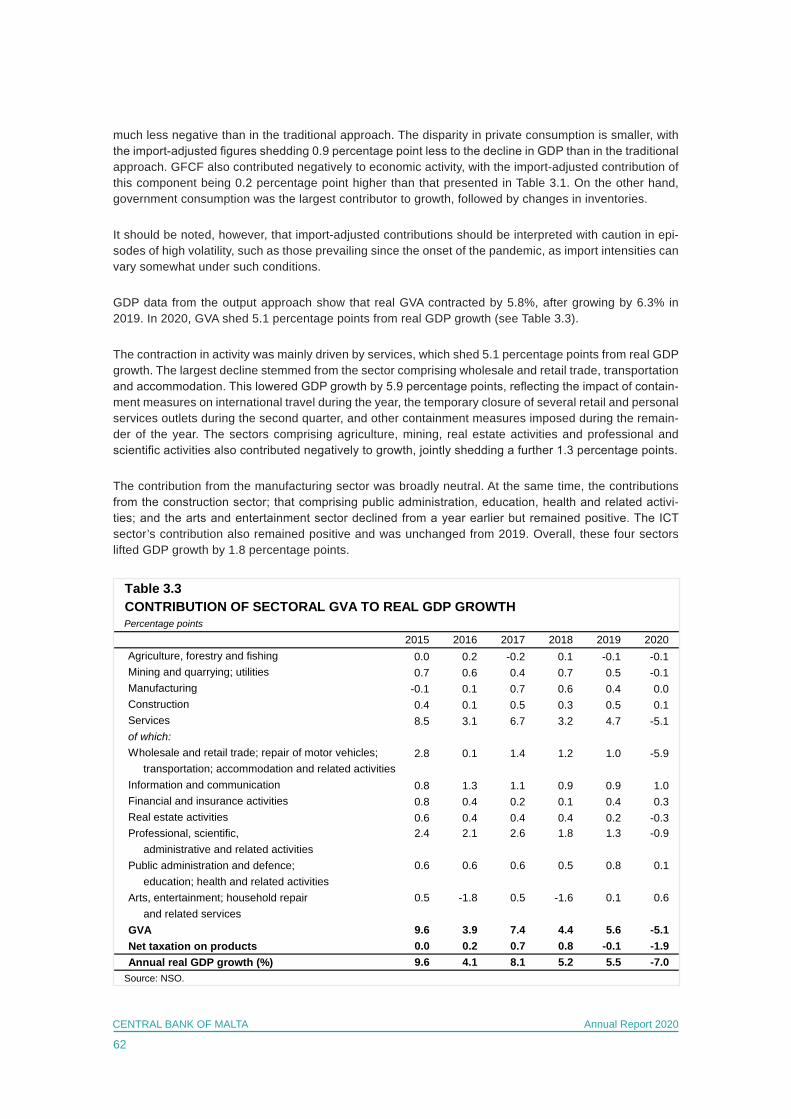
62
CENTRAL BANK OF MALTA Annual Report 2020
much less negative than in the traditional approach. The disparity in private consumption is smaller, with the import-adjusted figures shedding 0.9 percentage point less to the decline in GDP than in the traditional approach. GFCF also contributed negatively to economic activity, with the import-adjusted contribution of this component being 0.2 percentage point higher than that presented in Table 3.1. On the other hand, government consumption was the largest contributor to growth, followed by changes in inventories.
It should be noted, however, that import-adjusted contributions should be interpreted with caution in epi-sodes of high volatility, such as those prevailing since the onset of the pandemic, as import intensities can vary somewhat under such conditions.
GDP data from the output approach show that real GVA contracted by 5.8%, after growing by 6.3% in 2019. In 2020, GVA shed 5.1 percentage points from real GDP growth (see Table 3.3).
The contraction in activity was mainly driven by services, which shed 5.1 percentage points from real GDP growth. The largest decline stemmed from the sector comprising wholesale and retail trade, transportation and accommodation. This lowered GDP growth by 5.9 percentage points, reflecting the impact of contain-ment measures on international travel during the year, the temporary closure of several retail and personal services outlets during the second quarter, and other containment measures imposed during the remain-der of the year. The sectors comprising agriculture, mining, real estate activities and professional and scientific activities also contributed negatively to growth, jointly shedding a further 1.3 percentage points.
The contribution from the manufacturing sector was broadly neutral. At the same time, the contributions from the construction sector; that comprising public administration, education, health and related activi-ties; and the arts and entertainment sector declined from a year earlier but remained positive. The ICT sector’s contribution also remained positive and was unchanged from 2019. Overall, these four sectors lifted GDP growth by 1.8 percentage points.
Table 3.3
Percentage points
2015 2016 2017 2018 2019 2020Agriculture, forestry and fishing 0.0 0.2 -0.2 0.1 -0.1 -0.1Mining and quarrying; utilities 0.7 0.6 0.4 0.7 0.5 -0.1Manufacturing -0.1 0.1 0.7 0.6 0.4 0.0Construction 0.4 0.1 0.5 0.3 0.5 0.1Services 8.5 3.1 6.7 3.2 4.7 -5.1of which:Wholesale and retail trade; repair of motor vehicles; 2.8 0.1 1.4 1.2 1.0 -5.9 transportation; accommodation and related activities Information and communication 0.8 1.3 1.1 0.9 0.9 1.0Financial and insurance activities 0.8 0.4 0.2 0.1 0.4 0.3Real estate activities 0.6 0.4 0.4 0.4 0.2 -0.3Professional, scientific, 2.4 2.1 2.6 1.8 1.3 -0.9 administrative and related activitiesPublic administration and defence; 0.6 0.6 0.6 0.5 0.8 0.1 education; health and related activitiesArts, entertainment; household repair 0.5 -1.8 0.5 -1.6 0.1 0.6 and related servicesGVA 9.6 3.9 7.4 4.4 5.6 -5.1Net taxation on products 0.0 0.2 0.7 0.8 -0.1 -1.9Annual real GDP growth (%) 9.6 4.1 8.1 5.2 5.5 -7.0
Source: NSO.
CONTRIBUTION OF SECTORAL GVA TO REAL GDP GROWTH
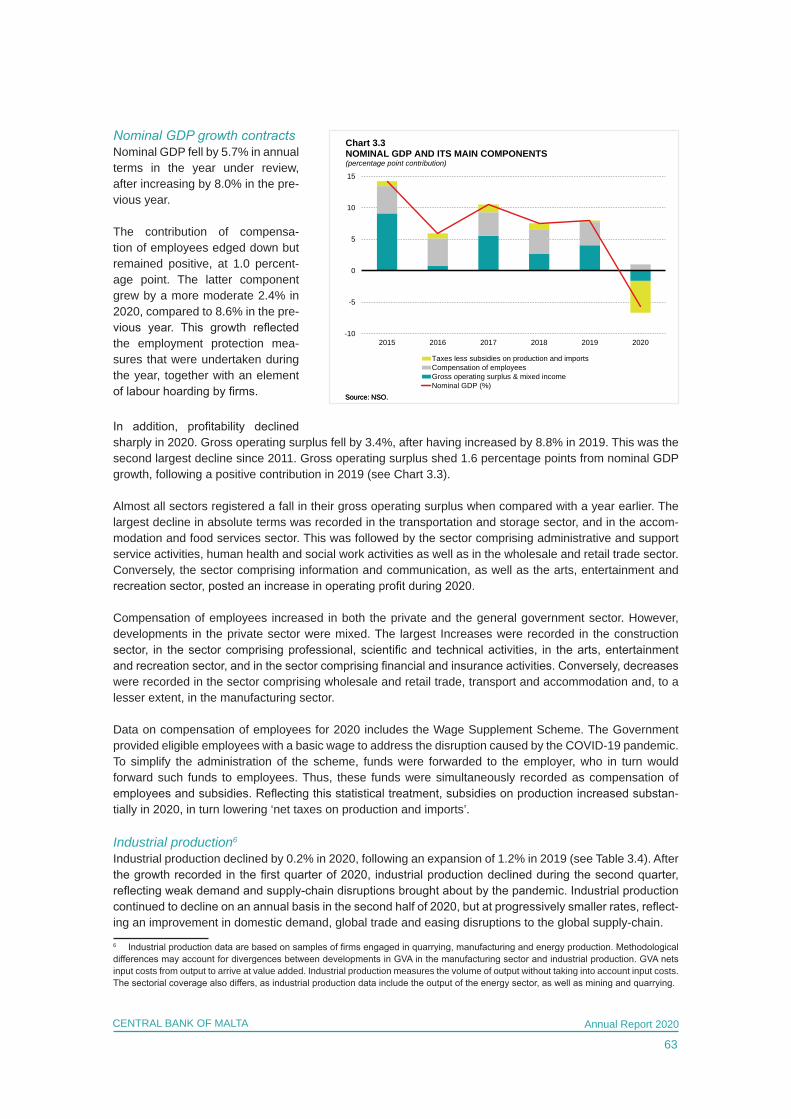
63
CENTRAL BANK OF MALTA Annual Report 2020
Nominal GDP growth contractsNominal GDP fell by 5.7% in annual terms in the year under review, after increasing by 8.0% in the pre-vious year.
The contribution of compensa-tion of employees edged down but remained positive, at 1.0 percent-age point. The latter component grew by a more moderate 2.4% in 2020, compared to 8.6% in the pre-vious year. This growth reflected the employment protection mea-sures that were undertaken during the year, together with an element of labour hoarding by firms.
In addition, profitability declined sharply in 2020. Gross operating surplus fell by 3.4%, after having increased by 8.8% in 2019. This was the second largest decline since 2011. Gross operating surplus shed 1.6 percentage points from nominal GDP growth, following a positive contribution in 2019 (see Chart 3.3).
Almost all sectors registered a fall in their gross operating surplus when compared with a year earlier. The largest decline in absolute terms was recorded in the transportation and storage sector, and in the accom-modation and food services sector. This was followed by the sector comprising administrative and support service activities, human health and social work activities as well as in the wholesale and retail trade sector. Conversely, the sector comprising information and communication, as well as the arts, entertainment and recreation sector, posted an increase in operating profit during 2020.
Compensation of employees increased in both the private and the general government sector. However, developments in the private sector were mixed. The largest Increases were recorded in the construction sector, in the sector comprising professional, scientific and technical activities, in the arts, entertainment and recreation sector, and in the sector comprising financial and insurance activities. Conversely, decreases were recorded in the sector comprising wholesale and retail trade, transport and accommodation and, to a lesser extent, in the manufacturing sector.
Data on compensation of employees for 2020 includes the Wage Supplement Scheme. The Government provided eligible employees with a basic wage to address the disruption caused by the COVID-19 pandemic. To simplify the administration of the scheme, funds were forwarded to the employer, who in turn would forward such funds to employees. Thus, these funds were simultaneously recorded as compensation of employees and subsidies. Reflecting this statistical treatment, subsidies on production increased substan-tially in 2020, in turn lowering ‘net taxes on production and imports’.
Industrial production6
Industrial production declined by 0.2% in 2020, following an expansion of 1.2% in 2019 (see Table 3.4). After the growth recorded in the first quarter of 2020, industrial production declined during the second quarter, reflecting weak demand and supply-chain disruptions brought about by the pandemic. Industrial production continued to decline on an annual basis in the second half of 2020, but at progressively smaller rates, reflect-ing an improvement in domestic demand, global trade and easing disruptions to the global supply-chain.
6 Industrial production data are based on samples of firms engaged in quarrying, manufacturing and energy production. Methodological differences may account for divergences between developments in GVA in the manufacturing sector and industrial production. GVA nets input costs from output to arrive at value added. Industrial production measures the volume of output without taking into account input costs. The sectorial coverage also differs, as industrial production data include the output of the energy sector, as well as mining and quarrying.
-10
-5
0
5
10
15
2015 2016 2017 2018 2019 2020
Taxes less subsidies on production and importsCompensation of employeesGross operating surplus & mixed incomeNominal GDP (%)
Chart 3.3NOMINAL GDP AND ITS MAIN COMPONENTS(percentage point contribution)
Source: NSO.Source: NSO.
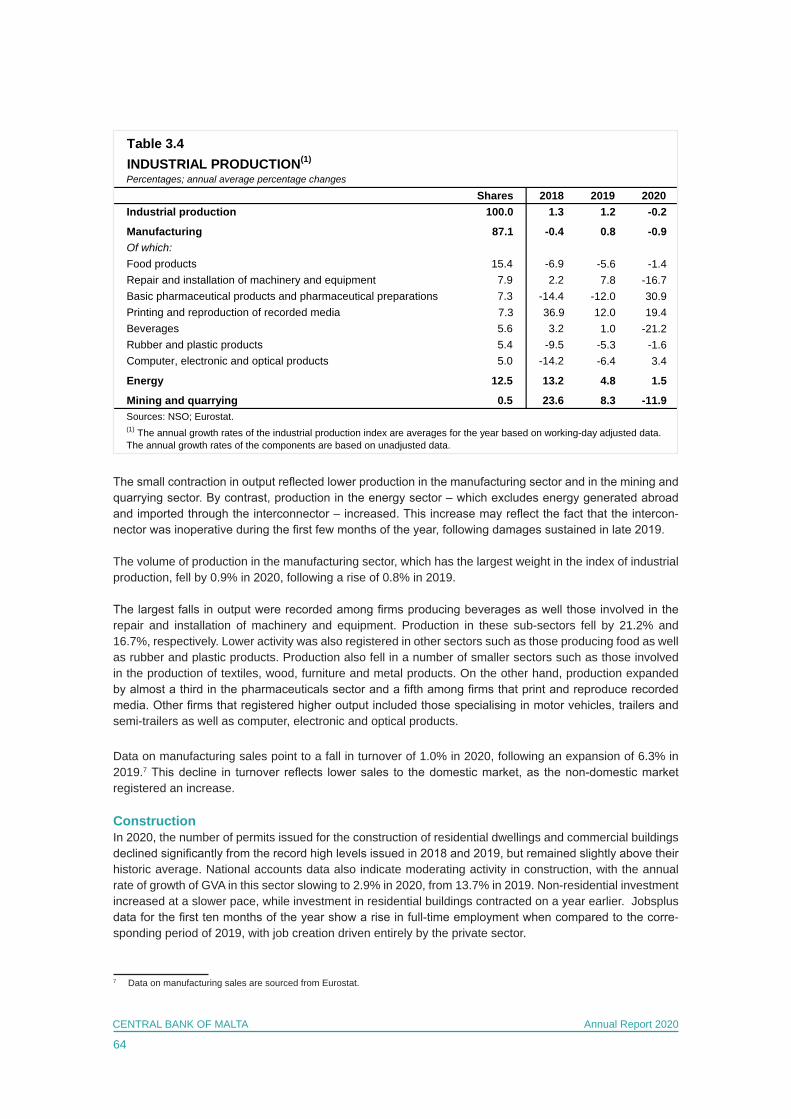
64
CENTRAL BANK OF MALTA Annual Report 2020
The small contraction in output reflected lower production in the manufacturing sector and in the mining and quarrying sector. By contrast, production in the energy sector – which excludes energy generated abroad and imported through the interconnector – increased. This increase may reflect the fact that the intercon-nector was inoperative during the first few months of the year, following damages sustained in late 2019.
The volume of production in the manufacturing sector, which has the largest weight in the index of industrial production, fell by 0.9% in 2020, following a rise of 0.8% in 2019. The largest falls in output were recorded among firms producing beverages as well those involved in the repair and installation of machinery and equipment. Production in these sub-sectors fell by 21.2% and 16.7%, respectively. Lower activity was also registered in other sectors such as those producing food as well as rubber and plastic products. Production also fell in a number of smaller sectors such as those involved in the production of textiles, wood, furniture and metal products. On the other hand, production expanded by almost a third in the pharmaceuticals sector and a fifth among firms that print and reproduce recorded media. Other firms that registered higher output included those specialising in motor vehicles, trailers and semi-trailers as well as computer, electronic and optical products.
Data on manufacturing sales point to a fall in turnover of 1.0% in 2020, following an expansion of 6.3% in 2019.7 This decline in turnover reflects lower sales to the domestic market, as the non-domestic market registered an increase.
ConstructionIn 2020, the number of permits issued for the construction of residential dwellings and commercial buildings declined significantly from the record high levels issued in 2018 and 2019, but remained slightly above their historic average. National accounts data also indicate moderating activity in construction, with the annual rate of growth of GVA in this sector slowing to 2.9% in 2020, from 13.7% in 2019. Non-residential investment increased at a slower pace, while investment in residential buildings contracted on a year earlier. Jobsplus data for the first ten months of the year show a rise in full-time employment when compared to the corre-sponding period of 2019, with job creation driven entirely by the private sector.
7 Data on manufacturing sales are sourced from Eurostat.
Table 3.4INDUSTRIAL PRODUCTION(1)
Percentages; annual average percentage changes
Shares 2018 2019 2020Industrial production 100.0 1.3 1.2 -0.2
Manufacturing 87.1 -0.4 0.8 -0.9Of which:Food products 15.4 -6.9 -5.6 -1.4Repair and installation of machinery and equipment 7.9 2.2 7.8 -16.7Basic pharmaceutical products and pharmaceutical preparations 7.3 -14.4 -12.0 30.9Printing and reproduction of recorded media 7.3 36.9 12.0 19.4Beverages 5.6 3.2 1.0 -21.2Rubber and plastic products 5.4 -9.5 -5.3 -1.6Computer, electronic and optical products 5.0 -14.2 -6.4 3.4
Energy 12.5 13.2 4.8 1.5
Mining and quarrying 0.5 23.6 8.3 -11.9Sources: NSO; Eurostat.(1) The annual growth rates of the industrial production index are averages for the year based on working-day adjusted data. The annual growth rates of the components are based on unadjusted data.
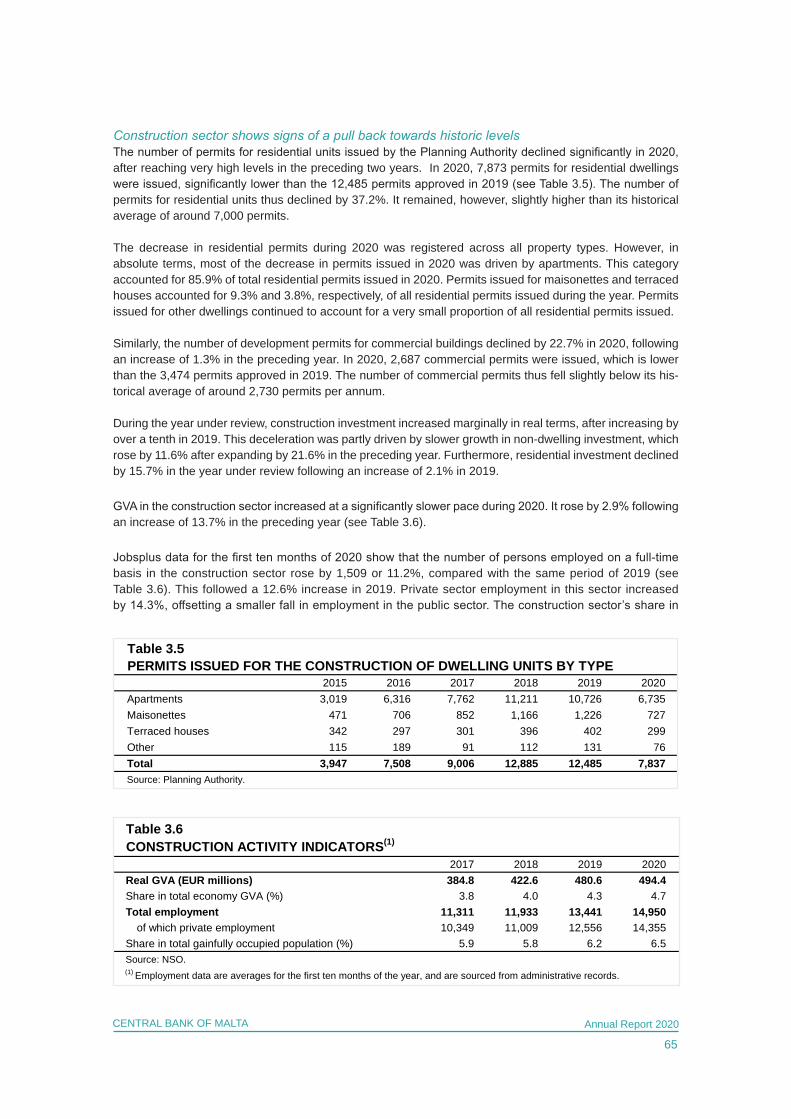
65
CENTRAL BANK OF MALTA Annual Report 2020
Construction sector shows signs of a pull back towards historic levelsThe number of permits for residential units issued by the Planning Authority declined significantly in 2020, after reaching very high levels in the preceding two years. In 2020, 7,873 permits for residential dwellings were issued, significantly lower than the 12,485 permits approved in 2019 (see Table 3.5). The number of permits for residential units thus declined by 37.2%. It remained, however, slightly higher than its historical average of around 7,000 permits.
The decrease in residential permits during 2020 was registered across all property types. However, in absolute terms, most of the decrease in permits issued in 2020 was driven by apartments. This category accounted for 85.9% of total residential permits issued in 2020. Permits issued for maisonettes and terraced houses accounted for 9.3% and 3.8%, respectively, of all residential permits issued during the year. Permits issued for other dwellings continued to account for a very small proportion of all residential permits issued.
Similarly, the number of development permits for commercial buildings declined by 22.7% in 2020, following an increase of 1.3% in the preceding year. In 2020, 2,687 commercial permits were issued, which is lower than the 3,474 permits approved in 2019. The number of commercial permits thus fell slightly below its his-torical average of around 2,730 permits per annum.
During the year under review, construction investment increased marginally in real terms, after increasing by over a tenth in 2019. This deceleration was partly driven by slower growth in non-dwelling investment, which rose by 11.6% after expanding by 21.6% in the preceding year. Furthermore, residential investment declined by 15.7% in the year under review following an increase of 2.1% in 2019.
GVA in the construction sector increased at a significantly slower pace during 2020. It rose by 2.9% following an increase of 13.7% in the preceding year (see Table 3.6).
Jobsplus data for the first ten months of 2020 show that the number of persons employed on a full-time basis in the construction sector rose by 1,509 or 11.2%, compared with the same period of 2019 (see Table 3.6). This followed a 12.6% increase in 2019. Private sector employment in this sector increased by 14.3%, offsetting a smaller fall in employment in the public sector. The construction sector’s share in
Table 3.5
2015 2016 2017 2018 2019 2020Apartments 3,019 6,316 7,762 11,211 10,726 6,735Maisonettes 471 706 852 1,166 1,226 727Terraced houses 342 297 301 396 402 299Other 115 189 91 112 131 76Total 3,947 7,508 9,006 12,885 12,485 7,837Source: Planning Authority.
PERMITS ISSUED FOR THE CONSTRUCTION OF DWELLING UNITS BY TYPE
Table 3.6CONSTRUCTION ACTIVITY INDICATORS(1)
2017 2018 2019 2020Real GVA (EUR millions) 384.8 422.6 480.6 494.4Share in total economy GVA (%) 3.8 4.0 4.3 4.7Total employment 11,311 11,933 13,441 14,950
of which private employment 10,349 11,009 12,556 14,355Share in total gainfully occupied population (%) 5.9 5.8 6.2 6.5Source: NSO.(1) Employment data are averages for the first ten months of the year, and are sourced from administrative records.
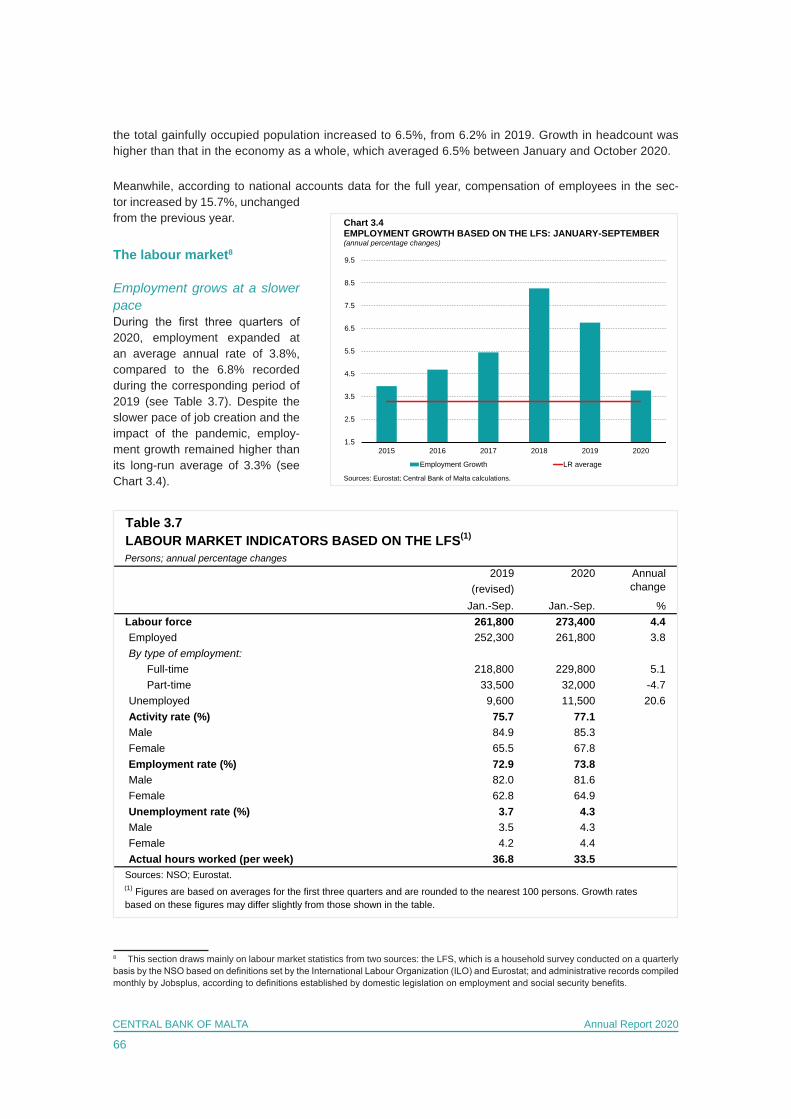
66
CENTRAL BANK OF MALTA Annual Report 2020
the total gainfully occupied population increased to 6.5%, from 6.2% in 2019. Growth in headcount was higher than that in the economy as a whole, which averaged 6.5% between January and October 2020.
Meanwhile, according to national accounts data for the full year, compensation of employees in the sec-tor increased by 15.7%, unchanged from the previous year.
The labour market8
Employment grows at a slower paceDuring the first three quarters of 2020, employment expanded at an average annual rate of 3.8%, compared to the 6.8% recorded during the corresponding period of 2019 (see Table 3.7). Despite the slower pace of job creation and the impact of the pandemic, employ-ment growth remained higher than its long-run average of 3.3% (see Chart 3.4).
8 This section draws mainly on labour market statistics from two sources: the LFS, which is a household survey conducted on a quarterly basis by the NSO based on definitions set by the International Labour Organization (ILO) and Eurostat; and administrative records compiled monthly by Jobsplus, according to definitions established by domestic legislation on employment and social security benefits.
LABOUR MARKET INDICATORS BASED ON THE LFS(1)
Persons; annual percentage changes2019
(revised)Jan.-Sep. Jan.-Sep. %
Labour force 261,800 273,400 4.4Employed 252,300 261,800 3.8By type of employment: Full-time 218,800 229,800 5.1 Part-time 33,500 32,000 -4.7Unemployed 9,600 11,500 20.6Activity rate (%) 75.7 77.1Male 84.9 85.3Female 65.5 67.8Employment rate (%) 72.9 73.8Male 82.0 81.6Female 62.8 64.9Unemployment rate (%) 3.7 4.3Male 3.5 4.3Female 4.2 4.4Actual hours worked (per week) 36.8 33.5
Sources: NSO; Eurostat. (1) Figures are based on averages for the first three quarters and are rounded to the nearest 100 persons. Growth rates based on these figures may differ slightly from those shown in the table.
Table 3.7
2020 Annual change
1.5
2.5
3.5
4.5
5.5
6.5
7.5
8.5
9.5
2015 2016 2017 2018 2019 2020
Employment Growth LR average
Sources: Eurostat; Central Bank of Malta calculations.
Chart 3.4 EMPLOYMENT GROWTH BASED ON THE LFS: JANUARY-SEPTEMBER(annual percentage changes)
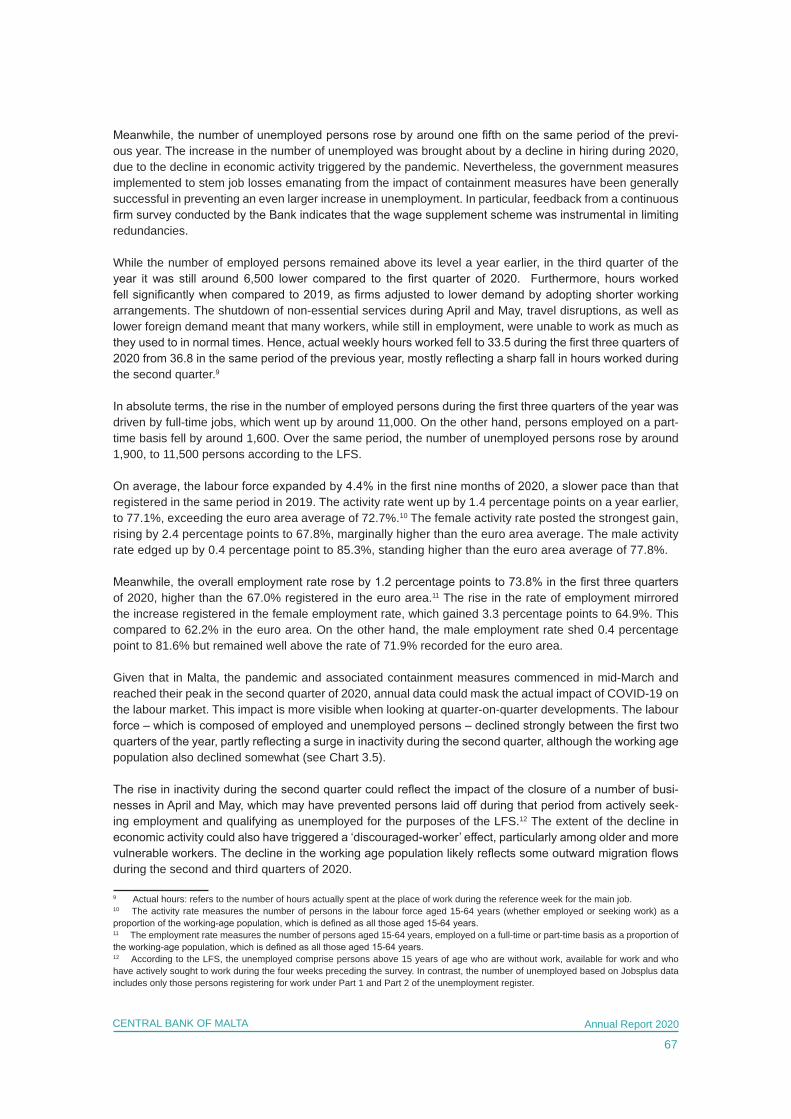
67
CENTRAL BANK OF MALTA Annual Report 2020
Meanwhile, the number of unemployed persons rose by around one fifth on the same period of the previ-ous year. The increase in the number of unemployed was brought about by a decline in hiring during 2020, due to the decline in economic activity triggered by the pandemic. Nevertheless, the government measures implemented to stem job losses emanating from the impact of containment measures have been generally successful in preventing an even larger increase in unemployment. In particular, feedback from a continuous firm survey conducted by the Bank indicates that the wage supplement scheme was instrumental in limiting redundancies.
While the number of employed persons remained above its level a year earlier, in the third quarter of the year it was still around 6,500 lower compared to the first quarter of 2020. Furthermore, hours worked fell significantly when compared to 2019, as firms adjusted to lower demand by adopting shorter working arrangements. The shutdown of non-essential services during April and May, travel disruptions, as well as lower foreign demand meant that many workers, while still in employment, were unable to work as much as they used to in normal times. Hence, actual weekly hours worked fell to 33.5 during the first three quarters of 2020 from 36.8 in the same period of the previous year, mostly reflecting a sharp fall in hours worked during the second quarter.9
In absolute terms, the rise in the number of employed persons during the first three quarters of the year was driven by full-time jobs, which went up by around 11,000. On the other hand, persons employed on a part-time basis fell by around 1,600. Over the same period, the number of unemployed persons rose by around 1,900, to 11,500 persons according to the LFS.
On average, the labour force expanded by 4.4% in the first nine months of 2020, a slower pace than that registered in the same period in 2019. The activity rate went up by 1.4 percentage points on a year earlier, to 77.1%, exceeding the euro area average of 72.7%.10 The female activity rate posted the strongest gain, rising by 2.4 percentage points to 67.8%, marginally higher than the euro area average. The male activity rate edged up by 0.4 percentage point to 85.3%, standing higher than the euro area average of 77.8%.
Meanwhile, the overall employment rate rose by 1.2 percentage points to 73.8% in the first three quarters of 2020, higher than the 67.0% registered in the euro area.11 The rise in the rate of employment mirrored the increase registered in the female employment rate, which gained 3.3 percentage points to 64.9%. This compared to 62.2% in the euro area. On the other hand, the male employment rate shed 0.4 percentage point to 81.6% but remained well above the rate of 71.9% recorded for the euro area.
Given that in Malta, the pandemic and associated containment measures commenced in mid-March and reached their peak in the second quarter of 2020, annual data could mask the actual impact of COVID-19 on the labour market. This impact is more visible when looking at quarter-on-quarter developments. The labour force – which is composed of employed and unemployed persons – declined strongly between the first two quarters of the year, partly reflecting a surge in inactivity during the second quarter, although the working age population also declined somewhat (see Chart 3.5).
The rise in inactivity during the second quarter could reflect the impact of the closure of a number of busi-nesses in April and May, which may have prevented persons laid off during that period from actively seek-ing employment and qualifying as unemployed for the purposes of the LFS.12 The extent of the decline in economic activity could also have triggered a ‘discouraged-worker’ effect, particularly among older and more vulnerable workers. The decline in the working age population likely reflects some outward migration flows during the second and third quarters of 2020.
9 Actual hours: refers to the number of hours actually spent at the place of work during the reference week for the main job.10 The activity rate measures the number of persons in the labour force aged 15-64 years (whether employed or seeking work) as a proportion of the working-age population, which is defined as all those aged 15-64 years. 11 The employment rate measures the number of persons aged 15-64 years, employed on a full-time or part-time basis as a proportion of the working-age population, which is defined as all those aged 15-64 years. 12 According to the LFS, the unemployed comprise persons above 15 years of age who are without work, available for work and who have actively sought to work during the four weeks preceding the survey. In contrast, the number of unemployed based on Jobsplus data includes only those persons registering for work under Part 1 and Part 2 of the unemployment register.
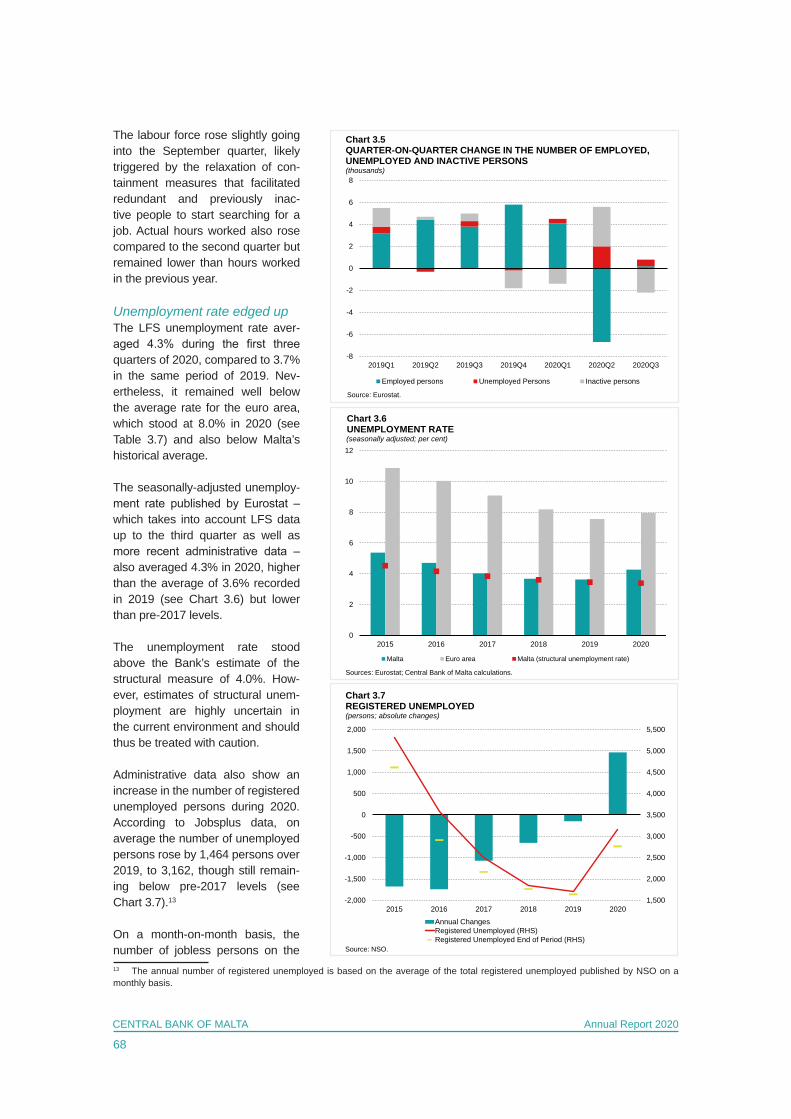
68
CENTRAL BANK OF MALTA Annual Report 2020
The labour force rose slightly going into the September quarter, likely triggered by the relaxation of con-tainment measures that facilitated redundant and previously inac-tive people to start searching for a job. Actual hours worked also rose compared to the second quarter but remained lower than hours worked in the previous year.
Unemployment rate edged upThe LFS unemployment rate aver-aged 4.3% during the first three quarters of 2020, compared to 3.7% in the same period of 2019. Nev-ertheless, it remained well below the average rate for the euro area, which stood at 8.0% in 2020 (see Table 3.7) and also below Malta’s historical average.
The seasonally-adjusted unemploy-ment rate published by Eurostat – which takes into account LFS data up to the third quarter as well as more recent administrative data – also averaged 4.3% in 2020, higher than the average of 3.6% recorded in 2019 (see Chart 3.6) but lower than pre-2017 levels.
The unemployment rate stood above the Bank’s estimate of the structural measure of 4.0%. How-ever, estimates of structural unem-ployment are highly uncertain in the current environment and should thus be treated with caution.
Administrative data also show an increase in the number of registered unemployed persons during 2020. According to Jobsplus data, on average the number of unemployed persons rose by 1,464 persons over 2019, to 3,162, though still remain-ing below pre-2017 levels (see Chart 3.7).13
On a month-on-month basis, the number of jobless persons on the 13 The annual number of registered unemployed is based on the average of the total registered unemployed published by NSO on a monthly basis.
-8
-6
-4
-2
0
2
4
6
8
2019Q1 2019Q2 2019Q3 2019Q4 2020Q1 2020Q2 2020Q3
Employed persons Unemployed Persons Inactive persons
Source: Eurostat.
Chart 3.5 QUARTER-ON-QUARTER CHANGE IN THE NUMBER OF EMPLOYED, UNEMPLOYED AND INACTIVE PERSONS(thousands)
0
2
4
6
8
10
12
2015 2016 2017 2018 2019 2020
Malta Euro area Malta (structural unemployment rate)
Chart 3.6UNEMPLOYMENT RATE(seasonally adjusted; per cent)
Sources: Eurostat; Central Bank of Malta calculations.
1,500
2,000
2,500
3,000
3,500
4,000
4,500
5,000
5,500
-2,000
-1,500
-1,000
-500
0
500
1,000
1,500
2,000
2015 2016 2017 2018 2019 2020Annual ChangesRegistered Unemployed (RHS)Registered Unemployed End of Period (RHS)
Chart 3.7REGISTERED UNEMPLOYED(persons; absolute changes)
Source: NSO.
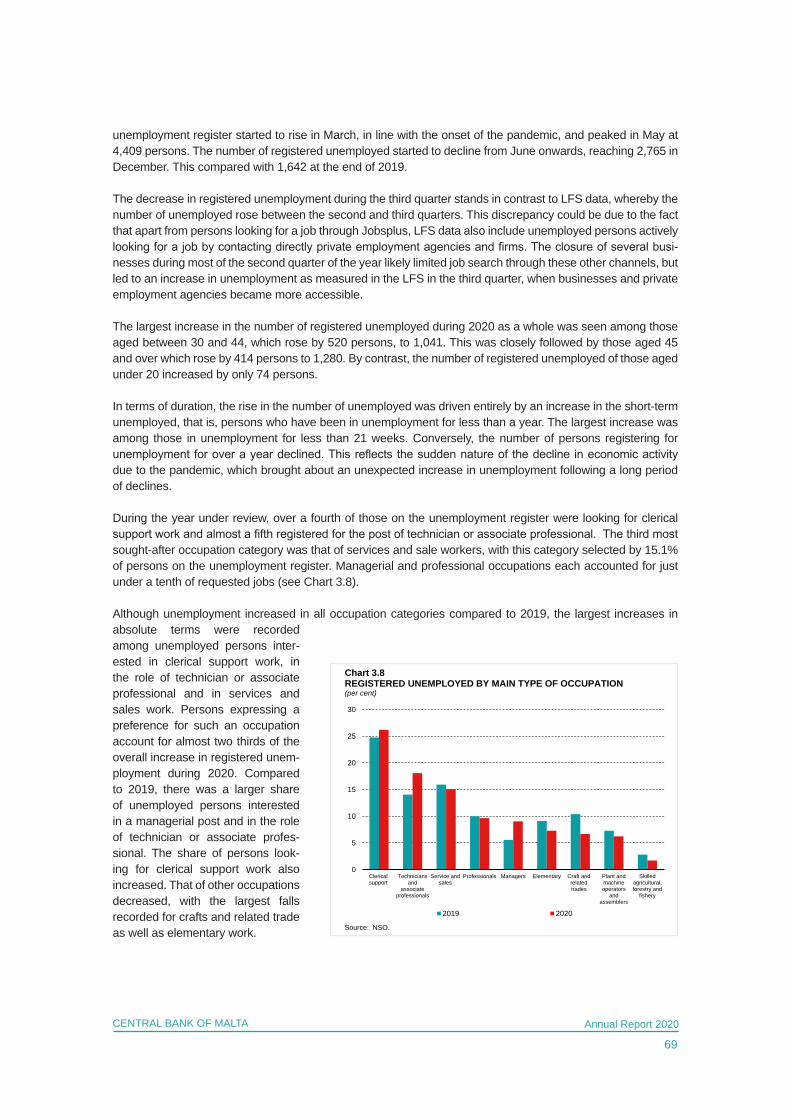
69
CENTRAL BANK OF MALTA Annual Report 2020
unemployment register started to rise in March, in line with the onset of the pandemic, and peaked in May at 4,409 persons. The number of registered unemployed started to decline from June onwards, reaching 2,765 in December. This compared with 1,642 at the end of 2019.
The decrease in registered unemployment during the third quarter stands in contrast to LFS data, whereby the number of unemployed rose between the second and third quarters. This discrepancy could be due to the fact that apart from persons looking for a job through Jobsplus, LFS data also include unemployed persons actively looking for a job by contacting directly private employment agencies and firms. The closure of several busi-nesses during most of the second quarter of the year likely limited job search through these other channels, but led to an increase in unemployment as measured in the LFS in the third quarter, when businesses and private employment agencies became more accessible.
The largest increase in the number of registered unemployed during 2020 as a whole was seen among those aged between 30 and 44, which rose by 520 persons, to 1,041. This was closely followed by those aged 45 and over which rose by 414 persons to 1,280. By contrast, the number of registered unemployed of those aged under 20 increased by only 74 persons.
In terms of duration, the rise in the number of unemployed was driven entirely by an increase in the short-term unemployed, that is, persons who have been in unemployment for less than a year. The largest increase was among those in unemployment for less than 21 weeks. Conversely, the number of persons registering for unemployment for over a year declined. This reflects the sudden nature of the decline in economic activity due to the pandemic, which brought about an unexpected increase in unemployment following a long period of declines.
During the year under review, over a fourth of those on the unemployment register were looking for clerical support work and almost a fifth registered for the post of technician or associate professional. The third most sought-after occupation category was that of services and sale workers, with this category selected by 15.1% of persons on the unemployment register. Managerial and professional occupations each accounted for just under a tenth of requested jobs (see Chart 3.8).
Although unemployment increased in all occupation categories compared to 2019, the largest increases in absolute terms were recorded among unemployed persons inter-ested in clerical support work, in the role of technician or associate professional and in services and sales work. Persons expressing a preference for such an occupation account for almost two thirds of the overall increase in registered unem-ployment during 2020. Compared to 2019, there was a larger share of unemployed persons interested in a managerial post and in the role of technician or associate profes-sional. The share of persons look-ing for clerical support work also increased. That of other occupations decreased, with the largest falls recorded for crafts and related trade as well as elementary work.
0
5
10
15
20
25
30
Clericalsupport
Techniciansand
associateprofessionals
Service andsales
Professionals Managers Elementary Craft andrelatedtrades
Plant andmachineoperators
andassemblers
Skilledagricultural,forestry and
fishery
2019 2020
Source: NSO.
Chart 3.8REGISTERED UNEMPLOYED BY MAIN TYPE OF OCCUPATION (per cent)
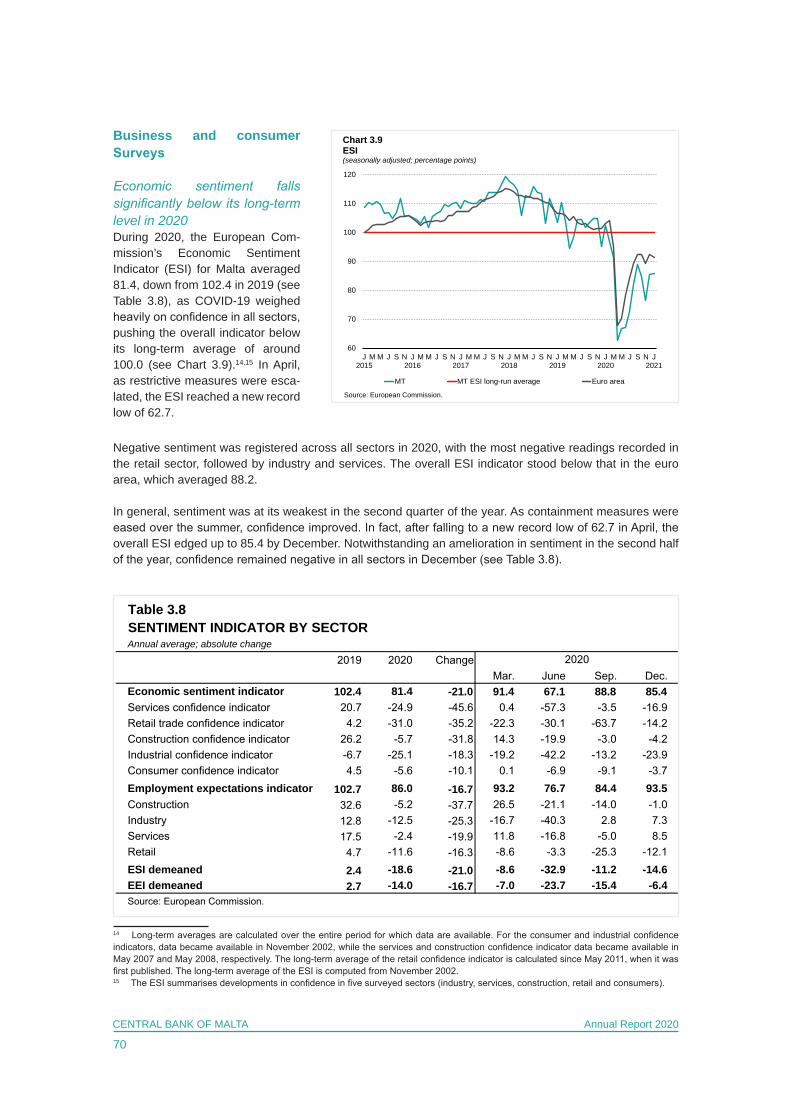
70
CENTRAL BANK OF MALTA Annual Report 2020
Business and consumer Surveys
Economic sentiment falls significantly below its long-term level in 2020During 2020, the European Com-mission’s Economic Sentiment Indicator (ESI) for Malta averaged 81.4, down from 102.4 in 2019 (see Table 3.8), as COVID-19 weighed heavily on confidence in all sectors, pushing the overall indicator below its long-term average of around 100.0 (see Chart 3.9).14,15 In April, as restrictive measures were esca-lated, the ESI reached a new record low of 62.7.
Negative sentiment was registered across all sectors in 2020, with the most negative readings recorded in the retail sector, followed by industry and services. The overall ESI indicator stood below that in the euro area, which averaged 88.2.
In general, sentiment was at its weakest in the second quarter of the year. As containment measures were eased over the summer, confidence improved. In fact, after falling to a new record low of 62.7 in April, the overall ESI edged up to 85.4 by December. Notwithstanding an amelioration in sentiment in the second half of the year, confidence remained negative in all sectors in December (see Table 3.8).
14 Long-term averages are calculated over the entire period for which data are available. For the consumer and industrial confidence indicators, data became available in November 2002, while the services and construction confidence indicator data became available in May 2007 and May 2008, respectively. The long-term average of the retail confidence indicator is calculated since May 2011, when it was first published. The long-term average of the ESI is computed from November 2002.15 The ESI summarises developments in confidence in five surveyed sectors (industry, services, construction, retail and consumers).
60
70
80
90
100
110
120
J2015
M M J S N J2016
M M J S N J2017
M M J S N J2018
M M J S N J2019
M M J S N J2020
M M J S N J2021
MT MT ESI long-run average Euro area
Chart 3.9ESI(seasonally adjusted; percentage points)
Source: European Commission.
Table 3.8SENTIMENT INDICATOR BY SECTORAnnual average; absolute change
2019 2020 ChangeMar. June Sep. Dec.
Economic sentiment indicator 102.4 81.4 -21.0 91.4 67.1 88.8 85.4Services confidence indicator 20.7 -24.9 -45.6 0.4 -57.3 -3.5 -16.9Retail trade confidence indicator 4.2 -31.0 -35.2 -22.3 -30.1 -63.7 -14.2Construction confidence indicator 26.2 -5.7 -31.8 14.3 -19.9 -3.0 -4.2Industrial confidence indicator -6.7 -25.1 -18.3 -19.2 -42.2 -13.2 -23.9Consumer confidence indicator 4.5 -5.6 -10.1 0.1 -6.9 -9.1 -3.7Employment expectations indicator 102.7 86.0 -16.7 93.2 76.7 84.4 93.5Construction 32.6 -5.2 -37.7 26.5 -21.1 -14.0 -1.0Industry 12.8 -12.5 -25.3 -16.7 -40.3 2.8 7.3Services 17.5 -2.4 -19.9 11.8 -16.8 -5.0 8.5Retail 4.7 -11.6 -16.3 -8.6 -3.3 -25.3 -12.1ESI demeaned 2.4 -18.6 -21.0 -8.6 -32.9 -11.2 -14.6EEI demeaned 2.7 -14.0 -16.7 -7.0 -23.7 -15.4 -6.4Source: European Commission.
2020
#Document Classification: Restricted
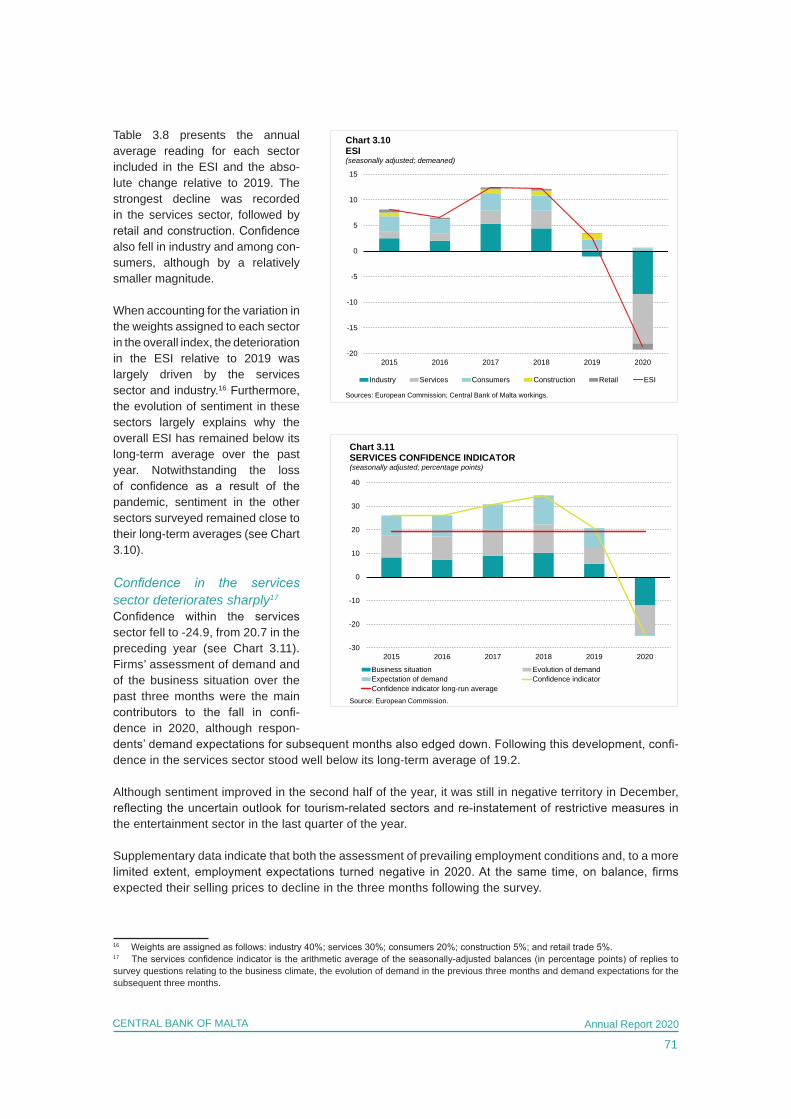
71
CENTRAL BANK OF MALTA Annual Report 2020
Table 3.8 presents the annual average reading for each sector included in the ESI and the abso-lute change relative to 2019. The strongest decline was recorded in the services sector, followed by retail and construction. Confidence also fell in industry and among con-sumers, although by a relatively smaller magnitude.
When accounting for the variation in the weights assigned to each sector in the overall index, the deterioration in the ESI relative to 2019 was largely driven by the services sector and industry.16 Furthermore, the evolution of sentiment in these sectors largely explains why the overall ESI has remained below its long-term average over the past year. Notwithstanding the loss of confidence as a result of the pandemic, sentiment in the other sectors surveyed remained close to their long-term averages (see Chart 3.10).
Confidence in the services sector deteriorates sharply17
Confidence within the services sector fell to -24.9, from 20.7 in the preceding year (see Chart 3.11). Firms’ assessment of demand and of the business situation over the past three months were the main contributors to the fall in confi-dence in 2020, although respon-dents’ demand expectations for subsequent months also edged down. Following this development, confi-dence in the services sector stood well below its long-term average of 19.2.
Although sentiment improved in the second half of the year, it was still in negative territory in December, reflecting the uncertain outlook for tourism-related sectors and re-instatement of restrictive measures in the entertainment sector in the last quarter of the year.
Supplementary data indicate that both the assessment of prevailing employment conditions and, to a more limited extent, employment expectations turned negative in 2020. At the same time, on balance, firms expected their selling prices to decline in the three months following the survey.
16 Weights are assigned as follows: industry 40%; services 30%; consumers 20%; construction 5%; and retail trade 5%. 17 The services confidence indicator is the arithmetic average of the seasonally-adjusted balances (in percentage points) of replies to survey questions relating to the business climate, the evolution of demand in the previous three months and demand expectations for the subsequent three months.
-20
-15
-10
-5
0
5
10
15
2015 2016 2017 2018 2019 2020
Industry Services Consumers Construction Retail ESI
Chart 3.10ESI (seasonally adjusted; demeaned)
Sources: European Commission; Central Bank of Malta workings.
-30
-20
-10
0
10
20
30
40
2015 2016 2017 2018 2019 2020
Business situation Evolution of demandExpectation of demand Confidence indicatorConfidence indicator long-run average
Chart 3.11SERVICES CONFIDENCE INDICATOR(seasonally adjusted; percentage points)
Source: European Commission.
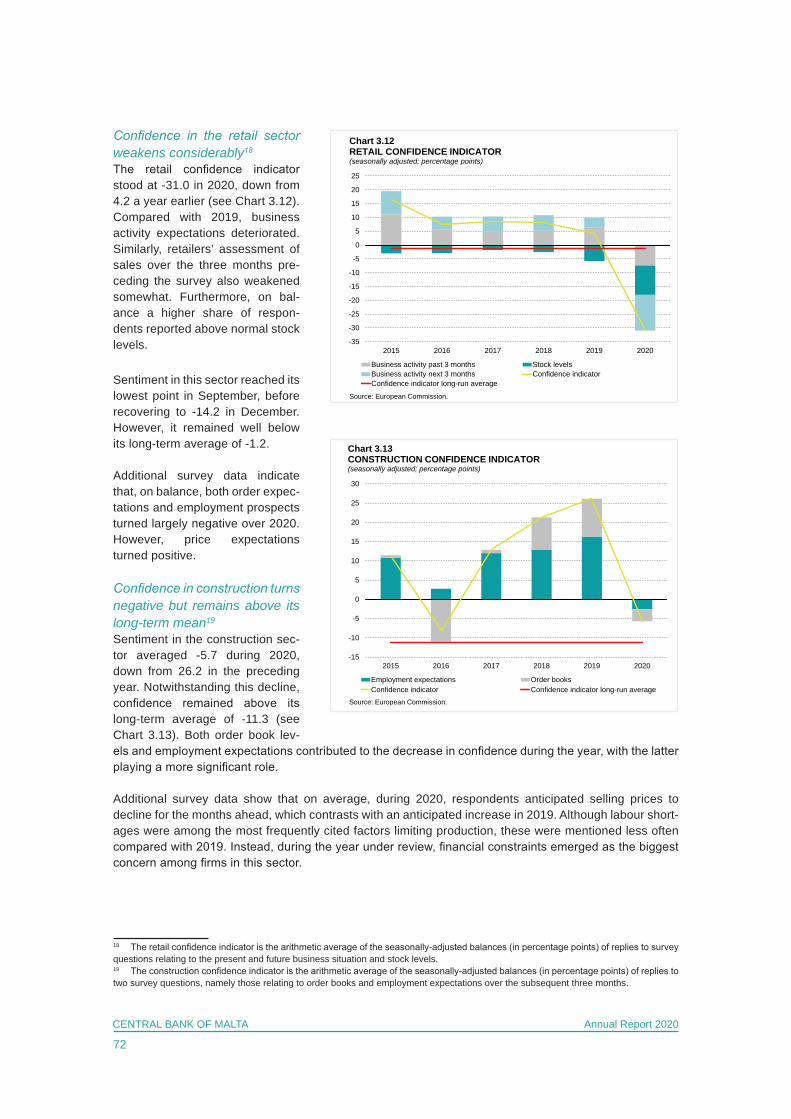
72
CENTRAL BANK OF MALTA Annual Report 2020
Confidence in the retail sector weakens considerably18 The retail confidence indicator stood at -31.0 in 2020, down from 4.2 a year earlier (see Chart 3.12). Compared with 2019, business activity expectations deteriorated. Similarly, retailers’ assessment of sales over the three months pre-ceding the survey also weakened somewhat. Furthermore, on bal-ance a higher share of respon-dents reported above normal stock levels.
Sentiment in this sector reached its lowest point in September, before recovering to -14.2 in December. However, it remained well below its long-term average of -1.2.
Additional survey data indicate that, on balance, both order expec-tations and employment prospects turned largely negative over 2020. However, price expectations turned positive.
Confidence in construction turns negative but remains above its long-term mean19
Sentiment in the construction sec-tor averaged -5.7 during 2020, down from 26.2 in the preceding year. Notwithstanding this decline, confidence remained above its long-term average of -11.3 (see Chart 3.13). Both order book lev-els and employment expectations contributed to the decrease in confidence during the year, with the latter playing a more significant role.
Additional survey data show that on average, during 2020, respondents anticipated selling prices to decline for the months ahead, which contrasts with an anticipated increase in 2019. Although labour short-ages were among the most frequently cited factors limiting production, these were mentioned less often compared with 2019. Instead, during the year under review, financial constraints emerged as the biggest concern among firms in this sector.
18 The retail confidence indicator is the arithmetic average of the seasonally-adjusted balances (in percentage points) of replies to survey questions relating to the present and future business situation and stock levels. 19 The construction confidence indicator is the arithmetic average of the seasonally-adjusted balances (in percentage points) of replies to two survey questions, namely those relating to order books and employment expectations over the subsequent three months.
-35
-30
-25
-20
-15
-10
-5
0
5
10
15
20
25
2015 2016 2017 2018 2019 2020
Business activity past 3 months Stock levelsBusiness activity next 3 months Confidence indicatorConfidence indicator long-run average
Chart 3.12RETAIL CONFIDENCE INDICATOR(seasonally adjusted; percentage points)
Source: European Commission.
-15
-10
-5
0
5
10
15
20
25
30
2015 2016 2017 2018 2019 2020
Employment expectations Order booksConfidence indicator Confidence indicator long-run average
Chart 3.13CONSTRUCTION CONFIDENCE INDICATOR(seasonally adjusted; percentage points)
Source: European Commission.
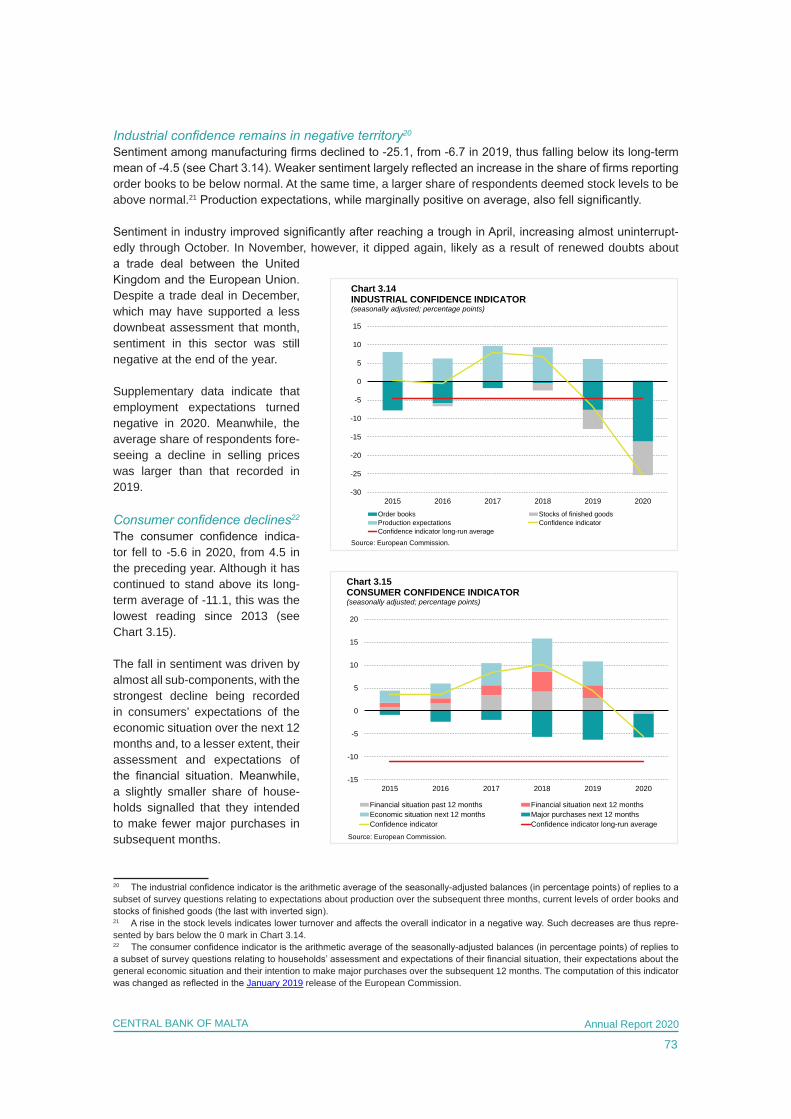
73
CENTRAL BANK OF MALTA Annual Report 2020
Industrial confidence remains in negative territory20
Sentiment among manufacturing firms declined to -25.1, from -6.7 in 2019, thus falling below its long-term mean of -4.5 (see Chart 3.14). Weaker sentiment largely reflected an increase in the share of firms reporting order books to be below normal. At the same time, a larger share of respondents deemed stock levels to be above normal.21 Production expectations, while marginally positive on average, also fell significantly.
Sentiment in industry improved significantly after reaching a trough in April, increasing almost uninterrupt-edly through October. In November, however, it dipped again, likely as a result of renewed doubts about a trade deal between the United Kingdom and the European Union. Despite a trade deal in December, which may have supported a less downbeat assessment that month, sentiment in this sector was still negative at the end of the year.
Supplementary data indicate that employment expectations turned negative in 2020. Meanwhile, the average share of respondents fore-seeing a decline in selling prices was larger than that recorded in 2019.
Consumer confidence declines22
The consumer confidence indica-tor fell to -5.6 in 2020, from 4.5 in the preceding year. Although it has continued to stand above its long-term average of -11.1, this was the lowest reading since 2013 (see Chart 3.15).
The fall in sentiment was driven by almost all sub-components, with the strongest decline being recorded in consumers’ expectations of the economic situation over the next 12 months and, to a lesser extent, their assessment and expectations of the financial situation. Meanwhile, a slightly smaller share of house-holds signalled that they intended to make fewer major purchases in subsequent months.
20 The industrial confidence indicator is the arithmetic average of the seasonally-adjusted balances (in percentage points) of replies to a subset of survey questions relating to expectations about production over the subsequent three months, current levels of order books and stocks of finished goods (the last with inverted sign).21 A rise in the stock levels indicates lower turnover and affects the overall indicator in a negative way. Such decreases are thus repre-sented by bars below the 0 mark in Chart 3.14.22 The consumer confidence indicator is the arithmetic average of the seasonally-adjusted balances (in percentage points) of replies to a subset of survey questions relating to households’ assessment and expectations of their financial situation, their expectations about the general economic situation and their intention to make major purchases over the subsequent 12 months. The computation of this indicator was changed as reflected in the January 2019 release of the European Commission.
-30
-25
-20
-15
-10
-5
0
5
10
15
2015 2016 2017 2018 2019 2020
Order books Stocks of finished goodsProduction expectations Confidence indicatorConfidence indicator long-run average
Chart 3.14INDUSTRIAL CONFIDENCE INDICATOR(seasonally adjusted; percentage points)
Source: European Commission.
-15
-10
-5
0
5
10
15
20
2015 2016 2017 2018 2019 2020
Financial situation past 12 months Financial situation next 12 monthsEconomic situation next 12 months Major purchases next 12 monthsConfidence indicator Confidence indicator long-run average
Chart 3.15CONSUMER CONFIDENCE INDICATOR(seasonally adjusted; percentage points)
Source: European Commission.
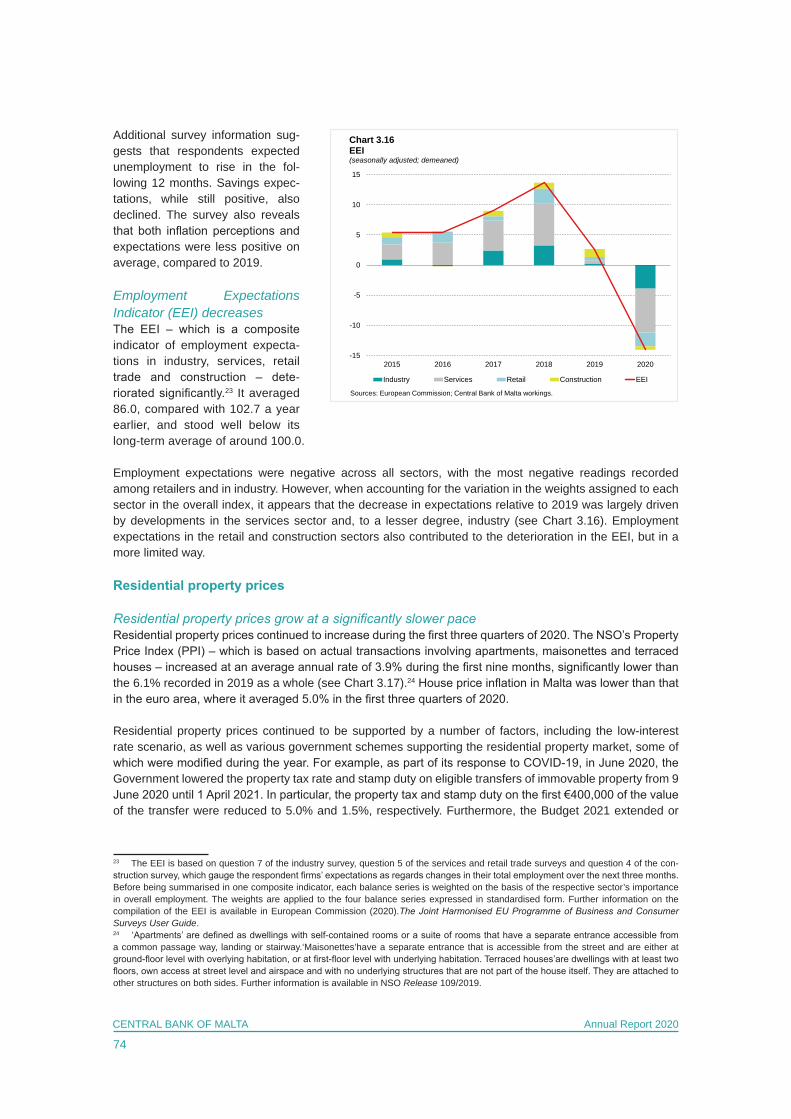
74
CENTRAL BANK OF MALTA Annual Report 2020
Additional survey information sug-gests that respondents expected unemployment to rise in the fol-lowing 12 months. Savings expec-tations, while still positive, also declined. The survey also reveals that both inflation perceptions and expectations were less positive on average, compared to 2019.
Employment Expectations Indicator (EEI) decreasesThe EEI – which is a composite indicator of employment expecta-tions in industry, services, retail trade and construction – dete-riorated significantly.23 It averaged 86.0, compared with 102.7 a year earlier, and stood well below its long-term average of around 100.0.
Employment expectations were negative across all sectors, with the most negative readings recorded among retailers and in industry. However, when accounting for the variation in the weights assigned to each sector in the overall index, it appears that the decrease in expectations relative to 2019 was largely driven by developments in the services sector and, to a lesser degree, industry (see Chart 3.16). Employment expectations in the retail and construction sectors also contributed to the deterioration in the EEI, but in a more limited way.
Residential property prices
Residential property prices grow at a significantly slower paceResidential property prices continued to increase during the first three quarters of 2020. The NSO’s Property Price Index (PPI) – which is based on actual transactions involving apartments, maisonettes and terraced houses – increased at an average annual rate of 3.9% during the first nine months, significantly lower than the 6.1% recorded in 2019 as a whole (see Chart 3.17).24 House price inflation in Malta was lower than that in the euro area, where it averaged 5.0% in the first three quarters of 2020. Residential property prices continued to be supported by a number of factors, including the low-interest rate scenario, as well as various government schemes supporting the residential property market, some of which were modified during the year. For example, as part of its response to COVID-19, in June 2020, the Government lowered the property tax rate and stamp duty on eligible transfers of immovable property from 9 June 2020 until 1 April 2021. In particular, the property tax and stamp duty on the first €400,000 of the value of the transfer were reduced to 5.0% and 1.5%, respectively. Furthermore, the Budget 2021 extended or
23 The EEI is based on question 7 of the industry survey, question 5 of the services and retail trade surveys and question 4 of the con-struction survey, which gauge the respondent firms’ expectations as regards changes in their total employment over the next three months. Before being summarised in one composite indicator, each balance series is weighted on the basis of the respective sector’s importance in overall employment. The weights are applied to the four balance series expressed in standardised form. Further information on the compilation of the EEI is available in European Commission (2020).The Joint Harmonised EU Programme of Business and Consumer Surveys User Guide.24 ‘Apartments’ are defined as dwellings with self-contained rooms or a suite of rooms that have a separate entrance accessible from a common passage way, landing or stairway.‘Maisonettes’have a separate entrance that is accessible from the street and are either at ground-floor level with overlying habitation, or at first-floor level with underlying habitation. Terraced houses’are dwellings with at least two floors, own access at street level and airspace and with no underlying structures that are not part of the house itself. They are attached to other structures on both sides. Further information is available in NSO Release 109/2019.
-15
-10
-5
0
5
10
15
2015 2016 2017 2018 2019 2020
Industry Services Retail Construction EEI
Chart 3.16EEI(seasonally adjusted; demeaned)
Sources: European Commission; Central Bank of Malta workings.
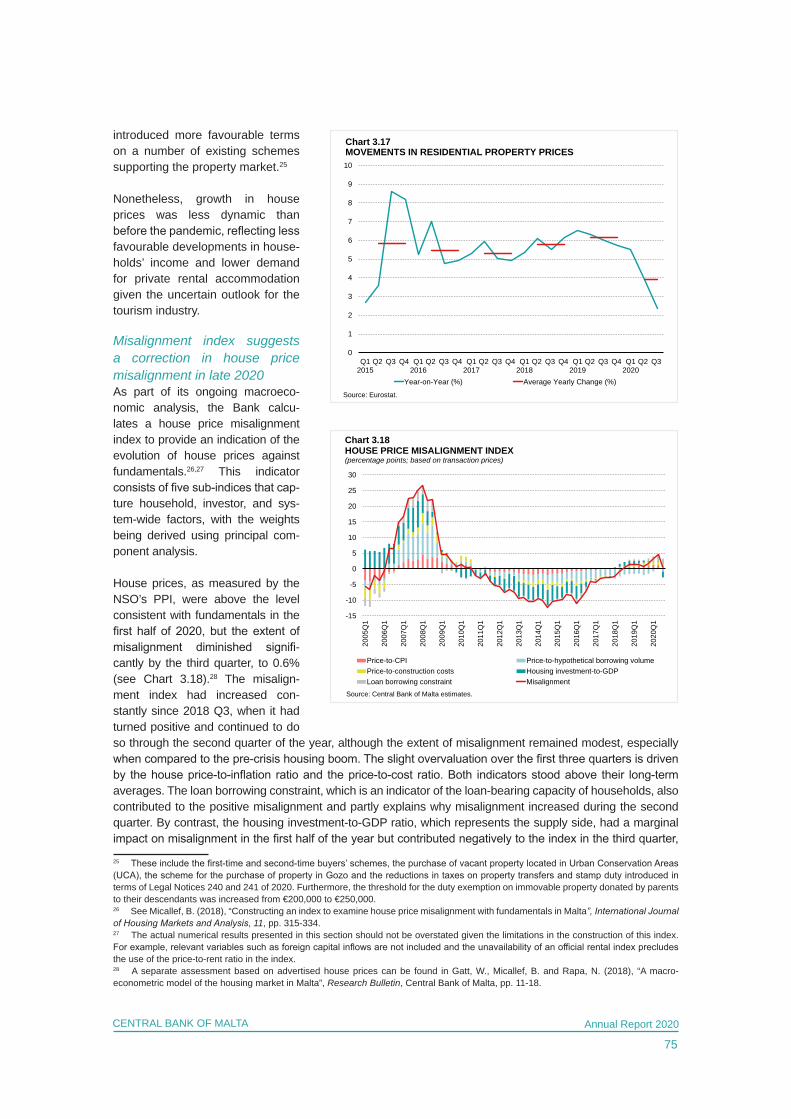
75
CENTRAL BANK OF MALTA Annual Report 2020
introduced more favourable terms on a number of existing schemes supporting the property market.25
Nonetheless, growth in house prices was less dynamic than before the pandemic, reflecting less favourable developments in house-holds’ income and lower demand for private rental accommodation given the uncertain outlook for the tourism industry.
Misalignment index suggests a correction in house price misalignment in late 2020As part of its ongoing macroeco-nomic analysis, the Bank calcu-lates a house price misalignment index to provide an indication of the evolution of house prices against fundamentals.26,27 This indicator consists of five sub-indices that cap-ture household, investor, and sys-tem-wide factors, with the weights being derived using principal com-ponent analysis.
House prices, as measured by the NSO’s PPI, were above the level consistent with fundamentals in the first half of 2020, but the extent of misalignment diminished signifi-cantly by the third quarter, to 0.6% (see Chart 3.18).28 The misalign-ment index had increased con-stantly since 2018 Q3, when it had turned positive and continued to do so through the second quarter of the year, although the extent of misalignment remained modest, especially when compared to the pre-crisis housing boom. The slight overvaluation over the first three quarters is driven by the house price-to-inflation ratio and the price-to-cost ratio. Both indicators stood above their long-term averages. The loan borrowing constraint, which is an indicator of the loan-bearing capacity of households, also contributed to the positive misalignment and partly explains why misalignment increased during the second quarter. By contrast, the housing investment-to-GDP ratio, which represents the supply side, had a marginal impact on misalignment in the first half of the year but contributed negatively to the index in the third quarter,
25 These include the first-time and second-time buyers’ schemes, the purchase of vacant property located in Urban Conservation Areas (UCA), the scheme for the purchase of property in Gozo and the reductions in taxes on property transfers and stamp duty introduced in terms of Legal Notices 240 and 241 of 2020. Furthermore, the threshold for the duty exemption on immovable property donated by parents to their descendants was increased from €200,000 to €250,000.26 See Micallef, B. (2018), “Constructing an index to examine house price misalignment with fundamentals in Malta”, International Journal of Housing Markets and Analysis, 11, pp. 315-334.27 The actual numerical results presented in this section should not be overstated given the limitations in the construction of this index. For example, relevant variables such as foreign capital inflows are not included and the unavailability of an official rental index precludes the use of the price-to-rent ratio in the index.28 A separate assessment based on advertised house prices can be found in Gatt, W., Micallef, B. and Rapa, N. (2018), “A macro-econometric model of the housing market in Malta”, Research Bulletin, Central Bank of Malta, pp. 11-18.
-15
-10
-5
0
5
10
15
20
25
30
2005
Q1
2006
Q1
2007
Q1
2008
Q1
2009
Q1
2010
Q1
2011
Q1
2012
Q1
2013
Q1
2014
Q1
2015
Q1
2016
Q1
2017
Q1
2018
Q1
2019
Q1
2020
Q1
Price-to-CPI Price-to-hypothetical borrowing volumePrice-to-construction costs Housing investment-to-GDPLoan borrowing constraint Misalignment
Source: Central Bank of Malta estimates.
Chart 3.18HOUSE PRICE MISALIGNMENT INDEX(percentage points; based on transaction prices)
0
1
2
3
4
5
6
7
8
9
10
Q12015
Q2 Q3 Q4 Q12016
Q2 Q3 Q4 Q12017
Q2 Q3 Q4 Q12018
Q2 Q3 Q4 Q12019
Q2 Q3 Q4 Q12020
Q2 Q3
Year-on-Year (%) Average Yearly Change (%)
Chart 3.17MOVEMENTS IN RESIDENTIAL PROPERTY PRICES
Source: Eurostat.
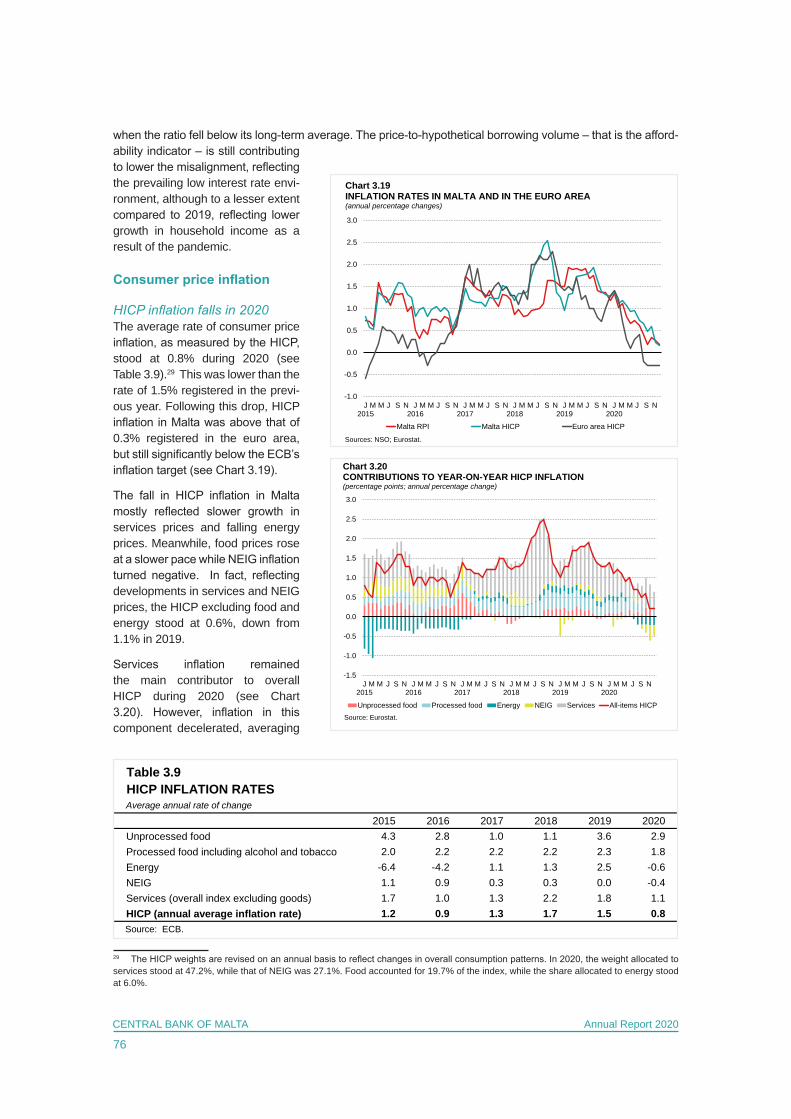
76
CENTRAL BANK OF MALTA Annual Report 2020
when the ratio fell below its long-term average. The price-to-hypothetical borrowing volume – that is the afford-ability indicator – is still contributing to lower the misalignment, reflecting the prevailing low interest rate envi-ronment, although to a lesser extent compared to 2019, reflecting lower growth in household income as a result of the pandemic.
Consumer price inflation
HICP inflation falls in 2020 The average rate of consumer price inflation, as measured by the HICP, stood at 0.8% during 2020 (see Table 3.9).29 This was lower than the rate of 1.5% registered in the previ-ous year. Following this drop, HICP inflation in Malta was above that of 0.3% registered in the euro area, but still significantly below the ECB’s inflation target (see Chart 3.19).
The fall in HICP inflation in Malta mostly reflected slower growth in services prices and falling energy prices. Meanwhile, food prices rose at a slower pace while NEIG inflation turned negative. In fact, reflecting developments in services and NEIG prices, the HICP excluding food and energy stood at 0.6%, down from 1.1% in 2019.
Services inflation remained the main contributor to overall HICP during 2020 (see Chart 3.20). However, inflation in this component decelerated, averaging
29 The HICP weights are revised on an annual basis to reflect changes in overall consumption patterns. In 2020, the weight allocated to services stood at 47.2%, while that of NEIG was 27.1%. Food accounted for 19.7% of the index, while the share allocated to energy stood at 6.0%.
-1.0
-0.5
0.0
0.5
1.0
1.5
2.0
2.5
3.0
J2015
M M J S N J2016
M M J S N J2017
M M J S N J2018
M M J S N J2019
M M J S N J2020
M M J S N
Malta RPI Malta HICP Euro area HICP
Chart 3.19INFLATION RATES IN MALTA AND IN THE EURO AREA(annual percentage changes)
Sources: NSO; Eurostat.
-1.5
-1.0
-0.5
0.0
0.5
1.0
1.5
2.0
2.5
3.0
J2015
M M J S N J2016
M M J S N J2017
M M J S N J2018
M M J S N J2019
M M J S N J2020
M M J S N
Unprocessed food Processed food Energy NEIG Services All-items HICPSource: Eurostat.
Chart 3.20CONTRIBUTIONS TO YEAR-ON-YEAR HICP INFLATION(percentage points; annual percentage change)
Table 3.9HICP INFLATION RATESAverage annual rate of change
2015 2016 2017 2018 2019 2020Unprocessed food 4.3 2.8 1.0 1.1 3.6 2.9Processed food including alcohol and tobacco 2.0 2.2 2.2 2.2 2.3 1.8Energy -6.4 -4.2 1.1 1.3 2.5 -0.6NEIG 1.1 0.9 0.3 0.3 0.0 -0.4Services (overall index excluding goods) 1.7 1.0 1.3 2.2 1.8 1.1HICP (annual average inflation rate) 1.2 0.9 1.3 1.7 1.5 0.8
Source: ECB.
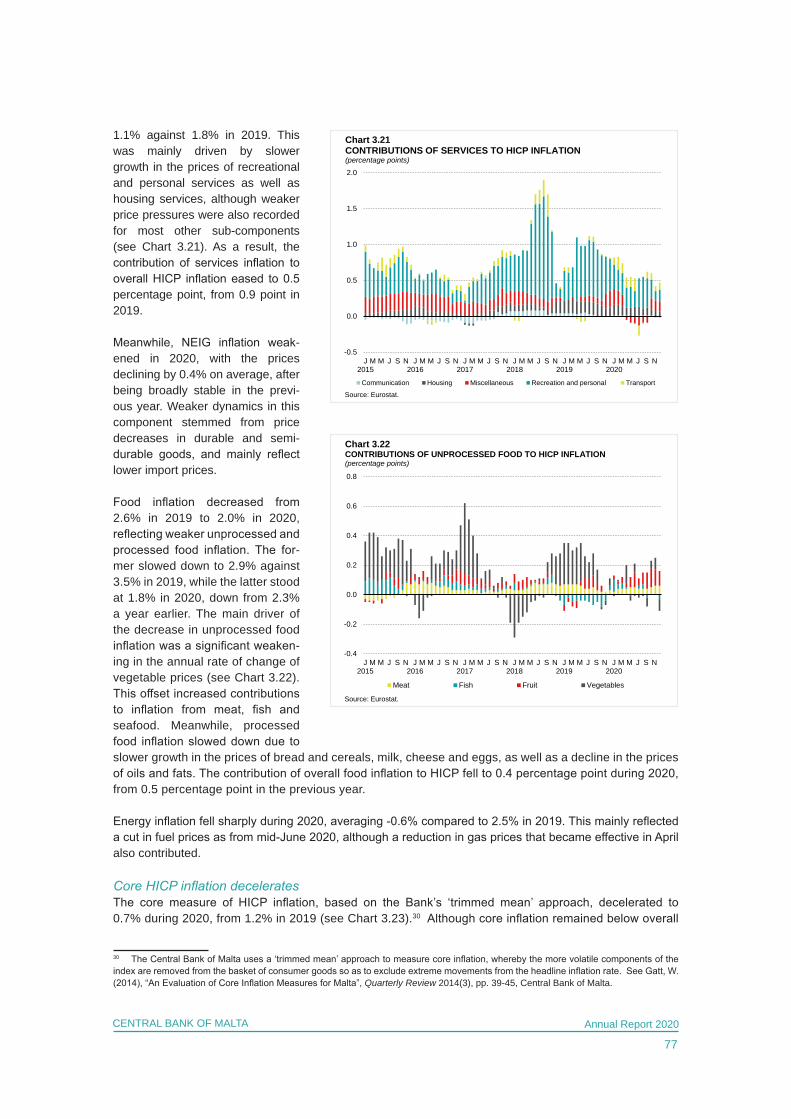
77
CENTRAL BANK OF MALTA Annual Report 2020
1.1% against 1.8% in 2019. This was mainly driven by slower growth in the prices of recreational and personal services as well as housing services, although weaker price pressures were also recorded for most other sub-components (see Chart 3.21). As a result, the contribution of services inflation to overall HICP inflation eased to 0.5 percentage point, from 0.9 point in 2019.
Meanwhile, NEIG inflation weak-ened in 2020, with the prices declining by 0.4% on average, after being broadly stable in the previ-ous year. Weaker dynamics in this component stemmed from price decreases in durable and semi-durable goods, and mainly reflect lower import prices.
Food inflation decreased from 2.6% in 2019 to 2.0% in 2020, reflecting weaker unprocessed and processed food inflation. The for-mer slowed down to 2.9% against 3.5% in 2019, while the latter stood at 1.8% in 2020, down from 2.3% a year earlier. The main driver of the decrease in unprocessed food inflation was a significant weaken-ing in the annual rate of change of vegetable prices (see Chart 3.22). This offset increased contributions to inflation from meat, fish and seafood. Meanwhile, processed food inflation slowed down due to slower growth in the prices of bread and cereals, milk, cheese and eggs, as well as a decline in the prices of oils and fats. The contribution of overall food inflation to HICP fell to 0.4 percentage point during 2020, from 0.5 percentage point in the previous year.
Energy inflation fell sharply during 2020, averaging -0.6% compared to 2.5% in 2019. This mainly reflected a cut in fuel prices as from mid-June 2020, although a reduction in gas prices that became effective in April also contributed.
Core HICP inflation deceleratesThe core measure of HICP inflation, based on the Bank’s ‘trimmed mean’ approach, decelerated to 0.7% during 2020, from 1.2% in 2019 (see Chart 3.23).30 Although core inflation remained below overall
30 The Central Bank of Malta uses a ‘trimmed mean’ approach to measure core inflation, whereby the more volatile components of the index are removed from the basket of consumer goods so as to exclude extreme movements from the headline inflation rate. See Gatt, W. (2014), “An Evaluation of Core Inflation Measures for Malta”, Quarterly Review 2014(3), pp. 39-45, Central Bank of Malta.
-0.5
0.0
0.5
1.0
1.5
2.0
J2015
M M J S N J2016
M M J S N J2017
M M J S N J2018
M M J S N J2019
M M J S N J2020
M M J S N
Communication Housing Miscellaneous Recreation and personal Transport
Source: Eurostat.
Chart 3.21CONTRIBUTIONS OF SERVICES TO HICP INFLATION(percentage points)
-0.4
-0.2
0.0
0.2
0.4
0.6
0.8
J2015
M M J S N J2016
M M J S N J2017
M M J S N J2018
M M J S N J2019
M M J S N J2020
M M J S N
Meat Fish Fruit Vegetables
Source: Eurostat.
Chart 3.22CONTRIBUTIONS OF UNPROCESSED FOOD TO HICP INFLATION(percentage points)
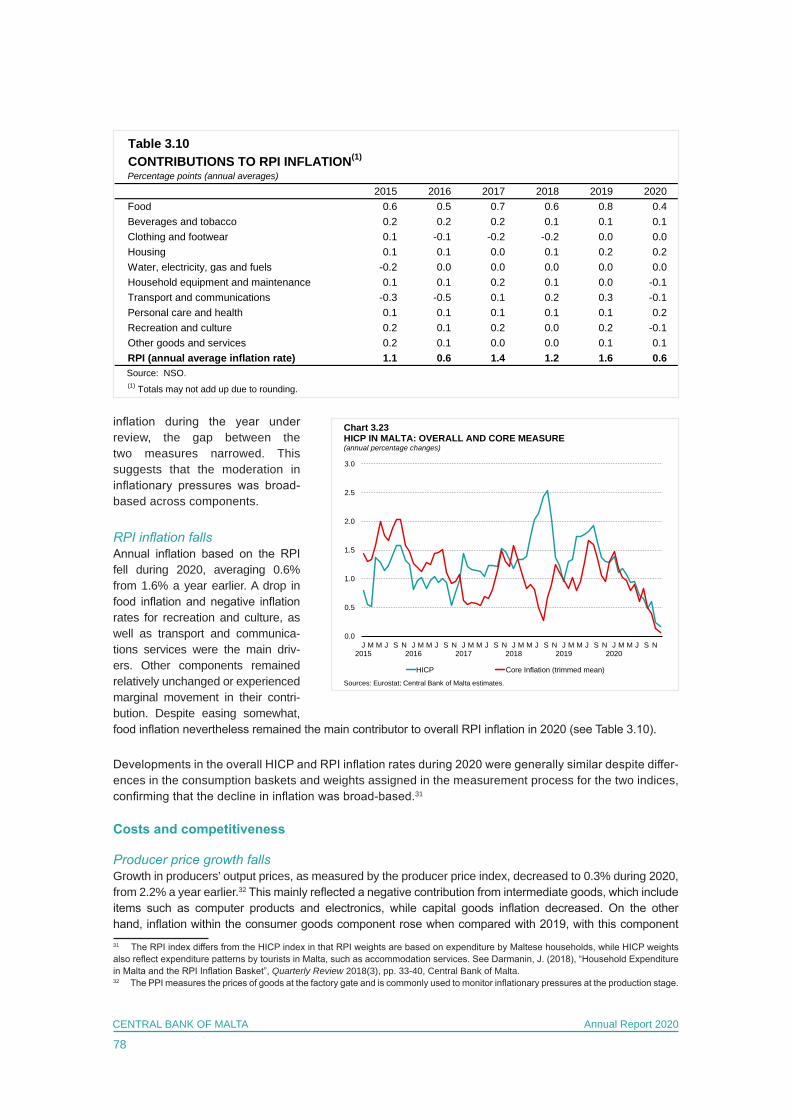
78
CENTRAL BANK OF MALTA Annual Report 2020
inflation during the year under review, the gap between the two measures narrowed. This suggests that the moderation in inflationary pressures was broad-based across components.
RPI inflation fallsAnnual inflation based on the RPI fell during 2020, averaging 0.6% from 1.6% a year earlier. A drop in food inflation and negative inflation rates for recreation and culture, as well as transport and communica-tions services were the main driv-ers. Other components remained relatively unchanged or experienced marginal movement in their contri-bution. Despite easing somewhat, food inflation nevertheless remained the main contributor to overall RPI inflation in 2020 (see Table 3.10).
Developments in the overall HICP and RPI inflation rates during 2020 were generally similar despite differ-ences in the consumption baskets and weights assigned in the measurement process for the two indices, confirming that the decline in inflation was broad-based.31
Costs and competitiveness
Producer price growth fallsGrowth in producers’ output prices, as measured by the producer price index, decreased to 0.3% during 2020, from 2.2% a year earlier.32 This mainly reflected a negative contribution from intermediate goods, which include items such as computer products and electronics, while capital goods inflation decreased. On the other hand, inflation within the consumer goods component rose when compared with 2019, with this component 31 The RPI index differs from the HICP index in that RPI weights are based on expenditure by Maltese households, while HICP weights also reflect expenditure patterns by tourists in Malta, such as accommodation services. See Darmanin, J. (2018), “Household Expenditure in Malta and the RPI Inflation Basket”, Quarterly Review 2018(3), pp. 33-40, Central Bank of Malta.32 The PPI measures the prices of goods at the factory gate and is commonly used to monitor inflationary pressures at the production stage.
0.0
0.5
1.0
1.5
2.0
2.5
3.0
J2015
M M J S N J2016
M M J S N J2017
M M J S N J2018
M M J S N J2019
M M J S N J2020
M M J S N
HICP Core Inflation (trimmed mean)
Chart 3.23HICP IN MALTA: OVERALL AND CORE MEASURE(annual percentage changes)
Sources: Eurostat; Central Bank of Malta estimates.
Table 3.10CONTRIBUTIONS TO RPI INFLATION(1)
Percentage points (annual averages)
2015 2016 2017 2018 2019 2020Food 0.6 0.5 0.7 0.6 0.8 0.4Beverages and tobacco 0.2 0.2 0.2 0.1 0.1 0.1Clothing and footwear 0.1 -0.1 -0.2 -0.2 0.0 0.0Housing 0.1 0.1 0.0 0.1 0.2 0.2Water, electricity, gas and fuels -0.2 0.0 0.0 0.0 0.0 0.0Household equipment and maintenance 0.1 0.1 0.2 0.1 0.0 -0.1Transport and communications -0.3 -0.5 0.1 0.2 0.3 -0.1Personal care and health 0.1 0.1 0.1 0.1 0.1 0.2Recreation and culture 0.2 0.1 0.2 0.0 0.2 -0.1Other goods and services 0.2 0.1 0.0 0.0 0.1 0.1RPI (annual average inflation rate) 1.1 0.6 1.4 1.2 1.6 0.6
Source: NSO.(1) Totals may not add up due to rounding.
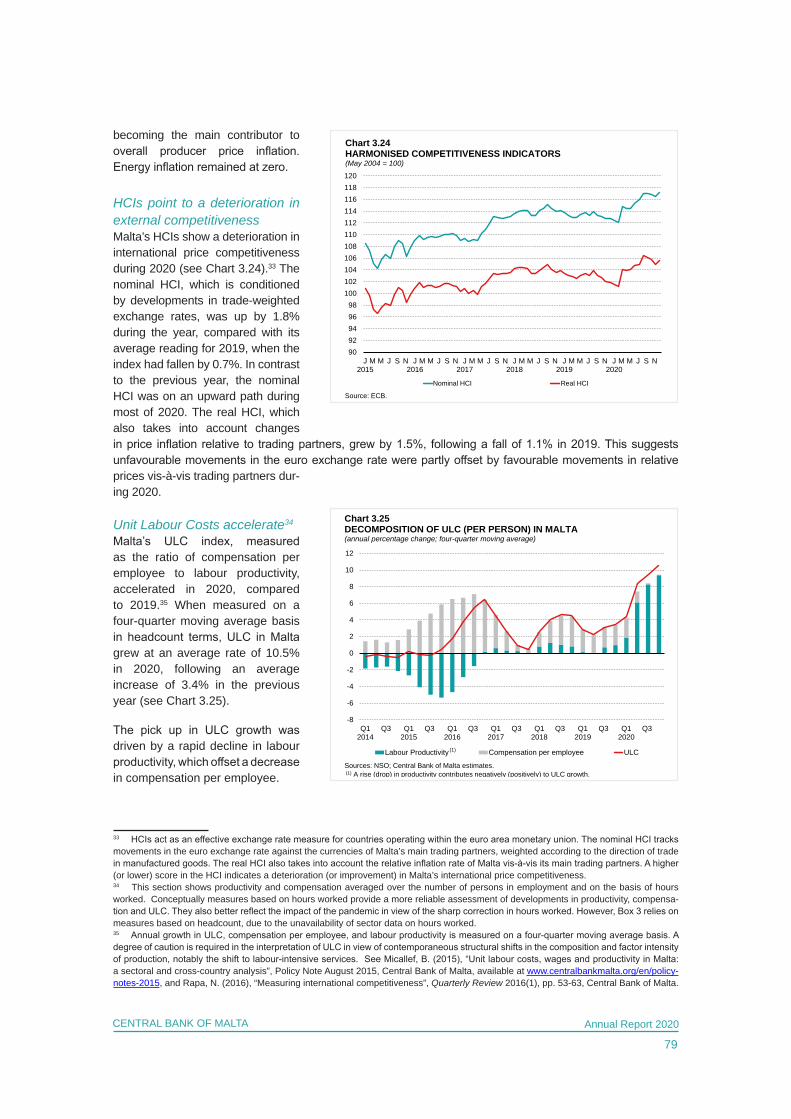
79
CENTRAL BANK OF MALTA Annual Report 2020
becoming the main contributor to overall producer price inflation. Energy inflation remained at zero.
HCIs point to a deterioration in external competitivenessMalta’s HCIs show a deterioration in international price competitiveness during 2020 (see Chart 3.24).33 The nominal HCI, which is conditioned by developments in trade-weighted exchange rates, was up by 1.8% during the year, compared with its average reading for 2019, when the index had fallen by 0.7%. In contrast to the previous year, the nominal HCI was on an upward path during most of 2020. The real HCI, which also takes into account changes in price inflation relative to trading partners, grew by 1.5%, following a fall of 1.1% in 2019. This suggests unfavourable movements in the euro exchange rate were partly offset by favourable movements in relative prices vis-à-vis trading partners dur-ing 2020.
Unit Labour Costs accelerate34
Malta’s ULC index, measured as the ratio of compensation per employee to labour productivity, accelerated in 2020, compared to 2019.35 When measured on a four-quarter moving average basis in headcount terms, ULC in Malta grew at an average rate of 10.5% in 2020, following an average increase of 3.4% in the previous year (see Chart 3.25).
The pick up in ULC growth was driven by a rapid decline in labour productivity, which offset a decrease in compensation per employee.
33 HCIs act as an effective exchange rate measure for countries operating within the euro area monetary union. The nominal HCI tracks movements in the euro exchange rate against the currencies of Malta’s main trading partners, weighted according to the direction of trade in manufactured goods. The real HCI also takes into account the relative inflation rate of Malta vis-à-vis its main trading partners. A higher (or lower) score in the HCI indicates a deterioration (or improvement) in Malta’s international price competitiveness.34 This section shows productivity and compensation averaged over the number of persons in employment and on the basis of hours worked. Conceptually measures based on hours worked provide a more reliable assessment of developments in productivity, compensa-tion and ULC. They also better reflect the impact of the pandemic in view of the sharp correction in hours worked. However, Box 3 relies on measures based on headcount, due to the unavailability of sector data on hours worked. 35 Annual growth in ULC, compensation per employee, and labour productivity is measured on a four-quarter moving average basis. A degree of caution is required in the interpretation of ULC in view of contemporaneous structural shifts in the composition and factor intensity of production, notably the shift to labour-intensive services. See Micallef, B. (2015), “Unit labour costs, wages and productivity in Malta: a sectoral and cross-country analysis”, Policy Note August 2015, Central Bank of Malta, available at www.centralbankmalta.org/en/policy-notes-2015, and Rapa, N. (2016), “Measuring international competitiveness”, Quarterly Review 2016(1), pp. 53-63, Central Bank of Malta.
-8
-6
-4
-2
0
2
4
6
8
10
12
Q12014
Q3 Q12015
Q3 Q12016
Q3 Q12017
Q3 Q12018
Q3 Q12019
Q3 Q12020
Q3
Labour Productivity Compensation per employee ULC
Chart 3.25DECOMPOSITION OF ULC (PER PERSON) IN MALTA (annual percentage change; four-quarter moving average)
Sources: NSO; Central Bank of Malta estimates.(1) A rise (drop) in productivity contributes negatively (positively) to ULC growth.
(1)
9092949698
100102104106108110112114116118120
J2015
M M J S N J2016
M M J S N J2017
M M J S N J2018
M M J S N J2019
M M J S N J2020
M M J S N
Nominal HCI Real HCI
Chart 3.24HARMONISED COMPETITIVENESS INDICATORS(May 2004 = 100)
Source: ECB.
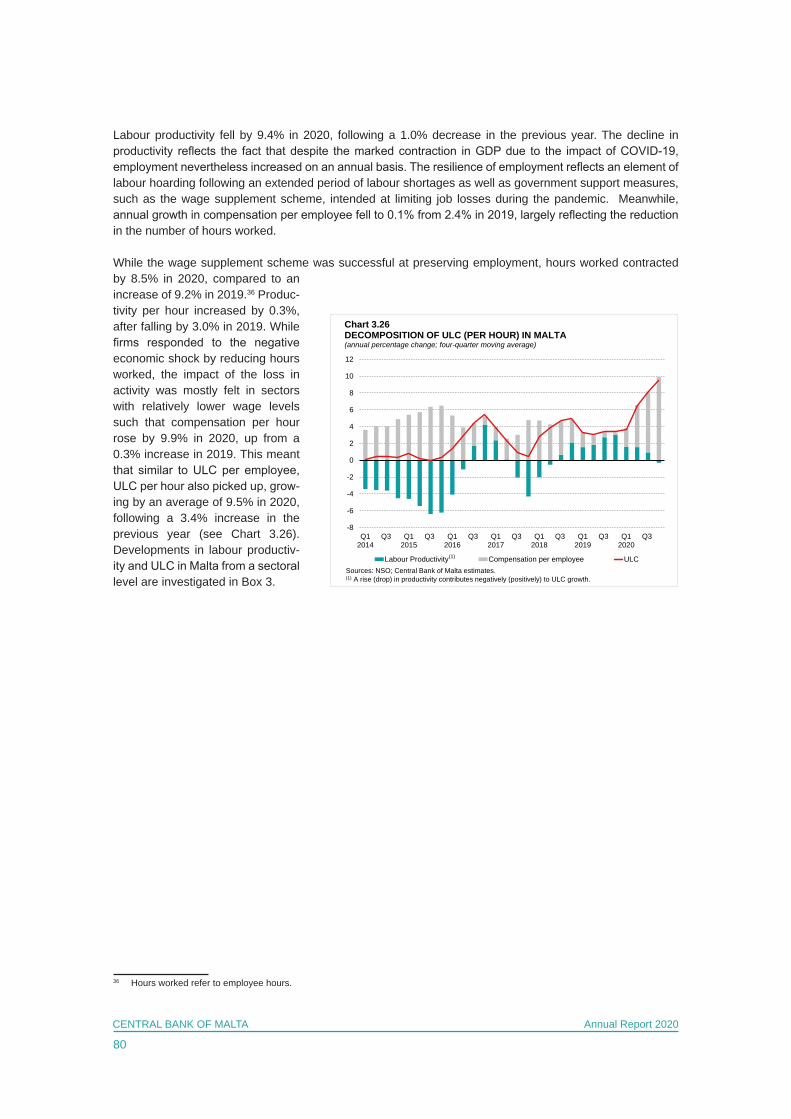
80
CENTRAL BANK OF MALTA Annual Report 2020
Labour productivity fell by 9.4% in 2020, following a 1.0% decrease in the previous year. The decline in productivity reflects the fact that despite the marked contraction in GDP due to the impact of COVID-19, employment nevertheless increased on an annual basis. The resilience of employment reflects an element of labour hoarding following an extended period of labour shortages as well as government support measures, such as the wage supplement scheme, intended at limiting job losses during the pandemic. Meanwhile, annual growth in compensation per employee fell to 0.1% from 2.4% in 2019, largely reflecting the reduction in the number of hours worked.
While the wage supplement scheme was successful at preserving employment, hours worked contracted by 8.5% in 2020, compared to an increase of 9.2% in 2019.36 Produc-tivity per hour increased by 0.3%, after falling by 3.0% in 2019. While firms responded to the negative economic shock by reducing hours worked, the impact of the loss in activity was mostly felt in sectors with relatively lower wage levels such that compensation per hour rose by 9.9% in 2020, up from a 0.3% increase in 2019. This meant that similar to ULC per employee, ULC per hour also picked up, grow-ing by an average of 9.5% in 2020, following a 3.4% increase in the previous year (see Chart 3.26). Developments in labour productiv-ity and ULC in Malta from a sectoral level are investigated in Box 3.
36 Hours worked refer to employee hours.
-8
-6
-4
-2
0
2
4
6
8
10
12
Q12014
Q3 Q12015
Q3 Q12016
Q3 Q12017
Q3 Q12018
Q3 Q12019
Q3 Q12020
Q3
Labour Productivity Compensation per employee ULC
Chart 3.26DECOMPOSITION OF ULC (PER HOUR) IN MALTA (annual percentage change; four-quarter moving average)
Sources: NSO; Central Bank of Malta estimates.(1) A rise (drop) in productivity contributes negatively (positively) to ULC growth.
(1)
81
CENTRAL BANK OF MALTA Annual Report 2020
BOX 3: SECTORAL CONTRIBUTIONS TO AGGREGATE LABOUR PRODUCTIVITY AND ULC GROWTH1
In August 2020, the NSO carried out benchmark revisions to national accounts data and published, for the first time, data on chainlinked GVA by sector.2 This additional information allows for the analy-sis of sectoral developments in labour productivity and ULCs, while accounting for the impact of price changes.
This box looks at sectoral contributions to total labour productivity and real ULC growth during 2020 using national accounts data. In order to ensure the additivity of sectoral productivity contributions, the analysis utilises the generalised exactly additive decomposition (GEAD) of productivity growth first developed by Tang and Wang (2004).3 In the first section, an overview of the GEAD decom-position of productivity growth is presented. This decomposition is then used to analyse sectoral contributions to labour productivity growth in Malta during 2020, using GVA output data measured in chainlinked volumes. The final section then assesses sectoral contributions to growth in real ULCs during 2020.
Overview of the GEAD Unlike other productivity decompositions, the GEAD proposed by Tang and Wang (2004) has the desirable property of estimating exactly additive sectoral contributions to aggregate labour productiv-ity growth, even when output is measured in chainlinked volumes.4 According to this approach, each sector’s contribution to aggregate labour productivity growth can be decomposed into three effects, commonly identified as the pure productivity effect, the reallocation level effect, and the reallocation growth effect.5
The pure productivity effect for a sector captures its contribution to aggregate productivity growth that is solely due to changes in its labour productivity, weighted by its share in nominal aggregate output. Aside from growth in sectoral productivity, a sector’s contribution to aggregate productivity growth is influenced by changes in its relative size, which can be due to either a change in its share of total employment or in real output prices, or both. For instance, even when sectoral labour pro-ductivity levels remain unchanged, labour productivity can increase at an aggregate level if labour shifts from sectors with below-average labour productivity levels towards sectors with above-aver-age labour productivity levels (Denison, 1962).6 Furthermore, the importance of a sector for aggre-gate labour productivity changes when the relative value of its output changes. Thus, an increase in a sector’s prices compared with the economy-wide price level will increase the sector’s con-tribution to aggregate labour productivity growth, even in the absence of a shift in labour inputs. 1 Prepared by Roberta Montebello and Jude Darmanin. Ms Montebello and Mr Darmanin are economists in the Economic Analysis Department of the Central Bank of Malta. 2 See “The 2020 National Accounts Benchmark Revision” QR 2021_1.3 Tang, J., & Wang, W. (2004) “Sources of aggregate labour productivity growth in Canada and the United States”, Canadian Journal of Economics, 37(2), pp. 421-444.4 The GEAD is one type of decomposition method used in this field of literature. Although other decomposition methods may give different results, the GEAD is the only decomposition to give exactly additive sectoral contributions when output is measured in chainlinked volumes. 5 The GEAD equation is shown below, where is growth in aggregate labour productivity measured on the basis of GVA, is growth in labour productivity of sector i, is the labour productivity level in period t, is labour productivity of sector i in period t, is aggregate nominal value added, is the relative price of sector i to economy-wide prices and is sector i’s share of total employment.
6 Denison, E. (1962). “The sources of economic growth in the United States and the alternatives before us”, New York: Committee for Economic Development.
𝐺𝐺𝐺𝐺𝑡𝑡𝑡𝑡 = � �𝑌𝑌𝑌𝑌𝑡𝑡𝑡𝑡−1𝑖𝑖𝑖𝑖
𝑌𝑌𝑌𝑌𝑡𝑡𝑡𝑡−1𝐺𝐺𝐺𝐺𝑡𝑡𝑡𝑡𝑖𝑖𝑖𝑖 +
𝑍𝑍𝑍𝑍𝑡𝑡𝑡𝑡−1𝑖𝑖𝑖𝑖
𝑍𝑍𝑍𝑍𝑡𝑡𝑡𝑡−1�𝑝𝑝𝑝𝑝𝑡𝑡𝑡𝑡𝑖𝑖𝑖𝑖𝑙𝑙𝑙𝑙𝑡𝑡𝑡𝑡𝑖𝑖𝑖𝑖 − 𝑝𝑝𝑝𝑝𝑡𝑡𝑡𝑡−1𝑖𝑖𝑖𝑖 𝑙𝑙𝑙𝑙𝑡𝑡𝑡𝑡−1𝑖𝑖𝑖𝑖 � +
𝑍𝑍𝑍𝑍𝑡𝑡𝑡𝑡−1𝑖𝑖𝑖𝑖
𝑍𝑍𝑍𝑍𝑡𝑡𝑡𝑡−1�𝑝𝑝𝑝𝑝𝑡𝑡𝑡𝑡𝑖𝑖𝑖𝑖𝑙𝑙𝑙𝑙𝑡𝑡𝑡𝑡𝑖𝑖𝑖𝑖 − 𝑝𝑝𝑝𝑝𝑡𝑡𝑡𝑡−1𝑖𝑖𝑖𝑖 𝑙𝑙𝑙𝑙𝑡𝑡𝑡𝑡−1𝑖𝑖𝑖𝑖 �𝐺𝐺𝐺𝐺𝑡𝑡𝑡𝑡𝑖𝑖𝑖𝑖�
𝑖𝑖𝑖𝑖
𝐺𝐺𝐺𝐺𝑡𝑡𝑡𝑡
𝐺𝐺𝐺𝐺𝑡𝑡𝑡𝑡𝑖𝑖𝑖𝑖
𝑍𝑍𝑍𝑍𝑡𝑡𝑡𝑡
𝑍𝑍𝑍𝑍𝑡𝑡𝑡𝑡𝑖𝑖𝑖𝑖
𝑌𝑌𝑌𝑌𝑡𝑡𝑡𝑡
𝑝𝑝𝑝𝑝𝑡𝑡𝑡𝑡𝑖𝑖𝑖𝑖
𝑙𝑙𝑙𝑙𝑡𝑡𝑡𝑡𝑖𝑖𝑖𝑖
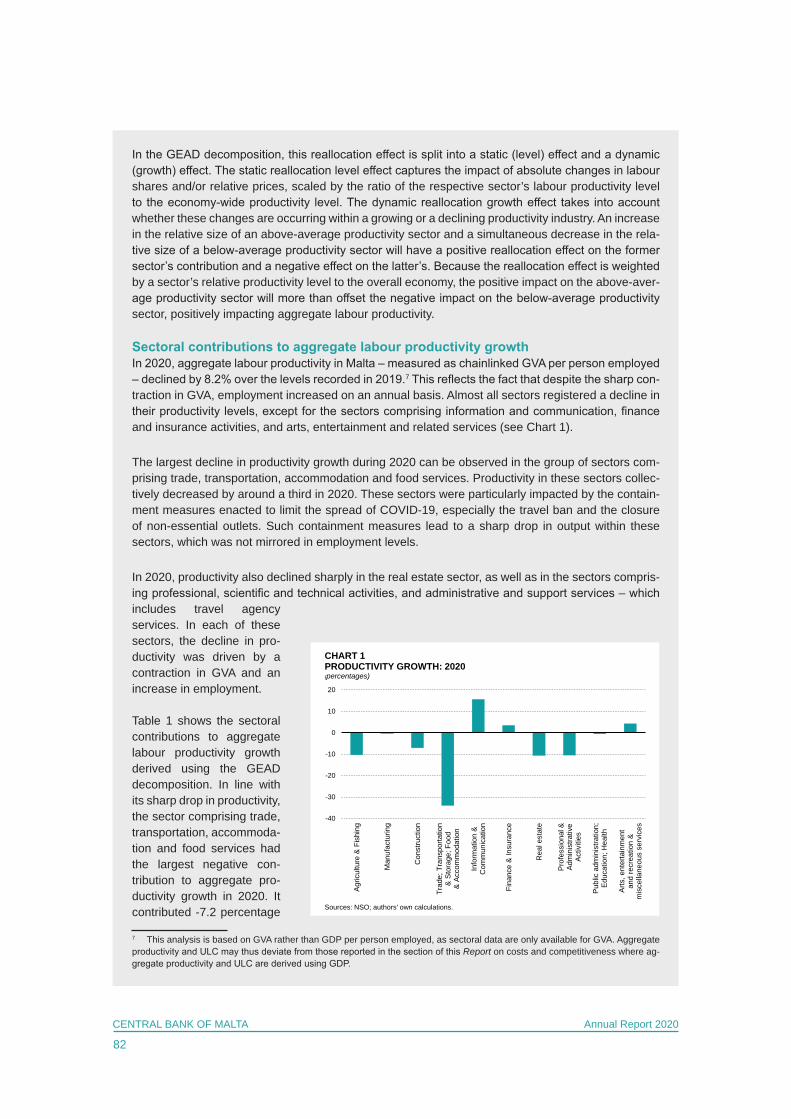
82
CENTRAL BANK OF MALTA Annual Report 2020
In the GEAD decomposition, this reallocation effect is split into a static (level) effect and a dynamic (growth) effect. The static reallocation level effect captures the impact of absolute changes in labour shares and/or relative prices, scaled by the ratio of the respective sector’s labour productivity level to the economy-wide productivity level. The dynamic reallocation growth effect takes into account whether these changes are occurring within a growing or a declining productivity industry. An increase in the relative size of an above-average productivity sector and a simultaneous decrease in the rela-tive size of a below-average productivity sector will have a positive reallocation effect on the former sector’s contribution and a negative effect on the latter’s. Because the reallocation effect is weighted by a sector’s relative productivity level to the overall economy, the positive impact on the above-aver-age productivity sector will more than offset the negative impact on the below-average productivity sector, positively impacting aggregate labour productivity.
Sectoral contributions to aggregate labour productivity growthIn 2020, aggregate labour productivity in Malta – measured as chainlinked GVA per person employed – declined by 8.2% over the levels recorded in 2019.7 This reflects the fact that despite the sharp con-traction in GVA, employment increased on an annual basis. Almost all sectors registered a decline in their productivity levels, except for the sectors comprising information and communication, finance and insurance activities, and arts, entertainment and related services (see Chart 1).
The largest decline in productivity growth during 2020 can be observed in the group of sectors com-prising trade, transportation, accommodation and food services. Productivity in these sectors collec-tively decreased by around a third in 2020. These sectors were particularly impacted by the contain-ment measures enacted to limit the spread of COVID-19, especially the travel ban and the closure of non-essential outlets. Such containment measures lead to a sharp drop in output within these sectors, which was not mirrored in employment levels.
In 2020, productivity also declined sharply in the real estate sector, as well as in the sectors compris-ing professional, scientific and technical activities, and administrative and support services – which includes travel agency services. In each of these sectors, the decline in pro-ductivity was driven by a contraction in GVA and an increase in employment.
Table 1 shows the sectoral contributions to aggregate labour productivity growth derived using the GEAD decomposition. In line with its sharp drop in productivity, the sector comprising trade, transportation, accommoda-tion and food services had the largest negative con-tribution to aggregate pro-ductivity growth in 2020. It contributed -7.2 percentage
7 This analysis is based on GVA rather than GDP per person employed, as sectoral data are only available for GVA. Aggregate productivity and ULC may thus deviate from those reported in the section of this Report on costs and competitiveness where ag-gregate productivity and ULC are derived using GDP.
-40
-30
-20
-10
0
10
20
Agric
ultu
re &
Fis
hing
Man
ufac
turin
g
Con
stru
ctio
n
Trad
e; T
rans
porta
tion
& St
orag
e; F
ood
& Ac
com
mod
atio
n
Info
rmat
ion
&C
omm
unic
atio
n
Fina
nce
& In
sura
nce
Rea
l est
ate
Prof
essi
onal
&Ad
min
istra
tive
Activ
ities
Publ
ic a
dmin
istra
tion;
Educ
atio
n; H
ealth
Arts
, ent
erta
inm
ent
and
recr
eatio
n &
mis
cella
neou
s se
rvic
es
CHART 1PRODUCTIVITY GROWTH: 2020(percentages)
Sources: NSO; authors' own calculations.
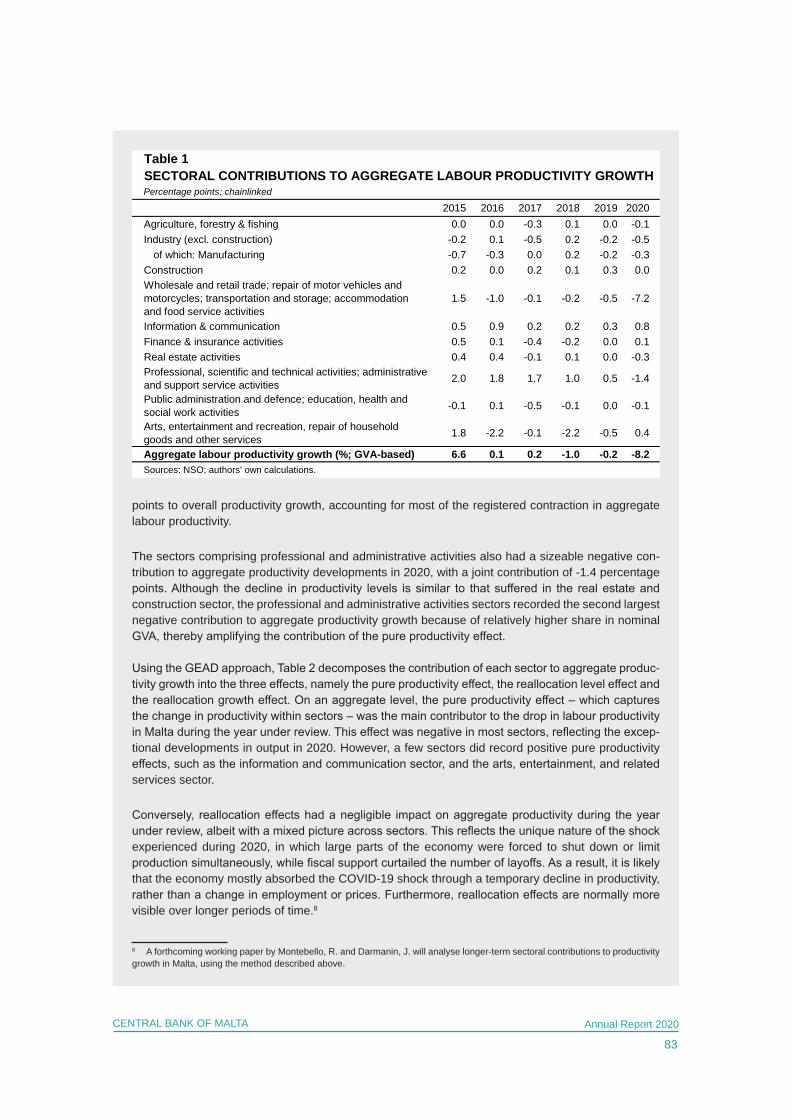
83
CENTRAL BANK OF MALTA Annual Report 2020
points to overall productivity growth, accounting for most of the registered contraction in aggregate labour productivity.
The sectors comprising professional and administrative activities also had a sizeable negative con-tribution to aggregate productivity developments in 2020, with a joint contribution of -1.4 percentage points. Although the decline in productivity levels is similar to that suffered in the real estate and construction sector, the professional and administrative activities sectors recorded the second largest negative contribution to aggregate productivity growth because of relatively higher share in nominal GVA, thereby amplifying the contribution of the pure productivity effect.
Using the GEAD approach, Table 2 decomposes the contribution of each sector to aggregate produc-tivity growth into the three effects, namely the pure productivity effect, the reallocation level effect and the reallocation growth effect. On an aggregate level, the pure productivity effect – which captures the change in productivity within sectors – was the main contributor to the drop in labour productivity in Malta during the year under review. This effect was negative in most sectors, reflecting the excep-tional developments in output in 2020. However, a few sectors did record positive pure productivity effects, such as the information and communication sector, and the arts, entertainment, and related services sector.
Conversely, reallocation effects had a negligible impact on aggregate productivity during the year under review, albeit with a mixed picture across sectors. This reflects the unique nature of the shock experienced during 2020, in which large parts of the economy were forced to shut down or limit production simultaneously, while fiscal support curtailed the number of layoffs. As a result, it is likely that the economy mostly absorbed the COVID-19 shock through a temporary decline in productivity, rather than a change in employment or prices. Furthermore, reallocation effects are normally more visible over longer periods of time.8
8 A forthcoming working paper by Montebello, R. and Darmanin, J. will analyse longer-term sectoral contributions to productivity growth in Malta, using the method described above.
Table 1
Percentage points; chainlinked
2015 2016 2017 2018 2019 2020Agriculture, forestry & fishing 0.0 0.0 -0.3 0.1 0.0 -0.1Industry (excl. construction) -0.2 0.1 -0.5 0.2 -0.2 -0.5
of which: Manufacturing -0.7 -0.3 0.0 0.2 -0.2 -0.3Construction 0.2 0.0 0.2 0.1 0.3 0.0Wholesale and retail trade; repair of motor vehicles and motorcycles; transportation and storage; accommodation and food service activities
1.5 -1.0 -0.1 -0.2 -0.5 -7.2
Information & communication 0.5 0.9 0.2 0.2 0.3 0.8Finance & insurance activities 0.5 0.1 -0.4 -0.2 0.0 0.1Real estate activities 0.4 0.4 -0.1 0.1 0.0 -0.3Professional, scientific and technical activities; administrative and support service activities 2.0 1.8 1.7 1.0 0.5 -1.4
Public administration and defence; education, health and social work activities -0.1 0.1 -0.5 -0.1 0.0 -0.1
Arts, entertainment and recreation, repair of household goods and other services 1.8 -2.2 -0.1 -2.2 -0.5 0.4
Aggregate labour productivity growth (%; GVA-based) 6.6 0.1 0.2 -1.0 -0.2 -8.2
SECTORAL CONTRIBUTIONS TO AGGREGATE LABOUR PRODUCTIVITY GROWTH
Sources: NSO; authors' own calculations.
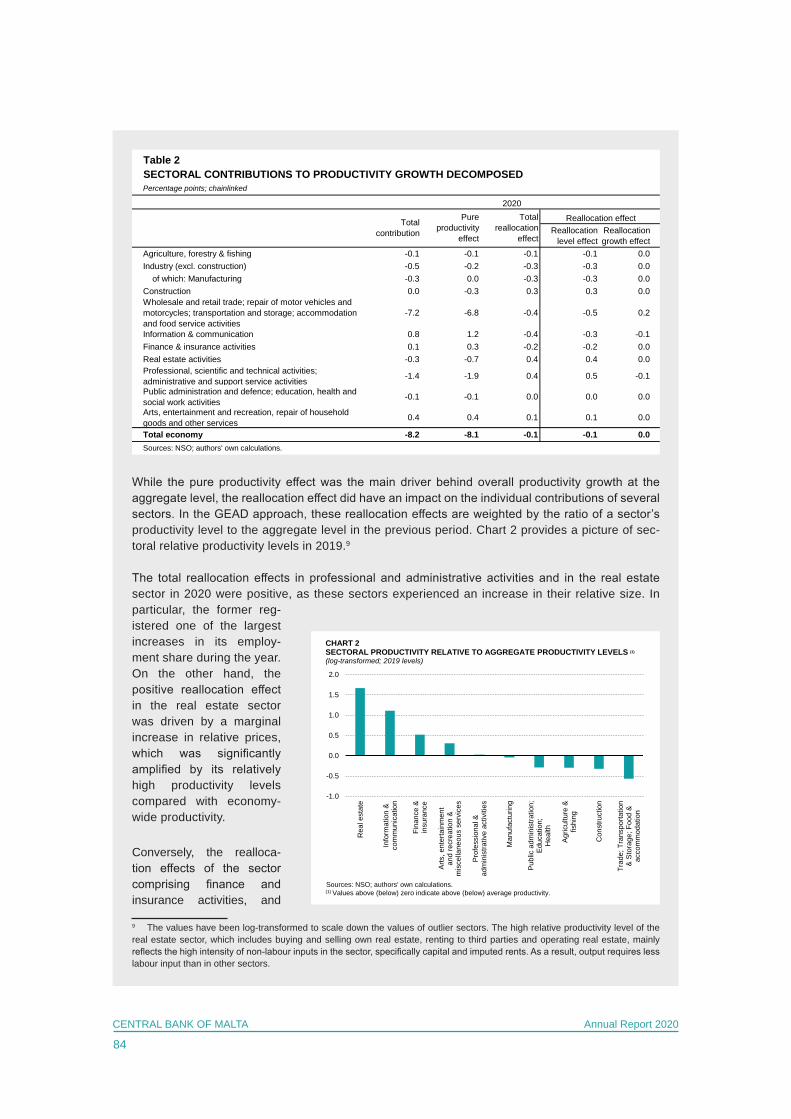
84
CENTRAL BANK OF MALTA Annual Report 2020
While the pure productivity effect was the main driver behind overall productivity growth at the aggregate level, the reallocation effect did have an impact on the individual contributions of several sectors. In the GEAD approach, these reallocation effects are weighted by the ratio of a sector’s productivity level to the aggregate level in the previous period. Chart 2 provides a picture of sec-toral relative productivity levels in 2019.9
The total reallocation effects in professional and administrative activities and in the real estate sector in 2020 were positive, as these sectors experienced an increase in their relative size. In particular, the former reg-istered one of the largest increases in its employ-ment share during the year. On the other hand, the positive reallocation effect in the real estate sector was driven by a marginal increase in relative prices, which was significantly amplified by its relatively high productivity levels compared with economy-wide productivity.
Conversely, the realloca-tion effects of the sector comprising finance and insurance activities, and
9 The values have been log-transformed to scale down the values of outlier sectors. The high relative productivity level of the real estate sector, which includes buying and selling own real estate, renting to third parties and operating real estate, mainly reflects the high intensity of non-labour inputs in the sector, specifically capital and imputed rents. As a result, output requires less labour input than in other sectors.
Table 2
Percentage points; chainlinked
Reallocation level effect
Reallocation growth effect
Agriculture, forestry & fishing -0.1 -0.1 -0.1 -0.1 0.0Industry (excl. construction) -0.5 -0.2 -0.3 -0.3 0.0
of which: Manufacturing -0.3 0.0 -0.3 -0.3 0.0Construction 0.0 -0.3 0.3 0.3 0.0Wholesale and retail trade; repair of motor vehicles and motorcycles; transportation and storage; accommodation and food service activities
-7.2 -6.8 -0.4 -0.5 0.2
Information & communication 0.8 1.2 -0.4 -0.3 -0.1Finance & insurance activities 0.1 0.3 -0.2 -0.2 0.0Real estate activities -0.3 -0.7 0.4 0.4 0.0Professional, scientific and technical activities; administrative and support service activities -1.4 -1.9 0.4 0.5 -0.1
Public administration and defence; education, health and social work activities -0.1 -0.1 0.0 0.0 0.0
Arts, entertainment and recreation, repair of household goods and other services 0.4 0.4 0.1 0.1 0.0
Total economy -8.2 -8.1 -0.1 -0.1 0.0Sources: NSO; authors' own calculations.
SECTORAL CONTRIBUTIONS TO PRODUCTIVITY GROWTH DECOMPOSED
2020Total
reallocation effect
Pure productivity
effect
Total contribution
Reallocation effect
-1.0
-0.5
0.0
0.5
1.0
1.5
2.0
Rea
l est
ate
Info
rmat
ion
&co
mm
unic
atio
n
Fina
nce
&in
sura
nce
Arts
, ent
erta
inm
ent
and
recr
eatio
n &
mis
cella
neou
s se
rvic
es
Prof
essi
onal
&ad
min
istra
tive
activ
ities
Man
ufac
turin
g
Publ
ic a
dmin
istra
tion;
Educ
atio
n;H
ealth
Agric
ultu
re &
fishi
ng
Con
stru
ctio
n
Trad
e; T
rans
porta
tion
& St
orag
e; F
ood
&ac
com
mod
atio
nCHART 2SECTORAL PRODUCTIVITY RELATIVE TO AGGREGATE PRODUCTIVITY LEVELS (1)
(log-transformed; 2019 levels)
Sources: NSO; authors' own calculations. (1) Values above (below) zero indicate above (below) average productivity.

85
CENTRAL BANK OF MALTA Annual Report 2020
the information and communication sector were negative, reflecting a decrease in their employment share, with the former also registering a marginal fall in relative prices. At the same time, the real-location effects of the manufacturing sector and the sector comprising trade, transportation, storage, accommodation and food services were negative due to a fall in their employment shares, though this effect was muted by the sectors’ below-average productivity.
Sectoral contributions to growth in real compensation per employee and real ULC10 Real compensation per employee decreased by 1.6% in 2020 (see Table 3). The largest contribu-tor to this drop was the sector comprising trade, transportation, accommodation and food services, reflecting the impact of the coronavirus pandemic on the tourism industry and the high take up of the wage supplement scheme. The sector comprising professional, scientific and technical activities along with administrative and support services also registered a significantly negative contribution. Most other industries had a minor contribution to aggregate compensation per employee growth, suggesting little or no growth. Only the sector comprising public administration, education and health registered a significant positive contribution during the period under review.
Aggregate real ULC increased by 7.2% during 2020 (see Table 4). This was mainly due to the sharp decline in aggregate productivity, shown in Table 1, which offset the aforementioned drop in compen-sation per employee.
As observed for contributions to productivity growth, the main driver behind the increase in ULC was the trade, transportation, accommodation and food services sector. This was followed by the sector comprising professional and administrative activities. These were the two groups of sectors whose output and productivity levels were mostly impacted by the pandemic, mainly as a result of their links
10 Using the GEAD decomposition of productivity, it is possible to calculate approximate sectoral contributions to real ULC growth as the log difference of sectoral contributions to compensation per employee growth and aggregate productivity growth.
Table 3
Percentage points
2015 2016 2017 2018 2019 2020Agriculture, forestry & fishing 0.0 0.0 0.0 0.0 0.0 0.0Industry (excl. construction) 0.3 0.5 -0.1 0.1 0.2 -0.3
of which: Manufacturing 0.1 0.4 -0.1 0.1 0.2 -0.3Construction 0.1 0.3 -0.1 0.0 -0.4 -0.3Wholesale and retail trade; repair of motor vehicles and motorcycles; transportation and storage; accommodation and food service activities
1.9 1.2 -1.3 0.0 -1.0 -1.4
Information & communication -0.1 0.5 0.7 0.9 0.2 0.1Finance & insurance activities 0.7 0.2 0.1 0.0 0.4 0.1Real estate activities 0.1 0.0 -0.1 0.0 -0.1 0.0Professional, scientific and technical activities; administrative and support service activities 0.2 0.5 -0.9 0.1 -0.3 -0.7
Public administration and defence; education, health and social work activities 0.1 0.6 -0.4 0.1 0.8 0.8
Arts, entertainment and recreation, repair of household goods and other services -0.2 1.2 0.3 0.3 0.2 0.1
Growth in compensation per employee (total economy) (%) 2.9 4.8 -2.1 1.4 0.5 -1.6
SECTORAL CONTRIBUTIONS TO GROWTH IN REAL COMPENSATION PER EMPLOYEE(1)
Sources: NSO; authors' own calculations. (1) Sum of sectoral contributions may not exactly match aggregate CPE growth due to chainlinking.
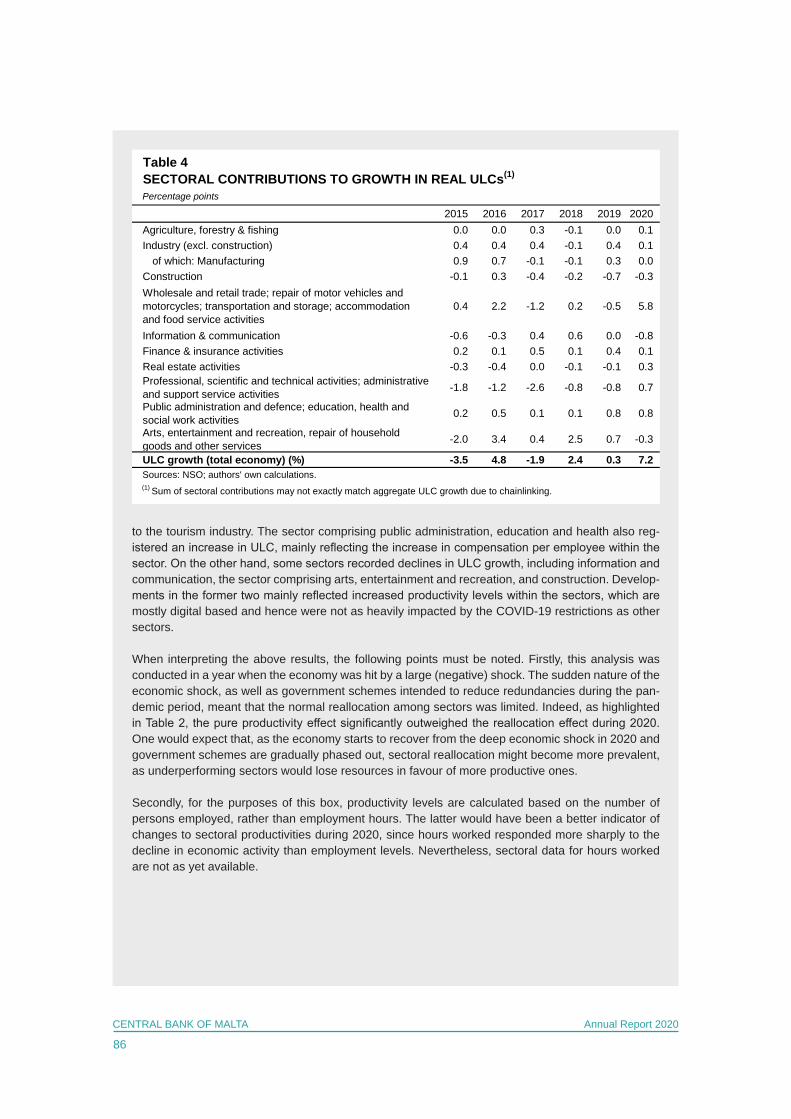
86
CENTRAL BANK OF MALTA Annual Report 2020
to the tourism industry. The sector comprising public administration, education and health also reg-istered an increase in ULC, mainly reflecting the increase in compensation per employee within the sector. On the other hand, some sectors recorded declines in ULC growth, including information and communication, the sector comprising arts, entertainment and recreation, and construction. Develop-ments in the former two mainly reflected increased productivity levels within the sectors, which are mostly digital based and hence were not as heavily impacted by the COVID-19 restrictions as other sectors.
When interpreting the above results, the following points must be noted. Firstly, this analysis was conducted in a year when the economy was hit by a large (negative) shock. The sudden nature of the economic shock, as well as government schemes intended to reduce redundancies during the pan-demic period, meant that the normal reallocation among sectors was limited. Indeed, as highlighted in Table 2, the pure productivity effect significantly outweighed the reallocation effect during 2020. One would expect that, as the economy starts to recover from the deep economic shock in 2020 and government schemes are gradually phased out, sectoral reallocation might become more prevalent, as underperforming sectors would lose resources in favour of more productive ones.
Secondly, for the purposes of this box, productivity levels are calculated based on the number of persons employed, rather than employment hours. The latter would have been a better indicator of changes to sectoral productivities during 2020, since hours worked responded more sharply to the decline in economic activity than employment levels. Nevertheless, sectoral data for hours worked are not as yet available.
Table 4
Percentage points
2015 2016 2017 2018 2019 2020Agriculture, forestry & fishing 0.0 0.0 0.3 -0.1 0.0 0.1Industry (excl. construction) 0.4 0.4 0.4 -0.1 0.4 0.1
of which: Manufacturing 0.9 0.7 -0.1 -0.1 0.3 0.0Construction -0.1 0.3 -0.4 -0.2 -0.7 -0.3Wholesale and retail trade; repair of motor vehicles and motorcycles; transportation and storage; accommodation and food service activities
0.4 2.2 -1.2 0.2 -0.5 5.8
Information & communication -0.6 -0.3 0.4 0.6 0.0 -0.8Finance & insurance activities 0.2 0.1 0.5 0.1 0.4 0.1Real estate activities -0.3 -0.4 0.0 -0.1 -0.1 0.3Professional, scientific and technical activities; administrative and support service activities -1.8 -1.2 -2.6 -0.8 -0.8 0.7
Public administration and defence; education, health and social work activities 0.2 0.5 0.1 0.1 0.8 0.8
Arts, entertainment and recreation, repair of household goods and other services -2.0 3.4 0.4 2.5 0.7 -0.3
ULC growth (total economy) (%) -3.5 4.8 -1.9 2.4 0.3 7.2
SECTORAL CONTRIBUTIONS TO GROWTH IN REAL ULCs(1)
(1) Sum of sectoral contributions may not exactly match aggregate ULC growth due to chainlinking.
Sources: NSO; authors' own calculations.
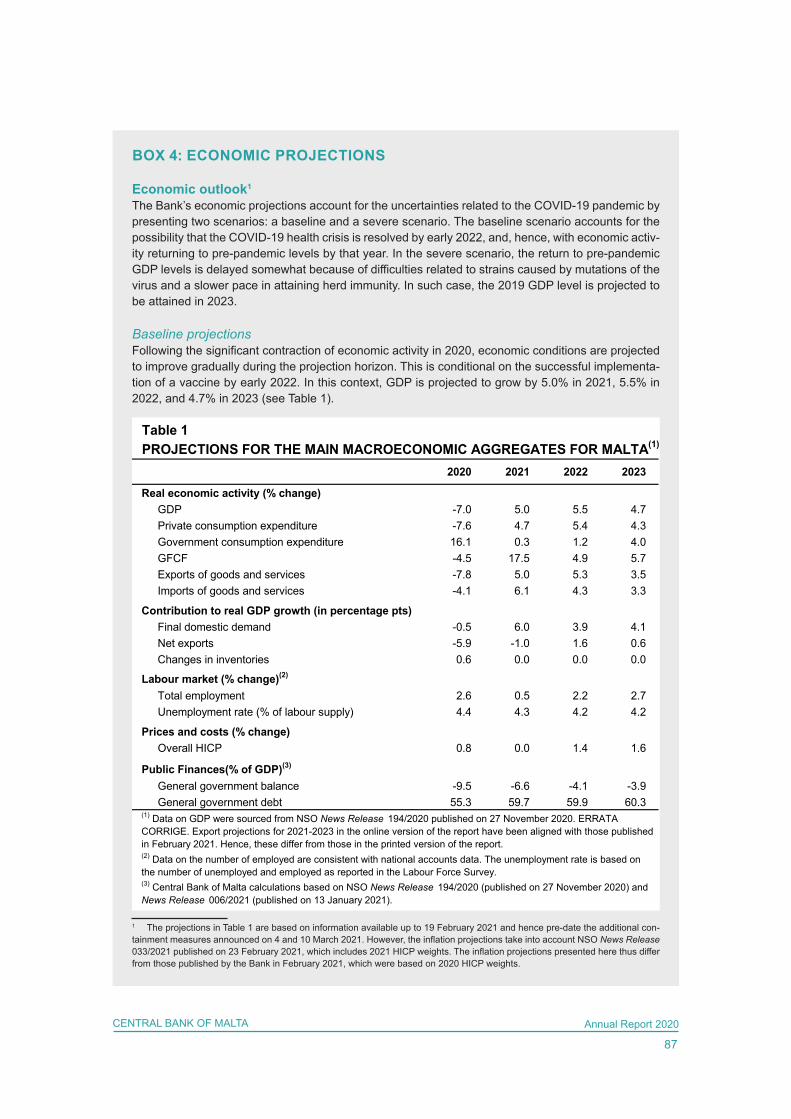
87
CENTRAL BANK OF MALTA Annual Report 2020
BOX 4: ECONOMIC PROJECTIONS
Economic outlook1
The Bank’s economic projections account for the uncertainties related to the COVID-19 pandemic by presenting two scenarios: a baseline and a severe scenario. The baseline scenario accounts for the possibility that the COVID-19 health crisis is resolved by early 2022, and, hence, with economic activ-ity returning to pre-pandemic levels by that year. In the severe scenario, the return to pre-pandemic GDP levels is delayed somewhat because of difficulties related to strains caused by mutations of the virus and a slower pace in attaining herd immunity. In such case, the 2019 GDP level is projected to be attained in 2023.
Baseline projectionsFollowing the significant contraction of economic activity in 2020, economic conditions are projected to improve gradually during the projection horizon. This is conditional on the successful implementa-tion of a vaccine by early 2022. In this context, GDP is projected to grow by 5.0% in 2021, 5.5% in 2022, and 4.7% in 2023 (see Table 1).
1 The projections in Table 1 are based on information available up to 19 February 2021 and hence pre-date the additional con-tainment measures announced on 4 and 10 March 2021. However, the inflation projections take into account NSO News Release 033/2021 published on 23 February 2021, which includes 2021 HICP weights. The inflation projections presented here thus differ from those published by the Bank in February 2021, which were based on 2020 HICP weights.
PROJECTIONS FOR THE MAIN MACROECONOMIC AGGREGATES FOR MALTA(1)
2020 2021 2022 2023
Real economic activity (% change) GDP -7.0 5.0 5.5 4.7 Private consumption expenditure -7.6 4.7 5.4 4.3 Government consumption expenditure 16.1 0.3 1.2 4.0 GFCF -4.5 17.5 4.9 5.7 Exports of goods and services -7.8 5.0 5.3 3.5 Imports of goods and services -4.1 6.1 4.3 3.3
Contribution to real GDP growth (in percentage pts) Final domestic demand -0.5 6.0 3.9 4.1 Net exports -5.9 -1.0 1.6 0.6 Changes in inventories 0.6 0.0 0.0 0.0
Labour market (% change)(2)
Total employment 2.6 0.5 2.2 2.7 Unemployment rate (% of labour supply) 4.4 4.3 4.2 4.2
Prices and costs (% change) Overall HICP 0.8 0.0 1.4 1.6
Public Finances(% of GDP)(3)
General government balance -9.5 -6.6 -4.1 -3.9 General government debt 55.3 59.7 59.9 60.3
Table 1
(1) Data on GDP were sourced from NSO News Release 194/2020 published on 27 November 2020. ERRATA CORRIGE. Export projections for 2021-2023 in the online version of the report have been aligned with those published in February 2021. Hence, these differ from those in the printed version of the report.(2) Data on the number of employed are consistent with national accounts data. The unemployment rate is based on the number of unemployed and employed as reported in the Labour Force Survey.(3) Central Bank of Malta calculations based on NSO News Release 194/2020 (published on 27 November 2020) and News Release 006/2021 (published on 13 January 2021).
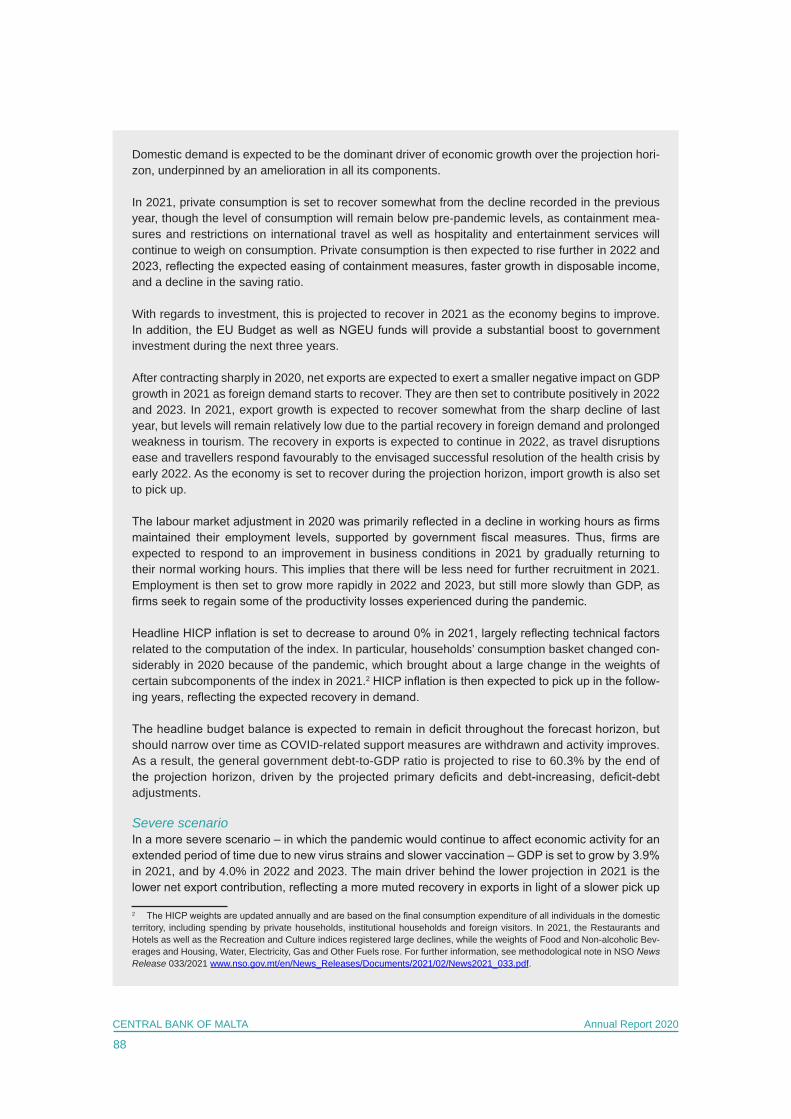
88
CENTRAL BANK OF MALTA Annual Report 2020
Domestic demand is expected to be the dominant driver of economic growth over the projection hori-zon, underpinned by an amelioration in all its components.
In 2021, private consumption is set to recover somewhat from the decline recorded in the previous year, though the level of consumption will remain below pre-pandemic levels, as containment mea-sures and restrictions on international travel as well as hospitality and entertainment services will continue to weigh on consumption. Private consumption is then expected to rise further in 2022 and 2023, reflecting the expected easing of containment measures, faster growth in disposable income, and a decline in the saving ratio.
With regards to investment, this is projected to recover in 2021 as the economy begins to improve. In addition, the EU Budget as well as NGEU funds will provide a substantial boost to government investment during the next three years.
After contracting sharply in 2020, net exports are expected to exert a smaller negative impact on GDP growth in 2021 as foreign demand starts to recover. They are then set to contribute positively in 2022 and 2023. In 2021, export growth is expected to recover somewhat from the sharp decline of last year, but levels will remain relatively low due to the partial recovery in foreign demand and prolonged weakness in tourism. The recovery in exports is expected to continue in 2022, as travel disruptions ease and travellers respond favourably to the envisaged successful resolution of the health crisis by early 2022. As the economy is set to recover during the projection horizon, import growth is also set to pick up.
The labour market adjustment in 2020 was primarily reflected in a decline in working hours as firms maintained their employment levels, supported by government fiscal measures. Thus, firms are expected to respond to an improvement in business conditions in 2021 by gradually returning to their normal working hours. This implies that there will be less need for further recruitment in 2021. Employment is then set to grow more rapidly in 2022 and 2023, but still more slowly than GDP, as firms seek to regain some of the productivity losses experienced during the pandemic.
Headline HICP inflation is set to decrease to around 0% in 2021, largely reflecting technical factors related to the computation of the index. In particular, households’ consumption basket changed con-siderably in 2020 because of the pandemic, which brought about a large change in the weights of certain subcomponents of the index in 2021.2 HICP inflation is then expected to pick up in the follow-ing years, reflecting the expected recovery in demand.
The headline budget balance is expected to remain in deficit throughout the forecast horizon, but should narrow over time as COVID-related support measures are withdrawn and activity improves. As a result, the general government debt-to-GDP ratio is projected to rise to 60.3% by the end of the projection horizon, driven by the projected primary deficits and debt-increasing, deficit-debt adjustments.
Severe scenarioIn a more severe scenario – in which the pandemic would continue to affect economic activity for an extended period of time due to new virus strains and slower vaccination – GDP is set to grow by 3.9% in 2021, and by 4.0% in 2022 and 2023. The main driver behind the lower projection in 2021 is the lower net export contribution, reflecting a more muted recovery in exports in light of a slower pick up
2 The HICP weights are updated annually and are based on the final consumption expenditure of all individuals in the domestic territory, including spending by private households, institutional households and foreign visitors. In 2021, the Restaurants and Hotels as well as the Recreation and Culture indices registered large declines, while the weights of Food and Non-alcoholic Bev-erages and Housing, Water, Electricity, Gas and Other Fuels rose. For further information, see methodological note in NSO News Release 033/2021 www.nso.gov.mt/en/News_Releases/Documents/2021/02/News2021_033.pdf.
89
CENTRAL BANK OF MALTA Annual Report 2020
in tourism and a relatively weaker international environment. Thus, in the severe scenario, economic activity is projected to return to 2019 levels only in 2023.
The general government deficit under the severe scenario is projected to rise further to 10.0% in 2021. It is then projected to decline to 5.6% by 2022, remaining at that level in 2023. This profile reflects the impact of a more persistent economic slowdown as well as higher outlays on COVID-related fiscal measures. As a result, the debt-to-GDP ratio is projected to rise further to 68.2% by 2023. This is mainly due to the expected budget shortfall, as well as the interest-growth differential.
Since these projections were finalised, COVID-19 infection rates have increased somewhat again, both in Malta and in key trading partners, leading to tighter containment measures. In particular, these projections do not incorporate the new measures announced by the Government on 4 and 10 March 2021. These present a downside risk to the baseline projections in the near term. Risks are assessed to be more balanced after 2021, as the implementation of vaccination programmes should allow a broader economic recovery in line with the Bank’s expectations.
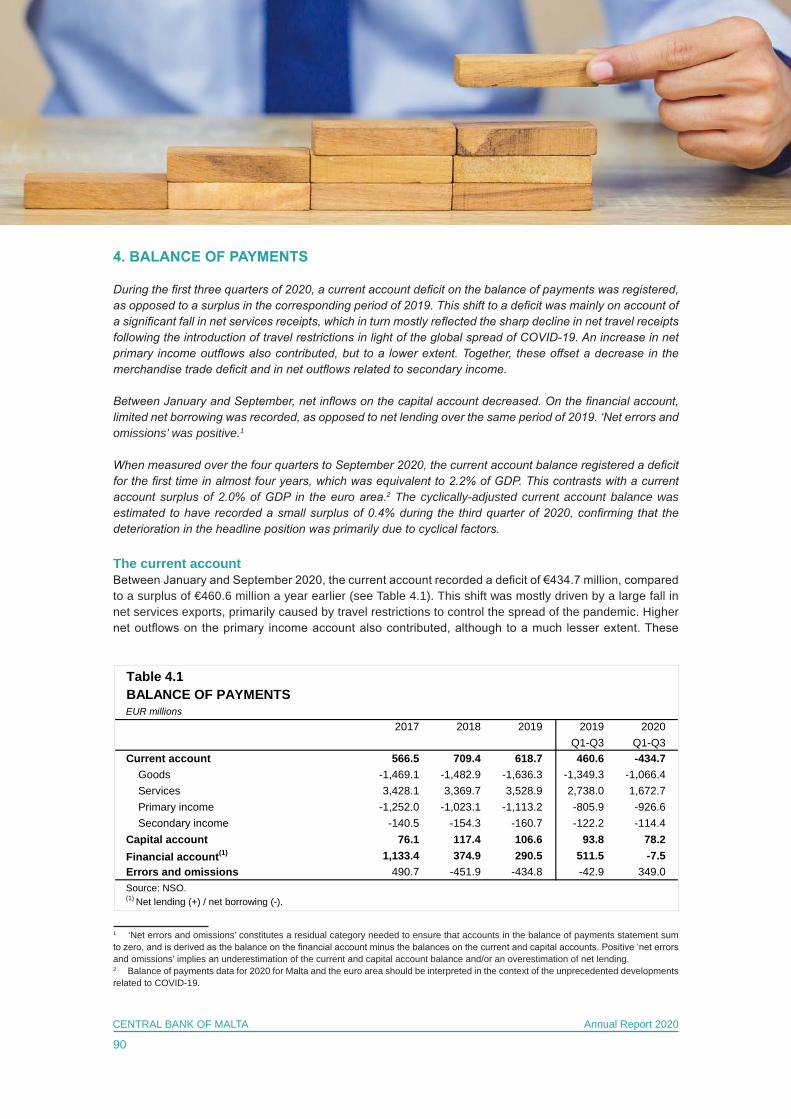
90
CENTRAL BANK OF MALTA Annual Report 2020
4. BALANCE OF PAYMENTS
During the first three quarters of 2020, a current account deficit on the balance of payments was registered, as opposed to a surplus in the corresponding period of 2019. This shift to a deficit was mainly on account of a significant fall in net services receipts, which in turn mostly reflected the sharp decline in net travel receipts following the introduction of travel restrictions in light of the global spread of COVID-19. An increase in net primary income outflows also contributed, but to a lower extent. Together, these offset a decrease in the merchandise trade deficit and in net outflows related to secondary income.
Between January and September, net inflows on the capital account decreased. On the financial account, limited net borrowing was recorded, as opposed to net lending over the same period of 2019. ‘Net errors and omissions’ was positive.1
When measured over the four quarters to September 2020, the current account balance registered a deficit for the first time in almost four years, which was equivalent to 2.2% of GDP. This contrasts with a current account surplus of 2.0% of GDP in the euro area.2 The cyclically-adjusted current account balance was estimated to have recorded a small surplus of 0.4% during the third quarter of 2020, confirming that the deterioration in the headline position was primarily due to cyclical factors.
The current accountBetween January and September 2020, the current account recorded a deficit of €434.7 million, compared to a surplus of €460.6 million a year earlier (see Table 4.1). This shift was mostly driven by a large fall in net services exports, primarily caused by travel restrictions to control the spread of the pandemic. Higher net outflows on the primary income account also contributed, although to a much lesser extent. These
1 ‘Net errors and omissions’ constitutes a residual category needed to ensure that accounts in the balance of payments statement sum to zero, and is derived as the balance on the financial account minus the balances on the current and capital accounts. Positive ‘net errors and omissions’ implies an underestimation of the current and capital account balance and/or an overestimation of net lending.2 Balance of payments data for 2020 for Malta and the euro area should be interpreted in the context of the unprecedented developments related to COVID-19.
Table 4.1BALANCE OF PAYMENTSEUR millions
2019 2020 Q1-Q3 Q1-Q3
Current account 566.5 709.4 618.7 460.6 -434.7 Goods -1,469.1 -1,482.9 -1,636.3 -1,349.3 -1,066.4 Services 3,428.1 3,369.7 3,528.9 2,738.0 1,672.7 Primary income -1,252.0 -1,023.1 -1,113.2 -805.9 -926.6 Secondary income -140.5 -154.3 -160.7 -122.2 -114.4Capital account 76.1 117.4 106.6 93.8 78.2Financial account(1) 1,133.4 374.9 290.5 511.5 -7.5Errors and omissions 490.7 -451.9 -434.8 -42.9 349.0Source: NSO.(1) Net lending (+) / net borrowing (-).
2017 2018 2019
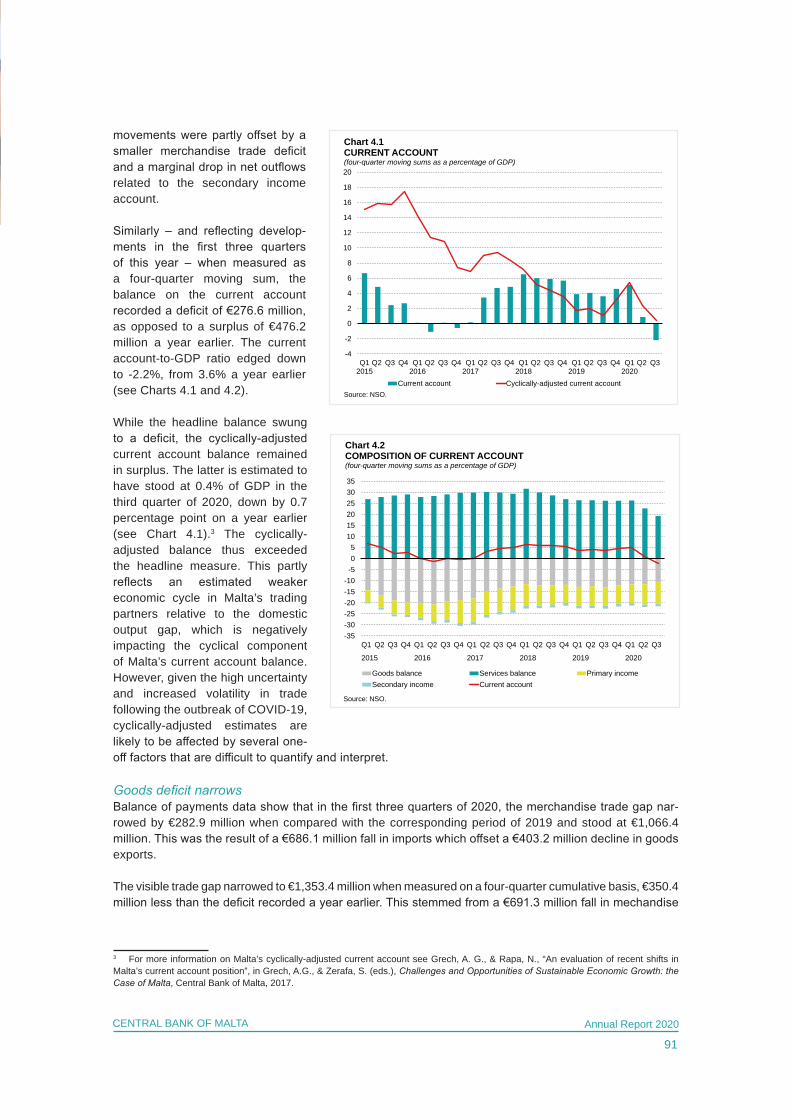
91
CENTRAL BANK OF MALTA Annual Report 2020
movements were partly offset by a smaller merchandise trade deficit and a marginal drop in net outflows related to the secondary income account.
Similarly – and reflecting develop-ments in the first three quarters of this year – when measured as a four-quarter moving sum, the balance on the current account recorded a deficit of €276.6 million, as opposed to a surplus of €476.2 million a year earlier. The current account-to-GDP ratio edged down to -2.2%, from 3.6% a year earlier (see Charts 4.1 and 4.2).
While the headline balance swung to a deficit, the cyclically-adjusted current account balance remained in surplus. The latter is estimated to have stood at 0.4% of GDP in the third quarter of 2020, down by 0.7 percentage point on a year earlier (see Chart 4.1).3 The cyclically-adjusted balance thus exceeded the headline measure. This partly reflects an estimated weaker economic cycle in Malta’s trading partners relative to the domestic output gap, which is negatively impacting the cyclical component of Malta’s current account balance. However, given the high uncertainty and increased volatility in trade following the outbreak of COVID-19, cyclically-adjusted estimates are likely to be affected by several one-off factors that are difficult to quantify and interpret.
Goods deficit narrowsBalance of payments data show that in the first three quarters of 2020, the merchandise trade gap nar-rowed by €282.9 million when compared with the corresponding period of 2019 and stood at €1,066.4 million. This was the result of a €686.1 million fall in imports which offset a €403.2 million decline in goods exports.
The visible trade gap narrowed to €1,353.4 million when measured on a four-quarter cumulative basis, €350.4 million less than the deficit recorded a year earlier. This stemmed from a €691.3 million fall in mechandise
3 For more information on Malta’s cyclically-adjusted current account see Grech, A. G., & Rapa, N., “An evaluation of recent shifts in Malta’s current account position”, in Grech, A.G., & Zerafa, S. (eds.), Challenges and Opportunities of Sustainable Economic Growth: the Case of Malta, Central Bank of Malta, 2017.
-35-30-25-20-15-10
-505
101520253035
Q1 Q2 Q3 Q4 Q1 Q2 Q3 Q4 Q1 Q2 Q3 Q4 Q1 Q2 Q3 Q4 Q1 Q2 Q3 Q4 Q1 Q2 Q3
2015 2016 2017 2018 2019 2020
Chart 4.2COMPOSITION OF CURRENT ACCOUNT(four-quarter moving sums as a percentage of GDP)
Goods balance Services balance Primary incomeSecondary income Current account
Source: NSO.
-4
-2
0
2
4
6
8
10
12
14
16
18
20
Q12015
Q2 Q3 Q4 Q12016
Q2 Q3 Q4 Q12017
Q2 Q3 Q4 Q12018
Q2 Q3 Q4 Q12019
Q2 Q3 Q4 Q12020
Q2 Q3
Chart 4.1CURRENT ACCOUNT (four-quarter moving sums as a percentage of GDP)
Current account Cyclically-adjusted current accountSource: NSO.
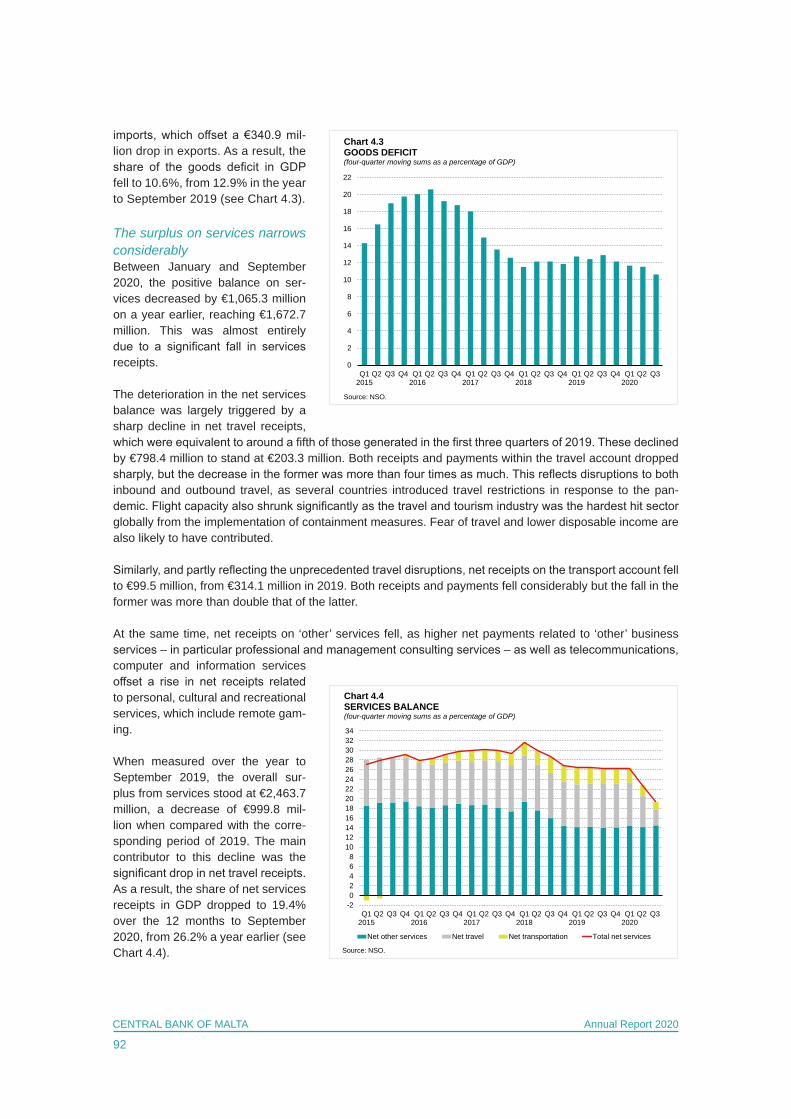
92
CENTRAL BANK OF MALTA Annual Report 2020
imports, which offset a €340.9 mil-lion drop in exports. As a result, the share of the goods deficit in GDP fell to 10.6%, from 12.9% in the year to September 2019 (see Chart 4.3).
The surplus on services narrows considerablyBetween January and September 2020, the positive balance on ser-vices decreased by €1,065.3 million on a year earlier, reaching €1,672.7 million. This was almost entirely due to a significant fall in services receipts.
The deterioration in the net services balance was largely triggered by a sharp decline in net travel receipts, which were equivalent to around a fifth of those generated in the first three quarters of 2019. These declined by €798.4 million to stand at €203.3 million. Both receipts and payments within the travel account dropped sharply, but the decrease in the former was more than four times as much. This reflects disruptions to both inbound and outbound travel, as several countries introduced travel restrictions in response to the pan-demic. Flight capacity also shrunk significantly as the travel and tourism industry was the hardest hit sector globally from the implementation of containment measures. Fear of travel and lower disposable income are also likely to have contributed.
Similarly, and partly reflecting the unprecedented travel disruptions, net receipts on the transport account fell to €99.5 million, from €314.1 million in 2019. Both receipts and payments fell considerably but the fall in the former was more than double that of the latter.
At the same time, net receipts on ‘other’ services fell, as higher net payments related to ‘other’ business services – in particular professional and management consulting services – as well as telecommunications, computer and information services offset a rise in net receipts related to personal, cultural and recreational services, which include remote gam-ing.
When measured over the year to September 2019, the overall sur-plus from services stood at €2,463.7 million, a decrease of €999.8 mil-lion when compared with the corre-sponding period of 2019. The main contributor to this decline was the significant drop in net travel receipts. As a result, the share of net services receipts in GDP dropped to 19.4% over the 12 months to September 2020, from 26.2% a year earlier (see Chart 4.4).
0
2
4
6
8
10
12
14
16
18
20
22
Q12015
Q2 Q3 Q4 Q12016
Q2 Q3 Q4 Q12017
Q2 Q3 Q4 Q12018
Q2 Q3 Q4 Q12019
Q2 Q3 Q4 Q12020
Q2 Q3
Chart 4.3GOODS DEFICIT (four-quarter moving sums as a percentage of GDP)
Source: NSO.
-202468
10121416182022242628303234
Q12015
Q2 Q3 Q4 Q12016
Q2 Q3 Q4 Q12017
Q2 Q3 Q4 Q12018
Q2 Q3 Q4 Q12019
Q2 Q3 Q4 Q12020
Q2 Q3
Chart 4.4SERVICES BALANCE(four-quarter moving sums as a percentage of GDP)
Net other services Net travel Net transportation Total net services
Source: NSO.
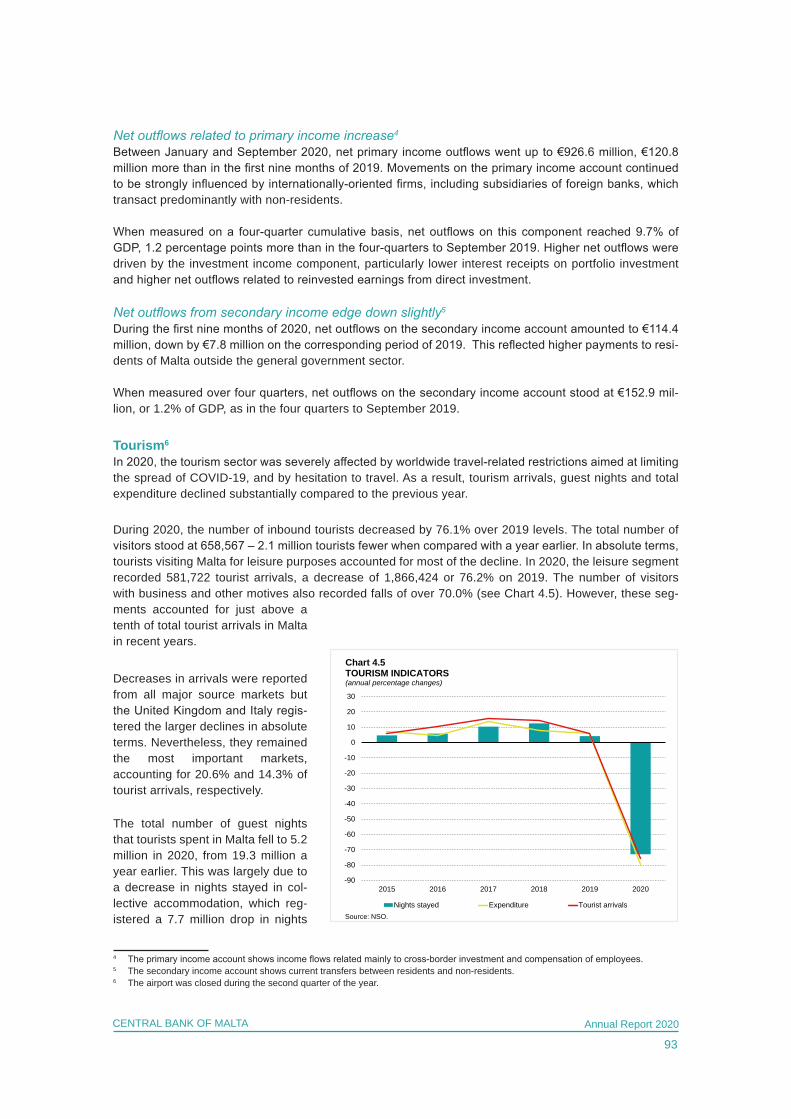
93
CENTRAL BANK OF MALTA Annual Report 2020
Net outflows related to primary income increase4
Between January and September 2020, net primary income outflows went up to €926.6 million, €120.8 million more than in the first nine months of 2019. Movements on the primary income account continued to be strongly influenced by internationally-oriented firms, including subsidiaries of foreign banks, which transact predominantly with non-residents.
When measured on a four-quarter cumulative basis, net outflows on this component reached 9.7% of GDP, 1.2 percentage points more than in the four-quarters to September 2019. Higher net outflows were driven by the investment income component, particularly lower interest receipts on portfolio investment and higher net outflows related to reinvested earnings from direct investment.
Net outflows from secondary income edge down slightly5
During the first nine months of 2020, net outflows on the secondary income account amounted to €114.4 million, down by €7.8 million on the corresponding period of 2019. This reflected higher payments to resi-dents of Malta outside the general government sector.
When measured over four quarters, net outflows on the secondary income account stood at €152.9 mil-lion, or 1.2% of GDP, as in the four quarters to September 2019.
Tourism6
In 2020, the tourism sector was severely affected by worldwide travel-related restrictions aimed at limiting the spread of COVID-19, and by hesitation to travel. As a result, tourism arrivals, guest nights and total expenditure declined substantially compared to the previous year.
During 2020, the number of inbound tourists decreased by 76.1% over 2019 levels. The total number of visitors stood at 658,567 – 2.1 million tourists fewer when compared with a year earlier. In absolute terms, tourists visiting Malta for leisure purposes accounted for most of the decline. In 2020, the leisure segment recorded 581,722 tourist arrivals, a decrease of 1,866,424 or 76.2% on 2019. The number of visitors with business and other motives also recorded falls of over 70.0% (see Chart 4.5). However, these seg-ments accounted for just above a tenth of total tourist arrivals in Malta in recent years.
Decreases in arrivals were reported from all major source markets but the United Kingdom and Italy regis-tered the larger declines in absolute terms. Nevertheless, they remained the most important markets, accounting for 20.6% and 14.3% of tourist arrivals, respectively.
The total number of guest nights that tourists spent in Malta fell to 5.2 million in 2020, from 19.3 million a year earlier. This was largely due to a decrease in nights stayed in col-lective accommodation, which reg-istered a 7.7 million drop in nights
4 The primary income account shows income flows related mainly to cross-border investment and compensation of employees.5 The secondary income account shows current transfers between residents and non-residents.6 The airport was closed during the second quarter of the year.
-90
-80
-70
-60
-50
-40
-30
-20
-10
0
10
20
30
2015 2016 2017 2018 2019 2020
Nights stayed Expenditure Tourist arrivals
Chart 4.5TOURISM INDICATORS (annual percentage changes)
Source: NSO.
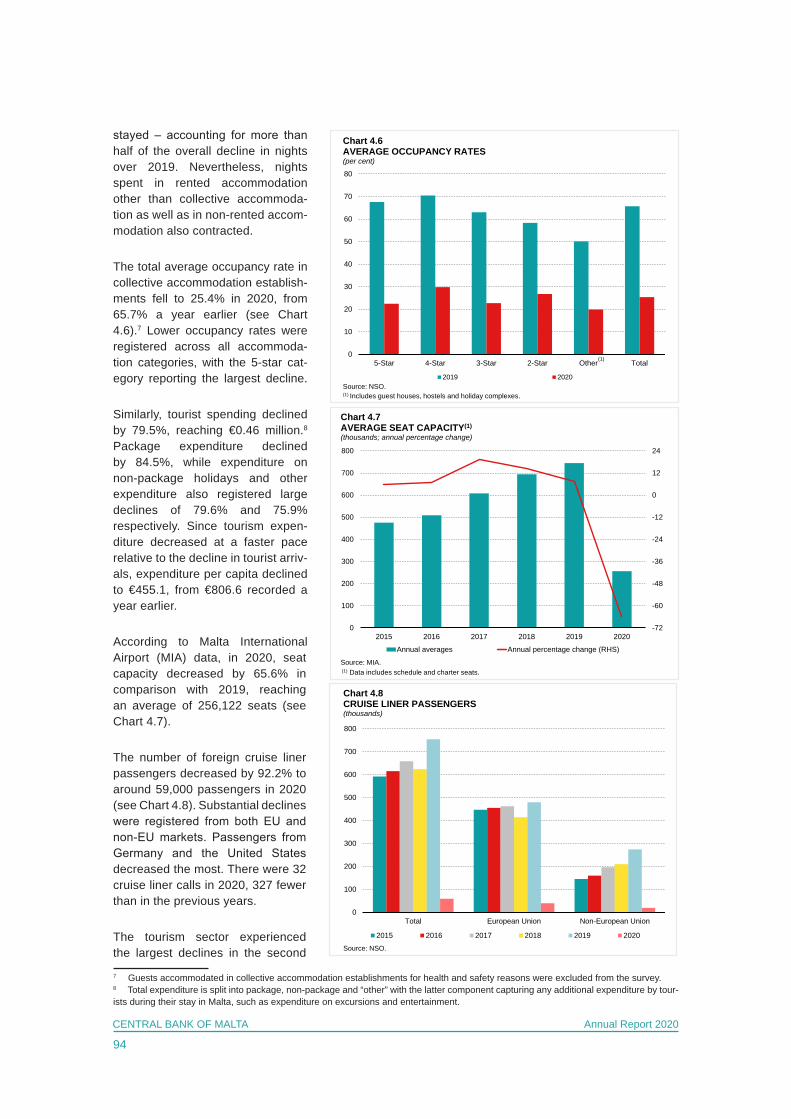
94
CENTRAL BANK OF MALTA Annual Report 2020
stayed – accounting for more than half of the overall decline in nights over 2019. Nevertheless, nights spent in rented accommodation other than collective accommoda-tion as well as in non-rented accom-modation also contracted.
The total average occupancy rate in collective accommodation establish-ments fell to 25.4% in 2020, from 65.7% a year earlier (see Chart 4.6).7 Lower occupancy rates were registered across all accommoda-tion categories, with the 5-star cat-egory reporting the largest decline.
Similarly, tourist spending declined by 79.5%, reaching €0.46 million.8 Package expenditure declined by 84.5%, while expenditure on non-package holidays and other expenditure also registered large declines of 79.6% and 75.9% respectively. Since tourism expen-diture decreased at a faster pace relative to the decline in tourist arriv-als, expenditure per capita declined to €455.1, from €806.6 recorded a year earlier.
According to Malta International Airport (MIA) data, in 2020, seat capacity decreased by 65.6% in comparison with 2019, reaching an average of 256,122 seats (see Chart 4.7).
The number of foreign cruise liner passengers decreased by 92.2% to around 59,000 passengers in 2020 (see Chart 4.8). Substantial declines were registered from both EU and non-EU markets. Passengers from Germany and the United States decreased the most. There were 32 cruise liner calls in 2020, 327 fewer than in the previous years.
The tourism sector experienced the largest declines in the second
7 Guests accommodated in collective accommodation establishments for health and safety reasons were excluded from the survey.8 Total expenditure is split into package, non-package and “other” with the latter component capturing any additional expenditure by tour-ists during their stay in Malta, such as expenditure on excursions and entertainment.
-72
-60
-48
-36
-24
-12
0
12
24
0
100
200
300
400
500
600
700
800
2015 2016 2017 2018 2019 2020
Annual averages Annual percentage change (RHS)
Chart 4.7AVERAGE SEAT CAPACITY(1)
(thousands; annual percentage change)
Source: MIA.(1) Data includes schedule and charter seats.
0
10
20
30
40
50
60
70
80
5-Star 4-Star 3-Star 2-Star Other Total
2019 2020
Chart 4.6AVERAGE OCCUPANCY RATES (per cent)
Source: NSO.(1) Includes guest houses, hostels and holiday complexes.
(1)
0
100
200
300
400
500
600
700
800
Total European Union Non-European Union
2015 2016 2017 2018 2019 2020
Chart 4.8CRUISE LINER PASSENGERS(thousands)
Source: NSO.
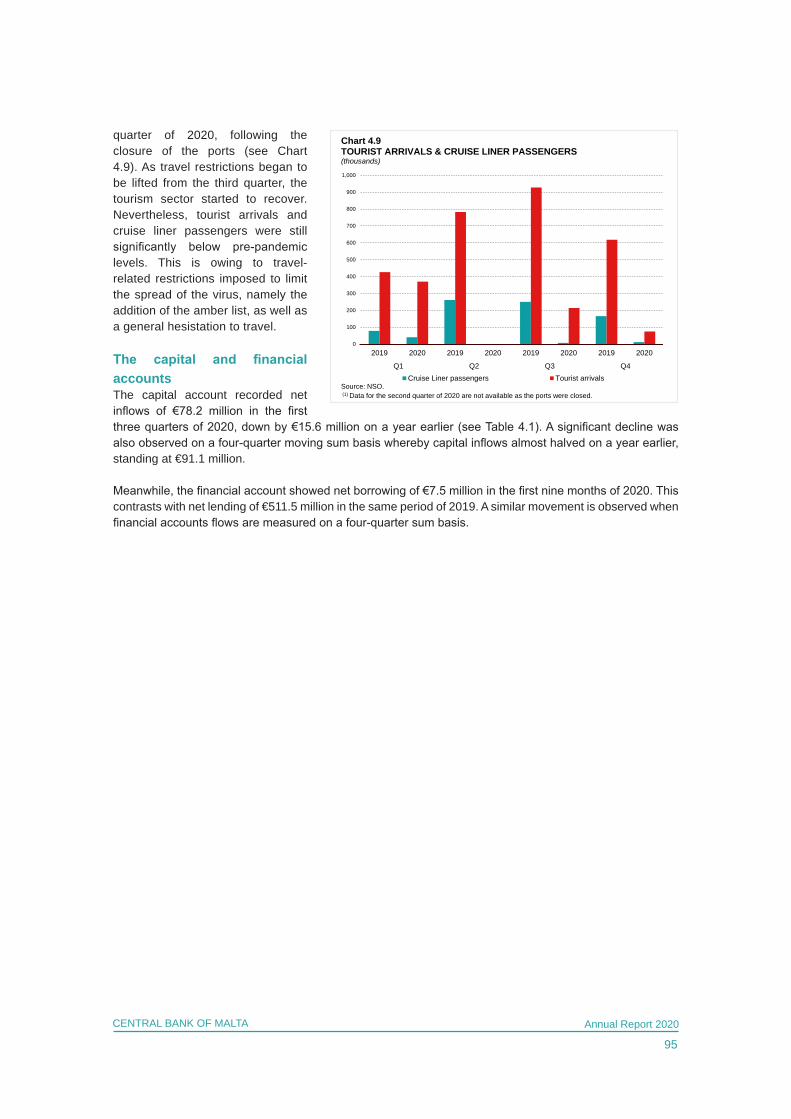
95
CENTRAL BANK OF MALTA Annual Report 2020
quarter of 2020, following the closure of the ports (see Chart 4.9). As travel restrictions began to be lifted from the third quarter, the tourism sector started to recover. Nevertheless, tourist arrivals and cruise liner passengers were still significantly below pre-pandemic levels. This is owing to travel-related restrictions imposed to limit the spread of the virus, namely the addition of the amber list, as well as a general hesistation to travel.
The capital and financial accountsThe capital account recorded net inflows of €78.2 million in the first three quarters of 2020, down by €15.6 million on a year earlier (see Table 4.1). A significant decline was also observed on a four-quarter moving sum basis whereby capital inflows almost halved on a year earlier, standing at €91.1 million.
Meanwhile, the financial account showed net borrowing of €7.5 million in the first nine months of 2020. This contrasts with net lending of €511.5 million in the same period of 2019. A similar movement is observed when financial accounts flows are measured on a four-quarter sum basis.
0
100
200
300
400
500
600
700
800
900
1,000
2019 2020 2019 2020 2019 2020 2019 2020
Q1 Q2 Q3 Q4Cruise Liner passengers Tourist arrivals
Source: NSO.(1) Data for the second quarter of 2020 are not available as the ports were closed.
Chart 4.9TOURIST ARRIVALS & CRUISE LINER PASSENGERS(thousands)
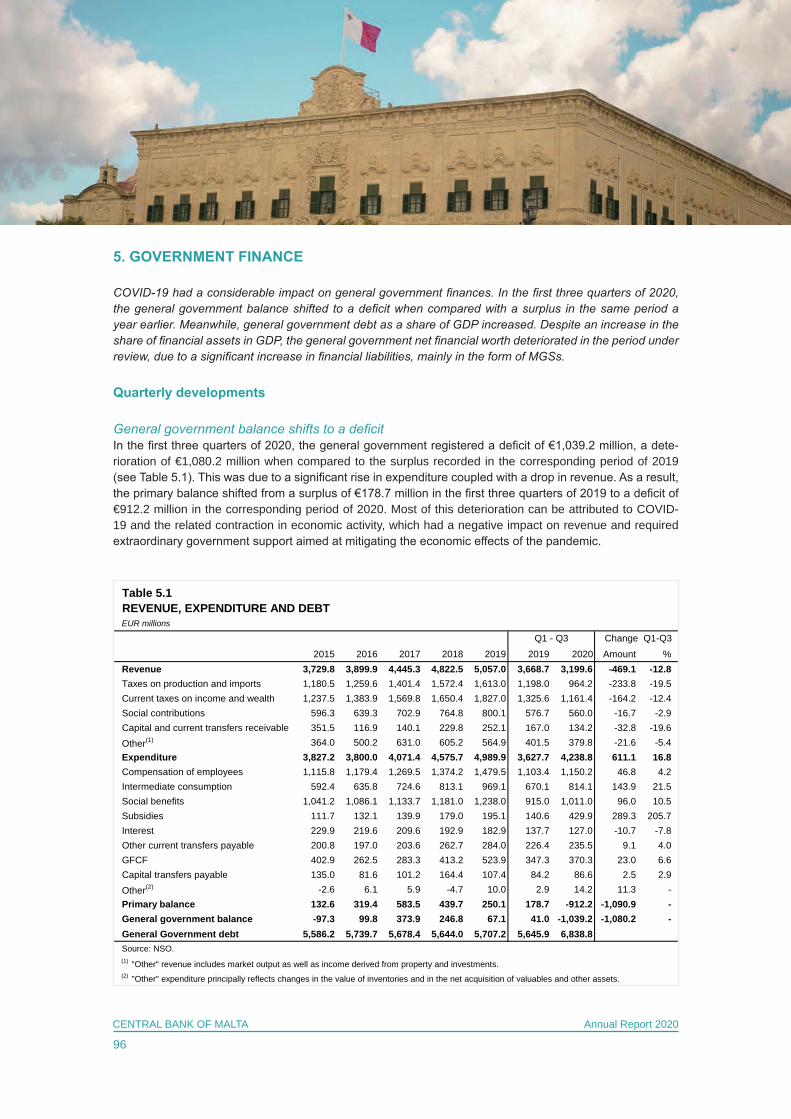
96
CENTRAL BANK OF MALTA Annual Report 2020
5. GOVERNMENT FINANCE
COVID-19 had a considerable impact on general government finances. In the first three quarters of 2020, the general government balance shifted to a deficit when compared with a surplus in the same period a year earlier. Meanwhile, general government debt as a share of GDP increased. Despite an increase in the share of financial assets in GDP, the general government net financial worth deteriorated in the period under review, due to a significant increase in financial liabilities, mainly in the form of MGSs.
Quarterly developments
General government balance shifts to a deficitIn the first three quarters of 2020, the general government registered a deficit of €1,039.2 million, a dete-rioration of €1,080.2 million when compared to the surplus recorded in the corresponding period of 2019 (see Table 5.1). This was due to a significant rise in expenditure coupled with a drop in revenue. As a result, the primary balance shifted from a surplus of €178.7 million in the first three quarters of 2019 to a deficit of €912.2 million in the corresponding period of 2020. Most of this deterioration can be attributed to COVID-19 and the related contraction in economic activity, which had a negative impact on revenue and required extraordinary government support aimed at mitigating the economic effects of the pandemic.
Table 5.1REVENUE, EXPENDITURE AND DEBTEUR millions
2015 2016 2017 2018 2019 2019 2020 Amount %Revenue 3,729.8 3,899.9 4,445.3 4,822.5 5,057.0 3,668.7 3,199.6 -469.1 -12.8Taxes on production and imports 1,180.5 1,259.6 1,401.4 1,572.4 1,613.0 1,198.0 964.2 -233.8 -19.5Current taxes on income and wealth 1,237.5 1,383.9 1,569.8 1,650.4 1,827.0 1,325.6 1,161.4 -164.2 -12.4Social contributions 596.3 639.3 702.9 764.8 800.1 576.7 560.0 -16.7 -2.9Capital and current transfers receivable 351.5 116.9 140.1 229.8 252.1 167.0 134.2 -32.8 -19.6Other(1) 364.0 500.2 631.0 605.2 564.9 401.5 379.8 -21.6 -5.4Expenditure 3,827.2 3,800.0 4,071.4 4,575.7 4,989.9 3,627.7 4,238.8 611.1 16.8Compensation of employees 1,115.8 1,179.4 1,269.5 1,374.2 1,479.5 1,103.4 1,150.2 46.8 4.2Intermediate consumption 592.4 635.8 724.6 813.1 969.1 670.1 814.1 143.9 21.5Social benefits 1,041.2 1,086.1 1,133.7 1,181.0 1,238.0 915.0 1,011.0 96.0 10.5Subsidies 111.7 132.1 139.9 179.0 195.1 140.6 429.9 289.3 205.7Interest 229.9 219.6 209.6 192.9 182.9 137.7 127.0 -10.7 -7.8Other current transfers payable 200.8 197.0 203.6 262.7 284.0 226.4 235.5 9.1 4.0GFCF 402.9 262.5 283.3 413.2 523.9 347.3 370.3 23.0 6.6Capital transfers payable 135.0 81.6 101.2 164.4 107.4 84.2 86.6 2.5 2.9Other(2) -2.6 6.1 5.9 -4.7 10.0 2.9 14.2 11.3 -Primary balance 132.6 319.4 583.5 439.7 250.1 178.7 -912.2 -1,090.9 -General government balance -97.3 99.8 373.9 246.8 67.1 41.0 -1,039.2 -1,080.2 -General Government debt 5,586.2 5,739.7 5,678.4 5,644.0 5,707.2 5,645.9 6,838.8Source: NSO.(1) "Other" revenue includes market output as well as income derived from property and investments.(2) "Other" expenditure principally reflects changes in the value of inventories and in the net acquisition of valuables and other assets.
Q1 - Q3 Change Q1-Q3
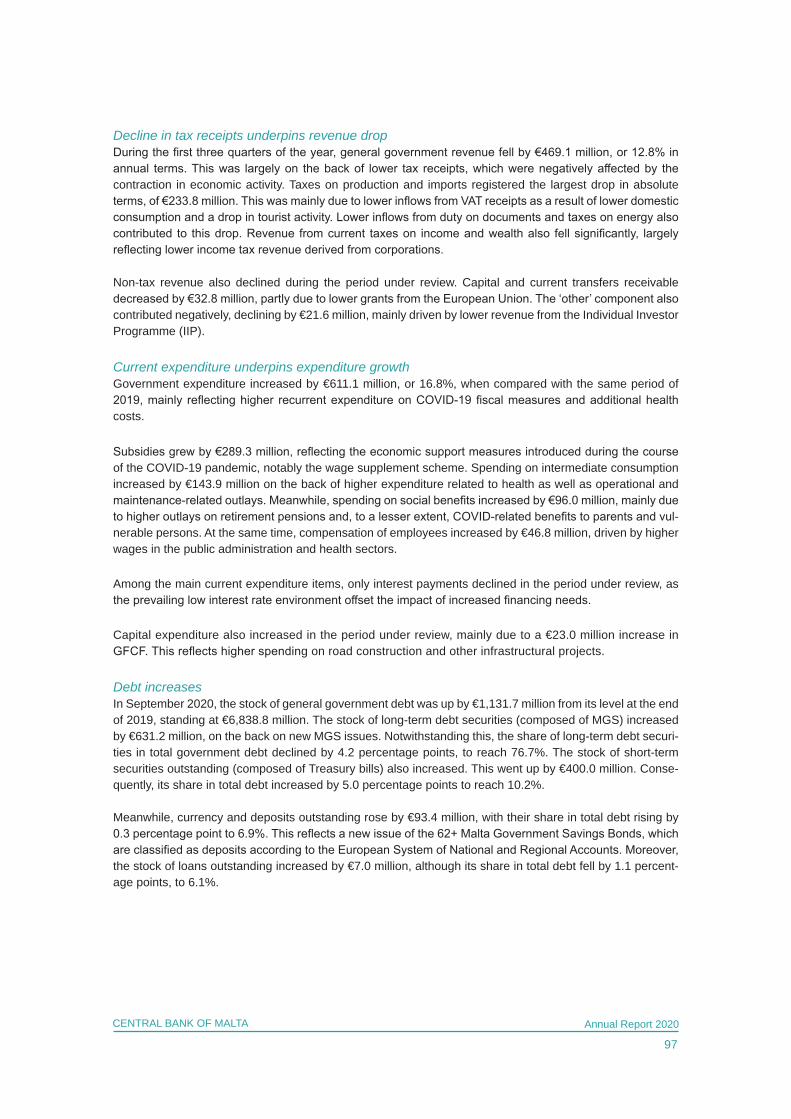
97
CENTRAL BANK OF MALTA Annual Report 2020
Decline in tax receipts underpins revenue dropDuring the first three quarters of the year, general government revenue fell by €469.1 million, or 12.8% in annual terms. This was largely on the back of lower tax receipts, which were negatively affected by the contraction in economic activity. Taxes on production and imports registered the largest drop in absolute terms, of €233.8 million. This was mainly due to lower inflows from VAT receipts as a result of lower domestic consumption and a drop in tourist activity. Lower inflows from duty on documents and taxes on energy also contributed to this drop. Revenue from current taxes on income and wealth also fell significantly, largely reflecting lower income tax revenue derived from corporations.
Non-tax revenue also declined during the period under review. Capital and current transfers receivable decreased by €32.8 million, partly due to lower grants from the European Union. The ‘other’ component also contributed negatively, declining by €21.6 million, mainly driven by lower revenue from the Individual Investor Programme (IIP).
Current expenditure underpins expenditure growthGovernment expenditure increased by €611.1 million, or 16.8%, when compared with the same period of 2019, mainly reflecting higher recurrent expenditure on COVID-19 fiscal measures and additional health costs.
Subsidies grew by €289.3 million, reflecting the economic support measures introduced during the course of the COVID-19 pandemic, notably the wage supplement scheme. Spending on intermediate consumption increased by €143.9 million on the back of higher expenditure related to health as well as operational and maintenance-related outlays. Meanwhile, spending on social benefits increased by €96.0 million, mainly due to higher outlays on retirement pensions and, to a lesser extent, COVID-related benefits to parents and vul-nerable persons. At the same time, compensation of employees increased by €46.8 million, driven by higher wages in the public administration and health sectors.
Among the main current expenditure items, only interest payments declined in the period under review, as the prevailing low interest rate environment offset the impact of increased financing needs.
Capital expenditure also increased in the period under review, mainly due to a €23.0 million increase in GFCF. This reflects higher spending on road construction and other infrastructural projects.
Debt increasesIn September 2020, the stock of general government debt was up by €1,131.7 million from its level at the end of 2019, standing at €6,838.8 million. The stock of long-term debt securities (composed of MGS) increased by €631.2 million, on the back on new MGS issues. Notwithstanding this, the share of long-term debt securi-ties in total government debt declined by 4.2 percentage points, to reach 76.7%. The stock of short-term securities outstanding (composed of Treasury bills) also increased. This went up by €400.0 million. Conse-quently, its share in total debt increased by 5.0 percentage points to reach 10.2%.
Meanwhile, currency and deposits outstanding rose by €93.4 million, with their share in total debt rising by 0.3 percentage point to 6.9%. This reflects a new issue of the 62+ Malta Government Savings Bonds, which are classified as deposits according to the European System of National and Regional Accounts. Moreover, the stock of loans outstanding increased by €7.0 million, although its share in total debt fell by 1.1 percent-age points, to 6.1%.
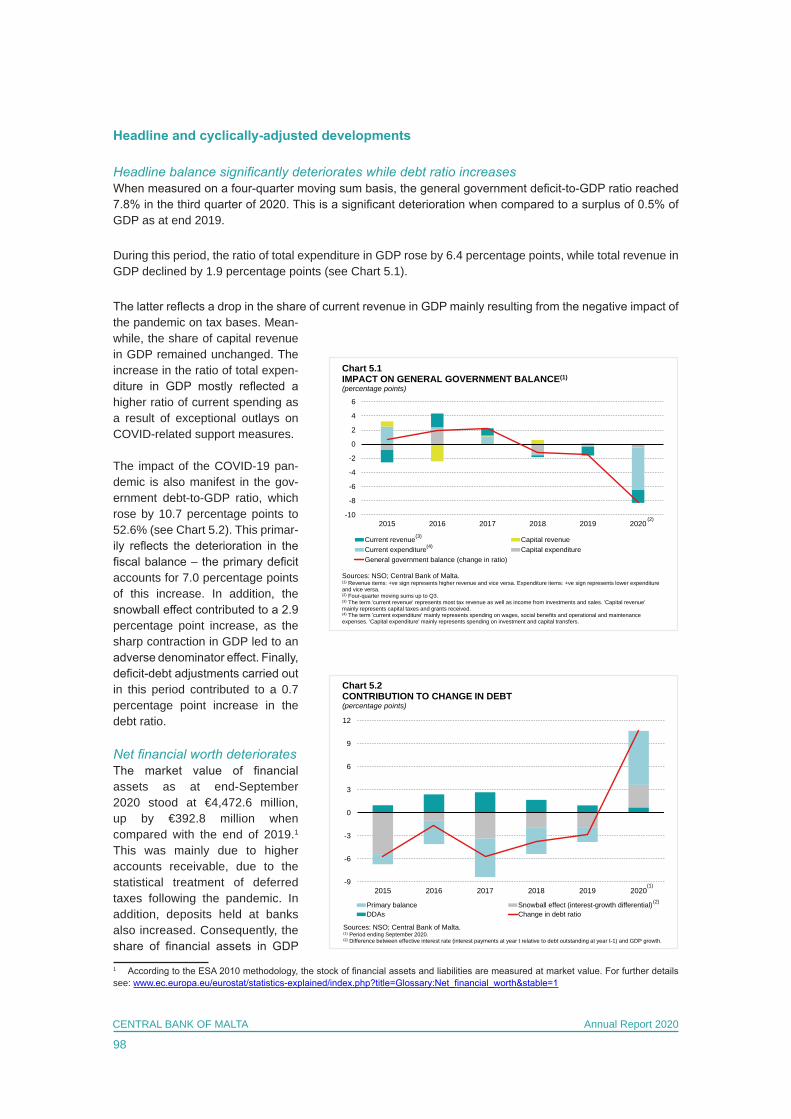
98
CENTRAL BANK OF MALTA Annual Report 2020
Headline and cyclically-adjusted developments
Headline balance significantly deteriorates while debt ratio increasesWhen measured on a four-quarter moving sum basis, the general government deficit-to-GDP ratio reached 7.8% in the third quarter of 2020. This is a significant deterioration when compared to a surplus of 0.5% of GDP as at end 2019.
During this period, the ratio of total expenditure in GDP rose by 6.4 percentage points, while total revenue in GDP declined by 1.9 percentage points (see Chart 5.1).
The latter reflects a drop in the share of current revenue in GDP mainly resulting from the negative impact of the pandemic on tax bases. Mean-while, the share of capital revenue in GDP remained unchanged. The increase in the ratio of total expen-diture in GDP mostly reflected a higher ratio of current spending as a result of exceptional outlays on COVID-related support measures.
The impact of the COVID-19 pan-demic is also manifest in the gov-ernment debt-to-GDP ratio, which rose by 10.7 percentage points to 52.6% (see Chart 5.2). This primar-ily reflects the deterioration in the fiscal balance – the primary deficit accounts for 7.0 percentage points of this increase. In addition, the snowball effect contributed to a 2.9 percentage point increase, as the sharp contraction in GDP led to an adverse denominator effect. Finally, deficit-debt adjustments carried out in this period contributed to a 0.7 percentage point increase in the debt ratio.
Net financial worth deterioratesThe market value of financial assets as at end-September 2020 stood at €4,472.6 million, up by €392.8 million when compared with the end of 2019.1 This was mainly due to higher accounts receivable, due to the statistical treatment of deferred taxes following the pandemic. In addition, deposits held at banks also increased. Consequently, the share of financial assets in GDP
1 According to the ESA 2010 methodology, the stock of financial assets and liabilities are measured at market value. For further details see: www.ec.europa.eu/eurostat/statistics-explained/index.php?title=Glossary:Net_financial_worth&stable=1
-10
-8
-6
-4
-2
0
2
4
6
2015 2016 2017 2018 2019 2020
Current revenue Capital revenueCurrent expenditure Capital expenditureGeneral government balance (change in ratio)
Chart 5.1IMPACT ON GENERAL GOVERNMENT BALANCE(1)
(percentage points)
Sources: NSO; Central Bank of Malta.(1) Revenue items: +ve sign represents higher revenue and vice versa. Expenditure items: +ve sign represents lower expenditure and vice versa.(2) Four-quarter moving sums up to Q3.(3) The term 'current revenue' represents most tax revenue as well as income from investments and sales. 'Capital revenue' mainly represents capital taxes and grants received.(4) The term 'current expenditure' mainly represents spending on wages, social benefits and operational and maintenance expenses. 'Capital expenditure' mainly represents spending on investment and capital transfers.
(3)
(4)
(2)
-9
-6
-3
0
3
6
9
12
2015 2016 2017 2018 2019 2020
Primary balance Snowball effect (interest-growth differential)DDAs Change in debt ratio
Chart 5.2CONTRIBUTION TO CHANGE IN DEBT (percentage points)
Sources: NSO; Central Bank of Malta.(1) Period ending September 2020.(2) Difference between effective interest rate (interest payments at year t relative to debt outstanding at year t-1) and GDP growth.
(2)
(1)
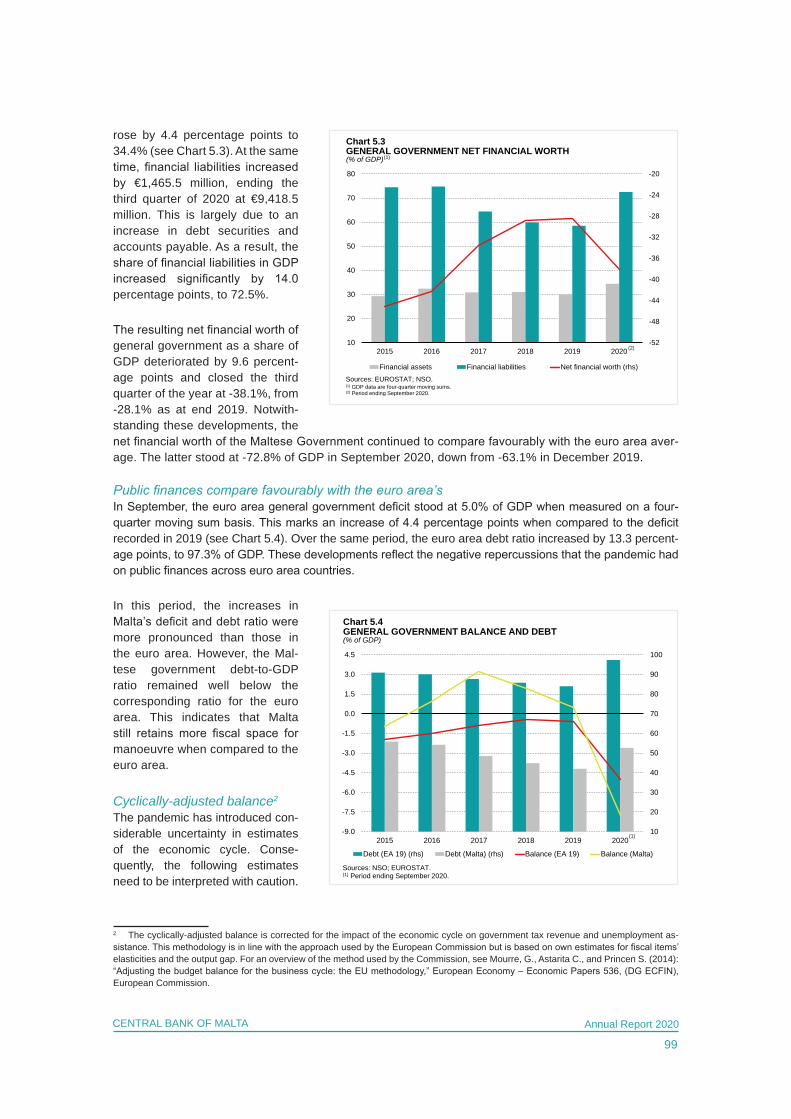
99
CENTRAL BANK OF MALTA Annual Report 2020
rose by 4.4 percentage points to 34.4% (see Chart 5.3). At the same time, financial liabilities increased by €1,465.5 million, ending the third quarter of 2020 at €9,418.5 million. This is largely due to an increase in debt securities and accounts payable. As a result, the share of financial liabilities in GDP increased significantly by 14.0 percentage points, to 72.5%.
The resulting net financial worth of general government as a share of GDP deteriorated by 9.6 percent-age points and closed the third quarter of the year at -38.1%, from -28.1% as at end 2019. Notwith-standing these developments, the net financial worth of the Maltese Government continued to compare favourably with the euro area aver-age. The latter stood at -72.8% of GDP in September 2020, down from -63.1% in December 2019.
Public finances compare favourably with the euro area’sIn September, the euro area general government deficit stood at 5.0% of GDP when measured on a four-quarter moving sum basis. This marks an increase of 4.4 percentage points when compared to the deficit recorded in 2019 (see Chart 5.4). Over the same period, the euro area debt ratio increased by 13.3 percent-age points, to 97.3% of GDP. These developments reflect the negative repercussions that the pandemic had on public finances across euro area countries.
In this period, the increases in Malta’s deficit and debt ratio were more pronounced than those in the euro area. However, the Mal-tese government debt-to-GDP ratio remained well below the corresponding ratio for the euro area. This indicates that Malta still retains more fiscal space for manoeuvre when compared to the euro area.
Cyclically-adjusted balance2
The pandemic has introduced con-siderable uncertainty in estimates of the economic cycle. Conse-quently, the following estimates need to be interpreted with caution.
2 The cyclically-adjusted balance is corrected for the impact of the economic cycle on government tax revenue and unemployment as-sistance. This methodology is in line with the approach used by the European Commission but is based on own estimates for fiscal items’ elasticities and the output gap. For an overview of the method used by the Commission, see Mourre, G., Astarita C., and Princen S. (2014): “Adjusting the budget balance for the business cycle: the EU methodology,” European Economy – Economic Papers 536, (DG ECFIN), European Commission.
-52
-48
-44
-40
-36
-32
-28
-24
-20
10
20
30
40
50
60
70
80
2015 2016 2017 2018 2019 2020
Financial assets Financial liabilities Net financial worth (rhs)
Chart 5.3GENERAL GOVERNMENT NET FINANCIAL WORTH(% of GDP)
Sources: EUROSTAT; NSO.(1) GDP data are four-quarter moving sums.(2) Period ending September 2020.
(1)
(2)
10
20
30
40
50
60
70
80
90
100
-9.0
-7.5
-6.0
-4.5
-3.0
-1.5
0.0
1.5
3.0
4.5
2015 2016 2017 2018 2019 2020
Debt (EA 19) (rhs) Debt (Malta) (rhs) Balance (EA 19) Balance (Malta)
Chart 5.4GENERAL GOVERNMENT BALANCE AND DEBT(% of GDP)
Sources: NSO; EUROSTAT.(1) Period ending September 2020.
(1)
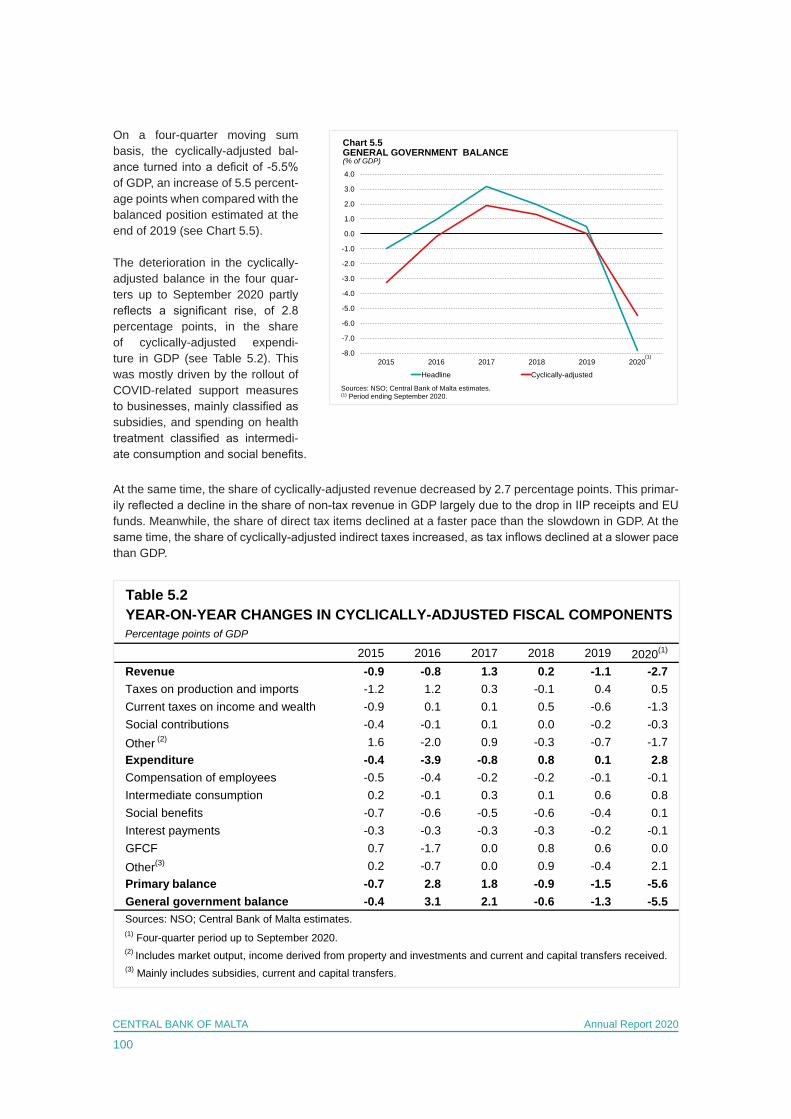
100
CENTRAL BANK OF MALTA Annual Report 2020
On a four-quarter moving sum basis, the cyclically-adjusted bal-ance turned into a deficit of -5.5% of GDP, an increase of 5.5 percent-age points when compared with the balanced position estimated at the end of 2019 (see Chart 5.5).
The deterioration in the cyclically-adjusted balance in the four quar-ters up to September 2020 partly reflects a significant rise, of 2.8 percentage points, in the share of cyclically-adjusted expendi-ture in GDP (see Table 5.2). This was mostly driven by the rollout of COVID-related support measures to businesses, mainly classified as subsidies, and spending on health treatment classified as intermedi-ate consumption and social benefits.
At the same time, the share of cyclically-adjusted revenue decreased by 2.7 percentage points. This primar-ily reflected a decline in the share of non-tax revenue in GDP largely due to the drop in IIP receipts and EU funds. Meanwhile, the share of direct tax items declined at a faster pace than the slowdown in GDP. At the same time, the share of cyclically-adjusted indirect taxes increased, as tax inflows declined at a slower pace than GDP.
-8.0
-7.0
-6.0
-5.0
-4.0
-3.0
-2.0
-1.0
0.0
1.0
2.0
3.0
4.0
2015 2016 2017 2018 2019 2020
Headline Cyclically-adjusted
Chart 5.5GENERAL GOVERNMENT BALANCE(% of GDP)
Sources: NSO; Central Bank of Malta estimates.(1) Period ending September 2020.
(1)
Table 5.2YEAR-ON-YEAR CHANGES IN CYCLICALLY-ADJUSTED FISCAL COMPONENTSPercentage points of GDP
2015 2016 2017 2018 2019 2020(1)
Revenue -0.9 -0.8 1.3 0.2 -1.1 -2.7Taxes on production and imports -1.2 1.2 0.3 -0.1 0.4 0.5Current taxes on income and wealth -0.9 0.1 0.1 0.5 -0.6 -1.3Social contributions -0.4 -0.1 0.1 0.0 -0.2 -0.3Other (2) 1.6 -2.0 0.9 -0.3 -0.7 -1.7Expenditure -0.4 -3.9 -0.8 0.8 0.1 2.8Compensation of employees -0.5 -0.4 -0.2 -0.2 -0.1 -0.1Intermediate consumption 0.2 -0.1 0.3 0.1 0.6 0.8Social benefits -0.7 -0.6 -0.5 -0.6 -0.4 0.1Interest payments -0.3 -0.3 -0.3 -0.3 -0.2 -0.1GFCF 0.7 -1.7 0.0 0.8 0.6 0.0Other(3) 0.2 -0.7 0.0 0.9 -0.4 2.1Primary balance -0.7 2.8 1.8 -0.9 -1.5 -5.6General government balance -0.4 3.1 2.1 -0.6 -1.3 -5.5Sources: NSO; Central Bank of Malta estimates.(1) Four-quarter period up to September 2020.(2) Includes market output, income derived from property and investments and current and capital transfers received.(3) Mainly includes subsidies, current and capital transfers.
101
CENTRAL BANK OF MALTA Annual Report 2020
BOX 5: THE SUSTAINABILITY OF MALTESE GOVERNMENT DEBT1
This box assesses the sustainability of Maltese general government debt over different time horizons and evaluates risks stemming from macro-financial linkages. It updates previous debt sustainability analyses (DSA) published by the Bank.2,3 The term ‘sustainability’ as used throughout this analysis is in line with the International Monetary Fund’s (IMF’s) definition; sovereign debt is sustainable if the country is able to finance its policy objectives and service the resulting debt, without resorting to unduly large adjustments which could otherwise compromise its stability.
Main messagesThis exercise marks the first assessment of Maltese government debt sustainability since the onset of COVID-19. The pandemic led to a significant deterioration in public finances and brought about new forms of debt sustainability risks which were not considered likely in the previous Annual Report’s assessment. The likelihood of these risks materialising varies, depending on the duration and severity of the pandemic. This exercise is therefore subject to a high degree of uncertainty.
The main messages can be summed up as follows:
• A backward-looking analysis using information up to 2019 attributes low risks related to the structure and financing of debt, macro-financial linkages and competitiveness. Thus, the Maltese economy and government finances were in a favourable condition before the onset of the pan-demic. This provided fiscal space when COVID-related support measures were first introduced.
• In order to reflect the uncertainty surrounding the impact of the pandemic, this box presents forecasts of government debt on the basis of a baseline and severe scenario. For the period
1 Prepared by John Farrugia and Juergen Attard, respectively a principal economist and a senior economist within the Economic Analysis Department of the Central Bank of Malta. The views expressed are those of the authors and do not necessarily reflect the views of the Central Bank of Malta. Any errors are the authors’ own.2 For further details on government debt dynamics and fiscal sustainability, see Farrugia, J. and Grech, O., “The Sustainability of Maltese Government Debt Revisited”, in Grech, A.G., and Zerafa, S. (eds.), Challenges and Opportunities of Sustainable Eco-nomic Growth: the Case of Malta, Central Bank of Malta, 2017.3 This study uses the national accounts vintage up to the third quarter of 2020, published in November 2020 and the general government data vintage up to the third quarter of 2020, published in January 2020. The cut-off date for other information is 15 February 2021.
Favourable economic and fiscal conditions priorto the pandemic, enabling fiscal space for manoeuvre
Medium term debt-to-GDP ratio can be brought down once pandemic subsides, if Government pursues
fiscal consolidation
Debt sustainability in short-to-medium termsignificantly affected by non-quantifiable risks
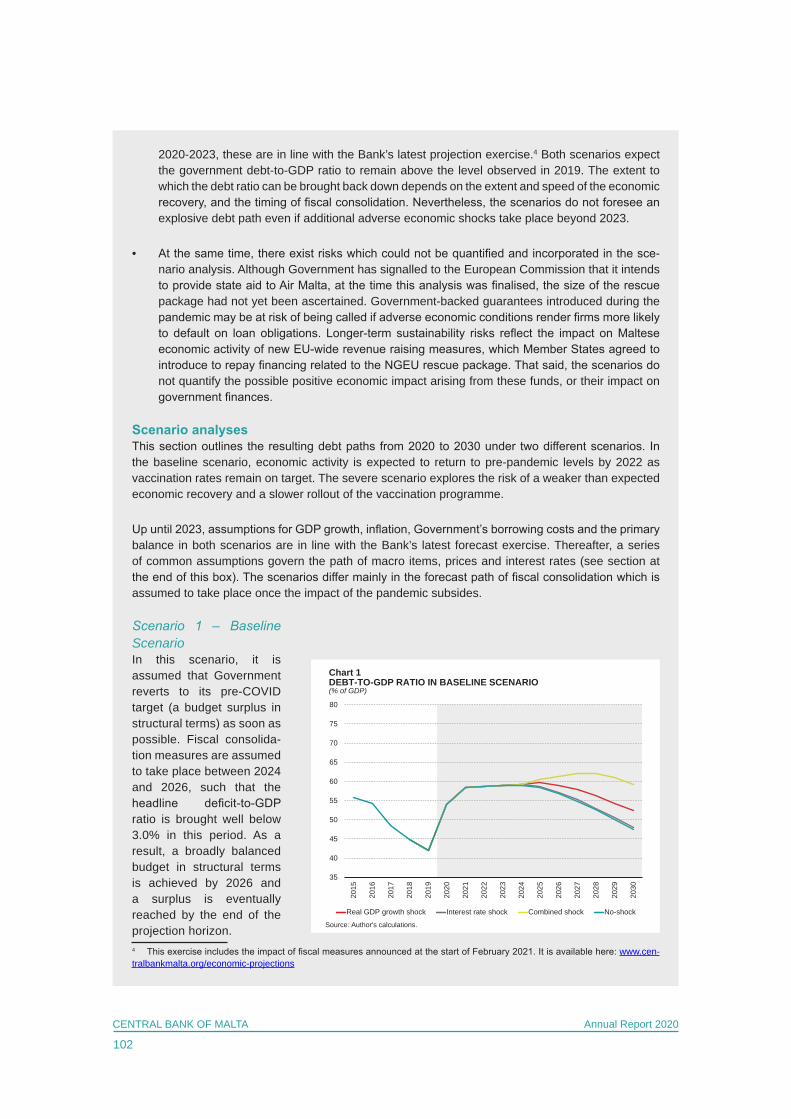
102
CENTRAL BANK OF MALTA Annual Report 2020
2020-2023, these are in line with the Bank’s latest projection exercise.4 Both scenarios expect the government debt-to-GDP ratio to remain above the level observed in 2019. The extent to which the debt ratio can be brought back down depends on the extent and speed of the economic recovery, and the timing of fiscal consolidation. Nevertheless, the scenarios do not foresee an explosive debt path even if additional adverse economic shocks take place beyond 2023.
• At the same time, there exist risks which could not be quantified and incorporated in the sce-nario analysis. Although Government has signalled to the European Commission that it intends to provide state aid to Air Malta, at the time this analysis was finalised, the size of the rescue package had not yet been ascertained. Government-backed guarantees introduced during the pandemic may be at risk of being called if adverse economic conditions render firms more likely to default on loan obligations. Longer-term sustainability risks reflect the impact on Maltese economic activity of new EU-wide revenue raising measures, which Member States agreed to introduce to repay financing related to the NGEU rescue package. That said, the scenarios do not quantify the possible positive economic impact arising from these funds, or their impact on government finances.
Scenario analysesThis section outlines the resulting debt paths from 2020 to 2030 under two different scenarios. In the baseline scenario, economic activity is expected to return to pre-pandemic levels by 2022 as vaccination rates remain on target. The severe scenario explores the risk of a weaker than expected economic recovery and a slower rollout of the vaccination programme.
Up until 2023, assumptions for GDP growth, inflation, Government’s borrowing costs and the primary balance in both scenarios are in line with the Bank’s latest forecast exercise. Thereafter, a series of common assumptions govern the path of macro items, prices and interest rates (see section at the end of this box). The scenarios differ mainly in the forecast path of fiscal consolidation which is assumed to take place once the impact of the pandemic subsides.
Scenario 1 – Baseline ScenarioIn this scenario, it is assumed that Government reverts to its pre-COVID target (a budget surplus in structural terms) as soon as possible. Fiscal consolida-tion measures are assumed to take place between 2024 and 2026, such that the headline deficit-to-GDP ratio is brought well below 3.0% in this period. As a result, a broadly balanced budget in structural terms is achieved by 2026 and a surplus is eventually reached by the end of the projection horizon. 4 This exercise includes the impact of fiscal measures announced at the start of February 2021. It is available here: www.cen-tralbankmalta.org/economic-projections
35
40
45
50
55
60
65
70
75
80
2015
2016
2017
2018
2019
2020
2021
2022
2023
2024
2025
2026
2027
2028
2029
2030
Real GDP growth shock Interest rate shock Combined shock No-shock
Source: Author's calculations.
Chart 1DEBT-TO-GDP RATIO IN BASELINE SCENARIO(% of GDP)
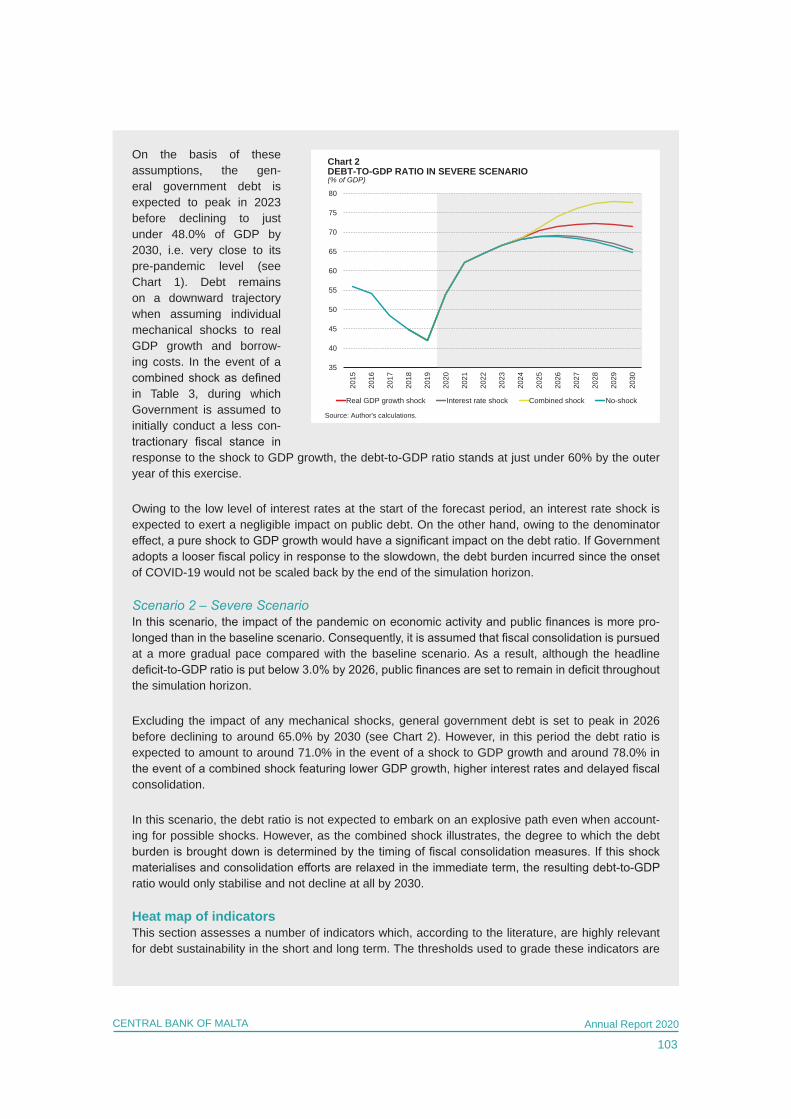
103
CENTRAL BANK OF MALTA Annual Report 2020
On the basis of these assumptions, the gen-eral government debt is expected to peak in 2023 before declining to just under 48.0% of GDP by 2030, i.e. very close to its pre-pandemic level (see Chart 1). Debt remains on a downward trajectory when assuming individual mechanical shocks to real GDP growth and borrow-ing costs. In the event of a combined shock as defined in Table 3, during which Government is assumed to initially conduct a less con-tractionary fiscal stance in response to the shock to GDP growth, the debt-to-GDP ratio stands at just under 60% by the outer year of this exercise.
Owing to the low level of interest rates at the start of the forecast period, an interest rate shock is expected to exert a negligible impact on public debt. On the other hand, owing to the denominator effect, a pure shock to GDP growth would have a significant impact on the debt ratio. If Government adopts a looser fiscal policy in response to the slowdown, the debt burden incurred since the onset of COVID-19 would not be scaled back by the end of the simulation horizon.
Scenario 2 – Severe ScenarioIn this scenario, the impact of the pandemic on economic activity and public finances is more pro-longed than in the baseline scenario. Consequently, it is assumed that fiscal consolidation is pursued at a more gradual pace compared with the baseline scenario. As a result, although the headline deficit-to-GDP ratio is put below 3.0% by 2026, public finances are set to remain in deficit throughout the simulation horizon.
Excluding the impact of any mechanical shocks, general government debt is set to peak in 2026 before declining to around 65.0% by 2030 (see Chart 2). However, in this period the debt ratio is expected to amount to around 71.0% in the event of a shock to GDP growth and around 78.0% in the event of a combined shock featuring lower GDP growth, higher interest rates and delayed fiscal consolidation.
In this scenario, the debt ratio is not expected to embark on an explosive path even when account-ing for possible shocks. However, as the combined shock illustrates, the degree to which the debt burden is brought down is determined by the timing of fiscal consolidation measures. If this shock materialises and consolidation efforts are relaxed in the immediate term, the resulting debt-to-GDP ratio would only stabilise and not decline at all by 2030.
Heat map of indicatorsThis section assesses a number of indicators which, according to the literature, are highly relevant for debt sustainability in the short and long term. The thresholds used to grade these indicators are
35
40
45
50
55
60
65
70
75
80
2015
2016
2017
2018
2019
2020
2021
2022
2023
2024
2025
2026
2027
2028
2029
2030
Real GDP growth shock Interest rate shock Combined shock No-shock
Source: Author's calculations.
Chart 2DEBT-TO-GDP RATIO IN SEVERE SCENARIO(% of GDP)
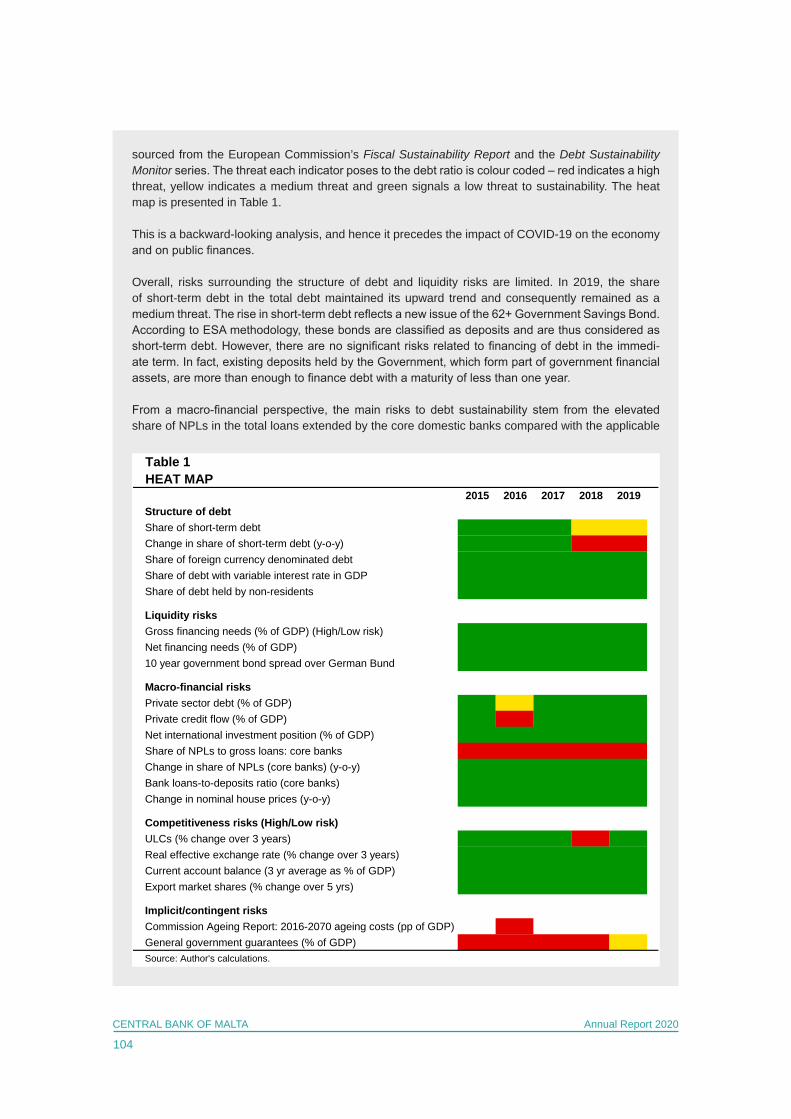
104
CENTRAL BANK OF MALTA Annual Report 2020
sourced from the European Commission’s Fiscal Sustainability Report and the Debt Sustainability Monitor series. The threat each indicator poses to the debt ratio is colour coded – red indicates a high threat, yellow indicates a medium threat and green signals a low threat to sustainability. The heat map is presented in Table 1.
This is a backward-looking analysis, and hence it precedes the impact of COVID-19 on the economy and on public finances.
Overall, risks surrounding the structure of debt and liquidity risks are limited. In 2019, the share of short-term debt in the total debt maintained its upward trend and consequently remained as a medium threat. The rise in short-term debt reflects a new issue of the 62+ Government Savings Bond. According to ESA methodology, these bonds are classified as deposits and are thus considered as short-term debt. However, there are no significant risks related to financing of debt in the immedi-ate term. In fact, existing deposits held by the Government, which form part of government financial assets, are more than enough to finance debt with a maturity of less than one year.
From a macro-financial perspective, the main risks to debt sustainability stem from the elevated share of NPLs in the total loans extended by the core domestic banks compared with the applicable
Table 1HEAT MAP
2015 2016 2017 2018 2019Structure of debtShare of short-term debtChange in share of short-term debt (y-o-y)Share of foreign currency denominated debtShare of debt with variable interest rate in GDPShare of debt held by non-residents
Liquidity risksGross financing needs (% of GDP) (High/Low risk)Net financing needs (% of GDP)10 year government bond spread over German Bund
Macro-financial risksPrivate sector debt (% of GDP)Private credit flow (% of GDP)Net international investment position (% of GDP)Share of NPLs to gross loans: core banksChange in share of NPLs (core banks) (y-o-y)Bank loans-to-deposits ratio (core banks)Change in nominal house prices (y-o-y)
Competitiveness risks (High/Low risk)ULCs (% change over 3 years)Real effective exchange rate (% change over 3 years)Current account balance (3 yr average as % of GDP)Export market shares (% change over 5 yrs)
Implicit/contingent risksCommission Ageing Report: 2016-2070 ageing costs (pp of GDP)General government guarantees (% of GDP)Source: Author's calculations.
105
CENTRAL BANK OF MALTA Annual Report 2020
threshold. Nevertheless, this share remained on a declining path, and continued to decline further in 2019 to a historical low. This partly reflects cyclical factors, but also de-risking measures by Maltese banks. However, following the outbreak of COVID-19, this metric may deteriorate as firms suffering from lack of liquidity may eventually not be able to honour loan obligations (see section on non-quantifiable risks).
Implicit liabilities, in the form of ageing costs (pensions, healthcare and long-term care), form another significant risk to sustainability. According to the Commission’s 2018 Ageing Report projections, at 6.8 points, Malta is set to have the second highest increase in age-related spending in the European Union between 2016 and 2070. However, this metric is set to improve, due to more favourable labour market developments observed in recent years. In the December 2020 strategic review of the pension system, the Pensions Strategy Group offer a more optimistic assessment compared with the previous update. While the pension system is still expected to revert to a deficit in the absence of additional reforms, the shortfall has been revised down from 4.8% of GDP by 2060 to 3.0% of GDP by 2070.5
Government-guaranteed debt in Malta has declined over the last couple of years. In 2019, it stood at 7.4% of GDP with half of this debt mainly concentrated in the energy sector.6 This ratio is the lowest value in more than a decade and is also in line with the euro area average. As a result, risks emanating from general government guarantees have now shifted from high to medium risk. However, government guarantees may increase in the near future due to the challenges posed by the pandemic (see below).
Non-quantifiable risksThis section outlines other debt sustainability risks which, owing to the outbreak of COVID-19, are likely to materialise. However, since it is not clear when these risks could materialise, their impact on government debt cannot be quantified at present.
In the immediate term, the largest risk to debt sustainability concerns the likelihood of state support to Air Malta. The company was reported to have been incurring losses of more than €170,000 daily fol-lowing the pandemic.7 At the time this analysis was finalised, Government had signalled to the Euro-pean Commission its intention to provide state aid, which requires approval before any assistance is granted. While the impact of this measure on government finances is likely to be significant, the size and nature of the support package have not yet been ascertained.
In the short-to-medium term, sustainability risks are likely to be affected by the inability of some firms to repay loan obligations. According to the latest available data published on the Bank’s web-site, by September 2020, the share of NPLs to total gross loans of core banks crept up to 3.5% from 3.2% at end-2019.8 However, according to the Bank’s 2020 Interim Financial Stability Report, there is a risk of an increase in NPLs once the loan moratoria period ends. Government finances stand to be affected through its exposure to the MDB CGS, if a portion of the guarantees are called. The extent to which this measure affects debt sustainability depends on the duration of the pandemic and its impact on bankruptcies.
In the medium-to-long term, sustainability risks reflect the likelihood of new EU-wide revenue rais-ing measures, which Member States in principle agreed to introduce in order to repay financing of the NGEU rescue package. If implemented, such measures have the potential to significantly affect the Maltese economy and public debt sustainability. Conversely, this analysis does not quantify the positive impact on economic growth and on government finances of EU funds. Given that the latter
5 See www.socialsecurity.gov.mt/wp-content/uploads/2021/02/Pensions-Strategic-Review-Report-2020.pdf 6 See National Audit Office Malta (2020). “Annual Audit Report: Public Accounts 2019” for further details.7 See www.timesofmalta.com/articles/view/honest-and-credible-plan-for-state-aid-as-air-malta-loses-170000-daily.851468 8 See www.centralbankmalta.org/financial-soundness-indicators
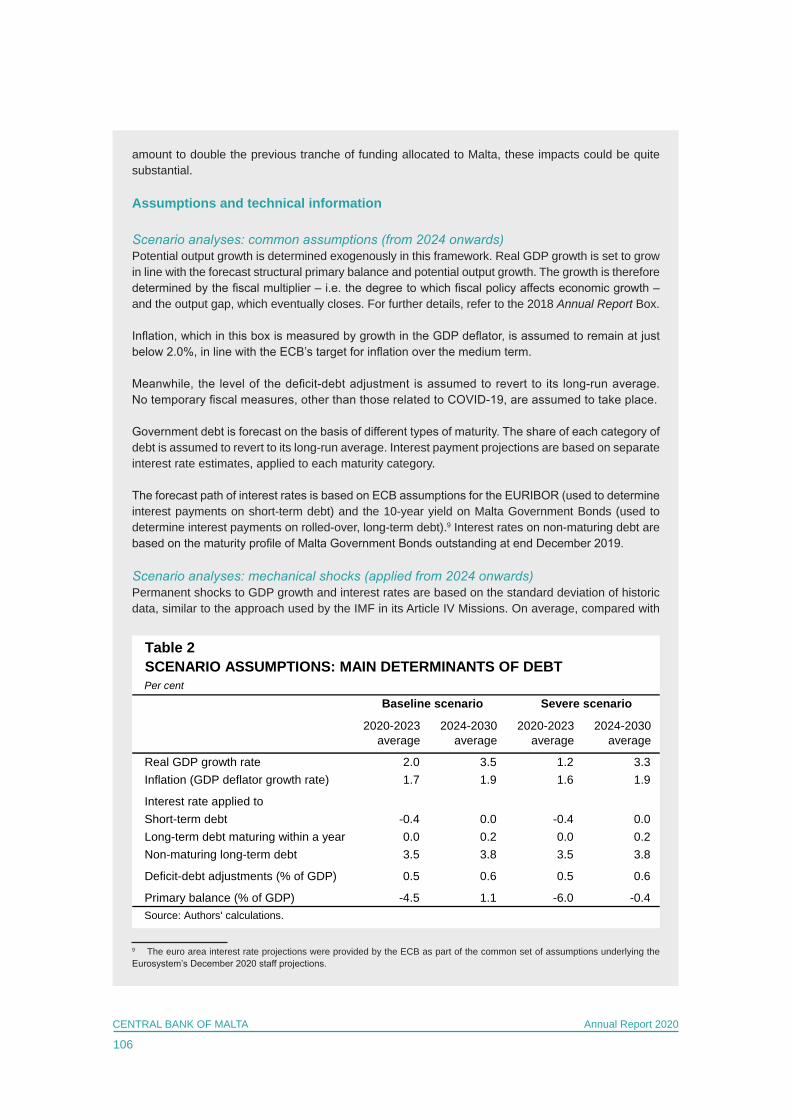
106
CENTRAL BANK OF MALTA Annual Report 2020
amount to double the previous tranche of funding allocated to Malta, these impacts could be quite substantial.
Assumptions and technical information
Scenario analyses: common assumptions (from 2024 onwards)Potential output growth is determined exogenously in this framework. Real GDP growth is set to grow in line with the forecast structural primary balance and potential output growth. The growth is therefore determined by the fiscal multiplier – i.e. the degree to which fiscal policy affects economic growth – and the output gap, which eventually closes. For further details, refer to the 2018 Annual Report Box.
Inflation, which in this box is measured by growth in the GDP deflator, is assumed to remain at just below 2.0%, in line with the ECB’s target for inflation over the medium term.
Meanwhile, the level of the deficit-debt adjustment is assumed to revert to its long-run average. No temporary fiscal measures, other than those related to COVID-19, are assumed to take place.
Government debt is forecast on the basis of different types of maturity. The share of each category of debt is assumed to revert to its long-run average. Interest payment projections are based on separate interest rate estimates, applied to each maturity category.
The forecast path of interest rates is based on ECB assumptions for the EURIBOR (used to determine interest payments on short-term debt) and the 10-year yield on Malta Government Bonds (used to determine interest payments on rolled-over, long-term debt).9 Interest rates on non-maturing debt are based on the maturity profile of Malta Government Bonds outstanding at end December 2019.
Scenario analyses: mechanical shocks (applied from 2024 onwards)Permanent shocks to GDP growth and interest rates are based on the standard deviation of historic data, similar to the approach used by the IMF in its Article IV Missions. On average, compared with
9 The euro area interest rate projections were provided by the ECB as part of the common set of assumptions underlying the Eurosystem’s December 2020 staff projections.
Table 2SCENARIO ASSUMPTIONS: MAIN DETERMINANTS OF DEBTPer cent
2020-2023 average
2024-2030 average
2020-2023 average
2024-2030 average
Real GDP growth rate 2.0 3.5 1.2 3.3Inflation (GDP deflator growth rate) 1.7 1.9 1.6 1.9
Interest rate applied toShort-term debt -0.4 0.0 -0.4 0.0Long-term debt maturing within a year 0.0 0.2 0.0 0.2Non-maturing long-term debt 3.5 3.8 3.5 3.8
Deficit-debt adjustments (% of GDP) 0.5 0.6 0.5 0.6
Primary balance (% of GDP) -4.5 1.1 -6.0 -0.4Source: Authors' calculations.
Baseline scenario Severe scenario
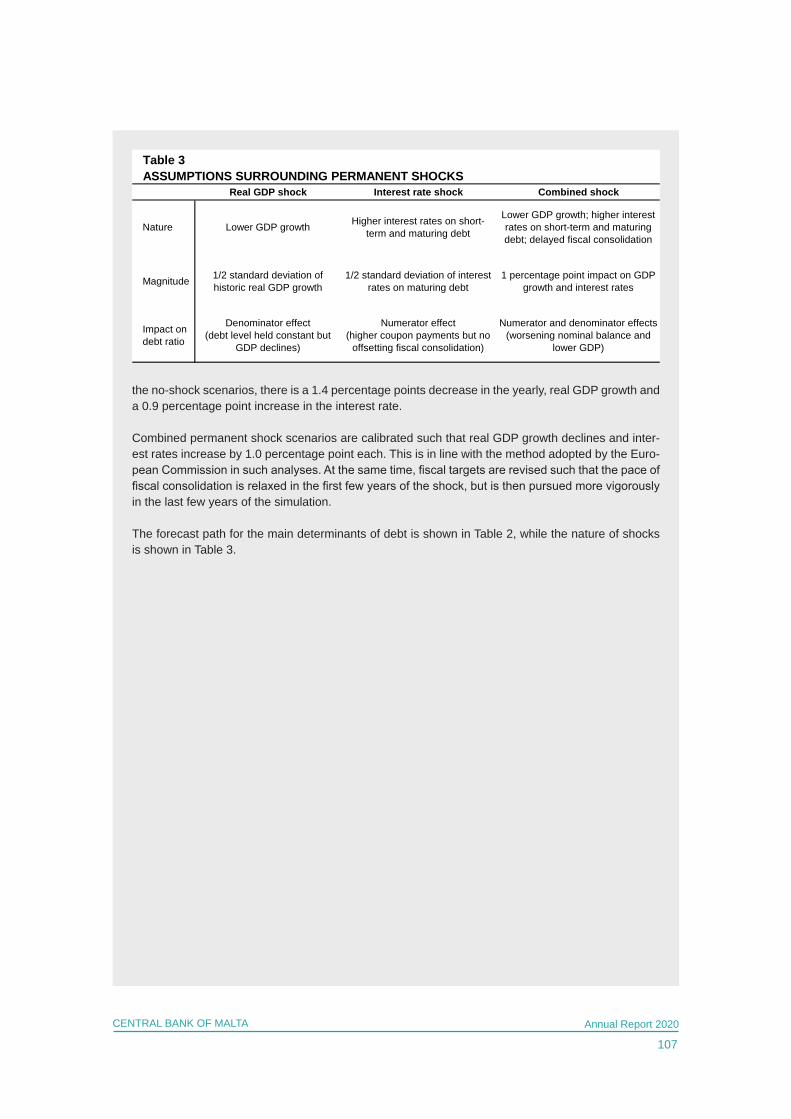
107
CENTRAL BANK OF MALTA Annual Report 2020
the no-shock scenarios, there is a 1.4 percentage points decrease in the yearly, real GDP growth and a 0.9 percentage point increase in the interest rate.
Combined permanent shock scenarios are calibrated such that real GDP growth declines and inter-est rates increase by 1.0 percentage point each. This is in line with the method adopted by the Euro-pean Commission in such analyses. At the same time, fiscal targets are revised such that the pace of fiscal consolidation is relaxed in the first few years of the shock, but is then pursued more vigorously in the last few years of the simulation.
The forecast path for the main determinants of debt is shown in Table 2, while the nature of shocks is shown in Table 3.
Table 3ASSUMPTIONS SURROUNDING PERMANENT SHOCKS
Real GDP shock Interest rate shock Combined shock
Nature Lower GDP growth Higher interest rates on short-term and maturing debt
Lower GDP growth; higher interest rates on short-term and maturing debt; delayed fiscal consolidation
Magnitude 1/2 standard deviation of historic real GDP growth
1/2 standard deviation of interest rates on maturing debt
1 percentage point impact on GDP growth and interest rates
Impact on debt ratio
Denominator effect(debt level held constant but
GDP declines)
Numerator effect(higher coupon payments but no
offsetting fiscal consolidation)
Numerator and denominator effects(worsening nominal balance and
lower GDP)

II. Bank Policies, Operations and Activities
110
CENTRAL BANK OF MALTA Annual Report 2020
1. THE CONDUCT OF MONETARY POLICY AND FINANCIAL MARKET OPERATIONS
Monetary policy operationsAs part of the Eurosystem, the Central Bank of Malta implements the monetary policy decisions of the ECB in Malta.1 Thus, the Central Bank of Malta regularly conducts open market operations with credit institutions licensed in Malta. It also offers standing facilities, administers the minimum reserve system and participates in the APP and in the PEPP.
Open market operations Standard monetary policy measures include open market operations, aimed at managing the level of liquid-ity in the money market and at steering short-term market interest rates close to the official rates of the ECB. The Eurosystem has various types of open market operations at its disposal.
MROs are short-term, liquidity-providing reverse transactions, which are executed according to a pre-speci-fied calendar. They take place on a weekly basis with a maturity of one week. The Eurosystem also conducts long-term refinancing operations, which consist of reverse transactions at a monthly frequency and with a normal maturity of three months.
During 2020, the Eurosystem continued to offer liquidity to eligible credit institutions via fixed-rate tender procedures with full allotment, through both MROs and long-term refinancing operations.
More specifically, during 2020, the ECB conducted 53 MROs. In the context of ample excess liquidity, credit institutions established in Malta participated only once in the MROs with an amount of €1.0 million, similar to 2019 (see Table 1.1).
1 For a description of the monetary policy decisions taken by the Governing Council, please refer to the Chapter titled “The euro area and the external environment”, which can be found in Part 1 of this Report.
Table 1.1
EUR millions
Type of operation(1) 2019 2020MROs 1.0 1.0LTROs
- Three-month - 10.0- Additional (bridge) N/A 50.0- PELTROs N/A 45.0- TLTROs 40.0 63.5
US dollar collateralised operations (USD millions)- Seven-day 1,359.3 1,840.2- 84-day N/A 35.1
PARTICIPATION OF ELIGIBLE MALTESE CREDIT INSTITUTIONS IN EUROSYSTEM OPEN MARKET OPERATIONS
(1) In these Eurosystem operations, the amounts shown are the amounts allotted. These are equivalent to the amounts bid, owing to the full allotment policy.
111
CENTRAL BANK OF MALTA Annual Report 2020
The ECB also conducted 12 regular 3-month long-term refinancing operations with full allotment and at a fixed rate equal to the average of the MROs rate during the lifetime of the operations. Credit institutions established in Malta participated with an aggregate amount of €10.0 million in such operations, whereas there was no participation in 2019 (see Table 1.1).
On 12 March 2020, the Governing Council of the ECB announced additional (bridge) long-term refinancing operations to provide immediate liquidity support to banks and to safeguard money market conditions cre-ated in view of the COVID-19 pandemic. These operations were conducted as fixed-rate tender procedures with full allotment, with the interest rate at the average overnight deposit facility rate over the life of the respective operation. 13 operations were conducted between March and June with all operations maturing on 24 June 2020. Credit institutions established in Malta participated with an amount of €50.0 million in such operations (see Table 1.1).
Furthermore, on 30 April 2020, the Governing Council announced a new series of seven additional long-term refinancing operations, called PELTROs.2 These operations were aimed at providing liquidity support to the euro area financial system and preserving the smooth functioning of money markets by providing an effective backstop after the expiry of the bridge LTROs. The PELTROs were conducted as fixed-rate tender procedures with full allotment with the interest rate set at 25 basis points below the average rate applied in the Eurosystem MROs over the life of the respective PELTRO. Credit institutions established in Malta par-ticipated with an amount of €45.0 million in such operations (see Table 1.1).
During 2020, the ECB conducted four quarterly operations from the third series of the TLTROs that started in September 2019. On 12 March and 30 April, the Governing Council decided to modify some of the key parameters of these operations to support the continued access of firms and households to bank credit in the face of disruptions and temporary funding shortages associated with the coronavirus outbreak.3 The modifications included an increase in the borrowing allowance, the removal of the bid limit per operation, the reduction of the lending performance threshold to 0%, the early repayment option after one year from settlement of the operation and the recalibration of the interest rate on such operations. As illustrated in Table 1.1, credit institutions established in Malta borrowed a total of €63.5 million in the TLTROs held in 2020.
During 2020, the ECB continued the weekly provision of US dollars through liquidity-providing opera-tions with a 1-week tenor by means of collateralised lending in conjunction with the US Federal Reserve. Between 23 March and 30 June, the 7-day USD operation was conducted on a daily basis, thereafter, reduced to three times a week until the end of August and further reduced to a weekly frequency as from 1 September. During the year under review, credit institutions established in Malta participated regularly, for a total cumulative amount of USD 1,840.2 million, which is higher than the USD 1,359.3 million taken up in the previous year.
Additionally, on 15 March 2020, the ECB announced the conduct of an 84-day USD operation on a weekly basis in conjunction with the 7-day operation. Furthermore, the pricing of all USD operations was lowered from USD OIS rate plus 50 basis points to USD OIS rate plus 25 basis points. Credit institutions established in Malta participated for a cumulative amount of USD 35.1 million in the 84-day USD operations.
Standing facilities Eligible counterparties may utilise two standing facilities on their own initiative, either to obtain overnight liquidity against eligible collateral or to place overnight deposits with the Eurosystem.
2 On 10 December 2020, the Governing Council of the ECB decided to offer four additional PELTROs in 2021, which will continue to provide an effective liquidity backstop. 3 On 10 December 2020, the Governing Council of the ECB decided to further recalibrate the conditions of the TLTROs and announced three additional operations that will be conducted between June and December 2021.
112
CENTRAL BANK OF MALTA Annual Report 2020
Following the introduction of the two-tier system for the remuneration of excess reserves in October 2019, credit institutions established in Malta shifted their excess funds held with the Eurosystem through the overnight deposit facility to their current accounts held with the Central Bank of Malta. The two-tier system applies to excess liquidity held in current accounts with the Eurosystem but does not apply to deposit facility holdings. It allows counterparties to avoid negative interest rates on part of their excess reserves. Since the introduction of the two-tier system until the maintenance period ending on 15 December 2020, credit insti-tutions in Malta saved an estimated €7.2 million compared to a situation where the negative interest rates would apply to all their excess reserves.
In fact, recourse to the deposit facility by Maltese credit institutions amounted to a daily average of €33.8 million, a decrease of €981.9 million compared to the 2019 average.
Similar to 2019, Maltese credit institutions did not use the marginal lending facility in 2020.
The interest rates on the MROs, the marginal lending facility and the overnight deposit facility remained unchanged throughout the year at 0.00%, 0.25% and -0.50% respectively.
Reserve requirements The ECB requires credit institutions established in the euro area to hold reserve deposits with their respec-tive NCB. The objective of the Eurosystem’s minimum reserve system is to contribute to the stability of money market interest rates and to help ensure the efficient operation of the Eurosystem as a liquidity sup-plier. Each credit institution established in Malta is accordingly obliged to hold minimum reserve deposits, equivalent to a fraction of certain liabilities – mainly deposits – with the Central Bank of Malta. During 2020, this reserve requirement ratio remained unchanged at 1.0%. The average balance required as minimum reserve deposits by credit institutions established in Malta amounted to €289.8 million in 2020 compared to €306.5 million in 2019. The average daily balances held in the current account with the Central Bank of Malta amounted to €5,066.2 million in 2020, compared to €3,408.0 million in 2019. This increase was mainly the result of a shift from the overnight deposit facility to the current account following the introduction of the two-tier system.
Asset purchase programmeThroughout the year, the Central Bank of Malta participated in the PSPP, which is part of the APP. During 2020, the Central Bank of Malta purchased €85.0 million worth of Maltese sovereign bonds under the Pro-gramme. This was a higher amount than the one bought during 2019, mainly owing to the increased rate of purchase arising from the additional PSPP envelope worth €120.0 billion also introduced as part of the ECB’s package of responses to the COVID-19 pandemic.
Since inception, the total securities purchased by the Central Bank of Malta for its PSPP portfolio amounted to €1,190.5 million at the end of 2020.4 The Bank’s PSPP holdings had a weighted average remaining matu-rity of 8.93 years as at the last trading day for December 2020. During the year, the Central Bank of Malta also purchased €31.9 million worth of Maltese sovereign bonds that were transferred to the ECB’s own PSPP portfolio, with total securities bought since inception in this portfolio amounting to €235.2 million.5
The Central Bank of Malta did not participate in the private-sector programmes, which also form part of the APP, owing to the lack of eligible securities in the domestic markets.
4 This figure does not reflect the amortisation of securities held under the PSPP portfolio. Purchases of securities which matured between 2017 and 2020 are also included in this figure.5 See footnote 4.
113
CENTRAL BANK OF MALTA Annual Report 2020
Pandemic emergency purchase programmeThe Central Bank of Malta also participated in the PEPP, announced on 18 March 2020 by the Governing Council as one of the ECB’s responses to the economic and financial market fallout from the COVID-19 pandemic. The initial size of the PEPP was €750.0 billion with the horizon of the net purchases lasting until the end of 2020. On 4 June, the Governing Council increased the size of the Programme to €1,350.0 billion with the net purchases’ horizon extended to at least June 2021.6
Since the inception of this programme, the Central Bank of Malta bought €235.9 million worth of Maltese sovereign bonds.7 The Central Bank of Malta’s PEPP holdings had a weighted average remaining maturity of 7.23 years as at the last trading day for December 2020.
During the same period, the Central Bank of Malta also purchased €26.4 million worth of Maltese sovereign bonds that were transferred to the ECB’s own PEPP portfolio.8
Similar to the APP, the Central Bank of Malta participated only in the public sector purchases under the PEPP.
Collateral management All Eurosystem credit operations take place against collateral. The Central Bank of Malta is responsible for assessing the eligibility of domestic marketable securities which can be used as collateral in Eurosystem monetary operations and for reporting them to the ECB. As at end-December 2020, the nominal outstanding value of eligible domestic marketable assets amounted to €6,286.9 million, compared with €5,069.4 million a year earlier.
At the end of the year, the market value – after haircuts – of securities pledged by eligible Maltese counter-parties with the Central Bank of Malta stood at €697.9 million. This consisted of both domestic and foreign securities, with the share of debt instruments issued by the Maltese government accounting for around 62.5% of the securities pledged.
On 7 April 2020, the Governing Council of the ECB adopted a package of temporary collateral easing measures to facilitate the availability of eligible collateral for Eurosystem counterparties to participate in liquidity-providing operations announced as a response to the coronavirus emergency. The package of collateral measures included a temporary increase in the Eurosystem’s risk tolerance in order to support credit to the economy, easing of the conditions for the use of credit claims as collateral, a general reduction of the collateral valuation haircuts and a waiver to accept Greek sovereign debt instruments as collateral in Eurosystem credit operations. Furthermore, on 22 April 2020, the ECB adopted temporary measures to mitigate the effect on collateral availability of possible rating downgrades resulting from the economic fallout from the pandemic.
On 22 September, in an initiative aimed at supporting green finance, the ECB decided that as from 1 January 2021, bonds with coupon structures linked to certain sustainability performance targets will become eligible as collateral for Eurosystem credit operations and for Eurosystem outright purchases for monetary policy purposes provided they comply with all other eligibility criteria. Furthermore, on 28 September 2020, among other decisions related to the implementation of monetary policy, the ECB announced the phasing out of secured marketable assets other than asset-backed securities, legislative covered bonds and multi-cédulas as collateral as from 1 January 2021.
6 On 10 December 2020, the Governing Council decided to increase the PEPP envelope by a further €500.0 billion to €1,850.0 billion and extended the horizon for net purchases to at least the end of March 2022.7 This figure does not reflect the amortisation of securities held under the PEPP portfolio. During 2020, there were no maturities for the PEPP portfolio.8 See footnote 7.
114
CENTRAL BANK OF MALTA Annual Report 2020
In November 2020, the Governing Council approved the Additional Credit Claims (ACC) framework pro-posed by the Central Bank of Malta. Under this framework, the Bank will accept credit claims that fall under the MDB CGS. The Scheme is part of a wider Government COVID-19 Response Support Programme. The ACCs framework became effective as from 1 January 2021.
During 2020, the Governing Council also approved the inclusion of the MDB in the harmonised list of rec-ognised agencies. Accordingly, any securities issued by the MDB could potentially be eligible for collateral management purposes and hence, eligible for purchases under the APP and the PEPP.
Liquidity management The Central Bank of Malta continued to provide the ECB with daily forecasts of items on its balance sheet that are unrelated to monetary policy instruments, such as banknotes in circulation, government deposits, net foreign assets and net assets denominated in euro. This information enables the Eurosystem to deter-mine liquidity needs even if the current full allotment policy ensures ample liquidity.
Eurosystem repo facility for Central Banks On 25 June 2020, in response to the coronavirus crisis, the Governing Council of the ECB decided to set up a new backstop facility – the Eurosystem repo facility for central banks – to provide precautionary euro repo lines to central banks outside the euro area. The Eurosystem repo facility for central banks addresses possible euro liquidity needs in case of market dysfunction resulting from the COVID-19 shock that might adversely impact the smooth transmission of ECB monetary policy. Under this facility, the Eurosystem will provide euro liquidity to a broad set of central banks outside the euro area against adequate collateral, con-sisting of euro-denominated marketable securities issued by euro area central governments and suprana-tional institutions. The Eurosystem repo facility for central banks complements the ECB’s bilateral swap and repo lines and reflects the importance of the euro in global financial markets. The Eurosystem repo facility for central banks will be available until March 2022.
Non-monetary policy operationsThe Central Bank of Malta manages an investment portfolio of around €2,000 million, comprising both euro and foreign currency denominated assets. The EUR portfolio represents approximately 65% of assets under management, while the remaining 35% are predominantly invested in USD denominated securities, with smaller exposures to other currencies including the Australian dollar, Canadian dollar, Pound sterling, Swedish krone, Norwegian krone and Swiss franc. The investment portfolio comprises money market instru-ments, fixed income securities, derivatives and gold. The fixed income asset classes include sovereign bonds, securities issued by supranational and national government agencies, bank-covered bonds and senior debt. The Bank holds both held-to-maturity as well as actively-managed, fixed income portfolios. A relatively smaller part of the Bank’s financial assets is managed through three external mandates.
The scope of the Investment Policy Committee (IPC) is to set the investments policy upon which the man-agement of the Bank’s financial assets will be based with a view to optimising returns, subject to prudent risk management practices, as specified in the mission statement. The IPC monitors the performance of the Bank’s financial assets, evaluates the implementation of investment strategies, reviews reserve manage-ment practices and assesses the overall investment policy. The Committee, which is chaired by the Gov-ernor and includes the Deputy Governors and senior officials of the Bank, met monthly during 2020, with additional meetings held to address specific issues.
Proposals relating to parameters or investment universe and the respective impact on the Bank’s profitability were discussed with a view to setting the Strategic Asset Allocation in the beginning of the year. The Commit-tee is also responsible to set the Tactical Benchmark for the internally, actively-managed funds on a monthly basis. Moreover, the IPC decides on the proposals put forward by the Investments Department for the active management of the externally-managed funds and gold holdings.
115
CENTRAL BANK OF MALTA Annual Report 2020
During 2020, the Bank continued to experience a reduction in the size of the held-to-maturity portfolios as it was not feasible to reinvest all maturities due to the low to negative yielding environment in the fixed income universe. The actively-managed foreign currency fixed income portfolio was also reduced due to elevated currency hedge costs earlier in the year. The Bank liquidated its holdings in a Sovereign China Fund in the first quarter of 2020, while it increased its holdings in a Fixed Income Global Unconstrained Fund. As part of its efforts to support transition towards a sustainable global economy, the Bank has increasingly been exploring ways to incorporate sustainable and responsible investment principles in the management of its portfolios. The Bank has invested in an Environmental, Social and Governance Fund in the second quarter of 2020 and increased exposure to green and social bonds in its internally-managed portfolios. Moreover, the Bank has also requested the provision of Environmental, Social and Governance metrics for each exter-nally-managed portfolio.
The Bank continued to co-manage its portion of US dollar reserves on behalf of the ECB by way of a pool-ing mechanism jointly with the Central Bank of Ireland. During the year, International Asset Management Office worked closely with the Central Bank of Ireland to review the investment strategy, discuss trades and analyse the portfolio’s performance.
The Central Bank of Malta remains a participant in the Exchange Rate Mechanism, a mechanism set up with the intention to ensure that exchange rate fluctuations between the euro and other EU currencies do not disrupt economic stability within the single market, while simultaneously helping non-euro area countries to prepare themselves for participation in the euro area. During 2020, the Croatian kuna and Bulgarian lev were included in the mechanism. During the year, the Bank duly participated in the Exchange Rate Mechanism test interventions as directed by the ECB. The Bank continues to report to the ECB information on its foreign-exchange transactions and holdings as well as on the EUR denominated portion of the investment portfolio.
The Bank continued to enter into spot/outright foreign currency purchases and foreign exchange (FX) swap purchases and sales. When compared to the previous year, both the spot and outright foreign currency pur-chases and sales increased. FX swap purchases continued to increase while FX swap sales decreased. The Central Bank of Malta continued to repo out fixed income holdings in the general collateral pooling market and the special repo market.
The Bank will continue to explore various options which are aimed at making gradual progress in incorporat-ing Environmental, Social and Governance and climate change-related considerations in both its internally- and externally-managed portfolios. In the coming year, as part of its diversification strategy, the Bank intends to increase exposure to other asset classes which are Sustainable and Responsible Investment compliant. The Bank is also actively exploring the adoption of a negative screening strategy to be implemented to its corporate bond portfolio managed through an external mandate. In addition, it is expected that thematic bond investing will grow in the future as this market develops further. As part of the Eurosystem, the Bank will continue to be guided by the ECB in this regard.
During 2020, the Bank continued to participate in the NGFS. The NGFS is a group of central banks and supervisors from around the world that aims to strengthen the role of the financial system to manage risks and to shift capital for green and low carbon investments.
The Bank continued to manage the Investor Compensation Scheme and Depositor Compensation Scheme on behalf of the MFSA. In 2020, the Bank also pursued the fulfilment of its obligations in terms of its agree-ment with the National Development and Social Fund to administer part of the Fund’s portfolio. During the year, the Fund navigated the sharp deterioration in the performance of equity markets. Overall, the value reported at the end of the year was close to that of last year, thus largely protecting the appreciation of circa €2.6 million gained since inception when €100 million were invested.
116
CENTRAL BANK OF MALTA Annual Report 2020
Government securities market-making operations The year 2020 has been challenging for many market players. The COVID-19 pandemic left a marked and lasting impact on world economies and disrupted businesses and households. The Central Bank of Malta, through the Government Securities Office, continued to provide market-making facilities by quoting daily bid and offer prices for the listed MGS on the MSE.
Turnover activity in the secondary market for MGS fell drastically in 2020 when compared to the previous year. In nominal terms, the total amount of traded MGS fell from €241.7 million in 2019 to €126.9 million in 2020. Although the Government of Malta issued a record amount of MGS during 2020, all auctions were targeted to the wholesale investor whereby banks tend to hold such bonds till maturity. This could, therefore, be considered as one of the main factors behind the drop in liquidity in the local MGS secondary market.
When compared with other private stockbrokers, the Bank’s market-making function effected a significant amount of Maltese sovereign bond market trading. The Bank transacted a total of 33.0% of total on-exchange deals while inter-brokers effected the remaining 67.0% among 16 brokers.
The Bank’s market-making function effected a total of €42.2 million (€24.2 million purchases and €18.0 mil-lion sales) of trading in MGS. These figures are significantly lower relative to the €132.9 million registered in 2019. A similar pattern can be noticed with respect to inter-broker trading which decreased notably from €108.8 million in 2019 to €84.7 million in 2020.
There was no secondary market activity in the Treasury bill market.
The Central Bank of Malta has been acting as a market-maker for MGS since its inception in 1968. The Bank fulfils this role by providing two-way trading: purchasing MGS on offer, at the prevailing indicative Bank price or lower; and placing MGS on offer. Furthermore, the Bank also acted as an agent on behalf of public institutional clients.
To sustain businesses and individuals who were negatively affected by the COVID-19 pandemic, the Gov-ernment of Malta increased Malta Government Stocks MGS issues significantly in 2020. The Bank assisted the Treasury in such auctions. More specifically, the Bank aided the Treasury by advising in the choice of maturities and coupons to offer in the primary market. This was aimed at attracting sufficient demand while limiting refinancing risk. Furthermore, the Bank was involved in analysing and presenting the technical aspects of potential additional avenues for financing other than through MGS.
117
CENTRAL BANK OF MALTA Annual Report 2020
2. FINANCIAL STABILITY
The Financial Stability Surveillance & Research Department and the Policy, Crisis Management & Stress Testing Department fulfil the Central Bank of Malta’s statutory mandate of ensuring financial stability. This is achieved through the regular monitoring of risks and vulnerabilities in the financial sector together with the implementation and maintenance of the macroprudential framework in Malta. The surveillance and assess-ment of the Maltese financial sector is also enhanced by stress tests and sensitivity analyses to gauge the level of resilience of the system to potential shocks.
The Bank publishes these risk assessments, including work related to macroprudential policies, in its Financial Stability Report and Interim Report. Such publications serve to inform the public and stakeholders of potential key systemic risks that could adversely hit the stability of the Maltese financial system and the macroprudential policies in place to stem the development of such risks. The Financial Stability Report 2019 published in 2020 also carried a special feature on aspects of financial sector resilience owing to COVID-19 developments.
Main developments The Bank has been very active, through its macroprudential policy mandate, to ensure that the local financial system supports the economy during the pandemic. Maltese households and businesses required support from the financial sector to withstand the economic disruption brought about by COVID-19. To this effect, the financial system responded positively and was also backed by the extraordinary policy measures under-taken by the authorities. In response to the unprecedented impact on the liquidity of businesses and households, the authorities issued the Moratorium on Credit Facilities Regulations in Exceptional Circumstances through Legal Notice 142 of 2020. This Legal Notice directed credit and financial institutions licensed by the MFSA to offer a mora-torium on repayments on capital and interest for borrowers who have been negatively affected by COVID-19. Upon publication of L.N. 142 of 2020, the moratorium was originally set for six months. L.N. 248 of 2020, however, allowed borrowers to extend their original moratorium by an additional six months, and provided the possibility for new moratoria until 30 September 2020. Due to the protracted impact of COVID-19, L.N. 15 of 2021 reopened the application period until 31 March 2021.
Pursuant to these regulations the Bank issued Directive No. 18 – On Moratoria on Credit Facilities in Excep-tional Circumstances – to define the eligibility for the moratorium and the prudential treatment of loans sub-ject to moratoria. The moratoria apply to individuals, households or businesses, who could demonstrate that they have been negatively affected by the pandemic. Furthermore, the Directive specifies that loans subject to a moratorium will not be treated as forborne or non-performing. The Bank also prepared a guide to explain the terms and conditions.
In the latest extension, borrowers could apply for a moratorium of up to nine months subject to conditions. In the case of a pre-existing moratorium, borrowers could apply for an extension, provided that the overall duration of the said moratorium would not exceed nine months.
Considering the disruptions to economic activity caused by the COVID-19 pandemic, the Bank also deemed it necessary to amend the BBMs laid out in Directive No. 16. The aim of these amendments was to safeguard
118
CENTRAL BANK OF MALTA Annual Report 2020
borrowers who had been negatively impacted by the pandemic and who might temporarily be in a weaker financial position to obtain financing for the purchase of residential real estate.1 In this regard, on 1 June 2020, the Bank issued a Notice outlining the changes in two provisions of Directive No.16, which came into effect from the date of publication of the said Notice.2 The changes made mainly related to a postponement by one year of the fully phased-in Loan-to-Value limit of 75% applicable to Category II borrowers, and the temporary relaxation of the 40% debt-service-to-income cap subject to certain conditions. For further information, refer to Panel C of the Financial Stability Report 2019.3
The Bank, in conjunction with the MFSA, applied the established methodology for the identification of Other Systemically Important Institutions (O-SII).4 During the 2020 iteration, the same four credit institutions iden-tified as O-SIIs in 2019 were re-confirmed. One O-SII registered an increase in its buffer rate, while the remaining three retained the same buffer rate as that applicable in 2020.5 In view of the uncertainties related to the COVID-19 pandemic, the authorities decided to postpone by one year any phasing-in arrangements for institutions currently subject to transitory provisions and to those institutions which registered an increase in their buffer rate stemming from the 2020 iteration.
In the context of COVID-19, the Bank also updated its stress testing frameworks to assess the banking sector’s resilience in terms of solvency and liquidity to the repercussions brought about by the COVID-19 pandemic. In particular, the Macro Stress Testing framework was conducted on the basis of two COVID-19 related scenarios and, similar to the ECB’s Vulnerability Assessment, was based on the Bank’s economic projections. Moreover, additional sources of vulnerability were assessed via dedicated sensitivity analyses. The results of these exercises were published in the Financial Stability Report 2019, as well as in the Interim Financial Stability Report 2020.
The countercyclical capital buffer (CCyB), whose aim is to attenuate excessive credit growth, remained unchanged at 0% throughout 2020. Although GDP contracted due to the adverse effects of the pandemic, the credit-to-GDP gap remained negative, with the assessment of supplementary indicators also support-ing the decision not to activate the CCyB at the current juncture. Meanwhile, the capital conservation buffer remained in force with banks required to hold an additional capital of 2.5% of risk weighted assets. Pursuant to the ESRB’s Recommendation 2015/1 on recognising and setting CCyB rates for exposures to third countries, in 2020 the Bank conducted its annual exercise with the aim of identifying material third countries to which the domestic banking sector is exposed.6 In line with the methodology prescribed in Article 4 of the ESRB Decision 2015/3, the United States, United Arab Emirates and Republic of Turkey are the three third countries which have been identified as material for Malta for the period 2020 Q2 to 2021 Q2.7,8
During 2020, the Bank published an amended version of Directive No. 11 On Macroprudential Policy which transposes elements of the revised CRD V falling under the responsibility of the Bank.9 In this regard, on 21 December 2020, the Bank published the final amendments to the Directive, following a public consulta-tion. In line with CRD V timelines, the amendments reflected in Directive No. 11 became applicable as of 28 December 2020.
1 Central Bank of Malta Directive No. 16 in terms of the Central Bank of Malta Act (Cap. 204) – Regulation on BBMs. Source: www.centralbankmalta.org/file.aspx?f=72401 2 Notice – Directive No.16 Regulation on BBMs – COVID-19 Related Measures. Source: www.centralbankmalta.org/en/news/79/2020/88233 Central Bank of Malta Financial Stability Report 2019. Source: www.centralbankmalta.org/site/excel/Publications/FSR-2019.pdf4 Link to the Bank-MFSA Policy Document on the revised methodology for the identification of O-SIIs and the related capital buffer calibra-tion: www.centralbankmalta.org/systemically-important-institutions5 The institutions designated as O-SIIs together with their applicable capital buffer rates has been communicated in the 2021 ‘O-SIIs’ statement of decision as per following link: www.centralbankmalta.org/site/Financial-Stability/O-SII/Statement-of-Decision.pdf6 ESRB/2015/1: Recommendation of the ESRB of 11 December 2015 on recognising and setting CCyB rates for exposures to third countries.7 ESRB/2015/3: Decision of the ESRB of 11 December 2015 on the assessment of materiality of third countries for the Union’s banking system in relation to the recognition and setting of CCyB rates. 8 www.centralbankmalta.org/reciprocity 9 Link to final revised text of Directive No.11: www.centralbankmalta.org/centralbankofmaltadirectives
119
CENTRAL BANK OF MALTA Annual Report 2020
The Bank, in collaboration with the ECB, conducted four quarterly rounds of the BLS to monitor develop-ments in lending standards and credit demand by households and NFCs. The survey – which is conducted among the four large core domestic banks – captures about 90% of domestic lending. Survey results were published in a dedicated box in the Bank’s Financial Stability Report 2019. Four domestic credit institutions were also included in the scope of the European Banking Authority’s (EBA) EU-Wide Transparency exercise, with individual bank data also published on the EBA’s website.10
During the year, the Bank finalised a data collection template to enhance the collection of real estate data indicators with the aim of improving the analysis on lending standards while at the same time being able to monitor the compliance and impact of Directive No. 16. Such requirements are also meant to address the ESRB’s Recommendation of 2019/3 which updates the previous recommendation of 2016/14.11 The enhanced data requirements will start to be submitted in 2021, with additional attributes requested as from 2022.
In addition, the Bank continued to monitor developments in the area of anti-money laundering (AML) as the different stakeholders, including the Government, national authorities and market operators continued their work in addressing the recommendations made by MONEYVAL. Going forward, the Bank will continue to contribute, within its remit, to strengthen Malta’s AML/Combating the Financing of Terrorism framework.
Committee meetings at domestic and European levels The Bank’s Financial Stability Committee (FSC) met five times in 2020. The Committee members were also formally consulted on a number of financial stability issues.12 Discussions covered the publication of the Financial Stability Reports, the methodologies for the categorisation of banks and investment funds focusing on domestic relevance, updated results on the identification of O-SIIs, the revision to stress testing scenarios and discussions on Directives Nos. 11, 16 and 18.
The JFSB met seven times in 2020 to discuss specific developments in the financial sector and to provide recommendations to the regulatory authorities.13
The Forum for Financial Stability was held twice, in January and December 2020. During these meetings, the outlook for the Maltese economy and financial stability in the euro area and Malta were discussed. Fur-thermore, results from the Bank’s and the MFSA’s Risk Surveys addressed to the financial services industry were also presented. The amended Bank’s stress testing framework was also presented. In addition, the Forum discussed the ECB’s Strategy Review, the update of macroprudential measures and recommenda-tions that were made during 2020.
The Domestic Standing Committee and its Crisis Management Task Force sub-structure continued working on updating the Domestic Crisis Management Framework and the Memoranda of Understanding between the Central Bank of Malta, MFSA and Ministry for Finance. The Framework sets out the structure and high-level principles and procedures that guide the Authorities in the event of a financial crisis, whereas the Mem-oranda of Understanding ensure that there is efficient cooperation and exchange of information between the three Authorities in the prevention and management of financial crisis situations. Meetings also focused on the resolution planning of domestic banks and the Depositor Compensation Scheme. In addition, following
10 While the transparency exercise has been conducted annually since 2011, following the postponement of the European Banking Au-thority 2020 EU-wide stress test to 2021, the EBA decided to have two editions of such exercise in 2020. The Spring and Autumn exercises informed the public of the conditions of circa 130 EU credit institutions prior to the onset of the COVID-19 crisis (for the second half of 2019) and its impact during the first half of 2020. 11 www.esrb.europa.eu/pub/pdf/recommendations/esrb.recommendation190819_ESRB_2019-3~6690e1fbd3.en.pdf12 The FSC is chaired by the Governor and includes the two Deputy Governors, the Chief Officer Economics, the Chief Officer Financial Control and Risk, the Chief Officer Financial Stability, the Head Financial Stability Surveillance and Research, and Head Policy, Crisis Management and Stress Testing.13 The JFSB is chaired by the Governor and includes two other representatives of the Bank and two representatives of the MFSA. The Minister for Finance attends the meetings as observer. The Governor may also request other officials to attend sittings of the Board as observers. The objective of the JFSB is to establish a coordination platform between the Bank and the MFSA to formulate macroprudential policy and to contribute to the safeguard of the stability of the financial system in Malta.
120
CENTRAL BANK OF MALTA Annual Report 2020
the outbreak of COVID-19 in Malta, the Crisis Management Task Force meetings were held fortnightly to discuss the ongoing situation of local credit institutions.
At a European level, senior Bank officials participated in a number of meetings of the ESRB and the ECB, and their sub-structures. Furthermore, several meetings on financial stability issues were held with the IMF, the EC in the context of the European Semester and credit rating agencies.
Future developmentsIn 2021, a number of initiatives are expected to take place including the enhancement of risk identification and stress testing. Moreover, the Bank in conjunction with other authorities will continue its work to bridge remaining gaps in real estate data as well as to monitor the domestic banks’ compliance with Directive No. 16 and assess the impact of such measures.
121
CENTRAL BANK OF MALTA Annual Report 2020
3. ECONOMIC ANALYSIS AND RESEARCH
The Central Bank of Malta monitors and assesses economic developments and prospects in support of its key policy-making function. At the same time, the Bank carries out economic research, and develops and maintains a suite of econometric models.
Staff provided input for the monetary policy process by briefing the Governor ahead of his participation in the Governing Council and the General Council of the ECB, as well as in relation to contacts with external bod-ies, such as the EC, the IMF and credit rating agencies. Furthermore, the Bank also participated in a number of teams set up in the context of the ECB’s Monetary Policy Strategy Review.
Four projection exercises were conducted, two of which were undertaken as part of the Eurosystem’s Broad Macroeconomic Projection Exercise. Further work was carried out to enhance the various tools used in the forecasting processes. In particular, in view of the asymmetrical impact of COVID-19 on different sec-tors, the toolkit used in the Bank’s forecasting process was expanded with a new integrated model, which combines the Bank’s main econometric model with an input-output based model. The commentary on the Bank’s projections continued to feature short boxes on specific aspects related to forecasting. In 2020, the Department analysed the impact of the containment measures and policy support introduced in response to the pandemic, the impact of the pandemic on different sectors of the economy and the response of infla-tion during the pandemic. A new in-house indicator that summarises the degree of COVID-19 stringency measures was developed. Given the prevailing uncertainty arising from the COVID-19 pandemic, the Bank’s projections were extended to include a severe scenario in addition to the baseline projection. Regular dis-cussions with companies’ representatives and public sector institutions to obtain a better gauge of economic conditions and prospects continued to be held. Due to the need for more sectoral analysis, the exercise was significantly expanded and carried out on a weekly and at times even daily basis.
The Bank published its analysis of domestic and foreign economic and financial developments in its Quarterly Review and Annual Report.1 Apart from commenting on official statistics, these publications include commentaries on a number of internally-developed indicators, including the Bank’s estimate of potential output, a BCI, a measure of structural unemployment, the FCI, as well as cyclically-adjusted fiscal and current account balances. Moreover, the Bank continued to publish a monthly Economic Update. The latter started to include a section on building development permits, which also began to feature as an input to the BCI. The Bank’s publications also comprised COVID-19 related sections such as information on the amount of loans benefitting from moratoria and government-guaranteed loans issued in the aftermath of the pandemic.
The Economic Analysis Department worked closely with statistical compilers in other institutions and partici-pated in the work of the ECB’s Statistics Committee. Following the publication of the results from the 2017 wave of the HFCS, the Bank liaised closely with the NSO on the fourth wave of this survey. In the second half of the year, the Economic Analysis Department delivered training sessions to the interviewers who will be administering this wave. Household interviews for the latter commenced in November and are expected to end in the first half of 2021.
1 The Bank’s publications can be found at: www.centralbankmalta.org/publications.
122
CENTRAL BANK OF MALTA Annual Report 2020
Bank staff undertook specialised research which resulted in eight working papers, three policy notes and 21 articles in the Bank’s regular publications. The working papers covered a variety of topics, including immi-gration, housing and the underground economy. Two working papers documented the results of specialised surveys while another three working papers focused on extensions to the Bank’s modelling toolkit. The policy notes dealt with the ageing of the Maltese workforce, advertised rents in Malta and developments in Malta’s air connectivity.
Research was also presented externally, both locally and abroad. Five studies were published in foreign peer-reviewed journals, one as an ECB Occasional Paper and one in an external working paper series. Input to a number of ECB working groups and task forces was provided, including on Brexit-related issues. Research results were delivered in local and external virtual conferences or webinars on a diverse range of topics, such as the determinants of well-being, migration, housing and methodological papers.
In 2020, the Bank organised its third Annual Research Symposium. The symposium focused on migration, with an external speaker from Queen Mary University of London (QMUL) who delivered a presentation on border policies and irregular migration with evidence on the refugee crisis in Europe. A senior economist from the Research Department presented his research on the macroeconomic impact of the inflow of foreign workers on the Maltese economy. During this online workshop, the Bank launched the third edition of its Research Bulletin. This included four articles on advertised rents, a sectoral extension of the Bank’s econo-metric model, housing demand shocks and a cross-country comparison of the key findings from the third wave of the HFCS.
Public lectures and seminars in economics and finance were held. Three online events, dealing with the pandemic impact from the perspective of a rating agency, the Bank of England and the EC respectively, were delivered by external speakers.
The Bank organised regular internal seminars to stimulate economic discussion and debate on its studies prior to their publication. Staff members kept regular contacts with academia, both locally and abroad. Pre-sentations were delivered to students and staff from the University of Malta, the University of Nottingham and the University of Greenwich. Assistance from external institutions was sought for the peer-review of the Bank’s technical studies. The Bank also remained active in domestic fora, such as the National Productivity Board, the Building Industry Consultative Council and an expert group set up by the Housing Authority on the private residential rental market. In addition, the Bank addressed a conference on productivity and competi-tiveness organised by the Malta Council for Economic and Social Development (MCESD).
Research plans for 2021 include studies on structural trends in the Maltese economy, drivers of cyclical fluc-tuations, housing, macrofinancial linkages, fiscal policy and monetary policy. A concerted effort will also be made to begin assessing the extent to which COVID-19 has changed the underlying structure of the Maltese economy. The Bank will pursue the allocation of resources to develop econometric and structural models which would complement its forecasting toolkit and enhance its research capacity. The Bank will continue to participate in Eurosystem discussions on the ECB’s Monetary Policy Strategy Review.
123
CENTRAL BANK OF MALTA Annual Report 2020
4. STATISTICS
The Bank is primarily responsible for the collection and compilation of monetary, banking, payments, securi-ties, financial accounts, financial soundness, financial market and financial institutions’ statistics in Malta. It also collects various other statistics for internal policy-making purposes, such as prudential supervisory and macroeconomic statistics. These statistics, which are regularly updated in the statistics part of the Bank’s interactive website, are also used by authorities, market participants, media and the general public. The Bank also contributes to the compilation of the NSO’s BoP/international investment position statistics. The Bank fulfils various international statistical reporting obligations, mainly to the ECB and the IMF. In the latter case, the Bank participates in the Fund’s Special Data Dissemination Standard and the General Data Dis-semination System, as well as in various surveys.
Given the developments caused by the COVID-19 pandemic, work accelerated to ensure continuity to the business operations in the area of statistics. Moreover, derogations were granted to certain categories of reporting financial sectors while additional statistics were collected, such as on moratoria on loans granted by the banks to their clients.
The Bank continued to operate its Central Credit Register (CCR) to provide borrowers’ credit risk information to both credit institutions as well as natural and legal borrowers. This is in line with Central Bank of Malta Directive No. 14 which empowers the Bank to operate the Register in pursuit of its objectives regarding financial system stability, monetary policy analysis and the processing of statistical information. The avail-ability of such a register allows credit institutions and the MDB to access data for assessing risks when granting credit, apart from addressing a key requirement of the World Bank’s Doing Business index. During the year, there were 37,001 searches on the Register by credit institutions. Requests from consumers, both natural and legal persons, for an extract of their own credit report held on the Register amounted to 477. Amendments were carried out to the Directive, while Directive No. 15 was enacted to affirm the role of the Bank as the supervisory authority of CRAs and to introduce their obligations when applying and in fulfilling licensing requirements.
Participation in Eurosystem-related work continued to grow. A public consultation process on payments statistics was launched, and subsequently work commenced on the design of a new reporting survey. Work also proceeded on the operational phase of the Anacredit database, aimed at providing a harmonised set of credit and credit risk data across participating euro area countries. Moreover, the Bank continued to enhance the quality of the Maltese securities data held within the ECB’s Centralised Securities Database. The Central Bank of Malta began collecting and processing pension funds statistics for the first time, while it continued to collect statistics on insurance corporations and on investment funds. Participation also commenced in a ESCB project on the European IReF, which is a project aimed at integrating a number of reporting require-ments into one common harmonised reporting template. The ECB’s Register of Institutions and Affiliates Database continued to be populated with reference data of all newly-licensed institutions and to enhance data on the institutions in operation. The Bank also introduced additional statistical breakdowns related to Brexit.
At the same time, the Bank stepped up its efforts to meet the ESRB’s requirements as per the recom-mendation on closing real estate data gaps, and to monitor developments following the introduction of Directive No. 16 on BBMs. Discussions with the reporting credit institutions and the MBA took place during
124
CENTRAL BANK OF MALTA Annual Report 2020
the year, while official reporting is targeted for 2021/2022. A status report was transmitted to the ESRB in December 2020.
The Central Bank of Malta widened the range of statistics made available to the public by publishing for the first time on the Bank’s website the aggregated statement of assets and liabilities of FVCs. Together with various national and international statistical agencies, the Central Bank of Malta marked World Statistics Day on 20 October 2020 by releasing on its website an Instagram post related to its investment in its statistical processing platform.
The Bank also continued to collaborate with the NSO to enhance the quality of the balance of payments statistics and to follow up on the recommendations of the ECB/Eurostat on the data quality assurance underlying this dataset within the framework of the MIP. Meetings were held with various investment funds and investment services providers to enhance data quality. In the area of financial accounts statistics, the requirements as per the new ECB guideline were integrated in the Bank’s statistical solution, INFOSTAT, while new data sources were identified and estimation methodologies were enhanced. ‘From-whom-to-whom’ tables – which explain the financial linkages between the country’s institutional sectors – continued to be released on the Bank’s website. The Bank also obtained access to granular financial data from private sources which will boost the Bank’s ability to produce more in-depth analysis.
Collaboration with Banca d’Italia in the implementation of INFOSTAT continued. In this regard, in 2020, the Central Bank of Malta, under the oversight of the Joint Central Bank of Malta/Banca d’Italia INFOS-TAT Steering Committee, launched a number of new initiatives, and reviewed some existing processes. Moreover, the technology underpinning the entire INFOSTAT platform was upgraded, while a service level agreement for the test environment was concluded. To enhance users’ knowledge, training on the use of INFOSTAT continued to be delivered.
In terms of internal data accessibility, the Bank deployed an improved version of the inquiry tool module. At the same time, virtual information sessions were delivered to the various respondents to start submit-ting their returns directly in the solution. Bank officials collaborated and guided their NSO counterparts to facilitate the migration of the BoP database from the legacy solution to INFOSTAT. The helpdesk within the Statistics Department continued to provide technical assistance and managed the authorisation process. More formal and deterministic checks were implemented at the data collection stage while outlier detection methods were introduced to ensure higher quality before data dissemination. At the same time, the Depart-ment started to participate in initiatives coordinated by European and other international institutions on cli-mate change indicators. Further work in this field is expected to be carried out in the coming years.
The Central Bank of Malta and the MFSA continued to organise meetings of the Joint Data Coordination Group with the aim of recommending policy actions on common data management. The Forum for Central Bank of Malta Statistics was held with the banks. Concurrently, Bank officials participated in the Statistics Committee in ESCB and Single Supervisory Mechanism (SSM) composition and in its various sub-struc-tures, which aim to develop statistics to support the various tasks of the ECB and the ESCB. The Bank’s internal Statistics Committee, supported by its sub-structure, met three times during 2020, mainly to define and implement the policy on statistical information within the Bank. The Bank’s internal Network on big data and machine learning met on various occasions to discuss and implement concrete and practical Bank-wide initiatives. Meanwhile, the Bank pursued its preparation, together with the NSO, to meet the requirements for Malta’s adherence to the IMF’s Special Data Dissemination Standard Plus.
125
CENTRAL BANK OF MALTA Annual Report 2020
5. CURRENCY, PAYMENT SYSTEMS AND BANKING SERVICES
The Central Bank of Malta is responsible for the issue and circulation of euro banknotes in accordance with the legal framework of the ESCB, the ECB and of the Central Bank of Malta Act. The Bank issues coins on behalf of the Government of Malta through a Memorandum of Understanding. Moreover, the Bank is respon-sible for the regulation and oversight of the payment and securities settlement systems (SSSs) in Malta.
Currency operationsThe Currency Operations Office provides an adequate supply of banknotes and coins to meet the demand of the banking system and ensures the high quality and authenticity of the currency in circulation. All cur-rency returned to the Central Bank is processed by ECB accredited machines. Counterfeit banknotes and coins are withdrawn, while those found to be unfit for circulation are destroyed. Data on stocks and flows of banknotes and coins are reported on a daily and monthly basis to the ECB through the Currency Information System.
In terms of the obligations laid down under Central Bank of Malta Directive No. 10, the Currency Operations Office monitors recycling activities performed by credit institutions and other professional cash handlers. Annual monitoring tests are done on banknote handling machines and coin processing machines. Other monitoring checks are undertaken on an ad hoc basis at branches of credit institutions.
The Currency Operations Office analyses banknotes and coins suspected to be counterfeit and also pro-vides expert evidence related to counterfeit currency in terms of the obligations laid down under Article 54 of the Central Bank of Malta Act (Cap. 204).
Circulation of notes and coinsDuring 2020, the notes inspected by the Bank numbered 78.8 million compared with 99.2 million in 2019. The inspected notes had a value of approximately €2,050.6 million, €328.8 million lower than in 2019. A total of 66.0 million banknotes with a value of €1,583.1 million were found suitable for re-issue. A total of 12.8 million banknotes with a value of €467.9 million were destroyed. The percentage of banknotes destroyed increased from 13.5% to 16.3% in 2020. The decrease in banknotes inspected in 2020 can largely be attributed to the impact of COVID-19, which led to a substantial reduction in the volume of banknotes deposited at the Central Bank (see Table 5.1). The increase in banknotes destroyed during the year was mainly due to the destruction of high denomination banknotes of the Europa first series of banknotes.
Total Issued Withdrawn Net issue Issued and outstanding
2019 2,583.0 2,368.0 215.0 1,548.32020 2,180.0 1,896.0 284.0 1,832.3Source: Central Bank of Malta.
Table 5.1BANKNOTES ISSUED AND OUTSTANDING BY THE CENTRAL BANK OF MALTAEUR millions
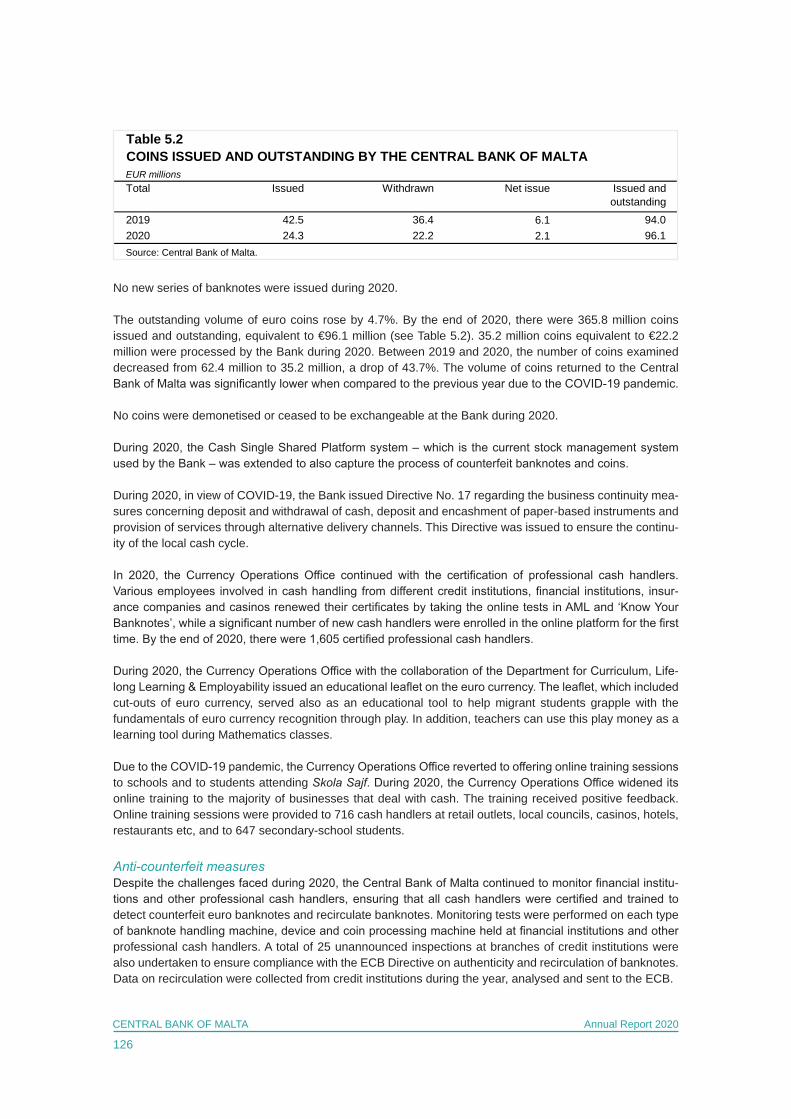
126
CENTRAL BANK OF MALTA Annual Report 2020
No new series of banknotes were issued during 2020.
The outstanding volume of euro coins rose by 4.7%. By the end of 2020, there were 365.8 million coins issued and outstanding, equivalent to €96.1 million (see Table 5.2). 35.2 million coins equivalent to €22.2 million were processed by the Bank during 2020. Between 2019 and 2020, the number of coins examined decreased from 62.4 million to 35.2 million, a drop of 43.7%. The volume of coins returned to the Central Bank of Malta was significantly lower when compared to the previous year due to the COVID-19 pandemic.
No coins were demonetised or ceased to be exchangeable at the Bank during 2020.
During 2020, the Cash Single Shared Platform system – which is the current stock management system used by the Bank – was extended to also capture the process of counterfeit banknotes and coins.
During 2020, in view of COVID-19, the Bank issued Directive No. 17 regarding the business continuity mea-sures concerning deposit and withdrawal of cash, deposit and encashment of paper-based instruments and provision of services through alternative delivery channels. This Directive was issued to ensure the continu-ity of the local cash cycle.
In 2020, the Currency Operations Office continued with the certification of professional cash handlers. Various employees involved in cash handling from different credit institutions, financial institutions, insur-ance companies and casinos renewed their certificates by taking the online tests in AML and ‘Know Your Banknotes’, while a significant number of new cash handlers were enrolled in the online platform for the first time. By the end of 2020, there were 1,605 certified professional cash handlers.
During 2020, the Currency Operations Office with the collaboration of the Department for Curriculum, Life-long Learning & Employability issued an educational leaflet on the euro currency. The leaflet, which included cut-outs of euro currency, served also as an educational tool to help migrant students grapple with the fundamentals of euro currency recognition through play. In addition, teachers can use this play money as a learning tool during Mathematics classes.
Due to the COVID-19 pandemic, the Currency Operations Office reverted to offering online training sessions to schools and to students attending Skola Sajf. During 2020, the Currency Operations Office widened its online training to the majority of businesses that deal with cash. The training received positive feedback. Online training sessions were provided to 716 cash handlers at retail outlets, local councils, casinos, hotels, restaurants etc, and to 647 secondary-school students.
Anti-counterfeit measuresDespite the challenges faced during 2020, the Central Bank of Malta continued to monitor financial institu-tions and other professional cash handlers, ensuring that all cash handlers were certified and trained to detect counterfeit euro banknotes and recirculate banknotes. Monitoring tests were performed on each type of banknote handling machine, device and coin processing machine held at financial institutions and other professional cash handlers. A total of 25 unannounced inspections at branches of credit institutions were also undertaken to ensure compliance with the ECB Directive on authenticity and recirculation of banknotes. Data on recirculation were collected from credit institutions during the year, analysed and sent to the ECB.
Total Issued Withdrawn Net issue Issued and outstanding
2019 42.5 36.4 6.1 94.02020 24.3 22.2 2.1 96.1Source: Central Bank of Malta.
Table 5.2COINS ISSUED AND OUTSTANDING BY THE CENTRAL BANK OF MALTAEUR millions
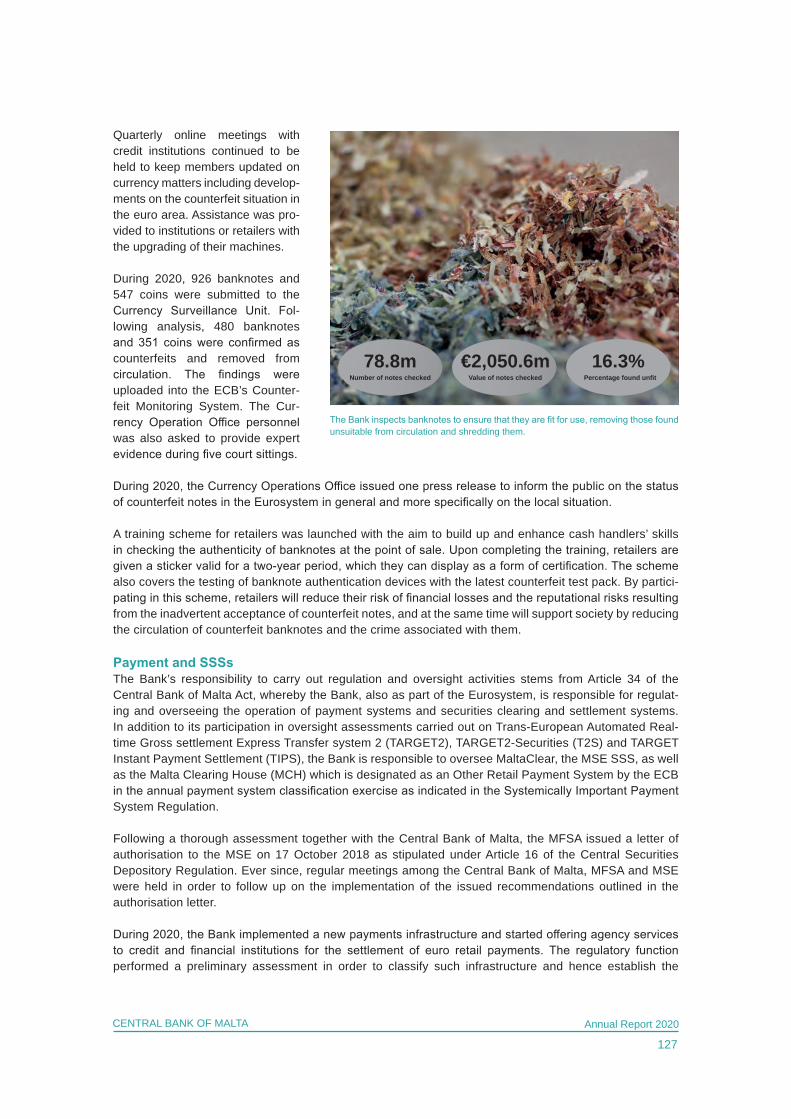
127
CENTRAL BANK OF MALTA Annual Report 2020
Quarterly online meetings with credit institutions continued to be held to keep members updated on currency matters including develop-ments on the counterfeit situation in the euro area. Assistance was pro-vided to institutions or retailers with the upgrading of their machines.
During 2020, 926 banknotes and 547 coins were submitted to the Currency Surveillance Unit. Fol-lowing analysis, 480 banknotes and 351 coins were confirmed as counterfeits and removed from circulation. The findings were uploaded into the ECB’s Counter-feit Monitoring System. The Cur-rency Operation Office personnel was also asked to provide expert evidence during five court sittings.
During 2020, the Currency Operations Office issued one press release to inform the public on the status of counterfeit notes in the Eurosystem in general and more specifically on the local situation.
A training scheme for retailers was launched with the aim to build up and enhance cash handlers’ skills in checking the authenticity of banknotes at the point of sale. Upon completing the training, retailers are given a sticker valid for a two-year period, which they can display as a form of certification. The scheme also covers the testing of banknote authentication devices with the latest counterfeit test pack. By partici-pating in this scheme, retailers will reduce their risk of financial losses and the reputational risks resulting from the inadvertent acceptance of counterfeit notes, and at the same time will support society by reducing the circulation of counterfeit banknotes and the crime associated with them.
Payment and SSSsThe Bank’s responsibility to carry out regulation and oversight activities stems from Article 34 of the Central Bank of Malta Act, whereby the Bank, also as part of the Eurosystem, is responsible for regulat-ing and over seeing the operation of payment systems and securities clearing and settlement systems. In addition to its participation in oversight assessments carried out on Trans-European Automated Real-time Gross settlement Express Transfer system 2 (TARGET2), TARGET2-Securities (T2S) and TARGET Instant Payment Settlement (TIPS), the Bank is responsible to oversee MaltaClear, the MSE SSS, as well as the Malta Clearing House (MCH) which is designated as an Other Retail Payment System by the ECB in the annual payment system classification exercise as indicated in the Systemically Important Pay ment System Regulation.
Following a thorough assessment together with the Central Bank of Malta, the MFSA issued a letter of authorisation to the MSE on 17 October 2018 as stipulated under Article 16 of the Central Securities Depository Regulation. Ever since, regular meetings among the Central Bank of Malta, MFSA and MSE were held in order to follow up on the implementation of the issued recommendations outlined in the authorisation letter.
During 2020, the Bank implemented a new payments infrastructure and started offering agency services to credit and financial institutions for the settlement of euro retail payments. The regulatory function performed a preliminary assessment in order to classify such infrastructure and hence establish the
78.8mNumber of notes checked Value of notes checked Percentage found unfit
€2,050.6m 16.3%
The Bank inspects banknotes to ensure that they are fit for use, removing those found unsuitable from circulation and shredding them.

128
CENTRAL BANK OF MALTA Annual Report 2020
appropriate oversight assessment thereafter. Based on a number of supporting documents which were provided by the operator, the infrastructure was classified as a ‘Payment System’ at the end of 2020.
Statistical analysis on the transactions undertaken through different payment instruments was carried out. Several reports on cash withdrawals, transactions at points-of-sale, as well as credit transfers were com-piled. Such analysis and reports were important to evaluate new trends within Malta’s payment landscape and also assist in any policy developments that might be required.
Given the rise in cyber threats, the guidelines on security risk management were updated at the European level to reflect such threats and hence, cover for new risks, such as, Information and Communication Technology and cyber risks. To this effect, such update was reflected in Central Bank of Malta Directive No. 1, particularly Annex 3, so that the reports provided by institutions at the end of 2020 are based on the newly-updated requirements.
One of the fundamental changes introduced by the Payment Services Directive No. 2 (Directive (EU) 2015/2366) is the requirement for all payment service providers to apply strong customer authentication when initiating or executing electronic payments. Such authentication is based on the use of two or more elements categorised as knowledge (i.e. something only the user knows), possession (i.e. something only the user possesses) and inherence (i.e. something the user is). The enforcement of this requirement was applicable as from 14 September 2019. However, due to the complexity of the payments market and the challenges that these requirements involved, the EBA extended the deadline to 31 December 2020 in respect of card payments for e-commerce. During 2020, the Bank focused on monitoring the migra-tion plans of payment service providers in order to ensure a consistent and harmonised approach for the implementation of strong customer authentication in the local market.
As from April 2020, the obligations which stem from the Cross-Border Payments Regulation (Regulation (EU) 2019/518 on information on currency conversion charges for card-based transactions and online credit transfers) came into force. Payment service providers providing card issuing and acquiring services are obliged to express the currency conversion charges as a percentage mark up over the latest available euro FX reference rates issued by the ECB. The percentage mark ups must be published on a broadly available and easily accessible electronic platform, such as the service provider’s website, internet bank-ing portal and mobile application.
Moreover, prior to the initiation of a card-based transaction, either at point-of-sale, or at an ATM machine which involves a currency conversion, the service provider needs to disclose to the payer the following information: (i) the option to pay in the currency used by the payee; (ii) the amount to be paid in both the currencies of the payer and the payee; (iii) the percentage mark up and the amounts to be paid in both currencies are to be made available on a durable medium. Furthermore, for online credit transfers which involve a currency conversion, the payment service provider must disclose: (i) the estimated currency conversion charges applicable to the credit transfer; (ii) the estimated total amount of the credit transfer in the currency of the payer, including any transaction fees and any currency conversion charges; and (iii) the estimated amount to be transferred to the payee in the payee’s currency.
MCHThe MCH meets every morning at the Bank’s premises to physically exchange the cheques negotiated dur-ing the previous working day by each participant of the MCH on behalf of the other participants. One member had its licence withdrawn, bringing the number of participants to 11.
The decrease in the number of cheques issued when compared to 2019 is likely to be attributed to the COVID-19 pandemic, since for a period of time most shops were closed. However, online shopping contin-ued to increase strongly, leading to more use of electronic means for settlement (see Table 5.3).
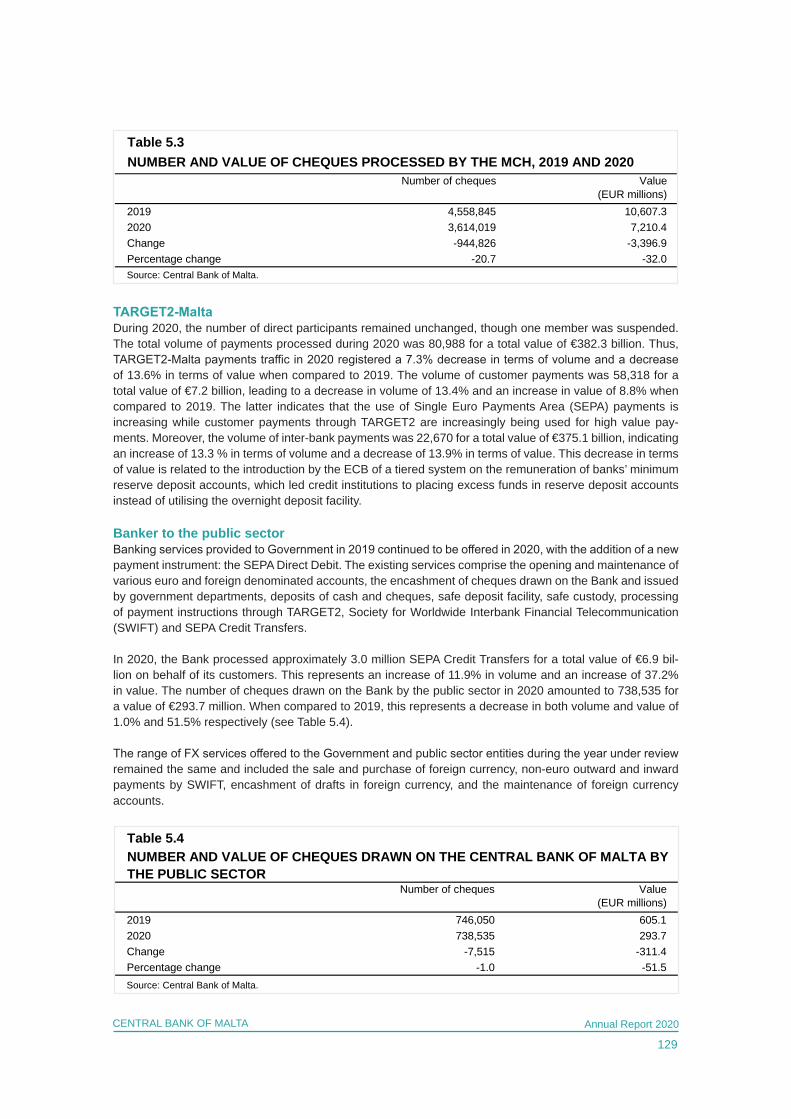
129
CENTRAL BANK OF MALTA Annual Report 2020
Number of cheques Value (EUR millions)
2019 4,558,845 10,607.32020 3,614,019 7,210.4Change -944,826 -3,396.9Percentage change -20.7 -32.0Source: Central Bank of Malta.
Table 5.3NUMBER AND VALUE OF CHEQUES PROCESSED BY THE MCH, 2019 AND 2020
TARGET2-Malta During 2020, the number of direct participants remained unchanged, though one member was suspended. The total volume of payments processed during 2020 was 80,988 for a total value of €382.3 billion. Thus, TARGET2-Malta payments traffic in 2020 registered a 7.3% decrease in terms of volume and a decrease of 13.6% in terms of value when compared to 2019. The volume of customer payments was 58,318 for a total value of €7.2 billion, leading to a decrease in volume of 13.4% and an increase in value of 8.8% when compared to 2019. The latter indicates that the use of Single Euro Payments Area (SEPA) payments is increasing while customer payments through TARGET2 are increasingly being used for high value pay-ments. Moreover, the volume of inter-bank payments was 22,670 for a total value of €375.1 billion, indicating an increase of 13.3 % in terms of volume and a decrease of 13.9% in terms of value. This decrease in terms of value is related to the introduction by the ECB of a tiered system on the remuneration of banks’ minimum reserve deposit accounts, which led credit institutions to placing excess funds in reserve deposit accounts instead of utilising the overnight deposit facility.
Banker to the public sectorBanking services provided to Government in 2019 continued to be offered in 2020, with the addition of a new payment instrument: the SEPA Direct Debit. The existing services comprise the opening and maintenance of various euro and foreign denominated accounts, the encashment of cheques drawn on the Bank and issued by government departments, deposits of cash and cheques, safe deposit facility, safe custody, processing of payment instructions through TARGET2, Society for Worldwide Interbank Financial Telecommunication (SWIFT) and SEPA Credit Transfers.
In 2020, the Bank processed approximately 3.0 million SEPA Credit Transfers for a total value of €6.9 bil-lion on behalf of its customers. This represents an increase of 11.9% in volume and an increase of 37.2% in value. The number of cheques drawn on the Bank by the public sector in 2020 amounted to 738,535 for a value of €293.7 million. When compared to 2019, this represents a decrease in both volume and value of 1.0% and 51.5% respectively (see Table 5.4).
The range of FX services offered to the Government and public sector entities during the year under review remained the same and included the sale and purchase of foreign currency, non-euro outward and inward payments by SWIFT, encashment of drafts in foreign currency, and the maintenance of foreign currency accounts.
Table 5.4
Number of cheques Value (EUR millions)
2019 746,050 605.12020 738,535 293.7Change -7,515 -311.4Percentage change -1.0 -51.5Source: Central Bank of Malta.
NUMBER AND VALUE OF CHEQUES DRAWN ON THE CENTRAL BANK OF MALTA BY THE PUBLIC SECTOR
130
CENTRAL BANK OF MALTA Annual Report 2020
During 2020, the Bank continued servicing the Government’s external debt through periodic payments. As in 2019, where €123,596 worth of capital repayments were settled, in 2020 such settlements stood at €123,058. The associated interest paid in 2020 was €8,631, which is 89% of last year’s amount of €9,698.
The total value of funds transferred to the external debt sinking fund by debiting the government account during 2020 amounted to €50,000.
Banker to the banking systemThe Central Bank of Malta continued to act as banker to the rest of the banking system by providing deposit facilities to credit institutions. These institutions maintain balances at the Bank mainly to meet their reserve deposit requirements. They generally hold reserve accounts, margin call accounts and accounts pledged in favour of the Investor Compensation Scheme and Depositor Compensation Scheme.
Other financial servicesDuring 2020, the Bank started offering agency services to local credit and financial institutions for the clear-ing of euro retail payments. As at end of 2020, two institutions were onboarded while another was under-taking the required testing for onboarding in early 2021. In the meantime, several other institutions showed interest to begin participation. The Bank is currently holding bilateral discussions in this regard with these institutions.
Public eventsIn 2020, the Payments and Banking Department delivered several presentations. In February, it delivered a presentation entitled Taking Stock of Banking in Malta during the Institute of Financial Services Practitioners’ annual conference. In November, the Department delivered a presentation entitled The Payments Land-scape: A National and Eurosystem perspective during the MBA virtual annual conference. In December, in collaboration with the Malta Association of Credit Management, it organised a webinar to address the chal-lenges faced by the Maltese business community when using current payment instruments.
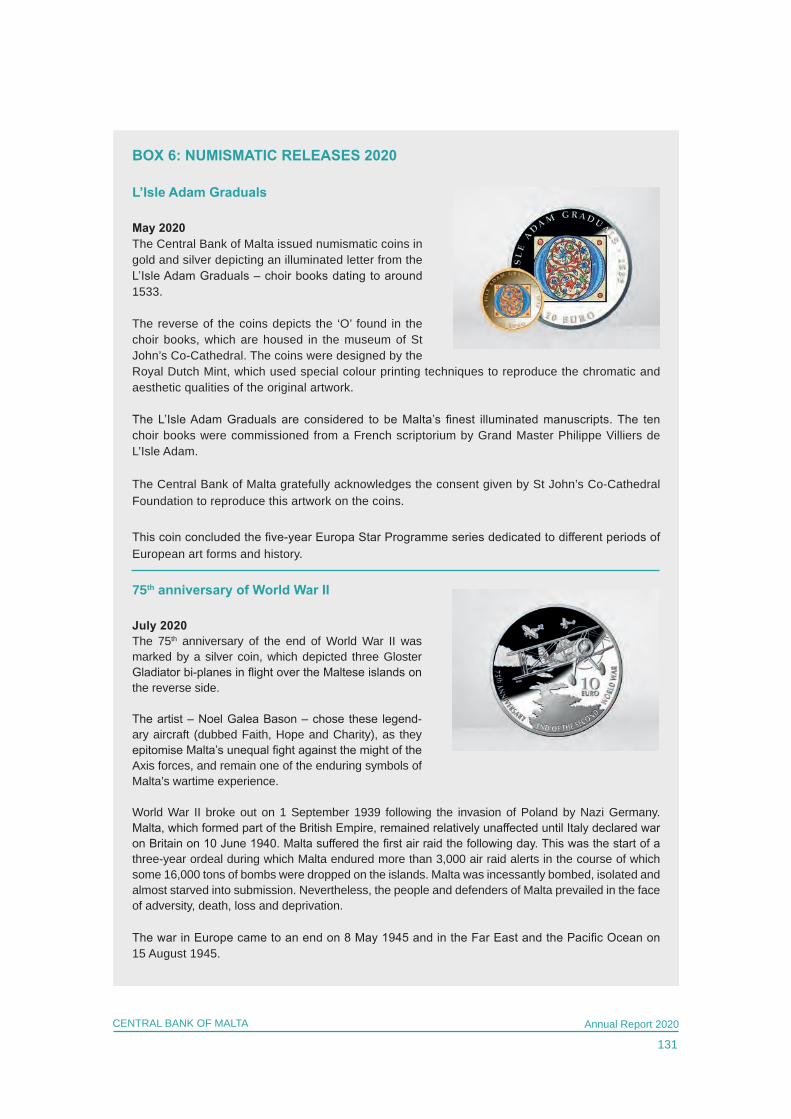
131
CENTRAL BANK OF MALTA Annual Report 2020
BOX 6: NUMISMATIC RELEASES 2020
L’Isle Adam Graduals
May 2020The Central Bank of Malta issued numismatic coins in gold and silver depicting an illuminated letter from the L’Isle Adam Graduals – choir books dating to around 1533.
The reverse of the coins depicts the ‘O’ found in the choir books, which are housed in the museum of St John’s Co-Cathedral. The coins were designed by the Royal Dutch Mint, which used special colour printing techniques to reproduce the chromatic and aesthetic qualities of the original artwork.
The L’Isle Adam Graduals are considered to be Malta’s finest illuminated manuscripts. The ten choir books were commissioned from a French scriptorium by Grand Master Philippe Villiers de L’Isle Adam.
The Central Bank of Malta gratefully acknowledges the consent given by St John’s Co-Cathedral Foundation to reproduce this artwork on the coins.
This coin concluded the five-year Europa Star Programme series dedicated to different periods of European art forms and history.
75th anniversary of World War II
July 2020The 75th anniversary of the end of World War II was marked by a silver coin, which depicted three Gloster Gladiator bi-planes in flight over the Maltese islands on the reverse side.
The artist – Noel Galea Bason – chose these legend-ary aircraft (dubbed Faith, Hope and Charity), as they epitomise Malta’s unequal fight against the might of the Axis forces, and remain one of the enduring symbols of Malta’s wartime experience.
World War II broke out on 1 September 1939 following the invasion of Poland by Nazi Germany. Malta, which formed part of the British Empire, remained relatively unaffected until Italy declared war on Britain on 10 June 1940. Malta suffered the first air raid the following day. This was the start of a three-year ordeal during which Malta endured more than 3,000 air raid alerts in the course of which some 16,000 tons of bombs were dropped on the islands. Malta was incessantly bombed, isolated and almost starved into submission. Nevertheless, the people and defenders of Malta prevailed in the face of adversity, death, loss and deprivation.
The war in Europe came to an end on 8 May 1945 and in the Far East and the Pacific Ocean on 15 August 1945.
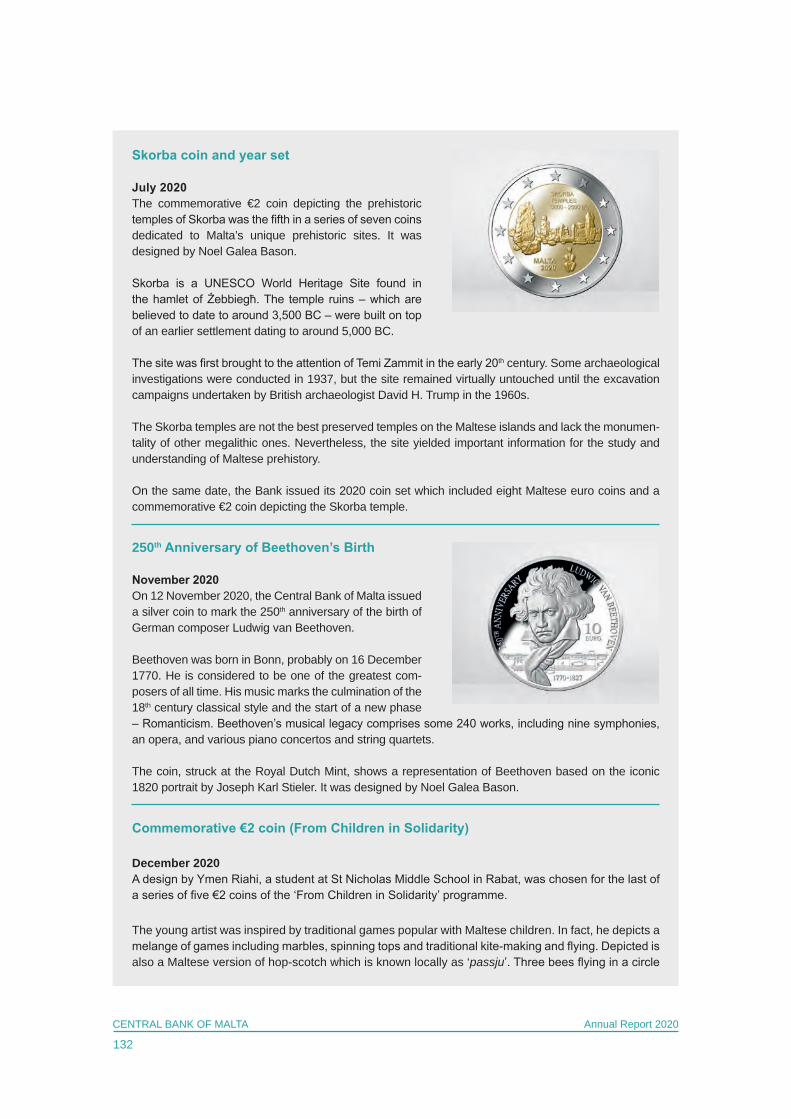
132
CENTRAL BANK OF MALTA Annual Report 2020
Skorba coin and year set
July 2020The commemorative €2 coin depicting the prehistoric temples of Skorba was the fifth in a series of seven coins dedicated to Malta’s unique prehistoric sites. It was designed by Noel Galea Bason.
Skorba is a UNESCO World Heritage Site found in the hamlet of Żebbiegħ. The temple ruins – which are believed to date to around 3,500 BC – were built on top of an earlier settlement dating to around 5,000 BC.
The site was first brought to the attention of Temi Zammit in the early 20th century. Some archaeological investigations were conducted in 1937, but the site remained virtually untouched until the excavation campaigns undertaken by British archaeologist David H. Trump in the 1960s.
The Skorba temples are not the best preserved temples on the Maltese islands and lack the monumen-tality of other megalithic ones. Nevertheless, the site yielded important information for the study and understanding of Maltese prehistory.
On the same date, the Bank issued its 2020 coin set which included eight Maltese euro coins and a commemorative €2 coin depicting the Skorba temple.
250th Anniversary of Beethoven’s Birth
November 2020On 12 November 2020, the Central Bank of Malta issued a silver coin to mark the 250th anniversary of the birth of German composer Ludwig van Beethoven.
Beethoven was born in Bonn, probably on 16 December 1770. He is considered to be one of the greatest com-posers of all time. His music marks the culmination of the 18th century classical style and the start of a new phase – Romanticism. Beethoven’s musical legacy comprises some 240 works, including nine symphonies, an opera, and various piano concertos and string quartets.
The coin, struck at the Royal Dutch Mint, shows a representation of Beethoven based on the iconic 1820 portrait by Joseph Karl Stieler. It was designed by Noel Galea Bason.
Commemorative €2 coin (From Children in Solidarity)
December 2020A design by Ymen Riahi, a student at St Nicholas Middle School in Rabat, was chosen for the last of a series of five €2 coins of the ‘From Children in Solidarity’ programme.
The young artist was inspired by traditional games popular with Maltese children. In fact, he depicts a melange of games including marbles, spinning tops and traditional kite-making and flying. Depicted is also a Maltese version of hop-scotch which is known locally as ‘passju’. Three bees flying in a circle
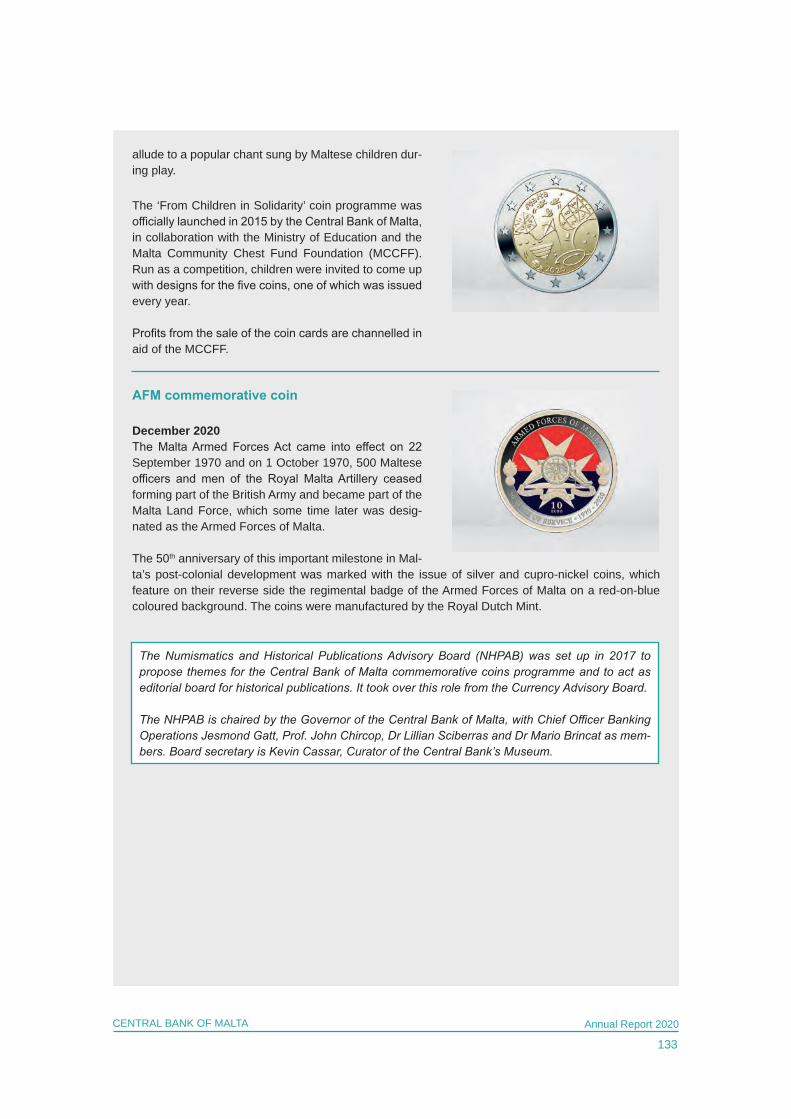
133
CENTRAL BANK OF MALTA Annual Report 2020
allude to a popular chant sung by Maltese children dur-ing play.
The ‘From Children in Solidarity’ coin programme was officially launched in 2015 by the Central Bank of Malta, in collaboration with the Ministry of Education and the Malta Community Chest Fund Foundation (MCCFF). Run as a competition, children were invited to come up with designs for the five coins, one of which was issued every year.
Profits from the sale of the coin cards are channelled in aid of the MCCFF.
AFM commemorative coin
December 2020The Malta Armed Forces Act came into effect on 22 September 1970 and on 1 October 1970, 500 Maltese officers and men of the Royal Malta Artillery ceased forming part of the British Army and became part of the Malta Land Force, which some time later was desig-nated as the Armed Forces of Malta.
The 50th anniversary of this important milestone in Mal-ta’s post-colonial development was marked with the issue of silver and cupro-nickel coins, which feature on their reverse side the regimental badge of the Armed Forces of Malta on a red-on-blue coloured background. The coins were manufactured by the Royal Dutch Mint.
The Numismatics and Historical Publications Advisory Board (NHPAB) was set up in 2017 to propose themes for the Central Bank of Malta commemorative coins programme and to act as editorial board for historical publications. It took over this role from the Currency Advisory Board.
The NHPAB is chaired by the Governor of the Central Bank of Malta, with Chief Officer Banking Operations Jesmond Gatt, Prof. John Chircop, Dr Lillian Sciberras and Dr Mario Brincat as mem-bers. Board secretary is Kevin Cassar, Curator of the Central Bank’s Museum.
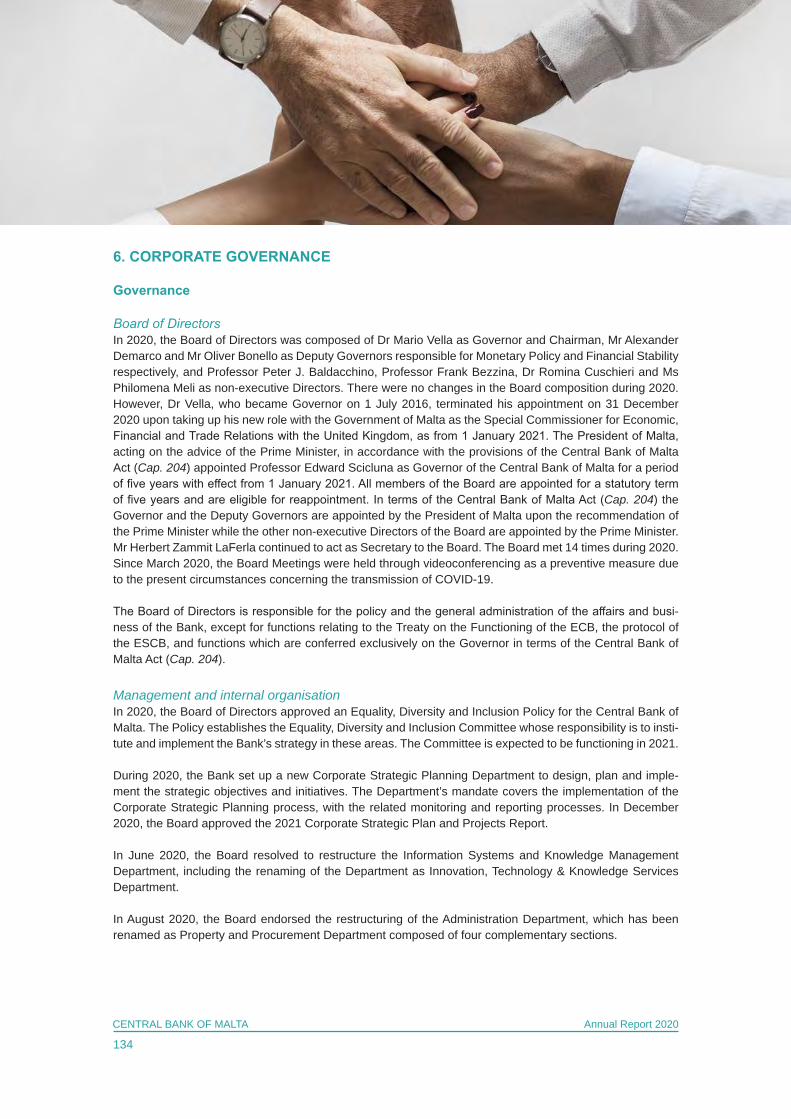
134
CENTRAL BANK OF MALTA Annual Report 2020
6. CORPORATE GOVERNANCE
Governance
Board of Directors In 2020, the Board of Directors was composed of Dr Mario Vella as Governor and Chairman, Mr Alexander Demarco and Mr Oliver Bonello as Deputy Governors responsible for Monetary Policy and Financial Stability respectively, and Professor Peter J. Baldacchino, Professor Frank Bezzina, Dr Romina Cuschieri and Ms Philomena Meli as non-executive Directors. There were no changes in the Board composition during 2020. However, Dr Vella, who became Governor on 1 July 2016, terminated his appointment on 31 December 2020 upon taking up his new role with the Government of Malta as the Special Commissioner for Economic, Financial and Trade Relations with the United Kingdom, as from 1 January 2021. The President of Malta, acting on the advice of the Prime Minister, in accordance with the provisions of the Central Bank of Malta Act (Cap. 204) appointed Professor Edward Scicluna as Governor of the Central Bank of Malta for a period of five years with effect from 1 January 2021. All members of the Board are appointed for a statutory term of five years and are eligible for reappointment. In terms of the Central Bank of Malta Act (Cap. 204) the Governor and the Deputy Governors are appointed by the President of Malta upon the recommendation of the Prime Minister while the other non-executive Directors of the Board are appointed by the Prime Minister. Mr Herbert Zammit LaFerla continued to act as Secretary to the Board. The Board met 14 times during 2020. Since March 2020, the Board Meetings were held through videoconferencing as a preventive measure due to the present circumstances concerning the transmission of COVID-19.
The Board of Directors is responsible for the policy and the general administration of the affairs and busi-ness of the Bank, except for functions relating to the Treaty on the Functioning of the ECB, the protocol of the ESCB, and functions which are conferred exclusively on the Governor in terms of the Central Bank of Malta Act (Cap. 204).
Management and internal organisationIn 2020, the Board of Directors approved an Equality, Diversity and Inclusion Policy for the Central Bank of Malta. The Policy establishes the Equality, Diversity and Inclusion Committee whose responsibility is to insti-tute and implement the Bank’s strategy in these areas. The Committee is expected to be functioning in 2021.
During 2020, the Bank set up a new Corporate Strategic Planning Department to design, plan and imple-ment the strategic objectives and initiatives. The Department’s mandate covers the implementation of the Corporate Strategic Planning process, with the related monitoring and reporting processes. In December 2020, the Board approved the 2021 Corporate Strategic Plan and Projects Report.
In June 2020, the Board resolved to restructure the Information Systems and Knowledge Management Department, including the renaming of the Department as Innovation, Technology & Knowledge Services Department.
In August 2020, the Board endorsed the restructuring of the Administration Department, which has been renamed as Property and Procurement Department composed of four complementary sections.
135
CENTRAL BANK OF MALTA Annual Report 2020
During 2020, the Governor continued to be supported by the Office of the Governor and the two Deputy Governors. The Governor was also directly responsible for the Departments of International Relations and Communications. The Research Department and the Economic Analysis Department, led by the Bank’s Chief Economist, reported to both the Governor and Deputy Governor responsible for Monetary Policy. Internal Audit Department administratively reports to the Governor but functionally to the Audit Committee.
Governor’s activities in Malta In 2020, the Governor served as a member of the Board of Governors of the MFSA and the National Coor-dinating Committee on Combating Money Laundering and Funding of Terrorism. He participated in the pro-ceedings of the MCESD, and the Research, Innovation and Development Trust of the University of Malta.
In 2020, the Governor made the following interventions:
• Presentation, ECB Strategy Review, delivered to the members of the MCESD – 4 December 2020.• Speech Beyond the Pandemic, webinar of the Institute of Financial Services – 10 December 2020.• Presentation, ECB Strategy Review, delivered to the public – 14 December 2020.
In addition, the Governor was interviewed by various news media. The Governor welcomed a number of distinguished guests, including foreign diplomatic representatives.
Audit CommitteeThe Bank’s Audit Committee, which is chaired by Professor Peter J. Baldacchino and includes Professor Frank Bezzina and Dr Romina Cuschieri, convened six times in 2020. During these meetings, the Chief Officer Internal Audit continued to brief Committee members on matters relating to governance issues, the Bank’s risk profile with particular focus on emerging risks, and the adequacy and effectiveness of the design and deployment of controls across the Bank. Progress on the performance of reviews and other exercises identified in the Annual Audit Plan was also provided. The latter was completed with only minor adjustments despite disruptions due to the pandemic. Regular status reports on outstanding audit findings, together with bank-wide, divisional and individual business area audit opinions were also tendered. During the meeting held in July 2020, the Chief Officer Internal Audit tabled the results of an update following the Department’s annual review of its five-year rolling strategic plan.1 This provided a detailed account of the Department’s achievements in working towards full attainment of its areas of strategic focus. The Bank’s external auditors, KPMG, were also invited to attend several Audit Committee meetings.
External AuditorsThe Bank’s external auditors, KPMG, carried out the statutory audit for the financial year ending 31 Decem-ber 2020, expressing their opinion on the financial statements and presenting their Management Letter to the Board.
Internal Audit DepartmentInternal Audit Department kept on providing assurance, mostly through the conduct of risk-based audits, covering a wide selection of the Bank’s operations in line with the approved 2020 Audit Plan. A total of 18 audit engagements were completed, the vast majority of which assessed the effectiveness of governance, risk management, and control and monitoring frameworks embedded in processes across several business areas. In line with methodological developments being introduced gradually, the latter were intended to add value, partly, by diversifying the function’s services portfolio; an opinion on the level of efficiency in the use and deployment of resources in the discharge of the processes reviewed was also provided for each of these audits. This innovative concept was further extended with the performance of two fully-fledged efficiency audits. The Department also conducted audits focusing specifically on areas which are inherently deemed
1 The first five-year rolling strategic plan, covering the years 2019-2023 was originally presented to the Audit Committee in 2019.
136
CENTRAL BANK OF MALTA Annual Report 2020
more susceptible to fraud, as well as a number of financial, projects, compliance and information technology oriented audits.
As a member of the ESCB IAC in Eurosystem, ESCB and SSM compositions, the Internal Audit Department provided the necessary assurances to the ESCB decision-making bodies through the conduct of three IAC audits and ongoing participation in IAC meetings. Moreover, the Department actively engaged in the Audit Task Forces on Information Technology and that of Monetary Policy, Financial Stability and Market Opera-tions, both of which are IAC substructures.
Throughout the year, the internal audit function was involved in consultancy engagements, mainly involving proposed changes by business areas to operational practices. A major redesign of the platform hosting the Bank’s Policies and Procedures database was also undertaken aimed at rendering the site easier to use. The Department pursued its participation in the Compliance Committee, mostly in the capacity of observers in order to preserve its independence and objectivity.
Risk managementThe Risk Committee met six times during 2020. The Committee members focussed on risks related to the Bank’s operations, financial assets under management, the PSPP portfolio, the MGS portfolio and other relevant issues. The various risks identified together with any arising incidents were thoroughly discussed, mitigation measures agreed upon and their implementation monitored.
The third cycle of the Operational Risk Management (ORM) continued during 2020 and is expected to be finalised during the first quarter of 2021. The exercise experienced further delays due to COVID-19. The operational risk status of the various business areas was reported on a regular basis to the Risk Committee.
During 2020, each business area continued with its review of the Business Continuity Plans of critical and important operations. Regular resilience testing was carried out by the business areas on these operations together with the ORM office.
Monthly Investment Policy meetings were held, during which various investment decisions were taken. In addition, performance measurement of assets under management was analysed and compared against the tactical benchmark and the strategic benchmark. The Strategic Asset Allocation exercise for 2021 was finalised and approved by the Governors.
During 2020, the Governing Council approved the ACC framework proposed by the Central Bank of Malta. Under this framework, the Bank will accept credit claims that fall under the MDB CGS. The CGS is part of a wider Government COVID-19 Response Support Programme. Through guarantees provided by the MDB CGS, businesses facing liquidity shortages because of the COVID-19 outbreak have better access to bank financing. The ACC framework is implemented through the Central Bank of Malta’s Directive No. 8 Monetary Policy Instruments and Procedures, effective as from 1 January 2021.
Legal issuesDuring 2020, the Bank’s Legal Department was involved in issuing and amending a number of Central Bank of Malta Directives:
• Central Bank of Malta Directive No. 11 on Macro-Prudential Policy was amended to reflect changes made to the CRDs and Capital Requirements Regulations (CRRs). This Directive sets out the objectives behind macro-prudential policy and the implementation of macro-prudential policy.
• Central Bank of Malta Directive No. 14 on the CCR was updated to include new obligations on the Bank, credit institutions and the MDB in providing and accessing information through the CCR. Other
137
CENTRAL BANK OF MALTA Annual Report 2020
amendments introduced several obligations applicable to CRAs on access to information held on the CCR.
• A new Central Bank of Malta Directive No. 15 on Supervision of CRA was issued on 22 December 2020. This Directive establishes the rules concerning the supervision of CRA licensed under the Trading Licences Regulations (S.L 441.07).
• A new Central Bank of Malta Directive No. 17 on Business Continuity Measures concerning the Deposit and Withdrawal of Cash, Deposit and Encashment of Paper Based Instruments and Provision of Ser-vices through Alternative Delivery Channels was issued on 25 March 2020 and was subsequently amended on 18 May 2020.
• A new Central Bank of Malta Directive No. 18 on Moratoria on Credit Facilities in Exceptional Circum-stances was issued on 13 April 2020. It defines the eligibility criteria and other conditions applicable to the moratorium, that credit and financial institutions established in Malta could grant to borrowers materially affected by the COVID-19 pandemic. This Directive was amended twice during the year, on 23 April and 30 June.
• Central Bank of Malta Directive No. 8 on Monetary Policy Instruments and Procedures was amended to implement the annual update of the General Documentation; as well as Guideline ECB/2020/21 amend-ing Guideline ECB/2014/31 on additional temporary measures relating to Eurosystem refinancing oper-ations and eligibility of collateral; and Guideline ECB/2020/29 amending Guideline ECB/2014/31 on additional temporary measures relating to Eurosystem refinancing operations and eligibility of collateral, adopted by the Governing Council of the ECB in response to the COVID-19 pandemic.
The Governing Council of the ECB decided also to temporarily allow an extension of the ACC frameworks with the possibility for NCBs to include loans backed by COVID-19-related public sector guarantees to cor-porates, small and medium enterprises, self-employed individuals and households. The temporary exten-sion of the ACC frameworks sought to allow the further easing of certain requirements for the acceptance of such loans.
The Bank embarked on the establishment of a new ACC framework for individual credit claims granted by credit institutions in Malta that were accredited by the MDB under the COVID-19 Government Guarantee Scheme. To this effect, the Bank implemented the terms and conditions of the domestic ACC framework, as approved by the Governing Council, through amendments affected to Directive No. 8.
The Bank’s in-house lawyers advised on diverse legal, contractual, and operational matters. The Legal Department continued to provide advisory assistance to business areas in revising the Bank’s policies and procedures, and in the vetting of contracts, agreements and memoranda of understanding entered into by the Bank. Legislative developments impacting the Bank were also thoroughly assessed. The legal team was also involved in legislative measures, including:
• Various amendments were carried out to the Central Bank of Malta Act (Chapter 204 of the Laws of Malta). The first set of amendments to the Act empowered the Bank to act as a supervisory authority of CRAs licensed under the Trading Licences Regulations. Furthermore, the second set of amendments to the Act addressed the need for a legal and regulatory framework to promote the safety and efficiency of the Maltese payments landscape.
• Moratorium on Credit Facilities, in Exceptional Circumstances Regulations, 2020 and Moratorium on Credit Facilities in Exceptional Circumstances (Extension) Regulations, 2020: The aim of these regula-tions is to set out the rules for the provision by credit and financial institutions of a moratorium on credit facilities, to support economically vulnerable persons who have been materially affected by the COVID-19 outbreak.
The legal function was also involved in the provision of legal advice concerning Brexit-related matters through its participation in the Brexit Task Force and through the vetting of contracts involving UK counterparties. An
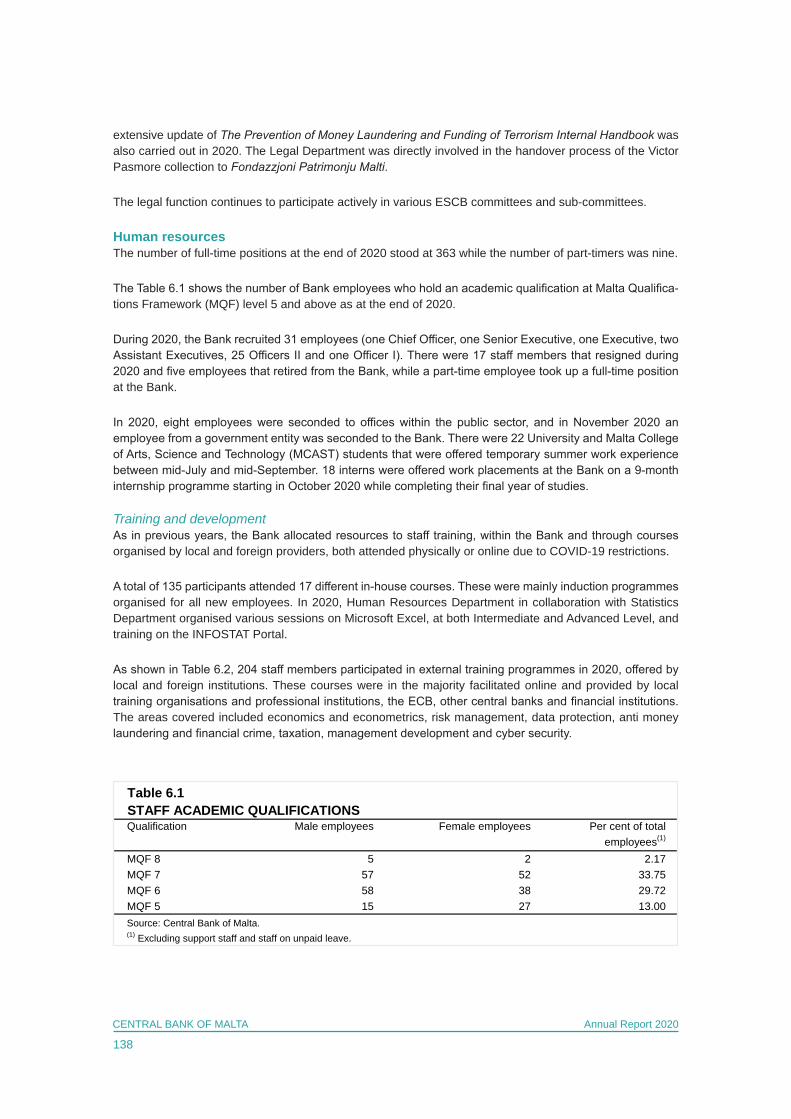
138
CENTRAL BANK OF MALTA Annual Report 2020
extensive update of The Prevention of Money Laundering and Funding of Terrorism Internal Handbook was also carried out in 2020. The Legal Department was directly involved in the handover process of the Victor Pasmore collection to Fondazzjoni Patrimonju Malti.
The legal function continues to participate actively in various ESCB committees and sub-committees.
Human resources The number of full-time positions at the end of 2020 stood at 363 while the number of part-timers was nine.
The Table 6.1 shows the number of Bank employees who hold an academic qualification at Malta Qualifica-tions Framework (MQF) level 5 and above as at the end of 2020.
During 2020, the Bank recruited 31 employees (one Chief Officer, one Senior Executive, one Executive, two Assistant Executives, 25 Officers II and one Officer I). There were 17 staff members that resigned during 2020 and five employees that retired from the Bank, while a part-time employee took up a full-time position at the Bank.
In 2020, eight employees were seconded to offices within the public sector, and in November 2020 an employee from a government entity was seconded to the Bank. There were 22 University and Malta College of Arts, Science and Technology (MCAST) students that were offered temporary summer work experience between mid-July and mid-September. 18 interns were offered work placements at the Bank on a 9-month internship programme starting in October 2020 while completing their final year of studies.
Training and developmentAs in previous years, the Bank allocated resources to staff training, within the Bank and through courses organised by local and foreign providers, both attended physically or online due to COVID-19 restrictions.
A total of 135 participants attended 17 different in-house courses. These were mainly induction programmes organised for all new employees. In 2020, Human Resources Department in collaboration with Statistics Department organised various sessions on Microsoft Excel, at both Intermediate and Advanced Level, and training on the INFOSTAT Portal.
As shown in Table 6.2, 204 staff members participated in external training programmes in 2020, offered by local and foreign institutions. These courses were in the majority facilitated online and provided by local training organisations and professional institutions, the ECB, other central banks and financial institutions. The areas covered included economics and econometrics, risk management, data protection, anti money laundering and financial crime, taxation, management development and cyber security.
Table 6.1
Qualification Male employees Female employees Per cent of total employees(1)
MQF 8 5 2 2.17MQF 7 57 52 33.75MQF 6 58 38 29.72MQF 5 15 27 13.00Source: Central Bank of Malta.(1) Excluding support staff and staff on unpaid leave.
STAFF ACADEMIC QUALIFICATIONS

139
CENTRAL BANK OF MALTA Annual Report 2020
During the year 2020, several employees either completed or con-tinued their programme of studies (see Infographic). Ten staff mem-bers completed their postgraduate education. A staff member who was fully supported by the Bank under its Learning, Research and Development Study Programme successfully completed his doc-torate studies leading to a PhD in Economics from the University of Nottingham. Another employee completed his PhD by publications (Economics) from the University of Portsmouth. Two other employees were supported on a full-time basis to read for Master’s degree pro-grammes in UK universities. A total of 46 employees continued their enrolment in postgraduate degree programmes through distance learning or part-time studies.
During 2020, three employees were awarded a full-time study sponsorship to read a postgraduate course in overseas universities in areas directly related to the Bank, also under the Bank’s Learning Research and Development Study Programme. However, due to the pandemic, two employees opted to postpone their studies for the next academic year. Another employee continued his doctorate studies in social policy on a part-time basis with the University of Bristol supported by the Bank’s development scheme.
In 2020, eight employees successfully completed their studies leading to the MCAST Undergraduate Certifi-cate in Accounting at MQF Level 5. Four other staff members continued their studies to read for the Higher Diploma in Computer Studies. This programme was also specifically designed by the MCAST to meet the Bank’s needs and is expected to be concluded in 2021. The Heading for Leadership programme was not held in 2020. However, the ESCB Task Force on Train-ing and Development pursued its work on a ESCB-wide and SSM-wide Learning & Development Strategy which, following the endorsement of the Human Resources Conference, was approved by the Governing Council in December 2020.
As part of the ongoing commitment to train and keep all staff members updated with policies and procedures of the Central Bank of Malta, the Bank will be launching early in 2021 its Online Training Portal. The portal,
Table 6.2
Type of training Number of courses/seminars
Number of participants
Internal 17 135External Local (physical and online) 82 151 Foreign physical 4 4 Foreign online 33 49Source: Central Bank of Malta.
STAFF TRAINING DURING 2020
ACADEMIC AND PROFESSIONAL COURSES 2020
Completed degrees Ongoing studies
Postgraduate
0 10 20 30 40 50
Undergraduate(Honours)
Diploma/Certificate
10
2
1
46
5
10
Source: Central Bank of Malta.
140
CENTRAL BANK OF MALTA Annual Report 2020
created in collaboration with Chief Operating Officer, Innovation, Technology & Knowledge Services Depart-ment, and Communications Department, is designed to become a repository of training material on major Policies & Procedures and user guides. Staff can benefit from the possibility to perform self-learning and assessment of major Bank’s policies, without the constraint of attending pre-determined training sessions.
Innovation, Technology and Knowledge Services
Innovation and technologyNew organisational challenges combined with digital trends (dynamic business solution, mobility, Cloud, business continuity, etc.) led the Department to propose a tailored structure which would enable the digital transformation of the Bank. The core services offered are now reflected in the new departmental name of Innovation, Technology and Knowledge Services. The mandate of the Department is to enable the digital business process transformation, efficient operations, knowledge-based services and cybersecurity through innovative and effective use of technology and expertise aligned with the Bank’s strategic direction. During the past year, the Bank continued to invest in its information security systems and business applications.
The COVID-19 pandemic prompted the introduction of a new technology to coordinate operational activi-ties. In 2020, the Department revolutionised the remote working services to enable employees to work from anywhere in the same way that they work from the office. The End User Technology & Infrastructure Office embarked on an ambitious programme to deliver a remote working connectivity through laptops, dedicated software and personal mobile devices while also widening the scope of business processes that could be performed remotely. As critical operations were moved to mobile platforms, the Department continued to assess the security posture of the services offered. The Bank partnered with Microsoft to deliver col-laboration tools for communication between employees and third parties thus limiting the need for physical interactions.
The Applications Development and Projects Delivery Office (ADPDO) delivered business value through the re-engineering of processes and the development of applications in areas such as the Centralised Bank Account Register, processing of government payments in SEPA, Collateral Management, interface applica-tion between INFOSTAT and the MFSA, preparatory works to onboard Credit Rating Agencies on the CCR and the introduction of machine learning projects. The team continued to train staff on new technology and programming languages to better support new business requirements. In 2021, ADPDO will be increasing its applications’ portfolio and managing projects to support the Bank’s deployment of additional value-added services through innovative technology.
The Core Applications Office ensured minimal downtime of all critical applications. The team is a key part-ner in the implementation of the new digital payment platform, aligned with the ISO 20022 standards. This initiative, supported by the Change Advisory Board, has been delivered through a dedicated programme. The first project milestone went live in March 2020 with the implementation of SEPA credit transfer services. Additional projects delivered during the past year were the SEPA direct debit services and the onboarding of indirect participants. The SWIFT system was further strengthened with the latest security updates and its channels migrated onto an enhanced platform in line with the recommendations established by the SWIFT security controls framework. The payroll and human resources systems have been migrated to a new plat-form with the aim of consolidating work practices and to decommission legacy technology.
The Cybersecurity Office was reinforced to monitor effectively the daily security events. The team introduced an AI-based network monitoring tool to improve its detection and alerting capability. The Cybersecurity Committee periodically reviewed the new trends in the cybersecurity landscape and monitored the work programme to assess developments in the Bank’s cybersecurity posture.
Several members of the Department are involved in ESCB’ technology-related committees and work groups. The latter enable local experts to coordinate the ESCB related activities on a local scale, covering IT network
141
CENTRAL BANK OF MALTA Annual Report 2020
operations, security operations and applications development. Furthermore, Information Technology experts participated in a TARGET work group to coordinate NCBs’ contributions to Cyber Resilience and Information Security topics.
The LibraryThe Central Bank of Malta Library aims to excel as Malta’s principal facilitator of financial, economic and social research, and to support and promote scholarly debate and dissemination of scientific knowledge in these fields. Since the Library’s establishment back in 1968, a substantial collection of standard works on economics and finance has been put together. The Library contains more than 13,000 volumes with almost 150 new titles added during the past year. In September, the banking historian John A. Consiglio donated a selection of his books to the Central Bank of Malta. The selection includes some hard-to-find volumes on banking history which complemented the Bank’s extensive Library collection.
The Library subscribes to various specialised academic journals. Moreover, the Library uses the database Business Source Complete which provides premium full-text content and peer-reviewed business journals. The Business Book Summaries is another useful tool which offers concise yet comprehensive summaries of the best business books.
In addition, the Bank’s Library facilitated the uploading of working paper series on EconStor, a publication service for economic literature provided by the ZBW – Leibniz Information Centre for Economics. EconStor is one of the largest repositories of economics studies with over 180,000 full-text documents available. The Library participated for the third time in the National Book Festival and in the 11th European System of Cen-tral Banks/SSM Meeting on Information Management.
Knowledge ServicesThe mission of the Knowledge Services team is to capture, manage, preserve, store and deliver the right information to the right people at the right time. The main activity consists of scanning, uploading and cata-loguing documents on to Microsoft SharePoint, and handling of requests for information.
The Knowledge Services staff uploaded more than 600 new policy documents in the Bank’s system together with relative metadata.
Corporate Strategic Planning The Corporate Strategic Planning Process is composed of five steps: strategy definition; identification of objectives and key performance indicators; project portfolio creation; budgeting; prioritisation of objectives and projects and approval of the plan. The projects were selected according to an agreed prioritisation framework. The planning process was achieved internally through several workshops with the Governors, Heads of Departments and Office Managers.
This planning process led to the creation of a Corporate Strategic Plan, presenting the Bank’s new vision statement, most important objectives and projects for 2021 and beyond. The plan ensures the strategic objectives are translated into divisional, departmental and office objectives, in line with the Bank’s organisa-tional structure. The Bank’s strategic objectives are grouped into eight building blocks:
1. Ensure active contribution to the ESCB, support its drives and initiatives while participating in its fora and activities.
2. Foster financial stability by strengthening the resilience of the domestic financial sector.3. Ensure a smooth functioning payment system and a secure provision of cash.4. Continue to be a reference for economic, financial and social analysis, research, and statistics in Malta.5. Optimise returns on financial assets under the Bank’s management.
142
CENTRAL BANK OF MALTA Annual Report 2020
6. Enhance risk mitigation and security measures, especially with respect to cybersecurity.7. Maintain strong internal governance, in full compliance with the law.8. Enhance overall efficiency and effectiveness, while actively promoting environmental awareness, CSR,
inclusiveness and diversity.
During 2021, the Department will monitor the implementation of the Corporate Strategic Plan, assist all Departments with the periodical reporting on the progress of their respective projects and objectives, and will coordinate any change that may be required.
Property and procurementNew organisational challenges led the Bank to reorganise the former Administration Department into a new Property and Procurement Department to better support the needs of the Bank’s Divisions. The new man-date of the Department is to assist the Bank in achieving its objectives. This is achieved through the commit-ment to a safe, effective and efficient management and maintenance of the Bank’s premises, the property management project services and appropriate procurement of goods, services and insurance coverage, and the guarantee of a proper and accountable use of public funds taking into account cost effectiveness considerations.
During most of 2020, the Bank was focused on the adoption of measures to mitigate the effects of the COVID-19 pandemic. As a result, there was a substantial investment from the Property and Procurement Department to ensure a healthy and safe environment for Bank staff. This included the redesign of office layouts in accordance with guidelines issued by the Health Authorities, the increase of daily cleansing and disinfection services, and the procurement of sanitisation services and various health-related items such as masks, visors, gloves, sanitiser dispensers and acrylic shields. The Bank pursued its programme of maintenance, upgrading and embellishment works, complying with the restrictions imposed by the pandemic mitigation measures. The most important project was the replacement of the heating, ventilation and air conditioning (HVAC) systems in Binja Ġlormu Cassar which commenced during the year and will be finalised in 2021. The new energy-efficient HVAC system is designed to optimise performance and to support the Bank to reduce its ecological footprint. This project also involves the replace-ment of suspended ceilings, soundproofing works and the installation of a new cabling infrastructure. The Department also implemented the installation of an audio-visual system for the Laparelli conference facili-ties, a new external steel staircase, enhanced parking controls and increased security measures around the Bank’s premises.
Regarding procurement, the Bank issued 25 calls for quotations and three calls for tenders. The tenders were related to removal services, coin minting and cleaning services. Following the adoption in 2019 of the Electronic Public Procurement System for Tenders, the Department introduced the electronic submission of quotations in 2020 with the aim of introducing an environment-friendly measure and achieving greater efficiency while complying with social distancing.
To further reduce its ecological footprint, in 2020, the Bank continued with its recycling exercises and sent for recycling 9 tonnes of paper and 1.8 tonnes of plastic.
During 2020, the Department streamlined its processes to achieve efficiencies and continued to participate in the ESCB’ Heads of Administration Conference, exchanging best practices on procurement, property management services and pandemic mitigation measures across European Union central banks.
The Bank continued to be an active participant in initiatives coordinated by the Eurosystem Procurement Coordination Office, which enables Eurosystem and ESCB members to benefit from efficiencies in joint pro-curement exercises, primarily in the areas of hardware, software, rating agency services and market data

143
CENTRAL BANK OF MALTA Annual Report 2020
provision. As part of a joint initiative undertaken during 2020, the Bank selected a service provider, in terms of an ECB Framework Agreement for the provision of connectivity services, related to the Eurosystem Single Market Infrastructure Gateway.
Information and public relations
Publications and websiteDuring 2020, the publications section of the Department was responsible for preparing and uploading the Bank’s official publications. The demand for printed copies of the Bank’s Annual Report and Financial Stability Report has been declining as more users opted for the digital version. Indeed, for some time, the Interim Financial Stability Report, Quarterly Reviews, monthly Economic Updates and Economic Projections have only been available in digital format, as these provide content that is easier to search, apart from reducing the Bank’s environmental footprint. In 2020, all subscribers who still receive printed copies were given the option to switch to copies in digital format, with institutions also being asked on the number of printed copies they require. As a result, copies needing to be printed and posted dropped substantially, saving considerably on our carbon footprint.
In 2020, the Bank initiated work to refresh its website, including its look-and-feel, its navigation and con-tent. The focus was put more on the user experience, and sections have been streamlined, placed into a more logical framework and made more user-friendly. This work is ongoing and the scrutiny has led to new features and functions, which will continue to be rolled out in 2021. Furthermore, work is also underway, in collaboration with the Malta Communications Authority, to make the website more accessible in line with the Website Accessibility Directive.
The Department is also offering more graphic design support to the various business units, creating multime-dia content, including videos and posters with strong brand recognition. This will continue over the coming months, complementing the Bank’s increasing presence on social media platforms.
Events managementBy early 2020, it had become clear that ‘physical’ events would be curtailed due to COVID-19. However, technology ensured that the Bank did not have to abandon its planned series of public lectures. Several events were held virtually over the second half of 2020, ranging from the Library lectures on social and cultural themes, to ones with eco-nomic content. Recordings, where applicable and approved, are also being uploaded onto the Bank’s website, making these events even more accessible, not only to an audience in Malta but also over-seas.
MediaThe public relations section con-tinued to tap into opportunities offered by magazines and publica-tions, focussing on a wide range of the Bank’s operations, from its financial literacy programme and CSR activity to its research output. In 2020, 74 communications were sent out to the media, resulting in
PRESS RELEASES
Source: Central Bank of Malta.
144
CENTRAL BANK OF MALTA Annual Report 2020
a publication rate of 2.6 mentions per item in print and online. These were also uploaded onto LinkedIn and Twitter and received over 160,000 views on the former platform alone.
During the pandemic, every effort was also made to reach out to the public with multimedia messages regarding ‘payee only’ cheques and the moratoria on loans via the Bank’s website and social media chan-nels. Informative interviews on radio and television stations were also organised.
Interaction with the public was maintained throughout the lockdown on several topics, complementing the stream of queries normally handled by the unit.
Social mediaThe Bank’s LinkedIn account was activated in mid-October 2019 and reached 4,000 followers by the end of 2020 – a threefold increase. In the meantime, the number of Twitter followers increased by 46 per cent, reaching over 1,318. The Bank also introduced a Facebook page, originally intended to publicise its events. However, the reach of social media proved invaluable during COVID-19 when the page could be used for important announcements of public interest. The page had 844 regular followers at year-end and has been able to leverage its presence to reach tens of thousands of people when the need arose. The Bank also signed up for Instagram in July and has posted regularly since then, accumulating 180 followers, focussing on people-centric posts highlighting the Bank’s role as an employer.
145
CENTRAL BANK OF MALTA Annual Report 2020
7. INTERNATIONAL RELATIONS
During 2020, the Central Bank of Malta maintained active its relations with international financial institutions to which it is affiliated.
Eurosystem and ESCBThe Governor is a member of the Governing Council, which is the highest decision-making body of the ECB. The Governing Council is made up of the members of the ECB’s Executive Board and NCBs’ Governors of the euro area Member States. The Governing Council is responsible for monetary policy in the euro area and decides on the implementation of tasks entrusted to the Eurosystem, which comprises the ECB and euro area NCBs.
During 2020, the Governing Council held 26 meetings, with 10 being focused on monetary policy. Owing to the COVID-19 pandemic, most meetings were conducted by teleconference or videoconference. Fur-thermore, a significant number of Governing Council decisions were taken through written procedure. Moreover, in connection with the ECB’s responsibilities in banking supervision, the Governing Council approved numerous draft supervisory decisions prepared by the ECB’s Supervisory Board. The Govern-ing Council also held several seminars on a range of issues, including the ECB’s monetary policy strategy review.
The Governor is also a member of the General Council of the ECB. The General Council, which is made up of the President and Vice-President of the ECB and the Governors of the NCBs of all the Member States of the European Union, mainly performs an advisory role. There were four General Council meetings in 2020.
The Governor or, in his absence, a Deputy Governor, participated in the two sessions dedicated to the Mac-roprudential Forum held jointly by the Governing Council and the ECB’s Supervisory Board during 2020.
Furthermore, the Deputy Governor for Financial Stability sits on the ECB’s Supervisory Board together with the Chief Executive Officer of the MFSA.
Following several decisions taken by the Governing Council, during 2020 the Governor signed a number of agreements on behalf of the Bank. More specifically, these agreements covered the realisation phase of the T2-T2S consolidation project, the Level 2 - Level 3 agreement on T2S, the TARGET2 simulator, the Common Eurosystem Pricing Hub, the Eurosystem Collateral Management System, the provision of TIPS service in Swedish krona and the organisation of the production of the second series of euro banknotes. In addition, the Governor signed a memorandum of understanding on joint controllership for the use of personal data in the context of the operation of ESCB-Information Technology shared services.
The Governing Council and the General Council are supported by a number of committees, working groups and other structures, in which various Bank officials participated actively throughout the year. These officials play a key role in briefing the Governor on issues to be discussed in meetings of both the Governing Council and the General Council. Moreover, they give feedback on written procedures addressed to the Governing Council and the General Council.
146
CENTRAL BANK OF MALTA Annual Report 2020
ESRBIn 2020, the Governor and the Deputy Governor for Financial Stability took part in the meetings of the Euro-pean Systemic Risk Board’s General Board where various issues on potential vulnerabilities and risks within the EU financial system and potential policy measures were discussed. Senior officials of the Bank also participated in meetings of the ESRB’s Advisory Technical Committee and its substructures.
The ESRB continued to publish its risk dashboard and working papers to increase awareness and stimulate public debate on macroprudential matters.
Other EU institutionsDuring 2020, the Deputy Governor for Monetary Policy regularly participated in meetings of the EFC when issues relevant to central banks were discussed.1
During the year, the Bank engaged in EFC discussions on matters related to the developments in financial markets and the regular monitoring of risks to financial stability in the European Union prior to the formula-tion of appropriate policy responses. Strengthening of the Banking Union, the completion of the Capital Markets Union, the AML Action Plan and digital finance continued to be topics of discussion, not least the associated consequences of the COVID-19 pandemic.
The EFC continued to play a crucial role in the preparation of common European positions at the G-20 meetings and other international fora, such as the IMF and the Financial Stability Board.
Other Bank officials also participated in meetings of several EFC sub-committees, where matters of rel-evance to central banks, such as sovereign debt, the impact of the COVID-19 pandemic and IMF-related topics were discussed.
The Deputy Governor for Financial Stability together with the representative from the MFSA sits on the EBA Board of Supervisors.
Apart from participating in the EFC and its sub-structures, Bank staff took part in several other EU com-mittee structures related to central banking functions. In addition, the Bank pursued its extensive contribu-tion, through consultations on matters of an economic and financial nature, to the participation of Malta’s representatives in various EU decision-making bodies. European Bank for Reconstruction and DevelopmentIn view that the Governor of the Central Bank of Malta was Alternate Governor for Malta on the Board of Governors of the European Bank for Reconstruction and Development (EBRD) during the year,2 the Bank continued to collaborate closely with the Ministry for Finance on issues related to Malta’s membership in this institution. In particular, the Bank provided advice to the Ministry on various resolutions, which required decisions by the EBRD’s Board of Governors.
Considering the outbreak of the COVID-19 pandemic, the 2020 EBRD Annual Meeting was postponed from May to October and conducted virtually. The Minister for Finance was accompanied by the Deputy
Governor for Monetary Policy. During the Annual Meeting, the Governors discussed the election of the new EBRD President, upon the conclusion of which Ms Odile Renaud-Basso was elected to the post. Another element of the Annual Meeting was the Strategic and Capital Framework for the upcoming five years and the way the Bank can act as a strong and reliable partner during uncertain times. Both the 2020 Annual Business Forum and the constituency meeting were cancelled.
1 In view of the COVID-19 pandemic, during 2020, most of these meetings were held in virtual format via teleconferences.2 As of January 2021, the Governor of the Central Bank of Malta acts as Malta’s Governor on the Board of Governors of the EBRD, while the Minister for Finance is the Alternate Governor.

147
CENTRAL BANK OF MALTA Annual Report 2020
In March 2020, an election for EBRD Directors was held, with Mr Leander Treppel being successfully elected as the Director for Malta’s constituency.
IMFIn the IMF, Malta forms part of a constituency headed by Italy and which includes Albania, Greece, Portugal and San Marino. In 2020, Domenico Fanizza was re-elected as the Executive Director heading the constitu-ency.
In February, the Bank’s Deputy Governor for Monetary Policy substituted for the Minister for Finance, in his capacity as Malta’s Governor on the Board of Governors of the Fund, to attend the joint IMF and World Bank Group Constituency meeting in Athens. The Minister for Finance participated in the virtual Spring IMF and World Bank Group Meetings in April and the Annual Meetings in October, being accompanied on both occa-sions by the Deputy Governor for Monetary Policy.3 During the year, the Central Bank of Malta advised the Ministry for Finance on several resolutions proposed by the Fund’s Executive Board.
In February 2020, IMF staff members conducted a visit in connection with the 2020 Article IV consultation. The Fund’s mission held meetings with senior officials of the Central Bank of Malta, the Government, the MFSA and other entities. The consultation was concluded on 8 April 2020.
During 2020, Malta’s net cumulative allocation of Special Drawing Rights (SDRs), which is computed in proportion to its quota share, remained unchanged at SDR95.4 million. The Bank’s SDR holdings remained broadly unchanged at SDR87.5 million.
The Bank also continued to carry out transactions related to the IMF’s operational budget. During 2020, Malta’s reserve tranche position increased by SDR9 million on a year earlier to SDR40.7 million on account of new drawings under the Financial Transaction Plan.4 Correspondingly the Fund’s holdings of the national currency with the Bank decreased to the equivalent of SDR127.7 million by the end of the year from SDR136.7 million a year earlier.5
In 2020, Malta pledged to contribute SDR0.165 million in support of the comprehensive debt-relief to Soma-lia under the IMF-World Bank’s Heavily Indebted Poor Countries initiative.6 Malta also made a one-time contribution of USD 0.8 million to the Catastrophe Containment and Relief Trust as part of the IMF’s efforts to assist low-income countries severely affected by the COVID-19 pandemic.7
In September 2017, a bilateral loan agreement between the Bank and the Fund was endorsed by the Governor. The loan was for a SDR-denominated amount of up to the equivalent of €260.0 million, the amount being the same as that for the previous loan agreement which had expired in January 2017. In July 2019, the Central Bank of Malta agreed to the extension of the bilateral loan agreement for a further year up to 31 December 2020, at which point the agreement expired. No drawings were affected under the loan agreement.
In January 2021, a new bilateral loan agreement between the Central Bank of Malta and the IMF was final-ised. As per the agreement, the original SDR-denominated loan amount of €260.0 million was lowered to
3 As of January 2021, the Governor of the Central Bank of Malta acts as Malta’s Governor on the Board of Governors of the IMF, while the Minister for Finance is the Alternate Governor.4 The Financial Transactions Plan is the mechanism through which the Fund finances its lending and repayment operations in the IMF’s principal account. 5 Figures for the reserve tranche position and the Fund’s holdings of national currency do not add up to SDR168.3 million (quota) due to rounding.6 The joint IMF-World Bank comprehensive approach to debt reduction under the Heavily Indebted Poor Countries initiative is designed to ensure that no poor country faces a debt burden it cannot manage.7 The Catastrophe Containment and Relief Trust allows the IMF to provide grants for debt relief for the poorest and most vulnerable countries hit by catastrophic natural disasters or public health disasters.
148
CENTRAL BANK OF MALTA Annual Report 2020
€112.0 million upon the activation of the New Arrangements to Borrow. The current loan agreement will run until December 2023 and may be extended for an additional year.
World Bank GroupAlthough Malta is represented in the World Bank Group by the Minister for Finance, throughout the year the Bank continued to assist the Ministry in monitoring developments within the World Bank Group and providing advice on particular initiatives from the Group. During 2020, the Bank provided the Ministry with background documentation and recommendations on various resolutions that required to be voted upon.
Asian Infrastructure Investment Bank The Bank, together with the Ministry for Finance, started monitoring developments in the Asian Infrastructure Investment Bank (AIIB) following the acceptance of the instrument of ratification for Malta in January 2016. The Maltese Parliament had approved the ratification of the articles of agreement which establish the AIIB as an international organisation in December 2015.
During 2020 Malta was represented on the AIIB’s Board of Governors by the Minister for Finance, with the Governor of the Central Bank of Malta as the Alternate Governor.8 Malta forms part of the euro area con-stituency which also includes Austria, Belgium, Cyprus, Finland, France, Germany, Greece, Ireland, Italy, Luxembourg, the Netherlands, Portugal and Spain.
In 2020, the Bank advised the Ministry for Finance on AIIB resolutions related to the formation and adminis-tration of the recently set up AIIB including applications for new membership and its presidential election. Mr Jin Liqun was confirmed as President of the AIIB for a second term.
In 2020, several constituency meetings were also held, on which occasions Malta was represented by officials from the Ministry for Finance with the support of the Bank. The AIIB Annual Meeting, originally scheduled to take place in Beijing between 2 and 3 July 2020, was held virtually on 28 July 2020. Malta was represented by the Minister for Finance, accompanied by the Deputy Governor for Monetary Policy.
Commonwealth Small States Trade Finance FacilityThe Bank continued to support efforts to establish a trade finance facility for the small states of the Com-monwealth by providing banking services. The Commonwealth Small States Trade Finance Facility was set up to enhance trade and investment finance particularly for small and vulnerable Commonwealth States with limited access to international trade finance.
Other international institutionsThe Bank continued to monitor developments related to the exit of the United Kingdom from the European Union, with a particular emphasis on the economic and financial implications of Brexit.
Non-ESCB, Bilateral and Commonwealth Relations Office During 2020, the Non-ESCB, Bilateral and Commonwealth Relations Office of the International Relations Department was involved in numerous projects.
• International sanctions on IranThe Office prepared a document providing updated information on the international sanctions against Iran. The report outlines the framework of US sanctions, the different sanctions imposed against Iran, the impact of the sanctions on Iran’s economy, and possible further developments.
8 As of January 2021, the Governor of the Central Bank of Malta acts as Malta’s Governor on the Board of Governors of the AIIB, while the Minister for Finance is the Alternate Governor.

149
CENTRAL BANK OF MALTA Annual Report 2020
• The impact of COVID-19 on oil pricesAt the onset of the COVID-19 pandemic in China, the Office compiled a report on the impact of the outbreak on oil prices, the reaction of oil producers and the impact on the global economy.
• COVID-19 developmentsThe focus of the Office during 2020 was the ongoing COVID-19 pandemic. A series of reports were prepared regarding COVID-19 developments in EU Member States, as well as selected non-EU coun-tries. These reports provided extensive and up-to-date information on the epidemiological and fiscal measures taken by countries to tackle the COVID-19 pandemic, as well as the economic and financial implications of the ongoing pandemic on these countries. The following reports were completed and distributed for internal use throughout the year:
○ COVID-19 pandemic measures taken by EU Member States; ○ Easing of COVID-19 pandemic measures by EU Member States; ○ COVID-19 pandemic measures and easing of measures in non-EU countries; ○ Update: Easing of COVID-19 pandemic measures by EU Member States; ○ COVID-19 in Latin America: the new “epicentre”?; ○ The COVID-19 pandemic in Mediterranean littoral non-EU countries; ○ The COVID-19 pandemic in selected African countries; ○ The reintroduction of COVID-19 pandemic measures in EU Member States and the United Kingdom; ○ Towards lockdowns in EU Member States and the United Kingdom.
In addition, the Office prepared regular presentations regarding COVID-19 epidemiological develop-ments which were delivered to the IPC.
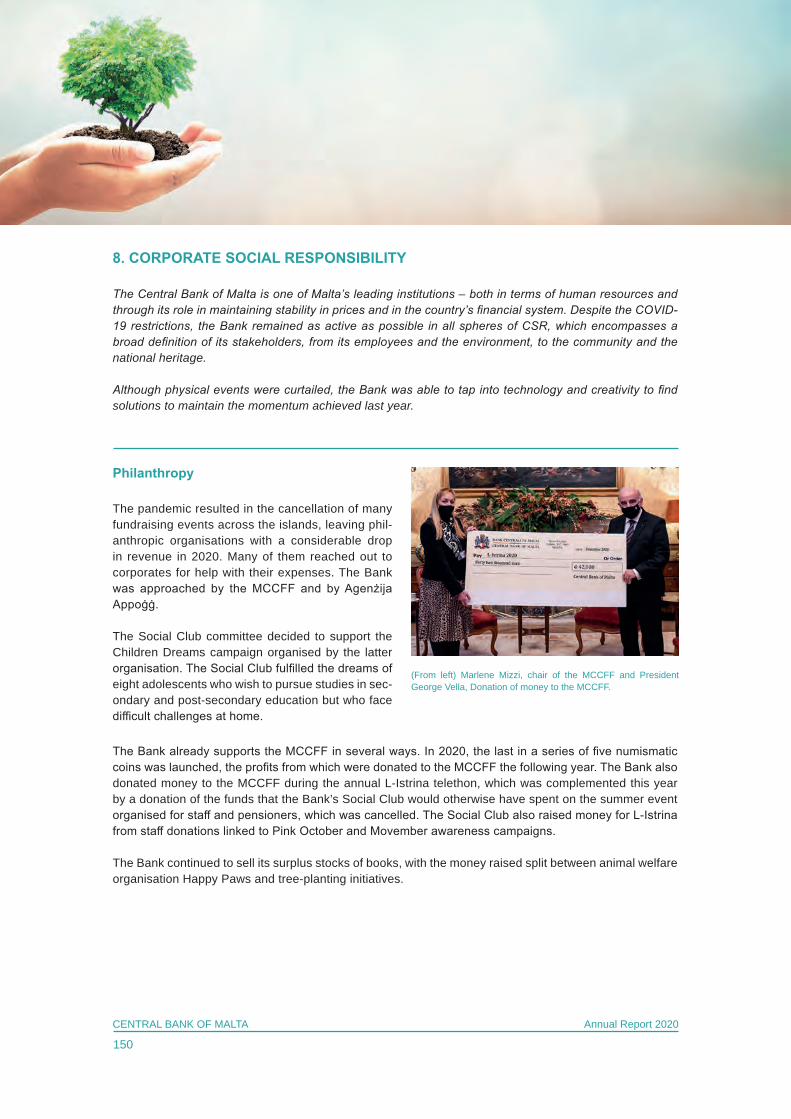
150
CENTRAL BANK OF MALTA Annual Report 2020
8. CORPORATE SOCIAL RESPONSIBILITY
The Central Bank of Malta is one of Malta’s leading institutions – both in terms of human resources and through its role in maintaining stability in prices and in the country’s financial system. Despite the COVID- 19 restrictions, the Bank remained as active as possible in all spheres of CSR, which encompasses a broad definition of its stakeholders, from its employees and the environment, to the community and the national heritage.
Although physical events were curtailed, the Bank was able to tap into technology and creativity to find solutions to maintain the momentum achieved last year.
Philanthropy
The pandemic resulted in the cancellation of many fundraising events across the islands, leaving phil- anthropic organisations with a considerable drop in revenue in 2020. Many of them reached out to corporates for help with their expenses. The Bank was approached by the MCCFF and by Agenżija Appoġġ.
The Social Club committee decided to support the Children Dreams campaign organised by the latter organisation. The Social Club fulfilled the dreams of eight adolescents who wish to pursue studies in sec- ondary and post-secondary education but who face difficult challenges at home.
The Bank already supports the MCCFF in several ways. In 2020, the last in a series of five numismatic coins was launched, the profits from which were donated to the MCCFF the following year. The Bank also donated money to the MCCFF during the annual L-Istrina telethon, which was complemented this year by a donation of the funds that the Bank’s Social Club would otherwise have spent on the summer event organised for staff and pensioners, which was cancelled. The Social Club also raised money for L-Istrina from staff donations linked to Pink October and Movember awareness campaigns.
The Bank continued to sell its surplus stocks of books, with the money raised split between animal welfareorganisation Happy Paws and tree-planting initiatives.
(From left) Marlene Mizzi, chair of the MCCFF and President George Vella, Donation of money to the MCCFF.
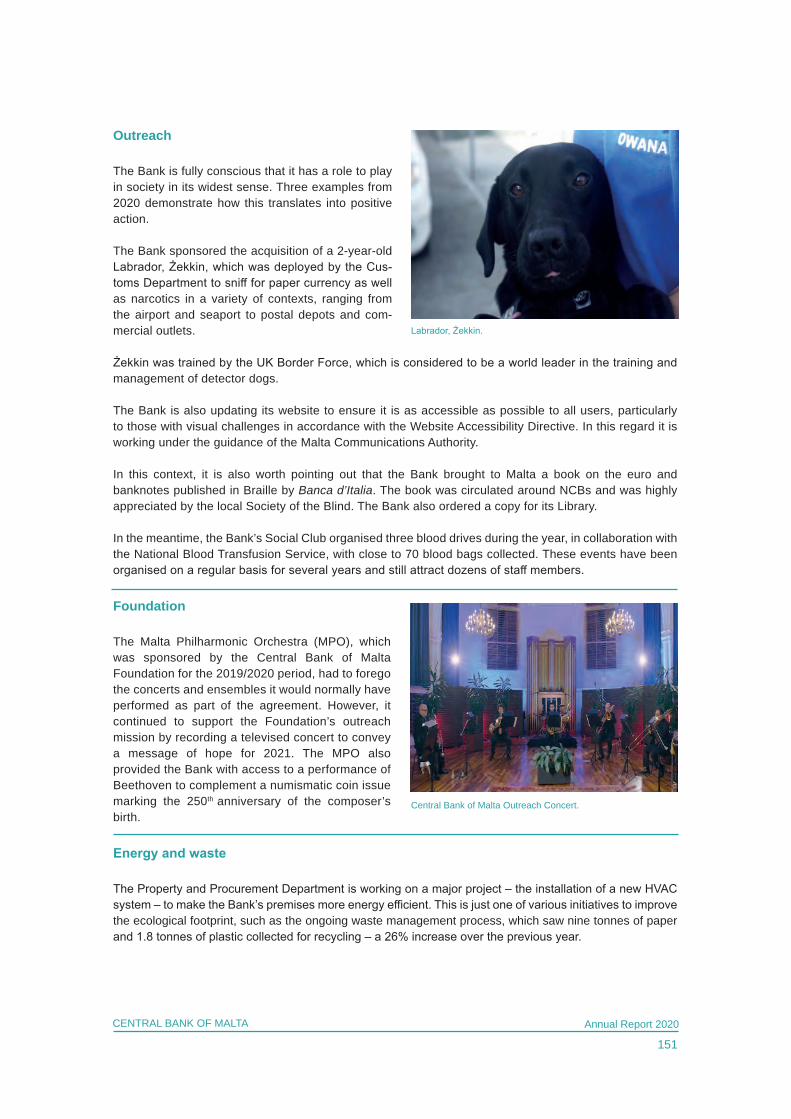
151
CENTRAL BANK OF MALTA Annual Report 2020
Outreach
The Bank is fully conscious that it has a role to play in society in its widest sense. Three examples from 2020 demonstrate how this translates into positive action.
The Bank sponsored the acquisition of a 2-year-old Labrador, Żekkin, which was deployed by the Cus- toms Department to sniff for paper currency as well as narcotics in a variety of contexts, ranging from the airport and seaport to postal depots and com- mercial outlets.
Żekkin was trained by the UK Border Force, which is considered to be a world leader in the training and management of detector dogs.
The Bank is also updating its website to ensure it is as accessible as possible to all users, particularly to those with visual challenges in accordance with the Website Accessibility Directive. In this regard it is working under the guidance of the Malta Communications Authority.
In this context, it is also worth pointing out that the Bank brought to Malta a book on the euro and banknotes published in Braille by Banca d’Italia. The book was circulated around NCBs and was highly appreciated by the local Society of the Blind. The Bank also ordered a copy for its Library.
In the meantime, the Bank’s Social Club organised three blood drives during the year, in collaboration with the National Blood Transfusion Service, with close to 70 blood bags collected. These events have been organised on a regular basis for several years and still attract dozens of staff members.
Foundation
The Malta Philharmonic Orchestra (MPO), which was sponsored by the Central Bank of Malta Foundation for the 2019/2020 period, had to forego the concerts and ensembles it would normally have performed as part of the agreement. However, it continued to support the Foundation’s outreach mission by recording a televised concert to convey a message of hope for 2021. The MPO also provided the Bank with access to a performance of Beethoven to complement a numismatic coin issue marking the 250th anniversary of the composer’s birth.
Energy and waste
The Property and Procurement Department is working on a major project – the installation of a new HVAC system – to make the Bank’s premises more energy efficient. This is just one of various initiatives to improve the ecological footprint, such as the ongoing waste management process, which saw nine tonnes of paper and 1.8 tonnes of plastic collected for recycling – a 26% increase over the previous year.
Labrador, Żekkin.
Central Bank of Malta Outreach Concert.

152
CENTRAL BANK OF MALTA Annual Report 2020
COVID-19 affected not only leisure trips but also official travel and overseas staff training events. The Bank experienced an 89% reduction in work-related overseas trips. The drop in travel had a considerable environmental benefit: the dip in the carbon footprint represented by these trips was around 250 metric tons of carbon dioxide. According to ConserveNaturalForests.org, this would equate to the amount absorbed from the air by over 11,000 mature trees.
Online meetings replaced most of these trips and the Bank will carefully reconsider its travel policy going forward.
Financial Literacy
The Central Bank of Malta is very keen to raise the level of financial literacy and has a very active out- reach programme run by the Currency Unit as well as educational visits to the premises, which were unfortunately curtailed this year. However, it col-laborated with government agency ĠEMMA to pro-duce videos aimed at promoting financial capabil-ity. These cover topics such as using credit cards and budgeting for everyday as well as for special expenditure, saving for a rainy day, and planning for retirement.
ĠEMMA was set up in January 2019, following a strategy launched in 2017 aimed at promoting better awareness about retirement income and financial capability.
The videos are available online at https://gemma.gov.mt/videos/
Reduction of 89% in the number of staff trips.
ĠEMMA produced videos aimed at promoting financial capability.

153
CENTRAL BANK OF MALTA Annual Report 2020
PUBLIC EVENTS 2020
2 JUNE 2020
LIBRARY
Conservation expert Theresa Zammit Lupi gave the Bank’s first virtual lecture, about a collection of illuminated liturgical manu-scripts found in the Conventual church of St John: the 1533 L’Isle Adam’s Graduals. One of the illuminated letters from the manuscripts was chosen by the Bank’s Malta Coin Centre as the design for the first numismatic coin released in 2020.
Dr Zammit Lupi made the manuscript collection the subject of her doctoral thesis and published her findings in a book in 2011 for Fondazzjoni Patrimonju Malti, entitled Cantate Domino: Early Choir Books for the Knights in Malta.
24 JUNE 2020
LIBRARY
Dr Mario Saliba delivered a virtual public lecture about the 1918/19 Influenza Pandemic in Malta, the so-called Spanish Flu.
The Spanish Flu wreaked unprecedented havoc and killed over 40 million people around the world – more than the number killed during World War I.
Three waves hit Malta and Gozo over a period of nine months. Dr Saliba’s research showed that 5.62% of the population in Malta and 9.41% of that in Gozo contracted the disease. Around 16,000 cases were reported, but the influenza probably affected some 50,000 persons. The death toll reached 1,000, one in ten of which were recorded in Gozo.
14 SEPTEMBER 2020
ECONOMICS
Michele Napolitano, head of the Western European sovereign team at Fitch Ratings, discussed Fitch’s approach to sovereign ratings in the difficult context of the COVID-19 pandemic.
He noted that there were signs that April marked the trough of the recession in Western Europe and that a recovery was on the way – although the resurgence of the virus in some countries made the picture asymmetric and highly uncertain. The sharp fall in eco-nomic activity and the policy response imply a marked deteriora-tion in public finances, which has put western European sovereign ratings under some pressure.
154
CENTRAL BANK OF MALTA Annual Report 2020
26 OCTOBER 2020
LIBRARY
Former banker John Cassar White delivered a webinar on the future of retail banking after COVID-19, drawing on his decades of banking experience to provide insight into this important question. He also used the opportunity to showcase some of the important work done by banking historian John Consiglio.
Mr Cassar White recently reviewed Mr Consiglio’s recent Insights on Financial Services Regulation, a book that analyses developments in the regulatory sector.
20 NOVEMBER 2020
ECONOMICS
A presentation on the refugee crisis in Europe, entitled ‘Border policies and unauthorised flows’ was the keynote speech at an online workshop organised by the Bank to launch its annual Research Bulletin. The presentation was given by Francesco Fasani, an associate professor at the School of Economics and Finance, QMUL.
Bank researcher Germano Ruisi also gave a presentation – on the macroeconomic implications of foreign labour supply shocks in Malta.
14 DECEMBER 2020
COMMUNICATIONS
Last January, the Governing Council of the ECB launched a review of its monetary policy strategy. The ECB, together with the central banks of the euro area, set out to engage with a variety of stakeholders. As part of this outreach initiative, the Central Bank of Malta organised two virtual listening events: one for the members of the MCESD; and one for the public and civil society groups.
There was a brief explanatory presentation delivered by the Bank, including excerpts from the ECB’s own Listening Event. However, most of the session was left for audience interventions. The Bank also set up a dedicated email address for all those who wanted to submit their feedback in writing. The feedback received from stakeholders was analysed and summarised by the Bank and sent to the ECB, to provide input to the deliberations of the Governing Council.

III. Financial Statements
CENTRAL BANK OF MALTA
A-2
Financial Statements for the year ended 31 December 2020
Directors’ report
The Directors present their report and the audited financial statements of the Central Bank of Malta (the Bank) for the year ended 31 December 2020.
Presentation of the financial statementsThese financial statements have been prepared so as to give a true and fair view of the state of affairs of the Bank as at 31 December 2020, and of its profit for the year then ended. The financial statements have been prepared in accordance with the provisions established by the Governing Council of the European Central Bank under Article 26.4 of the Statute of the European System of Central Banks and of the European Cen-tral Bank and in accordance with the requirements of the Central Bank of Malta Act (Cap. 204). The provi-sions established by the Governing Council of the European Central Bank are outlined in the Guideline of 3 November 2016 on the legal framework for accounting and financial reporting in the European System of Central Banks (recast) (ECB/2016/34) as amended by the Guideline of 28 November 2019 (ECB/2019/34).
Financial resultsThe Bank’s financial statements for the year ended 31 December 2020 are set out on pages A-4 to A-38 and disclose a profit for the year of €33.0 million (2019: €31.5 million) which is payable to the Government of Malta.
Board of DirectorsThe members of the Board of Directors during the year ended 31 December 2020 and up to the date of authorisation for issue of the financial statements were:
Professor Edward Scicluna – Governor (appointed 1 January 2021)Dr Mario Vella – Governor (up to 31 December 2020) Mr Alexander Demarco – Deputy Governor Monetary Policy Mr Oliver Bonello – Deputy Governor Financial Stability Ms Philomena MeliProfessor Peter J. Baldacchino Dr Romina Cuschieri Professor Frank Bezzina
During the financial year, Mr Herbert Zammit LaFerla was Secretary to the Board.
Statement of Directors’ responsibilities in respect of the financial statementsThe Board of Directors is responsible for ensuring that the financial statements are drawn up in accordance with the requirements of the Central Bank of Malta Act (Cap. 204). The Bank is required to prepare financial statements in accordance with the requirements of the Guideline of 3 November 2016 on the legal frame-work for accounting and financial reporting in the European System of Central Banks (recast) (ECB/2016/34) as amended by the Guideline of 28 November 2019 (ECB/2019/34).
The Board of Directors is responsible for ensuring that these financial statements give a true and fair view of the state of affairs of the Bank as at 31 December 2020 and of the profit for the year then ended.
In preparing the financial statements, the Directors are responsible for selecting and applying appropriate accounting policies and making accounting estimates that are reasonable in the circumstances.
CENTRAL BANK OF MALTA
A-3
CENTRAL BANK OF MALTA Financial Statements for the year ended 31 December 2020
* www.centralbankmalta.org/annual-reports
Mr Alexander DemarcoDeputy Governor
Mr Oliver BonelloDeputy Governor
The Directors are also responsible for designing, implementing and maintaining internal controls relevant to the preparation and the fair presentation of the financial statements that are free from material misstatement, whether due to fraud or error, and that comply with the requirements set out above. They are also respon-sible for safeguarding the assets of the Bank and hence for taking reasonable steps for the prevention and detection of fraud and other irregularities.
The financial statements of the Central Bank of Malta for the year ended 31 December 2020 are included in the Annual Report 2020, which is published in printed form and is made available on the Bank’s website*. The Directors are responsible for the maintenance and integrity of the Annual Report on the website in view of their responsibility for the controls over, and the security of, the website. Access to information published on the Bank’s website is available in other countries and jurisdictions, where legislation governing the prepa-ration and dissemination of financial statements may differ from requirements or practice in Malta.
AuditorsKPMG were appointed as the auditors of the Bank with effect from the financial year ended 31 December 2019 and have signified their willingness to continue in office.
By order of the Board.
Central Bank of MaltaPjazza KastiljaValletta VLT 1060Malta
17 March 2021
Professor Edward SciclunaGovernor
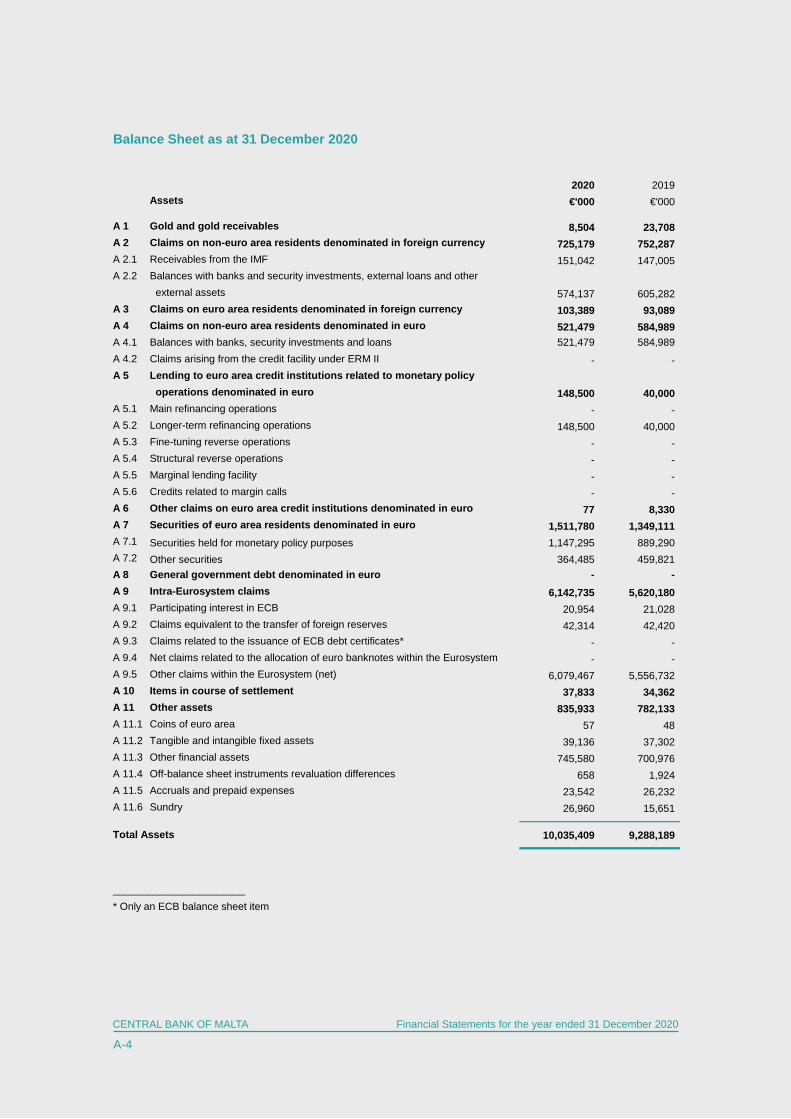
CENTRAL BANK OF MALTA
A-4
Financial Statements for the year ended 31 December 2020
Balance Sheet as at 31 December 2020
2020 2019 Assets €'000 €'000
A 1 Gold and gold receivables 8,504 23,708 A 2 Claims on non-euro area residents denominated in foreign currency 725,179 752,287 A 2.1 Receivables from the IMF 151,042 147,005 A 2.2 Balances with banks and security investments, external loans and other
external assets 574,137 605,282 A 3 Claims on euro area residents denominated in foreign currency 103,389 93,089 A 4 Claims on non-euro area residents denominated in euro 521,479 584,989 A 4.1 Balances with banks, security investments and loans 521,479 584,989 A 4.2 Claims arising from the credit facility under ERM II - - A 5 Lending to euro area credit institutions related to monetary policy
operations denominated in euro 148,500 40,000 A 5.1 Main refinancing operations - - A 5.2 Longer-term refinancing operations 148,500 40,000 A 5.3 Fine-tuning reverse operations - - A 5.4 Structural reverse operations - - A 5.5 Marginal lending facility - - A 5.6 Credits related to margin calls - - A 6 Other claims on euro area credit institutions denominated in euro 77 8,330 A 7 Securities of euro area residents denominated in euro 1,511,780 1,349,111 A 7.1 Securities held for monetary policy purposes 1,147,295 889,290 A 7.2 Other securities 364,485 459,821 A 8 General government debt denominated in euro - - A 9 Intra-Eurosystem claims 6,142,735 5,620,180 A 9.1 Participating interest in ECB 20,954 21,028 A 9.2 Claims equivalent to the transfer of foreign reserves 42,314 42,420 A 9.3 Claims related to the issuance of ECB debt certificates* - - A 9.4 Net claims related to the allocation of euro banknotes within the Eurosystem - - A 9.5 Other claims within the Eurosystem (net) 6,079,467 5,556,732 A 10 Items in course of settlement 37,833 34,362 A 11 Other assets 835,933 782,133 A 11.1 Coins of euro area 57 48 A 11.2 Tangible and intangible fixed assets 39,136 37,302 A 11.3 Other financial assets 745,580 700,976 A 11.4 Off-balance sheet instruments revaluation differences 658 1,924 A 11.5 Accruals and prepaid expenses 23,542 26,232 A 11.6 Sundry 26,960 15,651
10,035,409 9,288,189
_______________________
Total Assets
* Only an ECB balance sheet item
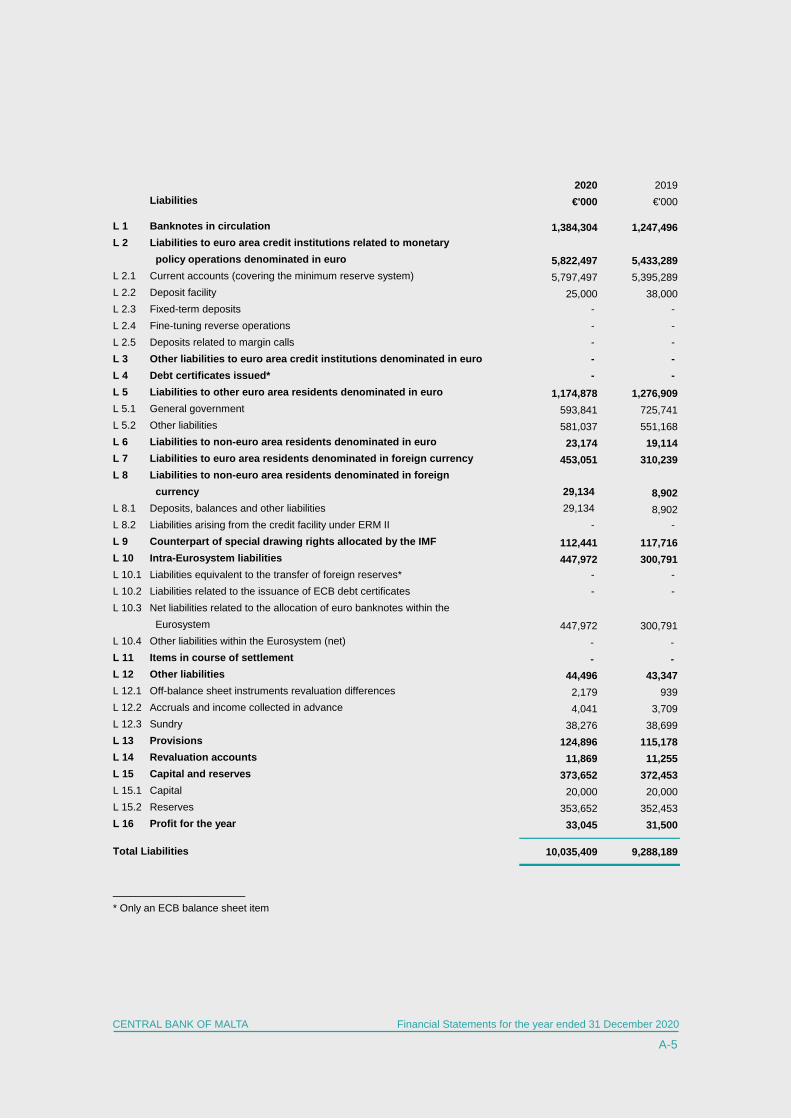
CENTRAL BANK OF MALTA
A-5
CENTRAL BANK OF MALTA Financial Statements for the year ended 31 December 2020
2020 2019Liabilities €'000 €'000
L 1 Banknotes in circulation 1,384,304 1,247,496L 2 Liabilities to euro area credit institutions related to monetary
policy operations denominated in euro 5,822,497 5,433,289L 2.1 Current accounts (covering the minimum reserve system) 5,797,497 5,395,289L 2.2 Deposit facility 25,000 38,000L 2.3 Fixed-term deposits - - L 2.4 Fine-tuning reverse operations - - L 2.5 Deposits related to margin calls - - L 3 Other liabilities to euro area credit institutions denominated in euro - - L 4 Debt certificates issued* - - L 5 Liabilities to other euro area residents denominated in euro 1,174,878 1,276,909L 5.1 General government 593,841 725,741L 5.2 Other liabilities 581,037 551,168L 6 Liabilities to non-euro area residents denominated in euro 23,174 19,114L 7 Liabilities to euro area residents denominated in foreign currency 453,051 310,239L 8 Liabilities to non-euro area residents denominated in foreign
currency 29,134 8,902L 8.1 Deposits, balances and other liabilities 29,134 8,902L 8.2 Liabilities arising from the credit facility under ERM II - - L 9 Counterpart of special drawing rights allocated by the IMF 112,441 117,716L 10 Intra-Eurosystem liabilities 447,972 300,791L 10.1 Liabilities equivalent to the transfer of foreign reserves* - - L 10.2 Liabilities related to the issuance of ECB debt certificates - - L 10.3 Net liabilities related to the allocation of euro banknotes within the
Eurosystem 447,972 300,791L 10.4 Other liabilities within the Eurosystem (net) - - L 11 Items in course of settlement - - L 12 Other liabilities 44,496 43,347L 12.1 Off-balance sheet instruments revaluation differences 2,179 939L 12.2 Accruals and income collected in advance 4,041 3,709L 12.3 Sundry 38,276 38,699L 13 Provisions 124,896 115,178L 14 Revaluation accounts 11,869 11,255L 15 Capital and reserves 373,652 372,453L 15.1 Capital 20,000 20,000L 15.2 Reserves 353,652 352,453L 16 Profit for the year 33,045 31,500
10,035,409 9,288,189
_______________________
Total Liabilities
* Only an ECB balance sheet item
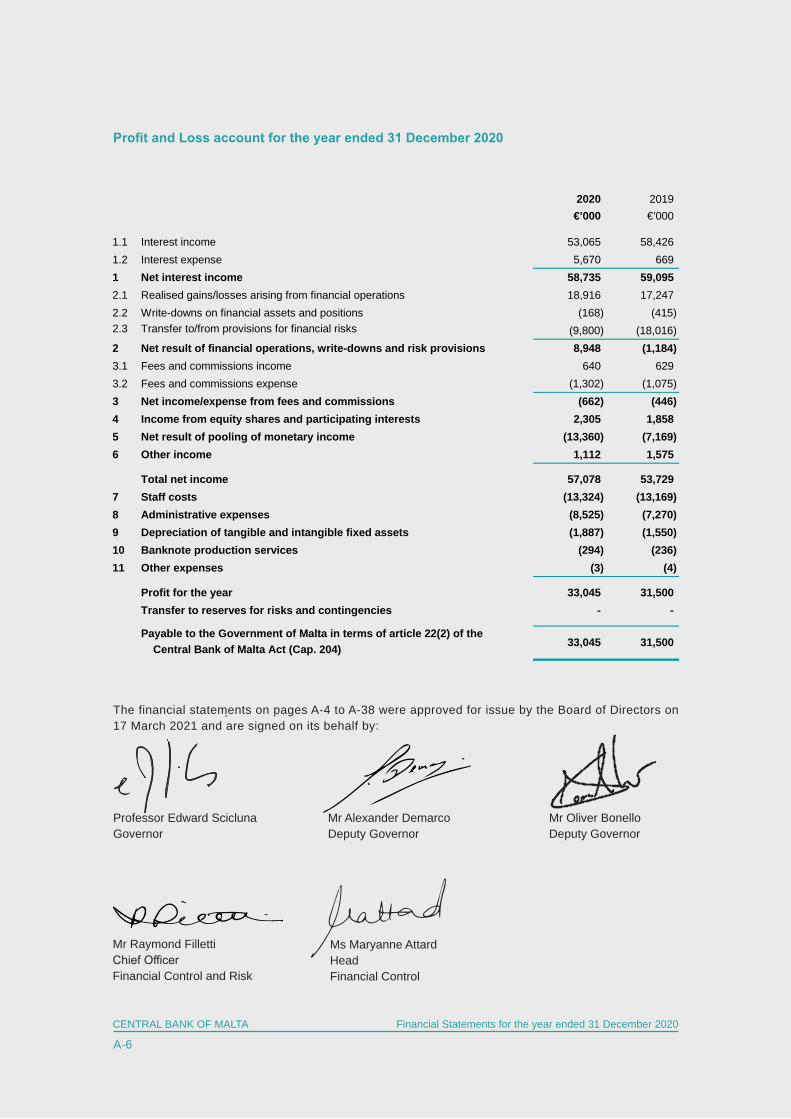
CENTRAL BANK OF MALTA
A-6
Financial Statements for the year ended 31 December 2020
The financial statements on pages A-4 to A-38 were approved for issue by the Board of Directors on 17 March 2021 and are signed on its behalf by:
Mr Alexander DemarcoDeputy Governor
Mr Raymond FillettiChief OfficerFinancial Control and Risk
Professor Edward SciclunaGovernor
Mr Oliver BonelloDeputy Governor
Ms Maryanne AttardHead Financial Control
2020 2019 €’000 €’000
1.1 Interest income 53,065 58,426 1.2 Interest expense 5,670 669 1 Net interest income 58,735 59,095 2.1 Realised gains/losses arising from financial operations 18,916 17,247 2.2 Write-downs on financial assets and positions (168) (415)2.3 Transfer to/from provisions for financial risks (9,800) (18,016)2 Net result of financial operations, write-downs and risk provisions 8,948 (1,184)3.1 Fees and commissions income 640 629 3.2 Fees and commissions expense (1,302) (1,075)3 Net income/expense from fees and commissions (662) (446)4 Income from equity shares and participating interests 2,305 1,858 5 Net result of pooling of monetary income (13,360) (7,169)6 Other income 1,112 1,575
Total net income 57,078 53,729 7 Staff costs (13,324) (13,169)8 Administrative expenses (8,525) (7,270)9 Depreciation of tangible and intangible fixed assets (1,887) (1,550)10 Banknote production services (294) (236)11 Other expenses (3) (4)
Profit for the year 33,045 31,500 Transfer to reserves for risks and contingencies - -
Payable to the Government of Malta in terms of article 22(2) of the Central Bank of Malta Act (Cap. 204) 33,045 31,500
Profit and Loss account for the year ended 31 December 2020

CENTRAL BANK OF MALTA
A-7
CENTRAL BANK OF MALTA Financial Statements for the year ended 31 December 2020
Notes to the financial statements for the year ended 31 December 2020
General notes to the financial statements
1 The EurosystemThe Central Bank of Malta (the Bank) is a participating member of the Eurosystem and has joint responsibil-ity for monetary policy and for exercising the common strategic goals of the European System of Central Banks (ESCB).1
2 Basis of preparation The Bank is required to prepare its financial statements in accordance with the guideline on the legal frame-work for accounting and financial reporting in the European System of Central Banks (recast) ECB/2016/34 issued on 3 November 2016 as amended by subsequent ECB guidelines2 (the Guideline), as established by the Central Bank of Malta Act (Chapter 204, Laws of Malta) (the Act). In line with the requirements of the Guideline, in cases where the Guideline does not provide specific direc-tion, the requirements of generally accepted accounting principles are applied. In the case of the Bank, refer-ence is made to International Financial Reporting Standards (IFRS) as adopted by the EU.
These financial statements have been drawn up so as to give a true and fair view of the state of affairs of the Bank as at 31 December 2020 and of its profit for the year then ended. The accounts have been prepared on a historical cost basis, modified to include the revaluation of gold, foreign currency instruments, securities (other than securities classified as held-to-maturity and securities held for monetary policy purposes that are accounted for at amortised cost), as well as other financial instruments, both on-balance sheet and off-balance sheet, at mid-market rates and prices.
3 Accounting policies
Basic accounting principles The basic accounting principles applied by the Bank in the preparation of these financial statements are:
- economic reality and transparency;- prudence;- materiality; - consistency and comparability;- going concern;- accruals principle; - post-balance sheet events.
Recognition of assets and liabilitiesAn asset or liability is only recognised in the balance sheet when it is probable that any associated future economic benefit will flow to or from the Bank, substantially all of the associated risks and rewards have been transferred to or from the Bank, and the cost or value of the asset or liability can be measured reliably.
1 The European Central Bank (ECB), together with national central banks (NCBs), shall constitute the ESCB. The ECB together with the NCBs of the Member States whose currency is the euro, constitute the Eurosystem and shall conduct the monetary policy of the Union, as per Article 282.1 of the Treaty of the Functioning of the European Union. The Eurosystem and the ESCB will co-exist as long as there are European Union (EU) Member States outside the euro area.2 Guideline ECB/2019/34 entered into force on 31 December 2019.
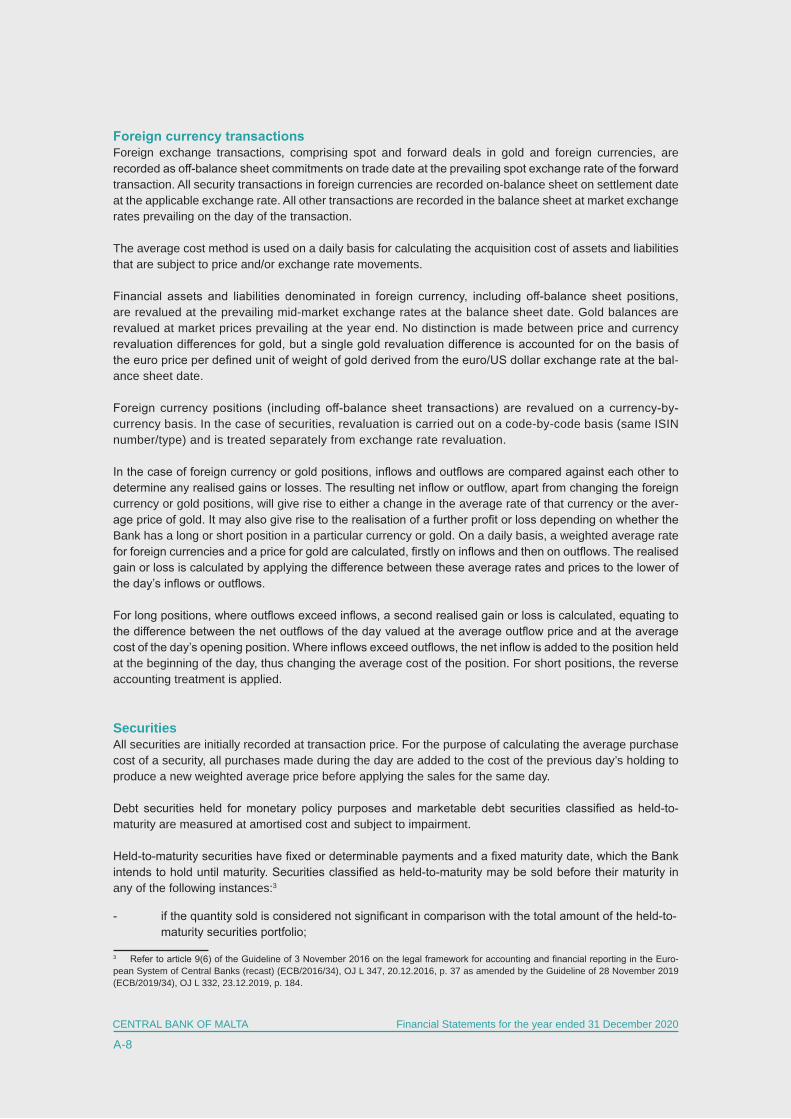
CENTRAL BANK OF MALTA
A-8
Financial Statements for the year ended 31 December 2020
Foreign currency transactionsForeign exchange transactions, comprising spot and forward deals in gold and foreign currencies, are recorded as off-balance sheet commitments on trade date at the prevailing spot exchange rate of the forward transaction. All security transactions in foreign currencies are recorded on-balance sheet on settlement date at the applicable exchange rate. All other transactions are recorded in the balance sheet at market exchange rates prevailing on the day of the transaction.
The average cost method is used on a daily basis for calculating the acquisition cost of assets and liabilities that are subject to price and/or exchange rate movements.
Financial assets and liabilities denominated in foreign currency, including off-balance sheet positions, are revalued at the prevailing mid-market exchange rates at the balance sheet date. Gold balances are revalued at market prices prevailing at the year end. No distinction is made between price and currency revaluation differences for gold, but a single gold revaluation difference is accounted for on the basis of the euro price per defined unit of weight of gold derived from the euro/US dollar exchange rate at the bal-ance sheet date.
Foreign currency positions (including off-balance sheet transactions) are revalued on a currency-by-currency basis. In the case of securities, revaluation is carried out on a code-by-code basis (same ISIN number/type) and is treated separately from exchange rate revaluation.
In the case of foreign currency or gold positions, inflows and outflows are compared against each other to determine any realised gains or losses. The resulting net inflow or outflow, apart from changing the foreign currency or gold positions, will give rise to either a change in the average rate of that currency or the aver-age price of gold. It may also give rise to the realisation of a further profit or loss depending on whether the Bank has a long or short position in a particular currency or gold. On a daily basis, a weighted average rate for foreign currencies and a price for gold are calculated, firstly on inflows and then on outflows. The realised gain or loss is calculated by applying the difference between these average rates and prices to the lower of the day’s inflows or outflows.
For long positions, where outflows exceed inflows, a second realised gain or loss is calculated, equating to the difference between the net outflows of the day valued at the average outflow price and at the average cost of the day’s opening position. Where inflows exceed outflows, the net inflow is added to the position held at the beginning of the day, thus changing the average cost of the position. For short positions, the reverse accounting treatment is applied.
SecuritiesAll securities are initially recorded at transaction price. For the purpose of calculating the average purchase cost of a security, all purchases made during the day are added to the cost of the previous day’s holding to produce a new weighted average price before applying the sales for the same day.
Debt securities held for monetary policy purposes and marketable debt securities classified as held-to-maturity are measured at amortised cost and subject to impairment.
Held-to-maturity securities have fixed or determinable payments and a fixed maturity date, which the Bank intends to hold until maturity. Securities classified as held-to-maturity may be sold before their maturity in any of the following instances:3
- if the quantity sold is considered not significant in comparison with the total amount of the held-to- maturity securities portfolio;
3 Refer to article 9(6) of the Guideline of 3 November 2016 on the legal framework for accounting and financial reporting in the Euro-pean System of Central Banks (recast) (ECB/2016/34), OJ L 347, 20.12.2016, p. 37 as amended by the Guideline of 28 November 2019 (ECB/2019/34), OJ L 332, 23.12.2019, p. 184.
CENTRAL BANK OF MALTA
A-9
CENTRAL BANK OF MALTA Financial Statements for the year ended 31 December 2020
- if the securities are sold during the month of the maturity date; - under exceptional circumstances, such as a significant deterioration of the issuer’s creditwor-
thiness.
Marketable securities (other than those held-to-maturity) are valued at the mid-market prices at the balance sheet date, on a security-by-security basis. For the year ended 31 December 2020, mid-market prices at that date were used.
The Bank holds financial instruments which are designated as part of an earmarked portfolio comprising investments held as a counterpart to the Bank’s capital and statutory reserves. The Bank also holds securi-ties forming part of another earmarked portfolio comprising Malta Government Stocks (MGS) and Treasury bills purchased on the secondary market in its role as a market maker. These two earmarked portfolios are measured at mid-market prices prevailing at the balance sheet date. Unrealised gains are reflected on-balance sheet under liabilities sub-item L 12.3 ‘Sundry’, while unrealised losses are recognised under assets sub-item A 11.6 ‘Sundry’.
Off-balance sheet instrumentsSpot and forward foreign exchange contracts and daily changes in the variation margins of future contracts are included in the net foreign currency position for the purpose of calculating the average cost of currencies and determining realised foreign exchange gains and losses. Futures are accounted for and revalued on an item-by-item basis. Daily changes in the variation margins of open futures contracts, representing realised gains and losses, are recognised in the profit and loss account.
Gains and losses arising from off-balance sheet instruments are recognised and treated in a similar manner to on-balance sheet instruments. Realised and unrealised gains and losses are measured and accounted as outlined in ‘Recognition of income and expenses’ in 3 ‘Accounting policies’ in the general notes to the financial statements.
Unrealised valuation gains or losses on spot and forward foreign exchange contracts are recorded from the trade date to the settlement date under asset sub-item A 11.4 ‘Off-balance sheet instruments revaluation differences’ and under liability sub-item L 12.1 ‘Off-balance sheet instruments revaluation differences’ as applicable.
Sale and repurchase agreements and lending of securitiesSecurities sold subject to repurchase agreements (repos) are retained in the financial statements in the appropriate classification on the assets side of the balance sheet while the counterparty liability is included as a collateralised inward deposit on the liabilities side of the balance sheet, as appropriate. Securities purchased under agreements to resell (reverse repos) are recorded as a collateralised outward loan on the assets side of the balance sheet, as appropriate. The difference between the sale and repurchase price is treated as interest and is accrued in the profit and loss account over the term of the agreement on a straight-line basis. Securities lent to counterparties are also retained in the financial statements.
Recognition of income and expensesIncome and expenses are recognised in the period in which they are earned or incurred.
Interest income and expenseInterest income and expense are recognised in the profit and loss account for all interest-bearing assets and liabilities.
CENTRAL BANK OF MALTA
A-10
Financial Statements for the year ended 31 December 2020
Interest income and interest expense arising from monetary policy operations are reported on a net basis on a balance sheet sub-item level, under either ‘Interest income’ or ‘Interest expense’ depending on whether the net amount generated or incurred is positive or negative.
Premiums or discounts arising from the difference between the average acquisition cost and the redemption price of securities are presented as part of interest income and are amortised over the remaining term of the security using either the straight-line method or the internal rate of return method. The internal rate of return method is used in the case of discount securities with a remaining maturity of more than one year at the time of acquisition. Interest accruals on foreign currency assets and liabilities are converted at the mid-market rate on each business day and are included in the respective foreign currency position to determine the average book value, as applicable.
Accordingly, interest income includes coupons earned on securities and amortised premiums or discounts on Treasury bills and other instruments. In respect of forward exchange contracts, the difference between the deemed spot exchange rate of the forward contract and the deal rate is considered as interest income or expense and is amortised on a straight-line basis from the trade date to settlement date.
Gains and losses arising from foreign exchange, gold and securitiesRealised gains and realised losses can only arise in the case of transactions leading to a reduction in foreign currency positions or on the sale of securities.
In the case of securities, realised gains or losses are derived by comparing the transaction value with the average cost of the respective security. All realised gains and losses are taken to the profit and loss account.
Unrealised revaluation gains and losses arise as a result of the revaluation of assets and liabilities by comparing the market value with the average book value. Unrealised gains are not recognised as income but are transferred directly to a revaluation account. Unrealised losses, with the exception of those relating to the earmarked portfolio, are taken to the profit and loss account when they exceed previous unrealised gains registered in the corresponding revaluation account. Unrealised losses recorded in the profit and loss account in previous years are not reversed against unrealised gains in subsequent years. Unrealised losses in any one security or in any foreign currency, including gold, are not netted against unrealised gains in other securities or other foreign currencies.
Claims on the International Monetary Fund (IMF) The IMF Reserve Tranche Position, SDR and other claims on the IMF are translated into euro at the year end ECB euro to SDR exchange rate. The IMF euro holdings are revalued against the SDR at the prevailing rep-resentative rate for the euro as quoted by the IMF at the close of business on the last working day of the year.
The IMF reserve tranche position is presented on a net basis representing the difference between the national quota and the holdings in euro at the disposal of the IMF. The euro account for administrative expenses is included under item L 6 ‘Liabilities to non-euro area residents denominated in euro’.
Euro coinsSubsequent to the agency agreement between the Bank and the Government of Malta, euro coins issued by the Bank give rise to a reserve in the form of a capital contribution by the Government. Deposits of euro coins with the Bank constitute a reversal of the capital contribution.
Tangible and intangible fixed assetsTangible and intangible fixed assets are stated at historical cost less depreciation and amortisation respectively, with the exception of land and works of art which are stated at historical cost and not depreciated. Historical
CENTRAL BANK OF MALTA
A-11
CENTRAL BANK OF MALTA Financial Statements for the year ended 31 December 2020
cost includes expenditure that is directly attributable to the acquisition of the asset. Subsequent costs are included in the carrying amount of the asset or are recognised as a separate asset, as appropriate, only when they are a present economic resource controlled by the Bank as a result of past events. All repairs and maintenance costs are charged to the profit and loss account during the financial period in which they are incurred.
Depreciation is calculated using the straight-line method to allocate the cost of the assets to their residual values over their estimated useful lives as follows:
Freehold buildings 2%Leasehold property over the remaining term of the leaseComputer hardware and software,equipment and other fixed assets 10% to 25%
Tangible and intangible fixed assets are reviewed for impairment whenever events or changes in circum-stances indicate that the carrying amount may not be recoverable. The carrying amount of an asset is written down to its recoverable amount if that carrying amount is greater than its estimated recoverable amount.
An item of property, plant and equipment is derecognised upon disposal or when no future economic benefits are expected from its use or disposal. Gains and losses arising on derecognition are determined by compar-ing sale proceeds with the carrying amount. These are included in the profit and loss account in the year when the asset is derecognised.
LeasesFor lease agreements, the related right-of-use asset and lease liability are recognised in the balance sheet at the lease commencement date under asset sub-item A 11.2 ‘Tangible and intangible fixed assets’ and liability sub-item L 12.3 ‘Sundry’ respectively.
The right-of-use asset is valued at cost less depreciation and impairment (see ‘Tangible and intangible fixed assets’ in 3 ‘Accounting policies’ in the general notes to the financial statements). Depreciation is calculated on a straight-line basis from the commencement date to either the end of the useful life of the right-of-use asset or the end of the lease term, whichever is earlier.
The lease liability is initially measured at the present value of the future lease payments, discounted at the Bank’s incremental borrowing rate. Subsequently, the lease liability is measured at amortised cost using the effective interest method.
Short-term leases with duration of twelve months or less and leases of low-value assets are recorded in the profit and loss account under item 8 ‘Administrative expenses’.
ProvisionsProvisions are recognised by the Bank in accordance with the Guideline. The general risk provision covers all financial risks, defined as market, liquidity and credit risks.
Taking into due consideration the nature of its activities, the Bank has established a provision for all finan-cial risks within its balance sheet. The Bank decides on the size and use of the provision on the basis of a reasoned estimate of its risk exposure.
CENTRAL BANK OF MALTA
A-12
Financial Statements for the year ended 31 December 2020
Marketable investment funds Marketable investment fund units held for investment purposes without the Bank intervening in the decisions on the purchase or sale of the underlying assets, are valued at market prices on a net fund basis at year end. Gains and losses arising on measurement of these investment funds are accounted for in accordance with the Guideline (see ‘Recognition of income and expenses’ in 3 ‘Accounting policies’ in the general notes to the financial statements).
Post-balance sheet events The values of assets and liabilities are adjusted for events that occur between the annual balance sheet date and the date on which the financial statements are approved by the relevant bodies if they affect the condition of assets or liabilities at the balance sheet date. No adjustment shall be made for assets and liabilities, but disclosure shall be made of those events occurring after the balance sheet date if they do not affect the condition of assets and liabilities at the balance sheet date, but which are of such importance that non-disclosure would affect the ability of the users of the financial statements to make proper evaluations and decisions.
4 Capital keyThe capital key determines the allocation of the ECB’s share capital to the NCBs on the basis of population and gross domestic product in equal share. It is adjusted every five years and whenever there is a change in the composition of the EU in accordance with the requirements of the Statute.
On 1 January 2019, the ESCB experienced a quinquennial capital key change in accordance with Article 29.3 of the Statute. As a result, the Bank’s allocation of the ECB’s share capital increased from 0.0648% to 0.0732%. Following the departure of the United Kingdom from the EU and the consequent withdrawal of the Bank of England from the ESCB on 31 January 2020, the Bank’s share in the capital of the ECB on 1 Febru-ary 2020 increased from 0.0732% to 0.0853%.
The Eurosystem capital key, which is the respective NCB’s share of the total share capital held by euro area NCBs, is used as the basis for the allocation of monetary income and the financial results of the ECB among the nineteen Eurosystem NCBs. Consequential to the ESCB quinquennial capital key change on 1 January 2019, the Bank’s Eurosystem capital key increased from 0.0921% to 0.1051%. Following the withdrawal of the Bank of England from the ESCB on 31 January 2020, the Bank’s Eurosystem capital key as at 1 Febru-ary 2020 decreased from 0.1051% to 0.1049%.
5 Banknotes in circulationThe ECB and the euro area NCBs, which together comprise the Eurosystem, issue euro banknotes. The total value of euro banknotes in circulation is allocated to the Eurosystem central banks on the last working day of each month in accordance with the banknote allocation key. The ECB has been allocated a share of 8% of the total value of euro banknotes in circulation, whereas the remaining 92% has been allocated to the NCBs according to their weightings in the capital key of the ECB.4 The share of banknotes allocated to each NCB is disclosed in the balance sheet under liability item L 1 ‘Banknotes in circulation’.
On 1 January 2019, as a result of the ESCB quinquennial capital key change, the Bank’s share in euro banknotes changed from 0.0850% to 0.0965%. Following the withdrawal of the Bank of England from the ESCB on 31 January 2020, the Bank’s share in euro banknotes remained unchanged at 0.0965%.
The difference between the value of the euro banknotes allocated to each NCB in accordance with the banknote allocation key and the value of the euro banknotes that it actually puts into circulation, as reduced
4 ECB decision of 13 December 2010 on the issue of euro banknotes (recast) (ECB/2010/29), OJ L 35, 9.2.2011, p. 26 as amended by ECB Decision of 29 November 2018 (ECB/2018/31), OJ L 9, 11.1.2019, p. 194.
CENTRAL BANK OF MALTA
A-13
CENTRAL BANK OF MALTA Financial Statements for the year ended 31 December 2020
by banknotes withdrawn from circulation, gives rise to intra-Eurosystem balances remunerated5 on a daily basis at the latest available marginal interest rate used by the Eurosystem in its tenders for main refinanc-ing operations (MROs). If the value of the euro banknotes actually issued is greater than the value accord-ing to the banknote allocation key, the excess is recognised in the balance sheet under liability sub-item L 10.3 ‘Net liabilities related to the allocation of euro banknotes within the Eurosystem’. If the value of the euro banknotes actually issued is less than the value according to the banknote allocation key, the shortfall is recognised in the balance sheet under asset sub-item A 9.4 ‘Net claims related to the allocation of euro banknotes within the Eurosystem’.
In the cash changeover year6 and in the subsequent five years, the intra-Eurosystem balances arising from the allocation of euro banknotes are adjusted in order to avoid significant changes in the NCB’s relative income positions as compared to previous years. The adjustments are affected by taking into account the differences between the average value of the banknotes which the NCB had in circulation in the reference period,7 and the average value of banknotes which would have been allocated to it during that period in accordance with its capital key. The adjustments are reduced in annual stages until the first day of the sixth year after the cash changeover year, when income on banknotes are allocated fully in proportion to the NCB’s paid-up shares in the ECB’s capital.
Any interest income or expense on these balances is cleared through the accounts of the ECB and is recog-nised in the profit and loss account under item 1 ‘Net interest income’.
6 ECB profit distribution The Governing Council of the ECB has decided that the seigniorage income of the ECB, which arises from the 8% share of euro banknotes allocated to the ECB, as well as income arising from the securities held under the securities markets programme (SMP), the third covered bond purchase programme (CBPP3), the asset-backed securities purchase programme (ABSPP), the public sector purchase programme (PSPP) and the pandemic emergency purchase programme (PEPP) is distributed in January of the following year by means of an interim profit distribution, unless otherwise decided by the Governing Council.8 This income is distributed in full unless it is higher than the ECB’s net profit for the year and subject to any decisions by the Governing Council of the ECB to make transfers to the provision for financial risks. The Governing Council of the ECB may also decide to charge costs incurred by the ECB in connection with the issue and handling of euro banknotes against income earned on euro banknotes in circulation.
The amount distributed to the Bank is recognised in the profit and loss account under item 4 ‘Income from equity shares and participating interests’.
7 Intra-Eurosystem balances/Intra-ESCB balancesIntra-Eurosystem balances result mostly from cross-border payments in the EU that are settled in central bank money in euro. They are primarily settled in the Trans-European Automated Real-time Gross settle-ment Express Transfer system (TARGET2) and give rise to bilateral balances in the TARGET2 accounts of EU central banks. These bilateral balances are netted and then assigned to the ECB on a daily basis, leaving each NCB with a single net bilateral position vis-à-vis the ECB only. Intra-Eurosystem balances of the Bank vis-à-vis the ECB arising from TARGET2, as well as other intra-Eurosystem balances denominated in euro
5 ECB Decision of 3 November 2016 on the allocation of monetary income of the national central banks of Member States whose cur-rency is the euro (recast) (ECB/2016/36), OJ L 347, 20.12.2016, p. 26 as amended by ECB Decision of 12 November 2020 (ECB/2020/55), OJ L 390, 20.11.2020, p. 60.6 Cash changeover year refers to the year in which the euro banknotes are introduced as legal tender in the respective Member State.7 The reference period refers to a 24-month period commencing 30 months prior to the day on which euro banknotes become legal tender in the respective Member State.8 ECB Decision of 15 December 2014 on the interim distribution of the income of the European Central Bank (recast) (ECB/2014/57), OJ L 53, 25.2.2015, p. 24 as amended by ECB Decision of 2 July 2015 (ECB/2015/25), OJ L 193, 21.7.2015, p. 133, ECB decision of 28 No-vember 2019 (ECB/2019/36) OJ L 332, 23.12.2019, p. 183 and ECB decision of 12 November 2020 (ECB/2020/56) OJ L 390, 20.11.2020, p. 63.

CENTRAL BANK OF MALTA
A-14
Financial Statements for the year ended 31 December 2020
(e.g. interim ECB profit distributions to NCBs and monetary income results), are presented on the balance sheet of the Bank as a single net asset or liability position and disclosed under A 9.5 ‘Other claims within the Eurosystem (net)’ or L 10.4 ‘Other liabilities within the Eurosystem (net)’. Intra-ESCB balances versus non-euro area NCBs not arising from TARGET2 are disclosed either under A 4 ‘Claims on non-euro area residents denominated in euro’ or L 6 ‘Liabilities to non-euro area residents denominated in euro’.
Intra-Eurosystem claims arising from the Bank’s participating interest in the ECB are reported under A 9.1 ‘Participating interest in ECB’. In particular this balance sheet item includes (i) the NCBs’ paid-up share in the ECB’s subscribed capital, (ii) any net amount paid by the NCBs due to the increase in their shares in the ECB’s equity value9 resulting from all previous ECB’s capital key adjustments, and (iii) contributions in accordance with Article 48.2 of the Statute of the ESCB with respect to central banks of Member States whose derogations have been abrogated.
Intra-Eurosystem balances arising from the allocation of euro banknotes within the Eurosystem are reported as a single net asset or liability under A 9.5 ‘Other claims within the Eurosystem (net)’ or L 10.4 ‘Other liabili-ties within the Eurosystem (net)’ as appropriate (see 5 ‘Banknotes in circulation’ in the general notes to the financial statements).
Intra-Eurosystem claims arising from the transfer of foreign reserve assets by the Bank to the ECB are denominated in euro and reported under A 9.2 ‘Claims equivalent to the transfer of foreign reserves’.
9 Equity value consists of the total ECB’s reserves, revaluation accounts and provisions equivalent to reserves, less any losses carried forward from previous periods. In the event of capital key changes the equity value also includes the ECB’s accumulated net profit or net loss until the date of the adjustment.
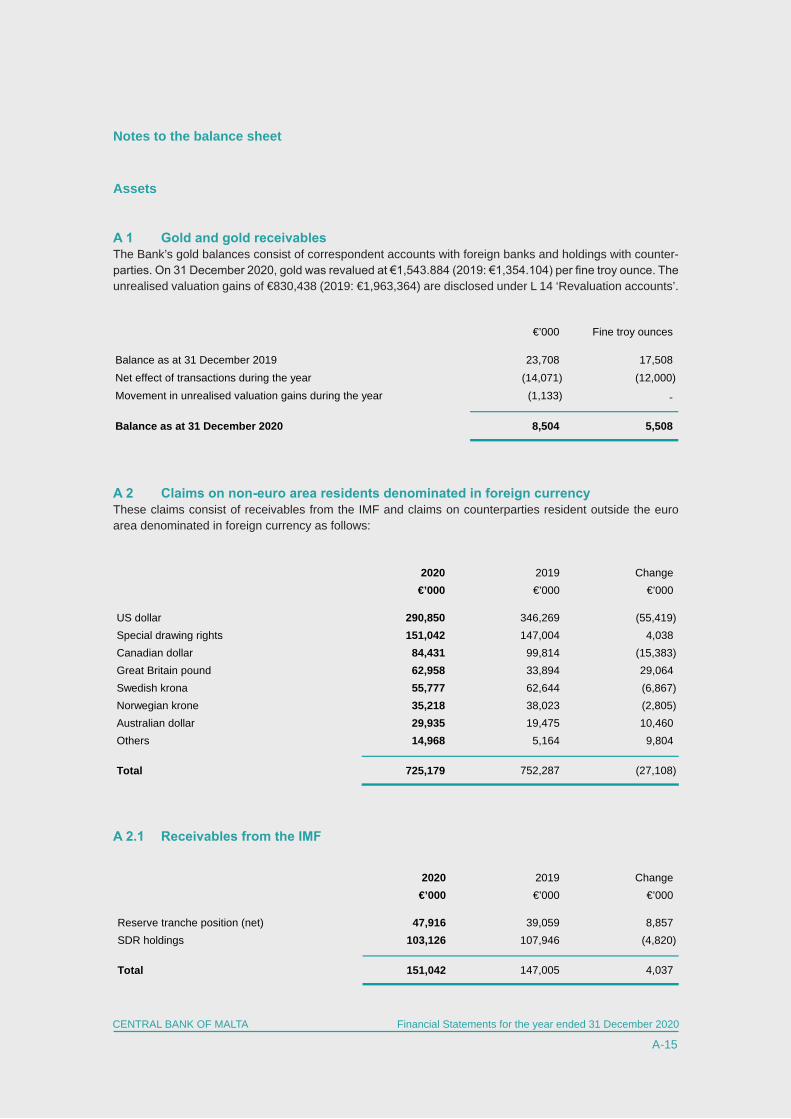
CENTRAL BANK OF MALTA
A-15
CENTRAL BANK OF MALTA Financial Statements for the year ended 31 December 2020
Notes to the balance sheet
Assets
A 1 Gold and gold receivables The Bank’s gold balances consist of correspondent accounts with foreign banks and holdings with counter-parties. On 31 December 2020, gold was revalued at €1,543.884 (2019: €1,354.104) per fine troy ounce. The unrealised valuation gains of €830,438 (2019: €1,963,364) are disclosed under L 14 ‘Revaluation accounts’.
A 2 Claims on non-euro area residents denominated in foreign currencyThese claims consist of receivables from the IMF and claims on counterparties resident outside the euro area denominated in foreign currency as follows:
A 2.1 Receivables from the IMF
€’000 Fine troy ounces
Balance as at 31 December 2019 23,708 17,508 Net effect of transactions during the year (14,071) (12,000)Movement in unrealised valuation gains during the year (1,133) -
Balance as at 31 December 2020 8,504 5,508
2020 2019 Change €’000 €’000 €’000
US dollar 290,850 346,269 (55,419)Special drawing rights 151,042 147,004 4,038 Canadian dollar 84,431 99,814 (15,383)Great Britain pound 62,958 33,894 29,064 Swedish krona 55,777 62,644 (6,867)Norwegian krone 35,218 38,023 (2,805)Australian dollar 29,935 19,475 10,460 Others 14,968 5,164 9,804
Total 725,179 752,287 (27,108)
2020 2019 Change €’000 €’000 €’000
Reserve tranche position (net) 47,916 39,059 8,857 SDR holdings 103,126 107,946 (4,820)
Total 151,042 147,005 4,037
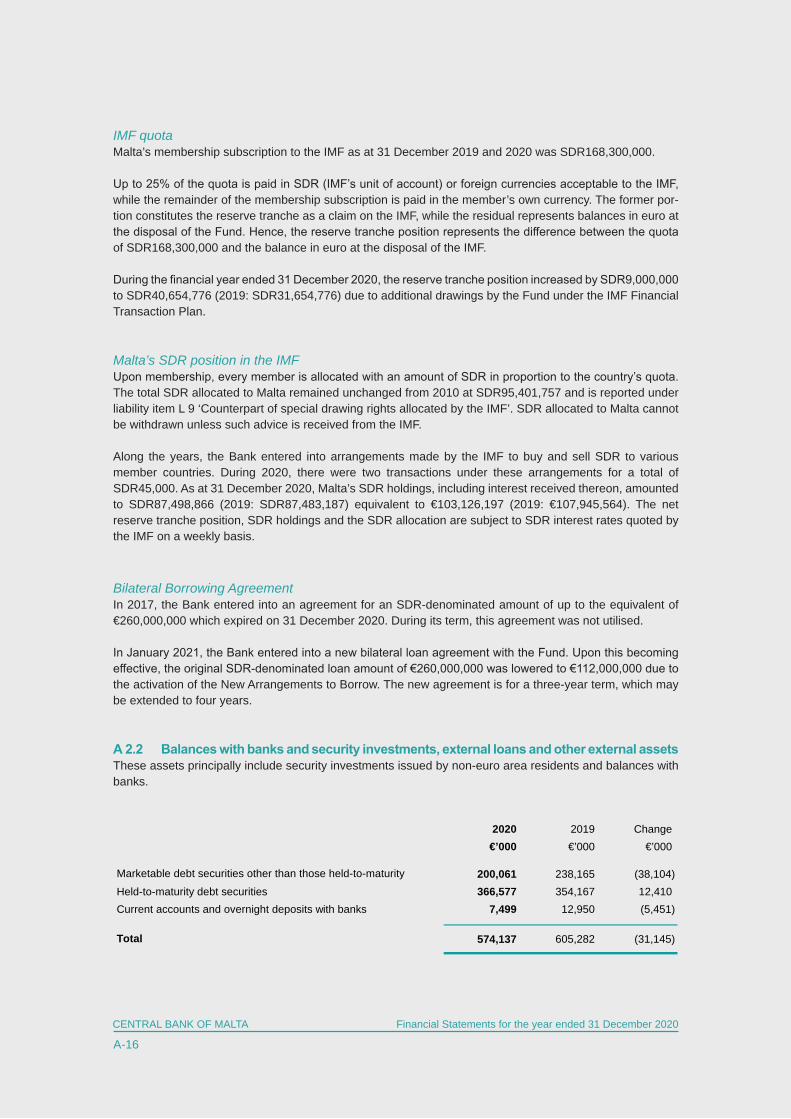
CENTRAL BANK OF MALTA
A-16
Financial Statements for the year ended 31 December 2020
2020 2019 Change €’000 €’000 €’000
200,061 238,165 (38,104)Held-to-maturity debt securities 366,577 354,167 12,410 Current accounts and overnight deposits with banks 7,499 12,950 (5,451)
574,137 605,282 (31,145)
Marketable debt securities other than those held-to-maturity
Total
IMF quota Malta’s membership subscription to the IMF as at 31 December 2019 and 2020 was SDR168,300,000.
Up to 25% of the quota is paid in SDR (IMF’s unit of account) or foreign currencies acceptable to the IMF, while the remainder of the membership subscription is paid in the member’s own currency. The former por-tion constitutes the reserve tranche as a claim on the IMF, while the residual represents balances in euro at the disposal of the Fund. Hence, the reserve tranche position represents the difference between the quota of SDR168,300,000 and the balance in euro at the disposal of the IMF.
During the financial year ended 31 December 2020, the reserve tranche position increased by SDR9,000,000 to SDR40,654,776 (2019: SDR31,654,776) due to additional drawings by the Fund under the IMF Financial Transaction Plan.
Malta’s SDR position in the IMFUpon membership, every member is allocated with an amount of SDR in proportion to the country’s quota. The total SDR allocated to Malta remained unchanged from 2010 at SDR95,401,757 and is reported under liability item L 9 ‘Counterpart of special drawing rights allocated by the IMF’. SDR allocated to Malta cannot be withdrawn unless such advice is received from the IMF.
Along the years, the Bank entered into arrangements made by the IMF to buy and sell SDR to various member countries. During 2020, there were two transactions under these arrangements for a total of SDR45,000. As at 31 December 2020, Malta’s SDR holdings, including interest received thereon, amounted to SDR87,498,866 (2019: SDR87,483,187) equivalent to €103,126,197 (2019: €107,945,564). The net reserve tranche position, SDR holdings and the SDR allocation are subject to SDR interest rates quoted by the IMF on a weekly basis.
Bilateral Borrowing AgreementIn 2017, the Bank entered into an agreement for an SDR-denominated amount of up to the equivalent of €260,000,000 which expired on 31 December 2020. During its term, this agreement was not utilised.
In January 2021, the Bank entered into a new bilateral loan agreement with the Fund. Upon this becoming effective, the original SDR-denominated loan amount of €260,000,000 was lowered to €112,000,000 due to the activation of the New Arrangements to Borrow. The new agreement is for a three-year term, which may be extended to four years.
A 2.2 Balances with banks and security investments, external loans and other external assetsThese assets principally include security investments issued by non-euro area residents and balances with banks.

CENTRAL BANK OF MALTA
A-17
CENTRAL BANK OF MALTA Financial Statements for the year ended 31 December 2020
A 3 Claims on euro area residents denominated in foreign currencyThese foreign currency assets mainly comprise investments in marketable debt securities issued by euro area residents, claims arising from reverse operations with euro area counterparties and balances with banks.
During 2020, credit institutions established in Malta participated for a total amount of US$1,875,300,000 (2019: US$1,359,300,000) in US dollar liquidity-providing operations. The outstanding amount as at 31 December 2020 amounted to US$64,500,000 (2019: US$23,400,000). Under this programme, the US dollar was provided by the Federal Reserve to the ECB by means of a swap line with the aim of offering short-term US dollar funding to Eurosystem counterparties. The ECB simultaneously entered into back-to-back swap transactions with euro area NCBs, which used the resulting funds to conduct liquidity-providing operations with the Eurosystem counterparties in the form of reverse and swap transactions.
Claims on euro area residents were denominated in foreign currency as follows:
A 4 Claims on non-euro area residents denominated in euroThese claims include marketable debt securities issued by non-euro area residents and balances with banks outside the euro area.
2020 2019 Change €’000 €’000 €’000
US dollar 78,275 83,285 (5,010)Great Britain pound 11,854 9 11,845 Swiss franc 3,738 3,699 39 Others 9,522 6,096 3,426
Total 103,389 93,089 10,300
2020 2019 Change €’000 €’000 €’000
23,953 58,032 (34,079)Held-to-maturity debt securities 26,556 14,200 12,356 US dollar liquidity-providing operations 52,563 20,830 31,733 Current accounts and overnight deposits with banks 317 27 290
103,389 93,089 10,300 Total
Marketable debt securities other than those held-to-maturity
2020 2019 Change €’000 €’000 €’000
Marketable debt securities other than those held-to-maturity 163,361 191,397 (28,036)Held-to-maturity debt securities 358,053 393,154 (35,101)Current accounts and overnight deposits with banks 65 438 (373)
Total 521,479 584,989 (63,510)
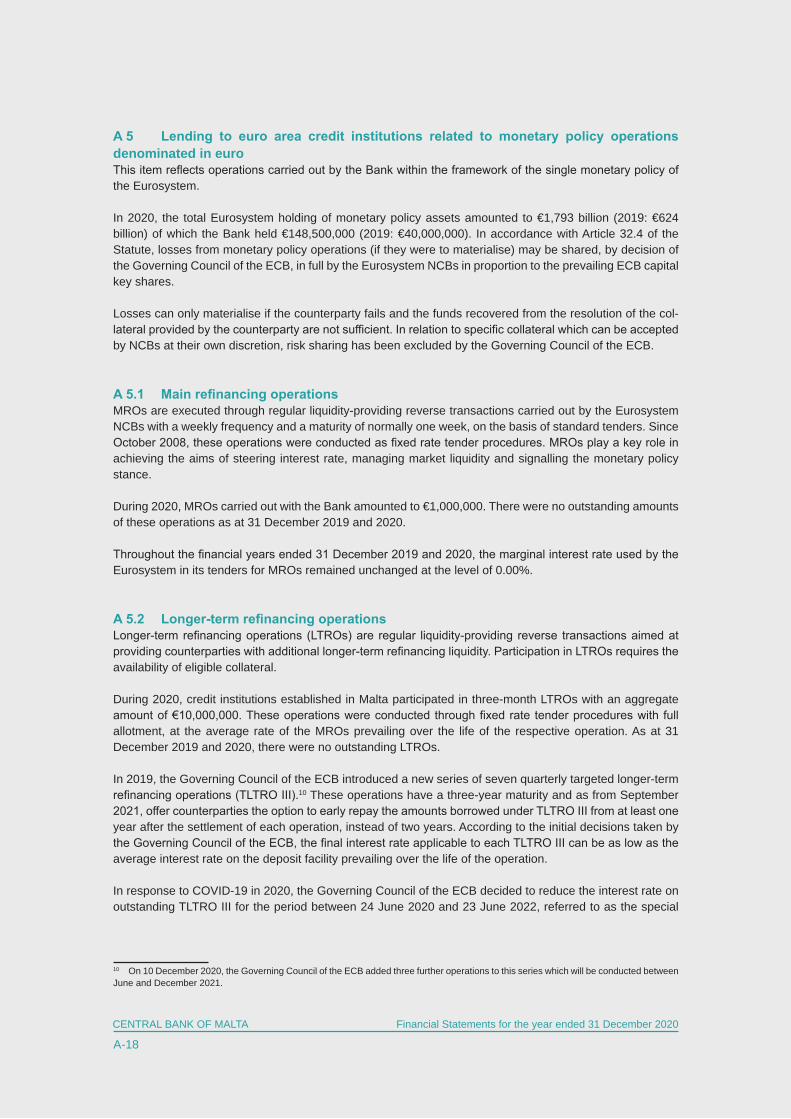
CENTRAL BANK OF MALTA
A-18
Financial Statements for the year ended 31 December 2020
A 5 Lending to euro area credit institutions related to monetary policy operations denominated in euroThis item reflects operations carried out by the Bank within the framework of the single monetary policy of the Eurosystem.
In 2020, the total Eurosystem holding of monetary policy assets amounted to €1,793 billion (2019: €624 billion) of which the Bank held €148,500,000 (2019: €40,000,000). In accordance with Article 32.4 of the Statute, losses from monetary policy operations (if they were to materialise) may be shared, by decision of the Governing Council of the ECB, in full by the Eurosystem NCBs in proportion to the prevailing ECB capital key shares.
Losses can only materialise if the counterparty fails and the funds recovered from the resolution of the col-lateral provided by the counterparty are not sufficient. In relation to specific collateral which can be accepted by NCBs at their own discretion, risk sharing has been excluded by the Governing Council of the ECB.
A 5.1 Main refinancing operations MROs are executed through regular liquidity-providing reverse transactions carried out by the Eurosystem NCBs with a weekly frequency and a maturity of normally one week, on the basis of standard tenders. Since October 2008, these operations were conducted as fixed rate tender procedures. MROs play a key role in achieving the aims of steering interest rate, managing market liquidity and signalling the monetary policy stance.
During 2020, MROs carried out with the Bank amounted to €1,000,000. There were no outstanding amounts of these operations as at 31 December 2019 and 2020.
Throughout the financial years ended 31 December 2019 and 2020, the marginal interest rate used by the Eurosystem in its tenders for MROs remained unchanged at the level of 0.00%.
A 5.2 Longer-term refinancing operationsLonger-term refinancing operations (LTROs) are regular liquidity-providing reverse transactions aimed at providing counterparties with additional longer-term refinancing liquidity. Participation in LTROs requires the availability of eligible collateral.
During 2020, credit institutions established in Malta participated in three-month LTROs with an aggregate amount of €10,000,000. These operations were conducted through fixed rate tender procedures with full allotment, at the average rate of the MROs prevailing over the life of the respective operation. As at 31 December 2019 and 2020, there were no outstanding LTROs.
In 2019, the Governing Council of the ECB introduced a new series of seven quarterly targeted longer-term refinancing operations (TLTRO III).10 These operations have a three-year maturity and as from September 2021, offer counterparties the option to early repay the amounts borrowed under TLTRO III from at least one year after the settlement of each operation, instead of two years. According to the initial decisions taken by the Governing Council of the ECB, the final interest rate applicable to each TLTRO III can be as low as the average interest rate on the deposit facility prevailing over the life of the operation.
In response to COVID-19 in 2020, the Governing Council of the ECB decided to reduce the interest rate on outstanding TLTRO III for the period between 24 June 2020 and 23 June 2022, referred to as the special
10 On 10 December 2020, the Governing Council of the ECB added three further operations to this series which will be conducted between June and December 2021.
CENTRAL BANK OF MALTA
A-19
CENTRAL BANK OF MALTA Financial Statements for the year ended 31 December 2020
interest rate period.11 The applicable interest rate can be as low as 50 basis points below the average interest rate on the deposit facility prevailing over the same period, with a ceiling of -1%.
As a prudent approach, given that the actual interest rates will only be known at the maturity of each opera-tion and that a reliable estimate is not possible until that time, the deposit facility rate minus 50 basis points, with a ceiling of -1% is used for calculating the TLTRO III interest over the special interest period and the deposit facility rate is used for calculating the TLTRO III interest over the remaining life of the operation.
During 2020, new participations in TLTRO III carried out with the Bank amounted to €63,500,000. The outstanding amount of these operations as at 31 December 2020 amounted to €103,500,000 (2019: €40,000,000).
On 12 March 2020, the Governing Council of the ECB announced additional bridge LTROs, which were conducted between March and June 2020, to provide immediate liquidity support to banks and to safeguard money market conditions created in view of COVID-19. These operations were conducted as fixed rate tender procedures with full allotment, with the interest rate fixed at the average overnight deposit facility rate over the life of the respective operation. Credit institutions established in Malta participated with an amount of €50,000,000 in such operations, which matured on 24 June 2020.
On 30 April 2020, the Governing Council of the ECB introduced a new series of seven LTROs which will mature in the third quarter of 2021, called pandemic emergency longer-term refinancing operations (PELTROs).12 These operations provide liquidity support to the euro area financial system and contribute to preserve the smooth functioning of money markets by providing an effective backstop after the expiry of the bridge LTROs. The PELTROs are conducted as fixed rate tender procedures with full allotment. The interest rate is 25 basis points below the average rate applied on the Eurosystem’s MROs over the life of the respec-tive PELTRO. The aggregate PELTROs carried out with the Bank amounted to €45,000,000 which remained outstanding as at 31 December 2020.
A 5.3 Fine-tuning reverse operationsFine-tuning reverse operations aim to regulate the market liquidity situation and steer interest rates, particu-larly to smooth the effects on interest rates caused by unexpected market fluctuations. Owing to their nature, they are executed on an ad hoc basis. No fine-tuning reverse operations were conducted by the ECB during the years ended 31 December 2019 and 2020.
A 5.4 Structural reverse operationsThese are reverse open-market transactions through standard tenders to enable the Eurosystem to adjust its structural liquidity position vis-à-vis the financial sector. No structural operations were conducted by the ECB during the years ended 31 December 2019 and 2020.
A 5.5 Marginal lending facilityMarginal lending facilities may be used by counterparties to obtain overnight liquidity from Eurosystem NCBs at a pre-specified interest rate against eligible assets. During 2020, there were no participations in the mar-ginal lending facility by credit institutions established in Malta. There were no outstanding transactions as at 31 December 2019 and 2020.
Throughout the financial years ended 31 December 2019 and 2020, the marginal lending facility rate remained unchanged at the level of 0.25%.
11 On 30 April 2020, the Governing Council of the ECB decided that the special interest period would be between 24 June 2020 and 23 June 2021. On 10 December 2020, the Governing Council of the ECB decided to extend this period by twelve months, to 23 June 2022.12 On 10 December 2020 the Governing Council of the ECB decided to offer four additional PELTROs in 2021.
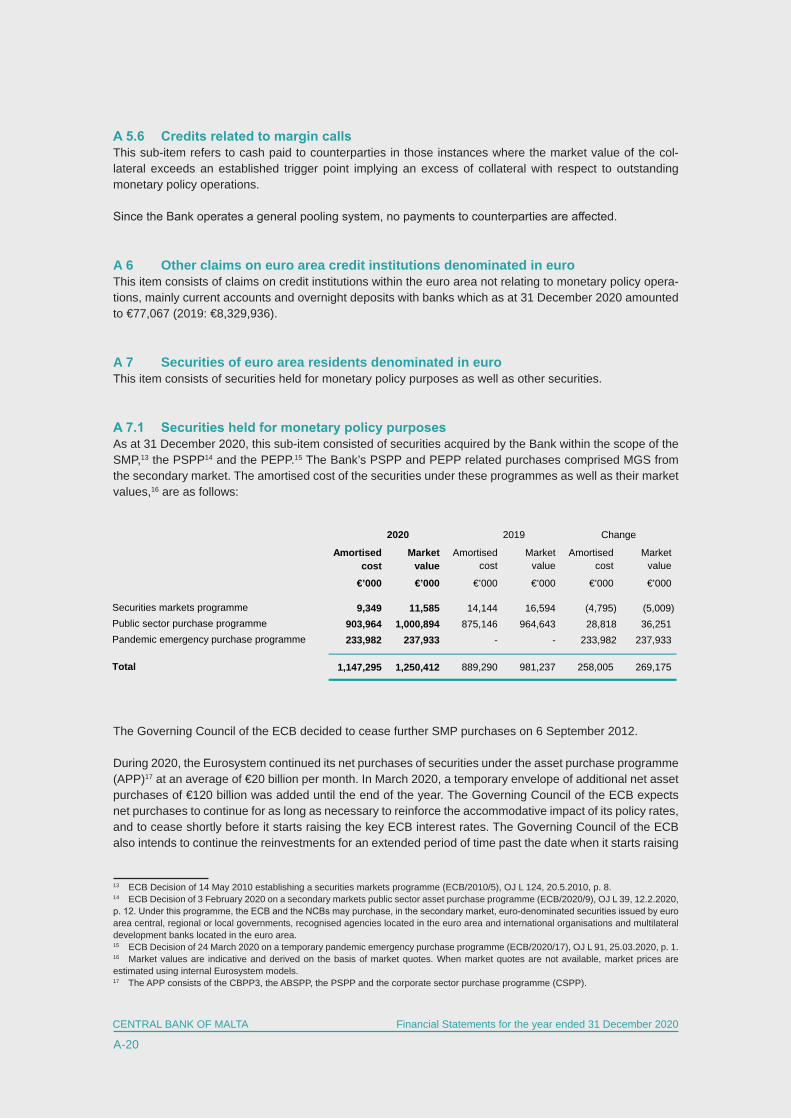
CENTRAL BANK OF MALTA
A-20
Financial Statements for the year ended 31 December 2020
Amortised Market Amortised Market Amortised Market cost value cost value cost value
€’000 €’000 €’000 €’000 €’000 €’000
9,349 11,585 14,144 16,594 (4,795) (5,009)903,964 1,000,894 875,146 964,643 28,818 36,251 233,982 237,933 - - 233,982 237,933
1,147,295 1,250,412 889,290 981,237 258,005 269,175
2020 2019 Change
Securities markets programmePublic sector purchase programme
Total
Pandemic emergency purchase programme
A 5.6 Credits related to margin callsThis sub-item refers to cash paid to counterparties in those instances where the market value of the col-lateral exceeds an established trigger point implying an excess of collateral with respect to outstanding monetary policy operations. Since the Bank operates a general pooling system, no payments to counterparties are affected.
A 6 Other claims on euro area credit institutions denominated in euroThis item consists of claims on credit institutions within the euro area not relating to monetary policy opera-tions, mainly current accounts and overnight deposits with banks which as at 31 December 2020 amounted to €77,067 (2019: €8,329,936).
A 7 Securities of euro area residents denominated in euroThis item consists of securities held for monetary policy purposes as well as other securities.
A 7.1 Securities held for monetary policy purposesAs at 31 December 2020, this sub-item consisted of securities acquired by the Bank within the scope of the SMP,13 the PSPP14 and the PEPP.15 The Bank’s PSPP and PEPP related purchases comprised MGS from the secondary market. The amortised cost of the securities under these programmes as well as their market values,16 are as follows:
The Governing Council of the ECB decided to cease further SMP purchases on 6 September 2012.
During 2020, the Eurosystem continued its net purchases of securities under the asset purchase programme (APP)17 at an average of €20 billion per month. In March 2020, a temporary envelope of additional net asset purchases of €120 billion was added until the end of the year. The Governing Council of the ECB expects net purchases to continue for as long as necessary to reinforce the accommodative impact of its policy rates, and to cease shortly before it starts raising the key ECB interest rates. The Governing Council of the ECB also intends to continue the reinvestments for an extended period of time past the date when it starts raising
13 ECB Decision of 14 May 2010 establishing a securities markets programme (ECB/2010/5), OJ L 124, 20.5.2010, p. 8. 14 ECB Decision of 3 February 2020 on a secondary markets public sector asset purchase programme (ECB/2020/9), OJ L 39, 12.2.2020, p. 12. Under this programme, the ECB and the NCBs may purchase, in the secondary market, euro-denominated securities issued by euro area central, regional or local governments, recognised agencies located in the euro area and international organisations and multilateral development banks located in the euro area.15 ECB Decision of 24 March 2020 on a temporary pandemic emergency purchase programme (ECB/2020/17), OJ L 91, 25.03.2020, p. 1.16 Market values are indicative and derived on the basis of market quotes. When market quotes are not available, market prices are estimated using internal Eurosystem models. 17 The APP consists of the CBPP3, the ABSPP, the PSPP and the corporate sector purchase programme (CSPP).
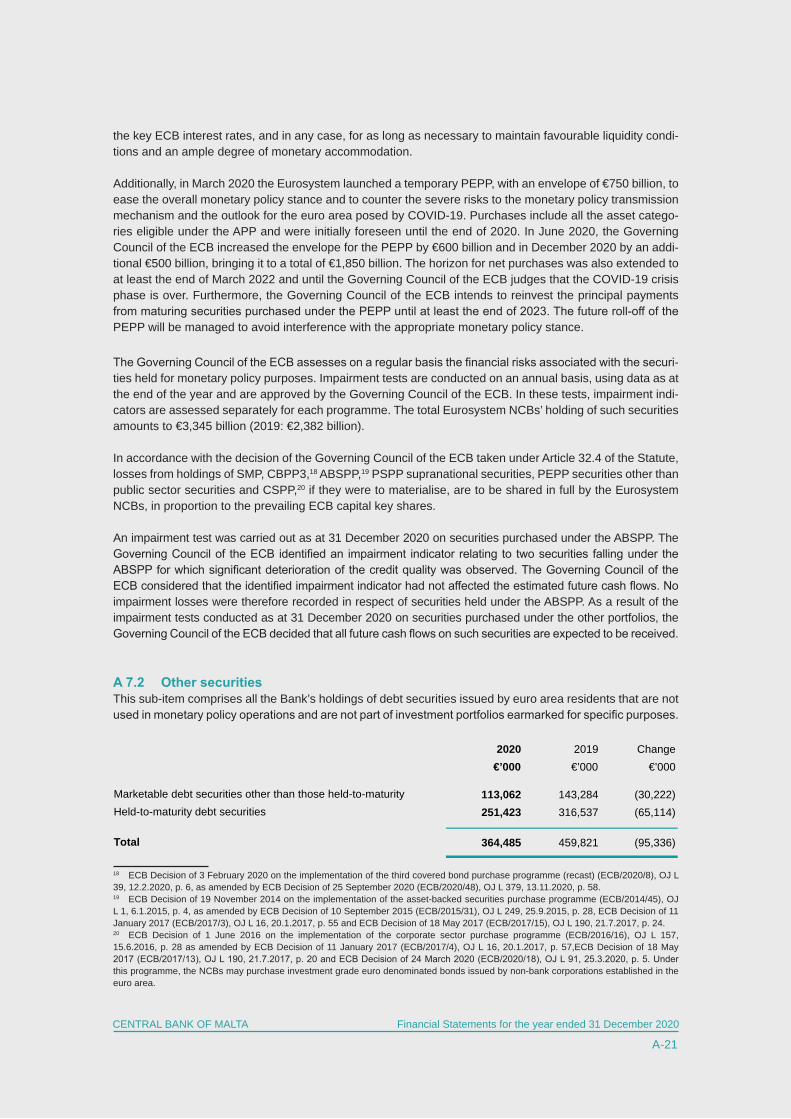
CENTRAL BANK OF MALTA
A-21
CENTRAL BANK OF MALTA Financial Statements for the year ended 31 December 2020
the key ECB interest rates, and in any case, for as long as necessary to maintain favourable liquidity condi-tions and an ample degree of monetary accommodation.
Additionally, in March 2020 the Eurosystem launched a temporary PEPP, with an envelope of €750 billion, to ease the overall monetary policy stance and to counter the severe risks to the monetary policy transmission mechanism and the outlook for the euro area posed by COVID-19. Purchases include all the asset catego-ries eligible under the APP and were initially foreseen until the end of 2020. In June 2020, the Governing Council of the ECB increased the envelope for the PEPP by €600 billion and in December 2020 by an addi-tional €500 billion, bringing it to a total of €1,850 billion. The horizon for net purchases was also extended to at least the end of March 2022 and until the Governing Council of the ECB judges that the COVID-19 crisis phase is over. Furthermore, the Governing Council of the ECB intends to reinvest the principal payments from maturing securities purchased under the PEPP until at least the end of 2023. The future roll-off of the PEPP will be managed to avoid interference with the appropriate monetary policy stance.
The Governing Council of the ECB assesses on a regular basis the financial risks associated with the securi-ties held for monetary policy purposes. Impairment tests are conducted on an annual basis, using data as at the end of the year and are approved by the Governing Council of the ECB. In these tests, impairment indi-cators are assessed separately for each programme. The total Eurosystem NCBs’ holding of such securities amounts to €3,345 billion (2019: €2,382 billion).
In accordance with the decision of the Governing Council of the ECB taken under Article 32.4 of the Statute, losses from holdings of SMP, CBPP3,18 ABSPP,19 PSPP supranational securities, PEPP securities other than public sector securities and CSPP,20 if they were to materialise, are to be shared in full by the Eurosystem NCBs, in proportion to the prevailing ECB capital key shares.
An impairment test was carried out as at 31 December 2020 on securities purchased under the ABSPP. The Governing Council of the ECB identified an impairment indicator relating to two securities falling under the ABSPP for which significant deterioration of the credit quality was observed. The Governing Council of the ECB considered that the identified impairment indicator had not affected the estimated future cash flows. No impairment losses were therefore recorded in respect of securities held under the ABSPP. As a result of the impairment tests conducted as at 31 December 2020 on securities purchased under the other portfolios, the Governing Council of the ECB decided that all future cash flows on such securities are expected to be received.
A 7.2 Other securitiesThis sub-item comprises all the Bank’s holdings of debt securities issued by euro area residents that are not used in monetary policy operations and are not part of investment portfolios earmarked for specific purposes.
18 ECB Decision of 3 February 2020 on the implementation of the third covered bond purchase programme (recast) (ECB/2020/8), OJ L 39, 12.2.2020, p. 6, as amended by ECB Decision of 25 September 2020 (ECB/2020/48), OJ L 379, 13.11.2020, p. 58.19 ECB Decision of 19 November 2014 on the implementation of the asset-backed securities purchase programme (ECB/2014/45), OJ L 1, 6.1.2015, p. 4, as amended by ECB Decision of 10 September 2015 (ECB/2015/31), OJ L 249, 25.9.2015, p. 28, ECB Decision of 11 January 2017 (ECB/2017/3), OJ L 16, 20.1.2017, p. 55 and ECB Decision of 18 May 2017 (ECB/2017/15), OJ L 190, 21.7.2017, p. 24.20 ECB Decision of 1 June 2016 on the implementation of the corporate sector purchase programme (ECB/2016/16), OJ L 157, 15.6.2016, p. 28 as amended by ECB Decision of 11 January 2017 (ECB/2017/4), OJ L 16, 20.1.2017, p. 57,ECB Decision of 18 May 2017 (ECB/2017/13), OJ L 190, 21.7.2017, p. 20 and ECB Decision of 24 March 2020 (ECB/2020/18), OJ L 91, 25.3.2020, p. 5. Under this programme, the NCBs may purchase investment grade euro denominated bonds issued by non-bank corporations established in the euro area.
2020 2019 Change€’000 €’000 €’000
113,062 143,284 (30,222)251,423 316,537 (65,114)
364,485 459,821 (95,336)Total
Held-to-maturity debt securitiesMarketable debt securities other than those held-to-maturity
CENTRAL BANK OF MALTA
A-22
Financial Statements for the year ended 31 December 2020
A 9 Intra-Eurosystem claimsThis item consists of claims arising from the Bank’s share in the ECB’s net equity claims equivalent to the transfer of foreign reserves to the ECB and other net claims within the Eurosystem.
A 9.1 Participating interest in ECBThis sub-item consists of the Bank’s paid-up share in the ECB’s subscribed capital and the Bank’s share in the ECB’s accumulated net profits.
Pursuant to Article 28 of the Statute, the ESCB NCBs are the sole subscribers to the capital of the ECB. Subscriptions depend on shares which are determined in accordance with Article 29 of the Statute and are subject to adjustment every five years or whenever there is a change in the composition of the ECSB NCBs. As a result of the departure of the United Kingdom from the EU on 31 January 2020 and following the with-drawal of the Bank of England from the ESCB, the weightings assigned to the remaining NCBs in the key for subscription to the ECB’s capital were adjusted. Consequently, with effect from 1 February 2020, the Bank’s share in the ECB’s capital increased from 0.0732% to 0.0853%.
The ECB kept its subscribed capital unchanged at €10,825 million after the Bank of England’s withdrawal from the ESCB. The share of the Bank of England in the ECB’s subscribed capital, which stood at 14.3%, was reallocated among the euro area NCBs and the remaining non-euro area NCBs.
The ECB’s paid-up capital also remained unchanged at €7,659 million, as the remaining NCBs were required to cover the withdrawn Bank of England’s paid-up capital of €58 million. As a result, an additional contribution of €30,066 was transferred by the Bank to the ECB on 1 February 2020. As at 31 December 2020, the Bank’s paid-up share in the ECB’s subscribed capital amounted to €7,953,971 (2019: €7,923,905). Euro area NCBs will be required to pay up in full their increased subscriptions to the ECB capital in two annual instalmentsin 2021 and 2022.21 The Bank will be required to make two payments of €639,880 each.
As a result of the Eurosystem capital key change that occurred on 1 February 2020 (see 4 ‘Capital key’ in the general notes to the financial statements), the Bank’s share in the ECB’s accumulated net profits amounted to €13,000,376 as at 31 December 2020 (2019: €13,104,026).
A 9.2 Claims equivalent to the transfer of foreign reservesThis asset represents the Bank’s claims arising from the transfer of foreign reserve assets to the ECB, when the Bank joined the Eurosystem. The remuneration of these claims is calculated daily at the latest available marginal interest rate used by the Eurosystem in its tenders for MROs, adjusted to reflect a zero return on the gold component.
Following (i) the increase in the weighting of the euro area NCBs in the ECB’s subscribed capital result-ing from the Bank of England’s withdrawal from the ESCB and (ii) a decision of the Governing Council to reduce the proportion of the euro area NCBs’ contributions, so that the total amount of foreign reserve assets already transferred by the euro area NCBs will remain at the current level, the Bank’s claim equivalent to this transfer was marginally adjusted. As at 31 December 2020, the Bank’s claim with respect to the foreign reserve assets transferred to the ECB amounted to €42,313,997 (2019: €42,420,163).
21 This will lead to an increase in the ECB’s paid-up capital from €7,659 million in 2020 to €8,270 million in 2021 and €8,880 million in 2022.
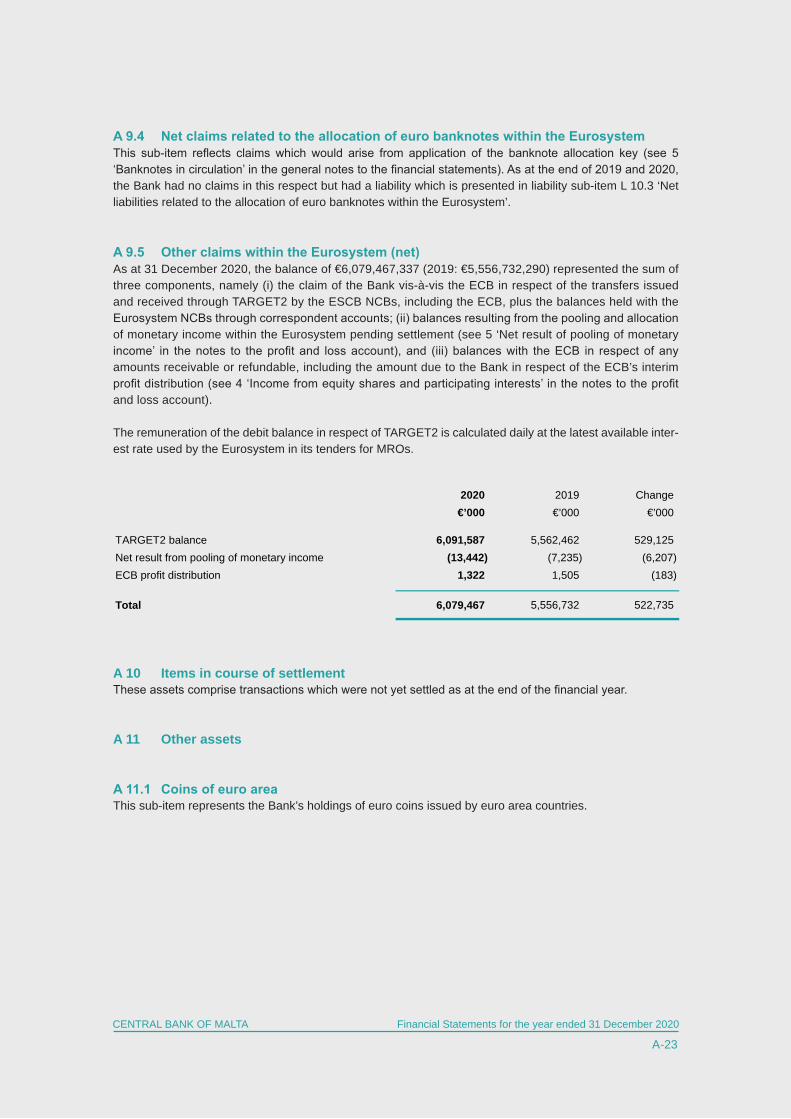
CENTRAL BANK OF MALTA
A-23
CENTRAL BANK OF MALTA Financial Statements for the year ended 31 December 2020
2020 2019 Change €’000 €’000 €’000
TARGET2 balance 6,091,587 5,562,462 529,125 Net result from pooling of monetary income (13,442) (7,235) (6,207)ECB profit distribution 1,322 1,505 (183)
Total 6,079,467 5,556,732 522,735
A 9.4 Net claims related to the allocation of euro banknotes within the EurosystemThis sub-item reflects claims which would arise from application of the banknote allocation key (see 5 ‘Banknotes in circulation’ in the general notes to the financial statements). As at the end of 2019 and 2020, the Bank had no claims in this respect but had a liability which is presented in liability sub-item L 10.3 ‘Net liabilities related to the allocation of euro banknotes within the Eurosystem’.
A 9.5 Other claims within the Eurosystem (net) As at 31 December 2020, the balance of €6,079,467,337 (2019: €5,556,732,290) represented the sum of three components, namely (i) the claim of the Bank vis-à-vis the ECB in respect of the transfers issued and received through TARGET2 by the ESCB NCBs, including the ECB, plus the balances held with the Eurosystem NCBs through correspondent accounts; (ii) balances resulting from the pooling and allocation of monetary income within the Eurosystem pending settlement (see 5 ‘Net result of pooling of monetary income’ in the notes to the profit and loss account), and (iii) balances with the ECB in respect of any amounts receivable or refundable, including the amount due to the Bank in respect of the ECB’s interim profit distribution (see 4 ‘Income from equity shares and participating interests’ in the notes to the profit and loss account).
The remuneration of the debit balance in respect of TARGET2 is calculated daily at the latest available inter-est rate used by the Eurosystem in its tenders for MROs.
A 10 Items in course of settlementThese assets comprise transactions which were not yet settled as at the end of the financial year.
A 11 Other assets
A 11.1 Coins of euro areaThis sub-item represents the Bank’s holdings of euro coins issued by euro area countries.
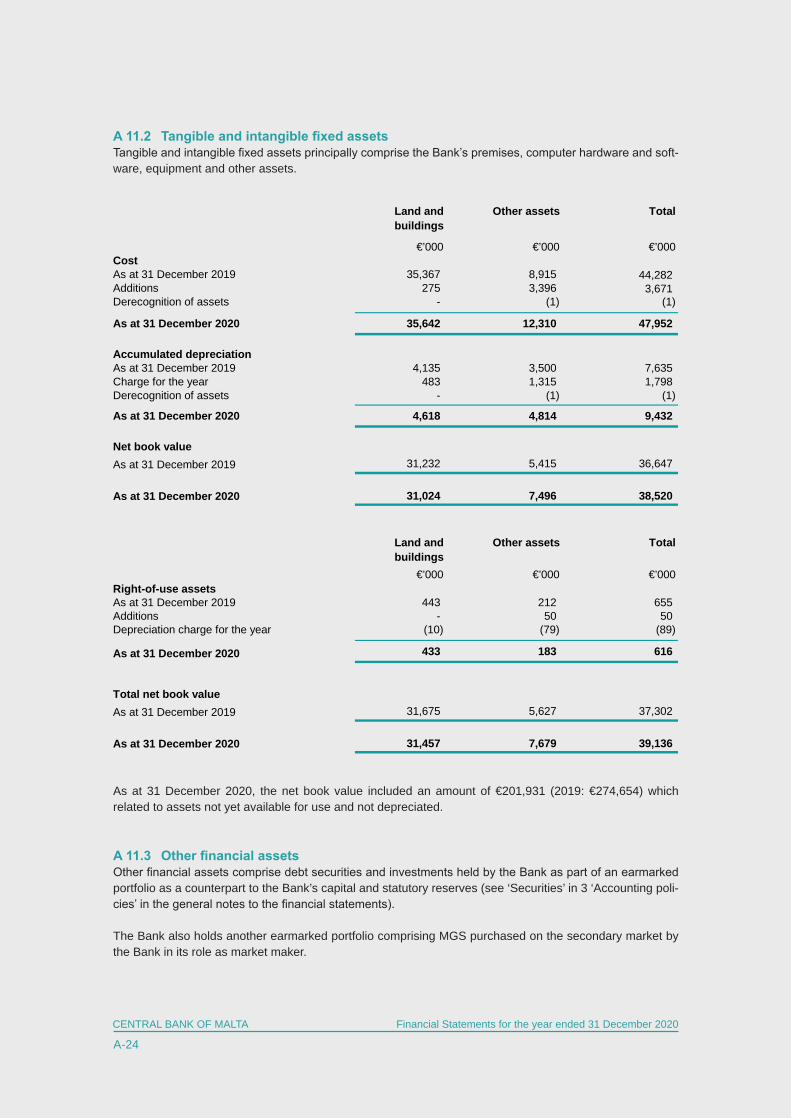
CENTRAL BANK OF MALTA
A-24
Financial Statements for the year ended 31 December 2020
Land and buildings
Other assets Total
€’000 €’000 €’000Cost As at 31 December 2019 35,367 8,915 44,282 Additions 275 3,396 3,671 Derecognition of assets - (1) (1)
As at 31 December 2020 35,642 12,310 47,952
Accumulated depreciationAs at 31 December 2019 4,135 3,500 7,635 Charge for the year 483 1,315 1,798 Derecognition of assets - (1) (1)
As at 31 December 2020 4,618 4,814 9,432
Net book valueAs at 31 December 2019 31,232 5,415 36,647
As at 31 December 2020 31,024 7,496 38,520
Land and buildings
Other assets Total
€’000 €’000 €’000Right-of-use assetsAs at 31 December 2019 443 212 655 Additions - 50 50 Depreciation charge for the year (10) (79) (89)
As at 31 December 2020 433 183 616
Total net book valueAs at 31 December 2019 31,675 5,627 37,302
As at 31 December 2020 31,457 7,679 39,136
A 11.2 Tangible and intangible fixed assets Tangible and intangible fixed assets principally comprise the Bank’s premises, computer hardware and soft-ware, equipment and other assets.
As at 31 December 2020, the net book value included an amount of €201,931 (2019: €274,654) which related to assets not yet available for use and not depreciated.
A 11.3 Other financial assetsOther financial assets comprise debt securities and investments held by the Bank as part of an earmarked portfolio as a counterpart to the Bank’s capital and statutory reserves (see ‘Securities’ in 3 ‘Accounting poli-cies’ in the general notes to the financial statements).
The Bank also holds another earmarked portfolio comprising MGS purchased on the secondary market by the Bank in its role as market maker.
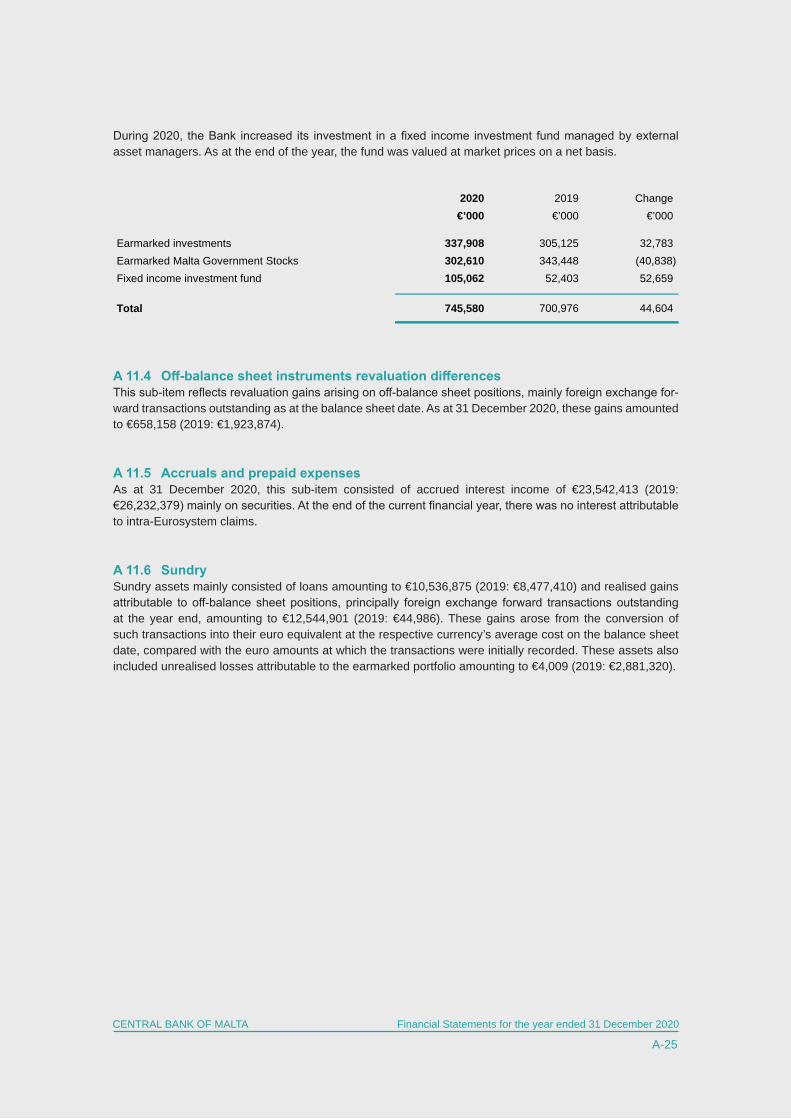
CENTRAL BANK OF MALTA
A-25
CENTRAL BANK OF MALTA Financial Statements for the year ended 31 December 2020
During 2020, the Bank increased its investment in a fixed income investment fund managed by external asset managers. As at the end of the year, the fund was valued at market prices on a net basis.
A 11.4 Off-balance sheet instruments revaluation differencesThis sub-item reflects revaluation gains arising on off-balance sheet positions, mainly foreign exchange for-ward transactions outstanding as at the balance sheet date. As at 31 December 2020, these gains amounted to €658,158 (2019: €1,923,874).
A 11.5 Accruals and prepaid expensesAs at 31 December 2020, this sub-item consisted of accrued interest income of €23,542,413 (2019: €26,232,379) mainly on securities. At the end of the current financial year, there was no interest attributable to intra-Eurosystem claims.
A 11.6 SundrySundry assets mainly consisted of loans amounting to €10,536,875 (2019: €8,477,410) and realised gains attributable to off-balance sheet positions, principally foreign exchange forward transactions outstanding at the year end, amounting to €12,544,901 (2019: €44,986). These gains arose from the conversion of such transactions into their euro equivalent at the respective currency’s average cost on the balance sheet date, compared with the euro amounts at which the transactions were initially recorded. These assets also included unrealised losses attributable to the earmarked portfolio amounting to €4,009 (2019: €2,881,320).
2020 2019 Change €’000 €’000 €’000
Earmarked investments 337,908 305,125 32,783 Earmarked Malta Government Stocks 302,610 343,448 (40,838)Fixed income investment fund 105,062 52,403 52,659
Total 745,580 700,976 44,604
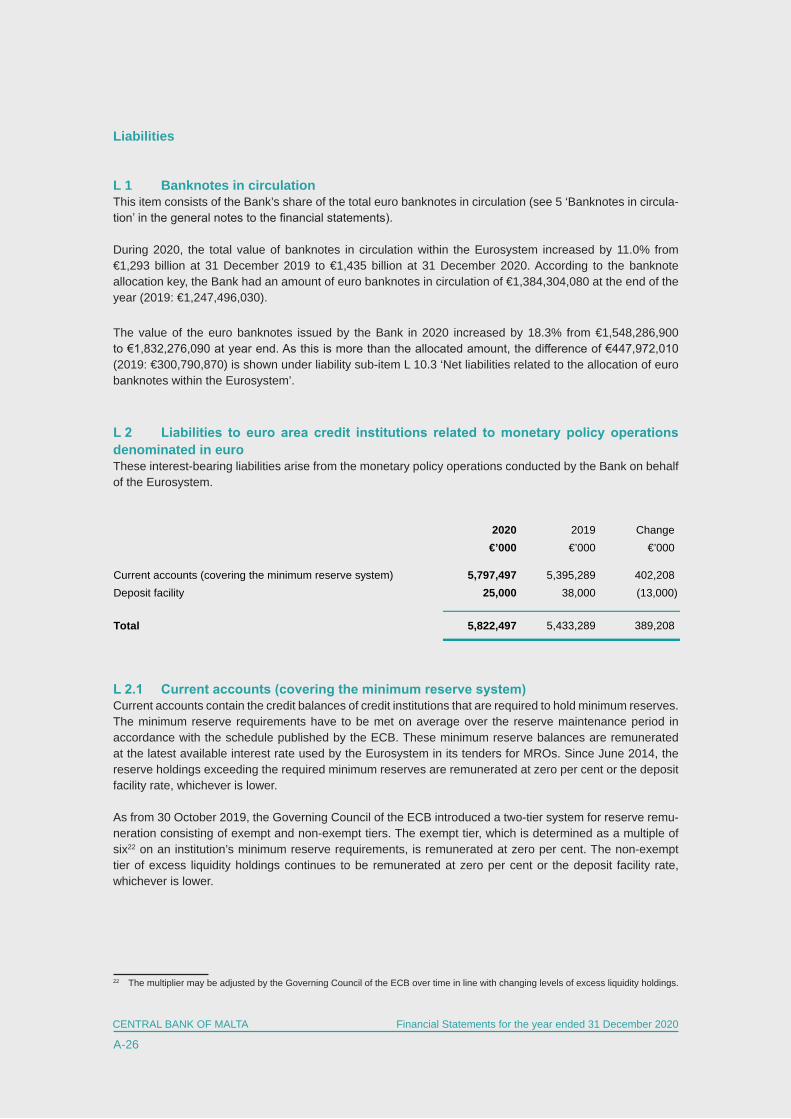
CENTRAL BANK OF MALTA
A-26
Financial Statements for the year ended 31 December 2020
2020 2019 Change €’000 €’000 €’000
Current accounts (covering the minimum reserve system) 5,797,497 5,395,289 402,208 Deposit facility 25,000 38,000 (13,000)
Total 5,822,497 5,433,289 389,208
Liabilities
L 1 Banknotes in circulationThis item consists of the Bank’s share of the total euro banknotes in circulation (see 5 ‘Banknotes in circula-tion’ in the general notes to the financial statements).
During 2020, the total value of banknotes in circulation within the Eurosystem increased by 11.0% from €1,293 billion at 31 December 2019 to €1,435 billion at 31 December 2020. According to the banknote allocation key, the Bank had an amount of euro banknotes in circulation of €1,384,304,080 at the end of the year (2019: €1,247,496,030).
The value of the euro banknotes issued by the Bank in 2020 increased by 18.3% from €1,548,286,900 to €1,832,276,090 at year end. As this is more than the allocated amount, the difference of €447,972,010 (2019: €300,790,870) is shown under liability sub-item L 10.3 ‘Net liabilities related to the allocation of euro banknotes within the Eurosystem’.
L 2 Liabilities to euro area credit institutions related to monetary policy operations denominated in euroThese interest-bearing liabilities arise from the monetary policy operations conducted by the Bank on behalf of the Eurosystem.
L 2.1 Current accounts (covering the minimum reserve system)Current accounts contain the credit balances of credit institutions that are required to hold minimum reserves. The minimum reserve requirements have to be met on average over the reserve maintenance period in accordance with the schedule published by the ECB. These minimum reserve balances are remunerated at the latest available interest rate used by the Eurosystem in its tenders for MROs. Since June 2014, the reserve holdings exceeding the required minimum reserves are remunerated at zero per cent or the deposit facility rate, whichever is lower.
As from 30 October 2019, the Governing Council of the ECB introduced a two-tier system for reserve remu-neration consisting of exempt and non-exempt tiers. The exempt tier, which is determined as a multiple of six22 on an institution’s minimum reserve requirements, is remunerated at zero per cent. The non-exempt tier of excess liquidity holdings continues to be remunerated at zero per cent or the deposit facility rate, whichever is lower.
22 The multiplier may be adjusted by the Governing Council of the ECB over time in line with changing levels of excess liquidity holdings.
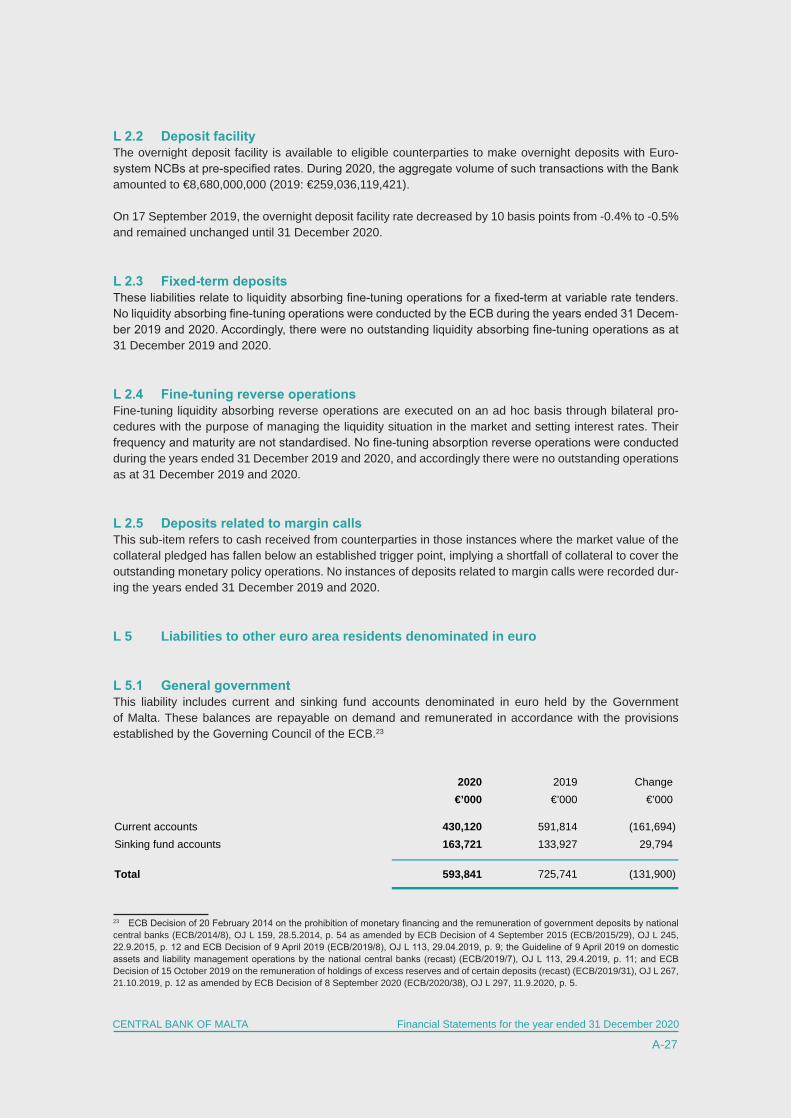
CENTRAL BANK OF MALTA
A-27
CENTRAL BANK OF MALTA Financial Statements for the year ended 31 December 2020
2020 2019 Change €’000 €’000 €’000
Current accounts 430,120 591,814 (161,694)Sinking fund accounts 163,721 133,927 29,794
Total 593,841 725,741 (131,900)
L 2.2 Deposit facilityThe overnight deposit facility is available to eligible counterparties to make overnight deposits with Euro-system NCBs at pre-specified rates. During 2020, the aggregate volume of such transactions with the Bank amounted to €8,680,000,000 (2019: €259,036,119,421).
On 17 September 2019, the overnight deposit facility rate decreased by 10 basis points from -0.4% to -0.5% and remained unchanged until 31 December 2020.
L 2.3 Fixed-term deposits These liabilities relate to liquidity absorbing fine-tuning operations for a fixed-term at variable rate tenders. No liquidity absorbing fine-tuning operations were conducted by the ECB during the years ended 31 Decem-ber 2019 and 2020. Accordingly, there were no outstanding liquidity absorbing fine-tuning operations as at 31 December 2019 and 2020.
L 2.4 Fine-tuning reverse operationsFine-tuning liquidity absorbing reverse operations are executed on an ad hoc basis through bilateral pro-cedures with the purpose of managing the liquidity situation in the market and setting interest rates. Their frequency and maturity are not standardised. No fine-tuning absorption reverse operations were conducted during the years ended 31 December 2019 and 2020, and accordingly there were no outstanding operations as at 31 December 2019 and 2020.
L 2.5 Deposits related to margin calls This sub-item refers to cash received from counterparties in those instances where the market value of the collateral pledged has fallen below an established trigger point, implying a shortfall of collateral to cover the outstanding monetary policy operations. No instances of deposits related to margin calls were recorded dur-ing the years ended 31 December 2019 and 2020.
L 5 Liabilities to other euro area residents denominated in euro
L 5.1 General governmentThis liability includes current and sinking fund accounts denominated in euro held by the Government of Malta. These balances are repayable on demand and remunerated in accordance with the provisions established by the Governing Council of the ECB.23
23 ECB Decision of 20 February 2014 on the prohibition of monetary financing and the remuneration of government deposits by national central banks (ECB/2014/8), OJ L 159, 28.5.2014, p. 54 as amended by ECB Decision of 4 September 2015 (ECB/2015/29), OJ L 245, 22.9.2015, p. 12 and ECB Decision of 9 April 2019 (ECB/2019/8), OJ L 113, 29.04.2019, p. 9; the Guideline of 9 April 2019 on domestic assets and liability management operations by the national central banks (recast) (ECB/2019/7), OJ L 113, 29.4.2019, p. 11; and ECB Decision of 15 October 2019 on the remuneration of holdings of excess reserves and of certain deposits (recast) (ECB/2019/31), OJ L 267, 21.10.2019, p. 12 as amended by ECB Decision of 8 September 2020 (ECB/2020/38), OJ L 297, 11.9.2020, p. 5.
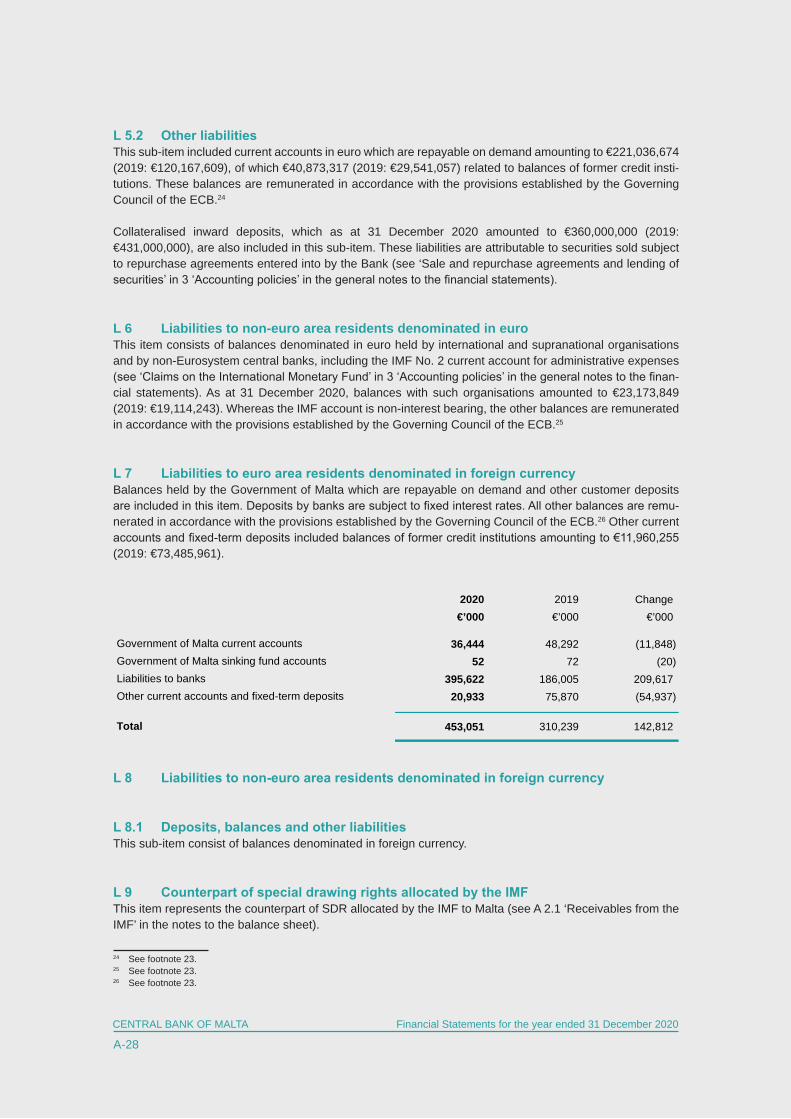
CENTRAL BANK OF MALTA
A-28
Financial Statements for the year ended 31 December 2020
L 5.2 Other liabilitiesThis sub-item included current accounts in euro which are repayable on demand amounting to €221,036,674 (2019: €120,167,609), of which €40,873,317 (2019: €29,541,057) related to balances of former credit insti-tutions. These balances are remunerated in accordance with the provisions established by the Governing Council of the ECB.24
Collateralised inward deposits, which as at 31 December 2020 amounted to €360,000,000 (2019: €431,000,000), are also included in this sub-item. These liabilities are attributable to securities sold subject to repurchase agreements entered into by the Bank (see ‘Sale and repurchase agreements and lending of securities’ in 3 ‘Accounting policies’ in the general notes to the financial statements).
L 6 Liabilities to non-euro area residents denominated in euroThis item consists of balances denominated in euro held by international and supranational organisations and by non-Eurosystem central banks, including the IMF No. 2 current account for administrative expenses (see ‘Claims on the International Monetary Fund’ in 3 ‘Accounting policies’ in the general notes to the finan-cial statements). As at 31 December 2020, balances with such organisations amounted to €23,173,849 (2019: €19,114,243). Whereas the IMF account is non-interest bearing, the other balances are remunerated in accordance with the provisions established by the Governing Council of the ECB.25
L 7 Liabilities to euro area residents denominated in foreign currencyBalances held by the Government of Malta which are repayable on demand and other customer deposits are included in this item. Deposits by banks are subject to fixed interest rates. All other balances are remu-nerated in accordance with the provisions established by the Governing Council of the ECB.26 Other current accounts and fixed-term deposits included balances of former credit institutions amounting to €11,960,255 (2019: €73,485,961).
L 8 Liabilities to non-euro area residents denominated in foreign currency
L 8.1 Deposits, balances and other liabilitiesThis sub-item consist of balances denominated in foreign currency.
L 9 Counterpart of special drawing rights allocated by the IMFThis item represents the counterpart of SDR allocated by the IMF to Malta (see A 2.1 ‘Receivables from the IMF’ in the notes to the balance sheet).
24 See footnote 23.25 See footnote 23.26 See footnote 23.
2020 2019 Change €’000 €’000 €’000
36,444 48,292 (11,848)52 72 (20)
395,622 186,005 209,617 20,933 75,870 (54,937)
453,051 310,239 142,812
Other current accounts and fixed-term deposits
Total
Liabilities to banks
Government of Malta current accountsGovernment of Malta sinking fund accounts

CENTRAL BANK OF MALTA
A-29
CENTRAL BANK OF MALTA Financial Statements for the year ended 31 December 2020
2020 2019 Change €’000 €’000 €’000
1,185 1,646 (461)2,856 2,063 793
4,041 3,709 332
Accrued interest payableOthers
Total
L 10 Intra-Eurosystem liabilitiesThis item represents the Bank’s liabilities to the ECB and to the other Eurosystem NCBs.
L 10.3 Net liabilities related to the allocation of euro banknotes within the EurosystemThis sub-item consists of the liability of the Bank vis-à-vis the Eurosystem relating to the excess of euro banknotes issued by the Bank over and above the amount allocated to the Bank by the ECB in accordance with the banknote allocation key (see L 1 ‘Banknotes in circulation’ in the notes to the balance sheet). The increase in the excess euro banknotes in 2020 reflects the relatively higher increase (18.3%) in the banknotes issued by the Bank as compared to the increase in banknotes put into circulation by the Eurosys-tem as a whole (11.0%).
L 10.4 Other liabilities within the Eurosystem (net)As at 31 December 2019 and 2020, the Bank had a net claim within the Eurosystem as reported under asset sub-item A 9.5 ‘Other claims within the Eurosystem (net)’.
L 12 Other liabilities
L 12.1 Off-balance sheet instruments revaluation differences This sub-item reflects revaluation losses arising on off-balance sheet positions, mainly foreign exchange forward transactions outstanding as at the balance sheet date.
L 12.2 Accruals and income collected in advance This sub-item includes accrued interest expense on interest-bearing liabilities, and other accrued expenses.
L 12.3 SundrySundry liabilities mainly included unrealised revaluation gains attributable to MGS held as part of the ear-marked portfolio amounting to €20,099,362 (2019: €22,605,928) and unrealised revaluation gains attribut-able to the other earmarked portfolios amounting to €9,429,752 (2019: €6,663,705). This sub-item also included lease liability of €616,273 (2019: €654,891) (see ‘Leases’ in 3 ‘Accounting policies’ in the general notes to the financial statements).
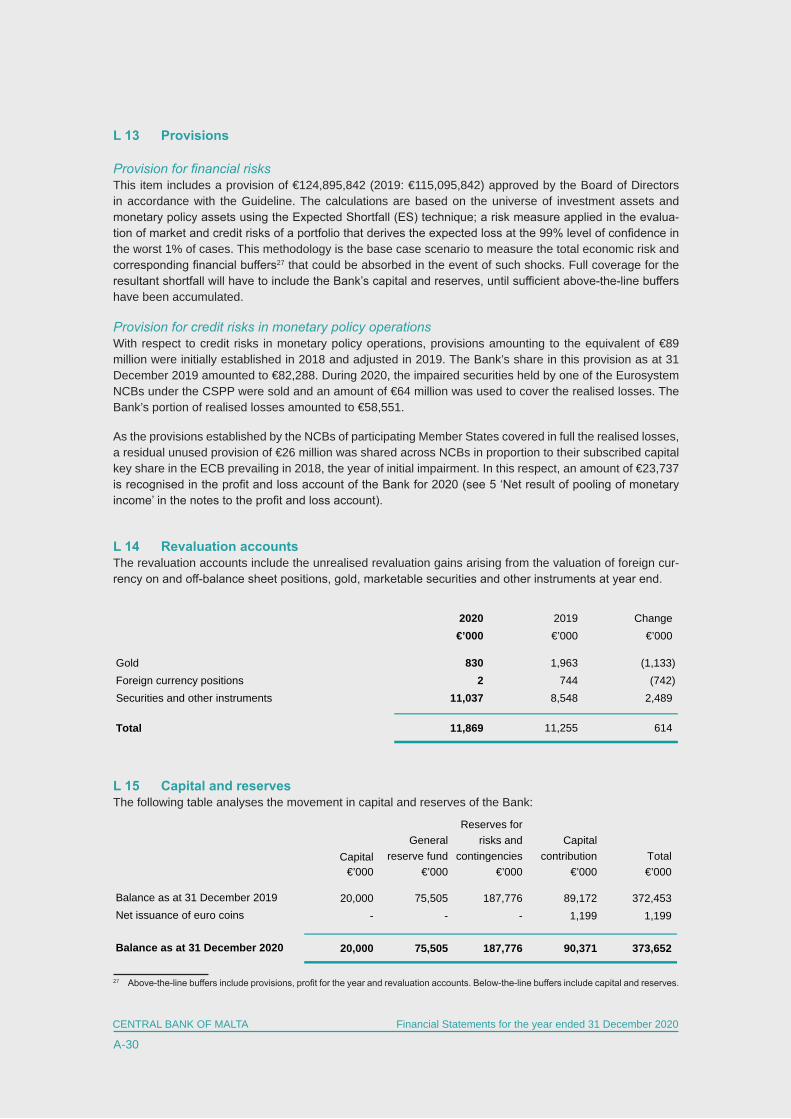
CENTRAL BANK OF MALTA
A-30
Financial Statements for the year ended 31 December 2020
L 13 Provisions
Provision for financial risksThis item includes a provision of €124,895,842 (2019: €115,095,842) approved by the Board of Directors in accordance with the Guideline. The calculations are based on the universe of investment assets and monetary policy assets using the Expected Shortfall (ES) technique; a risk measure applied in the evalua-tion of market and credit risks of a portfolio that derives the expected loss at the 99% level of confidence in the worst 1% of cases. This methodology is the base case scenario to measure the total economic risk and corresponding financial buffers27 that could be absorbed in the event of such shocks. Full coverage for the resultant shortfall will have to include the Bank’s capital and reserves, until sufficient above-the-line buffers have been accumulated.
Provision for credit risks in monetary policy operationsWith respect to credit risks in monetary policy operations, provisions amounting to the equivalent of €89 million were initially established in 2018 and adjusted in 2019. The Bank’s share in this provision as at 31 December 2019 amounted to €82,288. During 2020, the impaired securities held by one of the Eurosystem NCBs under the CSPP were sold and an amount of €64 million was used to cover the realised losses. The Bank’s portion of realised losses amounted to €58,551.
As the provisions established by the NCBs of participating Member States covered in full the realised losses, a residual unused provision of €26 million was shared across NCBs in proportion to their subscribed capital key share in the ECB prevailing in 2018, the year of initial impairment. In this respect, an amount of €23,737 is recognised in the profit and loss account of the Bank for 2020 (see 5 ‘Net result of pooling of monetary income’ in the notes to the profit and loss account).
L 14 Revaluation accountsThe revaluation accounts include the unrealised revaluation gains arising from the valuation of foreign cur-rency on and off-balance sheet positions, gold, marketable securities and other instruments at year end.
L 15 Capital and reservesThe following table analyses the movement in capital and reserves of the Bank:
27 Above-the-line buffers include provisions, profit for the year and revaluation accounts. Below-the-line buffers include capital and reserves.
2020 2019 Change €’000 €’000 €’000
Gold 830 1,963 (1,133)Foreign currency positions 2 744 (742)Securities and other instruments 11,037 8,548 2,489
Total 11,869 11,255 614
Reserves for General risks and Capital reserve fund contingencies contribution Total
€’000 €’000 €’000 €’000 €’000
20,000 75,505 187,776 89,172 372,453 - - - 1,199 1,199
20,000 75,505 187,776 90,371 373,652
Capital
Balance as at 31 December 2019Net issuance of euro coins
Balance as at 31 December 2020
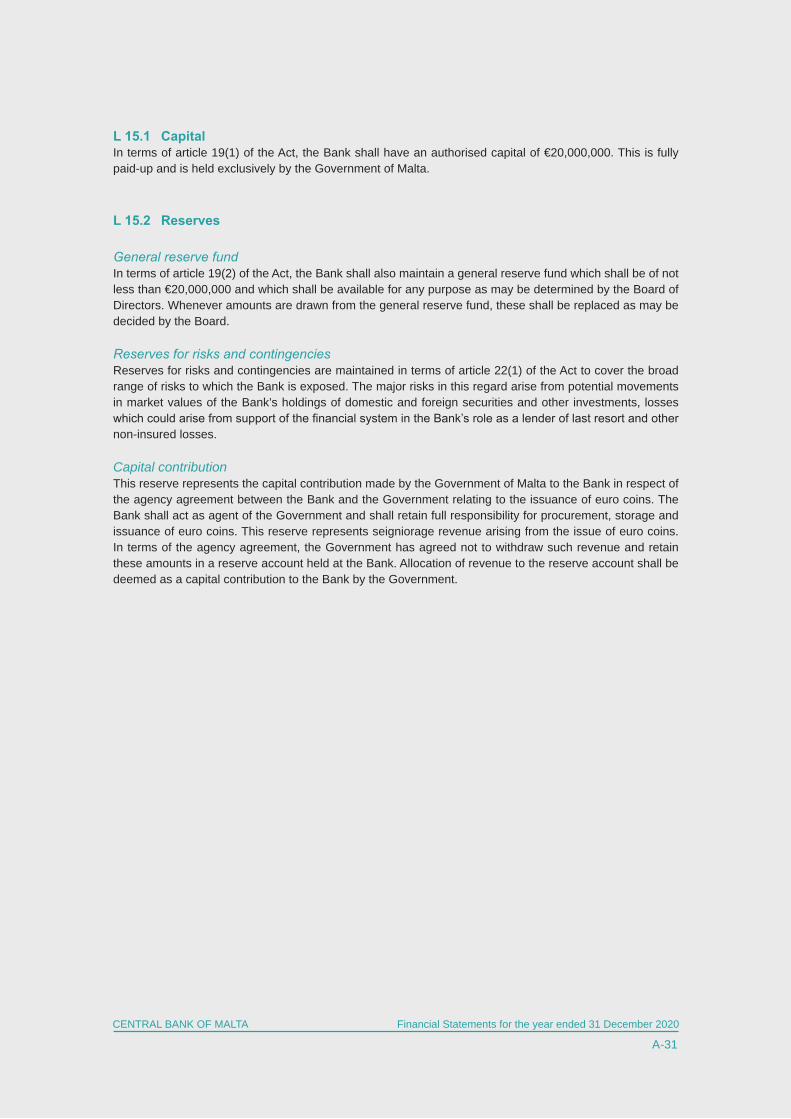
CENTRAL BANK OF MALTA
A-31
CENTRAL BANK OF MALTA Financial Statements for the year ended 31 December 2020
L 15.1 CapitalIn terms of article 19(1) of the Act, the Bank shall have an authorised capital of €20,000,000. This is fully paid-up and is held exclusively by the Government of Malta.
L 15.2 Reserves
General reserve fundIn terms of article 19(2) of the Act, the Bank shall also maintain a general reserve fund which shall be of not less than €20,000,000 and which shall be available for any purpose as may be determined by the Board of Directors. Whenever amounts are drawn from the general reserve fund, these shall be replaced as may be decided by the Board.
Reserves for risks and contingenciesReserves for risks and contingencies are maintained in terms of article 22(1) of the Act to cover the broad range of risks to which the Bank is exposed. The major risks in this regard arise from potential movements in market values of the Bank’s holdings of domestic and foreign securities and other investments, losses which could arise from support of the financial system in the Bank’s role as a lender of last resort and other non-insured losses.
Capital contributionThis reserve represents the capital contribution made by the Government of Malta to the Bank in respect of the agency agreement between the Bank and the Government relating to the issuance of euro coins. The Bank shall act as agent of the Government and shall retain full responsibility for procurement, storage and issuance of euro coins. This reserve represents seigniorage revenue arising from the issue of euro coins. In terms of the agency agreement, the Government has agreed not to withdraw such revenue and retain these amounts in a reserve account held at the Bank. Allocation of revenue to the reserve account shall be deemed as a capital contribution to the Bank by the Government.
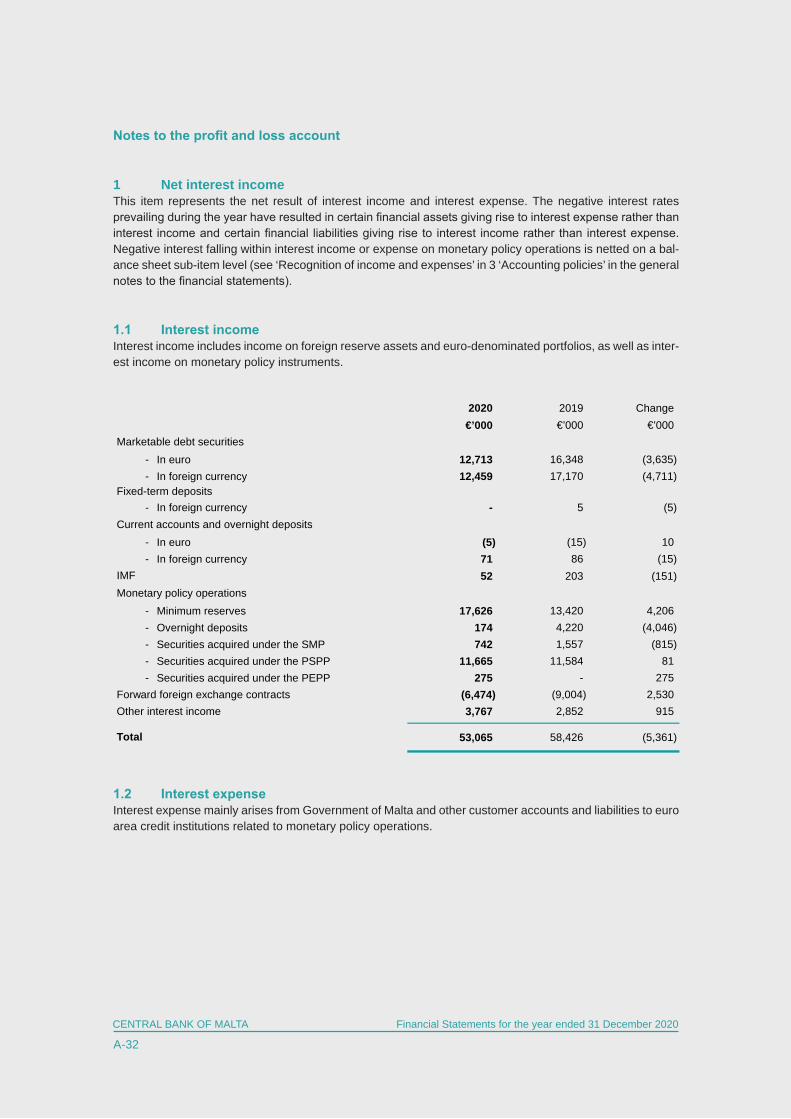
CENTRAL BANK OF MALTA
A-32
Financial Statements for the year ended 31 December 2020
Notes to the profit and loss account
1 Net interest income This item represents the net result of interest income and interest expense. The negative interest rates prevailing during the year have resulted in certain financial assets giving rise to interest expense rather than interest income and certain financial liabilities giving rise to interest income rather than interest expense. Negative interest falling within interest income or expense on monetary policy operations is netted on a bal-ance sheet sub-item level (see ‘Recognition of income and expenses’ in 3 ‘Accounting policies’ in the general notes to the financial statements).
1.1 Interest incomeInterest income includes income on foreign reserve assets and euro-denominated portfolios, as well as inter-est income on monetary policy instruments.
1.2 Interest expenseInterest expense mainly arises from Government of Malta and other customer accounts and liabilities to euro area credit institutions related to monetary policy operations.
2020 2019 Change €’000 €’000 €’000
- In euro 12,713 16,348 (3,635)- In foreign currency 12,459 17,170 (4,711)
- In foreign currency - 5 (5)
- In euro (5) (15) 10 - In foreign currency 71 86 (15)
52 203 (151)
- Minimum reserves 17,626 13,420 4,206 - Overnight deposits 174 4,220 (4,046)- Securities acquired under the SMP 742 1,557 (815)- Securities acquired under the PSPP 11,665 11,584 81 - Securities acquired under the PEPP 275 - 275
Forward foreign exchange contracts (6,474) (9,004) 2,530 Other interest income 3,767 2,852 915
53,065 58,426 (5,361)Total
Marketable debt securities
Fixed-term deposits
Current accounts and overnight deposits
IMFMonetary policy operations

CENTRAL BANK OF MALTA
A-33
CENTRAL BANK OF MALTA Financial Statements for the year ended 31 December 2020
2020 2019 Change€’000 €’000 €’000
Write-downs on debt securities 139 175 (36)Write-downs on foreign currency positions 29 240 (211)
Total 168 415 (247)
2020 2019 Change €’000 €’000 €’000
Net gains on disposal of financial instruments 11,787 16,173 (4,386)Net gains on foreign currency positions 7,129 1,074 6,055
Total 18,916 17,247 1,669
2 Net result of financial operations, write-downs and risk provisions
2.1 Realised gains/losses arising from financial operationsThis sub-item includes realised gains arising from the disposal of financial instruments, mainly debt securi-ties, and reductions in foreign currency positions.
2.2 Write-downs on financial assets and positionsThis sub-item comprises unrealised revaluation losses arising from the price revaluation of debt securities and the exchange rate revaluation of foreign currency assets and liabilities, including off-balance sheet posi-tions, by comparing the market value at balance sheet date with the average book value.
2.3 Transfer to/from provision for financial risksThis sub-item consists of movements in provisions (see L 13 ‘Provisions’ in the notes to the balance sheet).
2020 2019 Change €’000 €’000 €’000
- In euro (4,395) (3,312) (1,083)- In foreign currency (19) (14) (5)
Other customer accounts- In euro (1,082) (698) (384)- In foreign currency 1,038 5,250 (4,212)
Monetary policy operations- Longer-term refinancing operations 619 94 525
Other interest expense (1,831) (1,989) 158
(5,670) (669) (5,001)
Government accounts
Total
CENTRAL BANK OF MALTA
A-34
Financial Statements for the year ended 31 December 2020
3 Net income/expense from fees and commissionsFees and commissions receivable mainly arise from banking services provided by the Bank. Fees and com-missions payable include correspondent account charges, handling fees on cheques drawn on the Bank and TARGET2 connection and participation fees.
4 Income from equity shares and participating interestsDuring 2020, the Bank received an amount of €982,868 (2019: €353,527) representing its relative share of the ECB’s distributable remaining profits for 2019, in proportion to the Bank’s subscribed capital key (see 4 ‘Capital key’ in the general notes to the financial statements).
Also, included under this caption is the amount of €1,321,714 (2019: €1,504,568) due to the Bank with respect to the ECB’s 2020 interim profit distribution (see 6 ‘ECB profit distribution’ in the general notes to the financial statements).
5 Net result of pooling of monetary incomeThis item contains the net result of pooling of monetary income for 2020 amounting to an expense of €13,385,303 (2019: €7,220,428). In 2020, a net expense of €56,652 (2019: €14,713) was paid in relation to an adjustment for the previous two years. This mainly related to the Bank’s portion of the realised loss arising from the sale in 2020 of the securities held by an NCB of the Eurosystem in the CSPP.
This item also includes an income of €82,288 (2019: €65,922), representing the Bank’s share of the release of the provision against losses in monetary policy portfolio (see L 13 ‘Provisions’ in the notes to the balance sheet).
The amount of each Eurosystem NCB’s monetary income is determined by measuring the actual annual income that is derived from the earmarkable assets held against the liability base. The liability base consists mainly of the following items: banknotes in circulation; liabilities to euro area credit institutions related to monetary policy operations denominated in euro; net intra-Eurosystem liabilities resulting from TARGET2 transactions; net intra-Eurosystem liabilities related to the allocation of euro banknotes within the Eurosys-tem, accrued interest recorded at quarter-end by each NCB on monetary policy liabilities with a maturity of one year or longer; and liabilities vis-à-vis the ECB backing the claim in relation to swap agreements that earn net income for the Eurosystem. Any interest paid on liabilities included within the liability base is to be deducted from the monetary income to be pooled.
The earmarkable assets consist mainly of the following items: lending to euro area credit institutions related to monetary policy operations denominated in euro; securities held for monetary policy purposes; intra-Eurosystem claims equivalent to the transfer of foreign reserve assets to the ECB; net intra-Eurosystem claims resulting from TARGET2 transactions; net intra-Eurosystem claims related to the allocation of euro banknotes within the Eurosystem; claims on euro area counterparties related to swap agreements between the ECB and non-Eurosystem central banks that earn net income for the Eurosystem; accrued interest recorded at quarter-end by each NCB on monetary policy assets with a maturity of one year or longer; and a limited amount of each NCB’s gold holdings in proportion to each NCB’s capital key share.
The amount of each NCB’s monetary income shall be determined by measuring the actual income that is derived from the earmarkable assets recorded in its books. As an exception to this, gold is considered to generate no income and the following are considered to generate income at the latest available marginal interest rate used by the Eurosystem in its tenders for MROs: securities held under CBPP,28 CBPP229 and
28 ECB decision of 2 July 2009 on the implementation of the covered bond purchase programme (ECB/2009/16), OJ L175, 4.7.2009, p. 18. 29 ECB decision of 3 November 2011 on the implementation of the second covered bond purchase programme (ECB/2011/17), OJ L297, 16.11.2011, p. 70.
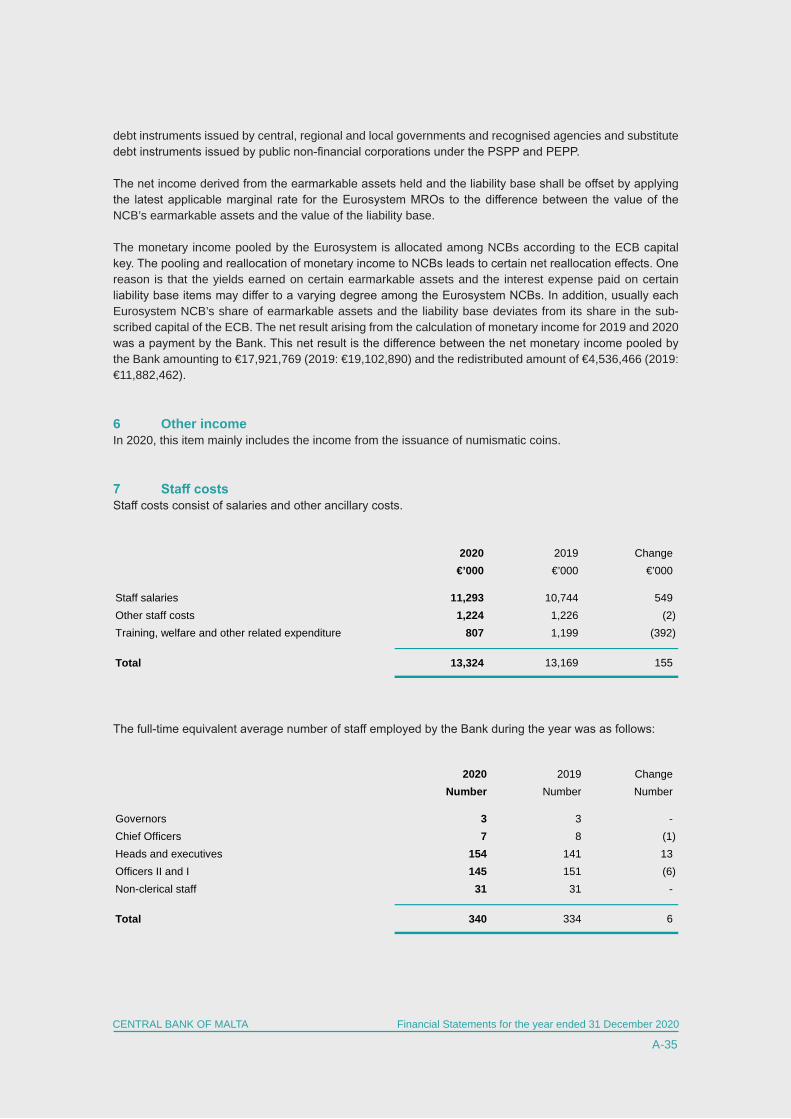
CENTRAL BANK OF MALTA
A-35
CENTRAL BANK OF MALTA Financial Statements for the year ended 31 December 2020
2020 2019 Change €’000 €’000 €’000
Staff salaries 11,293 10,744 549 Other staff costs 1,224 1,226 (2)Training, welfare and other related expenditure 807 1,199 (392)
Total 13,324 13,169 155
2020 2019 Change Number Number Number
Governors 3 3 - Chief Officers 7 8 (1)Heads and executives 154 141 13 Officers II and I 145 151 (6)Non-clerical staff 31 31 -
Total 340 334 6
debt instruments issued by central, regional and local governments and recognised agencies and substitute debt instruments issued by public non-financial corporations under the PSPP and PEPP.
The net income derived from the earmarkable assets held and the liability base shall be offset by applying the latest applicable marginal rate for the Eurosystem MROs to the difference between the value of the NCB’s earmarkable assets and the value of the liability base.
The monetary income pooled by the Eurosystem is allocated among NCBs according to the ECB capital key. The pooling and reallocation of monetary income to NCBs leads to certain net reallocation effects. One reason is that the yields earned on certain earmarkable assets and the interest expense paid on certain liability base items may differ to a varying degree among the Eurosystem NCBs. In addition, usually each Eurosystem NCB’s share of earmarkable assets and the liability base deviates from its share in the sub-scribed capital of the ECB. The net result arising from the calculation of monetary income for 2019 and 2020 was a payment by the Bank. This net result is the difference between the net monetary income pooled by the Bank amounting to €17,921,769 (2019: €19,102,890) and the redistributed amount of €4,536,466 (2019: €11,882,462).
6 Other incomeIn 2020, this item mainly includes the income from the issuance of numismatic coins.
7 Staff costs Staff costs consist of salaries and other ancillary costs.
The full-time equivalent average number of staff employed by the Bank during the year was as follows:
CENTRAL BANK OF MALTA
A-36
Financial Statements for the year ended 31 December 2020
8 Administrative expensesThis item consists of operating expenditure incurred by the Bank.
Administrative expenses of €8,525,041 (2019: €7,269,536) comprised maintenance expenditure, profes-sional fees, travelling costs and other expense items which were incurred in the course of the Bank’s opera-tions. Auditors’ remuneration, inclusive of VAT, for the year ended 31 December 2020 amounted to €81,500 (2019: €79,000).
Compensation to the members of the Board of Directors for the financial year ended 31 December 2020 amounted to €305,342 (2019: €269,598). The Governor and Deputy Governors are entitled to benefits such as health insurance cover and refund of certain other expenses. The other members of the Board of Direc-tors are entitled to a health insurance cover and the refund of certain other expenses.
9 Depreciation of tangible and intangible fixed assetsDepreciation of buildings, computer hardware and software, equipment and other assets was charged to the Bank’s profit and loss account according to the depreciation rates disclosed in ‘Tangible and intangible fixed assets’ and ‘Leases’ in 3 ‘Accounting policies’ in the general notes to the financial statements.
10 Banknote production servicesThis item consists of expenditure relating to the procurement and transportation of euro banknotes and other ancillary costs.
CENTRAL BANK OF MALTA
A-37
CENTRAL BANK OF MALTA Financial Statements for the year ended 31 December 2020
Other notes
Off-balance sheet instruments As at 31 December 2020, the Bank had outstanding net foreign exchange forward and swap contracts of €292,348,449 (2019: €387,472,370) against other currencies (principally the US dollar). Unsettled net spot transactions as at 31 December 2020 were €8,630,000 (2019: €16,730,000).
At the balance sheet date, the Bank had outstanding interest rate futures contracts linked to German govern-ment securities (net long position with a notional amount of €33,213,150) and US treasury notes (net short position with a notional amount of US$7,051,774).
Contingent liabilities and commitmentsAs at 31 December 2020, the bank did not have any contingent liabilities. As at 31 December 2019, these consisted of outstanding guarantees amounting to €2,300.
As at the end of the year, the Bank had commitments in respect of tangible and intangible fixed assets which extended beyond the balance sheet date. Capital commitments, which amount to €8,705,300 (2019: €6,953,000), are expected to be incurred during the forthcoming financial year and relate mainly to capital expenditure attributable to buildings and investment in IT.
Transactions with GovernmentIn the course of its operations, the Bank conducts banking transactions with, and provides several banking services to, the Government of Malta, government departments, public sector corporations and other enti-ties owned by the Government. The Bank holds the principal accounts of the Government and maintains accounts for the other entities. Balances held with the Bank by the Government and the other entities as at the balance sheet date, together with the terms of such instruments, are disclosed in L 5 ‘Liabilities to other euro area residents denominated in euro’ and L 7 ‘Liabilities to euro area residents denominated in foreign currency’ in the notes to the balance sheet. The net interest on deposits arising from these banking transac-tions is recognised in item 1.2 ‘Interest expense’ in the Bank’s profit and loss account. The Bank provides these entities with foreign exchange and related services, which do not have a significant impact on the Bank’s profit and loss account.
Market maker in Malta Government securities The Bank acts as market maker in MGS and Treasury bills and ensures their liquidity in the secondary market by being ready to trade in such securities on the initiative of the market (see A 11.3 ‘Other financial assets’ in the notes to the balance sheet). Income earned by the Bank from these assets, amounting to €3,109,292 (2019: €3,838,260), is included in 1.1 ‘Interest income’ in the notes to the profit and loss account and presented within income from euro marketable debt securities.
Investment securities pledged as collateralAs at 31 December 2020, investment securities were pledged as collateral against the provision of credit lines by a counterparty up to an amount of US$65,000,000 or approximately €52,900,000 (2019: US$65,000,000 or approximately €58,300,000). No amounts were borrowed under these facilities at the balance sheet dates.
Assets held in custodyAs at 31 December 2020, assets held in custody by the Bank in terms of the Insurance Business Act (Cap. 403) amounted to the equivalent of €18,387,295 (2019: €22,398,008).
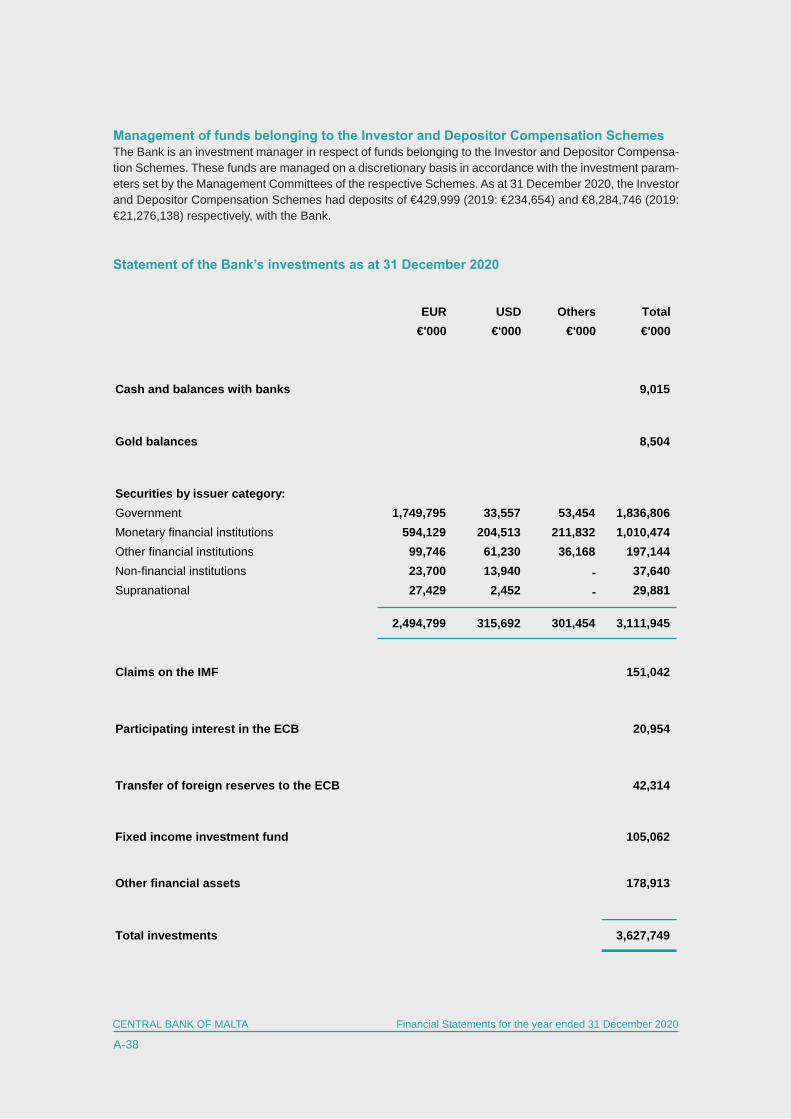
CENTRAL BANK OF MALTA
A-38
Financial Statements for the year ended 31 December 2020
Management of funds belonging to the Investor and Depositor Compensation SchemesThe Bank is an investment manager in respect of funds belonging to the Investor and Depositor Compensa-tion Schemes. These funds are managed on a discretionary basis in accordance with the investment param-eters set by the Management Committees of the respective Schemes. As at 31 December 2020, the Investor and Depositor Compensation Schemes had deposits of €429,999 (2019: €234,654) and €8,284,746 (2019: €21,276,138) respectively, with the Bank.
Statement of the Bank’s investments as at 31 December 2020
EUR USD Others Total €'000 €'000 €'000 €'000
Cash and balances with banks 9,015
Gold balances 8,504
Securities by issuer category: Government 1,749,795 33,557 53,454 1,836,806Monetary financial institutions 594,129 204,513 211,832 1,010,474Other financial institutions 99,746 61,230 36,168 197,144Non-financial institutions 23,700 13,940 - 37,640Supranational 27,429 2,452 - 29,881
2,494,799 315,692 301,454 3,111,945
Claims on the IMF 151,042
Participating interest in the ECB 20,954
Transfer of foreign reserves to the ECB 42,314
Fixed income investment fund 105,062
Other financial assets 178,913
Total investments 3,627,749
CENTRAL BANK OF MALTA
A-39
CENTRAL BANK OF MALTA Financial Statements for the year ended 31 December 2020
KPMG, a Maltese civil partnership and a member firm of the KPMG global organisation of independent member firms affiliated with KPMG International Limited, a private English company limited by guarantee.
The firm is registered as a partnership of Certified Public Accountants in terms of the Accountancy Profession Act.
A list of partners and directors of the firm is available at 92, Marina Street, Pietà, PTA9044, Malta.
KPMG92, Marina StreetPietà, PTA 9044 MaltaTelephone (+356) 2563 1000Fax (+356) 2566 1000Website www.kpmg.com.mt
Independent Auditors’ Report
To the Directors of the Central Bank of Malta
Opinion
We have audited the financial statements of the Central Bank of Malta (the “Bank”) which comprise the balance sheet as at 31 December 2020, the profit and loss account for the year then ended, and notes, comprising significant accounting policies and other explanatory information.
In our opinion, the accompanying financial statements give a true and fair view of the financial position of the Bank as at 31 December 2020, and of its financial performance for the year then ended in accordance with the basis of accounting described in the guideline on the legal frame-work for accounting and financial reporting in the European System of Central Banks (recast) ECB/2016/34 issued on 3 November 2016 as amended by subsequent European Central Bank guidelines (the “Guideline”), as established by the Central Bank of Malta Act (Chapter 204, Laws of Malta).
Basis for opinion
We conducted our audit in accordance with International Standards on Auditing (“ISAs”). Our responsibilities under those standards are further described in the Auditors’ responsibilities for the audit of the financial statements section of our report. We are independent of the Bank in accordance with the International Ethics Standards Board for Accountants’ International Code of Ethics for Professional Accountants (including International Independence Standards) (IESBA Code), together with the ethical requirements that are relevant to our audit of the finan-cial statements in accordance with the Accountancy Profession (Code of Ethics for Warrant Holders) Directive issued in terms of the Accountancy Profession Act (Chapter 281, Laws of Malta), and we have fulfilled our other ethical responsibilities in accordance with these require-ments and the IESBA Code. We believe that the audit evidence we have obtained is sufficient and appropriate to provide a basis for our opinion.
CENTRAL BANK OF MALTA
A-40
Financial Statements for the year ended 31 December 2020
KPMG, a Maltese civil partnership and a member firm of the KPMG global organisation of independent member firms affiliated with KPMG International Limited, a private English company limited by guarantee.
The firm is registered as a partnership of Certified Public Accountants in terms of the Accountancy Profession Act.
A list of partners and directors of the firm is available at 92, Marina Street, Pietà, PTA9044, Malta.
KPMG92, Marina StreetPietà, PTA 9044 MaltaTelephone (+356) 2563 1000Fax (+356) 2566 1000Website www.kpmg.com.mt
Independent Auditors’ Report (continued)
To the Directors of the Central Bank of Malta
Other information
The directors are responsible for the other information. The other information comprises
(i) the ‘Directors’ Report’, which we obtained prior to the date of this auditor’s report; and(ii) the ‘Governor’s Statement’, the ‘Financial and Economic Developments’; and the ‘Bank Poli-
cies, Operations and Activities’, which are expected to be made available to us after that date.
The other information does not include the financial statements and our auditors’ report thereon. Our opinion on the financial statements does not cover the other information and, we do not and will not express any form of assurance conclusion thereon.
In connection with our audit of the financial statements, our responsibility is to read the other information identified above, and, in doing so, consider whether the other information is materially inconsistent with the financial statements or our knowledge obtained in the audit, or otherwise appears to be materially misstated. If, based on the work we have performed on the other infor-mation that we have obtained prior to the date of this auditors’ report, we conclude that there is a material misstatement of this other information, we are required to report that fact. We have nothing to report in this regard.
When we read the other information not yet received identified in this section of our report, if we conclude that there is a material misstatement therein, we are required to communicate the matter to the directors. In the event that a material misstatement in the other information not yet received is not corrected by the directors, we are required to determine the appropriate course of action in accordance with the requirements of ISAs.
Responsibilities of the directors for the financial statements
As those charged with governance of the Bank, the directors are responsible for the preparation of financial statements that give a true and fair view in accordance with the basis of accounting described in the Guideline, and for such internal control as the directors determine is necessary to enable the preparation of financial statements that are free from material misstatement, whether due to fraud or error.
CENTRAL BANK OF MALTA
A-41
CENTRAL BANK OF MALTA Financial Statements for the year ended 31 December 2020
KPMG, a Maltese civil partnership and a member firm of the KPMG global organisation of independent member firms affiliated with KPMG International Limited, a private English company limited by guarantee.
The firm is registered as a partnership of Certified Public Accountants in terms of the Accountancy Profession Act.
A list of partners and directors of the firm is available at 92, Marina Street, Pietà, PTA9044, Malta.
KPMG92, Marina StreetPietà, PTA 9044 MaltaTelephone (+356) 2563 1000Fax (+356) 2566 1000Website www.kpmg.com.mt
Independent Auditors’ Report (continued)
To the Directors of the Central Bank of Malta
Responsibilities of the directors for the financial statements (continued)
In preparing the financial statements, the directors are responsible for assessing the Bank’s ability to continue as a going concern, disclosing, as applicable, matters related to going concern. The directors are required to use the going concern basis of accounting as pronounced in the Guide-line, provided there are no factual or legal impediments to do so.
The directors are also responsible for overseeing the financial reporting process.
Auditors’ responsibilities for the audit of the financial statements
Our objectives are to obtain reasonable assurance about whether the financial statements as a whole are free from material misstatement, whether due to fraud or error, and to issue an auditors’ report that includes our opinion. ‘Reasonable assurance’ is a high level of assurance, but is not a guarantee that an audit conducted in accordance with ISAs will always detect a material mis-statement when it exists. Misstatements can arise from fraud or error and are considered material if, individually or in the aggregate, they could reasonably be expected to influence the economic decisions of users taken on the basis of these financial statements.
As part of an audit in accordance with ISAs, we exercise professional judgement and maintain professional scepticism throughout the audit.
We also:• Identify and assess the risks of material misstatement of the financial statements, whether
due to fraud or error, design and perform audit procedures responsive to those risks, and obtain audit evidence that is sufficient and appropriate to provide a basis for our opinion. The risk of not detecting a material misstatement resulting from fraud is higher than for one resulting from error, as fraud may involve collusion, forgery, intentional omissions, misrepre-sentations, or the override of internal control.
• Obtain an understanding of internal control relevant to the audit in order to design audit pro-cedures that are appropriate in the circumstances, but not for the purpose of expressing an opinion on the effectiveness of the Bank’s internal control.
CENTRAL BANK OF MALTA
A-42
Financial Statements for the year ended 31 December 2020
KPMG92, Marina StreetPietà, PTA 9044 MaltaTelephone (+356) 2563 1000Fax (+356) 2566 1000Website www.kpmg.com.mt
Independent Auditors’ Report (continued)
To the Directors of the Central Bank of Malta
Auditors’ responsibilities for the audit of the financial statements (continued)
• Evaluate the appropriateness of accounting policies used and the reasonableness of accounting estimates and related disclosures made by the directors.
• Conclude on the appropriateness of the directors’ use of the going concern basis of account-ing and, based on the audit evidence obtained, whether a material uncertainty exists related to events or conditions that may cast significant doubt on the Bank’s ability to continue as a going concern. If we conclude that a material uncertainty exists, we are required to draw attention in our auditors’ report to the related disclosures in the financial statements or, if such disclosures are inadequate, to modify our opinion. Our conclusions are based on the audit evidence obtained up to the date of our auditors’ report. However, future events or conditions may cause the Bank to cease to continue as a going concern.
• Evaluate the overall presentation, structure and content of the financial statements, including the disclosures, and whether the financial statements represent the underlying transactions and events in a manner that achieves fair presentation.
We communicate with the directors regarding, among other matters, the planned scope and tim-ing of the audit and significant audit findings, including any significant deficiencies in internal control that we identify during our audit.
The Principal authorised to sign on behalf of KPMG on the audit resulting in this independent auditors’ report is Claude Ellul.
KPMG 17 March 2021Registered Auditors
KPMG, a Maltese civil partnership and a member firm of the KPMG global organisation of independent member firms affiliated with KPMG International Limited, a private English company limited by guarantee.
The firm is registered as a partnership of Certified Public Accountants in terms of the Accountancy Profession Act.
A list of partners and directors of the firm is available at 92, Marina Street, Pietà, PTA9044, Malta.