fifth and final progress report of a 12 month long … wind energy... · 2.2 bats and wind turbines...
TRANSCRIPT

1
Fifth and Final Progress Report of a 12 month Long-Term Bat Monitoring
Study
- For the proposed Umsobomvu Wind Energy Facility, near Teebus, Northern Cape
Compiled by: Monika Moir
Reviewed by: Monika Moir &
Werner Marais
August 2015

2
PREPARED FOR:
InnoWind (Pty) Ltd
16 Irvine Street, Richmond Hill, 6000 T: +27 (0) 41 506 4900
F: +27 41 484 3038
www.innowind.com
by
CK 2009/057469/23
P.O. Box 6892 Weltevredenpark
Gauteng 1715
+27 78 190 3316
www.animalia-consult.co.za
Ref: R-1508-25

3
Appointment of Specialist
Specialist Company: Animalia Zoological & Ecological Consultation CC
Fieldwork conducted by: Carel Malouf
Report done by: Monika Moir
Overseen/reviewed by: Monika Moir and Werner Marais
Appointed by: InnoWind (Pty) Ltd
For: 12 Month pre-construction bat activity monitoring
Independence:
Animalia Zoological & Ecological Consultation CC has no connection with the developer.
Animalia Zoological & Ecological Consultation CC is not a legal or financial subsidiary of the
developer; remuneration for services by the developer in relation to this proposal is not linked
to approval by decision-making authorities responsible for permitting this proposal and the
consultancy has no interest in secondary or downstream developments as a result of the
authorization of this project.
Applicable Legislation:
Legislation dealing with biodiversity applies to bats and includes the following:
NATIONAL ENVIRONMENTAL MANAGEMENT: BIODIVERSITY ACT, 2004 (ACT 10 OF 2004;
Especially sections 2, 56 & 97)
The act calls for the management and conservation of all biological diversity within South
Africa. Bats constitute an important component of South African biodiversity and therefore
all species receive additional attention to those listed as Threatened or Protected.

4
TABLE OF CONTENTS
1 OBJECTIVES AND TERMS OF REFERENCE FOR PRECONSTRUCTION STUDY ....................... 8
2 INTRODUCTION .................................................................................................................. 8
2.1 The Bats of South Africa .............................................................................................. 9
2.2 Bats and Wind Turbines ............................................................................................ 10
3 METHODOLOGY ................................................................................................................ 12
3.1 Site Visits ................................................................................................................... 13
3.2 Assumptions and Limitations .................................................................................... 16
4 RESULTS AND DISCUSSION ............................................................................................... 17
4.1 Land Use, Vegetation, Climate and Topography....................................................... 17
4.2 Literature Based Species Probability of Occurrence ................................................. 21
4.3 Ecology of Bat Species that will be Largely Impacted by the Umsobomvu WEF ...... 24
4.4 Transects ................................................................................................................... 26
4.4.1 Second Site Transects ........................................................................................ 27
4.4.2 Third Site Transects ............................................................................................ 29
4.4.3 Fourth Site Transects ......................................................................................... 31
4.4.4 Fifth Site Transects ............................................................................................. 33
4.5 Bat Roost ................................................................................................................... 35
4.6 Sensitivity Map .......................................................................................................... 36
4.7 Passive Data .............................................................................................................. 42
4.7.1 Abundances and Composition of Bat Assemblages........................................... 42
4.7.2 Temporal Distribution ........................................................................................ 49
4.7.3 Relation between Bat Activity and Weather Conditions ................................... 70
5 PROPOSED MITIGATION MEASURE DETAILS .................................................................... 90

5
6 MITIGATION SCHEDULE .................................................................................................... 92
7 CUMULATIVE IMPACTS OF WIND FARMS ADJACENT TO UMSOBOMVU WEF ................ 94
8 IMPACT ASSESSMENT OF PROPOSED WEF ON BAT FAUNA ............................................ 96
8.1 Construction phase ................................................................................................... 96
8.2 Operational phase ..................................................................................................... 99
8.3 Decommissioning phase.......................................................................................... 102
9 OPERATIONAL MONITORING PRELIMINARY METHODOLOGY OUTLINE ........................ 104
9.1 Introduction............................................................................................................. 104
9.2 Methodology ........................................................................................................... 104
Carcass searches ............................................................................................................. 105
Wind turbine mitigation ..................................................................................................... 105
9.3 Deliverables ............................................................................................................. 105
10 CONCLUSION ............................................................................................................... 106
11 REFERENCES ................................................................................................................ 108

6
Figure 1: Map overview of the proposed Umsobomvu WEF turbine layout.

7
Figure 2: Overview of the passive monitoring systems on the Umsobomvu WEF.

1 OBJECTIVES AND TERMS OF REFERENCE FOR PRECONSTRUCTION STUDY
Study bat species assemblage and abundance on the site.
Study temporal distribution of bat activity across the night as well as the four seasons
of the year in order to detect peaks and troughs in activity.
Determine whether weather variables (wind, temperature, humidity and barometric
pressure) influence bat activity.
Determine the weather range in which bats are mostly active.
Develop long-term baseline data for use during operational monitoring.
Identify which turbines need to have special attention with regards to bat monitoring
during the operational phase and identify if any turbines occur in sensitive areas and
need to be shifted into less sensitive areas or removed from the layout.
Detail the types of mitigation measures that are possible if bat mortality rates are
found to be unacceptable, including the potential times/circumstances which may
result in high mortality rates.
2 INTRODUCTION
This is the fifth and final progress report for a twelve month bat monitoring study at the
proposed Umsobomvu Wind Energy Facility near Noupoort, Northern Cape.
Three factors need to be present for most South African bats to be prevalent in an area:
availability of roosting space, food (insects/arthropods or fruit), and accessible open water
sources. The importance of these factors can vary greatly between bat species, their
respective behaviour and ecology. Nevertheless, bat activity, abundance and diversity are
likely to be higher in areas supporting all three above-mentioned factors.
The site is evaluated in terms of the amount of surface rock (possible roosting space),
topography (influencing surface rock in most cases), vegetation (possible roosting spaces and
foraging sites), climate (can influence insect numbers and availability of fruit), and presence
of surface water (influences insects and acts as a source of drinking water) to identify bat
species that may be impacted by wind turbines. This evaluation is done chiefly by studying
the geographic literature of each site, available satellite imagery and observations during site
visits. Species probability of occurrence, based on the above-mentioned factors, is estimated
for the site and the surrounding larger area (see Section 4.2).
General bat diversity, abundance and activity are determined by the use of bat detectors. A
bat detector is a device capable of detecting and recording the ultrasonic echolocation calls
of bats which may then be analysed with the use of computer software. A real time expansion
type bat detector records bat echolocation in its true ultrasonic state which is then effectively
slowed down 10 times during data analysis. Thus the bat calls become audible to the human

9
ear, but still retain all of the harmonics and characteristics of the call from which bat species
with characteristic echolocation calls can be identified. Although this type of bat detection
equipment is advanced technology, it is not necessarily possible to identify all bat species by
just their echolocation calls. Recordings may be affected by the weather conditions (i.e.
humidity) and openness of the terrain (bats may adjust call frequencies). The range of
detecting a bat is also dependent on the volume of the bat call. Nevertheless it is a very
accurate method of recording bat activity.
2.1 The Bats of South Africa
Bats form the Order Chiroptera and are the second largest group of mammals after rodents
(Rodentia). They are the only mammals to have developed true powered flight and have
undergone various skeletal changes to accommodate this. The forelimbs are elongated,
whereas the hind limbs are compact and light, thereby reducing the total body weight. This
unique wing profile allows for the manipulation of wing camber and shape, facilitating
functions such as agility and manoeuvrability. This adaptation surpasses the static design of
the bird wings in function and enables bats to utilize a wide variety of food sources, including,
but not limited to, a large diversity of insects (Neuweiler 2000). Species-based facial features
may differ considerably as a result of differing life histories – particularly as a result of the
various foraging and echolocation strategies evident among bats. Most South African bats are
insectivorous and are capable of consuming vast quantities of insects on a nightly basis (Taylor
2000, Tuttle and Hensley 2001) however, they have also been found to feed on amphibians,
fruit, nectar and other invertebrates (e.g. spiders and scorpions). As a result, insectivorous
bats are the predominant predators of nocturnal flying insects in South Africa and contribute
greatly to the suppression of these numbers. Their prey also includes agricultural pests such
as moths and vectors for diseases such as mosquitoes (Rautenbach 1982, Taylor 2000).
Urban development and agricultural practices have contributed to the deterioration of bat
populations on a global scale. Public participation and funding of bat conservation are often
hindered by negative public perceptions and unawareness of the ecological and economic
value of bats. Some species choose to roost in domestic residences, causing disturbance and
thereby decreasing any esteem that bats may have established. Other species may occur in
large communities in buildings, posing as a potential health hazard to residents in addition to
their nuisance value. Unfortunately, the negative association with bats obscures their
importance as an essential component of ecological systems and their value as natural pest
control agents, which actually serves as an advantage to humans.
Many bat species roost in large communities and congregate in small areas. Therefore, any
major disturbances within and around the roosting areas may adversely impact individuals of
different communities within the same population (Hester and Grenier 2005). Secondly,
nativity rates of bats are much lower than those of most other small mammals. This is
10
because, for the most part, only one or two pups are born per female per annum. Moreover,
according to O’Shea et al. (2003), bats may live for up to 30 years thereby limiting the number
of pups born due to this increased life expectancy. Under natural circumstances, a
population’s numbers may accumulate over long periods of time. This is due to the longevity
and the relatively low predation of bats when compared to other small mammals. However,
in contrast the relatively low reproduction rates of bats results in populations having a low
recovery rate from mass mortalities and major roost disturbances.
2.2 Bats and Wind Turbines
Although most bats are highly capable of advanced navigation through the use of
echolocation and excellent sight, they are still at risk of physical impact with the blades of
wind turbines. The corpses of bats have been found in close proximity to wind turbines and,
in a case study conducted by Johnson et al. (2003), were found to be directly related to
collisions. The incident of bat fatalities for migrating species has been found to be directly
related to turbine height, increasing exponentially with altitude, as this disrupts the migratory
flight paths (Howe et al. 2002; Barclay et al. 2007). Although the number of fatalities of
migrating species increased with turbine height, this correlation was not found for increased
rotor sweep (Howe et al. 2002; Barclay et al. 2007). In the USA it was hypothesized that
migrating bats may navigate without the use of echolocation, rather using vision as their main
sense for long distance orientation (Johnson et al. 2003, Barclay et al. 2007). Bat mortalities
due to turbines have been attributed to be caused by direct impact with the blades and by
barotrauma (Baerwald et al. 2008). Barotrauma is a condition where low air pressure found
around the moving blades of wind turbines, causes the lungs of a bat to collapse, resulting in
fatal internal haemorrhaging (Kunz et al. 2007). Rollins et al. (2012) carried out a
histopathological study to assess whether direct collision or barotrauma was the major cause
of mortality. They found an increased incidence of fractures, external lacerations and features
of traumatic injury (diaphragmatic hernia, subcutaneous hemorrhage, and bone marrow
emboli) in bats killed at wind farms. 73% of bats had lesions consistent with traumatic injury
whereas there was a 20% incidence of ruptured tympana, a sensitive marker of barotrauma
in humans. Thus the data of this study strongly suggests that traumatic injury from direct
collision with turbine blades was the major cause of bat mortality at wind farms and
barotrauma is a minor etiology.
Additionally, it has been hypothesized that barotrauma causes mortality only if the bat is
within a very short distance of the turbine blade tip such that collision with the blades is a
much more likely cause of death.
A study conducted by Arnett (2005) recorded a total of 398 and 262 bat fatalities in two
surveys at the Mountaineer Wind Energy Centre in Tucker County, West Virginia and at the

11
Meyersdale Wind Energy Centre in Somerset County, Pennsylvania, respectively. These
surveys took place during a 6 week study period from 31 July 2004 to 13 September 2004. In
some studies, such as that taken in Kewaunee County (Howe et al. 2002), bat fatalities were
found exceed bird fatalities by up to three-fold.
Although bats are predominately found roosting and foraging in areas near trees, rocky
outcrops, human dwellings and water, in conditions where valleys are foggy, warmer air is
drawn to hilltops through thermal inversion which may result in increased concentrations of
insects and consequently bats at hilltops, where wind turbines are often placed (Kunz et al.
2007). Some studies (Horn et al. 2008) suggest that bats may be attracted to the large turbine
structure as roosting spaces or that swarms of insects may get trapped in low pressure air
pockets around the turbine, also encouraging the presence of bats. The presence of lights on
wind turbines have also been identified as possible causes for increased bat fatalities for non-
cave roosting species. This is thought to be due to increased insect densities that are attracted
to the lights and subsequently encourage foraging activity of bats (Johnson et al. 2003).
Clearings around wind turbines, in previously forested areas, may also improve conditions for
insects, thereby attracting bats to the area and the swishing sound of the turbine blades has
been proposed as possible sources for disorienting bats (Kunz et al. 2007). Electromagnetic
fields generated by the turbine may also affect bats which are sensitive to magnetic fields
(Kunz et al. 2007). It could also be hypothesized, from personal observations that the
echolocation capabilities of bats are designed to locate smaller insect prey or avoid stationary
objects, and may not be primarily focused on the detection of unnatural objects moving
sideways across the flight path.
Whatever the reason for bat fatalities in relation to wind turbines, it is clear that this is a grave
ecological problem which requires attention. During a study by Arnett et al. (2009), 10
turbines monitored over a period of 3 months showed 124 bat fatalities in South-central
Pennsylvania (America), which can cumulatively have a catastrophic long term effect on bat
populations if this rate of fatality continues. Most bat species only reproduce once a year,
bearing one young per female, therefore their numbers are slow to recover from mass
mortalities. It is very difficult to assess the true number of bat deaths in relation to wind
turbines, due to carcasses being removed from sites through predation, the rate of which
differs from site to site as a result of habitat type, species of predator and their numbers
(Howe et al. 2002; Johnson et al. 2003). Mitigation measures are being researched and
experimented with globally, but are still only effective on a small scale. An exception is the
implementation of curtailment processes, where the turbine cut-in speed is raised to a higher
wind speed. This relies on the principle that the prey of bats will not be found in areas of
strong winds and more energy is required for the bats to fly under these conditions. It is
thought, that by the implementation of such a measure, that bats in the area are not likely to
experience as great an impact as when the turbine blades move slowly in low wind speeds.

12
However, this measure is currently not effective enough to translate the impact of wind
turbines on bats to a category of low concern.
3 METHODOLOGY
Bat activity has been monitored using active and passive bat monitoring techniques. Active
monitoring has been done through site visits with transects made throughout the site with a
vehicle-mounted bat detector. Passive detection has been performed with the mounting of
passive bat monitoring systems placed on four monitoring masts on site. Specifically, three
short 10m masts and one meteorological mast (Figure 2).
The monitoring systems consisted of SM3BAT time expansion bat detectors that were
powered by 12V, 18Ah, sealed lead acid batteries and 20W solar panels that provided
recharging power to the batteries. Each system also had an 8 amp low voltage protection
regulator and SM3PWR step down transformer. Four SD memory cards, class 10 speed, with
a capacity of 32GB each were utilized within each SM3BAT detector; this was to ensure
substantial memory space with high quality recordings even under conditions of multiple false
wind triggers.
One weatherproof ultrasound microphone was mounted at a height of 10 meters on the short
masts, while two microphones were mounted at 10m and 50m on the meteorological mast.
These microphones were then connected to the SM3BAT bat detectors.
Each detector was set to operate in continuous trigger mode from dusk each evening until
dawn (times were correlated with latitude and longitude). Trigger mode was the setting for a
bat detector in which any frequency which exceeds 16 kHz and -18dB will trigger the detector
to record for the duration of the sound and 500ms after the sound has ceased, this latter
period is known as a trigger window. All signals were recorded in WAC0 lossless compression
format. The table below summarizes the above-mentioned equipment setup.

13
3.1 Site Visits
Site visit dates First Visit 7 – 12 July 2014
Second Visit 14 – 17 October 2014
Third Visit 19 - 23 January 2015
Fourth Visit 20 – 24 April 2015
Fifth Visit 11 – 14 July 2015
Met mast passive bat detection systems
Quantity on site 1
Microphone heights
10m; 50m
Coordinates S31°22'59.50" E24°47'37.90"
Short mast passive bat detection systems
Quantity on site 3
Microphone height
10m
Coordinates Short Mast 1: S31°23'34.80" E24°51'16.62" Short Mast 2: S31°23'29.94"E24°49'54.06" Short Mast 3: S31°22'8.95" E24°47'45.83"(control system)
Replacements/ Repairs/ Comments
First site visit The microphones were mounted such that they pointed approximately 30 degrees downward to avoid excessive water damage. Crows have been found to peck at microphones and subsequently destroying them. Hence, measures were taken for protection against birds, without noticeably compromising effectiveness.
The bat detectors were installed within their weatherproof containers and all peripherals attached.
Monitoring at 50m height will provide an assessment of the bat activity occurring within rotor-sweep height.
Second site visit All the clamps on the spider beams were retightened and broken clamps replaced. Anchors were hit in deeper and replaced if found to be bent. All SM3BAT+ systems were reset and SD card statuses checked.
Met Mast: The SD card in slot A showed an error. The card was removed and replaced. All SD cards were cleared and checked.
SM 1: A middle section of the mast was broken. This section was removed resulting in the mast being a metre lower. The microphone is now at a height of 8.5m. Rocks were placed around the base point of the mast and guy lines moved above the rocks around the anchor points to prevent shearing. The SD

14
card in slot A was found to be faulty and replaced. All SD cards were cleared and checked.
SM2: Two clamps needed to be replaced on the mast. The guy lines were tightened and rocks placed around the base of the mast. The SD card in slot A was loose and the SD card in slot B was replaced as it showed an error during reading. All SD cards were cleared and checked.
SM3: Two sections of the mast were damaged and removed resulting in the mast being two metres lower. The microphone is now at a height of 7.5m. Broken clamps were replaced and the mast re-erected. Rocks were also placed at the base of the mast. All SD cards were cleared and checked.
Third site visit Met Mast: This system was operating properly, all components and microphones were in good working order.
SM1: One of the guy ropes had broken resulting in the system toppling over. None of the system components were broken from the fall. The guy rope was reattached and system erected. The guy ropes and anchors were further reinforced. The battery was still charged and the system was functional. The system remained operational while it was on the ground, although the system was not operating at maximum efficiency, no data was lost.
SM2: The SM3 bat detector was displaying a fatal clock error. The system was reset and became functional again. This happened on 10 January 2015, resulting in data loss from 10 - 20 January 2015.
SM3: This system was operating properly, all components and microphone were in good working order.
Fourth site visit Met Mast: This system was operating properly, all components and microphones were in good working order.
SM1: The mast had shortened slightly with the telescopic poles distending into one another. The mast was extended over the site visit. Memory cards had issues of corruption of the data from the bat detector. The data was recovered by data specialists as far as possible.
SM2: The mast had shortened slightly with the telescopic poles distending into one another. The mast was extended over the site visit. Memory cards had issues of corruption of the data
15
from the bat detector. The data was recovered by data specialists as far as possible.
SM3: The mast had shortened slightly with the telescopic poles distending into one another. The mast was extended over the site visit.
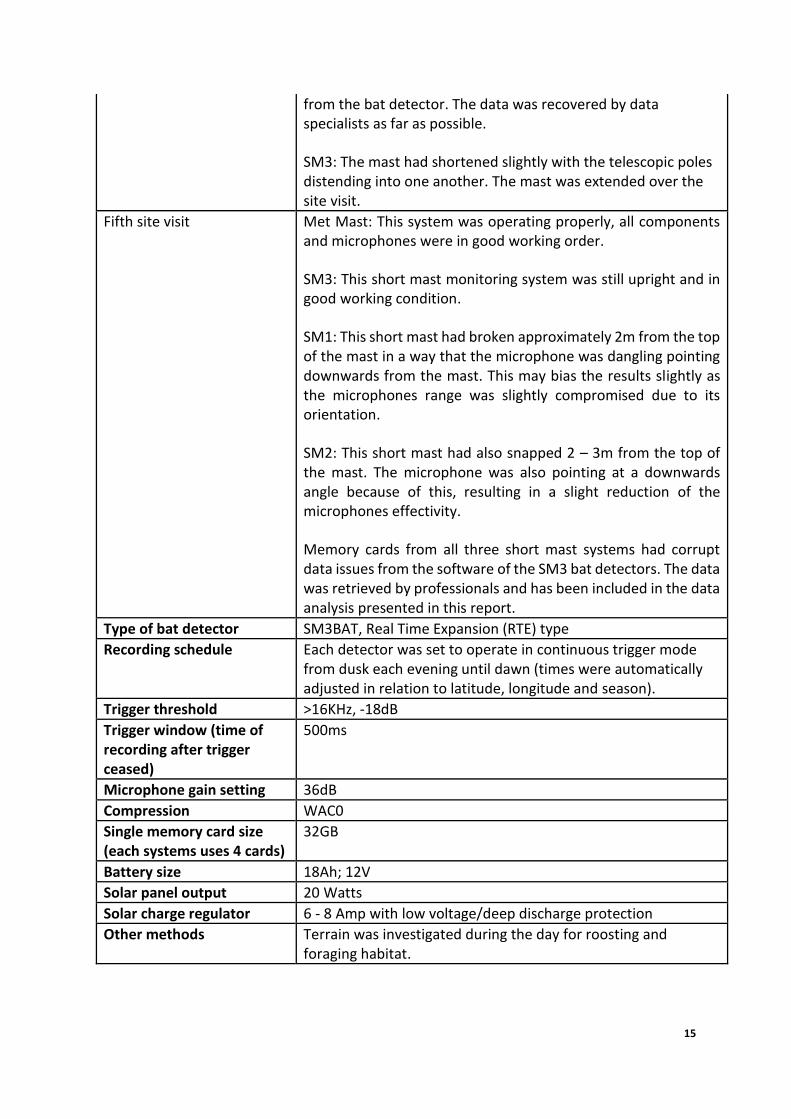
Fifth site visit Met Mast: This system was operating properly, all components and microphones were in good working order.
SM3: This short mast monitoring system was still upright and in good working condition.
SM1: This short mast had broken approximately 2m from the top of the mast in a way that the microphone was dangling pointing downwards from the mast. This may bias the results slightly as the microphones range was slightly compromised due to its orientation.
SM2: This short mast had also snapped 2 – 3m from the top of the mast. The microphone was also pointing at a downwards angle because of this, resulting in a slight reduction of the microphones effectivity.
Memory cards from all three short mast systems had corrupt data issues from the software of the SM3 bat detectors. The data was retrieved by professionals and has been included in the data analysis presented in this report.
Type of bat detector SM3BAT, Real Time Expansion (RTE) type
Recording schedule Each detector was set to operate in continuous trigger mode from dusk each evening until dawn (times were automatically adjusted in relation to latitude, longitude and season).
Trigger threshold >16KHz, -18dB
Trigger window (time of recording after trigger ceased)
500ms
Microphone gain setting 36dB
Compression WAC0
Single memory card size (each systems uses 4 cards)
32GB
Battery size 18Ah; 12V
Solar panel output 20 Watts
Solar charge regulator 6 - 8 Amp with low voltage/deep discharge protection
Other methods Terrain was investigated during the day for roosting and foraging habitat.

16
Figure 3: Photographs depicting the SM3BAT detection system (Left) and the Short Masts they
are mounted on (Right).
3.2 Assumptions and Limitations
Distribution maps of South African bat species still require further refinement such
that the bat species proposed to occur on the site (that were not detected) are
assumed accurate. If a species has a distribution marginal to the site it was assumed
to occur in the area. The literature based table of species probability of occurrence
may include a higher number of bat species than actually present.
The migratory paths of bats are largely unknown, thus limiting the ability to determine
if the wind farm will have a large scale effect on migratory species. Attempts to
overcome this limitation, however, will be made during this long-term sensitivity
assessment.
The satellite imagery partly used to develop the sensitivity map may be slightly
imprecise due to land changes occurring since the imagery was taken.
Species identification with the use of bat detection and echolocation is less accurate
when compared to morphological identification, nevertheless it is a very certain and

17
accurate indication of bat activity and their presence with no harmful effects on bats
being surveyed.
It is not possible to determine actual individual bat numbers from acoustic bat activity
data, whether gathered with transects or the passive monitoring systems. However,
bat passes per night are internationally used and recognized as a comparative unit for
indicating levels of bat activity in an area as well as a measure of relative abundance.
Spatial distribution of bats over the study area cannot be accurately determined by
means of transects, although the passive systems can provide comparative data for
different areas of the site. Transects may still possibly uncover high activity in areas
where it is not necessarily expected and thereby increase insight into the site.
Exact foraging distances from bat roosts or exact commuting pathways cannot be
determined by the current methodology. Radio telemetry tracking of tagged bats is
required to provide such information if needed.
Costly radar technology is required to provide more quantitative data on actual bat
numbers as well as spatial distribution of multiple bats.

18
4 RESULTS AND DISCUSSION
4.1 Land Use, Vegetation, Climate and Topography
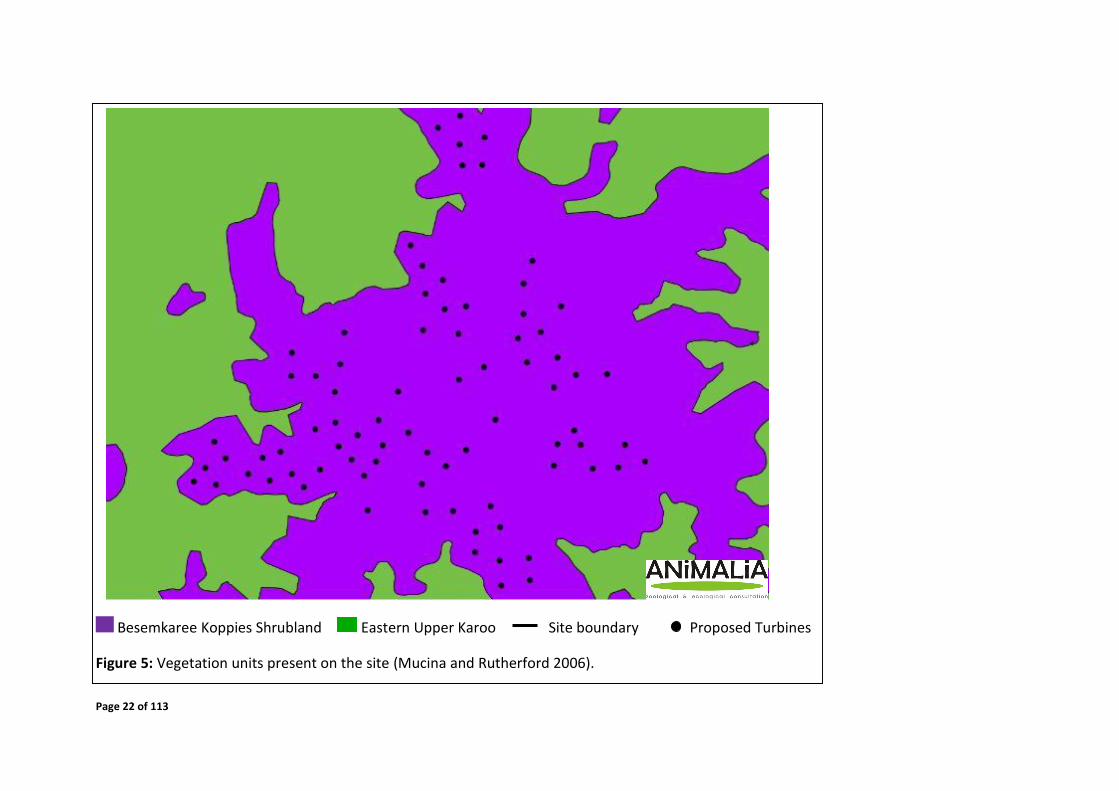
The majority of the site is occupied by the Besemkaree Koppies Shrubland vegetation unit
which forms part of the Grassland biome (Figure 5
Figure 1). This vegetation unit occurs at altitudes between 1120 m – 1680 m and consists of
two-layered karroid shrubland. The lower layer comprises of mostly dwarf, small-leaved
shrubs and abundant grasses, particularly in wet years; while the upper layer is mostly tall
shrubs e.g. Rhus sp (Mucina and Rutherford 2006). The dolerite-dominated geology is the
result of extensive volcanic activity. In some areas, the slopes of mesas and butts may be a
mix of dolerite, sandstones and mudstones. Climatic conditions show hints of the bimodal
pattern typical of the Nama-Karoo. Overall MAP is 400 mm but ranges from 280 mm in the

19
west of the unit to 580 mm in the east (the site is situated in the south west portion of this
unit). Mean annual temperature is 15°C. The unit is considered Least Threatened as it is
largely excluded from major agricultural activities (Mucina and Rutherford 2006). About 5%
is statutorily conserved.
The Eastern Upper Karoo vegetation unit forms part of the Nama-Karoo biome and is mostly
present in the western parts of the site (Figure 5). This unit is found at an altitude of 1000 m
– 1700 m. The unit is characterised by flat and gently sloping plains dominated by dwarf
microphyllous shrubs and ‘white’ grasses of the genera Aristida and Eragrostis (Mucina and
Rutherford 2006). Mostly sandstones and mudstones, which support duplex soils and some
shallow Glenrosa and Mispah soils, dominate the unit but some areas may have prominent
dolerites. Rainfall occurs mainly in autumn and summer with MAP ranging from 180 mm in
the west of the unit to 430 mm in the east (the site is situated in the eastern third of the unit).
Mean maximum and minimum temperatures are 36.1°C and -7.2°C for January and July,
respectively. Frost incidence is relatively high and ranges from <30 to >80 days but are likely
closer to the lower end at this site. The Eastern Upper Karoo is Least Threatened but veld
managers perceive the unit to be experiencing species composition changes hence high-
priority action is required (Mucina and Rutherford 2006).
Vegetation units and geology are of great importance as these may serve as suitable sites for
the roosting of bats and support of their foraging habits (Monadjem et al. 2010). Houses and
buildings may also serve as suitable roosting spaces (Taylor 2000; Monadjem et al. 2010). The
importance of the vegetation units and associated geomorphology serving as potential
roosting and foraging sites have been described in Table 1.

20
Figure 4: Photographs of the vegetation found on site.
Table 1: Potential of the vegetation to serve as suitable roosting and foraging spaces for bats.
Vegetation Unit Roosting
Potential
Foraging
Potential
Comments
Besemkaree
Koppies
Shrubland
Moderate -
High
Moderate- High The tall shrubs (e.g. Rhus sp.) and
dolerite outcrops have roosting
potential while the vegetation
provides foraging potential for
insectivorous bats.

21
Eastern Upper
Karoo
Low -
Moderate
Moderate - High The presence of sandstone and some
dolerite outcrops may provide
potential roost sites while the variety
of plant species and open grasslands
can attract a variety of insect species
for insectivorous bat species to feed
on.
Page 22 of 113
Besemkaree Koppies Shrubland Eastern Upper Karoo Site boundary Proposed Turbines
Figure 5: Vegetation units present on the site (Mucina and Rutherford 2006).
Page 23 of 113
4.2 Literature Based Species Probability of Occurrence
“Probability of Occurrence” is assigned based on consideration of the presence of roosting
sites and foraging habitats on the site, compared to literature described preferences. The
probability of occurrence is described by a percentage indicative of the expected numbers of
individuals present on site and the frequency with which the site will be visited by the species
(in other words the likelihood of encountering the bat species).
The column of “Likely risk of impact” describes the likelihood of risk of fatality from direct
collision or barotrauma with wind turbine blades for each bat species. The risk was assigned
by Sowler and Stoffberg (2014) based on species distributions, altitudes at which they fly and
distances they travel; and assumes a 100% probability of occurrence. The ecology of most
applicable bat species recorded in the vicinity of the site is discussed below.
Table 2: Table of species that may be roosting or foraging on the study area, the possible site
specific roosts, and their probability of occurrence based on literature (Monadjem et al.
2010).

Page 24 of 113
Species Common name
Probability of occurrence (%)
Conservation status
Possible roosting habitat on site Possible foraging habitat utilised on site Likelihood of risk of fatality (Sowler & Stoffberg, 2014)
Eptesicus hottentotus
Long-tailed serotine
Confirmed Least Concern It is a crevice dweller roosting in rock crevices, expansion joints in bridges and road culverts
It seems to prefer woodland habitats, but has been caught in granitic hills and near rocky outcrops. Clutter edge forager
Medium
Cistugo lesueuri
Lesueur’s Wing- gland bat
10 - 20 Vulnerable
Roosts in rock crevices near water. Associated with broken terrain in high-altitude montane grasslands.
Not well known, probably near water. Not known
Miniopterus natalensis
Natal long-fingered bat
Confirmed Near Threatened
It is cave/mine dependent and hence the availability of suitable roosting sites is a critical factor in determining its presence. It may be found in the Noupoort copper mines. Have been found roosting singly or in small groups inside culverts and manmade hollows.
Forages around the edge of clutters of vegetation, and may therefore avoid most of the site and may only be found at the denser drainage systems. It is also dependant on open surface water sources.
Medium - High
Myotis tricolor
Temmink’s myotis
20 - 30 Least Concern
Roosts gregariously in caves, but have been found roosting singly or in small groups inside culverts and manmade hollows.
It is restricted to areas with suitable caves or hollows, which may explain its absence from flat and featureless terrain; its close association with mountainous areas may therefore be due to its roosting requirements.
Medium - High
Neoromicia capensis
Cape serotine
Confirmed Least Concern
Roosts under the bark of trees, at the base of aloe leaves, and inside the roofs of houses. The farm buildings are the most likely roosting space.
It appears to tolerate a wide range of environmental conditions from arid semi-desert areas to montane grasslands, forests, and savannas. Highly adaptable species, but a clutter edge forager limiting its utilisation of the site.
Medium - High
Nycteris thebaica
Egyptian slit-faced bat
10 - 20 Least Concern
Roosts in caves, aardvark burrows, culverts under roads and the trunks of large trees and hollows (manmade or natural). Roosting space unlikely on site.
It appears to occur throughout the savanna and karoo biomes, but avoids open grasslands. May be found in denser drainage systems. Relatively small foraging range and an open space forager
Low
Rhinolophus clivosus
Geoffroy’s horseshoe bat
10 - 20 Least Concern Roosts in caves, mine adits and hollows (manmade and natural).
Arid savanna, woodland and riparian forest. Clutter forager that may only possibly be found in denser drainage systems. Relatively small foraging range
Low
Page 25 of 113
Rhinolophus capensis
Cape horseshoe bat
Confirmed Near Threatened
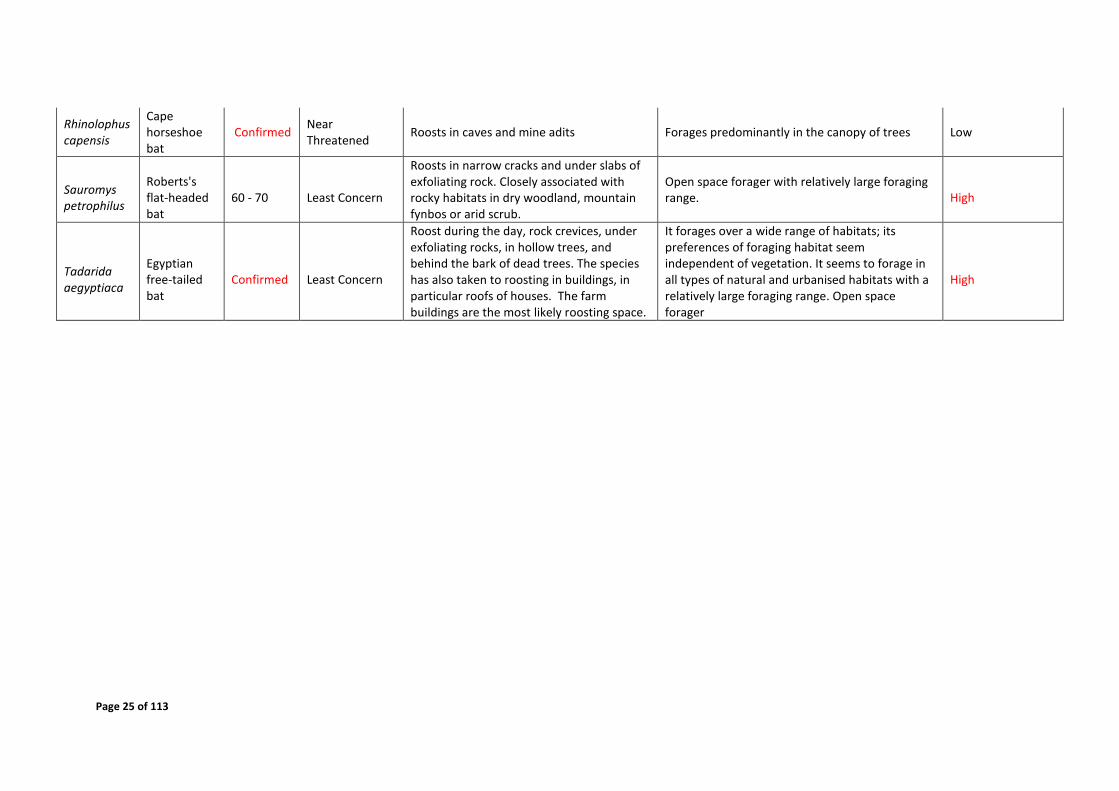
Roosts in caves and mine adits Forages predominantly in the canopy of trees Low
Sauromys petrophilus
Roberts's flat-headed bat
60 - 70 Least Concern
Roosts in narrow cracks and under slabs of exfoliating rock. Closely associated with rocky habitats in dry woodland, mountain fynbos or arid scrub.
Open space forager with relatively large foraging range. High
Tadarida aegyptiaca
Egyptian free-tailed bat
Confirmed Least Concern
Roost during the day, rock crevices, under exfoliating rocks, in hollow trees, and behind the bark of dead trees. The species has also taken to roosting in buildings, in particular roofs of houses. The farm buildings are the most likely roosting space.
It forages over a wide range of habitats; its preferences of foraging habitat seem independent of vegetation. It seems to forage in all types of natural and urbanised habitats with a relatively large foraging range. Open space forager
High

Page 26 of 113
4.3 Ecology of Bat Species that will be Largely Impacted by the Umsobomvu WEF
There are three bat species recorded on site and that occurs commonly in the area due to
their probably of occurrence and widespread distribution. These species are of importance
based on their likelihood of being impacted by the proposed WEF, which is a combination of
abundance and behaviour. The relevant species are discussed below.
Miniopterus natalensis
Miniopterus natalensis, also commonly referred to as the Natal long-fingered bat, occurs
widely across the country but mostly within the southern and eastern regions and is listed as
Near Threatened (Monadjem et al. 2010).
This bat is a cave-dependent species and identification of suitable roosting sites may be more
important in determining its presence in an area than the presence of surrounding vegetation.
It occurs in large numbers when roosting in caves with approximately 260 000 bats observed
making seasonal use of the De Hoop Guano Cave in the Western Cape, South Africa. Culverts
and mines have also been observed as roosting sites for either single bats or small colonies.
Separate roosting sites are used for winter hibernation activities and summer maternity
behaviour, with the winter hibernacula generally occurring at higher altitudes in more
temperate areas and the summer hibernacula occurring at lower altitudes in warmer areas of
the country (Monadjem et al. 2010
Mating and fertilisation usually occur during March and April and is followed by a period of
delayed implantation until July/August. Birth of a single pup usually occurs between October
and December as the females congregate at maternity roosts (Monadjem et al. 2010 & Van
Der Merwe 1979).
The Natal long-fingered bat undertakes short migratory journeys between hibernaculum and
maternity roosts. Due to this migratory behaviour, they are considered to be at high risk of
fatality from wind turbines if a wind farm is placed within a migratory path (Sowler and
Stoffberg 2014). The mass movement of bats during migratory periods could result in mass
casualties if wind turbines are positioned over a mass migratory route and such turbines are
not effectively mitigated. Very little is known about the migratory behaviour and paths of M.
natalensis in South Africa with migration distances exceeding 150 kilometres. If the site is
located within a migratory path the bat detection systems should detect high numbers and
activity of the Natal long-fingered bat.
A study by Vincent et al. (2011) on the activity and foraging habitats of Miniopteridae found
that the individual home ranges of lactating females were significantly larger than that of
pregnant females. It was also found that the bats predominately made use of urban areas
(54%) followed by open areas (19.8%), woodlands (15.5%) orchards and parks (9.1%) and

Page 27 of 113
water bodies (1.5%) when selecting habitats. Foraging areas were also investigated with the
majority again occurring in urban areas (46%); however a lot of foraging also occurred in
woodland areas (22%), crop and vineyard areas (8%), pastures, meadows and scrubland (4%)
and water bodies (4%).
Sowler and Stoffberg (2014) advise that M. natalensis faces a medium to high risk of fatality
due to wind turbines. This evaluation was based on broad ecological features and excluded
migratory information.
Neoromicia capensis
Neoromicia capensis is commonly called the Cape serotine and has a conservation status of
Least Concern as it is found in high numbers and is widespread over much of Sub-Saharan
Africa.
High mortality rates of this species due to wind turbines would be a cause of concern as N.
capensis is abundant and widespread and as such has a more significant role to play within
the local ecosystem than the rarer bat species. They do not undertake migrations and thus
are considered residents of the site.
It roosts individually or in small groups of two to three bats in a variety of shelters, such as
under the bark of trees, at the base of aloe leaves, and under the roofs of houses. They will
use most man-made structures as day roosts which can be found throughout the site and
surrounding areas (Monadjem et al. 2010).
They are tolerant of a wide range of environmental conditions as they survive and prosper
within arid semi-desert areas to montane grasslands, forests, and savannas; indicating that
they may occupy several habitat types across the site, and are amenable towards habitat
changes. They are however clutter-edge foragers, meaning they prefer to hunt on the edge
of vegetation clutter mostly, but can occasionally forage in open spaces. They are thought to
have a Medium-High likelihood of risk of fatality due to wind turbines (Sowler and Stoffberg
2014).
Mating takes place from the end of March until the beginning of April. Spermatozoa are
stored in the uterine horns of the female from April until August, when ovulation and
fertilisation occurs. They give birth to twins during late October and November but single
pups, triplets and quadruplets have also been recorded (van der Merwe 1994 & Lynch 1989).
Tadarida aegyptiaca
The Egyptian Free-tailed bat, Tadarida aegyptiaca, is a Least Concern species as it has a wide
distribution and high abundance throughout South Africa. It occurs from the Western Cape
of South Africa, north through to Namibia and southern Angola; and through Zimbabwe to

Page 28 of 113
central and northern Mozambique (Monadjem et al. 2010). This species is protected by
national legislation in South Africa (ACR 2010).
They roost communally in small (dozens) to medium-sized (hundreds) groups in rock crevices,
under exfoliating rocks, caves, hollow trees and behind the bark of dead trees. T. aegyptiaca
has also adapted to roosting in buildings, in particular roofs of houses (Monadjem et al. 2010).
The Egyptian Free-tailed bat forages over a wide range of habitats, flying above the vegetation
canopy. It appears that the vegetation has little influence on foraging behaviour as the species
forages over desert, semi-arid scrub, savannah, grassland and agricultural lands. Its presence
is strongly associated with permanent water bodies due to concentrated densities of insect
prey (Monadjem et al. 2010).
The Egyptian Free-tailed bat is considered to have a High likelihood of risk of fatality by wind
turbines (Sowler and Stoffberg 2014). Due to the high abundance and widespread distribution
of this species, high mortality rates by wind turbines would be a cause of concern as these
species have more significant ecological roles than the rarer bat species. The sensitivity maps
are strongly informed by the areas that may be used by this species.
After a gestation of four months, a single pup is born, usually in November or December,
when females give birth once a year. In males, spermatogenesis occurs from February to July
and mating occurs in August (Bernard and Tsita 1995). Maternity colonies are apparently
established by females in November (Herselman 1980).
Several North American studies indicate the impact of wind turbines to be highest on
migratory bats, however there is evidence to the impact on resident species. Fatalities from
turbines increase during natural changes in the behaviour of bats leading to increased activity
in the vicinity of turbines. Increases in non-migrating bat mortalities around wind turbines in
North America corresponded with when bats engage in mating activity (Cryan and Barclay
2009). This long term assessment will also be able to indicate seasonal peaks in species activity
and bat presence.
4.4 Transects
Transects were carried out over the first site visit but no bat passes were recorded due to
very poor weather conditions over a cold front. Further transects will be carried out over
the following site visits.
Page 29 of 113
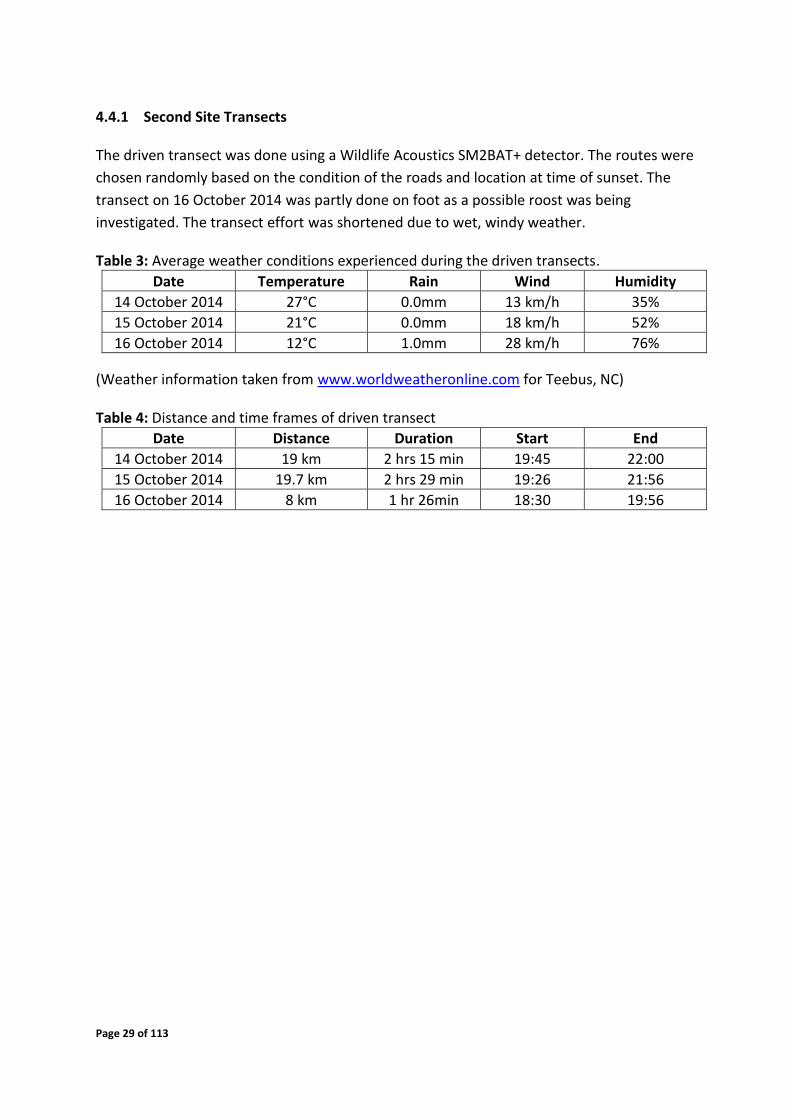
4.4.1 Second Site Transects
The driven transect was done using a Wildlife Acoustics SM2BAT+ detector. The routes were
chosen randomly based on the condition of the roads and location at time of sunset. The
transect on 16 October 2014 was partly done on foot as a possible roost was being
investigated. The transect effort was shortened due to wet, windy weather.
Table 3: Average weather conditions experienced during the driven transects.
Date Temperature Rain Wind Humidity
14 October 2014 27°C 0.0mm 13 km/h 35%
15 October 2014 21°C 0.0mm 18 km/h 52%
16 October 2014 12°C 1.0mm 28 km/h 76%
(Weather information taken from www.worldweatheronline.com for Teebus, NC)
Table 4: Distance and time frames of driven transect
Date Distance Duration Start End
14 October 2014 19 km 2 hrs 15 min 19:45 22:00
15 October 2014 19.7 km 2 hrs 29 min 19:26 21:56
16 October 2014 8 km 1 hr 26min 18:30 19:56
Page 30 of 113
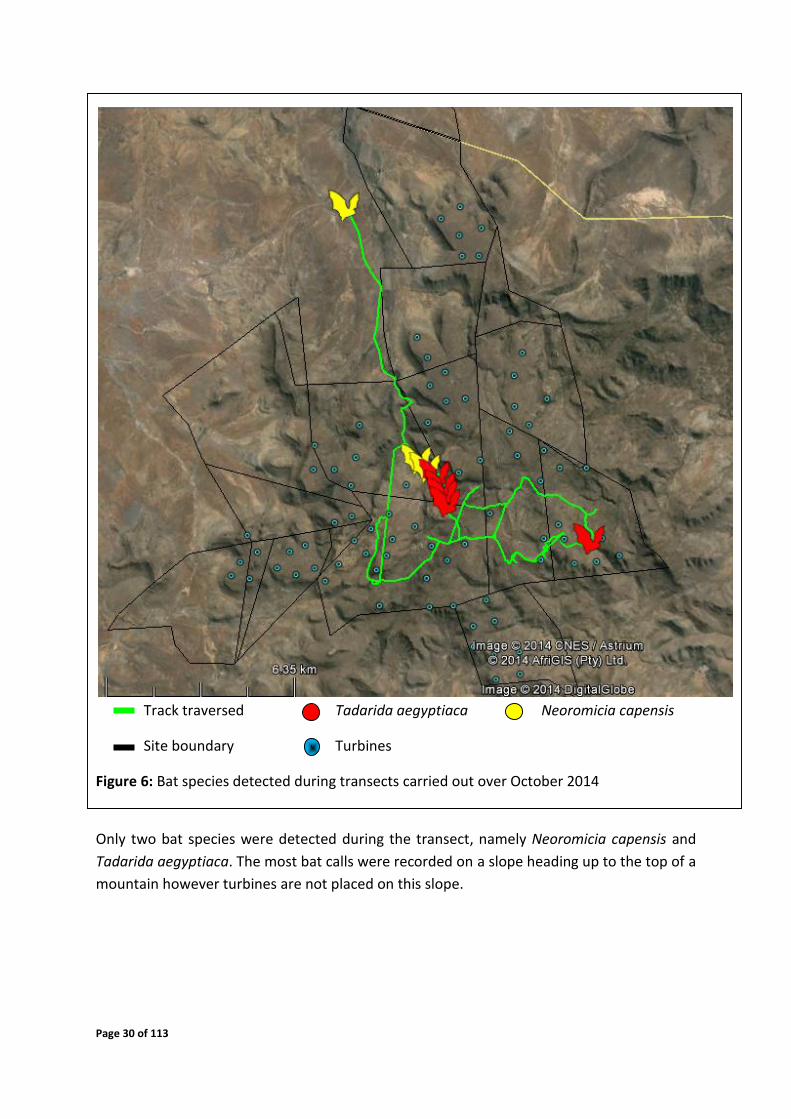
Track traversed Tadarida aegyptiaca Neoromicia capensis
Site boundary Turbines
Figure 6: Bat species detected during transects carried out over October 2014
Only two bat species were detected during the transect, namely Neoromicia capensis and
Tadarida aegyptiaca. The most bat calls were recorded on a slope heading up to the top of a
mountain however turbines are not placed on this slope.

Page 31 of 113
4.4.2 Third Site Transects
The driven transect was done using a Wildlife Acoustics SM2BAT+ detector. The routes were
chosen randomly based on the condition of the roads and location at time of sunset.
Table 4: Average weather conditions experienced during the driven transects.
Date Temperature Rain Wind Humidity
20 January 2015 29°C 0.0mm 8 km/h 30%
21 January 2015 28°C 0.0mm 6 km/h 41%
22 January 2015 28°C 0.0mm 28 km/h 29%
(Weather information taken from www.worldweatheronline.com for Teebus, NC)
Table 5: Distance and time frames of driven transect
Date Distance Duration Start End
20 January 2015 18.6 km 2 hrs 19:00 21:00
21 January 2015 25.1 km 2 hrs 42 min 19:30 22:20
22 January 2015 27.7 km 3 hrs 18:30 21:30

Page 32 of 113
Track traversed Tadarida aegyptiaca Neoromicia capensis
Site boundary Turbines
Figure 7: Bat species detected during transects carried out over January 2015

Page 33 of 113
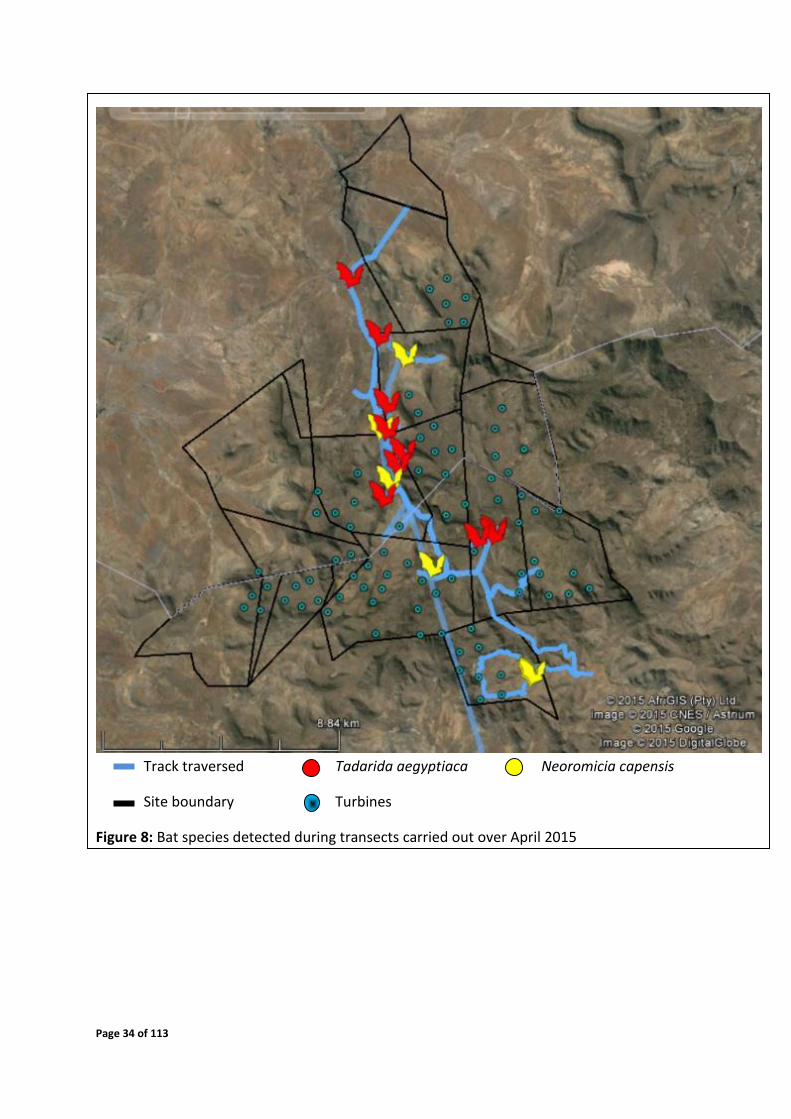
4.4.3 Fourth Site Transects
The driven transect was done using a Wildlife Acoustics SM2BAT+ detector. The routes were
chosen randomly based on the condition of the roads and location at time of sunset.
Table 6: Average weather conditions experienced during the driven transects.
Date Temperature Rain Wind Humidity
21 April 2015 15°C 0.0mm 5 km/h 86%
22 April 2015 17°C 0.0mm 5 km/h 66%
23 April 2015 15°C 0.0mm 3 km/h 80%
(Weather information taken from www.worldweatheronline.com for Teebus, NC)
Table 7: Distance and time frames of driven transect
Date Distance Duration Start End
21 April 2015 18.6 km 2 hrs 19:00 21:00
22 April 2015 25.1 km 2 hrs 42 min 19:30 22:20
23 April 2015 27.7 km 3 hrs 18:30 21:30
Page 34 of 113
Track traversed Tadarida aegyptiaca Neoromicia capensis
Site boundary Turbines
Figure 8: Bat species detected during transects carried out over April 2015

Page 35 of 113
4.4.4 Fifth Site Transects
The driven transect was done using a Wildlife Acoustics SM2BAT+ detector. The routes were
chosen randomly based on the condition of the roads and location at time of sunset.
Table 8: Average weather conditions experienced during the driven transects.
Date Temperature Rain Wind Humidity
10 July 2015 14°C 0.0mm 11 km/h 39%
12 July 2015 5°C 0.0mm 6 km/h 76%
13 July 2015 1°C 0.0mm 2 km/h 56%
(Weather information taken from www.worldweatheronline.com for Teebus, NC)
Table 9: Distance and time frames of driven transect
Date Distance Duration Start End
10 July 2015 22.4 km 2 hrs 35 min 18:00 20:35
12 July 2015 42.2 km 4 hrs 18:00 22:00
13 July 2015 38.2 km 3 hrs 18:30 21:30
No bat passes were detected during transects of this site visit. Equipment failures were not
evident, so it is assumed that very low bat activity was prevalent across the site during this
time.

Page 36 of 113
Track traversed Site boundary Turbines
Figure 9: Transect routes wherein no bat activity was detected over July 2015

Page 37 of 113
4.5 Bat Roost
A bat roost was found on the second Umsobomvu site visit in an abandoned building (Figure
10). Two different bat species were found, namely, Rhinolophus spp. and Myotis tricolor
(Temminck’s myotis) (Figure 11). The genus Rhinolophus spp totaled in excess of
approximately 300 individuals. Very few M. tricolor bats were observed. This roost was still
present and displaying consistent numbers over the third site visit. However on inspection
over the fourth site visit the building had been disturbed and opened up such that it was no
longer dark and bat friendly. The bats had vacated the roost due to the disturbance.
Figure 10: Location of the bat roost.
Figure 11: Photograph of the two bat species found.

Page 38 of 113
4.6 Sensitivity Map
Figures 12 - 15 depict the sensitive areas of the site, based on features identified to be
important for foraging and roosting of the species that are confirmed and most probable to
occur on site. Thus the sensitivity map is based on species ecology and habitat preferences.
This map can be used as a pre-construction mitigation in terms of improving turbine
placement with regards to bat preferred habitats on site.
Last iteration September 2014
High sensitivity buffer
250m
Moderate sensitivity buffer
150m
Features used to develop the sensitivity map
Manmade structures, such as farm houses, barns, sheds, road culverts and mine adits, these structures provide easily accessible roosting sites.
The presence of caves, rock faces, areas of exfoliating rock and clumps of larger woody plants. These features provide natural roosting spaces and tend to attract insect prey.
The different vegetation types and presence of riparian/water drainage habitat is used as indicators of probable foraging areas.
Open water sources, be it man-made farm dams or natural streams and wetlands, are important sources of drinking water and provide habitat that host insect prey.
The areas designated as having a High Bat Sensitivity (Table 10) implicates that no turbines
should be placed in these areas and their respective buffer zones, due to the elevated impacts
it can have on bat mortalities. If turbines are located within the Moderate Bat Sensitivity zone
or buffer zone, they must receive special attention and preference for post-construction
monitoring and implementation of mitigations during the operational phase outlined in
Section 6.

Page 39 of 113
Table 10: Description of sensitivity categories utilized in the sensitivity map
Sensitivity Description
Moderate Sensitivity
Areas of foraging habitat or roosting sites considered to have
significant roles for bat ecology. Turbines within or close to
these areas must acquire priority (not excluding all other
turbines) during pre/post-construction studies and mitigation
measures, if any is needed.
High Sensitivity
Areas that are deemed critical for resident bat populations,
capable of elevated levels of bat activity and support greater
bat diversity than the rest of the site. These areas are ‘no-go’
areas and turbines must not be placed in these areas.
Table 11: Turbines located within bat sensitive areas and buffers
Bat sensitive area Proposed turbine layout
High bat sensitivity area None
High bat sensitivity buffer Turbine 24, 27, 41, 42
Moderate bat sensitivity area Turbine 17, 41
Moderate bat sensitivity buffer Turbine 18, 32, 63, 67
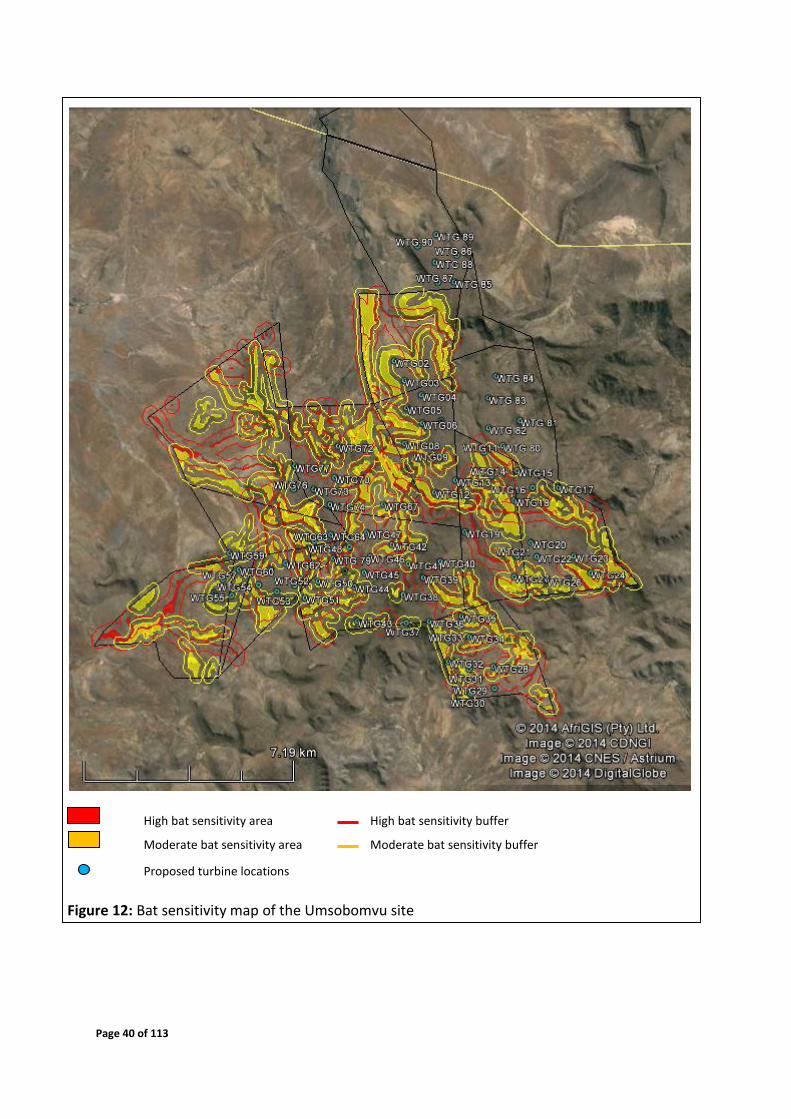
Page 40 of 113
High bat sensitivity area High bat sensitivity buffer
Moderate bat sensitivity area Moderate bat sensitivity buffer
Proposed turbine locations
Figure 12: Bat sensitivity map of the Umsobomvu site
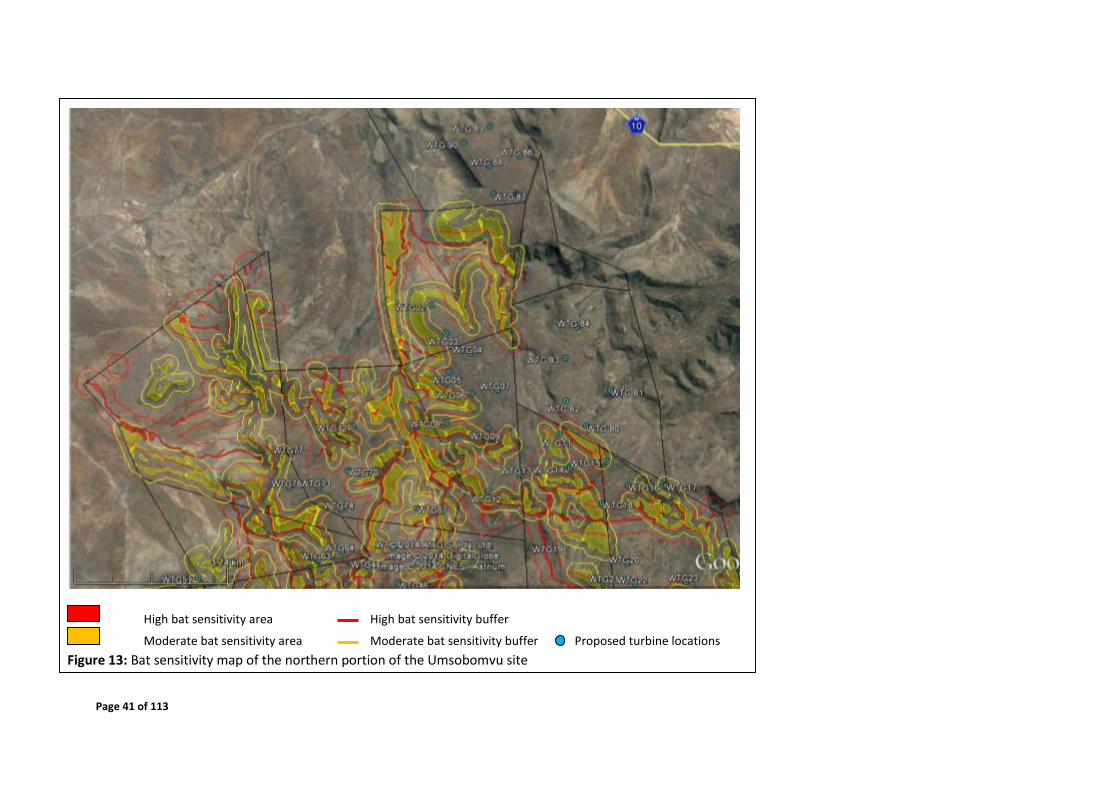
Page 41 of 113
High bat sensitivity area High bat sensitivity buffer
Moderate bat sensitivity area Moderate bat sensitivity buffer Proposed turbine locations
Figure 13: Bat sensitivity map of the northern portion of the Umsobomvu site
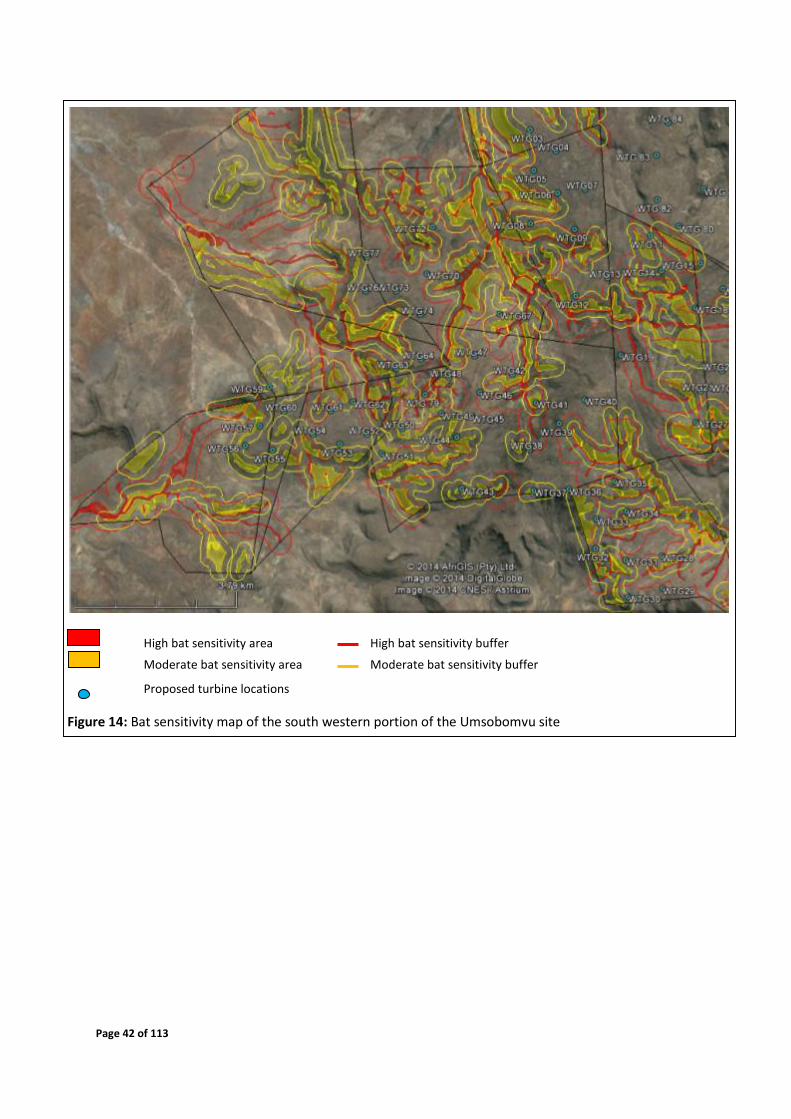
Page 42 of 113
High bat sensitivity area High bat sensitivity buffer
Moderate bat sensitivity area Moderate bat sensitivity buffer
Proposed turbine locations
Figure 14: Bat sensitivity map of the south western portion of the Umsobomvu site

Page 43 of 113
High bat sensitivity area High bat sensitivity buffer
Moderate bat sensitivity area Moderate bat sensitivity buffer
Proposed turbine locations
Figure 15: Bat sensitivity map of the south eastern portion of the Umsobomvu site

Page 44 of 113
4.7 Passive Data
4.7.1 Abundances and Composition of Bat Assemblages
Average bat passes detected per bat detector night (nights on which detectors recorded
correctly - see Tables 12 – 15 for these time frames) and total number of bat passes detected
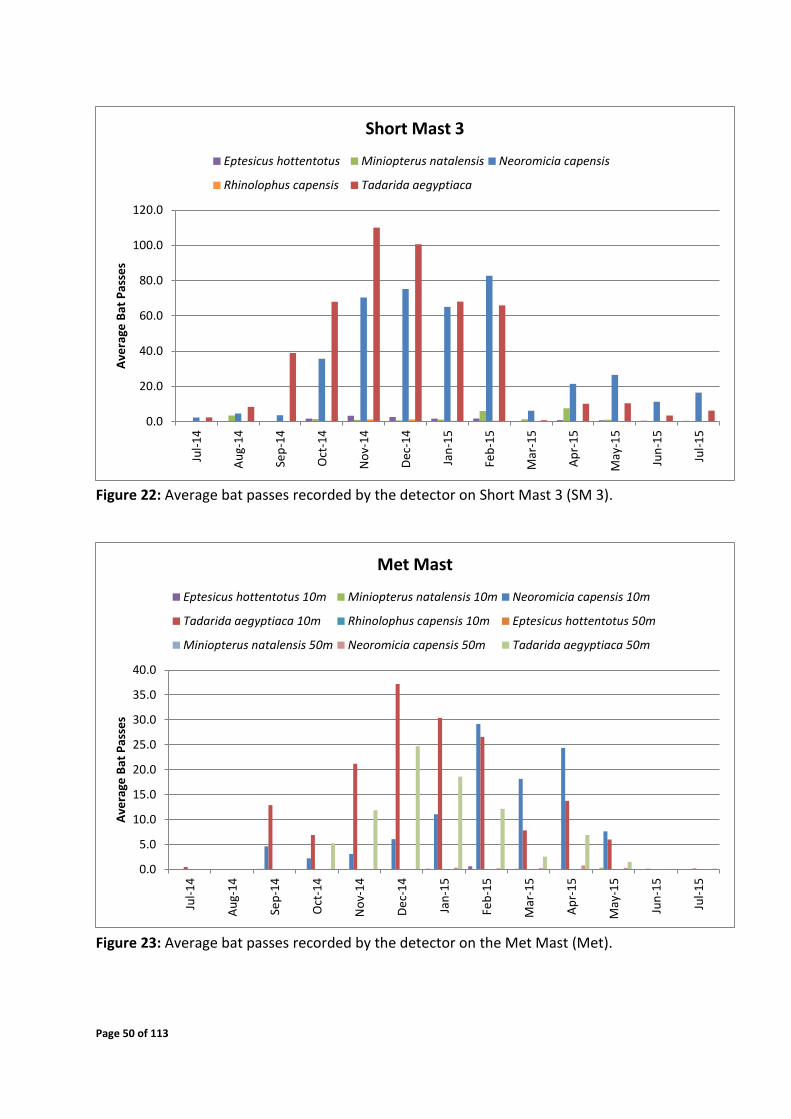
over the monitoring period by all systems are displayed in Figures 16 - 23. Five bat species
were detected by the passive monitoring systems, namely, Eptesicus hottentotus,
Miniopterus natalensis, Neoromicia capensis, Rhinolophus capensis and Tadarida aegyptiaca.
Short mast 3 recorded a significantly higher number of bat passes compared to the other
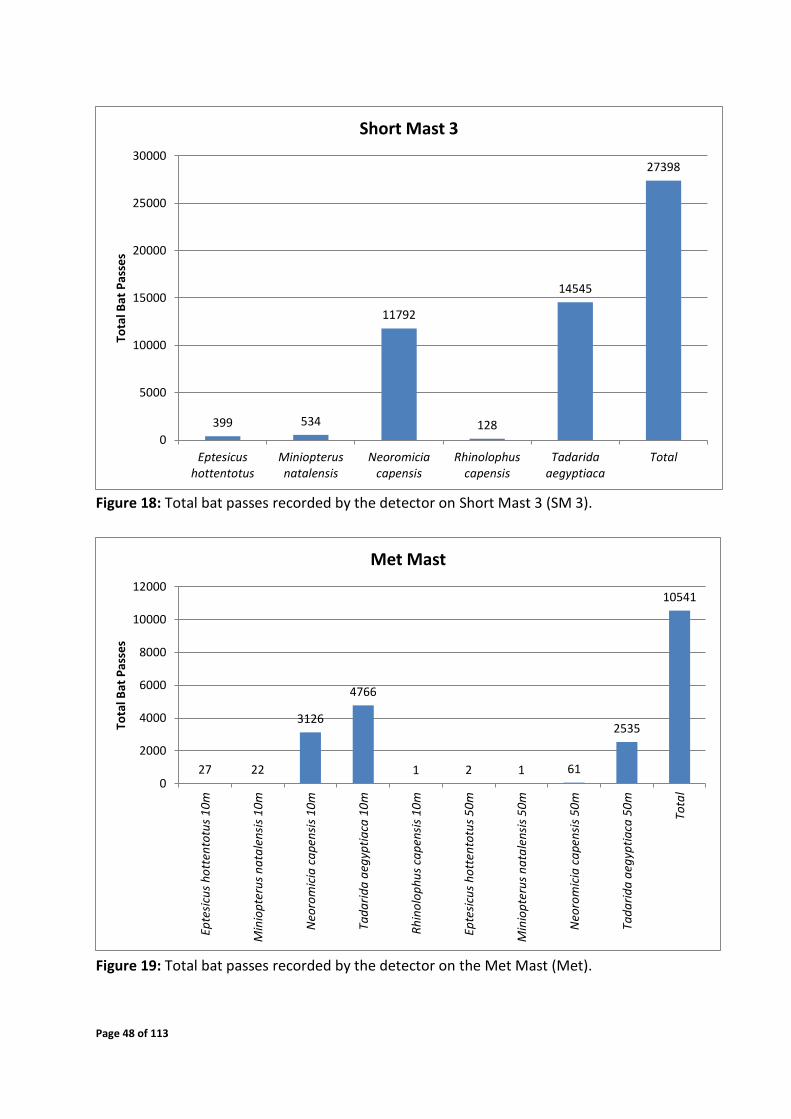
three systems (Figure 18). This emphasizes that higher bat activity is normally present in
sheltered valley areas as opposed to open exposed areas. As expected, higher bat activity was
detected at 10m height than 50m height by the met mat monitoring system. However a high
number of Tadarida aegyptiaca passes were detected at a height of 50m which would be the
high risk population (Figure 19).
Tadarida aegyptiaca and Neoromicia capensis are the most abundant bat species recorded
by all systems. Common and abundant species, such as Neoromicia capensis, Tadarida
aegyptiaca and Miniopterus natalensis, are of a larger value to the local ecosystems as they
provide a greater contribution to most ecological services than the rarer species due to their
higher numbers.
Miniopterus natalensis is the only migratory species detected on site. The results of the full
12 months have been analysed for the presence of a migratory event. However, no migratory
event was detected by the four passive monitoring systems. Thus the results are indicative of
the site not being within a migratory route.
The average number of passes per night per month for Short Mast 1 and 2 were low over the
winter months of 2014 with a gradual increase over spring and summer. Average passes per
night peaked over February and March 2015 with a general decline from April 2015 to the
end of the July 2015 (Figure 20 and 21). Short Mast 3 (Figure 22) also depicts low bat activity
over the winter of 2014 with higher activity levels occurring from spring with a peak in
November 2014. Activity then declined over autumn and winter 2015. The met mast
monitoring system detected low activity levels for the winter of 2014 with a peak in December
2014 (Figure 23). Activity remained elevated from December 2014 to April 2015, with a
general decline into winter 2015.

Page 45 of 113
Table 12: Date ranges over which the monitoring systems were functioning for the first
monitoring period
Mast Date Range Comments
Met Mast 10m 11/07/2014 - 18/09/2014
Met Mast 50m 11/07/2014 - 18/09/2014
No viable calls were recorded, both microphones and system will be checked in start of December to determine if this phenomenon is due to a fault or just very low bat activity.
SM 1 09/07/2014 - 18/09/2014
SM 2 12/08/2014 - 15/10/2014
SM 3 09/07/2014 - 16/10/2014
Table 13: Date ranges over which the monitoring systems were functioning for the second
monitoring period
Mast Date Range Comments
Met Mast 10m 16/10/2014 - 20/01/2015
Met Mast 50m 16/10/2014 - 20/01/2015
SM 1 15/10/2014 - 20/01/2015
SM 2 15/10/2014 - 10/01/2015
Fatal clock error resulted in a loss of ten days of data in January 2015. The loss of data over such a short period for one short mast is an insignificant loss.
SM 3 16/10/2014 - 20/01/2015
Table 14: Date ranges over which the monitoring systems were functioning for the third
monitoring period
Mast Date Range Comments
Met Mast 10m 20/01/2015 – 22/04/2015
Met Mast 50m 20/01/2015 – 22/04/2015
SM 1 20/01/2015 – 13/04/2015
Memory cards were corrupted by
the bat detectors. Corrupt data
was retrieved by data specialists as
far as possible. However, one
weeks’ worth of data from the end
of April was inaccessible. The loss
of data over such a short period for
one short mast is an insignificant
loss.
SM 2 20/01/2015 – 14/04/2015
Memory cards were corrupted by
the bat detectors. Corrupt data

Page 46 of 113
was retrieved by data specialists as
far as possible. However, one
weeks’ worth of data from the end
of April was inaccessible. The loss
of data over such a short period for
one short mast is an insignificant
loss.
SM 3 20/01/2015 – 22/03/2015
Memory cards were corrupted by the bat detectors. Corrupt data was retrieved by data specialists as far as possible. However, one months’ worth of data from the end of March to end of April was inaccessible.
Table 15: Date ranges over which the monitoring systems were functioning for the fourth
monitoring period
Mast Date Range Comments
Met Mast 10m 22/04/2015 – 11/07/2015
Met Mast 50m 22/04/2015 – 11/07/2015
SM 1
23/04/2015 – 10/05/2015 28 – 30/05/2015 13 – 25/06/2015
Memory cards were corrupted by
the bat detectors. Corrupt data
was retrieved by data specialists as
far as possible. However only
intermittent data intervals were
retrievable.
SM 2 23/04/2015 – 10/05/2015 25/05/2015 – 11/07/2015
Memory cards were corrupted by
the bat detectors. Corrupt data
was retrieved by data specialists as
far as possible. However, two
weeks’ worth of data from mid to
end May was inaccessible. The loss
of data over such a short period for
one short mast is an insignificant
loss.
SM 3 23/04/2015 – 11/07/2015

Page 47 of 113
Figure 16: Total bat passes recorded by the detector on Short Mast 1 (SM 1).
Figure 177: Total bat passes recorded by the detector on Short Mast 2 (SM 2).
28 9
2510
4
1104
3655
0
500
1000
1500
2000
2500
3000
3500
4000
Eptesicushottentotus
Miniopterusnatalensis
Neoromiciacapensis
Rhinolophuscapensis
Tadaridaaegyptiaca
Total
Tota
l Bat
Pas
ses
Short Mast 1
112 112
7810 7994
3
16031
0
2000
4000
6000
8000
10000
12000
14000
16000
18000
Eptesicushottentotus
Miniopterusnatalensis
Neoromiciacapensis
Tadaridaaegyptiaca
Rhinolophuscapensis
Total
Tota
l Bat
Pas
ses
Short Mast 2
Page 48 of 113
Figure 18: Total bat passes recorded by the detector on Short Mast 3 (SM 3).
Figure 19: Total bat passes recorded by the detector on the Met Mast (Met).
399 534
11792
128
14545
27398
0
5000
10000
15000
20000
25000
30000
Eptesicushottentotus
Miniopterusnatalensis
Neoromiciacapensis
Rhinolophuscapensis
Tadaridaaegyptiaca
Total
Tota
l Bat
Pas
ses
Short Mast 3
27 22
3126
4766
1 2 1 61
2535
10541
0
2000
4000
6000
8000
10000
12000
Epte
sicu
s h
ott
ento
tus
10
m
Min
iop
teru
s n
ata
len
sis
10
m
Neo
rom
icia
ca
pen
sis
10
m
Tad
ari
da
aeg
ypti
aca
10
m
Rh
ino
lop
hu
s ca
pen
sis
10
m
Epte
sicu
s h
ott
ento
tus
50
m
Min
iop
teru
s n
ata
len
sis
50
m
Neo
rom
icia
ca
pen
sis
50
m
Tad
ari
da
aeg
ypti
aca
50
m
Tota
l
Tota
l Bat
Pas
ses
Met Mast

Page 49 of 113
Figure 20: Average bat passes recorded by the detector on Short Mast 1 (SM 1).
Figure 21: Average bat passes recorded by the detector on Short Mast 2 (SM 2).
0.0
5.0
10.0
15.0
20.0
25.0
30.0
35.0
40.0
45.0
Jul-
14
Au
g-1
4
Sep
-14
Oct
-14
No
v-1
4
De
c-1
4
Jan
-15
Feb
-15
Mar
-15
Ap
r-1
5
May
-15
Jun
-15
Jul-
15
Ave
rage
Bat
Pas
ses
Short Mast 1
Eptesicus hottentotus Miniopterus natalensis Neoromicia capensis
Rhinolophus capensis Tadarida aegyptiaca
0.0
20.0
40.0
60.0
80.0
100.0
120.0
Jul-
14
Au
g-1
4
Sep
-14
Oct
-14
No
v-1
4
De
c-1
4
Jan
-15
Feb
-15
Mar
-15
Ap
r-1
5
May
-15
Jun
-15
Jul-
15
Ave
rage
Bat
Pas
ses
Short Mast 2
Eptesicus hottentotus Miniopterus natalensis Neoromicia capensis
Tadarida aegyptiaca Rhinolophus capensis
Page 50 of 113
Figure 22: Average bat passes recorded by the detector on Short Mast 3 (SM 3).
Figure 23: Average bat passes recorded by the detector on the Met Mast (Met).
0.0
20.0
40.0
60.0
80.0
100.0
120.0Ju
l-1
4
Au
g-1
4
Sep
-14
Oct
-14
No
v-1
4
De
c-1
4
Jan
-15
Feb
-15
Mar
-15
Ap
r-1
5
May
-15
Jun
-15
Jul-
15
Ave
rage
Bat
Pas
ses
Short Mast 3
Eptesicus hottentotus Miniopterus natalensis Neoromicia capensis
Rhinolophus capensis Tadarida aegyptiaca
0.0
5.0
10.0
15.0
20.0
25.0
30.0
35.0
40.0
Jul-
14
Au
g-1
4
Sep
-14
Oct
-14
No
v-1
4
De
c-1
4
Jan
-15
Feb
-15
Mar
-15
Ap
r-1
5
May
-15
Jun
-15
Jul-
15
Ave
rage
Bat
Pas
ses
Met Mast
Eptesicus hottentotus 10m Miniopterus natalensis 10m Neoromicia capensis 10m
Tadarida aegyptiaca 10m Rhinolophus capensis 10m Eptesicus hottentotus 50m
Miniopterus natalensis 50m Neoromicia capensis 50m Tadarida aegyptiaca 50m

Page 51 of 113
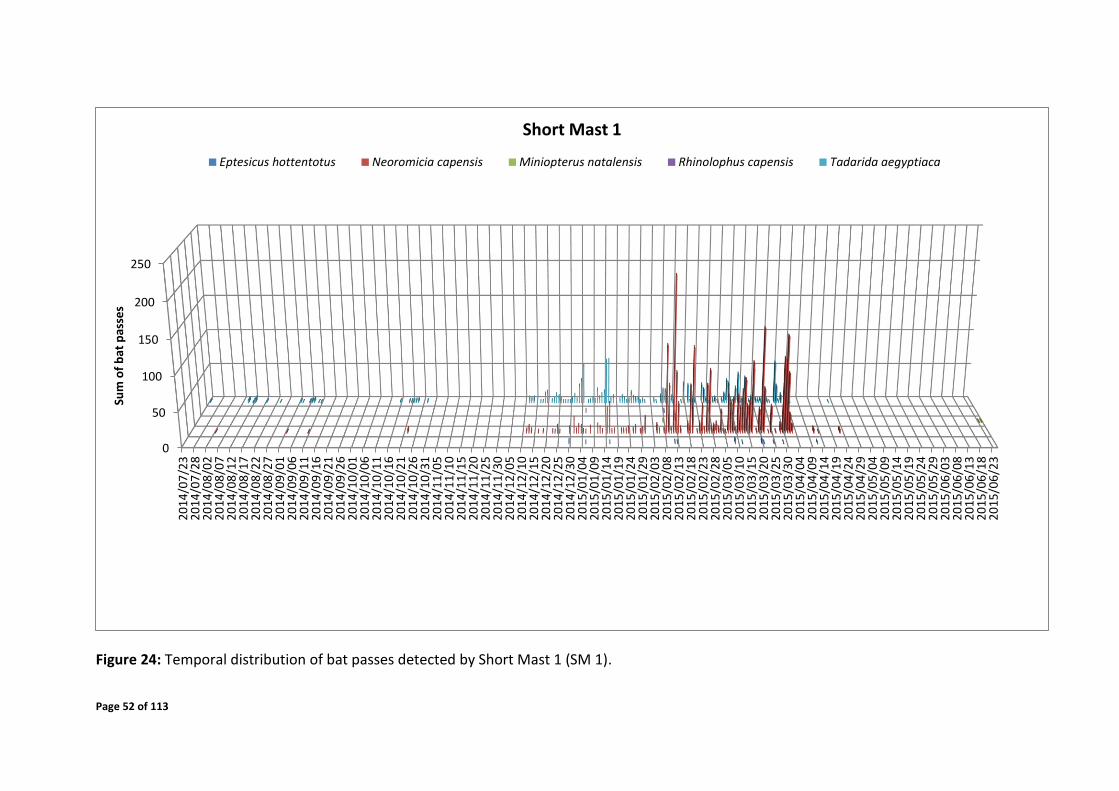
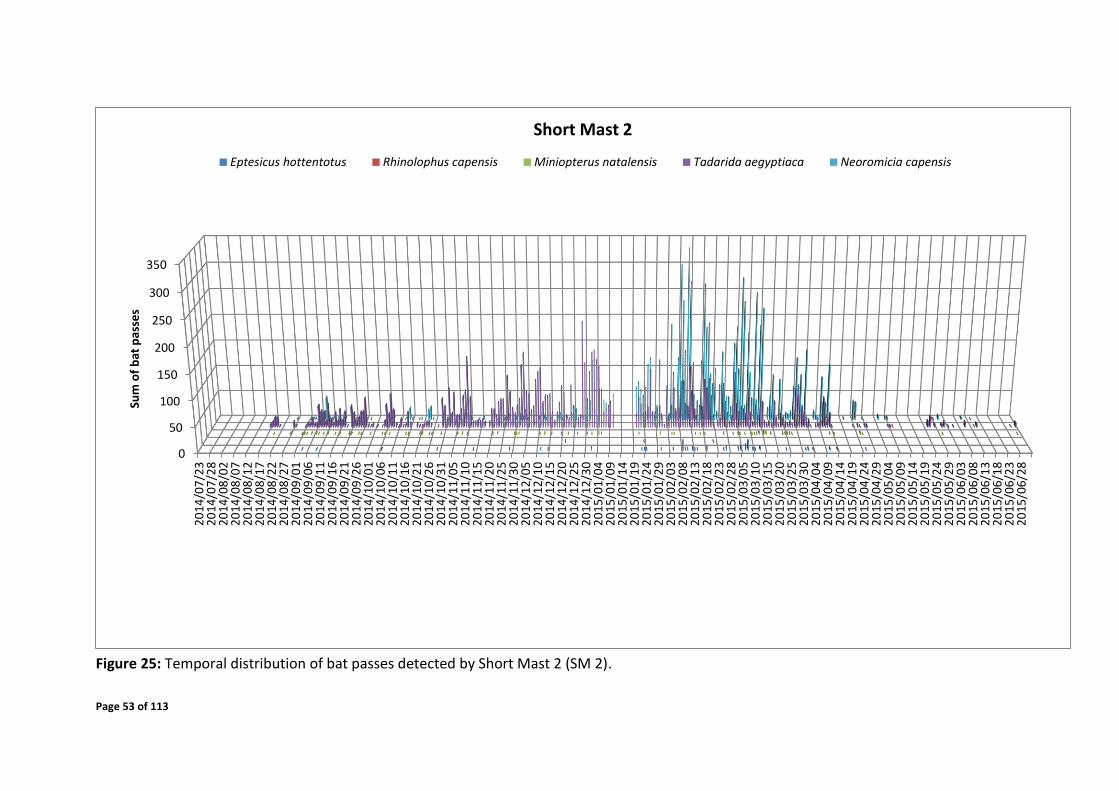
4.7.2 Temporal Distribution
The sum of all bat passes recorded by the detection systems of the particular species are
displayed per night over the entire monitoring period (Figures 24 - 27). The bat passes across
the times of night have been displayed in Figures 28 - 43. These figures give an indication of
the specific date periods and time periods where high activity was detected and by each
system. Periods of elevated bat activity as depicted in Figures 24 - 43 are as follows:
Short mast 1
Early February – early April 2015 over the time of 19:30 – 04:00
Short mast 2
Late October 2014 - mid January 2015 over the time of 19:30 – 04:00
Late January – mid April 2015 over the time of 20:00 – 04:00
Short mast 3
Mid October 2014 - mid January 2015 over the time of 19:00 – 23:00 and 03:30 – 04:30
Late January – early March 2015 over the time of 19:00 – 00:00
Met mast
Late October 2014 - mid January 2015 over the times of 19:00 - 23:00 and 03:00 - 04:30
(a significant proportion of this activity was detected at 50m height)
Month of February 2015 over the time of 18:30 – 05:00
Mid-March – early April 2015 over the time of 18:30 – 05:00
Page 52 of 113
Figure 24: Temporal distribution of bat passes detected by Short Mast 1 (SM 1).
0
50
100
150
200
250
20
14
/07
/23
20
14
/07
/28
20
14
/08
/02
20
14
/08
/07
20
14
/08
/12
20
14
/08
/17
20
14
/08
/22
20
14
/08
/27
20
14
/09
/01
20
14
/09
/06
20
14
/09
/11
20
14
/09
/16
20
14
/09
/21
20
14
/09
/26
20
14
/10
/01
20
14
/10
/06
20
14
/10
/11
20
14
/10
/16
20
14
/10
/21
20
14
/10
/26
20
14
/10
/31
20
14
/11
/05
20
14
/11
/10
20
14
/11
/15
20
14
/11
/20
20
14
/11
/25
20
14
/11
/30
20
14
/12
/05
20
14
/12
/10
20
14
/12
/15
20
14
/12
/20
20
14
/12
/25
20
14
/12
/30
20
15
/01
/04
20
15
/01
/09
20
15
/01
/14
20
15
/01
/19
20
15
/01
/24
20
15
/01
/29
20
15
/02
/03
20
15
/02
/08
20
15
/02
/13
20
15
/02
/18
20
15
/02
/23
20
15
/02
/28
20
15
/03
/05
20
15
/03
/10
20
15
/03
/15
20
15
/03
/20
20
15
/03
/25
20
15
/03
/30
20
15
/04
/04
20
15
/04
/09
20
15
/04
/14
20
15
/04
/19
20
15
/04
/24
20
15
/04
/29
20
15
/05
/04
20
15
/05
/09
20
15
/05
/14
20
15
/05
/19
20
15
/05
/24
20
15
/05
/29
20
15
/06
/03
20
15
/06
/08
20
15
/06
/13
20
15
/06
/18
20
15
/06
/23
Sum
of
bat
pas
ses
Short Mast 1
Eptesicus hottentotus Neoromicia capensis Miniopterus natalensis Rhinolophus capensis Tadarida aegyptiaca
Page 53 of 113
Figure 25: Temporal distribution of bat passes detected by Short Mast 2 (SM 2).
0
50
100
150
200
250
300
350
20
14
/07
/23
20
14
/07
/28
20
14
/08
/02
20
14
/08
/07
20
14
/08
/12
20
14
/08
/17
20
14
/08
/22
20
14
/08
/27
20
14
/09
/01
20
14
/09
/06
20
14
/09
/11
20
14
/09
/16
20
14
/09
/21
20
14
/09
/26
20
14
/10
/01
20
14
/10
/06
20
14
/10
/11
20
14
/10
/16
20
14
/10
/21
20
14
/10
/26
20
14
/10
/31
20
14
/11
/05
20
14
/11
/10
20
14
/11
/15
20
14
/11
/20
20
14
/11
/25
20
14
/11
/30
20
14
/12
/05
20
14
/12
/10
20
14
/12
/15
20
14
/12
/20
20
14
/12
/25
20
14
/12
/30
20
15
/01
/04
20
15
/01
/09
20
15
/01
/14
20
15
/01
/19
20
15
/01
/24
20
15
/01
/29
20
15
/02
/03
20
15
/02
/08
20
15
/02
/13
20
15
/02
/18
20
15
/02
/23
20
15
/02
/28
20
15
/03
/05
20
15
/03
/10
20
15
/03
/15
20
15
/03
/20
20
15
/03
/25
20
15
/03
/30
20
15
/04
/04
20
15
/04
/09
20
15
/04
/14
20
15
/04
/19
20
15
/04
/24
20
15
/04
/29
20
15
/05
/04
20
15
/05
/09
20
15
/05
/14
20
15
/05
/19
20
15
/05
/24
20
15
/05
/29
20
15
/06
/03
20
15
/06
/08
20
15
/06
/13
20
15
/06
/18
20
15
/06
/23
20
15
/06
/28
Sum
of
bat
pas
ses
Short Mast 2
Eptesicus hottentotus Rhinolophus capensis Miniopterus natalensis Tadarida aegyptiaca Neoromicia capensis

Page 54 of 113
Figure 26: Temporal distribution of bat passes detected by Short Mast 3 (SM 3).
0
50
100
150
200
250
300
350
400
20
14
/07
/14
20
14
/07
/19
20
14
/07
/24
20
14
/07
/29
20
14
/08
/03
20
14
/08
/08
20
14
/08
/13
20
14
/08
/18
20
14
/08
/23
20
14
/08
/28
20
14
/09
/02
20
14
/09
/07
20
14
/09
/12
20
14
/09
/17
20
14
/09
/22
20
14
/09
/27
20
14
/10
/02
20
14
/10
/07
20
14
/10
/12
20
14
/10
/17
20
14
/10
/22
20
14
/10
/27
20
14
/11
/01
20
14
/11
/06
20
14
/11
/11
20
14
/11
/16
20
14
/11
/21
20
14
/11
/26
20
14
/12
/01
20
14
/12
/06
20
14
/12
/11
20
14
/12
/16
20
14
/12
/21
20
14
/12
/26
20
14
/12
/31
20
15
/01
/05
20
15
/01
/10
20
15
/01
/15
20
15
/01
/20
20
15
/01
/25
20
15
/01
/30
20
15
/02
/04
20
15
/02
/09
20
15
/02
/14
20
15
/02
/19
20
15
/02
/24
20
15
/03
/01
20
15
/03
/06
20
15
/03
/11
20
15
/03
/16
20
15
/03
/21
20
15
/03
/26
20
15
/03
/31
20
15
/04
/05
20
15
/04
/10
20
15
/04
/15
20
15
/04
/20
20
15
/04
/25
20
15
/04
/30
20
15
/05
/05
20
15
/05
/10
20
15
/05
/15
20
15
/05
/20
20
15
/05
/25
20
15
/05
/30
20
15
/06
/04
20
15
/06
/09
20
15
/06
/14
20
15
/06
/19
20
15
/06
/24
20
15
/06
/29
20
15
/07
/04
20
15
/07
/09
Sum
of
bat
pas
ses
Short Mast 3
Rhinolophus capensis Eptesicus hottentotus Miniopterus natalensis Neoromicia capensis Tadarida aegyptiaca

Page 55 of 113
Figure 27: Temporal distribution of bat passes detected by the Met Mast (Met).
0
50
100
150
200
250
300
20
14
/07
/16
20
14
/07
/21
20
14
/07
/26
20
14
/07
/31
20
14
/08
/05
20
14
/08
/10
20
14
/08
/15
20
14
/08
/20
20
14
/08
/25
20
14
/08
/30
20
14
/09
/04
20
14
/09
/09
20
14
/09
/14
20
14
/09
/19
20
14
/09
/24
20
14
/09
/29
20
14
/10
/04
20
14
/10
/09
20
14
/10
/14
20
14
/10
/19
20
14
/10
/24
20
14
/10
/29
20
14
/11
/03
20
14
/11
/08
20
14
/11
/13
20
14
/11
/18
20
14
/11
/23
20
14
/11
/28
20
14
/12
/03
20
14
/12
/08
20
14
/12
/13
20
14
/12
/18
20
14
/12
/23
20
14
/12
/28
20
15
/01
/02
20
15
/01
/07
20
15
/01
/12
20
15
/01
/17
20
15
/01
/22
20
15
/01
/27
20
15
/02
/01
20
15
/02
/06
20
15
/02
/11
20
15
/02
/16
20
15
/02
/21
20
15
/02
/26
20
15
/03
/03
20
15
/03
/08
20
15
/03
/13
20
15
/03
/18
20
15
/03
/23
20
15
/03
/28
20
15
/04
/02
20
15
/04
/07
20
15
/04
/12
20
15
/04
/17
20
15
/04
/22
20
15
/04
/27
20
15
/05
/02
20
15
/05
/07
20
15
/05
/12
20
15
/05
/17
20
15
/05
/22
20
15
/05
/27
20
15
/06
/01
20
15
/06
/06
20
15
/06
/11
20
15
/06
/16
20
15
/06
/21
20
15
/06
/26
20
15
/07
/01
Sum
of
bat
pas
ses
Met Mast
Rhinolophus capensis 10m Eptesicus hottentotus 50m Eptesicus hottentotus 10m Miniopterus natalensis 10m Miniopterus natalensis 50m
Neoromicia capensis 50m Tadarida aegyptiaca 50m Neoromicia capensis 10m Tadarida aegyptiaca 10m

Page 56 of 113
Figure 28: Time of night activity over the first three-month monitoring period recorded at Short Mast 1 (SM 1) (July - October 2014).
0
1
2
3
4
5
6
18
:20
18
:30
18
:40
18
:50
19
:00
19
:10
19
:20
19
:30
19
:40
19
:50
20
:00
20
:10
20
:20
20
:30
20
:40
20
:50
21
:00
21
:10
21
:20
21
:30
21
:40
21
:50
22
:00
22
:10
22
:20
22
:30
22
:40
22
:50
23
:00
23
:10
23
:20
23
:30
23
:40
23
:50
00
:00
00
:10
00
:20
00
:30
00
:40
00
:50
01
:00
01
:10
01
:20
01
:30
01
:40
01
:50
02
:00
02
:10
02
:20
02
:30
02
:40
02
:50
03
:00
03
:10
03
:20
03
:30
03
:40
03
:50
04
:00
04
:10
04
:20
04
:30
04
:40
04
:50
05
:00
05
:10
05
:20
05
:30
05
:40
05
:50
06
:00
Sum
of
Bat
Pas
ses
Short Mast 1
Neoromicia capensis Tadarida aegyptiaca
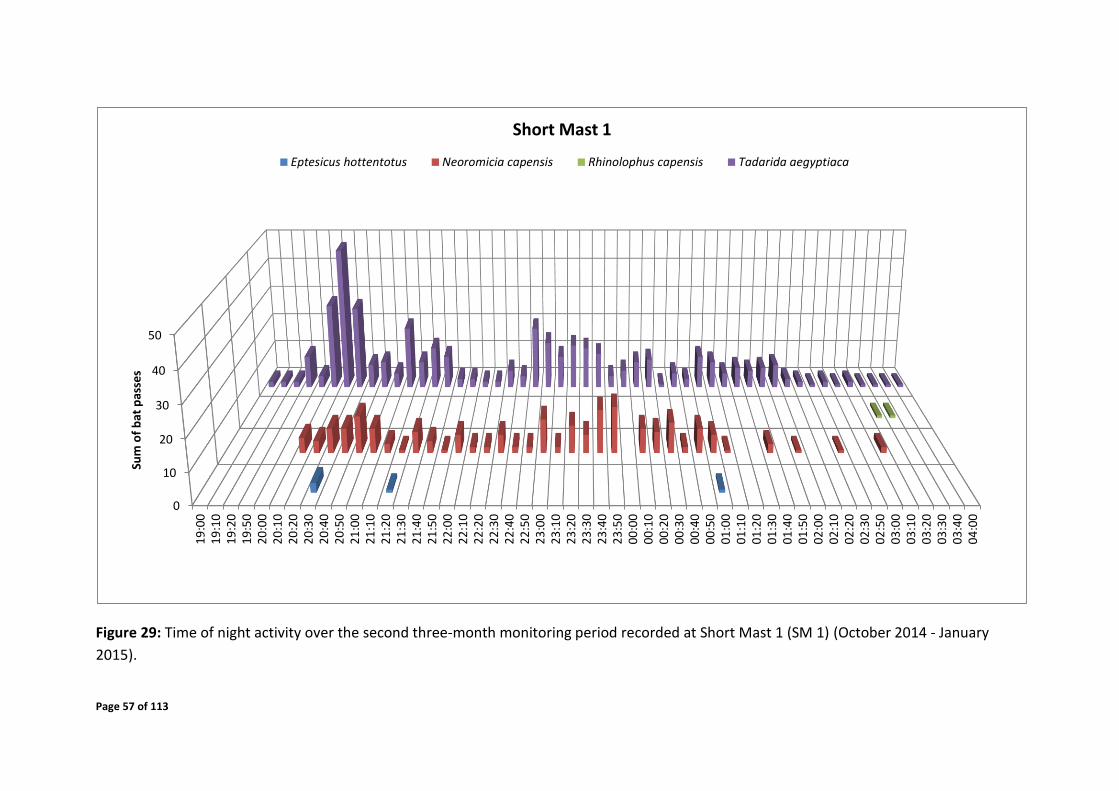
Page 57 of 113
Figure 29: Time of night activity over the second three-month monitoring period recorded at Short Mast 1 (SM 1) (October 2014 - January
2015).
0
10
20
30
40
50
19
:00
19
:10
19
:20
19
:50
20
:00
20
:10
20
:20
20
:30
20
:40
20
:50
21
:00
21
:10
21
:20
21
:30
21
:40
21
:50
22
:00
22
:10
22
:20
22
:30
22
:40
22
:50
23
:00
23
:10
23
:20
23
:30
23
:40
23
:50
00
:00
00
:10
00
:20
00
:30
00
:40
00
:50
01
:00
01
:10
01
:20
01
:30
01
:40
01
:50
02
:00
02
:10
02
:20
02
:30
02
:50
03
:00
03
:10
03
:20
03
:30
03
:40
04
:00
Sum
of
bat
pas
ses
Short Mast 1
Eptesicus hottentotus Neoromicia capensis Rhinolophus capensis Tadarida aegyptiaca

Page 58 of 113
Figure 30: Time of night activity over the third three-month monitoring period recorded at Short Mast 1 (SM 1) (January - April 2015).
0
10
20
30
40
50
60
70
80
18
:30
18
:40
18
:50
19
:00
19
:10
19
:20
19
:30
19
:40
19
:50
20
:00
20
:10
20
:20
20
:30
20
:40
20
:50
21
:00
21
:10
21
:20
21
:30
21
:40
21
:50
22
:00
22
:10
22
:20
22
:30
22
:40
22
:50
23
:00
23
:10
23
:20
23
:30
23
:40
23
:50
00
:00
00
:10
00
:20
00
:30
00
:40
00
:50
01
:00
01
:10
01
:20
01
:30
01
:40
01
:50
02
:00
02
:10
02
:20
02
:30
02
:40
02
:50
03
:00
03
:10
03
:20
03
:30
03
:40
03
:50
04
:00
04
:10
04
:20
04
:30
04
:40
04
:50
05
:00
05
:10
05
:20
05
:30
05
:40
05
:50
06
:00
Sum
of
bat
pas
ses
Short Mast 1
Eptesicus hottentotus Miniopterus natalensis Rhinolophus capensis Tadarida aegyptiaca Neoromicia capensis

Page 59 of 113
Figure 31: Time of night activity over the fourth three-month monitoring period recorded at Short Mast 1 (SM 1) (April – July 2015).
0
1
2
3
4
5
18
:30
18
:40
18
:50
19
:00
19
:10
19
:20
19
:30
19
:40
19
:50
20
:00
20
:10
20
:20
20
:30
20
:40
20
:50
21
:00
21
:10
21
:20
21
:30
21
:40
21
:50
22
:00
22
:10
22
:20
22
:30
22
:40
22
:50
23
:00
23
:10
23
:20
23
:30
23
:40
23
:50
00
:00
00
:10
00
:20
00
:30
00
:40
00
:50
01
:00
01
:10
01
:20
01
:30
01
:40
01
:50
02
:00
02
:10
02
:20
02
:30
02
:40
02
:50
03
:00
03
:10
03
:20
03
:30
03
:40
03
:50
04
:00
04
:10
04
:20
04
:30
04
:40
04
:50
05
:00
05
:10
05
:20
05
:30
05
:40
05
:50
06
:00
Sum
of
bat
pas
ses
Short Mast 1
Eptesicus hottentotus Neoromicia capensis Miniopterus natalensis Rhinolophus capensis Tadarida aegyptiaca

Page 60 of 113
Figure 32: Time of night activity over the first three-month monitoring period recorded at Short Mast 2 (SM 2) (July - October 2014).
0
10
20
30
40
50
60
70
18
:40
18
:50
19
:00
19
:10
19
:20
19
:30
19
:40
19
:50
20
:00
20
:10
20
:20
20
:30
20
:40
20
:50
21
:00
21
:10
21
:20
21
:30
21
:40
21
:50
22
:00
22
:10
22
:20
22
:30
22
:40
22
:50
23
:00
23
:10
23
:20
23
:30
23
:40
23
:50
00
:00
00
:10
00
:20
00
:30
00
:40
00
:50
01
:00
01
:10
01
:20
01
:30
01
:40
01
:50
02
:00
02
:10
02
:20
02
:30
02
:40
02
:50
03
:00
03
:10
03
:20
03
:30
03
:40
03
:50
04
:00
04
:10
04
:20
04
:30
04
:40
04
:50
05
:00
05
:10
05
:20
05
:30
05
:40
05
:50
06
:00
06
:10
06
:20
Sum
of
Bat
Pas
ses
Short Mast 2
Eptesicus hottentotus Miniopterus natalensis Neoromicia capensis Tadarida aegyptiaca

Page 61 of 113
Figure 33: Time of night activity over the second three-month monitoring period recorded at Short Mast 2 (SM 2) (October 2014 - January
2015).
0
20
40
60
80
100
120
19
:00
19
:10
19
:20
19
:30
19
:40
19
:50
20
:00
20
:10
20
:20
20
:30
20
:40
20
:50
21
:00
21
:10
21
:20
21
:30
21
:40
21
:50
22
:00
22
:10
22
:20
22
:30
22
:40
22
:50
23
:00
23
:10
23
:20
23
:30
23
:40
23
:50
00
:00
00
:10
00
:20
00
:30
00
:40
00
:50
01
:00
01
:10
01
:20
01
:30
01
:40
01
:50
02
:00
02
:10
02
:20
02
:30
02
:40
02
:50
03
:00
03
:10
03
:20
03
:30
03
:40
03
:50
04
:00
04
:10
04
:20
04
:30
04
:40
04
:50
Sum
of
bat
pas
ses
Short Mast 2
Eptesicus hottentotus Miniopterus natalensis Neoromicia capensis Tadarida aegyptiaca Rhinolophus capensis

Page 62 of 113
Figure 34: Time of night activity over the third three-month monitoring period recorded at Short Mast 2 (SM 2) (January – April 2015).
0
50
100
150
200
250
18
:20
18
:30
18
:40
18
:50
19
:00
19
:10
19
:20
19
:30
19
:40
19
:50
20
:00
20
:10
20
:20
20
:30
20
:40
20
:50
21
:00
21
:10
21
:20
21
:30
21
:40
21
:50
22
:00
22
:10
22
:20
22
:30
22
:40
22
:50
23
:00
23
:10
23
:20
23
:30
23
:40
23
:50
00
:00
00
:10
00
:20
00
:30
00
:40
00
:50
01
:00
01
:10
01
:20
01
:30
01
:40
01
:50
02
:00
02
:10
02
:20
02
:30
02
:40
02
:50
03
:00
03
:10
03
:20
03
:30
03
:40
03
:50
04
:00
04
:10
04
:20
04
:30
04
:40
04
:50
05
:00
05
:10
05
:20
05
:30
05
:40
05
:50
06
:00
Sum
of
bat
pas
ses
Short Mast 2
Eptesicus hottentotus Miniopterus natalensis Rhinolophus capensis Tadarida aegyptiaca Neoromicia capensis

Page 63 of 113
Figure 35: Time of night activity over the fourth three-month monitoring period recorded at Short Mast 2 (SM 2) (April – July 2015).
0
5
10
15
20
25
30
35
18
:10
18
:20
18
:30
18
:40
18
:50
19
:00
19
:10
19
:20
19
:30
19
:40
19
:50
20
:00
20
:10
20
:20
20
:30
20
:40
20
:50
21
:00
21
:10
21
:20
21
:30
21
:40
21
:50
22
:00
22
:10
22
:20
22
:30
22
:40
22
:50
23
:00
23
:10
23
:20
23
:30
23
:40
23
:50
00
:00
00
:10
00
:20
00
:30
00
:40
00
:50
01
:00
01
:10
01
:20
01
:30
01
:40
01
:50
02
:00
02
:10
02
:20
02
:30
02
:40
02
:50
03
:00
03
:10
03
:20
03
:30
03
:40
03
:50
04
:00
04
:10
04
:20
04
:30
04
:40
04
:50
05
:00
05
:10
05
:20
05
:30
05
:40
05
:50
06
:00
Sum
of
bat
pas
ses
Short Mast 2
Eptesicus hottentotus Miniopterus natalensis Rhinolophus capensis Tadarida aegyptiaca Neoromicia capensis

Page 64 of 113
Figure 36: Time of night activity over the first three-month monitoring period recorded at Short Mast 3 (SM 3) (July - October 2014).
0
20
40
60
80
100
120
140
18
:20
18
:30
18
:40
18
:50
19
:00
19
:10
19
:20
19
:30
19
:40
19
:50
20
:00
20
:10
20
:20
20
:30
20
:40
20
:50
21
:00
21
:10
21
:20
21
:30
21
:40
21
:50
22
:00
22
:10
22
:20
22
:30
22
:40
22
:50
23
:00
23
:10
23
:20
23
:30
23
:40
23
:50
00
:00
00
:10
00
:20
00
:30
00
:40
00
:50
01
:00
01
:10
01
:20
01
:30
01
:40
01
:50
02
:00
02
:10
02
:20
02
:30
02
:40
02
:50
03
:00
03
:10
03
:20
03
:30
03
:40
03
:50
04
:00
04
:10
04
:20
04
:30
04
:40
04
:50
05
:00
05
:10
05
:20
05
:30
05
:40
05
:50
06
:00
06
:10
06
:20
06
:30
06
:40
06
:50
07
:00
07
:10
07
:20
07
:30
Sum
of
Bat
Pas
ses
Short Mast 3
Rhinolophus capensis Eptesicus hottentotus Miniopterus natalensis Neoromicia capensis Tadarida aegyptiaca

Page 65 of 113
Figure 37: Time of night activity over the second three-month monitoring period recorded at Short Mast 3 (SM 3) (October 2014 - January 2015).
0
100
200
300
400
500
600
18
:30
18
:40
18
:50
19
:00
19
:10
19
:20
19
:30
19
:40
19
:50
20
:00
20
:10
20
:20
20
:30
20
:40
20
:50
21
:00
21
:10
21
:20
21
:30
21
:40
21
:50
22
:00
22
:10
22
:20
22
:30
22
:40
22
:50
23
:00
23
:10
23
:20
23
:30
23
:40
23
:50
00
:00
00
:10
00
:20
00
:30
00
:40
00
:50
01
:00
01
:10
01
:20
01
:30
01
:40
01
:50
02
:00
02
:10
02
:20
02
:30
02
:40
02
:50
03
:00
03
:10
03
:20
03
:30
03
:40
03
:50
04
:00
04
:10
04
:20
04
:30
04
:40
04
:50
05
:00
05
:10
Sum
of
bat
pas
ses
Short Mast 3
Rhinolophus capensis Eptesicus hottentotus Miniopterus natalensis Neoromicia capensis Tadarida aegyptiaca

Page 66 of 113
Figure 38: Time of night activity over the third three-month monitoring period recorded at Short Mast 3 (SM 3) (January – April 2015).
0
50
100
150
200
250
18
:30
18
:40
18
:50
19
:00
19
:10
19
:20
19
:30
19
:40
19
:50
20
:00
20
:10
20
:20
20
:30
20
:40
20
:50
21
:00
21
:10
21
:20
21
:30
21
:40
21
:50
22
:00
22
:10
22
:20
22
:30
22
:40
22
:50
23
:00
23
:10
23
:20
23
:30
23
:40
23
:50
00
:00
00
:10
00
:20
00
:30
00
:40
00
:50
01
:00
01
:10
01
:20
01
:30
01
:40
01
:50
02
:00
02
:10
02
:20
02
:30
02
:40
02
:50
03
:00
03
:10
03
:20
03
:30
03
:40
03
:50
04
:00
04
:10
04
:20
04
:30
04
:40
04
:50
05
:00
05
:10
05
:20
05
:30
05
:40
05
:50
06
:00
Sum
of
bat
pas
ses
Short Mast 3
Rhinolophus capensis Eptesicus hottentotus Miniopterus natalensis Tadarida aegyptiaca Neoromicia capensis

Page 67 of 113
Figure 39: Time of night activity over the fourth three-month monitoring period recorded at Short Mast 3 (SM 3) (April – July 2015).
0
50
100
150
200
250
17
:30
17
:40
17
:50
18
:00
18
:10
18
:20
18
:30
18
:40
18
:50
19
:00
19
:10
19
:20
19
:30
19
:40
19
:50
20
:00
20
:10
20
:20
20
:30
20
:40
20
:50
21
:00
21
:10
21
:20
21
:30
21
:40
21
:50
22
:00
22
:10
22
:20
22
:30
22
:40
22
:50
23
:00
23
:10
23
:20
23
:30
23
:40
23
:50
00
:00
00
:10
00
:20
00
:30
00
:40
00
:50
01
:00
01
:10
01
:20
01
:30
01
:40
01
:50
02
:00
02
:10
02
:20
02
:30
02
:40
02
:50
03
:00
03
:10
03
:20
03
:30
03
:40
03
:50
04
:00
04
:10
04
:20
04
:30
04
:40
04
:50
05
:00
05
:10
05
:20
05
:30
05
:40
05
:50
06
:00
06
:10
06
:20
06
:30
06
:40
06
:50
07
:00
Sum
of
bat
pas
ses
Short Mast 3
Rhinolophus capensis Eptesicus hottentotus Miniopterus natalensis Neoromicia capensis Tadarida aegyptiaca
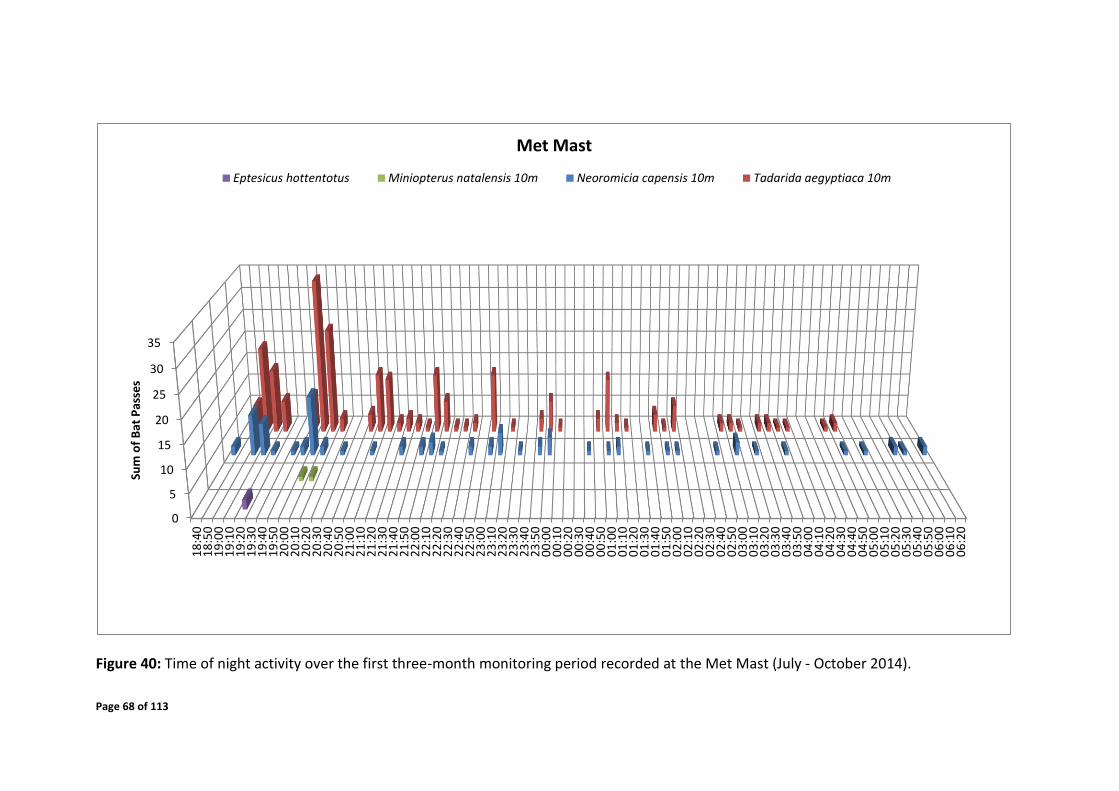
Page 68 of 113
Figure 40: Time of night activity over the first three-month monitoring period recorded at the Met Mast (July - October 2014).
0
5
10
15
20
25
30
35
18
:40
18
:50
19
:00
19
:10
19
:20
19
:30
19
:40
19
:50
20
:00
20
:10
20
:20
20
:30
20
:40
20
:50
21
:00
21
:10
21
:20
21
:30
21
:40
21
:50
22
:00
22
:10
22
:20
22
:30
22
:40
22
:50
23
:00
23
:10
23
:20
23
:30
23
:40
23
:50
00
:00
00
:10
00
:20
00
:30
00
:40
00
:50
01
:00
01
:10
01
:20
01
:30
01
:40
01
:50
02
:00
02
:10
02
:20
02
:30
02
:40
02
:50
03
:00
03
:10
03
:20
03
:30
03
:40
03
:50
04
:00
04
:10
04
:20
04
:30
04
:40
04
:50
05
:00
05
:10
05
:20
05
:30
05
:40
05
:50
06
:00
06
:10
06
:20
Sum
of
Bat
Pas
ses
Met Mast
Eptesicus hottentotus Miniopterus natalensis 10m Neoromicia capensis 10m Tadarida aegyptiaca 10m

Page 69 of 113
Figure 41: Time of night activity over the second three-month monitoring period recorded at Met Mast (October 2014 - January 2015).
0
20
40
60
80
100
120
140
18
:50
19
:00
19
:10
19
:20
19
:30
19
:40
19
:50
20
:00
20
:10
20
:20
20
:30
20
:40
20
:50
21
:00
21
:10
21
:20
21
:30
21
:40
21
:50
22
:00
22
:10
22
:20
22
:30
22
:40
22
:50
23
:00
23
:10
23
:20
23
:30
23
:40
23
:50
00
:00
00
:10
00
:20
00
:30
00
:40
00
:50
01
:00
01
:10
01
:20
01
:30
01
:40
01
:50
02
:00
02
:10
02
:20
02
:30
02
:40
02
:50
03
:00
03
:10
03
:20
03
:30
03
:40
03
:50
04
:00
04
:10
04
:20
04
:30
04
:40
04
:50
Sum
of
bat
pas
ses
Met Mast
Eptesicus hottentotus 10m Miniopterus natalensis 10m Neoromicia capensis 10m Tadarida aegyptiaca 10m
Miniopterus natalensis 50m Neoromicia capensis 50m Tadarida aegyptiaca 50m

Page 70 of 113
Figure 42: Time of night activity over the third three-month monitoring period recorded at Met Mast (January – April 2015).
0
10
20
30
40
50
60
70
18
:20
18
:30
18
:40
18
:50
19
:00
19
:10
19
:20
19
:30
19
:40
19
:50
20
:00
20
:10
20
:20
20
:30
20
:40
20
:50
21
:00
21
:10
21
:20
21
:30
21
:40
21
:50
22
:00
22
:10
22
:20
22
:30
22
:40
22
:50
23
:00
23
:10
23
:20
23
:30
23
:40
23
:50
00
:00
00
:10
00
:20
00
:30
00
:40
00
:50
01
:00
01
:10
01
:20
01
:30
01
:40
01
:50
02
:00
02
:10
02
:20
02
:30
02
:40
02
:50
03
:00
03
:10
03
:20
03
:30
03
:40
03
:50
04
:00
04
:10
04
:20
04
:30
04
:40
04
:50
05
:00
05
:10
05
:20
05
:30
05
:40
05
:50
06
:00
Sum
of
bat
pas
ses
Met Mast
Rhinolophus capensis 10m Eptesicus hottentotus 50m Eptesicus hottentotus 10m Miniopterus natalensis 10m Miniopterus natalensis 50m
Neoromicia capensis 50m Tadarida aegyptiaca 50m Tadarida aegyptiaca 10m Neoromicia capensis 10m

Page 71 of 113
Figure 43: Time of night activity over the fourth three-month monitoring period recorded at Met Mast (April – July 2015).
0
5
10
15
20
25
30
35
40
45
50
17
:50
18
:00
18
:10
18
:20
18
:30
18
:40
18
:50
19
:00
19
:10
19
:20
19
:30
19
:40
19
:50
20
:00
20
:10
20
:20
20
:30
20
:40
20
:50
21
:00
21
:10
21
:20
21
:30
21
:40
21
:50
22
:00
22
:10
22
:20
22
:30
22
:40
22
:50
23
:00
23
:10
23
:20
23
:30
23
:40
00
:00
00
:10
00
:20
00
:30
00
:40
00
:50
01
:00
01
:10
01
:20
01
:30
01
:40
01
:50
02
:00
02
:10
02
:20
02
:30
02
:40
02
:50
03
:00
03
:10
03
:20
03
:30
03
:40
03
:50
04
:00
04
:10
04
:20
04
:30
04
:40
04
:50
05
:00
05
:10
05
:20
05
:30
05
:40
05
:50
06
:00
Sum
of
bat
pas
ses
Met Mast
Rhinolophus capensis 10m Eptesicus hottentotus 50m Eptesicus hottentotus 10m Miniopterus natalensis 10m Miniopterus natalensis 50m
Neoromicia capensis 50m Tadarida aegyptiaca 50m Neoromicia capensis 10m Tadarida aegyptiaca 10m

Page 72 of 113
4.7.3 Relation between Bat Activity and Weather Conditions
Several sources of literature describe how numerous bat species are influenced by weather
conditions. Weather may influence bats in terms of lowering activity, changing time of
emergence and flight time. It is also important to note the environmental factors are never
isolated and therefore a combination of the environmental factors can have synergistic or
otherwise contradictory influences on bat activity. For instance, a combination of high
temperatures and low wind speeds will be more favourable to bat activity than low
temperatures and low wind speed, whereas low temperature and high wind speed will be the
least favourable for bats. Below are short descriptions of how wind speed, temperature and
barometric pressure influences bat activity.
Wind speed
Some bat species show reduced activity in windy conditions. Strong winds have been found
to suppress flight activity in bats by making flight difficult (O’Farrell et al. 1967). Several
studies at proposed and operating wind facilities in the United States have documented
discernibly lower bat activity during ‘high’ wind speeds (Arnett et al. 2009).
Wind speed and direction also affects availability of insect prey as insects on the wing often
accumulate on the lee side of wind breaks such as tree lines (Peng et al. 1992). So at edges
exposed to wind, flight activity of insects, and thus bats may be suppressed and at edges to
the lee side of wind, bat activity may be greater. This relationship is used in the sensitivity
map whereby the larger vegetation and man-made structures provide shelter from the wind.
However, the turbine localities are situated on the ridges of the site such that they will be in
areas exposed to the wind and not protected by vegetation or structure.
Temperature
Flight activity of bats generally increases with temperature. Flights are of shorter duration on
cooler nights and extended on warmer nights.
Rachwald (1992) noted that distinct peaks of activity disappeared in warm weather such that
activity was mostly continuous through the night. During nights of low temperatures bats
intensified foraging shortly after sunset (Corbet and Harris 1991).
Peng (1991) found that many families of aerial dipteran (flies) insects preferred warm
conditions for flight. A preference among insects for warm conditions has been reported by
many authors suggesting that temperature is an important regulator of bat activity, through
its effects on insect prey availability.

Page 73 of 113
The aim of this analysis is to determine the wind speed and temperature range within which
80% of bat passes are detected. The time periods used for the calculations are the high bat
activity periods elicited in Section 4.7.2 by the met mast monitoring system. They are
specifically late October – mid-January 2014, the month of February 2015, and mid-March –
early April 2015. Ultimately these values of wind speed and temperature will be used to
mitigate turbine operation based on conserving 80% of detected bat passes during high
activity periods, keeping in mind the synergistic or otherwise contradictory effects that the
combination of wind speeds and temperatures can have on bat activity.
The bat passes recorded by the microphone mounted at 50m on the met mast were used in
the analysis below with wind speed (m/s) recorded by loggers of the met mast at 50m height.
The same applies to the microphone at 10m of the met mast whereby wind speed recorded
at 10m height was used for the analysis. The figures below display the sum of bat passes per
wind speed and temperature category, as well as the normalised number of bat passes per
wind speed and temperature category.
The normalised number of bat passes is derived from the sum of bat passes by factoring in
the frequency of occurrence of the particular wind speed and temperature categories. This
serves the purpose of removing a bias of a wind speed or temperature category due to a
higher prevalence of the category on site. The normalised data was used in mitigation
parameter selection.
Figures 44 – 61 below display the sum of bat passes and normalised bat passes per wind speed
(10m and 50m) and temperature category for the peak bat activity periods identified on the
met mast monitoring system. Also included are the graphs of cumulative percentage of sum
of bat passes and normalised bat passes per wind speed (10m and 50m) and temperature
categories.

Page 74 of 113
Figure 44: Sum of bat passes (top) and normalised bat passes (bottom) for 10m wind speed
over late October 2014 – mid January 2015
050
100150200250300350400450500
0.0
–<0
.5
1.0
–<1
.5
2.0
–<2
.5
3.0
–<3
.5
4.0
–<4
.5
5.0
–<5
.5
6.0
–<6
.5
7.0
–<7
.5
8.0
–<8
.5
9.0
–<9
.5
10
.0–<
10
.5
11
.0–<
11
.5
12
.0–<
12
.5
13
.0–<
13
.5
14
.0–<
14
.5
15
.0–<
15
.5
16
.0–<
16
.5
17
.0–<
17
.5Sum
of
bat
pas
ses
10
m
Wind speed 10m (m/s)
Late Oct - mid Jan
0
0.1
0.2
0.3
0.4
0.5
0.6
0.7
0.8
0.0
–<0
.5
1.0
–<1
.5
2.0
–<2
.5
3.0
–<3
.5
4.0
–<4
.5
5.0
–<5
.5
6.0
–<6
.5
7.0
–<7
.5
8.0
–<8
.5
9.0
–<9
.5
10
.0–<
10
.5
11
.0–<
11
.5
12
.0–<
12
.5
13
.0–<
13
.5
14
.0–<
14
.5
15
.0–<
15
.5
16
.0–<
16
.5No
rmal
ised
bat
pas
ses
10
m
Wind speed 10m (m/s)
Late Oct - mid Jan

Page 75 of 113
Figure 45: Cumulative percentage of bat passes for 10m wind speed over late October 2014 – mid January 2015
0
10
20
30
40
50
60
70
80
90
1000
.0–<
0.5
0.5
–<1
.0
1.0
–<1
.5
1.5
–<2
.0
2.0
–<2
.5
2.5
–<3
.0
3.0
–<3
.5
3.5
–<4
.0
4.0
–<4
.5
4.5
–<5
.0
5.0
–<5
.5
5.5
–<6
.0
6.0
–<6
.5
6.5
–<7
.0
7.0
–<7
.5
7.5
–<8
.0
8.0
–<8
.5
8.5
–<9
.0
9.0
–<9
.5
9.5
–<1
0.0
10
.0–<
10
.5
10
.5–<
11
.0
11
.0–<
11
.5
11
.5–<
12
.0
12
.0–<
12
.5
12
.5–<
13
.0
13
.0–<
13
.5
13
.5–<
14
.0
14
.0–<
14
.5
14
.5–<
15
.0
15
.0–<
15
.5
15
.5–<
16
.0
16
.0–<
16
.5
16
.5–<
17
.0
%
Wind speed 10m (m/s)
Late Oct - mid Jan
Sum of bat passes Normalised bat passes

Page 76 of 113
Figure 46: Sum of bat passes (top) and normalised bat passes (bottom) for 50m wind speed
over late October 2014 – mid January 2015
0
20
40
60
80
100
120
1400
.0–<
0.5
1.0
–<1
.5
2.0
–<2
.5
3.0
–<3
.5
4.0
–<4
.5
5.0
–<5
.5
6.0
–<6
.5
7.0
–<7
.5
8.0
–<8
.5
9.0
–<9
.5
10
.0–<
10
.5
11
.0–<
11
.5
12
.0–<
12
.5
13
.0–<
13
.5
14
.0–<
14
.5
15
.0–<
15
.5
16
.0–<
16
.5
Sum
of
bat
pas
ses
50
m
Wind speed 50m (m/s)
Late Oct - mid Jan
0
0.05
0.1
0.15
0.2
0.25
0.3
0.35
0.4
0.0
–<0
.5
1.0
–<1
.5
2.0
–<2
.5
3.0
–<3
.5
4.0
–<4
.5
5.0
–<5
.5
6.0
–<6
.5
7.0
–<7
.5
8.0
–<8
.5
9.0
–<9
.5
10
.0–<
10
.5
11
.0–<
11
.5
12
.0–<
12
.5
13
.0–<
13
.5
14
.0–<
14
.5
15
.0–<
15
.5
16
.0–<
16
.5No
rmal
ised
bat
pas
ses
50
m
Wind speed 50m (m/s)
Late Oct - mid Jan

Page 77 of 113
Figure 47: Cumulative percentage of bat passes for 50m wind speed over late October 2014 – mid January 2015
0
10
20
30
40
50
60
70
80
90
1000
.0–<
0.5
0.5
–<1
.0
1.0
–<1
.5
1.5
–<2
.0
2.0
–<2
.5
2.5
–<3
.0
3.0
–<3
.5
3.5
–<4
.0
4.0
–<4
.5
4.5
–<5
.0
5.0
–<5
.5
5.5
–<6
.0
6.0
–<6
.5
6.5
–<7
.0
7.0
–<7
.5
7.5
–<8
.0
8.0
–<8
.5
8.5
–<9
.0
9.0
–<9
.5
9.5
–<1
0.0
10
.0–<
10
.5
10
.5–<
11
.0
11
.0–<
11
.5
11
.5–<
12
.0
12
.0–<
12
.5
12
.5–<
13
.0
13
.0–<
13
.5
13
.5–<
14
.0
14
.0–<
14
.5
%
Wind speed 50m (m/s)
Late Oct - mid Jan
Sum of bat passes Normalised bat passes

Page 78 of 113
Figure 48: Sum of bat passes (top) and normalised bat passes (bottom) for temperature over
late October 2014 – mid January 2015
0
50
100
150
200
250
0.0
–<0
.5
1.5
–<2
.0
3.0
–<3
.5
4.5
–<5
.0
6.0
–<6
.5
7.5
–<8
.0
9.0
–<9
.5
10
.5–<
11
.0
12
.0–<
12
.5
13
.5–<
14
.0
15
.0–<
15
.5
16
.5–<
17
.0
18
.0–<
18
.5
20
.0–<
20
.5
21
.5–<
22
.0
23
.0–<
23
.5
24
.5–<
25
.0
26
.0–<
26
.5
27
.5–<
28
.0
29
.0–<
29
.5
30
.5–<
31
.0
Sum
of
bat
pas
ses
Temperature (°C)
Late Oct - mid Jan
Sum of bat passes 10m Sum of bat passes 50m
0
0.1
0.2
0.3
0.4
0.5
0.6
0.0
–<0
.5
1.5
–<2
.0
3.0
–<3
.5
4.5
–<5
.0
6.0
–<6
.5
7.5
–<8
.0
9.0
–<9
.5
10
.5–<
11
.0
12
.0–<
12
.5
13
.5–<
14
.0
15
.0–<
15
.5
16
.5–<
17
.0
18
.0–<
18
.5
20
.0–<
20
.5
21
.5–<
22
.0
23
.0–<
23
.5
24
.5–<
25
.0
26
.0–<
26
.5
27
.5–<
28
.0
29
.0–<
29
.5No
rmal
ised
bat
pas
ses
Temperature (°C)
Late Oct - mid Jan
Normalised bat passes 10m Normalised bat passes 50m
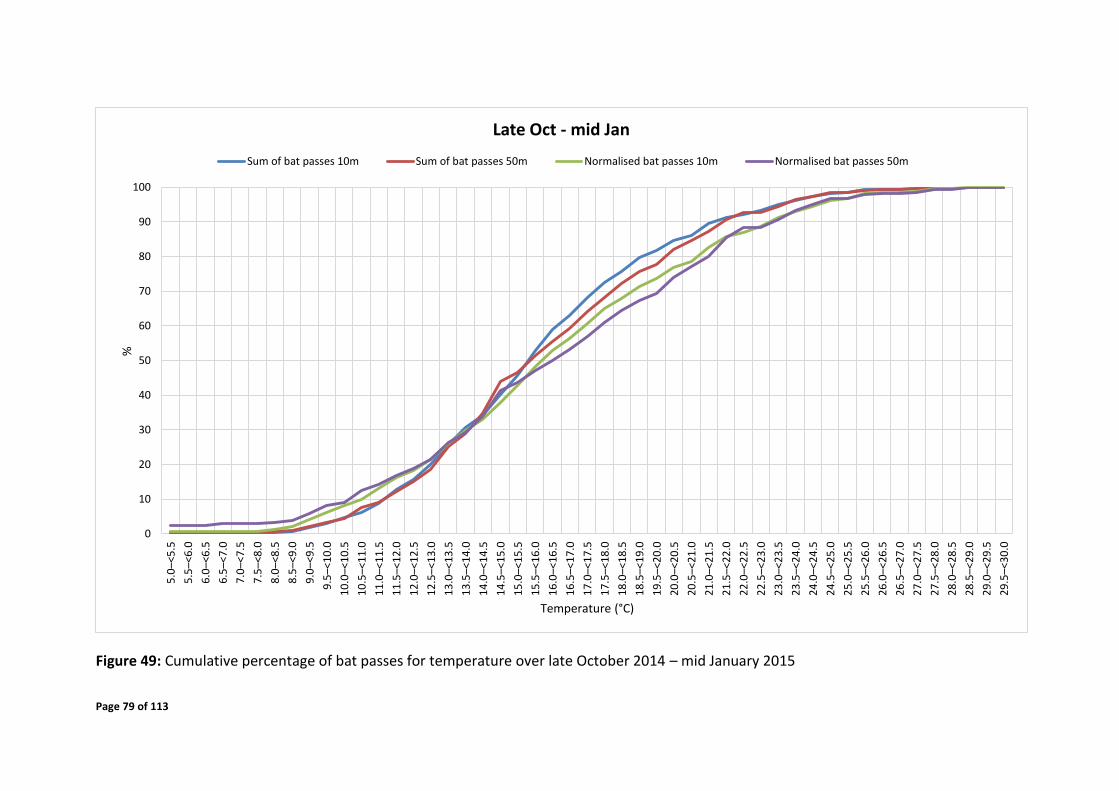
Page 79 of 113
Figure 49: Cumulative percentage of bat passes for temperature over late October 2014 – mid January 2015
0
10
20
30
40
50
60
70
80
90
100
5.0
–<5
.5
5.5
–<6
.0
6.0
–<6
.5
6.5
–<7
.0
7.0
–<7
.5
7.5
–<8
.0
8.0
–<8
.5
8.5
–<9
.0
9.0
–<9
.5
9.5
–<1
0.0
10
.0–<
10
.5
10
.5–<
11
.0
11
.0–<
11
.5
11
.5–<
12
.0
12
.0–<
12
.5
12
.5–<
13
.0
13
.0–<
13
.5
13
.5–<
14
.0
14
.0–<
14
.5
14
.5–<
15
.0
15
.0–<
15
.5
15
.5–<
16
.0
16
.0–<
16
.5
16
.5–<
17
.0
17
.0–<
17
.5
17
.5–<
18
.0
18
.0–<
18
.5
18
.5–<
19
.0
19
.5–<
20
.0
20
.0–<
20
.5
20
.5–<
21
.0
21
.0–<
21
.5
21
.5–<
22
.0
22
.0–<
22
.5
22
.5–<
23
.0
23
.0–<
23
.5
23
.5–<
24
.0
24
.0–<
24
.5
24
.5–<
25
.0
25
.0–<
25
.5
25
.5–<
26
.0
26
.0–<
26
.5
26
.5–<
27
.0
27
.0–<
27
.5
27
.5–<
28
.0
28
.0–<
28
.5
28
.5–<
29
.0
29
.0–<
29
.5
29
.5–<
30
.0
%
Temperature (°C)
Late Oct - mid Jan
Sum of bat passes 10m Sum of bat passes 50m Normalised bat passes 10m Normalised bat passes 50m

Page 80 of 113
Figure 50: Sum of bat passes (top) and normalised bat passes (bottom) for 10m wind speed
over February 2015
0
50
100
150
200
250
3000
.0–<
0.5
0.5
–<1
.0
1.0
–<1
.5
1.5
–<2
.0
2.0
–<2
.5
2.5
–<3
.0
3.0
–<3
.5
3.5
–<4
.0
4.0
–<4
.5
4.5
–<5
.0
5.0
–<5
.5
5.5
–<6
.0
6.0
–<6
.5
6.5
–<7
.0
7.0
–<7
.5
7.5
–<8
.0
8.0
–<8
.5
8.5
–<9
.0
9.0
–<9
.5
9.5
–<1
0.0
10
.0–<
10
.5
10
.5–<
11
.0
11
.0–<
11
.5
11
.5–<
12
.0
12
.0–<
12
.5
12
.5–<
13
.0
Sum
of
bat
pas
ses
10
m
Wind speed 10m (m/s)
Feb-15
0
0.5
1
1.5
2
2.5
3
3.5
4
4.5
0.0
–<0
.5
0.5
–<1
.0
1.0
–<1
.5
1.5
–<2
.0
2.0
–<2
.5
2.5
–<3
.0
3.0
–<3
.5
3.5
–<4
.0
4.0
–<4
.5
4.5
–<5
.0
5.0
–<5
.5
5.5
–<6
.0
6.0
–<6
.5
6.5
–<7
.0
7.0
–<7
.5
7.5
–<8
.0
8.0
–<8
.5
8.5
–<9
.0
9.0
–<9
.5
9.5
–<1
0.0
10
.0–<
10
.5
10
.5–<
11
.0
11
.0–<
11
.5
11
.5–<
12
.0
12
.0–<
12
.5
12
.5–<
13
.0No
rmal
ised
bat
pas
ses
10
m
Wind speed 10m (m/s)
Feb-15

Page 81 of 113
Figure 51: Cumulative percentage of bat passes for 10m wind speed over February 2015
0
10
20
30
40
50
60
70
80
90
1000
.0–<
0.5
0.5
–<1
.0
1.0
–<1
.5
1.5
–<2
.0
2.0
–<2
.5
2.5
–<3
.0
3.0
–<3
.5
3.5
–<4
.0
4.0
–<4
.5
4.5
–<5
.0
5.0
–<5
.5
5.5
–<6
.0
6.0
–<6
.5
6.5
–<7
.0
7.0
–<7
.5
7.5
–<8
.0
8.0
–<8
.5
8.5
–<9
.0
9.0
–<9
.5
9.5
–<1
0.0
10
.0–<
10
.5
10
.5–<
11
.0
11
.0–<
11
.5
11
.5–<
12
.0
%
Wind speed 10m (m/s)
Feb-15
Sum of bat passes Normalised bat passes

Page 82 of 113
Figure 52: Sum of bat passes (top) and normalised bat passes (bottom) for 50m wind speed
over February 2015
0
5
10
15
20
25
30
35
400
.0–<
0.5
1.0
–<1
.5
2.0
–<2
.5
3.0
–<3
.5
4.0
–<4
.5
5.0
–<5
.5
6.0
–<6
.5
7.0
–<7
.5
8.0
–<8
.5
9.0
–<9
.5
10
.0–<
10
.5
11
.0–<
11
.5
12
.0–<
12
.5
13
.0–<
13
.5
14
.0–<
14
.5
15
.0–<
15
.5
Sum
of
bat
pas
ses
50
m
Wind speed 50m (m/s)
Feb-15
00.10.20.30.40.50.60.70.80.9
1
0.0
–<0
.5
1.0
–<1
.5
2.0
–<2
.5
3.0
–<3
.5
4.0
–<4
.5
5.0
–<5
.5
6.0
–<6
.5
7.0
–<7
.5
8.0
–<8
.5
9.0
–<9
.5
10
.0–<
10
.5
11
.0–<
11
.5
12
.0–<
12
.5
13
.0–<
13
.5
14
.0–<
14
.5
15
.0–<
15
.5
16
.0–<
16
.5No
rmal
ised
bat
pas
ses
50
m
Wind speed 50m (m/s)
Feb-15
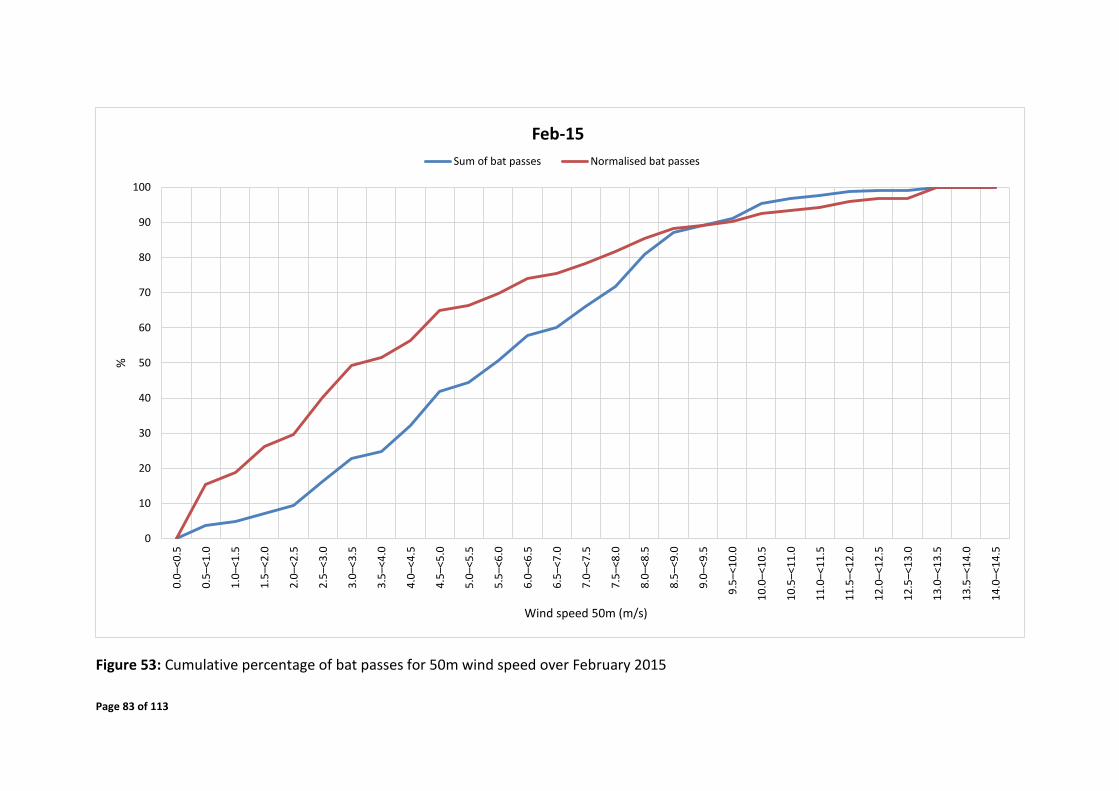
Page 83 of 113
Figure 53: Cumulative percentage of bat passes for 50m wind speed over February 2015
0
10
20
30
40
50
60
70
80
90
1000
.0–<
0.5
0.5
–<1
.0
1.0
–<1
.5
1.5
–<2
.0
2.0
–<2
.5
2.5
–<3
.0
3.0
–<3
.5
3.5
–<4
.0
4.0
–<4
.5
4.5
–<5
.0
5.0
–<5
.5
5.5
–<6
.0
6.0
–<6
.5
6.5
–<7
.0
7.0
–<7
.5
7.5
–<8
.0
8.0
–<8
.5
8.5
–<9
.0
9.0
–<9
.5
9.5
–<1
0.0
10
.0–<
10
.5
10
.5–<
11
.0
11
.0–<
11
.5
11
.5–<
12
.0
12
.0–<
12
.5
12
.5–<
13
.0
13
.0–<
13
.5
13
.5–<
14
.0
14
.0–<
14
.5
%
Wind speed 50m (m/s)
Feb-15
Sum of bat passes Normalised bat passes

Page 84 of 113
Figure 54: Sum of bat passes (top) and normalised bat passes (bottom) for temperature over
February 2015
0
50
100
150
200
250
2.0
–<2
.5
3.5
–<4
.0
5.0
–<5
.5
6.5
–<7
.0
8.0
–<8
.5
9.5
–<1
0.0
11
.0–<
11
.5
12
.5–<
13
.0
14
.0–<
14
.5
15
.5–<
16
.0
17
.0–<
17
.5
18
.5–<
19
.0
20
.5–<
21
.0
22
.0–<
22
.5
23
.5–<
24
.0
25
.0–<
25
.5
26
.5–<
27
.0
28
.0–<
28
.5
29
.5–<
30
.0
31
.0–<
31
.5
Sum
of
bat
pas
ses
Temperature (°C)
Feb-15
Sum of bat passes 10m Sum of bat passes 50m
0
1
2
3
4
5
2.0
–<2
.5
3.0
–<3
.5
4.0
–<4
.5
5.0
–<5
.5
6.0
–<6
.5
7.0
–<7
.5
8.0
–<8
.5
9.0
–<9
.5
10
.0–<
10
.5
11
.0–<
11
.5
12
.0–<
12
.5
13
.0–<
13
.5
14
.0–<
14
.5
15
.0–<
15
.5
16
.0–<
16
.5
17
.0–<
17
.5
18
.0–<
18
.5
19
.5–<
20
.0
20
.5–<
21
.0
21
.5–<
22
.0
22
.5–<
23
.0
23
.5–<
24
.0
24
.5–<
25
.0
25
.5–<
26
.0
26
.5–<
27
.0
27
.5–<
28
.0
28
.5–<
29
.0No
rmal
ised
bat
pas
ses
Temperature (°C)
Feb-15
Normalised bat passes 10m Normalised bat passes 50m
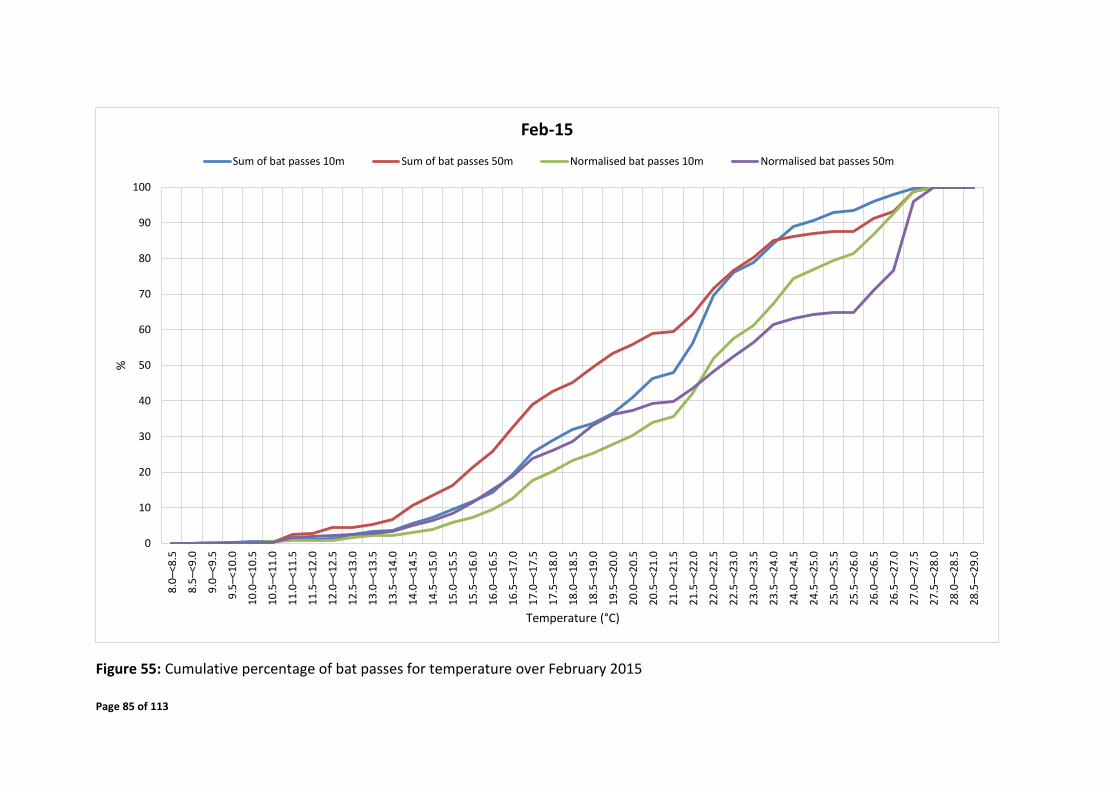
Page 85 of 113
Figure 55: Cumulative percentage of bat passes for temperature over February 2015
0
10
20
30
40
50
60
70
80
90
100
8.0
–<8
.5
8.5
–<9
.0
9.0
–<9
.5
9.5
–<1
0.0
10
.0–<
10
.5
10
.5–<
11
.0
11
.0–<
11
.5
11
.5–<
12
.0
12
.0–<
12
.5
12
.5–<
13
.0
13
.0–<
13
.5
13
.5–<
14
.0
14
.0–<
14
.5
14
.5–<
15
.0
15
.0–<
15
.5
15
.5–<
16
.0
16
.0–<
16
.5
16
.5–<
17
.0
17
.0–<
17
.5
17
.5–<
18
.0
18
.0–<
18
.5
18
.5–<
19
.0
19
.5–<
20
.0
20
.0–<
20
.5
20
.5–<
21
.0
21
.0–<
21
.5
21
.5–<
22
.0
22
.0–<
22
.5
22
.5–<
23
.0
23
.0–<
23
.5
23
.5–<
24
.0
24
.0–<
24
.5
24
.5–<
25
.0
25
.0–<
25
.5
25
.5–<
26
.0
26
.0–<
26
.5
26
.5–<
27
.0
27
.0–<
27
.5
27
.5–<
28
.0
28
.0–<
28
.5
28
.5–<
29
.0
%
Temperature (°C)
Feb-15
Sum of bat passes 10m Sum of bat passes 50m Normalised bat passes 10m Normalised bat passes 50m

Page 86 of 113
Figure 56: Sum of bat passes (top) and normalised bat passes (bottom) for 10m wind speed
over mid-March – early April 2015
0
50
100
150
200
250
300
350
4000
.0–<
0.5
0.5
–<1
.0
1.0
–<1
.5
1.5
–<2
.0
2.0
–<2
.5
2.5
–<3
.0
3.0
–<3
.5
3.5
–<4
.0
4.0
–<4
.5
4.5
–<5
.0
5.0
–<5
.5
5.5
–<6
.0
6.0
–<6
.5
6.5
–<7
.0
7.0
–<7
.5
7.5
–<8
.0
8.0
–<8
.5
8.5
–<9
.0
9.0
–<9
.5
9.5
–<1
0.0
10
.0–<
10
.5
10
.5–<
11
.0
11
.0–<
11
.5
Sum
of
bat
pas
ses
10
m
Wind speed 10m (m/s)
Mid Mar - early Apr
0
0.5
1
1.5
2
2.5
0.0
–<0
.5
0.5
–<1
.0
1.0
–<1
.5
1.5
–<2
.0
2.0
–<2
.5
2.5
–<3
.0
3.0
–<3
.5
3.5
–<4
.0
4.0
–<4
.5
4.5
–<5
.0
5.0
–<5
.5
5.5
–<6
.0
6.0
–<6
.5
6.5
–<7
.0
7.0
–<7
.5
7.5
–<8
.0
8.0
–<8
.5
8.5
–<9
.0
9.0
–<9
.5
9.5
–<1
0.0
10
.0–<
10
.5
10
.5–<
11
.0
11
.0–<
11
.5No
rmal
ised
bat
pas
ses
10
m
Wind speed 10m (m/s)
Mid Mar - early Apr
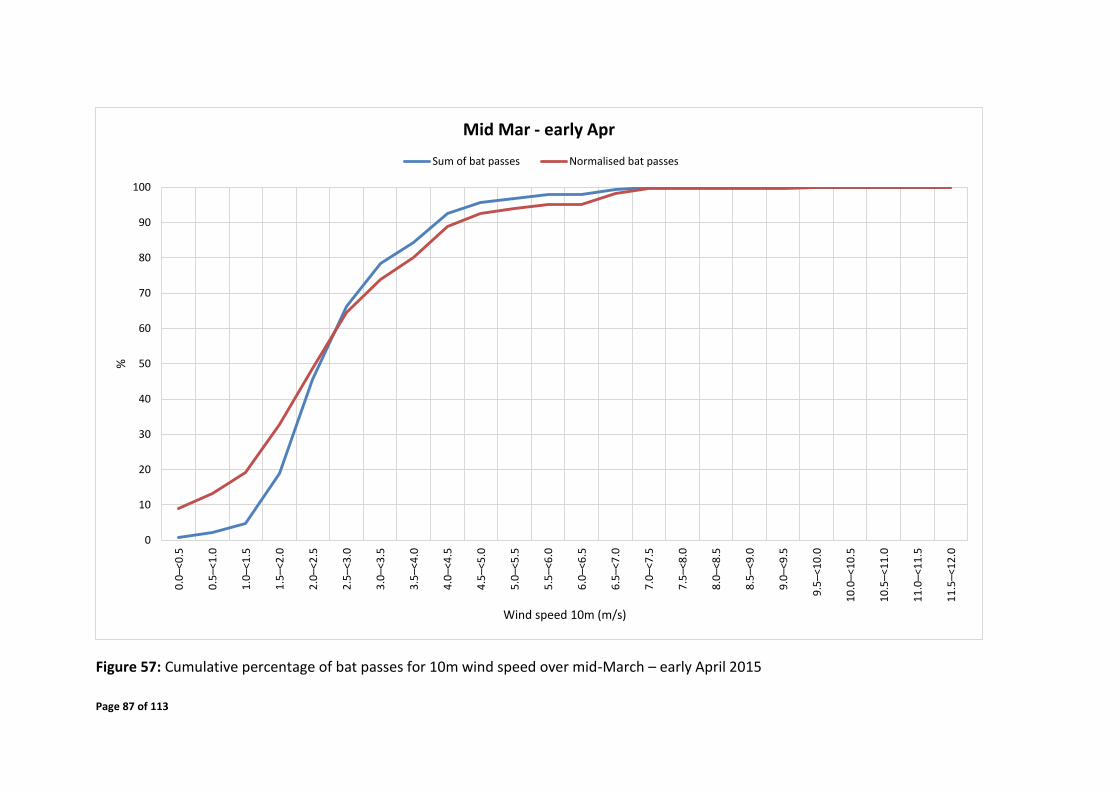
Page 87 of 113
Figure 57: Cumulative percentage of bat passes for 10m wind speed over mid-March – early April 2015
0
10
20
30
40
50
60
70
80
90
1000
.0–<
0.5
0.5
–<1
.0
1.0
–<1
.5
1.5
–<2
.0
2.0
–<2
.5
2.5
–<3
.0
3.0
–<3
.5
3.5
–<4
.0
4.0
–<4
.5
4.5
–<5
.0
5.0
–<5
.5
5.5
–<6
.0
6.0
–<6
.5
6.5
–<7
.0
7.0
–<7
.5
7.5
–<8
.0
8.0
–<8
.5
8.5
–<9
.0
9.0
–<9
.5
9.5
–<1
0.0
10
.0–<
10
.5
10
.5–<
11
.0
11
.0–<
11
.5
11
.5–<
12
.0
%
Wind speed 10m (m/s)
Mid Mar - early Apr
Sum of bat passes Normalised bat passes

Page 88 of 113
Figure 58: Sum of bat passes (top) and normalised bat passes (bottom) for 50m wind speed
over mid-March – early April 2015
0
10
20
30
40
50
600
.0–<
0.5
0.5
–<1
.0
1.0
–<1
.5
1.5
–<2
.0
2.0
–<2
.5
2.5
–<3
.0
3.0
–<3
.5
3.5
–<4
.0
4.0
–<4
.5
4.5
–<5
.0
5.0
–<5
.5
5.5
–<6
.0
6.0
–<6
.5
6.5
–<7
.0
7.0
–<7
.5
7.5
–<8
.0
8.0
–<8
.5
8.5
–<9
.0
9.0
–<9
.5
9.5
–<1
0.0
10
.0–<
10
.5
10
.5–<
11
.0
11
.0–<
11
.5
11
.5–<
12
.0
Sum
of
bat
pas
ses
50
m
Wind speed 50m (m/s)
Mid Mar - early Apr
0
0.1
0.2
0.3
0.4
0.5
0.6
0.0
–<0
.5
0.5
–<1
.0
1.0
–<1
.5
1.5
–<2
.0
2.0
–<2
.5
2.5
–<3
.0
3.0
–<3
.5
3.5
–<4
.0
4.0
–<4
.5
4.5
–<5
.0
5.0
–<5
.5
5.5
–<6
.0
6.0
–<6
.5
6.5
–<7
.0
7.0
–<7
.5
7.5
–<8
.0
8.0
–<8
.5
8.5
–<9
.0
9.0
–<9
.5
9.5
–<1
0.0
10
.0–<
10
.5
10
.5–<
11
.0
11
.0–<
11
.5
11
.5–<
12
.0No
rmal
ised
bat
pas
ses
50
m
Wind speed 50m (m/s)
Mid Mar - early Apr

Page 89 of 113
Figure 59: Cumulative percentage of bat passes for 50m wind speed over mid-March – early April 2015
0
10
20
30
40
50
60
70
80
90
1000
.0–<
0.5
0.5
–<1
.0
1.0
–<1
.5
1.5
–<2
.0
2.0
–<2
.5
2.5
–<3
.0
3.0
–<3
.5
3.5
–<4
.0
4.0
–<4
.5
4.5
–<5
.0
5.0
–<5
.5
5.5
–<6
.0
6.0
–<6
.5
6.5
–<7
.0
7.0
–<7
.5
7.5
–<8
.0
8.0
–<8
.5
8.5
–<9
.0
9.0
–<9
.5
9.5
–<1
0.0
10
.0–<
10
.5
10
.5–<
11
.0
11
.0–<
11
.5
11
.5–<
12
.0
%
Wind speed 50m (m/s)
Mid Mar - early Apr
Sum of bat passes Normalised bat passes

Page 90 of 113
Figure 60: Sum of bat passes (top) and normalised bat passes (bottom) for temperature over
mid-March – early April 2015
0
20
40
60
80
100
120
140
3.0
–<3
.5
4.0
–<4
.5
5.0
–<5
.5
6.0
–<6
.5
7.0
–<7
.5
8.0
–<8
.5
9.0
–<9
.5
10
.0–<
10
.5
11
.0–<
11
.5
12
.0–<
12
.5
13
.0–<
13
.5
14
.0–<
14
.5
15
.0–<
15
.5
16
.0–<
16
.5
17
.0–<
17
.5
18
.0–<
18
.5
19
.5–<
20
.0
20
.5–<
21
.0
21
.5–<
22
.0
22
.5–<
23
.0
23
.5–<
24
.0
24
.5–<
25
.0
Sum
of
bat
pas
ses
Temperature (°C)
Mid Mar - early Apr
Sum of bat passes 10m Sum of bat passes 50m
012345678
3.0
–<3
.5
4.0
–<4
.5
5.0
–<5
.5
6.0
–<6
.5
7.0
–<7
.5
8.0
–<8
.5
9.0
–<9
.5
10
.0–<
10
.5
11
.0–<
11
.5
12
.0–<
12
.5
13
.0–<
13
.5
14
.0–<
14
.5
15
.0–<
15
.5
16
.0–<
16
.5
17
.0–<
17
.5
18
.0–<
18
.5
19
.5–<
20
.0
20
.5–<
21
.0
21
.5–<
22
.0
22
.5–<
23
.0
23
.5–<
24
.0No
rmal
ised
bat
pas
ses
Temperature (°C)
Mid Mar - early Apr
Normalised bat passes 10m Normalised bat passes 50m

Page 91 of 113
Figure 61: Cumulative percentage of bat passes for temperature over mid-March – early April 2015
0
10
20
30
40
50
60
70
80
90
100
3.0
–<3
.5
3.5
–<4
.0
4.0
–<4
.5
4.5
–<5
.0
5.0
–<5
.5
5.5
–<6
.0
6.0
–<6
.5
6.5
–<7
.0
7.0
–<7
.5
7.5
–<8
.0
8.0
–<8
.5
8.5
–<9
.0
9.0
–<9
.5
9.5
–<1
0.0
10
.0–<
10
.5
10
.5–<
11
.0
11
.0–<
11
.5
11
.5–<
12
.0
12
.0–<
12
.5
12
.5–<
13
.0
13
.0–<
13
.5
13
.5–<
14
.0
14
.0–<
14
.5
14
.5–<
15
.0
15
.0–<
15
.5
15
.5–<
16
.0
16
.0–<
16
.5
16
.5–<
17
.0
17
.0–<
17
.5
17
.5–<
18
.0
18
.0–<
18
.5
18
.5–<
19
.0
19
.5–<
20
.0
20
.0–<
20
.5
20
.5–<
21
.0
21
.0–<
21
.5
21
.5–<
22
.0
22
.0–<
22
.5
22
.5–<
23
.0
23
.0–<
23
.5
%
Temperature (°C)
Mid Mar - early Apr
Sum of bat passes 10m Sum of bat passes 50m Normalised bat passes 10m Normalised bat passes 50m

Page 92 of 113
5 PROPOSED MITIGATION MEASURE DETAILS
The correct placement of wind farms and of individual turbines can significantly lessen the
impacts on bat fauna in an area, and should be considered as the preferred option for
mitigation.
Where mitigation by location is not possible, other options that may be utilized if required
include curtailment, blade feathering, blade lock, acoustic deterrents or light lures. The
following terminology applies:
Curtailment:
Curtailment is the act of limiting the supply of electricity to the grid during conditions when it
would normally be supplied. This is usually accomplished by locking or feathering the turbine
blades.
Cut-in speed:
Cut-in speed is defined as the wind speed at which the generator is connected to the grid and
producing electricity. For some turbines, their blades will spin at full or partial RPMs below
cut-in speed when no electricity is being produced.
Feathering or Feathered:
Adjusting the angle/pitch of the rotor blade parallel to the wind, or turning the whole unit out
of the wind, to slow or stop blade rotation. Normally operating turbine blades are angled
almost perpendicular to the wind at all times.
Free-wheeling:
Free-wheeling occurs when the blades are allowed to rotate below the cut-in speed or even
when fully feathered and parallel to the wind. In contrast, blades can be “locked” and cannot
rotate, which is a mandatory situation when turbines are being accessed by operations
personnel.
Increasing cut-in speed:
The turbine’s computer system (referred to as the Supervisory Control and Data Acquisitions
or SCADA system) is programmed to a cut-in speed higher than the manufacturer’s set speed,
and turbines are programmed to stay locked or feathered at 90° until the increased cut-in
speed is reached over some average number of minutes (usually 5 – 10 min), thus triggering
the turbine blades to pitch back “into the wind” and begin to spin normally and producing
power.

Page 93 of 113
Blade locking or full feathering below the manufacturers cut in speed, that locks or
significantly reduces the speed the blades turn, is more desirable for the conservation of bats
than allowing free rotation with no feathering below the manufacturers cut in speed.
Acoustic deterrents are a developing technology and will need investigation as a possible
option for mitigation if during operation mitigation is found to be required
Light lures refer to the concept where strong lights are placed on the periphery (or only a few
sides) of the wind farm to lure insects and therefore bats away from the turbines. The long
term effects on bat populations and local ecology of this method is unknown.
Habitat modification, with the aim of augmenting bat habitat around the wind farm in an
effort to lure bats away from turbines, is not recommended. Such a method can be adversely
intrusive on other fauna and flora and the ecology of the areas being modified. Additionally,
it is unknown whether such a method may actually increase the bat numbers of the broader
area, causing them to move into the wind farm site due to resource pressure.
Power modes for turbines are the various operational modes linked to cut in and cut out and
tip speeds for turbines that the turbines are designed to be able to operate at without
overstraining the turbines. Different modes are used to reduce the noise output of the
turbines (which also reduces the energy output) and the greater the reduction in noise the
slightly slower the tip speeds are. Thus using lower noise modes will reduce the tip speed of
the turbines
Currently the most effective method of mitigation, after correct turbine placement, is
alteration of blade speeds and cut-in speeds under environmental conditions favourable to
bats.
A basic "6 levels of mitigation" (by blade manipulation or curtailment), from light to aggressive
mitigation is presented below:
1. No curtailment (free-wheeling is unhindered below manufacturers cut in speed so all
momentum is retained, thus normal operation).
2. Feathering blades below manufacturers cut-in speed to as close to 70 degrees as
possible or more so as to reduce the free-wheeling blade rotation
3. Feathering of blades below manufacturers cut-in speed to as close to 90 degrees as
possible so as to minimise free-wheeling blade rotation as much as possible without
locking the blades.
4. 90 Degree feathering of blades below manufacturers cut in speed, with reduced
power mode settings between manufacturers’ cut-in speed and mitigation cut-in
conditions.

Page 94 of 113
5. 90 Degree feathering of blades below mitigation cut in conditions.
6. 90 Degree feathering throughout the entire night.
A preliminary recommendation would be that curtailment mitigation initiates at Level 4 for
the months, times and weather conditions determined from the data obtained to date to be
the times most likely for increased bat activity. These times and weather conditions are
outlined in Section 6 below. If such mitigation is undertaken, then depending on the results
of the post construction mortality monitoring the mitigation can be either relaxed or
intensified (moving down or up in the levels) up to a maximum intensity of Level 5. This is an
adaptive mitigation management approach that will require changes in the mitigation plan to
be implemented immediately and in real time during the post construction monitoring.
6 MITIGATION SCHEDULE
The correct placement of wind farms and of individual turbines can significantly lessen the
impacts on bat fauna in an area, and should be considered as the preferred option for
mitigation. However, the monitoring systems detected significant peaks in activity over the
12 month monitoring period. Bat species active over these time frames need to be protected
from the impacts of wind turbines. Thus mitigations are advised for all sensitive turbines
according to the parameters listed in the table below. The tables infer mitigation be applied
during the peak activity periods and times, and when the advised wind speed and
temperature ranges are prevailing (considering conditions in which 80% of bat activity
occurred).
The wind speed and temperature parameters were calculated and shown graphically in
Section 4.7.3. These calculations were performed using bat passes recorded by the 10m and
50m microphones on the met mast, with wind speed data recorded at 10m and 50m
respectively.
This schedule is intended to be used initially at the start of the operational phase, however
the exact mitigation parameters will be adjusted and adapted as determined by the
operational monitoring data. These changes may be applied within a few weeks after
operation commenced.
The times of implementation of mitigation measures is preliminarily recommended
(considering more than 80% bat activity) as follows:

Page 95 of 113
Table 12: Time period 1, wind speed and temperature parameters for turbine mitigation
Terms of mitigation implementation to be applied to
turbines 17, 18, 32, 41, 63, 67
Period of peak activity (times to
implement curtailment/ mitigation)
Late October – mid January
19:00 - 23:00 and 03:00 - 04:30
Environmental conditions in which
turbines must be mitigated
Below 7 m/s; Above 13.0°C (measured at 10m agl)
Below 9 m/s; Above 13.0°C (measured at 50m agl)
Table 13: Time period 2, wind speed and temperature parameters for turbine mitigation
Terms of mitigation implementation to be applied to
turbines 17, 18, 32, 41, 63, 67
Period of peak activity (times to
implement curtailment/ mitigation)
Month of February
18:30 – 05:00
Environmental conditions in which
turbines must be mitigated
Below 4.5 m/s; Above 16°C (measured at 10m agl)
Below 7.5 m/s; Above 17°C (measured at 50m agl)
Table 14: Time period 3, wind speed and temperature parameters for turbine mitigation
Terms of mitigation implementation to be applied to
turbines 17, 18, 32, 41, 63, 67
Period of peak activity (times to
implement curtailment/ mitigation)
Mid-March – early April
18:30 – 05:00
Environmental conditions in which
turbines must be mitigated
Below 3.5 m/s; Above 14.5°C (measured at 10m agl)
Below 5.5 m/s; Above 13.0°C (measured at 50m agl)

Page 96 of 113
7 CUMULATIVE IMPACTS OF WIND FARMS ADJACENT TO UMSOBOMVU WEF
The impact of a single wind energy facility on the resident and migratory bat populations in
South Africa is not currently well understood but, if properly mitigated, is not expected to
jeopardise viable populations. However, as wind energy facilities become substantially more
numerous and begin to populate certain areas, bat fatalities and thus biologically-significant
impacts to the populations will increase. Bats have low reproductive rates and wind farms
may impact them to the point of elimination from the local area. Since population estimates
are poorly known, it is difficult to determine whether bat fatalities due to wind turbines are a
significant threat to South African bat populations.
Due to the high number of proposed wind farms across South Africa, it is important to adopt
a precautionary approach in the assessment of cumulative impacts in order to reduce them
where possible. Figure 62 below displays the map of proposed wind farms within a 200km
radius of the Umsobomvu wind farm. This map was taken from the Department of
Environmental Affairs website, Renewable Energy Applications and is dated March 2015.
There are nine proposed wind farms within the area. Table 15 below lists the project names,
EA holders and project statuses. A number of these projects will undergo division into smaller
entities. It must be noted that not all of the listed wind farms have been approved and those
that have will become operational. The uncertainty as to which projects will be constructed,
hampers the assessment of the cumulative impacts. Thus adopting the precautionary
approach assumes a worst case scenario of all of the approved projects becoming operational.
With this in mind, the cumulative impact is considerably large and significant and has been
included in the Impact Assessment section of this report.
Table 15: Wind farm developments within a 200km radius of the Umsobomvu Wind Farm
Project Name EA holder Status
De Aar Mulilo Renewable Energy Approved
Noupoort South African Mainstream Renewable Power Preferred bidder
Springfontein South African Mainstream Renewable Power Approved
Burgersdorp iNca Queenstown Wind Withdrawn/Lapsed
Sterkstroo Dorper Wind Farm Approved
Cathcart iNca Queenstown Wind Withdrawn/Lapsed
Aberdeen Faria Holding Approved
Poortjie Wes Terra Wind Energy Approved
Beaufort West Terra Wind Energy Withdrawn/Lapsed
Ishwati Emoyeni Special Energy Project In process
Nobelsfield Coria Investments Preffered bidder

Page 97 of 113
Victoria West South African Mainstream Renewable Power Approved
Oasis Oasis Wind Energy Withdrawn/Lapsed
Longyuan Mulilo
De Aar
Mulilo Renewable Energy Preferred bidder
Naumanni Naumanni Wind Farm Withdrawn/Lapsed
Renosterberg Not specified Approved
Figure 62: Map of the proposed wind farm developments (blue polygons) in the area
surrounding the Umsobomvu wind farm (green pointer).
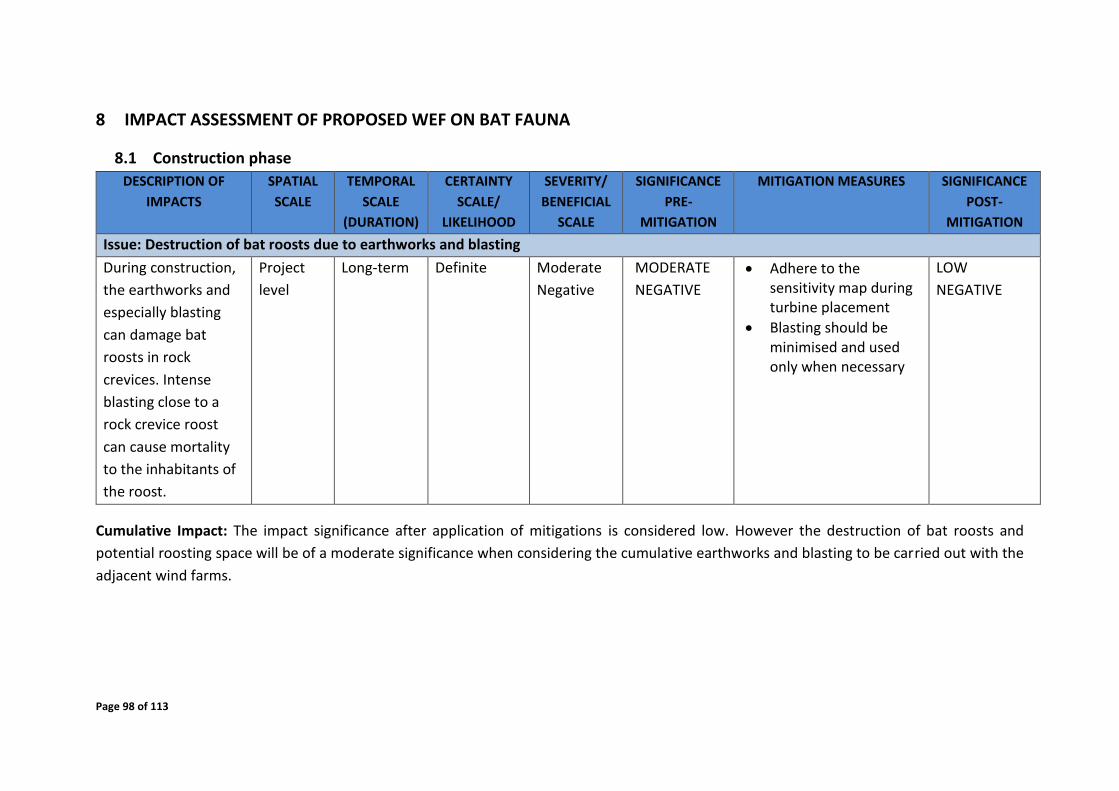
Page 98 of 113
8 IMPACT ASSESSMENT OF PROPOSED WEF ON BAT FAUNA
8.1 Construction phase
DESCRIPTION OF
IMPACTS
SPATIAL
SCALE
TEMPORAL
SCALE
(DURATION)
CERTAINTY
SCALE/
LIKELIHOOD
SEVERITY/
BENEFICIAL
SCALE
SIGNIFICANCE
PRE-
MITIGATION
MITIGATION MEASURES SIGNIFICANCE
POST-
MITIGATION
Issue: Destruction of bat roosts due to earthworks and blasting
During construction,
the earthworks and
especially blasting
can damage bat
roosts in rock
crevices. Intense
blasting close to a
rock crevice roost
can cause mortality
to the inhabitants of
the roost.
Project
level
Long-term Definite Moderate
Negative
MODERATE
NEGATIVE
Adhere to the sensitivity map during turbine placement
Blasting should be minimised and used only when necessary
LOW
NEGATIVE
Cumulative Impact: The impact significance after application of mitigations is considered low. However the destruction of bat roosts and
potential roosting space will be of a moderate significance when considering the cumulative earthworks and blasting to be carried out with the
adjacent wind farms.
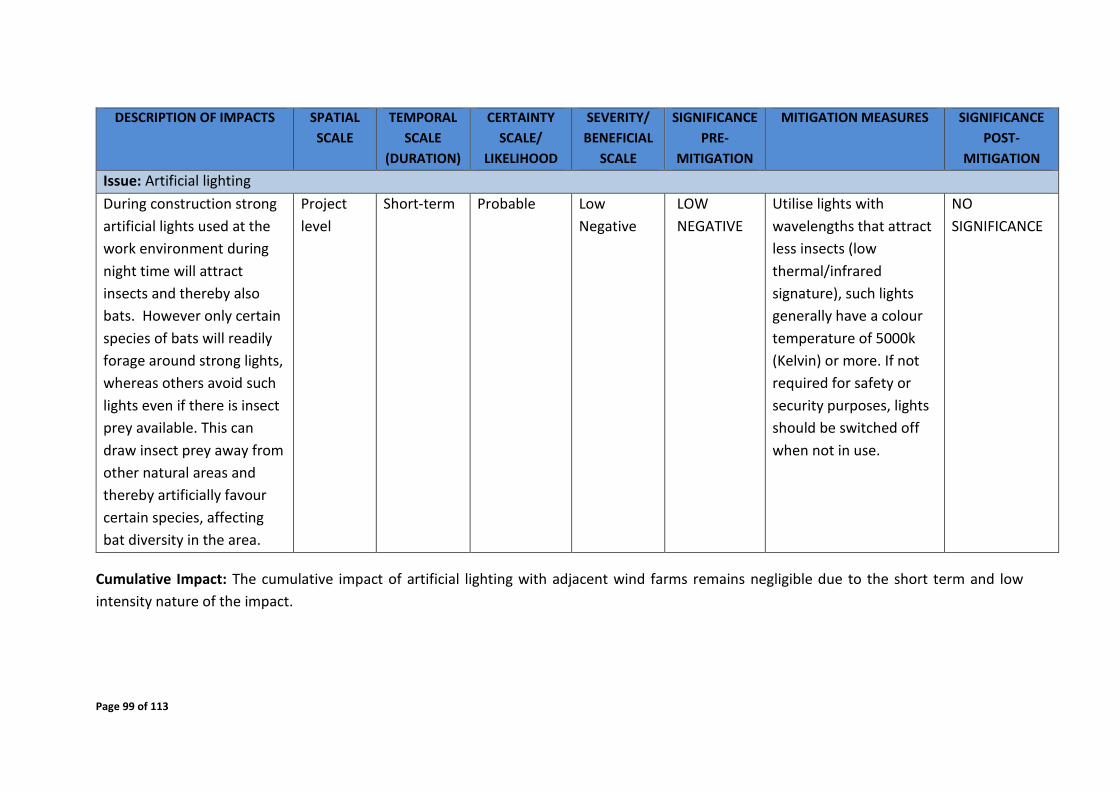
Page 99 of 113
DESCRIPTION OF IMPACTS SPATIAL
SCALE
TEMPORAL
SCALE
(DURATION)
CERTAINTY
SCALE/
LIKELIHOOD
SEVERITY/
BENEFICIAL
SCALE
SIGNIFICANCE
PRE-
MITIGATION
MITIGATION MEASURES SIGNIFICANCE
POST-
MITIGATION
Issue: Artificial lighting
During construction strong
artificial lights used at the
work environment during
night time will attract
insects and thereby also
bats. However only certain
species of bats will readily
forage around strong lights,
whereas others avoid such
lights even if there is insect
prey available. This can
draw insect prey away from
other natural areas and
thereby artificially favour
certain species, affecting
bat diversity in the area.
Project
level
Short-term Probable Low
Negative
LOW
NEGATIVE
Utilise lights with
wavelengths that attract
less insects (low
thermal/infrared
signature), such lights
generally have a colour
temperature of 5000k
(Kelvin) or more. If not
required for safety or
security purposes, lights
should be switched off
when not in use.
NO
SIGNIFICANCE
Cumulative Impact: The cumulative impact of artificial lighting with adjacent wind farms remains negligible due to the short term and low
intensity nature of the impact.
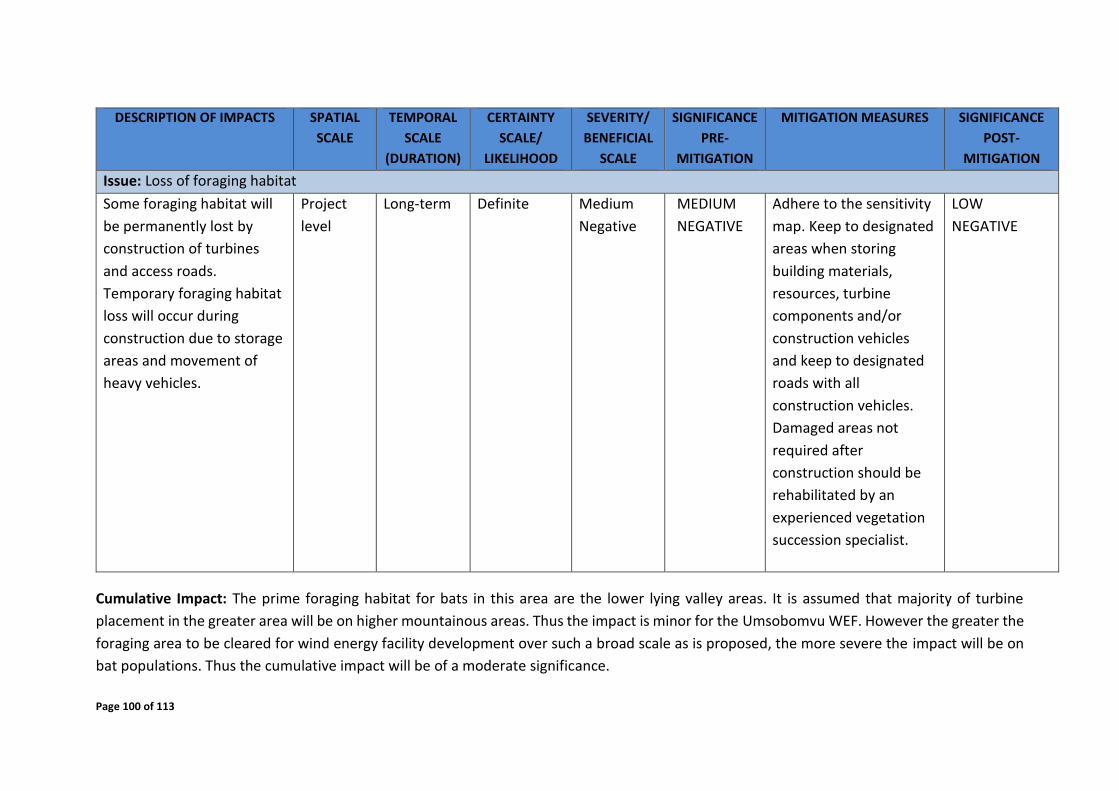
Page 100 of 113
DESCRIPTION OF IMPACTS SPATIAL
SCALE
TEMPORAL
SCALE
(DURATION)
CERTAINTY
SCALE/
LIKELIHOOD
SEVERITY/
BENEFICIAL
SCALE
SIGNIFICANCE
PRE-
MITIGATION
MITIGATION MEASURES SIGNIFICANCE
POST-
MITIGATION
Issue: Loss of foraging habitat
Some foraging habitat will
be permanently lost by
construction of turbines
and access roads.
Temporary foraging habitat
loss will occur during
construction due to storage
areas and movement of
heavy vehicles.
Project
level
Long-term Definite Medium
Negative
MEDIUM
NEGATIVE
Adhere to the sensitivity
map. Keep to designated
areas when storing
building materials,
resources, turbine
components and/or
construction vehicles
and keep to designated
roads with all
construction vehicles.
Damaged areas not
required after
construction should be
rehabilitated by an
experienced vegetation
succession specialist.
LOW
NEGATIVE
Cumulative Impact: The prime foraging habitat for bats in this area are the lower lying valley areas. It is assumed that majority of turbine
placement in the greater area will be on higher mountainous areas. Thus the impact is minor for the Umsobomvu WEF. However the greater the
foraging area to be cleared for wind energy facility development over such a broad scale as is proposed, the more severe the impact will be on
bat populations. Thus the cumulative impact will be of a moderate significance.

Page 101 of 113
8.2 Operational phase
DESCRIPTION OF IMPACTS SPATIAL
SCALE
TEMPORAL
SCALE
(DURATION)
CERTAINTY
SCALE/
LIKELIHOOD
SEVERITY/
BENEFICIAL
SCALE
SIGNIFICANCE
PRE-
MITIGATION
MITIGATION MEASURES SIGNIFICANCE
POST-
MITIGATION
Issue: Bat mortalities due to direct blade impact or barotrauma during foraging activities (not migration)
The concerns of foraging
bats in relation to wind
turbines is discussed in
Section 2.2. If the impact is
too severe (e.g. in the case
of no mitigation) local bat
populations will not recover
from mortalities.
Municipal Long-term Definite High
Negative
HIGH
NEGATIVE
Adhere to the sensitivity
maps, apply outlined
mitigations to any
further layout revisions,
avoid areas of High bat
sensitivity and their
buffers as well as
preferably avoid areas of
Moderate bat sensitivity
and their buffers. Also
see Section 6 on
mitigation options and
recommendations for
minimising risk of
mortalities.
LOW
NEGATIVE
Cumulative Impact: It is common knowledge that the greater the number of turbines in an area, the greater the risk of collision by bat species.
The cumulative impact across the general area will be high unless there is strict implementation of site specific mitigations advised by the relevant
Bat Specialists applied to all wind farms.

Page 102 of 113
DESCRIPTION OF IMPACTS SPATIAL
SCALE
TEMPORAL
SCALE
(DURATION)
CERTAINTY
SCALE/
LIKELIHOOD
SEVERITY/
BENEFICIAL
SCALE
SIGNIFICANCE
PRE-
MITIGATION
MITIGATION MEASURES SIGNIFICANCE
POST-
MITIGATION
Issue: Bat mortalities due to direct blade impact or barotrauma during foraging – cumulative impact (resident and migrating bats affected).
Mortalities of bats due to
wind turbines during
foraging and migration can
have significant ecological
consequences as the bat
species at risk are
insectivorous and thereby
contribute significantly to
the control of flying insects
at night. On a project
specific level insect
numbers in a certain
habitat can increase if
significant numbers of bats
are killed off. But if such an
impact is present on
multiple projects in close
vicinity of each other, insect
numbers can increase
regionally and possibly
cause outbreaks of colonies
National Long-term Definite High
Negative
HIGH
NEGATIVE
Adhere to the sensitivity
map during any further
turbine layout revisions,
and preferably do not
move any turbines into
even Moderate
sensitivity areas. The
High sensitivity areas can
serve as commuting
corridors for bats in the
larger area, potentially
lowering the cumulative
effects of several WEF’s
in an area. Also adhere
to recommended
mitigation measures for
this project during
operation. It is essential
that project specific
mitigations be applied
and adhered to for each
LOW –
MODERATE
NEGATIVE

Page 103 of 113
DESCRIPTION OF IMPACTS SPATIAL
SCALE
TEMPORAL
SCALE
(DURATION)
CERTAINTY
SCALE/
LIKELIHOOD
SEVERITY/
BENEFICIAL
SCALE
SIGNIFICANCE
PRE-
MITIGATION
MITIGATION MEASURES SIGNIFICANCE
POST-
MITIGATION
of certain insect species.
Additionally, if migrating
bats are killed off it can
have detrimental effects on
the cave ecology of the
caves that a specific colony
utilises. This is due to the
fact that bat guano is the
primary form of energy
input into a cave ecology
system, given that no
sunshine that allows
photosynthesis exists in
cave ecosystems.
project, as there is no
overarching mitigation
that can be
recommended on a
regional level due to
habitat and ecological
differences between
project sites.
Cumulative Impact: It is common knowledge that the greater the number of turbines in an area, the greater the risk of collision by bat species.
The cumulative impact across the general area will be major unless there is strict implementation of site specific mitigations advised by the
relevant Bat Specialists applied to all wind farms.

Page 104 of 113
8.3 Decommissioning phase
DESCRIPTION OF IMPACTS SPATIAL
SCALE
TEMPORAL
SCALE
(DURATION)
CERTAINTY
SCALE/
LIKELIHOOD
SEVERITY/
BENEFICIAL
SCALE
SIGNIFICANCE
PRE-
MITIGATION
MITIGATION MEASURES SIGNIFICANCE
POST-
MITIGATION
Issue: Artificial lighting
During decommissioning
strong artificial lights used
at the work environment
during night time will
attract insects and thereby
also bats. However only
certain species of bats will
readily forage around
strong lights, whereas
others avoid such lights
even if there is insect prey
available. This can draw
insect prey away from other
natural areas and thereby
artificially favour certain
species, affecting bat
diversity in the area.
Project
level
Short-term Probable Low
Negative
LOW
NEGATIVE
Utilise lights with
wavelengths that attract
less insects (low
thermal/infrared
signature), such lights
generally have a colour
temperature of 5000k
(Kelvin) or more. If not
required for safety or
security purposes, lights
should be switched off
when not in use.
NO
SIGNIFICANCE
Cumulative Impact: The cumulative impact of artificial lighting with adjacent wind farms remains negligible due to the short term and low
intensity nature of the impact.
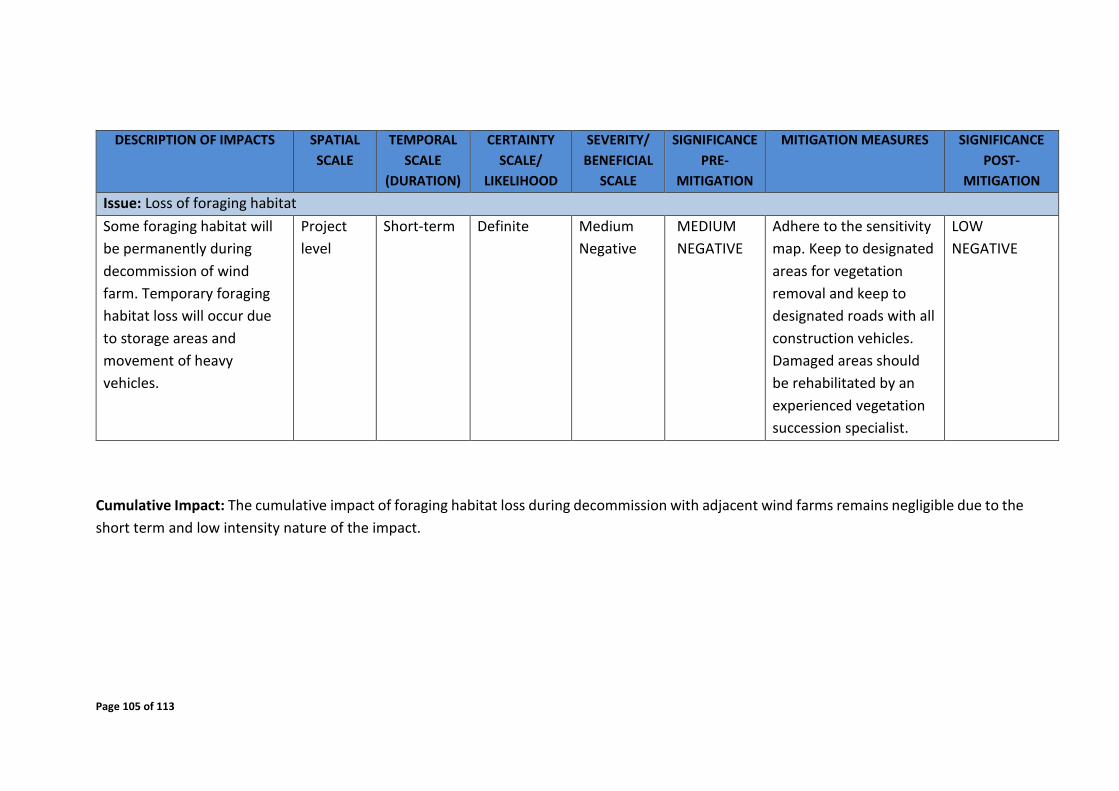
Page 105 of 113
DESCRIPTION OF IMPACTS SPATIAL
SCALE
TEMPORAL
SCALE
(DURATION)
CERTAINTY
SCALE/
LIKELIHOOD
SEVERITY/
BENEFICIAL
SCALE
SIGNIFICANCE
PRE-
MITIGATION
MITIGATION MEASURES SIGNIFICANCE
POST-
MITIGATION
Issue: Loss of foraging habitat
Some foraging habitat will
be permanently during
decommission of wind
farm. Temporary foraging
habitat loss will occur due
to storage areas and
movement of heavy
vehicles.
Project
level
Short-term Definite Medium
Negative
MEDIUM
NEGATIVE
Adhere to the sensitivity
map. Keep to designated
areas for vegetation
removal and keep to
designated roads with all
construction vehicles.
Damaged areas should
be rehabilitated by an
experienced vegetation
succession specialist.
LOW
NEGATIVE
Cumulative Impact: The cumulative impact of foraging habitat loss during decommission with adjacent wind farms remains negligible due to the
short term and low intensity nature of the impact.
Page 106 of 113
9 OPERATIONAL MONITORING PRELIMINARY METHODOLOGY OUTLINE
9.1 Introduction
Operational phase monitoring and research programs across North America and Europe have
identified bats to be vulnerable to mortality due to wind turbines. Bats are particularly
vulnerable to non-natural causes of mortality as they are long-lived animals with low
reproductive fecundity. Additionally, there is relatively little scientific knowledge about bat
populations and migration routes. It is recommended that a minimum of two-year
operational monitoring be undertaken as soon as turbines are functional, with auditing
continuing throughout the lifespan of the Umsobomvu WEF.
The primary objectives of the operational phase monitoring programme are to:
Determine the bat fatality rates for the Umsobomvu WEF
Determine the fatality rates for species of concern
Determine the fatality rates for migratory and resident bat species
Study the relation of bat fatalities within all habitats, geology and vegetation types
found in turbine areas
Compare the bat fatality rates with those from wind farms in similar habitat types
where possible
Determine the relationship between bat activity and bat fatality
Understand the relationship between bat fatality and weather conditions
Study the temporal distribution of bat fatalities across the night and seasons
Determine whether mitigation measures are necessary to reduce bat fatality rates,
and if necessary recommend detailed mitigation measures
9.2 Methodology
Operational monitoring methodology is divided into two components, namely acoustic
monitoring and carcass searches. On conclusion of the first year an adapted methodology will
be outlined for the second year of monitoring.
Acoustic monitoring
Acoustics detectors and ultrasonic microphones will be used to monitor bat activity. They will
be installed on the meteorological mast and/or a sub-sample of turbine nacelles to monitor
activity in the rotor-swept path of high risk and select turbines.

Page 107 of 113
Carcass searches
Carcass searches will be undertaken to determine bat fatality rates. This component of the
methodology will be combined with that of the carcass searches for the bird monitoring
programme.
Locals will be trained in proper search techniques to carry out the carcass searches and to
record and collect all carcasses located. Searches will begin as early in the morning as possible
to reduce carcass removal by scavengers. The order in which turbines are searched will ideally
be randomly selected for each day to reduce carcass removal by predators from specific
turbines before they can be searched. Search intervals will be a maximum of one week.
All necessary information will be recorded when a carcass is found. The carcass will then be
bagged and labelled and kept refrigerated for species identification and to determine the
cause of death by the specialist. Fatality monitoring will be carried out over all seasons of the
year.
The necessary searcher efficiency and scavenger removal trials will be carried out at least
once per season to calculate field bias and error estimation.
Wind turbine mitigation
Data collected throughout the monitoring programme will be used to inform and direct
mitigation if the Umsobomvu WEF or specific turbines is found to be causing significant bat
mortality. If mitigations are implemented, monitoring the effectiveness of the applied
techniques will be necessary to evaluate and refine the success and economic efficiency of
the mitigation.
9.3 Deliverables
Four monitoring reports will be submitted annually for the first year, on conclusion of
the first year an adapted reporting and methodology schedule will be outlined for the
second year of monitoring. Reports will include descriptions of the field protocols and
sampling methods. Raw data will be included in the reports as appendices, and
methods for data analysis shall be transparent.
A contingency plan will be compiled which informs immediate actions to be taken in
the case of a significant mortality event, or if mitigation measures fail. A contingency
plan will consist of additional mitigation measures to be implemented in the event
that significant negative impacts are observed from a single mortality survey.
An adaptive management approach to the operational monitoring programme.
Page 108 of 113
The methodology of the assessment will comply with requirements pertaining to the South
African Good Practice Guidelines for Operational Monitoring for Bats at Wind Energy Facilities
(the latest version available at the time of commencement), which will be a mandatory
requirement for all specialists.
10 CONCLUSION
The site was visited over the period of 11 – 14 July 2015 wherein the four passive monitoring
systems were decommissioned and all data was downloaded. The monitoring systems served
the purpose of recording bat activity every night for the 12-month pre-construction study
period. This data has been used to outline mitigation measures to be used upon operation of
the wind farm.
Section 4.7.1 outlines the periods of data loss from the monitoring systems due to technical
failures. The time periods were short and intermittent such that the data loss is an
insignificant influencer to the monitoring campaign results. Additionally, the monitoring
system at height on the met mast did not suffer any data losses, the advised mitigation
measures are based on the results from this system.
A sensitivity map was drawn up indicating bat sensitive roosting and foraging areas (Figure
12). The Moderate bat sensitivity areas and associated buffer zones must be prioritised during
operational monitoring; turbines placed within moderate sensitivity areas and buffers will
require mitigation measures listed in Section 6. The High Bat Sensitivity areas are expected to
have elevated levels of bat activity and support greater bat diversity. High Bat Sensitivity areas
and their respective buffers are ‘no – go’ areas due to the expected elevated rates of bat
fatalities due to wind turbines.
The turbine layout of September 2014, named Alternative 1, was assessed in accordance with
the map features, and a number of turbines were required to be removed or relocated.
Turbines 17 and 41 were located within a moderate bat sensitivity. Turbines 18, 32, 63 and
67 were located within the moderate sensitivity buffers. Turbines 24, 27, 41 and 42 were
located within the high bat sensitivity buffers. No turbines were located in high sensitivity
areas.
The turbine layout has since been revised in July 2015, and named Alternative 2. The design
of the layout took the bat sensitivity map into consideration and the Bat Specialist
recommendations into account. The revised turbine layout, Alternative 2, has greatly
improved and is now respective of the bat sensitive areas and buffers. Turbines are not
located within any of the high or moderate bat sensitivity areas or the respective buffers.

Page 109 of 113
In Section 5 and 6 of this Umsobomvu Fifth and Final Progress Report for the bat monitoring
study, a mitigation schedule is laid out and is advised to be applied as follows:
90 Degree feathering of blades below manufacturers cut in speed, with reduced power mode
settings between manufacturers’ cut-in speed and mitigation cut-in conditions (level 4 of the
6 level mitigation scheme).
However, the turbine layout has since undergone the mitigation measure of removing
turbines from bat sensitive habitats in layout Alternative 2. Thus the mitigation schedule can
be relaxed to:
Feathering of blades below manufacturers cut-in speed to as close to 90 degrees as possible
so as to minimise free-wheeling blade rotation as much as possible without locking the blades
(level 3 of the 6 level mitigation scheme).

Page 110 of 113
11 REFERENCES
ACR. 2010. African Chiroptera Report, 2010. African Bats, Pretoria. Arnett, E. B., Huso, M. M. P., Schirmacher, M. R and Hayes, J. P. 2009.Patterns of bat fatality at the Casselman Wind Project in south-central Pennsylvania. An annual report of the Bats and Wind Energy Cooperative and the Pennsylvania Game Commission. Bat Conservation International. Austin, Texas, USA.
Arnett, E. B., technical editor. 2005. Relationships between bats and wind turbines in Pennsylvania and West Virginia: an assessment of bat fatality search protocols, patterns of fatality, and behavioral interactions with wind turbines. A final report submitted to the Bats and Wind Energy Cooperative. Bat Conservation International. Austin, Texas, USA.
Baerwald, E. F., D’Amours, G. H., Klug, B.J. and Barclay, R. M. R. 2008. Barotrauma is a significant cause of bat fatalities at wind turbines. Current Biology 18: 695-695.
Barclay, R. M. R., Baerwald, E. F., and Gruver, J. C. 2007. Variation in bat and bird fatalities at wind energy facilities: assessing the effects of rotor size and tower height. Canadian Journal of Zoology 85: 381-387.
Bernard, R. T. F. and Tsita, J. N. 1995.Seasonally monoestrous reproduction in the molossid bat, Tadarida aegyptiaca, from low temperature latitudes (35⁰S) in South Africa. South African Journal of Zoology 30: 18-22. Cryan, P. M. and Barclay, R. M. R. 2009. Causes of bat fatalities at wind turbines: Hypotheses and predictions. Journal of Mammalogy 90: 1330-1340.
Herselman, J. C. 1980. The distribution and status of bats in the Cape Province. International Report. Cape Department of Nature and Environmental Conservation.
Hester, S. G. and Grenier, M.B. 2005.A conservation plan for bats in Wyoming. Lander, WY: Wyoming Game and Fish Department, Nongame Program.
Horn, J. W., Arnett, E. B. and Kunz, T.H. 2008. Behavioural responses of bats to operating wind turbines. Journal of Wildlife Management 72: 123-132.
Howe, R. H., Evans, W. and Wolf, A. T. 2002. Effects of wind turbines on Birds and Bats on Northeastern Wisconsin. Report submitted to Wisconsin Public Service Corporation and Madison Gas and Electric Company.
Johnson, G. D., Erickson, W. P., Stickland, M. D., Shepherd, M. F., Shepherd, D. A. and Sarappo, S. A. 2003. Mortality of bats at a large-scale wind power development at Buffalo Ridge, Minnesota. The American Midland Naturalist Journal 150: 332-342.
Kunz, T. H., Arnett, E. B., Erickson, W. P., Hoar, A. R., Johnson, G. D., Larkin, R. P., Strickland, M. D., Thresher, R. W., Tuttle, M. D. 2007. Ecological impacts of wind energy development on

Page 111 of 113
bats: questions, research needs, and hypothesis. Frontiers in Ecology and the Environment 5: 315-324.
Lynch, C. D. 1989. The mammals of the north-eastern Cape Province Mem. Nas. Mus. Bloemfontein 25: 1-116.
Monadjem, A., Taylor, P.J., Cotterill, F.P.D. & Schoeman, M.C. 2010. Bats of southern and central Africa – A biogeographic and taxonomic synthesis, Ultra Litho (Pty) Ltd, Johannesburg.
Mucina, L. and Rutherford, M. C. 2006. The Vegetation of South Africa, Lesotho and Swaziland-Strelitzia 19, South African National Biodiversity Institute, Pretoria.
Neuweiler, G. 2000. The Biology of Bats. Oxford University Press.
O’Shea, T. J., Bogan, M. A. and Ellison, L. E. 2003. Monitoring trends in bat populations of the United States and territories: Status of the science and recommendations for the future. Wildlife Society Bulletin, 31: 16-29.
Rautenbach, I.L. 1982. Mammals of the Transvaal. Pretoria: Ecoplan.
Rollins, K. E., Meyerholz, D. K., Johnson, G. D., Capparella, A. P. and Loew, S. S. 2012. A forensic investigation into the etiology of bat mortality at a wind farm: barotrauma or traumatic injury? Veterinary Pathology, 49(2): 362 - 371.
Sowler, S. and Stoffberg, S. 2014. South African good practice guidelines for surveying bats in wind farm developments. Endangered Wildlife Trust.
Taylor, P. J. 2000. Bats of southern Africa, University of Natal Press, Pietermaritzburg.
Tuttle, M. D. and Hensley, D. L. 2001. The Bat House Builder’s Handbook. (BCI) Bat Conservation International.
van der Merwe, M. 1979. Growth of ovarian follicles in the Natal clinging bat. South African Journal of Zoology 14: 111-117.
van der Merwe, M. 1994. Reproductive biology of the Cape serotine bat, Eptesicus capensis, in the Transvaal, South Africa. South African Journal of Zoology 29: 36-39.
Vincent, S., Nemoz, M. and Aulagnier, S. 2011. Activity and foraging habitats of Miniopterus schreibersii (Chiroptera: Miniopteridae) in southern France: implications for its conservation. The Italian Journal of Mammalogy 22: 57-72.

Page 112 of 113
Reviewed and signed off by:
Monika Moir
Zoologist and Ecologist
MSc (Biodiversity & Conservation, UJ)
Pr.Sci.Nat. – SACNASP
(Zoological Science)
Page 113 of 113
DISCLAIMER
The services carried out and reported in this document have been done as accurately and
scientifically as allowed by the resources and knowledge available to Animalia Zoological &
Ecological Consultation CC at the time on which the requested services were provided to the
client. Animalia Zoological & Ecological Consultation CC reserves the right to modify aspects of
the document including the recommendations if and when new information may become
available from ongoing research or further work in this field, or pertaining to this investigation.
Although great care and pride have been taken to carry out the requested services accurately
and professionally, and to represent the relevant data in a clear and concise manner; no
responsibility or liability will be accepted by Animalia Zoological & Ecological Consultation CC.
And the client, by receiving this document, indemnifies Animalia Zoological & Ecological
Consultation CC and its staff against all claims, demands, losses, liabilities, costs, damages and
expenses arising from or in connection with services rendered, directly or indirectly by Animalia
Zoological & Ecological Consultation CC; and by the use of the information contained in this
document. The primary goal of Animalia’s services is to provide professionalism that is to the
benefit of the environment as well as the community.
COPYRIGHT
This document may not be altered or added to without the prior written consent of the author.
This also refers to electronic copies of this document which are supplied for the purposes of
inclusion as part of other reports. Similarly, any recommendations, statements or conclusions
drawn from or based on this document must make reference to this document.