field testing of the orthotropic deck on … · final report 8 figure 3.4 – lvdt installed...
TRANSCRIPT

ATLSS is a National Center for Engineering Research on Advanced Technology for Large Structural Systems
117 ATLSS Drive
Bethlehem, PA 18015-4729
Phone: (610)758-3525 www.atlss.lehigh.edu Fax: (610)758-5902 Email: [email protected]
FIELD TESTING OF THE
ORTHOTROPIC DECK ON THE BRONX-WHITESTONE BRIDGE
Final Report
by
Ian C. Hodgson
Carl Bowman
ATLSS Report 09-01
Prepared for: Weidlinger Associates
New York, NY
January 2009

ATLSS is a National Center for Engineering Research on Advanced Technology for Large Structural Systems
117 ATLSS Drive
Bethlehem, PA 18015-4729
Phone: (610)758-3525 www.atlss.lehigh.edu Fax: (610)758-5902 Email: [email protected]
FIELD TESTING OF THE
ORTHOTROPIC DECK ON THE BRONX-WHITESTONE BRIDGE
Final Report
by
Ian C. Hodgson Research Engineer
ATLSS Engineering Research Center
Carl Bowman Manager, Field Instrumentation
ATLSS Engineering Research Center
ATLSS Report 09-01
Prepared for:
Weidlinger Associates New York, NY
January 2009

Field Testing of the Orthotropic Deck on the Bronx-Whitestone Bridge FINAL REPORT
1
Table of Contents:
1. Introduction................................................................................................................... 2
2. Background and Summary .......................................................................................... 3
3. Instrumentation............................................................................................................. 4 3.1 Strain Gages ............................................................................................................. 4
3.1.1 Deck Plate ........................................................................................................ 5
3.1.2 Deck Ribs ......................................................................................................... 6
3.2 Displacement Sensors .............................................................................................. 7
3.3 Data Acquisition ...................................................................................................... 8
4. Test Program – Summary.......................................................................................... 10 4.1 Controlled Load Testing ........................................................................................ 10
4.1.1 Test Truck ...................................................................................................... 10
4.1.2 Testing Procedure and Summary ................................................................... 11
4.2 Remote Monitoring ................................................................................................ 14
5. Results of Controlled-load Tests................................................................................ 15 5.1 Response of Deck Plate.......................................................................................... 15
5.1.1 Strain Gages at Quarterspan........................................................................... 15
5.1.2 Strain Gages at Built-up Diaphragm .............................................................. 20
5.2 Response of Longitudinal Ribs .............................................................................. 22
5.3 Deck Plate Displacement ....................................................................................... 23
5.4 Peak Measured Stresses/Displacements................................................................. 27
5.5 Dynamic Amplification.......................................................................................... 28
6. Results of Long-term Monitoring.............................................................................. 29 6.1 Orthotropic Deck Plate........................................................................................... 29
6.2 Orthotropic Ribs..................................................................................................... 34
6.3 Comparison with 2002 Prototype Deck Panel Field Measurements...................... 36
7. References.................................................................................................................... 37

Field Testing of the Orthotropic Deck on the Bronx-Whitestone Bridge FINAL REPORT
2
1. Introduction The Bronx-Whitestone was recently redecked with a steel orthotropic deck as part
of a overall rehabilitation of the bridge aimed at reducing dead load. During the design stage, a laboratory fatigue evaluation of the deck was conducted of a full-scale prototype in the ATLSS Laboratory [1]. Furthermore, in 2002 an in-depth field study of a prototype deck panel installed on the bridge was undertaken by ATLSS researchers [2].
To address the cause of cracking observed in the overlay of the steel orthotropic deck of the Bronx-Whitestone Bridge, field testing was performed in July 2007 by Lehigh University’s ATLSS Center under contract from the firm of Weidlinger Associates, Inc. This report presents the results of this recent field study regarding the in-situ performance of the orthotropic deck.
Strain gages were installed on the underside of the deck (on the deck plate and diaphragms), and on the top surface of the deck plate from the roadway above. Additionally, vertical displacements of the deck plate relative to the rib walls were measured to assess the deformations induced in the deck plate.
Controlled-load tests were performed with a test truck of known weight and geometry. In addition, long-term monitoring of all sensors was performed over a period of approximately 2 1/2 months to assess the response of the deck to normal traffic.

Field Testing of the Orthotropic Deck on the Bronx-Whitestone Bridge FINAL REPORT
3
2. Background and Summary The Bronx-Whitestone bridge is a steel suspension bridge with a main span of
2,300 feet. The bridge is located in New York City and carries Interstate 678 (six lanes) across the East River connecting the Boroughs of The Bronx and Queens. The bridge recently underwent a major rehabilitation. A significant portion of this work comprised the replacement of the existing concrete deck with a much lighter steel orthotropic deck. The orthotropic deck consists of a steel deck plate and steel ribs (mainly closed ribs) which span longitudinally and are welded to the underside of the deck plate. The top surface of the deck plate is topped with a epoxy-based wearing surface. The deck consists of a series of prefabricated panels that are made continuous with bolted rib splices and welded transverse and longitudinal deck plate splices.
Past investigations conducted by researchers at Lehigh University included a full-scale fatigue test of a full-scale deck prototype in 2001[1] and field instrumentation and testing of a two-span prototype deck panel installed on the bridge in 2002 [2].

Field Testing of the Orthotropic Deck on the Bronx-Whitestone Bridge FINAL REPORT
4
3. Instrumentation The following section describes the instrumentation plan used during the field
testing of the orthotropic deck. A single orthotropic deck panel between Floorbeams 88 and 89 on the northbound side of the bridge. This panel is located just north of midspan. There were a total of 20 strain gages and 2 displacement sensors (linear variable differential transformers, or LVDTs, were used to measure displacements). A complete as-installed instrumentation plan is presented in Appendix A.
3.1 Strain Gages As noted, a total of 20 strain gages were installed on the bridge. A summary of
the strain gage locations is presented in Table 3.1.
All strain gages installed on the bridge were produced by Measurements Group Inc. and were 0.25 inch gage length, model LWK-06-W250B-350. These gages are uniaxial weldable resistance-type strain gages. Weldable-type strain gages were selected due to the ease of installation in a variety of weather conditions. Strain gages placed on the underside of the deck were protected with a multi-layer weatherproofing system and then sealed with a silicon type compound. The gages on the top surface of the deck were sealed with fast-curing adhesive and protected with heavy-duty mastic tape.
Strain Gage Location Side Rib Location in Span
DP7TED 7
DP6TWD 6
DP4TED 4
DP3TWD 3
Midspan (diaph)
DP7TEQ 7
DP6TWQ 6
DP4TEQ 4
DP3TWQ
Top
3
1/4 span
DP7BEQ 7
DP6BWQ 6
DP6BEQ 6
DP4BWQ 4
DP4BEQ 4
DP3BWQ
Deck Plate
Bottom
3
1/4 span
R6LP NB Rib Bottom 6 Midspan (diaph) R3LP NB Rib Bottom 3 Midspan (diaph) R6LN NB Rib Bottom 6 Floorbeam R3LN NB Rib Bottom 3 Floorbeam
SB_R6LN SB Rib Bottom 6 Floorbeam SB_R3LN SB Rib Bottom 3 Floorbeam
Table 3.1 – Summary of strain gage locations

Field Testing of the Orthotropic Deck on the Bronx-Whitestone Bridge FINAL REPORT
5
3.1.1 Deck Plate Strain gages were installed on the top and bottom surface of the deck plate. As
indicated in Table 3.1, a total of fourteen strain gages were installed on the deck plate. Of these fourteen, eight were installed on the top surface and six were installed on the underside of the deck plate.
The strain gages on the underside of the deck were located at the same relative locations (i.e., rib number and position within rib span) as strain gages installed for the field testing of a prototype deck panel in 2002 [2] in order to make direct comparisons between testing programs. Note however that the instrumented deck panel during the 2002 testing was located on the southbound side of the bridge while the deck panel in the current study is located on the northbound side of the bridge. These gages were installed in a transverse orientation directly adjacent to the toe of the rib-to-deck-plate weld. These gages were installed adjacent to Ribs 3, 4, 6, and 7 at the quarterspan point (i.e., halfway between the floorbeam and the intermediate built-up diaphragm.
Eight strain gages were installed on the top surface of the deck plate. Four gages were installed directly above the gages installed on the underside of the deck plate at the quarterspan point between Ribs 3 and 4 and between Ribs 6 and 7. An additional four gages were installed above the intermediate built-up diaphragm (at midspan). Due to the presence of the diaphragm plate which stiffens the deck plate between ribs, the strain gages were installed with the edge of the gages adjacent to the rib wall above the closed portion of the box. Between rib walls in the closed region of the box there is no diaphragm plate present and therefore the deck plate is free to deform in the presence of a localized wheel load.
To access the deck plate, a small area (approximately 2 in. by 2 in.) of the overlay was chipped away. After grinding the surface of the deck plate smooth, the strain gage was installed (see Figure 3.1). The removed overlay was then replaces with a fast curing acrylic adhesive, as shown in Figure 3.1.
(a) strain gage on deck plate (b) after application of adhesive/sealant
Figure 3.1 – Installation of strain gages on top surface of deck
Traffic

Field Testing of the Orthotropic Deck on the Bronx-Whitestone Bridge FINAL REPORT
6
The strain gage wiring was placed transversely across the rightmost roadway to the barrier and then below the deck to the data acquisition system. To protect the wires and patched area over the strain gages from damage due to the heavy wheel loads, multiple layers of a 4 in. wide heavy-duty fabric-backed mastic tape were applied to the roadway surface over the wiring and strain gages. This tape was developed for use with temporary weigh-in-motion systems.
Figure 3.2 – Final configuration of strain gages installed on the top surface of the deck
in the rightmost northbound roadway (photo looking south)
3.1.2 Deck Ribs Strain gages were installed on the bottom flange of Ribs 3 and 6. Under the
northbound lanes, strain gages were installed at Floorbeam 88 (located 12 inches from the floorbeam) and at the built-up diaphragm between Floorbeams 88 and 89 (located 12 inches from the diaphragm). Figure 3.3 contains a photograph of strain gage R3LP located 12 inches north of the built-up diaphragm. The other rib strain gage installations are similar.
Diaphragm gages
1/4 span gages

Field Testing of the Orthotropic Deck on the Bronx-Whitestone Bridge FINAL REPORT
7
Figure 3.3 – Longitudinally-oriented strain gage R3LP located 12 inches north of the
intermediate built-up diaphragm (prior to weatherproofing)
3.2 Displacement Sensors The relative vertical displacement between the deck plate and the rib wall was
measured between Ribs 6 and 7 as well as between Ribs 3 and 4, both at the quarter span point (i.e., between the floorbeam and subdiaphragm). Linear Variable Differential Transformers (LVDTs) were used to measure these displacements. These sensors were manufactured by Macro Sensors, Inc., and are identified as model GHSD-750-250. These sensors are an all-welded stainless steel spring-loaded LVDT specially designed to be used in harsh industrial environments where dirt, water, and other contaminates may be present. Hence, they are well suited for this application. The sensors have a stroke of ±0.25 inches. LVDTs of this type theoretically have infinite resolution, however the resolution of the measurements was limited by the data acquisition system (a 16 bit system) to 8x10⁻⁶ inches as configured for this project.
The LVDTs were attached to a magnetic base mounted to the rib wall on one side. Figure 3.4 contains a photograph of LVDT67Q. As shown the LVDT is mounted to Rib 6 and measures the relative vertical displacement between the deck plate and Rib 6.
Strain gage
Rib
Built-up diaphragm
Dec
k pl
ate

Field Testing of the Orthotropic Deck on the Bronx-Whitestone Bridge FINAL REPORT
8
Figure 3.4 – LVDT installed between Ribs 6 and 7 at the quarterspan point between
Floorbeams 88 and 89
3.3 Data Acquisition A Campbell Scientific CR9000 data logger was used for the collection of data
during both the controlled-load testing and the long-term monitoring phases of this project. This logger is a high speed, multi-channel 16-bit data acquisition system and was configured with digital and analog filters to assure noise-free signals. Real-time data were viewed while on site by connecting the logger directly to a laptop computer. This was done to assure that all sensors were functioning properly. This configuration was also used during the controlled load testing when data collection was started and stopped manually using the laptop.
The data logger was enclosed in a weather-tight enclosure located on the temporary shield below the deck. Figure 3.5 contains a photograph of the weather-tight enclosure containing the data acquisition system. In addition to the CR9000 data logger, communications equipment and a power supply were housed the enclosure.
Remote communications with the data logger were established using a wireless modem connected to the data logger. Data were downloaded automatically every night via a server located in the ATLSS laboratory in Bethlehem, PA.
Continuous 110VAC power supply was obtained by connecting into an outlet located in the maintenance walkway. During the long-term monitoring phase, there were several power outages, however a sufficient quantity of high-quality data were obtained.
LVDT
Rib
6
RIb
7
Mag
netic
B
ase
Deck plate

Field Testing of the Orthotropic Deck on the Bronx-Whitestone Bridge FINAL REPORT
9
Figure 3.5 – Weather-tight enclosure used to house the data acquisition system and
wireless communications

Field Testing of the Orthotropic Deck on the Bronx-Whitestone Bridge FINAL REPORT
10
4. Test Program – Summary The following sections discuss the controlled-load testing and remote monitoring
that was conducted.
4.1 Controlled Load Testing
4.1.1 Test Truck A series of controlled load tests were conducted using a test truck of known
geometry and weight. The truck had three main axles and a fourth floating rear axle which remained in the up position for all tests. The test truck was fully loaded with 3/4” stone and had a gross vehicle weight (GVW) of 73,000 pounds (44,000 pounds of stone). The truck was weighed on scales at the loading facility immediately before departing for the bridge. The individual axles of the truck were not measured. However, the individual axle weights were estimated using a linear regression on past test truck geometry and weight data. Figure 4.1 contains a photograph of the truck used for the testing. Table 4.1 contains the weight at each axle. Table 4.2 provides the key dimensions of the test truck.
Figure 4.1 – Test truck used during controlled load tests

Field Testing of the Orthotropic Deck on the Bronx-Whitestone Bridge FINAL REPORT
11
Test Description
Rear Axle Type
Front AxleLoad (lb)
Rear Axle Group
Load (lb) GVW1
(lb) Date of Tests
Controlled Load Tests Tandem2 18,4003 54,6003 73,000 July 12-13,
2007
Note:
1. GVW = Gross Vehicle Weight 2. Floating third rear axle was in the up position for all tests. 3. Only GVW was measured. Individual axle loads are estimated based on a linear regression of past test truck
test weights and dimensions.
Table 4.1 – Test truck axle load data
Rear
Axle
L1
(in)
L2
(in)
Wf
(in)
Wr
(in)
A
(in)
B
(in)
C
(in)
D
(in)
E
(in)
Tandem 192 54 80 72 12 10 21 13 8.25
Table 4.2 – Geometry of test truck used for controlled load tests
4.1.2 Testing Procedure and Summary The controlled load tests were conducted between 11 PM and 3 AM on the night
of Thursday July 12, 2007. The center and right northbound travel lanes of the bridge were closed for the duration of the load testing.
The tests consisted of a series of park, crawl, and dynamic tests. During the park test, the truck was parked at a number of specified locations. The truck remained parked at each location for at least 10 seconds. During the crawl tests, the test truck was driven completely across the instrumented orthotropic deck panel between 3 and 5 mph. The dynamic tests were conducted with the test truck traveling at normal driving speed, which varied between 40 and 45 mph. A summary of all tests performed is presented in Table 4.3. As shown, a total of fourteen tests were performed.
WrWf
L1 L2
B
C
A
E
D

Field Testing of the Orthotropic Deck on the Bronx-Whitestone Bridge FINAL REPORT
12
Test No Test Name Truck
Speed Description
1 BW_PARK Park Park each axle of the rear tandem on the subdiaphragm line, the quarterspan point, and Floorbeam 88 – A total of six park locations
2 BW_CRL1 Test truck centered in roadway 3 (right lane) – #1
3 BW_CRL2 Test truck centered in roadway 3 (right lane) – #2
4 BW_CRL3 Test truck centered in roadway 3 (right lane) – #3
5 BW_CRL4 Test truck against barrier along roadway 3 (right lane) – #1
6 BW_CRL5 Test truck against barrier along roadway 3 (right lane) – #2
7 BW_CRL6 Test truck in roadway 3 with center of leftmost rear tires centered on striping between roadways 2 and 3 – #1
8 BW_CRL7 Test truck in roadway 3 with center of leftmost rear tires centered on striping between roadways 2 and 3 – #2
9 BW_CRL8 Test truck centered in roadway 2 (center lane) – #1
10 BW_CRL9
Crawl
Test truck centered in roadway 2 (center lane) – #2
11 BW_DYN1 Test truck centered in roadway 3 (right lane) – #1
12 BW_DYN2 Test truck centered in roadway 3 (right lane) – #2
13 BW_DYN3 Test truck centered in roadway 2 (center lane) – #1
14 BW_DYN4
posted speed limit
Test truck centered in roadway 2 (center lane) – #2
Table 4.3 – Summary of controlled load tests
The park test was conducted first. Each axle of the rear tandem axle was parked on three locations, namely the built-up diaphragm between Floorbeams 88 and 89, the quarterspan point, and over Floorbeam 88, as shown in Figure 4.2. Therefore, the test truck was parked at a total of six different positions.

Field Testing of the Orthotropic Deck on the Bronx-Whitestone Bridge FINAL REPORT
13
Figure 4.2 – Park test location plan (6 park positions in total)
Subsequently, the crawl tests were conducted. Crawl tests with four different transverse truck positions were conducted, and are as follows:
1. Test truck centered in right lane (3 tests) 2. Test truck against barrier in right lane (2 tests) 3. Test truck with left rear wheel pair centered on striping between center
and right lanes (2 tests) 4. Test truck centered in center lane (2 tests)
As noted, each test position was performed multiple times to assess the repeatability of the data.
These tests were followed by the dynamic tests. Two dynamic tests in each of the center and right lanes were performed (for a total of four dynamic tests).
The tests shaded in gray are those that were considered for data analysis. The tests performed more than once were reviewed to assess the repeatability of the data. The data were found to be repeatable. Therefore, one test (of each type) was selected for all further data analysis. Therefore, all tabulated data and charts presented in the remainder of this report are from one of these selected data files.
FRONT AXLE, TYP. REAR AXLES, TYP.
C.L. FB 88
1/4 SPAN C.L. SUB-DIAPH.
4’-11 1/4” 4’-11 1/4”
NORTH POSITION #1
POSITION #2
POSITION #3
POSITION #4
POSITION #5
POSITION #6

Field Testing of the Orthotropic Deck on the Bronx-Whitestone Bridge FINAL REPORT
14
4.2 Remote Monitoring The CR9000 data logger was also used for the long-term monitoring phase of this
project. The bridge was monitored between July 13, 2007 and September 25, 2007. Despite a limited number of power outages, a total of 72 days of high-quality data were collected.
During the long-term monitoring, stress time-history data were not collected continuously. Data were only recorded when the measured stress at selected gages exceeded predefined triggers. The trigger gage and trigger value are selected solely to reduce the amount of time-history data recorded during the monitoring period. Generally by selecting a trigger value of stress equal to or slightly greater than the stress caused by the test truck, data will only be recorded during the passage of the heaviest trucks. These data can be used to validate the highest stress cycles recorded in the stress range histogram (which is recorded constantly over the monitoring period). Once the strain value for the “trigger” gage reached the predefined limit, the logger began recording data for a predefined period of time (equal to 40 seconds for this project). It should be noted that the trigger value of stress is not meant to be correlated to a stress caused by a particular vehicle. The value is selected so an appropriate quantity of data is recorded.
As noted, stress-range histograms were developed continuously at each location monitored using the rainflow cycle-counting method. For each strain gage, this method considers 10 minutes of time-history data at a time and pairs up peaks in the response in this 10 minute segment to determine a tally of stress range cycles (number and magnitude). Every 10 minutes, the “tally” is updated, while the time-history data used to develop the tally is discarded. This results in significantly less data than continuously recorded time-history data. This process continued for the duration of the long-term monitoring period. Using these histograms, estimates of the effective stress-range and number of cycles can be made. Utilizing these results and knowing the detail category at the sensor location, and making the assumption that the stresses measured during the monitoring period are representative of the life of the bridge, an estimate of the remaining fatigue life can be made. A complete description of this procedure including a description of the rainflow cycle-counting algorithm is presented in Appendix B. Results of the long-term monitoring are presented in Section 6.

Field Testing of the Orthotropic Deck on the Bronx-Whitestone Bridge FINAL REPORT
15
5. Results of Controlled-load Tests The results of the controlled static and dynamic load tests are presented in this
section. The general response of the various instrumented details to the test load will be discussed. Additionally, the peak response parameters for each sensor and each test will be presented. It was observed that the stresses measured at the instrumented locations were very low when the test truck was in the middle lane (tests BW_CRL8 and BW_CRL9). Therefore for the results presented in the following discussion correspond only to tests with the truck in various transverse positions in the right lane. Detailed instrumentation plans are provided in Appendix A.
5.1 Response of Deck Plate The strain gages installed on the deck plate (both the top and underside) are very
sensitive to localized wheel loads and therefore the transverse position of the test truck greatly affects the stresses in the deck plate. Though the response exhibits some global response, it is primarily influenced by local wheel loading.
5.1.1 Strain Gages at Quarterspan As noted above, ten transversely-oriented strain gages were installed at the
quarterspan point; four strain gages above, and six strain gages below. The six gages on the underside were installed at identical locations as the prior field testing project in 2002. At two locations there the upper and lower strain gages were installed back-to-back (i.e., directly opposite each other on the deck plate). These are strain gages DP4TEQ/DP4BEQ and DP3TWQ/DP3BWQ.
Shown in Figure 5.1 is a stress-time history for these four strain gages, for a crawl test with the test truck centered in the right lane (test BW_CRL1). The passage of the front and rear tandem axles can be clearly seen in the plot. Furthermore, the response of the deck plate is dominated by flexure, evidenced by the comparable stresses in the back-to-back gages. Finally, the peak stresses are the result of the local presence of the wheels. Wheel loads cause high tension (positive) stresses on the top surface and compression stresses (negative) on the underside of the deck plate. It should also be noted that in addition to the peaks in the response due to the local wheel loading, there is a global bending response of the deck plate which causes opposite direction bending stresses. This causes stress reversal on the underside of the deck (i.e., peak stresses are compressive, however there is a small amount of tension reversal).
Figure 5.2 and Figure 5.3 contain similar plots for crawl tests with the test truck against the barrier and with the left edge of the test truck on the striping between the middle and right lanes, respectively. It can be seen that with the test truck against the barrier (Figure 5.2) the response is similar though at the underside against Rib 4 (DP4BEQ) the stresses are reduced. With the test truck shifted left in the lane (Figure 5.3) the stresses are significantly reduced and the response is markedly different.

Field Testing of the Orthotropic Deck on the Bronx-Whitestone Bridge FINAL REPORT
16
Figure 5.1 – Stress time-history for two pairs of back-to-back (top and bottom) strain gages on the deck plate at quarterspan for test BW_CRL1 (test truck centered in lane)
Figure 5.2 – Stress time-history for two pairs of back-to-back (top and bottom) strain gages on the deck plate at quarterspan for test BW_CRL5 (test truck against barrier)
DP3TWQ DP4TEQ
DP3BWQ
DP4BEQ
Time (sec)
Stre
ss (k
si)
DP3TWQ
DP4TEQ
DP3BWQ
DP4BEQ
Time (sec)
Stre
ss (k
si)

Field Testing of the Orthotropic Deck on the Bronx-Whitestone Bridge FINAL REPORT
17
Figure 5.3 – Stress time-history for two pairs of back-to-back (top and bottom) strain
gages on the deck plate at the quarterspan for test BW_CRL6 (test truck against left edge)
DP3TWQ
DP4TEQ
DP3BWQ
DP4BEQ
Time (sec)
Stre
ss (k
si)

Field Testing of the Orthotropic Deck on the Bronx-Whitestone Bridge FINAL REPORT
18
Shown in Figure 5.4, Figure 5.5, and Figure 5.6 are the stress time-histories for the remainder of the underside strain gages at the quarterspan, for the test truck centered, shifted right in the lane, and shifted left in the lane, respectively. As seen in the plots, the general response is similar for the three truck positions. Additionally, the observations noted above are echoed in these figures. The peak stresses were observed with the test truck centered in the lane. A peak stress of just over 8 ksi in compression was measured at strain gage DP6BWQ, with a 1.3 ksi tension reversal.
The peak stresses decrease only slightly with the truck shifted to the right (Figure 5.5). However, when the truck is shifted to the left side of the lane, the stresses are decreased significantly, thought the response is similar.
Figure 5.4 – Stress time-history for four strain gages on the bottom surface of the deck
plate at quarterspan for test BW_CRL1 (test truck centered in lane)
DP6BWQ
DP7BEQ
DP4BWQ
DP6BEQ
Time (sec)
Stre
ss (k
si)

Field Testing of the Orthotropic Deck on the Bronx-Whitestone Bridge FINAL REPORT
19
Figure 5.5 – Stress time-history for four strain gages on the bottom surface of the deck
plate at quarterspan for test BW_CRL5 (test truck against barrier)
Figure 5.6 – Stress time-history for four strain gages on the bottom surface of the deck
plate at quarterspan for test BW_CRL5 (test truck against left edge of lane)
DP6BWQ
DP7BEQ
DP4BWQ
DP6BEQ
Time (sec)
Stre
ss (k
si)
DP6BWQ DP7BEQ
DP4BWQ DP6BEQ
Time (sec)
Stre
ss (k
si)

Field Testing of the Orthotropic Deck on the Bronx-Whitestone Bridge FINAL REPORT
20
5.1.2 Strain Gages at Built-up Diaphragm The strain gages at the built-up diaphragm were placed on the top surface of the
deck plate only. These strain gages were installed above the closed portion of the rib since the presence of the diaphragm plate between ribs significantly stiffens the deck plate for out-of-plane loading caused by local wheel presence. There is no diaphragm inside the ribs (only a rib wall stiffener).
Shown in Figures Figure 5.7, Figure 5.8, and Figure 5.9 are the stress time-history plots for the four strain gages located on the top surface of the deck plate above the built-up diaphragm with the test truck in the center, right side, and left side of the lane, respectively. The response is very sensitive to the transverse position of the truck. For example, the peak stress in strain gage DP4TED with the test truck centered in the lane was 4.5 ksi (Figure 5.7) however, the peak stress at the same strain gage with the test truck to the right side of the lane was less than 0.5 ksi (Figure 5.8).
Figure 5.7 – Stress time-history for four strain gages on the top surface of the deck plate
at the diaphragm for test BW_CRL1 (test truck centered in lane)
DP6TWD
DP7TEDDP3TWD
DP4TED
Time (sec)
Stre
ss (k
si)

Field Testing of the Orthotropic Deck on the Bronx-Whitestone Bridge FINAL REPORT
21
Figure 5.8 – Stress time-history for four strain gages on the top surface of the deck plate
at the diaphragm for test BW_CRL5 (test truck against barrier)
Figure 5.9 – Stress time-history for four strain gages on the top surface of the deck plate
at the diaphragm for test BW_CRL6 (test truck against left edge of lane)
DP6TWD
DP7TED DP3TWD
DP4TED
Time (sec)
Stre
ss (k
si)
DP6TWD
DP3TWD
DP4TED
Time (sec)
Stre
ss (k
si)

Field Testing of the Orthotropic Deck on the Bronx-Whitestone Bridge FINAL REPORT
22
5.2 Response of Longitudinal Ribs The longitudinal ribs were not sensitive to the transverse position of the test truck.
This is due to the fact that the bottom flange of the rib is not directly subjected to wheel loads (unlike the deck plate). Figure 5.10 shows the stress time-history plot for the four strain gages installed on Ribs 3 and 6. It can be seen that the response of R3LP and R6LP are very similar in magnitude and shape. The same can be said of strain gages R3LN and R6LN. Note that R3LP and R6LP (located at the built-up diaphragm) are dominated by tension response indicating positive bending. Peak tension occurs when the axles cross over the built-up diaphragm.
Strain gages R3LN and R6LN (located at Floorbeam 88) are dominated by compression response indicating negative bending. However, peak compression occurs when the axle groups are away from the floorbeam. When the axles pass directly above the floorbeam, tension stresses are induced at these locations.
Figure 5.10 – Stress time-history for four strain gages on Ribs 3 and 6 at the floorbeam (denoted by “N”) and at the diaphragm (denoted by “P”) with test truck centered in lane
R3LP
R6LP
R3LN R6LN
Time (sec)
Stre
ss (k
si)

Field Testing of the Orthotropic Deck on the Bronx-Whitestone Bridge FINAL REPORT
23
5.3 Deck Plate Displacement The relative vertical displacement between the deck plate and the rib wall was
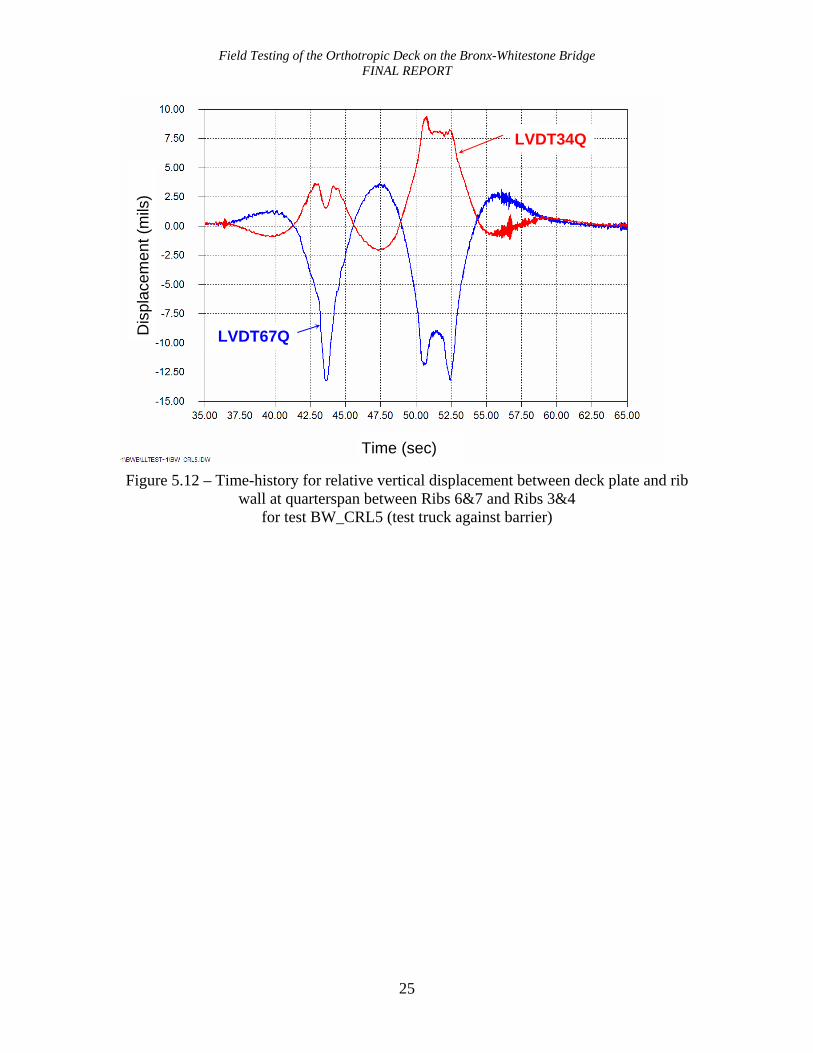
measured between Ribs 6 and 7 (LVDT67Q), as well as between Ribs 3 and 4 (LVDT34Q). Both measurements were made at quarterspan between Floorbeam 88 and the built-up diaphragm. Figure 5.11, Figure 5.12, and Figure 5.13 show the displacement time histories with the test truck in the center, right side, and left side of the lane, respectively. Note that all displacements are in mils (or 1/1000 inches) and that positive displacements are downward.
As indicated in the plots, the transverse position of the test truck has a major influence on the displacement response. A peak downward displacement of just under 20 mils was observed in both sensors with the test truck centered in the lane (Figure 5.11). However, with the test truck shifted to the right, an upward displacement of 13 mils was measured between Ribs 6 and 7, and a downward displacement of 8 mils was measured between Ribs 3 and 4 (Figure 5.12).
It is important to note that displacement data is meant to qualitatively characterize the behavior of the deck plate. Direct conversion between displacements and stresses is a very complex problem. This is due to the fact that the bending of the deck plate is a three dimensional problem. The behavior cannot be idealized using a simple beam model. Furthermore, quantifying the loading is very difficult. Both the tire pressure distribution and the exact location of the tire load patch are unknown.
The displacement data confirms the behavior of the deck plate. When peak compression stresses are measured on the underside of the deck, the deck plate deflects downward between ribs. It is evident from the displacement data that as the load moves away from the instrumented location, the deck plate deflects upwards before settling back to its undeformed position.

Field Testing of the Orthotropic Deck on the Bronx-Whitestone Bridge FINAL REPORT
24
Figure 5.11 – Time-history for relative vertical displacement between deck plate and rib
wall at quarterspan between Ribs 6&7 and Ribs 3&4 for test BW_CRL1 (test truck centered in lane)
LVDT34Q
LVDT67Q
Time (sec)
Dis
plac
emen
t (m
ils)
Field Testing of the Orthotropic Deck on the Bronx-Whitestone Bridge FINAL REPORT
25
Figure 5.12 – Time-history for relative vertical displacement between deck plate and rib
wall at quarterspan between Ribs 6&7 and Ribs 3&4 for test BW_CRL5 (test truck against barrier)
LVDT34Q
LVDT67Q
Time (sec)
Dis
plac
emen
t (m
ils)

Field Testing of the Orthotropic Deck on the Bronx-Whitestone Bridge FINAL REPORT
26
Figure 5.13 – Time-history for relative vertical displacement between deck plate and rib
wall at quarterspan between Ribs 6&7 and Ribs 3&4 for test BW_CRL6 (test truck against left edge of lane)
LVDT34Q
LVDT67Q
Dis
plac
emen
t (m
ils)
Time (sec)

Field Testing of the Orthotropic Deck on the Bronx-Whitestone Bridge FINAL REPORT
27
5.4 Peak Measured Stresses/Displacements The peak measured stresses are presented in Table 5.1. For each of the three tests
(BW_CRL1, BW_CRL5, and BW_CRL6), the maximum, minimum stress, and stress range (= maximum – minimum) are given. Stresses are given in ksi.
Table 5.2 contains a summary of the peak measured vertical displacements for the same three controlled-load tests. Displacements are the vertical displacement of the deck plate relative to the rib wall, and are given in mils with positive values representing downward deck displacements.
BW_CRL1 truck centered in
lane BW_CRL5
truck shifted right BW_CRL6
truck shifted left
σmax σmin SR σmax σmin SR σmax σmin SR
Strain Gage
(ksi) (ksi) (ksi) (ksi) (ksi) (ksi) (ksi) (ksi) (ksi)
DP7TED 0.2 -2.6 2.7 0.2 -0.8 1.0 - - -
DP6TWD 2.4 -2.0 4.3 4.5 -0.8 5.3 0.6 -0.3 0.9
DP4TED 4.5 -2.1 6.6 0.5 -0.2 0.8 4.0 -0.1 4.1
DP3TWD 0.3 -2.6 2.9 4.1 -2.4 6.5 0.2 -0.5 0.7
DP4TEQ 3.7 -0.8 4.4 1.8 -0.6 2.3 1.2 -0.2 1.4
DP3TWQ 6.7 -0.7 7.4 5.3 -0.9 6.2 0.9 -0.6 1.5
DP4BEQ 0.8 -5.3 6.1 0.4 -2.0 2.4 0.6 -1.2 1.8
DP3BWQ 1.2 -4.4 5.6 1.9 -4.1 6.0 0.8 -0.8 1.6
DP7BEQ 0.6 -5.0 5.6 0.4 -1.4 1.8 1.0 -3.4 4.4
DP6BWQ 1.5 -8.2 9.7 0.9 -5.1 6.0 0.2 -1.5 1.7
DP6BEQ 0.9 -3.5 4.4 1.3 -7.5 8.8 0.2 -0.7 0.8
DP4BWQ 1.1 -0.6 1.6 0.2 -0.3 0.5 1.7 -4.8 6.5
R6LP 3.3 -0.6 3.9 3.3 -0.7 4.1 3.8 -0.7 4.4
R3LP 2.9 -0.4 3.3 3.3 -1.0 4.3 2.3 -0.6 2.9
R6LN 0.6 -2.5 3.1 1.2 -2.4 3.6 0.4 -1.6 2.0
R3LN 0.8 -2.1 2.9 1.4 -2.9 4.3 0.4 -1.0 1.4
Table 5.1 – Summary of peak measured stresses (maximum = σmax; minimum= σmin; range = SR = σmax- σmin)
BW_CRL1
truck centered in lane BW_CRL5
truck shifted right BW_CRL6
truck shifted left Δmax Δmin ΔR Δmax Δmin ΔR Δmax Δmin ΔR
Displacement Sensor
(mils) (mils) (mils) (mils) (mils) (mils) (mils) (mils) (mils)
R6_7_Displ 19.5 -4.6 24.0 3.6 -13.2 16.9 6.7 -2.8 9.5
R3_4_Displ 18.5 -1.0 19.5 9.4 -2.1 11.5 4.1 -8.1 12.2
Table 5.2 – Summary of peak measured displacements (positive downward) (maximum = Δmax; minimum= Δmin; range = ΔR = Δmin= Δmin=)

Field Testing of the Orthotropic Deck on the Bronx-Whitestone Bridge FINAL REPORT
28
5.5 Dynamic Amplification Presented in Table 5.3 is a summary of the peak measured stresses (maximum,
minimum and range) recorded during test BW_DYN1. During this test, the test truck was traveling at normal traveling speed. Also shown in the Table are the ratio of dynamic stresses to static stress (recorded during test BW_CRL1, see Table 5.1). This ratio represents the dynamic amplification. It can be seen that there is a wide range of dynamic amplification. In fact, this ratio is often less than 1, and can be as high as 1.7. This variation is most likely the result of the high sensitivity of the deck plate to transverse truck position. With small changes is truck position, significant variations in stress can result.
BW_DYN1
truck centered in lane DYN/CRL
truck shifted right σmax σmin SR σmax,DYN σmin,DYN SR,DYN
Strain Gage
(ksi) (ksi) (ksi) σmax,CRL σmin,CRL SR,CRL DP7TED - - - - - -
DP6TWD 3.3 -1.9 5.2 1.4 0.9 1.2
DP4TED 1.5 -2.2 3.7 0.3 1.0 0.6
DP3TWD 0.3 -2.6 2.9 1.3 1.0 1.0
DP4TEQ 2.3 -1.3 3.6 0.6 1.7 0.8
DP3TWQ 5.7 -1.0 6.7 0.9 1.5 0.9
DP4BEQ 0.6 -2.8 3.5 0.8 0.5 0.6
DP3BWQ 1.6 -4.3 5.9 1.4 1.0 1.1
DP7BEQ 0.5 -3.8 4.3 0.9 0.8 0.8
DP6BWQ 1.2 -7.6 8.8 0.8 0.9 0.9
DP6BEQ 0.8 -4.1 4.8 0.8 1.2 1.1
DP4BWQ 0.4 -0.5 0.9 0.4 0.9 0.6
R6LP 3.4 -0.5 3.9 1.0 0.8 1.0
R3LP 3.1 -0.5 3.6 1.1 1.3 1.1
R6LN 0.8 -2.6 3.4 1.4 1.1 1.1
R3LN 0.8 -2.5 3.3 0.9 1.2 1.1
Table 5.3 – Summary of peak dynamic stresses (max, min, and range) measured during dynamic test BW_DYN1, and ratio of peak dynamic to peak static stresses
Field Testing of the Orthotropic Deck on the Bronx-Whitestone Bridge FINAL REPORT
29
6. Results of Long-term Monitoring This section of the report presents the results of the long-term monitoring phase of
this project. Long-term monitoring was conducted between July 13, 2007 and September 25, 2007. A total of 72 days of high-quality data were collected.
Stress time-history data were recorded from all gages. It should be noted that the topside deck plate gages all failed over time (though some lasted over one month). When predefined trigger values were exceeded in specified channels, continuous time-history data were recorded. These stress time-history data were used to verify large cycles in the stress-range histograms (often high stress cycles are the result of spurious signals such as noise spikes).
Stress-range histograms were developed continuously for all channels throughout the monitoring period. Every ten minutes, histograms were updated for each channel and written to a file. The rainflow cycle-counting algorithm was used to develop the stress-range histograms. For the fatigue evaluation, the stress-range histograms were truncated at a level equal to approximately 1/4 of the constant amplitude fatigue limit (CAFL) of the detail specified in AASHTO. That is, all cycles with stress ranges less than the truncation level were removed from the histogram prior to calculation of the effective stress. An in-depth discussion of the methodology used for the fatigue evaluation can be found in Appendix B.
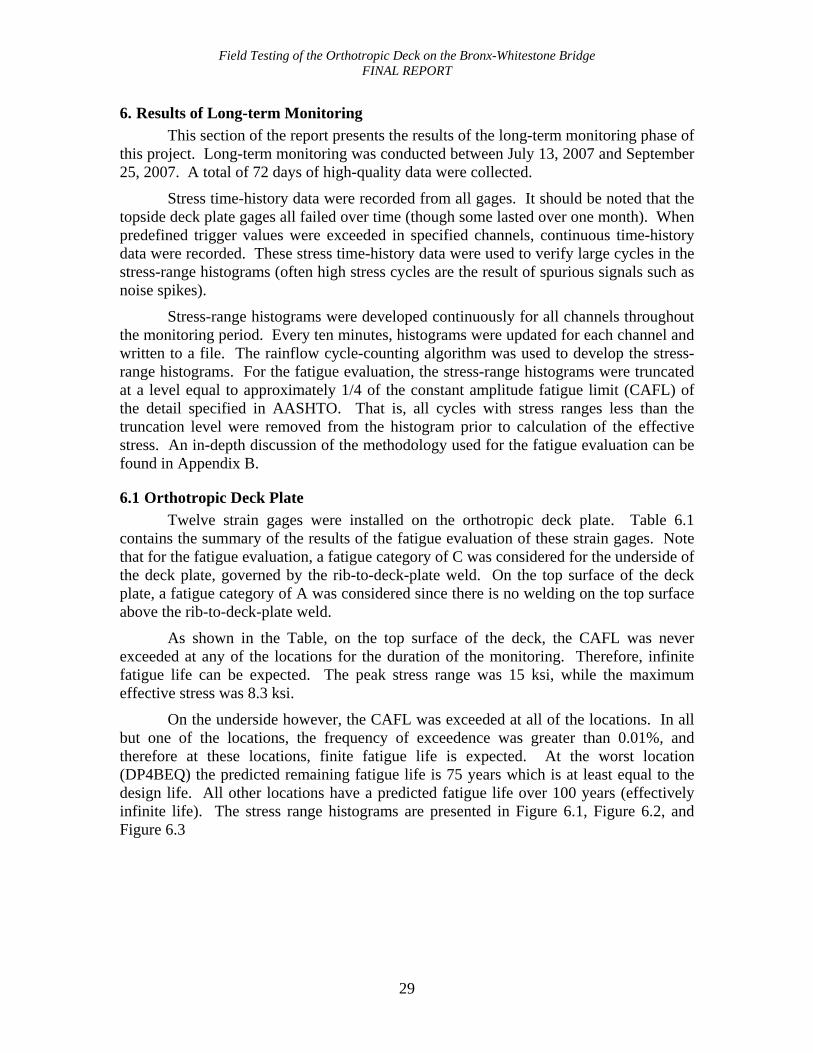
6.1 Orthotropic Deck Plate Twelve strain gages were installed on the orthotropic deck plate. Table 6.1
contains the summary of the results of the fatigue evaluation of these strain gages. Note that for the fatigue evaluation, a fatigue category of C was considered for the underside of the deck plate, governed by the rib-to-deck-plate weld. On the top surface of the deck plate, a fatigue category of A was considered since there is no welding on the top surface above the rib-to-deck-plate weld.
As shown in the Table, on the top surface of the deck, the CAFL was never exceeded at any of the locations for the duration of the monitoring. Therefore, infinite fatigue life can be expected. The peak stress range was 15 ksi, while the maximum effective stress was 8.3 ksi.
On the underside however, the CAFL was exceeded at all of the locations. In all but one of the locations, the frequency of exceedence was greater than 0.01%, and therefore at these locations, finite fatigue life is expected. At the worst location (DP4BEQ) the predicted remaining fatigue life is 75 years which is at least equal to the design life. All other locations have a predicted fatigue life over 100 years (effectively infinite life). The stress range histograms are presented in Figure 6.1, Figure 6.2, and Figure 6.3
Field Testing of the Orthotropic Deck on the Bronx-Whitestone Bridge FINAL REPORT
30
1
10
100
1,000
10,000
0.0-0.
5
1.0-1.
5
2.0-2.
5
3.0-3.
5
4.0-4.
5
5.0-5.
5
6.0-6.
5
7.0-7.
5
8.0-8.
5
9.0-9.
5
10.0-
10.5
11.0-
11.5
12.0-
12.5
13.0-
13.5
14.0-
14.5
15.0-
15.5
16.0-
16.5
17.0-
17.5
18.0-
18.5
19.0-
19.5
Stress Range (ksi)
Num
ber o
f Cyc
les
DP7TEDDP6TWDDP4TEDDP3TWD
Note: DP7TED, DP4TED, and DP3TWD scaled up to match 37 day time period of DP6TWD.
Figure 6.1 – Stress-range histogram for strain gages installed
on top surface of deck plate at built-up diaphragm

Field Testing of the Orthotropic Deck on the Bronx-Whitestone Bridge FINAL REPORT
31
1
10
100
1,000
0.0-0.
5
1.0-1.
5
2.0-2.
5
3.0-3.
5
4.0-4.
5
5.0-5.
5
6.0-6.
5
7.0-7.
5
8.0-8.
5
9.0-9.
5
10.0-
10.5
11.0-
11.5
12.0-
12.5
13.0-
13.5
14.0-
14.5
15.0-
15.5
16.0-
16.5
17.0-
17.5
18.0-
18.5
19.0-
19.5
Stress Range (ksi)
Num
ber o
f Cyc
les
DP4TEQDP3TWQ
Figure 6.2 – Stress-range histogram for strain gages installed
on top surface of deck plate at quarterspan

Field Testing of the Orthotropic Deck on the Bronx-Whitestone Bridge FINAL REPORT
32
1
10
100
1,000
10,000
100,000
0.0-0.
5
1.0-1.
5
2.0-2.
5
3.0-3.
5
4.0-4.
5
5.0-5.
5
6.0-6.
5
7.0-7.
5
8.0-8.
5
9.0-9.
5
10.0-
10.5
11.0-
11.5
12.0-
12.5
13.0-
13.5
14.0-
14.5
15.0-
15.5
16.0-
16.5
17.0-
17.5
18.0-
18.5
19.0-
19.5
Stress Range (ksi)
Num
ber o
f Cyc
les
DP7BEQDP6BWQDP6BEQDP4BWQDP4BEQDP3BWQ
Figure 6.3 – Stress-range histogram for strain gages installed
on underside of deck plate at quarterspan

Field Testing of the Orthotropic Deck on the Bronx-Whitestone Bridge FINAL REPORT
33
Cycles > CAFL Strain Gage Location Side Rib Location
in Span Detail
Category SReff (ksi)
SRmax (ksi)
Days Monitored # %
Cycles/ day
Estimated Remaining Life (years)
DP7TED 7 A 7.9 14.0 31.1 0 0.00% 276 infinite
DP6TWD 6 A 6.4 7.0 37.0 0 0.00% 1 infinite
DP4TED 4 A 8.3 15.0 10.9 0 0.00% 472 infinite
DP3TWD 3
Midspan (diaph)
A 7.4 9.5 10.8 0 0.00% 2 infinite
DP4TEQ 4 A 7.4 11.0 5.9 0 0.00% 86 infinite
DP3TWQ
Top
3 1/4 span
A 7.4 12.5 18.9 0 0.00% 83 infinite
DP7BEQ 7 C 4.2 12.5 72.0 40 0.05% 1,021 159
DP6BWQ 6 C 4.5 13.5 72.0 252 0.28% 1,273 104
DP6BEQ 6 C 3.5 10.5 72.0 1 0.01% 168 infinite
DP4BWQ 4 C 4.0 11.5 72.0 26 0.07% 542 356
DP4BEQ 4 C 4.7 14.5 72.0 474 0.43% 1,531 75
DP3BWQ
Deck Plate
Bottom
3
1/4 span
C 4.1 12.5 72.0 84 0.12% 1,006 173
Table 6.1 - Summary of fatigue evaluation for strain gages installed on orthotropic deck plate
Field Testing of the Orthotropic Deck on the Bronx-Whitestone Bridge FINAL REPORT
34
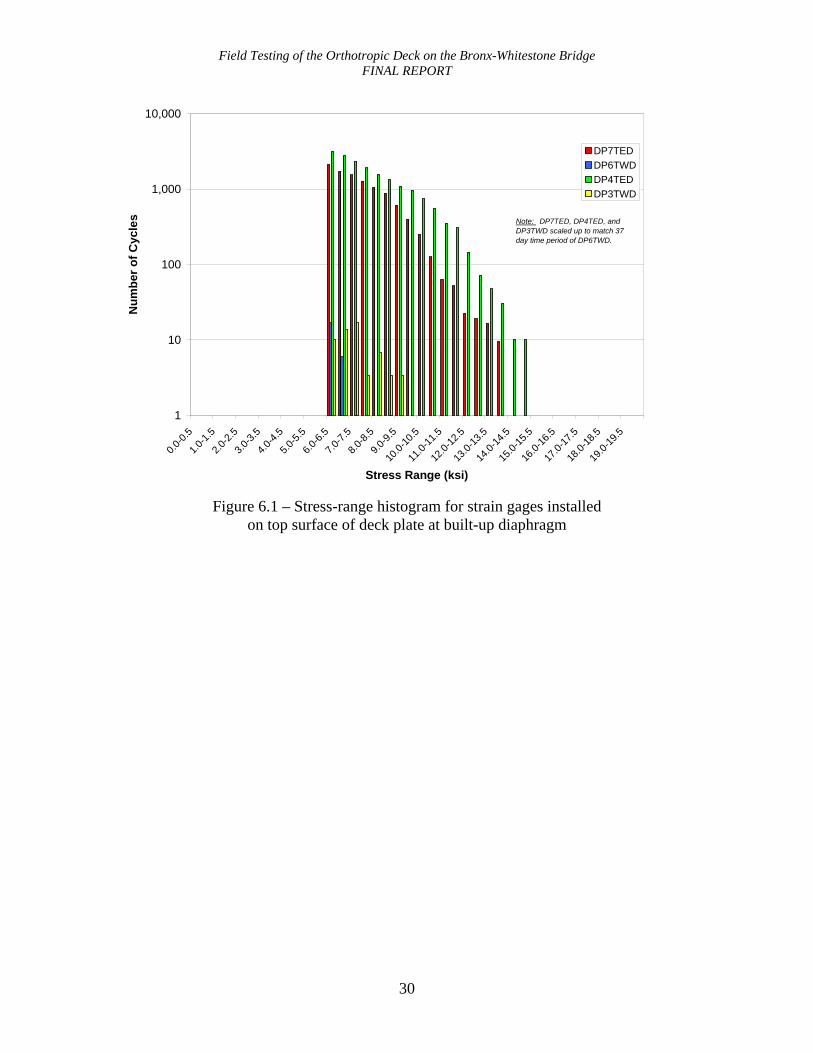
6.2 Orthotropic Ribs Six gages were installed on the orthotropic ribs: four under the northbound lanes
(Ribs 3 and 6); and two under the southbound lanes (Ribs 3 and 6). Table 6.2 contains the summary of the results of the fatigue evaluation of these strain gages. For these strain gages, a fatigue category of C was conservatively used (welding on the rib is on the rib walls for the diaphragm cutout, not on the bottom flange of the rib.
As shown in the Table, the CAFL was never exceeded. The maximum stress range was 9.0 ksi, and the maximum effective stress was 2.7 ksi. All locations are expected to exhibit infinite fatigue life. Figure 6.4 contains the stress range histograms for the six strain gages installed on the orthotropic ribs.
1
10
100
1,000
10,000
100,000
0.0-0.
5
0.5-1.
0
1.0-1.
5
1.5-2.
0
2.0-2.
5
2.5-3.
0
3.0-3.
5
3.5-4.
0
4.0-4.
5
4.5-5.
0
5.0-5.
5
5.5-6.
0
6.0-6.
5
6.5-7.
0
7.0-7.
5
7.5-8.
0
8.0-8.
5
8.5-9.
0
9.0-9.
5
9.5-10
.0
Stress Range (ksi)
Num
ber o
f Cyc
les
R3LPR6LPR3LNR6LNSB_R3LNSB_R6LN
Figure 6.4 Stress-range histogram for strain gages installed
on bottom flange of Ribs 3 and 6 at quarterspan and at built-up diaphragm

Field Testing of the Orthotropic Deck on the Bronx-Whitestone Bridge FINAL REPORT
35
Cycles > CAFL Strain Gage Location Side Rib Location
in Span Detail
Category SReff (ksi)
SRmax (ksi)
Days Monitored # %
Cycles/ day
Estimated Remaining Life (years)
R6LP NB Rib Bottom 6 Midspan (diaph) C 3.1 8.0 72.0 0 0.00% 304 infinite R3LP NB Rib Bottom 3 Midspan (diaph) C 2.9 7.5 72.0 0 0.00% 117 infinite R6LN NB Rib Bottom 6 Floorbeam C 3.0 6.5 72.0 0 0.00% 35 infinite R3LN NB Rib Bottom 3 Floorbeam C 3.0 9.0 72.0 0 0.00% 13 infinite
SB_R6LN SB Rib Bottom 6 Floorbeam C 3.1 6.0 72.0 0 0.00% 115 infinite SB_R3LN SB Rib Bottom 3 Floorbeam C 3.0 6.0 72.0 0 0.00% 33 infinite
Table 6.2 - Summary of fatigue evaluation for strain gages installed on ribs

Field Testing of the Orthotropic Deck on the Bronx-Whitestone Bridge FINAL REPORT
36
6.3 Comparison with 2002 Prototype Deck Panel Field Measurements In this section a comparison is made between the results presented above and the
long-term measurements obtained during the 2002 field study. As noted earlier, an extensive test program was undertaken on a prototype deck panel installed in the southbound side of the bridge near Floorbeam 63, within the main span of the bridge, north of midspan. A number of strain gages were monitored over an extended period of time, from February to June 2003.
There were four gages located at common locations between the two test programs. A summary of the fatigue life calculations for the two field studies is presented in Table 6.3. Note that since the Phase 1 and Phase 2 studies were conducted on the southbound and northbound sides of the bridge, respectively, the strain gage identifications shown in the table differ, i.e., “E” designations denoting “east” sides are changed to “W” designations denoting “west” sides. To use the table, strain gage number 1 in Phase 1 is compared to strain gage number 1 in Phase 2.
It can be seen in the table that there is relatively good correlation between the two phases of testing. In some cases, the stresses are higher in Phase 2 than Phase 1, exemplified by gage number 1 (DP3BE vs. DP3BWQ). The effective stress increased from 3.3 ksi to 4.1 ksi, and the maximum stress range increased from 10.5 ksi to 12.5 ksi. The number of cycles also increased from 589 to 1,006 cycles per day. This results in a finite-life prediction (173 years, or effectively infinite) at this location. During Phase 1, this location was expected to have infinite life.
However, at other locations, the stresses remained relatively constant or less. As an example, consider strain gage number 3, where the effective stress remained nearly constant (4.1 ksi vs. 4.2 ksi), but the maximum stress range decreased from 13.5 ksi to 12.5 ksi. The number of cycles also decreased from 1,208 cycles to 1,021 cycles. Infinite fatigue life is predicted for these gages using data from both phases of testing.
Test Series No. Strain
Gage SReff (ksi)
SRmax (ksi) Cycles/Day
Estimated Remaining
Life 1 DP3BE 3.3 10.5 589 infinite 2 DP6BW 3.1 9.5 72 infinite 3 DP7BW 4.1 13.5 1,208 145
Phase 1 (2002)
4 R6LP 2.9 8.5 542 infinite
1 DP3BWQ 4.1 12.5 1,006 173 2 DP6BEQ 3.5 10.5 168 infinite 3 DP7BEQ 4.2 12.5 1,021 159
Phase 2 (2007)
4 R6LP 3.1 8.0 304 infinite
Table 6.3 – Comparison of the fatigue-life estimates for strain gages common to both the 2002 and 2007 field studies

Field Testing of the Orthotropic Deck on the Bronx-Whitestone Bridge FINAL REPORT
37
7. References
1 Tsakopoulos, P.A., and Fisher, John W., “Fatigue Resistance Investigation for the Orthotropic Deck on the Bronx-Whitestone Bridge,” ATLSS report 02-05, 2002.
2 Connor, Robert J., and Fisher, John W., “Results of Field Measurements Made on the Prototype Orthotropic Deck on the Bronx-Whitestone Bridge,” ATLSS report 04-03, 2004.

APPENDIX A
Instrumentation Plans


APPENDIX B
Development of Stress-range Histograms used to Calculate Fatigue Damage

Field Testing of the Orthotropic Deck on the Bronx-Whitestone Bridge FINAL REPORT
B-2
B.1 Stress-Range Histograms The stress-range histogram data collected during the uncontrolled monitoring
permitted the development of a random variable-amplitude stress-range spectrum for the selected strain gages. It has been shown that a variable-amplitude stress-range spectrum can be represented by an equivalent constant-amplitude stress range equal to the cube root of the mean cube (rmc) of all stress ranges (i.e., Miner’s rule) [1] (i.e., Sreff = [ΣαiSri
3]1/3). During the long-term monitoring program, stress-range histograms were
developed using the rainflow cycle counting method [2]. Although several other methods have been developed to convert a random-amplitude stress-range response into a stress-range histogram, the rainflow cycle counting method is widely used and accepted for use in most structures. During the long-term monitoring program, the rainflow analysis algorithm was programmed to ignore any stress range less than 0.50 ksi (18με). Hence, the “raw” histograms do not include these very small cycles. Such small cycles do not contribute to the overall fatigue damage of even the worst details and if included, can actually unconservatively skew the results, as will be discussed below. It is also worth mentioning, that in some testing environments, the validity of stress-range cycles less than this are often questionable due to electromechanical noise.
The rainflow cycle counting method considers a fixed period (10 minutes was used for this project) of time-history data (i.e., stress versus time). First, the tensile and compressive peaks are determined. Then the peaks are paired up to determine the number and magnitude of stress range cycles which are totaled to form a stress-range histogram for that particular period of time. This process is repeated for the next segment of time. The histograms are summed in order to develop a cumulative stress-range histogram. It should be noted that since the peaks are paired up within a block of time (e.g., 10 min.), one stress cycle may not necessarily be the result of one vehicle. For instance if one truck causes tensile stress in a detail while crossing in the southbound lane, and a similar truck causes compressive stress at the same detail while crossing in the northbound lane (both crossings occur within the same 10 minute block of time), the stress range would be the peak-to-peak stress caused by the two trucks (assuming no other vehicles cross the bridge in this time period).
The effective stress range presented for each channel in the body of the report was calculated by ignoring all stress-range cycles obtained from the stress-range histograms that were less than predetermined limits. (It should be noted that the limit described here should not be confused with the limit described above. The limit above (i.e., 0.50 ksi (18με)) refers to the threshold of the smallest amplitude cycle that was counted by the algorithm and not related to the cycles that were counted, but later ignored, to ensure an accurate fatigue life estimate, as will be discussed.) For all welded steel details, a cut-off or threshold is appropriate and necessary, as will be discussed. The limits were typically about ¼ the constant amplitude fatigue limit for the respective detail. For example, for strain gages installed at details that are characterized as category C, with a CAFL of 10.0 ksi, the cutoff was set at 2.5 ksi. Hence, stress range cycles less than 2.5 ksi were ignored in the preparation of the stress-range histograms used to calculate the effective stress range and the number of cycles accumulated. The threshold was selected for two reasons.

Field Testing of the Orthotropic Deck on the Bronx-Whitestone Bridge FINAL REPORT
B-3
Previous research has demonstrated that stress ranges less than about ¼ the CAFL have little effect on the cumulative damage at the detail [3]. It has also been demonstrated that as the number of random variable cycles of lower stress range levels are considered, the predicted cumulative damage provided by the calculated effective stress range becomes asymptotic to the applicable S-N curve. A similar approach of truncating cycles of low stress range is accepted by researchers and specifications throughout the world [4].
Figure B.1 – Effect of truncating cycles at different stress range cut off levels (Typical data from a stain gage at a fatigue sensitive detail)
Figure B.1, shows the effect on the calculated effective stress range for several levels of truncation using typical field acquired long-term monitoring data collected from strain gage installed on a bridge. The data presented in Figure B.1 are also listed in Table B.1 showing the selected truncation level and its impact on the effective stress range.
As demonstrated by Figure B.1, as the truncation level decreases (from the lowest level), the effective stress range and corresponding number of cycles approaches the slope of the S-N curve for Category C, which is also plotted in Figure B.1 (i.e., a slope of –3 on a log-log plot). As long as the cut off level selected is consistent with the slope of the fatigue resistance curve, considering additional stress cycles at lower truncation levels does not improve the damage assessment and can therefore be ignored. As can be seen, using a truncation level as high as 10 ksi, the curve is nearly asymptotic to the slope of the S-N curves. Hence, an accurate prediction of the total fatigue life results.
1.00
10.00
100.00
1.0E+00 1.0E+01 1.0E+02 1.0E+03 1.0E+04 1.0E+05 1.0E+06 1.0E+07
# Cycles (N)
Sref
f (ks
i)
Typ. Data
CURVE IS APPROACHING THE SLOPE OF THE S-N CURVES
Curve for Cat. C
Cycles <5.75 ksi Ignored
Cycles <10.75 ksi Ignored

Field Testing of the Orthotropic Deck on the Bronx-Whitestone Bridge FINAL REPORT
B-4
It should also be noted that the load spectrum assumed in the AASHTO LRFD specifications for design was developed by only considering vehicles greater than about 20 kips [5]. Thus the AASHTO LRFD design also implicitly truncates and ignores stress cycles generated by lighter vehicles and vibration [6]. The observed frequency of stress cycles obtained from traffic counts is also consistent with the frequency of vehicles measured.

Field Testing of the Orthotropic Deck on the Bronx-Whitestone Bridge FINAL REPORT
B-5
Cut Off (ksi)
Number Cycles > Cut Off Value
Sreff (ksi)
0.75 575,867 3.3 2.75 117,869 5.5 4.75 37,842 7.6 6.75 15,112 9.6 8.75 6,547 11.5 10.75 2,938 13.3 12.75 1,284 15.1 14.75 509 17.0 16.75 191 19.3 18.75 85 21.3 20.75 45 22.6 22.75 22 23.9 24.75 6 25.1 25.75 2 25.7
Table B.1 – Calculated effective stress ranges using different stress range cut off levels
Only every other data shown in Figure B.1 is shown for brevity
The maximum stress ranges listed in the tables developed in the body of this report were determined from the rainflow count. According to rainflow cycle counting procedures, the peak and valley that comprise the maximum stress range may not be the result of a single loading event and may in fact occur hours apart. In other words, an individual truck did not necessarily generate the maximum stress range shown in the tables. This is particularly true of distortion induced stresses that are subjected to reversals in stress due to eccentricity of the loading. In many cases, it was possible to identify this maximum stress range with a specific vehicle passage, but in other cases, the maximum rainflow stress range exceeded the maximum stress range from any individual vehicle. During the remote long-term monitoring program, the stress-range histograms were updated every ten minutes. Hence, the longest interval between nonconsecutive peaks and valleys is ten minutes.

Field Testing of the Orthotropic Deck on the Bronx-Whitestone Bridge FINAL REPORT
B-6
B.2 Frequency of Exceedence of the CAFL Based on experimental data, it has been found that when cycles in the variable
amplitude spectrum exceed the CAFL often enough, then all stress cycles experienced by the structure can be considered to be damage-causing. This frequency of exceedence limit ranges between 0.01% and 0.05%. This corresponds to an occurrence of 1 in 10,000 or 1 in 2,000.
Research indicates that if this frequency limit is not exceeded, then it is reasonable to conclude that fatigue cracking would not be expected and infinite life can be assumed. However, if the limit is exceeded, the potential for fatigue cracking of the member exists and the fatigue life can be estimated by extending the given S-N curve. Obviously, this extension will only be required if the effective stress range (SReff) is less than the CAFL of the detail.
It should be noted that the limits are somewhat different for different details and the experimental data are limited. It is perhaps overly conservative to set the limit at 0.01% one for all details when conducting a fatigue evaluation. (This is not an issue in the design of new structures.) However, some owners may feel that 0.05% is too liberal and that a more conservative approach is best. Therefore, for the purposes of this study, a limit of 0.01% has been used.

Field Testing of the Orthotropic Deck on the Bronx-Whitestone Bridge FINAL REPORT
B-7
References:
1. Miner, M.A., Cumulative Damage in Fatigue, Journal of Applied Mechanics, Vol. 1, No.1, Sept., 1945.
2. Downing S.D., Socie D.F., Simple Rainflow Counting Algorithms, International Journal of Fatigue, January 1982.
3. Fisher, J.W., Nussbaumer, A., Keating, P.B., and Yen, B.T., Resistance of Welded Details Under Variable Amplitude Long-Life Fatigue Loading, NCHRP Report 354, National Cooperative Highway Research Program, Washington, DC, 1993.
4. Steel Structures – Material and Design, Draft International Standard, International Organization for Standardization, 1994.
5. Schilling, C.G., Variable Amplitude Load Fatigue, Task A - Literature Review: Volume I - Traffic Loading and Bridge Response, Publication No. FHWA-RD-87-059, Federal Highway Administration, Washington, DC, July 1990.
6. Moses, F., Schilling, C.G., Raju, K.S., Fatigue Evaluation Procedures for Steel Bridges, NCHRP Report 299, National Cooperative Highway Research Program, Washington, DC, 1987.