field test for estimating service life of corrugated metal
TRANSCRIPT

Field Test for Estimating Service Life of Corrugated Metal Pipe Culverts
J . L . B E A T O N A N D R . F . S T R A T F U L L ,
Respectively, Supervising Highway Engineer and Corrosion Engineer, Materials and Research Department, California Division of Highways
In 1959 the California Division of Highways reported on findings of a corrosion survey of 7,000 corrugated metal culverts located in one area of California. Based on those data supplemented by additional information collected during statewide investigations, a survey technique has been developed to estimate the corrosion potential of proposed culvert sites.
The results of the 1959 study indicated that the corrosion rate of metal culverts was a variable depending on the environment, with certain factors exerting greater influence than others. I t was therefore considered worthwhile to attempt to determine the relative influence of the individual factors that comprise the corrosion environments.
By utilizing the information from the first study and supplementing it with data from different types of watersheds located in various parts of the State, it has been observed that the major factors influencing the corrosion rate are the hydrogen ion concentration (pH) and the electrical resistivity of the soil and waters. A standard test method has been developed and is reported in detail. I t is relatively simple to perform, taking about 5 min for water and not more than 20 min for soils. As a check on the test method, it has been found to correlate with the published corrosion rates of metal pipe reported by the National Bureau of Standards in its nationwide studies.
• MANY TYPES of materials have met by either material, the choice be-been used for the small structures tween the two types of culvert pipe needed to carry water beneath high- usually depends on one of three fac-ways. Wood, brick, stone, glazed and tors: (a) the character and stability unglazed clay pipe, cast iron, and of the underlying foundation mate-steel have all been used as pipe ma- rial, (b) the effect of loading (either terials for well over a century. In from high embankments or from recent years the majority of the pipe traffic under shallow earth cover), culverts under roads have been of and (c) an estimate of the annual either reinforced concrete or corru- cost (1). Insofar as hydrologic, foun-gated metal. The corrugated metal is dation, and embankment data are zinc-coated iron or steel. concerned, means are available (1)
I f the hydrologic and special re- to determine such information to quirements of a specific site can be whatever degree might be considered
255

256 M A T E R I A L S A N D C O N S T R U C T I O N
necessary for the particular installation. However, up to the present time, the only way an accurate estimate of the annual cost could be made was to compare the past service records of the two types of pipe materials in the same watershed and apply this information to current prices. In new locations or where watershed land use has been changed, such comparisons are not usually available.
The effects of an aggressive (i.e., acid, sulfate, sea water, etc.) environment on concrete and reinforcing steel have been reported in the literature. Although an annual cost is still difficult to develop for reinforced concrete pipe, sufficient information is available to determine its suitability for a particular location providing the chemical environment is known. In broad terms this also has been the case when considering corrugated metal pipe. However, it has not been possible to predict the years of service life of a zinc-coated steel corrugated metal pipe in any specific site. This report describes a test procedure used by the California Division of Highways to predetermine the corrosion rate (and thus the annual cost) of corrugated metal culverts.
This study is the result of a series of investigations performed during the past 35 years by the Materials and Research Department of the California Division of Highways during which time more than 12,000 corrugated metal highway culvert pipes have been evaluated throughout the State highway system.
D E V E L O P M E N T O P T E S T M E T H O D
Life of Metal Culverts Corrugated metal pipes used by the
State of California conform to AASHO Specification M36. All pipes in this study conformed in general to this specification with the minor
changes made during the past 40 to 50 years.
Considering the various climates and geographic features found in California, it is not surprising that figures purporting to show the average life of metal culverts are of little use to a designer dealing with individual installations inasmuch as the service life of metal culverts depends on their locations.
The best criterion for estimating the service life of metal culverts is considered to be the proven tenure of an existing pipe in the same location as the proposed facility; that is, using existing culverts for estimating the economic life of a proposed metal pipe. All others are a compromised estimate, the accuracy of which depends on the experience and judgment of the engineer.
Although the past history of a culvert in a particular location is considered to be the best criterion for estimating future life, this method of analysis is not infallible. Experience has shown that the use of the land in a watershed may be altered; e.g., from a timber or brush land to an agricultural use. In such a case, the previous service life of the culverts may not reflect the future corrosion rate of the pipes. I t is also true that any other corrosion test method or other means for estimating culvert life would be subject to the same error due to a possible change in the culvert environment.
There is also speculation as to whether several culverts that would be repeatedly placed at the same site would have the same service life. The corrosion rate of steel is difficult to reproduce even in the same environment. This fact is brought out by Romanoff (2, p. 18) who gives reasons that steel specimens buried in one end of a trench might corrode at a somewhat different rate from those at the other end. The National Bureau of Standards stated concern-
B E A T O N A N D S T R A T F U L L : M E T A L C U L V E R T S 257
ing the reason for dispersion of corrosion rate data found in its testing program, "The lack of reproducibility of results is common to all corrosion tests, particularly to non-laboratory tests." Because an existing metal culvert can be considered as a test site when its corrosion rate is determined, the corrosion rate of an existing pipe consequently may or may not be duplicated by a subsequent installation. Therefore, it appears that the life of existing metal culverts may be a general indication whose reliability depends on the number of inspected culverts that are exposed to the same environment. Also, an example of the performance of a single culvert installation may not accurately represent the corrosion rate of a number of culverts in the same general area of environment.
Corrosion Theory I t is generally accepted that the
corrosion of steel is electrochemical in nature; that is, there is an electrolyte and a flow of electricity accompanying the corrosion or conversion of the metal to its oxide or to its most stable compound in the particular environment. Even though the theory of corrosion is well established, the variables that influence the rate of corrosion are so numerous that the corrosion rate of metals is generally established by an environmental test rather than from a calculation based on a corrosion theory.
The basic cause of corrosion of metal culverts is moisture; however, the presence of moisture does not necessarily mean that the corrosion rate will be rapid. The rate of corrosion depends not only on the frequency of the wetting of the metal but also on the formation of corrosion-inhibiting films and by the types and quantities of aggressive salts that are contained in the waters.
In an unreported study made in
1925 of 5,000 metal culverts throughout California, it was found that when the average annual rainfall increased from 10 to 80 in. per yr, the average life of metal culverts appeared to decrease by about 65 percent. One result was the suggestion that the magnitude of annual rainfall could be used to predict corrosion rate. However, it was also observed that in areas of equal rainfall there were extreme differences in rates of corrosion of individual culverts. It was apparent that factors other than the relative amount of rainfall were involved in the corrosion rate of the pipes.
In a 1955 study of 7,000 metal culverts in the northwestern section of California (3), it was observed that when a certain type of soil bacteria appeared to be present at a culvert location, the corrosion rate of the culvert was rapid. The apparent presence of these bacteria {Sporovibrio desulfuricans) were assumed to be indicated by the observation of hydrogen sulfide gas in the soil. However, among other variables, the propagation of these bacteria required that the soil be relatively flooded with moisture so as to restrict the ingress of air. I t became apparent that the presence of these anaerobic bacteria was limited to areas of high rainfall or ponded water conditions and was of minor importance in many geographic areas of the State.
Corrosive Factors
Numerous factors could influence the corrosion rate of metal culverts. If all the elements that could influence corrosion were investigated, the investigation would be prolonged for several years. Rather than investigate all possibilities, only those factors that a search of the literature indicated to be of the greatest probable influence were recorded and analyzed for their relative contribution

258 M A T E R I A L S A N D C O N S T R U C T I O N
to the observed corrosion rates of metal culverts:
1. The presence of flowing water; 2. Average annual rainfall; 3. Probable presence of bacteria
(3); 4. pH or hydrogen ion concentra
tion; 5. Minimum resistivity of soil; 6. Sulfate (SO4) concentration; 7. Total alkalinity as CaCOa; 8. Dissolved solids; and 9. Total calcium as CaCOg. By means of mathematical and
graphical analyses i t was determined that all of the considered factors had an influence on the corrosion rate of metal culverts. However, it was also observed that the influences of most of these elements were isolated to certain geographic areas. Some of these factors were combined by means of the Langelier (4) and also the Ryznar (5) indices and compared to the corrosion rate of the culverts.
As such, all the considered factors were not found usable as a general and economical test procedure. The exceptions were the pH or hydrogen ion concentration, the electrical resistivity of the soil or water, and the indirect effect of rainfall on these two variables.
Influence of Salts There are numerous salts in soils
or water which affect the corrosion rate of culverts. For instance, it is well known that the salts in sea water will cause the rapid corrosion of steel. Also, the salts in "alkali" soils, effluents from mines and numerous other sources have been observed to be highly corrosive to iron and steels.
When corrosive salts are present, other conditions being equal, the corrosion of steel will generally vary as their concentration (1, 6). Up to certain limits, the greater the concentration of salts, the more rapid the corrosion rate (7).
5.000
1,000
E o E o
I >. 500
\ \ \
\ N \ \
\ N \ N
\ N \ \ \
V
\ XPi ^̂ '-̂ \ \ \
\ \
\ Xv \
\ \ N ^
100 1,000 10,000
Chemica l Concentrotion In S o i l - P a r t s per Mi l l ion
100,000
Figure 1. Salts in a soil va minimum soil resistivity. Curves developed from analysis of soils found in Colorado Desert, Calif., and are not necessarily representative of soils
found in other California areas.

B E A T O N A N D S T R A T F U L L : M E T A L C U L V E R T S 259
With other factors equal, an increasing quantity of salts will result in the lowering of the specific electrical resistance of a soil or water. Figure 1 shows the relationship between the natural variations in the concentrations of salts in a particular soil series compared to its measured minimum soil resistivity. The salt-resistivity relationship represents a specific geographic area of about 1,000 sq mi near the Salton Sea. This relationship of the data is not necessarily applicable to other areas, as the proportions and the presence of the particular salts have been found to vary throughout the State.
Figure 2 shows that the electrical resistivity of a soil influences the corrosion rate of metal highway culverts. The service life of metal culverts is less in a soil of low electrical resistivity than in soils of higher values. This correlation of corrosion rate and electrical resistivity compares with the general observations of other investigators in the field of the underground corrosion of pipe lines (8, 9, 10).
Influence of Electrical Resistivity
Numerous methods for measuring the electrical resistivity of a soil or water are described by Romanoff (2).
The method employed in this investigation for measuring the electrical resistivity of a soil is a derivation of one described by the U. S. Department of Agriculture {11). In its test method, a Wheatstone bridge and a "Bureau of Soils" soil cup were utilized to measure the resistivity of a water-saturated soil at a corrected temperature of 60 F.
In duplicating the "Bureau" test method, it was found that the water saturation point of some soils would lead to disagreement as to when the saturation point occurred. As a result, the method for measuring the resistivity of soils was investigated
1,000
- I
Figure 2. Resistivity vs sei-vice life of 16-gage CMP. To maintain but one variable, pH limited between 8.0 and 8.5; annual rainfall limited to less than 5 in. per year.
to determine a standard means for testing.
Figure 3 shows the measured resistivity of soils will decrease with continued additions of distilled water to a minimum value—a characteristic of all soils. With the addition of more water, the soil solution with its contained salts becomes diluted in respect to free ions and the resistivity increases. In this test method, the soil resistivity value that is utilized is the minimum value obtainable.
Normally the minimum resistivity of a soil does not duplicate what

260 50,000
10,000
M A T E R I A L S A N D C O N S T R U C T I O N
2 X o I
>
5,000
1,000
V) 111 500
100 9 0
1
\1 \ \1 \
\ \
•—•—' \ \
\ J {-A
\ \ —A - -—A - -
- ~ i 50 100 500
% M O I S T U R E - D R Y W E I G H T
LOOO SPOO 10,000
Figure 3. Moisture content vs resistivity of soils.
might be measured under field conditions, as the moisture content of the soil is a controlling factor. The moisture content of an in-situ soil could be a variable depending on the time of year and the rainfall. As all tested soils were found to have a minimum resistivity at the optimum moisture content, it is considered that this value is a common denominator and is a basic characteristic of soils.
It was observed that the soil resistivity values seem to be related to their hydrologic location. In areas of high rainfall, the soil resistivity was high; conversely, it was low in areas of meager rainfall.
As indicated by this relationship between soil resistivity and the average annual rainfall (Fig. 4), the presence of soluble salts in surface soils appears to be primarily controlled by the average annual rainfall.
Influence of Soil pH When other factors are equal, the
pH or hydrogen ion concentration has been found to be an indication of corrosive soils or waters (10, 12). Normally, as the pH of the solution increases, the corrosion rate of steel decreases. A pH of less than 7.0 is an acidic condition, a pH of 7.0 is neutral, and a pH of greater than 7.0 is an alkaline solution.
In this study the pH values were determined by an electrometric method involving the simultaneous use of a glass and a calomel electrode.
The pH measurements of the soil solutions generally were obtained by mixing 1 part of soil to 1 part of distilled water by volume in a glass beaker or waxed paper cup. There is no absolute or consistent proportion of water or soil to be mixed for measuring the pH value. I t has been reported that ratios of 1 part soil to 5

B E A T O N A N D S T R A T F U L L : M E T A L C U L V E R T S 261
10,000
5.000
10 20 30 40 I A V E R A G E ANNUAL R A I N F A L L - I N C H E S
Figure 4. Soil resistivity vs average annual rainfall.
parts water have been used when the soil is high in organic content (2,11).
During this investigation, the pH of a soil appeared to vary according to the hydrologic area. In general, alkaline soils were found in areas of low rainfall, and acidic soils were found in areas of high rainfall. Figure 5 shows this trend of the variations of the average pH of surface soils and rainfall values. Also, all the soils located in areas of the same rainfall did not have the same pH or soluble salt content. This appears to be the result of the variation between drainage, vegetation, and the usage of soils in various locations. The measured soil pH is a value that
could be the result of the variables affecting the land in a particular location; the average annual rainfall is considered to be indicative of an expected over-all average condition.
The culvert corrosion rate data obtained during this study were analyzed to determine if there was a correlation between the average annual rainfall and the life of metal culverts. A direct correlation between rainfall and culvert life was not obtained; therefore, i t was concluded that the higher rainfalls serve to create the corrosion-causing environment rather than to establish the actual corrosion rate of culverts directly.

262 MATERIALS AND CONSTRUCTION
10 20 30 40
A V E R A G E A N N U A L R A I N F A L L - I N C H E S
Figure 5. pH vs average annual rainfall.
50
Derivation of Chart The three variables found to be pos
sible major indices of the corrosion rate of metal culverts were average annual rainfall, pH, and the electrical resistivity of the soil.
Initially a linear equation was evaluated by the method of least squares (13) to determine the relative influence of the three environmental variables on the performance of metal culverts. The resulting equation had a correlation coefficient of 0.219, which was indicative of a correlation at the 5 percent level of significance. However, when this linear equation for correlating the life of metal culverts to the considered variables was checked by computing the actual data in the equation, it was apparent that the relationships were not linear nor accurately expressed by the equation, except at the mean values.
Therefore, the data were arranged into graphs on which culvert life was plotted against rainfall, resistivity, and pH. Then the same environmental factors were plotted against one another to examine a number of
different relationships by trial and error.
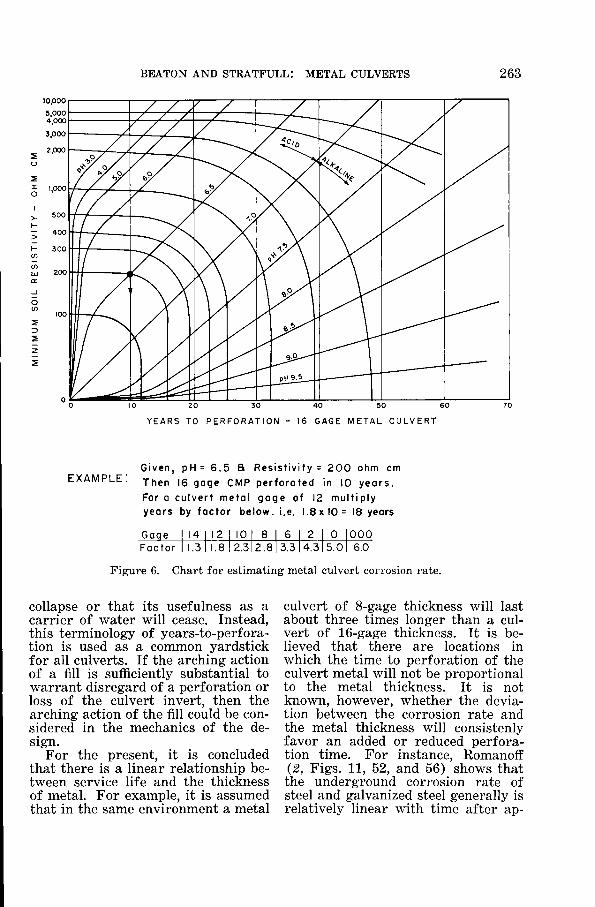
Figure 6 is a graphical solution of the data and represents the influence of the average pH and resistivity values that were measured at each culvert channel and then compared to the corrosion rate of the existing culverts. The degree of correlation between the mathematically computed theoretical life as determined from Figure 6 and the actual life of the inspected metal culverts was computed by the method of least squares. There was a correlation coefficient of 0.344, indicative of about 0.08 percent level of significance. The standard error of estimate of the theoretical life for culverts was found to deviate by 12 years of the actual service life. The investigation included culverts that were bituminous coated for corrosion protection; however, only those culverts without the coatings were analyzed in the original calculations.
The estimated years-to-perforation of a metal culvert (Fig. 6) does not necessarily mean that the culvert will
BEATON AND STRATFULL: METAL CULVERTS 263
5.000 4.000
3,000
2.000
1.000
20 30
Y E A R S TO P E R F O R A T I O N
40 50 60
16 G A G E M E T A L C U L V E R T
E X A M P L E : Given, pH = 6 . 5 a Res is t iv i ty = 2 0 0 ohm cm Then 16 gage CMP perforated in 10 y e a r s . For a culver t metal goge of 12 multiply years by factor below, i.e. 1.8x10= 18 yeors
Gage | I 4 | I 2 | I 0 [ 8 | 6 | 2 | 0 [ 0 0 0 F a c t o r i l .3 I 1.8 I 2 . 3 1 2 . 8 1 3.3 I 4 . 3 1 5.0 I 6.0
Figure 6. Chart for estimating metal culvert corrosion rate.
collapse or that its usefulness as a carrier of water will cease. Instead, this terminology of years-to-perfora-tion is used as a common yardstick for all culverts. I f the arching action of a fill is sufficiently substantial to warrant disregard of a perforation or loss of the culvert invert, then the arching action of the fill could be considered in the mechanics of the design.
For the present, it is concluded that there is a linear relationship between service life and the thickness of metal. For example, it is assumed that in the same environment a metal
culvert of 8-gage thickness will last about three times longer than a culvert of 16-gage thickness. It is believed that there are locations in which the time to perforation of the culvert metal will not be proportional to the metal thickness. I t is not known, however, whether the deviation between the corrosion rate and the metal thickness will consistenly favor an added or reduced perforation time. For instance, Romanoff (2, Figs. 11, 52, and 56) shows that the underground corrosion rate of steel and galvanized steel generally is relatively linear with time after ap-

264 MATERIALS AND CONSTRUCTION
proximately 2 years of exposure. In most of the soils, the corrosion rate reduces with time and is considered to be the result of the formation of a more or less protective rust or oxide coating on the surface of the metal.
In the case of highway culverts, there are numerous examples in which a corrosion-inhibiting film may not be substantial or remain on the metal surface that is in contact with a flow that carries abrasive particles. These particles can and do abrade the corrosion-inhibiting oxide film from the surface of the metal.
Inasmuch as Figure 6 is based on the data from culverts that have been in service from 10 to 40 years, the average effect of abrasion on the corrosion rate of the culverts is considered to be included in the chart. Because the effect of the thickness of the culvert metal on the corrosion rate is still open to speculation, the direct ratio method may be the most reasonable assumption for the present time.
Bituminous Coating The theoretical life of plain, gal
vanized culverts and the estimated service life for bituminous-coated pipes in the same locations was statistically analyzed to determine whether the life attributed to the coated pipes would affect the theoretical value. The results of the statistical analysis for the 68 asphalt-coated pipes resulted in a correlation coefficient of 0.324, which is indicative of about 0.08 percent level of significance. The standard error of estimate of the theoretical from the actual data was found to deviate by 14.5 years. This analysis indicated a greater deviation between the theoretical and the actual life of the bituminous-coated culverts than was found for galvanzied culverts. I t appeared that the coating definitely increased the life of culverts.
Because the average life of the plain, galvanized culverts was found to be about 6 years less than the life of the bituminous-coated pipes, it was decided to determine statistically whether the average difference in life as indicated by the two sets of calculations could be the result of chance.
The statistical i-test demonstrated that there was a difference in the average life of the coated and un-coated pipes at the 2 percent significance level, indicating that the difference was not likely to be due to a chance sampling. Therefore, the over-all gain in service life of galvanized pipe in California is about 6 years. This difference is significant, but it should not be assumed that the service life of all pipes will be extended 6 years by the coating as a highly abrasive flow could remove the coating during one period of flow. Conversely, it has been observed that in the desert areas of infrequent flow, the coating could increase culvert life by at least 20 years. (The asphalt coating referred to in this study was in place on old existing pipes and was an uncontrolled commercial type of dip. The presently specified bituminous coating and lining material is superior and should result in a greater increase in l ife).
OPERATIONAL TEST PROCEDURE
Two environmental factors are combined for estimating the service life of metal culverts. These environmental factors are the hydrogen ion concentration (pH) and the electrical resistivity of the site and backfill materials. The hydrogen ion concentration (pH) of the soils and waters indicates the degree of acidity or alkalinity, and the resistivity measurements indicate the relative quantity of soluble salts. The probable service life of a metal culvert in a given location is estimated by using the chart in Figure 6.
This information, combined with

BEATON AND STRATFULL: METAL CULVERTS 265
observations of existing culverts, i f any, provides a basis for (a) estimating the service life of galvanized metal culverts and (b) estimating the additional life obtained by coating the culverts to reduce the corrosion rate. The test method is divided into five steps:
1. Field resistivity survey and sampling for corrosion tests,
2. Preliminary field determination of pH of water samples,
3. Determination of pH of soils, 4. Laboratory determination of
minimum resistivity, and 5. Estimation of service life of
metal culverts from test data.
Field Resistivity Survey and Sampling for Corrosion Tests
The field resistivity test is an indication of the soluble salts in the soil or water and is used primarily as a guide for selecting samples that will be further tested in the laboratory to obtain data for estimating the service life of culverts. The natural soil in each channel or culvert location and the structural backfill material are tested by a portable earth resistivity meter, and samples are selected on the basis of these tests.
A. Apparatus 1. Portable earth resistivity
meter, suitable for rapid in-place determinations of soil resistivity.
2. Field probe. 3. Steel starting rod, for mak
ing hole (in hard ground) for inserting probe.
4. Sledge hammer (4 lb). B. Materials
Distilled, de-ionized or other clean waters that measure greater than 20,000 ohm cm.
C. Recording Data Record test data in a field notebook for use in selecting samples
and also for use as needed in analyzing laboratory test data.
D. Test Procedure 1. In the channel of a proposed
culvert site, insert the field probe into the soil for a depth between 6 and 12 in. and measure resistivity. Remove the field probe and pour about 2 oz of clean water into the hole.
2. Re-insert the probe, while twisting to mix the water and soil, then measure the resistivity. Follow manufacturer's instructions for correct use of meter.
3. Withdraw the field probe and add an additional 2 oz of clean water.
4. Re-insert the probe and again measure the resistivity of the soil.
5. Record the lowest of the readings as the field resistivity of the soil.
E. Selection of Soil Samples for Laboratory Tests
1. Make sufficient resistivity determinations at various locations in the channel or culvert site area to represent adequately the entire area.
2. I f the resistivity is reasonably uniform within the limits of the project, three soil samples from different culvert locations will be sufficient. If , however, some locations show resistivities that differ significantly from the average of the determinations for the area being surveyed, additional soil samples should be taken to represent these locations—particularly those with resistivities significantly below the average.
For example, if the soil resistivities throughout the surveyed area are all at or near an average value of 2,000 ohm cm, three samples will

266 MATERIALS AND CONSTRUCTION
be enough. I f any of the locations tested have resistivities markedly below this average (for example, 800 ohm cm) then these "hot spots" should definitely be represented by additional samples. Scattered locations of higher resistivity (for example, 3,000 ohm cm or more) do not necessarily require additional samples.
Judgment must be exercised both in the field testing and sampling and in evaluating the laboratory tests. In all cases, do not take less than 3 samples.
F. Precautions In field testing and sampling, follow very carefully the test method instructions and also the manufacturer's instructions for use of meters.
Notes.—If the minimum resistivity of a soil is determined to be less than 3,000 ohm cm in the laboratory, a representative sample weighing at least 2 lb which passes the No. 8 sieve will be needed for a sulfate (SO4) analysis. This should be taken into account in field sampling and is to be used for evaluating the effect of the environment on the stability of normal concrete.
B. Recording Data Record test data in a field notebook.
C. Method of Sampling 1. Dip the wide-mouth con
tainer into the water to be tested. Swirl to rinse and pour out contents to avoid contamination from container.
2. Dip into the water again for obtaining a sample.
3. Pour off any film that is on the surface of the sample before testing.
D. Standardizing pH Meter Follow the instructions provided with the type of pH meter being used.
E. Use of pH Meter to Determine pH of Water
Follow the instructions provided with the type of pH meter being used.
F. Precautions Follow the manufacturer's instructions for use of the meter and observe the usual precautions for making chemical tests.
Notes.—pH readings may be taken at any period other than flood flow. All waters having a pH of less than 6 should be sampled for further analysis, in 1-qt bottles.
Preliminary Field Determination of pH of Water Samples
This method is suitable for use in the field or laboratory for determining the pH of water samples.
A. Apparatus and Materials 1. Two ounce or larger wide-
mouth container, e.g., glass jar, beaker, or dry wax paper cup.
2. pH meter, suitable for either field or laboratory testing.
3. pH standard solution of pH 7.
Method of Determining pH of Soils
This method is suitable for use in determining the pH of soil samples.
A. Apparatus and Materials 1. Paper cups, 2 oz, wax-coated
type. 2. Teaspoon or small metal
scoop. 3. Wash bottle containing dis
tilled water. 4. pH meter suitable for field
or laboratory testing. 5. pH standard solution of pH 7.

BEATON AND STRATFULL: METAL CULVERTS 267
B. Recording Data Record data in a field notebook.
C. Preparation of Test Specimens 1. Place 2 rounded teaspoons of
the soil to be tested into a 2-oz paper cup.
2. Add about two teaspoons of distilled water to the sample in the cup.
3. Disperse soil in water by stirring. The specimen is now ready for testing.
D. Standardization of pH Meter Follow the instructions provided with the pH meter.
E. Use of pH Meter to Determine pH of Soil
Follow the instructions provided with the pH meter.
F. Precautions Carefully follow the above procedure and the manufacturer's instructions. I f the pH reading is unstable when the electrode is immersed in the soil slurry, leave the electrode immersed until the pH reading has stabilized. In some cases this waiting period for the stabilization of the pH reading may take 5 min.
Laboratory Determination of Minimum Resistivity
This method covers the procedure for determining the minimum resistivity of soil or water samples selected as indicated previously. These resistivity values are used in estimating culvert life as described subsequently.
A. Apparatus 1. Resistivity instrument suit
able for laboratory testing. 2. Soil box calibrated for use
with resistivity meter (See Fig. 7 for details).
3. No. 8 sieve. 4. Round tin pans, 12-in. diam
eter and 2 in. deep. 5. 200 F oven.
20 Go. Stainless Steel Electrodes
... TOP VIEW
FRONT VIEW
M o l t r i o l - • P l o j i i c
B o t t o m - r PC. 6 ^ . 4 - ^ > y
Ends — 2 P c » . 4 ^ 1 X ^
Sides — 2 Pes. 6 " » \ ^ « ^
E l t c t r o d t s — 2 Pes. 2 0 Go. Stointess Steel 6 " » 1^
2 Ed. No. a - 3 2 i j R o u n d Head Stoinless S Icc I
IMdctiins Screw Wit t i Rubber Wosher a s ta in less
Steel Wosher a N u t .
Figure 7. Soil box for laboratory resistivity determination.
6. One balance, 5 kg capacity, accurate to 10 g.
B. Materials Distilled or de-ionized water.
C. Recording Data Record data in notebook.
D. Preparation of Soil Samples After thoroughly mixing sample, screen i t through a No. 8 sieve. I f the sample is too moist to be sieved, it may be dried and crushed. Do not crush rocks. Only the natural material that passes the No. 8 sieve is to be used for the test.
E. Measuring Resistivity of Soil Sample
1. Quarter or split out about 1,300 g of the passing No. 8 material.
2. I f the sample was dried, add about 150 g of distilled water to the 1,300 g of soil and mix thoroughly.

268 MATERIALS AND CONSTRUCTION
3. After the soil sample is thoroughly mixed, place and compact it (moderate compaction with the fingers is sufficient) in the soil box.
4. Measure the resistivity of the soil in accordance with the instructions furnished with the meter.
5. Remove the soil from the soil box, add about 100 more grams of distilled water and again mix thoroughly.
6. Again place and compact the soil in the soil box and measure its resistivity.
7. Repeat this procedure. 8. I f the resistivity of the soil
has not followed a trend of high resistivity, low resistivity, and then an increase in resistivity for the preceding additions of distilled water, continue to add water in about 50-g increments to the soil; mixing, placing, compacting, and measuring resistivity for each increment until the minimum resistivity is obtained.
9. I f the sample was not dried, begin the test procedure by adding 50 g of water in lieu of 150 g specified previously. Continue to add 50-g increments of water followed by mixing, placing, compacting, and measuring until a minimum value of resistivity is measured.
10. Record the test value that is the minimum value of soil resistivity at any moisture content.
F. Measuring Resistivity of a Water Sample
1. Thoroughly clean the soil box of all soil particles and rinse the soil box at least three times with distilled or de-ionized water.
2. Fill the soil box with distilled water and measure its resistivity.
3. I f the distilled water in the soil box measures infinite resistivity, empty the soil box of distilled water, fill with the test water, measure its resistivity, then record the measured value.
4. I f the distilled water in the soil box did not measure infinite resistivity, continue to rinse the box with distilled or de-ionized water until the box is thoroughly clean, which is indicated by an infinite resistivity measurement.
G. Recording Data Record data in notebook.
H. Precautions Follow the above instructions very carefully.
Estimating Service Life of Metal Culverts from Test Data
Using the minimum resistivity and the pH values of the soils or waters, obtained as described in Steps 2, 3, and 4 of this test method, determine the estimated service life (years to perforation) from Figure 6.
TEST CORRELATION
Operational Test Accuracy As previously pointed out, this in
vestigation indicated that the accuracy of the test method when compared to existing facilities is ± 12 years. Since the time of the original findings, the test method has been distributed to each of the eleven California Highway Districts and has been used on an operational basis for approximately two years. The District personnel have been given the responsibility of investigating all existing culverts on each section of highway that is to be realigned or reconstructed. Generally the age and

B E A T O N A N D S T R A T F U L L : M E T A L C U L V E R T S 269
S U M M A R Y O F T W O Y E A R S O F R O U T I N E O P E R A T I O N A L U S E O F T E S T R E S U L T S V S E X I S T I N G C U L V E R T C O N D I T I O N S ^
Exist . Culverts with Inspected Perforation Time in Excess of 50 Years ^
Exist ing Culverts with Inspected Perforation Time Less than 50 Years
Proj . Actual Service
All Culverts (yr)
No. of Insp. Culv.
Est . Time to Perf. by Test
(yr) No. of
Insp. Culv.
Average Time to Perf. by Culv. Insp.
(yr)
Est . Time to Perf. by Test
(yr)
1 10-20 7 60 4 25 20 2 12-30 9 60 5 40 40 3 30 2 60 4 33 7 60 5 20 3 85 6 30 16 20 7 11 4 40 8 20-40 12 60 1 40 45 9 12 1 25
10 23 27 60 11 36 6 40 12 20 2 35 13 25 4 30 86 14 20 6 16 20 15 30 3 46 45 16 37 8 35 8 40 35 17 35 2 50 18 28 10 25 30 19 6 4 10 20 20 30 4 70 21 15 7 46 22 38 1 20 4 40 35 23 30 1 13 24 25 8 40 35 25 20 3 40 40 26 20 5 45 1 20 15 27 9 2 60 28 1 20 25
84' 65* 88 3 30-' SO''
^ Culvert perforation time rounded off to nearest 6-yr increment of time. 2 Inspected condition of these culverts clearly indicated they would not be perforated by corrosion in
less than 60 yr of exposure. = Total.
Average.
condition of each pipe have been determined and the necessary tests performed so that a determination may be made in advance of a new project for preventing the accelerated corrosion of metal or the deterioration of concrete culverts, which is indicated by the pH and the sulfate (SO,) of the soils; or the feasibility of extending or replacing the existing pipes.
Table 1 gives the results of 28 highway project investigations by the District personnel. These investigations represent the studies of various sections of highways that are being considered for realignment and reconstruction. This table contains the results of a total of approximately 170 corrosion tests performed at the sites of the same number of inspected
pipes. The number of investigations given in the table does not represent the total number of projects or culverts that the Districts have investigated. Numerous projects have covered highways that were on such drastic realignment that the condition of existing culverts beneath nearby highways could be misleading, or were not representative of the environment in the new highway location. Therefore, in these cases the accuracy in the use of the test method could not be compared to the corrosion rate of an existing culvert.
Table 1 shows the culvert test favorably compares to the actual culvert corrosion rate observed in the field. For example, on the highway projects that were investigated by

270 MATERIALS AND CONSTRUCTION
the Districts, 84 inspected culverts had an estimated culvert perforation time that is in excess of 50 years. The culvert test method that was performed at these same culvert sites indicated an average perforation time of 55 years.
The reason that the culvert data were not projected beyond the 50-year period was that some of the culverts had an apparent life that bordered on infinity and so could not be used to obtain a mathematical average. For instance, some culverts that have been in place for 30 or 40 years still had the zinc coating intact and were anticipated to resist perforation by corrosion beyond any reasonable limit of calculated time.
At the 88 culvert installations inspected by District personnel and listed under the general heading of culverts with less than 50 years to perforation, the average perforation time of these culverts was estimated to be 30 years by inspection, and by the test method the average perforation time was also 30 years. Thus far, the test method appears to be a reasonable tool when in the hands of trained personnel.
Comparison to Work of Others Generally, i f a new test method can
be verified by means of independently acquired data, then it is considered that the significance of the test is increased. A search of the literature indicated that such culvert corrosion rate data are not available for comparison to this test method. Therefore, it was compared with results obtained by the National Bureau of Standards in its nationwide studies of underground corrosion. The culvert corrosion rate chart (Fig. 6) when converted to underground corrosion rates was found to have a high degree of correlation to the Bureau's data. Also, when this test method was compared to the reported data of seven different types of corrosion test
methods, it was observed that it was one of the more accurate means for determining relative soil corrosiv-ity i U ) .
Because of the indicated high degree of correlation of this test method to independently acquired data, a search of the literature was undertaken to determine the reason.
Romanoff {2, p. 14), in a discussion of the various corrosion tests and the factors considered to be a cause of corrosion, stated, "However, these factors are interrelated, and it is difficult to control conditions so that there is only one variable. In the absence of such control, the correlation may be difficult or indefinite, . . . ." As the corrosion test method described in this paper evaluates two variables (pH and resistivity), it is apparent that this is the circumstance that is responsible for its relatively high degree of correlation. Also, when additional variables are related to the corrosion phenomenon, there will be a substantial increase in the accuracy of this or any other test.
PINDINGS
1. The life of metal culverts is a variable depending primarily on the presence of moisture and the chemicals contained in the watershed.
2. The chemical environment of a specific culvert site is directly influenced by the soils, vegetation, rainfall, and drainage characteristics of the watershed; also by the frequency and the volume of the flow of water as well as the character of the culvert backfill soil used at the site. The chemical environment of a watershed directly affects the pH and electrical resistivity of a culvert site.
3. A relatively accurate estimate of the corrosion rate of galvanized metal pipe in a specific location can be made by using pH and resistivity values of the soils and the waters. The relationships are given in Figure 6.
4. A procedure for determining the

BEATON AND STRATFULL: METAL CULVERTS 271
pH and resistivity of a culvert site is outlined under Operational Test Procedure in this report.
5. Bituminous coatings were found on the average to add six years to the life of CMP culverts. However, this benefit cannot be indiscriminately applied as the actual added life varied from nearly zero in areas of continuous flow carrying heavy debris to over 20 yr in arid areas with infrequent runoff. The bituminous coatings covered in this study were of a lower quality than that presently used by California. It is too early to report on the effects of the new coating; however, its characteristics should result in a marked improvement over the old.
6. The usefulness of a bituminous coating lies in its ability to serve as a moisture barrier. Therefore, its protective life is limited in streams where it will be subjected to an abrasive flow that will result in the rapid removal of the coating from the culvert invert.
SUMMARY
Generally the estimation of culvert perforation time by using the test method when compared to field inspections of existing facilities has been remarkably close. Even so, it is considered that the culvert test method is a substitution, and at most a verification of the evaluation of an existing facility. I t should be relied on solely only when existing facilities are not available for inspection.
All the investigations by the California Division of Highways have shown that the perforation time of a zinc-coated corrugated steel culvert usually can be extended by means of a protective coating. The previous work has also shown that further study is required to determine how many additional years of protection will be gained by the various modern means of protecting metal pipe from corrosion.
This study has indicated that the bituminous coating of metal culverts will extend the perforation time of the culvert by approximately 6 yr when the pipe is subjected to a corrosive flow. I t is known that the bituminous coating will protect the metal from corrosion on the backfilled side of the pipe for more than 6 yr. I t has been assumed that the asphalt coating will protect the surface of the pipe that is in contact with the backfill soil for at least 20 yr. This is primarily speculation, but is also based on the observation of the condition of numerous coated pipes that have been removed after 20 to 30 yr of service.
The corrosion rate chart (Fig. 6) was derived from the comparison of the observed corrosion rate of existing galvanized corrugated metal culverts in California to the described environmental factors. As a result, Figure 6 is an average value of the effect of frequency of flow, abrasion, bacterial action, and other known and unknown variables on the perforation rate of the culvert wall.
As indicated by operational use of this culvert test method, inaccuracies can and do occur when culverts are subjected to greater than normal periods of water flow or excessive abrasion or lack of normal soil moisture. The degree of error in the test method when compared to the inspected life of such unusual installations is being studied and will be evaluated at a later date. Irrespective of these few exceptions it appears that the accuracy of the test method is sufficient to warrant its continued use. Discrepancies in its accuracy can be evaluated because there is now a means by which unusual circumstances can be recognized as such, and it is possible that they may be given a numerical value.
The use of the test method by the California Division of Highways when considered with proper hydraulic and foundation information

272 MATERIALS AND CONSTRUCTION
has placed the use and the method for protecting corrugated metal culverts on an engineering basis. Previously the judgment of the effect of the environment on corrosion was generally controlled by experience or prejudice or a combination of the two.
ACKNOWLEDGMENTS
This investigation, which resulted in the development of a test for estimating the corrosion rate of metal culverts, was conducted as one of the activities of the Materials and Research Department of the California Division of Highways.
The authors wish to express their appreciation to F. N. Hveem, Materials and Research Engineer, for his advice and direction during this study; also to the numerous personnel of the California Division of Highways and those of the Materials and Research Department who extended their aid and cooperation during this study.
REFERENCES
1. "California Culvert Practice." Division of Highways, Department of Public Works, State of California.
2. ROMANOFF, M. , "Underground Corrosion." Nat. Bureau of Standard, Circular 579 (April 1957).
3. BEATON, J . L . , AND STRATFULL, R. F., "Corrosion of Corrugated Metal Culverts in California." HRB Bull. 223, 1-13 (1959).
4. LANGELIER, W . F., "The Analytical Control of Anti-Corrosion Water Treatment." Jour. AWWA, 28:1500 (1936).
5. RYZNAR, J. W., "A New Index for Determining Amount of Calcium Carbonate Scale Formed by a Water." Jour. AWWA, 36: No. 4 (1944).
6. UHLIG, H . H . , "The Corrosion Handbook." J. Wiley (1948).
7. BORGMANN, C. W., Ind. Eng. Chem., 29:814 (1937).
8. McCoLLUM, BARTON, AND LOGAN, K. H., "Earth Resistance and Its Relation to Electrolysis of Underground Structures." Tech. Paper BST 26 (1915).
9. WATERS, F . 0., "Soil Resistivity Measurements for Corrosion Control." Corrosion, 8: No. 12 (1952).
10. W H I T M A N , W. , RUSSELL, R., AND ALTIERI, V . , Ind. Eng. Chem., 16:665 (1924).
11. "Soil Survey Manual." U . S. Dept. Agric. Handbook 18 (1951).
12. PUTMAN, J. F., "Soil Corrosion." Proc. Amer. Petroleum Inst., Production Bull. 216.
13. BROWNLEE, K . A . , "Industrial Experimentation." Chemical Publishing Co., Brooklyn (1949).
14. STRATFULL, R. F., "A New Test for Estimating Soil Corrosiv-ity Based on an Investigation of Highway Culverts in California." Corrosion, 17: No. 10 (1961).