field performance assessment of advanced grid support
TRANSCRIPT

FIELD PERFORMANCE ASSESSMENT OF ADVANCED GRID SUPPORT FUNCTIONS IMPLEMENTED VIA PLANT CONTROLLERSNational Grid Solar Phase II Program Report
May 2020
11176929

DISCLAIMER OF WARRANTIES AND LIMITATION OF LIABILITIES
THIS DOCUMENT WAS PREPARED BY THE ORGANIZATION(S) NAMED BELOW AS AN ACCOUNT OF WORK SPONSORED OR COSPONSORED BY THE
ELECTRIC POWER RESEARCH INSTITUTE, INC. (EPRI). NEITHER EPRI, ANY MEMBER OF EPRI, ANY COSPONSOR, THE ORGANIZATION(S) BELOW, NOR
ANY PERSON ACTING ON BEHALF OF ANY OF THEM:
(A) MAKES ANY WARRANTY OR REPRESENTATION WHATSOEVER, EXPRESS OR IMPLIED, (I) WITH RESPECT TO THE USE OF ANY INFORMATION, APPA-
RATUS, METHOD, PROCESS, OR SIMILAR ITEM DISCLOSED IN THIS DOCUMENT, INCLUDING MERCHANTABILITY AND FITNESS FOR A PARTICULAR
PURPOSE, OR (II) THAT SUCH USE DOES NOT INFRINGE ON OR INTERFERE WITH PRIVATELY OWNED RIGHTS, INCLUDING ANY PARTY’S INTELLECTUAL
PROPERTY, OR (III) THAT THIS DOCUMENT IS SUITABLE TO ANY PARTICULAR USER’S CIRCUMSTANCE; OR
(B) ASSUMES RESPONSIBILITY FOR ANY DAMAGES OR OTHER LIABILITY WHATSOEVER (INCLUDING ANY CONSEQUENTIAL DAMAGES, EVEN IF EPRI OR
ANY EPRI REPRESENTATIVE HAS BEEN ADVISED OF THE POSSIBILITY OF SUCH DAMAGES) RESULTING FROM YOUR SELECTION OR USE OF THIS DOCU-
MENT OR ANY INFORMATION, APPARATUS, METHOD, PROCESS, OR SIMILAR ITEM DISCLOSED IN THIS DOCUMENT.
REFERENCE HEREIN TO ANY SPECIFIC COMMERCIAL PRODUCT, PROCESS, OR SERVICE BY ITS TRADE NAME, TRADEMARK, MANUFACTURER, OR OTHER-
WISE, DOES NOT NECESSARILY CONSTITUTE OR IMPLY ITS ENDORSEMENT, RECOMMENDATION, OR FAVORING BY EPRI.
THE FOLLOWING ORGANIZATION(S), UNDER CONTRACT TO EPRI, PREPARED THIS REPORT:
THE ELECTRIC POWER RESEARCH INSTITUTE (EPRI) PREPARED THIS REPORT.
NOTE
For further information about EPRI, call the EPRI Customer Assistance Center at 800.313.3774 or e-mail [email protected].
Electric Power Research Institute, EPRI, and TOGETHER¼SHAPING THE FUTURE OF ELECTRICITY are registered service marks of the Elec-tric Power
Research Institute, Inc.
Copyright © 2020 Electric Power Research Institute, Inc. All rights reserved.
11176929

National Grid Solar Phase II Program Report 3 May 2020
Field Performance Assessment of Advanced Grid Support Functions Implemented via Plant Controllers
Key Findings• This project demonstrated successful implementation of
advanced grid-support functions of distributed energy re-sources (DERs) at the megawatt scale through a DER plant controller, which will enable larger-scale DER facilities to comply with IEEE 1547-2018 requirements.
• Fixed power factor, volt-var, and automatic voltage regula-tion (AVR) functions of DERs were implemented quite ac-curately by the plant controller at the five sites investigated in this project. When activated, these functions were able to bring the voltage closer to the target.
• Because DER plant controllers typically do not go through the same level of detailed certification testing as inverters, field verification of plants, especially during a commission-ing process, is critically important to identify any unwanted behavior like the voltage oscillations observed at two sites.
• Power quality meters with high data resolution are valuable for larger DER plants to capture any voltage and/or power quality issues, which may not be visible through revenue meters.
Table of Contents
Key Findings ....................................................................................... 3Introduction ........................................................................................ 3PV Plant Description ........................................................................... 4
PV Plants Selected for Testing ....................................................... 4Monitoring System......................................................................... 4Inverter Settings Options ............................................................... 6Plant Controller and IEEE 1547-2018 Requirement .................... 7
Test Methodology and Results .......................................................... 7Test Methodology .......................................................................... 7Power-Factor Function ................................................................... 8Volt-Var Function............................................................................ 9Automatic Voltage Regulation (AVR) Function ............................. 11Reactive Power Induced Oscillations ........................................... 12
Summary ............................................................................................ 13Acknowledgements ........................................................................... 13
1 https://www.seia.org/states-map.
IntroductionDeployment of inverter-based distributed energy resources (DERs) such as solar photovoltaics (PV) and energy storage (ES) in the distribution system is increasing rapidly. The addition of many DERs presents new challenges for distribution service providers in the form of changes in load shape, potential voltage violations, and reliability issues. One method to mitigate challenges to grid integration of proliferating DERs is effective utilization of smart inverters, which offer advanced grid-support capabilities like active and reactive power management to support voltage and frequency regulation, fault ride-through, and communication interoperabil-ity.
Massachusetts is a prime example of a U.S. state facing the chal-lenges of integrating DERs. As of Q4 2019, in terms of installed solar capacity, Massachusetts is number eight among the fifty states.1 With 2.77 GW installed capacity, 13.6% of the state’s electricity comes from solar. In recent years, Massachusetts has experienced a sharp increase in interconnection applications for DER plants between 1 and 5 MW. Figure 1 illustrates this increase by showing the cumulative number of applications for DER of this size.
A recent revision of DER interconnection standard IEEE 1547-2018 made grid-support capabilities mandatory for DER plants. Among other capabilities, reactive power control through power-fac-tor and volt-var functions for voltage regulation support is included in the standards. For larger-scale DER plants, especially those that are primarily designed for power generation, these control functions are required to be implemented at the DER plant aggregate level.
Figure 1. Cumulative Number of Applications for DER between 1 and 5 MW in Massachusetts
11176929
National Grid Solar Phase II Program Report 4 May 2020
Field Performance Assessment of Advanced Grid Support Functions Implemented via Plant Controllers
Although several successful field demonstrations of these func-tions at the inverter level have been carried out, not many examples exist for plant-level implementations. Successful implementation and field demonstration of voltage regulation support functions at the plant level through a plant controller are critical for wide-scale adoption of the new IEEE 1547-2018 standard.
In 2017, the Electric Power Research Institute (EPRI) and National Grid began a collaborative multi-year research project to investigate and demonstrate potential benefits of smart inverters in real-life PV plants connected to National Grid’s distribution system. These plants are installed and operated by National Grid as part of its Solar Phase II Program. Earlier work2 in this project focused on extensive modeling of existing circuits and the PV plants to identify the potential benefits of smart inverters in terms of improvement in hosting capacity. This work recommended power-factor and volt-var settings for each of the eighteen Solar Phase II PV sites and identi-fied two sites for monitoring and performance assessment. This white paper presents the results of the field-performance assessment and key findings from these selected sites.
PV Plant Description
PV Plants Selected for TestingNational Grid’s Solar Phase II Program includes eighteen solar PV sites ranging from 650 kW to 1,000kW. Each of these plants includes multiple smart inverters, which are managed by plant controllers installed at the sites. EPRI has studied these feeders to identify sites that benefit most, in terms of hosting capacity, from reactive power control by smart inverters. Based on these studies, five sites were chosen for field testing and detailed performance assessment:
• Kelly Road #1 and Kelly Road #2 (aggregated to “Kelly”)
• Blossom Road #1 and Blossom Road #2 (aggregated to “Blossom”)
• Groton Road
More details of the selected sites are shown in Table 1. An example satellite photo for the Kelly site is shown in Figure 2 on the fol-lowing page.
Monitoring SystemOn the high side of the distribution interconnection transformer for all sites, power quality (PQ) monitors were installed through appropriate potential transformers (PTs) and current transformers (CTs). These measure:
• Active power (per phase and total)
• Reactive power (per phase and total)
• Voltage (per phase and average)
• Current (per phase and total)
• Flicker (per phase)
SEL model 734P PQ monitors were used. The 734P allows for flicker measurements per the IEEE Standard 1454 and IEC 61000-4-15 flicker meter. For a PQ meter that complies with IEC 61000-4-30 Power Quality, it is necessary to use an SEL-735. Additionally, weather measurements—such as irradiance, temperature, humidity, and wind speed—are available for each of the sites.
Data from the inverters themselves allowed the research team to have access to both the low- and high-side voltage measure-ments. Data from individual inverters answered questions about what is happening in the aggregate. The monitoring and control architecture for this project is shown in Figure 3 on page 5. In this configuration, plant controllers implemented the voltage-
2 Recommended Smart Inverter Settings for Grid Support and Test Plan: Interim Report. EPRI, Palo Alto, CA: 2018. 3002012594.
Table 1. National Grid Solar Phase II Site Details
Site Name City/Town Feeder Number Rated kW at Unity PF Max Var Capability
Kelly Rd. 1 Sturbridge 413L2 1000 kW 600 kvar
Kelly Rd. 2 Sturbridge 413L2 1000 kW 600 kvar
Blossom Rd. 1 Fall River 115W52 1000 kW 600 kvar
Blossom Rd. 2 Fall River 115W52 1000 kW 600 kvar
Groton Rd. Ayer 227W3 1000 kW 600 kvar
11176929

National Grid Solar Phase II Program Report 5 May 2020
Field Performance Assessment of Advanced Grid Support Functions Implemented via Plant Controllers
Figure 2. Satellite Photo of Kelly PV Plant #1 and #2
Figure 3. Monitoring and Control Architecture
11176929

National Grid Solar Phase II Program Report 6 May 2020
Field Performance Assessment of Advanced Grid Support Functions Implemented via Plant Controllers
regulation support functions based on the low-side voltage of the corresponding interconnection transformers for the PV plants. If the point-of-common-coupling (PCC) is on the MV-side, then measurement from high-side of the transformer should be used by the plant controller.
Inverter Settings Options
Plant ControllerEach of the eighteen solar PV plants in National Grid’s Solar Phase II program is controlled via its dedicated plant controller, which manages a fleet of inverters within the plant to meet the interconnection requirements at the plant level. The plant control-ler manages the individual inverters by issuing constant reactive power commands with a time interval of 5 seconds to implement a target power-factor or volt-var setting at the PCC. A screenshot of the plant controller’s user interface is shown in Figure 4.
A PV plant is a complicated system with many control loops. The control loops internal to the inverter typically operate very fast (in
Figure 4. Screenshot of Plant Controller User Interface
millisecond to second range), while the response of the plant con-troller to grid voltage regulation can be relatively slow (in multiple seconds). This has the potential to cause voltage oscillation if the inverter and controller are not properly coordinated.
Available Grid Support FunctionsPower FactorThe plant controller measures the active power generated by the plant and commands the inverters to absorb or inject a propor-tional amount of reactive power to maintain the target constant power factor.
Volt-VarThe plant controller measures the voltage at the low-voltage side of the PV plant interconnection transformer and commands the inverters to absorb or inject an amount of reactive power as prescribed by the configured volt-var curve settings. In this mode, the plant controller reacts to the voltage measured with the cor-responding reactive power. This function is different from the voltage-regulation function described next, where the plant con-
11176929

National Grid Solar Phase II Program Report 7 May 2020
Field Performance Assessment of Advanced Grid Support Functions Implemented via Plant Controllers
troller actively increases or decreases the reactive power to move the voltage into a certain range.
Automatic Voltage RegulationIn this mode of control, the plant controller is configured to maintain voltage within a band around a target voltage. The plant controller measures the voltage at the low-voltage side of the PV plant and commands the inverters to inject or absorb reactive power. If the voltage does not move into the target voltage range, the plant controller commands the inverters to inject or absorb more reactive power until either the reactive power limit of the PV plant is met, or the voltage is within the target range. This is an advanced closed-loop control function that is not included in the IEEE 1547-2018 DER interconnection standard.
A summary of the functions is shown in Figure 5.
Plant Controller and IEEE 1547-2018 RequirementTypical PV volt-var control is used by measuring voltage at the terminals of the inverter and responding with reactive power accord-ing to the volt-var curve. However, according to the 2018 revision of the IEEE 1547 standard, larger-scale DER plants, which are primarily designed for power generation, are required to implement the voltage-regulation support functions like fixed power factor and volt-var at the PCC, which is different from the inverter terminals. Because individual inverters within the plant do not have visibility at the voltage and aggregate power generation at the PCC, a plant
controller is important for this type of generation facility. With the use of a plant controller, it is not necessary to rely only on the volt-age at the terminals of the inverter. Voltage can be regulated from any monitored point that communicates with the plant controller. In this project, volt-var and automatic voltage regulation functions are implemented by the plant controller based on the voltage mea-surement at the low side of the medium-voltage service transformer. Based on the voltage measurement and corresponding function setting, the plant controller issued the fixed-var command to the in-verters within the plant to obtain the required amount of aggregate reactive power at the measurement point.
Test Methodology and Results
Test MethodologyThe voltage at the PV plant is impacted by many factors, includ-ing substation busbar voltage, regulator settings, capacitor banks, conductor size, feeder loading, and DER generation. It is difficult to compare voltage from one day to the next, or even one hour to next, because of these disparate influences. To isolate and then evaluate the impact of advanced grid-support functions on feeder voltage, measurements were compared immediately before and after activation/deactivation of a particular function. With the assumption that other influential variables remained relatively constant for the brief period around the activation/deactivation of the grid-support function, this measurement method enabled an accurate evaluation of function’s impact.
Figure 5. Explanation of Different Reactive Power Functions
11176929
National Grid Solar Phase II Program Report 8 May 2020
Field Performance Assessment of Advanced Grid Support Functions Implemented via Plant Controllers
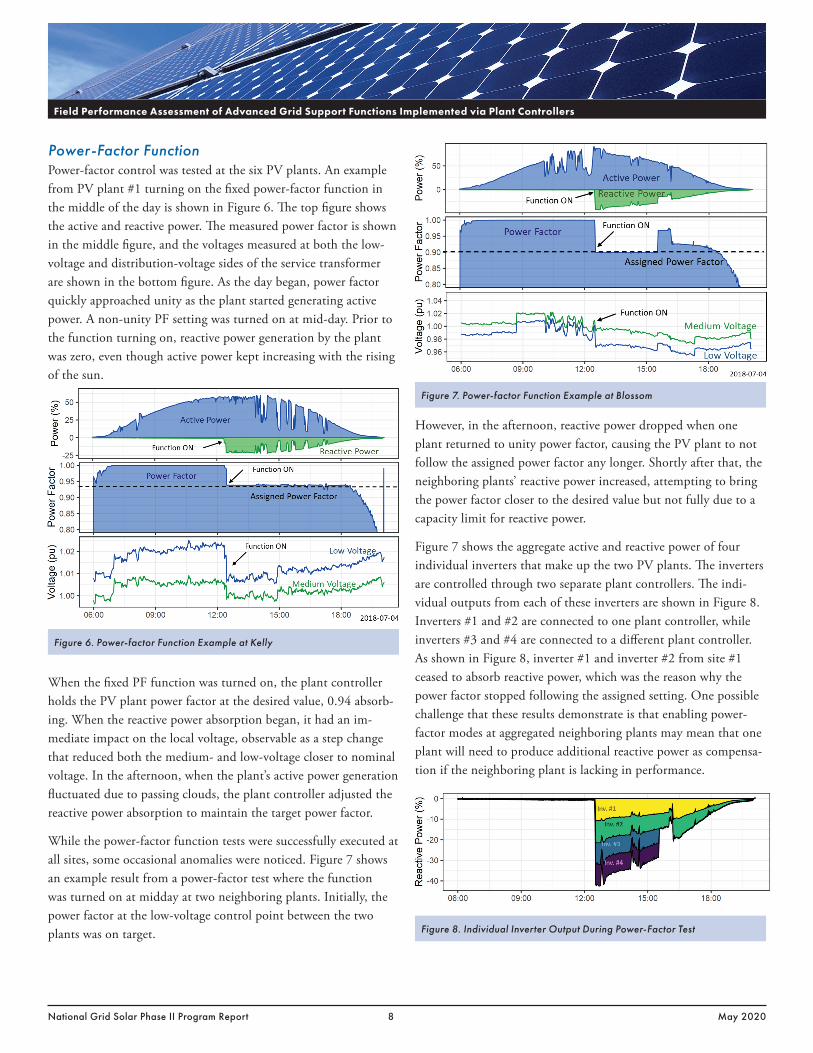
Power-Factor FunctionPower-factor control was tested at the six PV plants. An example from PV plant #1 turning on the fixed power-factor function in the middle of the day is shown in Figure 6. The top figure shows the active and reactive power. The measured power factor is shown in the middle figure, and the voltages measured at both the low-voltage and distribution-voltage sides of the service transformer are shown in the bottom figure. As the day began, power factor quickly approached unity as the plant started generating active power. A non-unity PF setting was turned on at mid-day. Prior to the function turning on, reactive power generation by the plant was zero, even though active power kept increasing with the rising of the sun.
When the fixed PF function was turned on, the plant controller holds the PV plant power factor at the desired value, 0.94 absorb-ing. When the reactive power absorption began, it had an im-mediate impact on the local voltage, observable as a step change that reduced both the medium- and low-voltage closer to nominal voltage. In the afternoon, when the plant’s active power generation fluctuated due to passing clouds, the plant controller adjusted the reactive power absorption to maintain the target power factor.
While the power-factor function tests were successfully executed at all sites, some occasional anomalies were noticed. Figure 7 shows an example result from a power-factor test where the function was turned on at midday at two neighboring plants. Initially, the power factor at the low-voltage control point between the two plants was on target.
However, in the afternoon, reactive power dropped when one plant returned to unity power factor, causing the PV plant to not follow the assigned power factor any longer. Shortly after that, the neighboring plants’ reactive power increased, attempting to bring the power factor closer to the desired value but not fully due to a capacity limit for reactive power.
Figure 7 shows the aggregate active and reactive power of four individual inverters that make up the two PV plants. The inverters are controlled through two separate plant controllers. The indi-vidual outputs from each of these inverters are shown in Figure 8. Inverters #1 and #2 are connected to one plant controller, while inverters #3 and #4 are connected to a different plant controller. As shown in Figure 8, inverter #1 and inverter #2 from site #1 ceased to absorb reactive power, which was the reason why the power factor stopped following the assigned setting. One possible challenge that these results demonstrate is that enabling power-factor modes at aggregated neighboring plants may mean that one plant will need to produce additional reactive power as compensa-tion if the neighboring plant is lacking in performance.
Figure 6. Power-factor Function Example at Kelly
Figure 8. Individual Inverter Output During Power-Factor Test
Figure 7. Power-factor Function Example at Blossom
11176929
National Grid Solar Phase II Program Report 9 May 2020
Field Performance Assessment of Advanced Grid Support Functions Implemented via Plant Controllers
transformer. Prior to the volt-var function turning on, the cloud-induced power variability caused voltage changes of over 1%. After the volt-var function was turned on, similar cloud-induced power variations resulted in voltage changes of less than 1%. Voltage vari-abilities due to a similar level of power fluctuations were reduced by 50% when volt-var function was active.
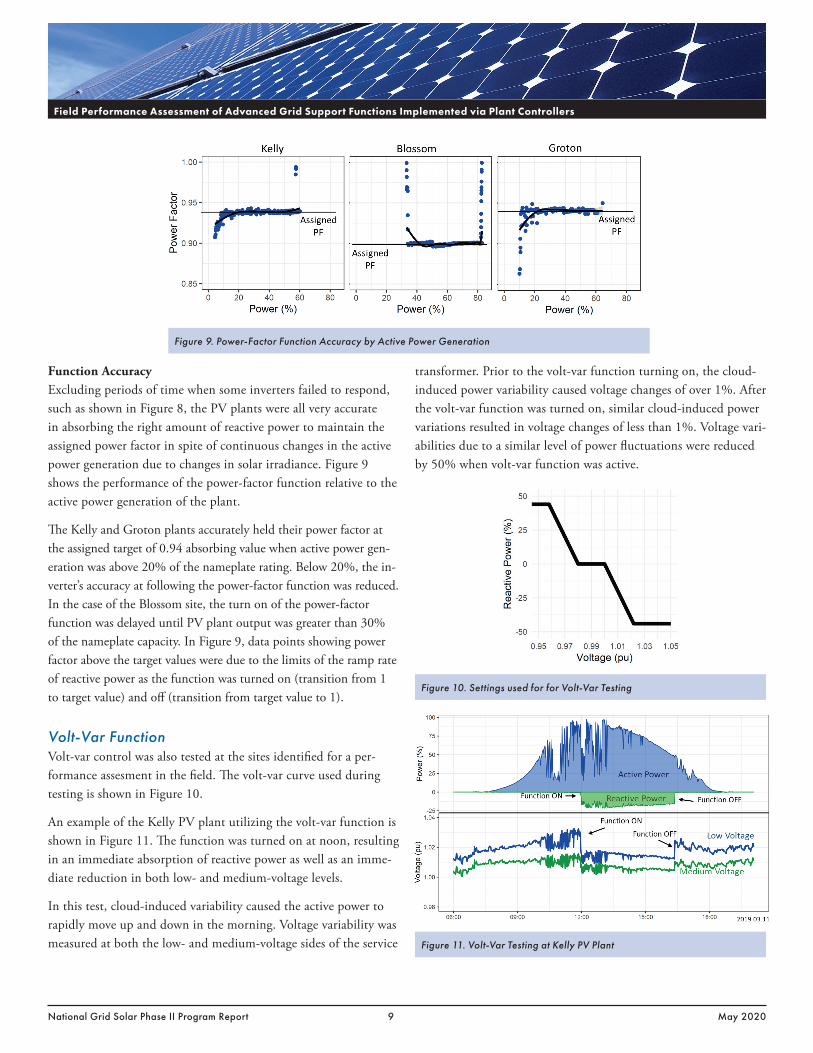
Function AccuracyExcluding periods of time when some inverters failed to respond, such as shown in Figure 8, the PV plants were all very accurate in absorbing the right amount of reactive power to maintain the assigned power factor in spite of continuous changes in the active power generation due to changes in solar irradiance. Figure 9 shows the performance of the power-factor function relative to the active power generation of the plant.
The Kelly and Groton plants accurately held their power factor at the assigned target of 0.94 absorbing value when active power gen-eration was above 20% of the nameplate rating. Below 20%, the in-verter’s accuracy at following the power-factor function was reduced. In the case of the Blossom site, the turn on of the power-factor function was delayed until PV plant output was greater than 30% of the nameplate capacity. In Figure 9, data points showing power factor above the target values were due to the limits of the ramp rate of reactive power as the function was turned on (transition from 1 to target value) and off (transition from target value to 1).
Volt-Var FunctionVolt-var control was also tested at the sites identified for a per-formance assesment in the field. The volt-var curve used during testing is shown in Figure 10.
An example of the Kelly PV plant utilizing the volt-var function is shown in Figure 11. The function was turned on at noon, resulting in an immediate absorption of reactive power as well as an imme-diate reduction in both low- and medium-voltage levels.
In this test, cloud-induced variability caused the active power to rapidly move up and down in the morning. Voltage variability was measured at both the low- and medium-voltage sides of the service
Figure 10. Settings used for for Volt-Var Testing
Figure 9. Power-Factor Function Accuracy by Active Power Generation
Figure 11. Volt-Var Testing at Kelly PV Plant
11176929

National Grid Solar Phase II Program Report 10 May 2020
Field Performance Assessment of Advanced Grid Support Functions Implemented via Plant Controllers
tion was turned on. Prior to the function turning on at these sites, PV generation caused voltage to rise and fall as sunlight increased or clouds passed by. The volt-var function reduced this change. At the Blossom site, the voltage was on the low side of the volt-var curve when the function was turned on. Hence the plant injected reactive power to boost the voltage when the function was turned on in the early morning. Once the plant started to generate more active power, which increased the voltage, reactive power injection from the plant was reduced.
Figure 13 shows the distribution of voltages for both medium and low voltages across all sites when the volt-var function was on and off. The height (y-axis) of the distribution represents how often the voltage was at a certain value, while the range of the distribu-
Function Impact on VoltageThe impact of the volt-var function on the time series voltage for the other sites that were tested is shown in Figure 12. For the Groton site, voltage began high, and the PV plants responded to the high voltage by absorbing reactive power to pull the voltage down. The Blossom site began with a low-voltage condition and responded by injecting reactive power to boost the voltage when the function was turned on.
In all cases, the volt-var function was effective at moving the volt-age either up or down, depending on the starting condition. The Kelly and Groton sites were on the high-voltage side of the volt-var curve when the function was turned on. Voltage was reduced, flattening the profile compared to the time period before the func-
Figure 13. Voltage Distribution with/without Volt-var
Figure 12. Voltage Impact of Volt-var Function during Volt-var Test
11176929

National Grid Solar Phase II Program Report 11 May 2020
Field Performance Assessment of Advanced Grid Support Functions Implemented via Plant Controllers
the target voltage was 1.0 pu, while the allowed range of voltages was 0.99–1.01 pu. This means that the plant controller iteratively increased or decreased the reactive power until the voltage was within the allowed range or until the maximum available reactive power was dispatched.
Typical volt-var control of a PV plant allows the inverter to react to a voltage with a certain amount of reactive power as determined by the volt-var curve. This is an open-loop technique that is not actively trying to push the voltage to a certain value by propor-tionally changing the reactive power, as is common in closed-loop control techniques.
An example of this function operating at the Kelly site is shown in Figure 15. A little before 9:00 am, the function was turned on. The PV plant responded by absorbing enough reactive power to pull the voltage down within the target range of voltages. As the
tion represents the range of voltages measured during the period when the function was either off or on. For all sites, the voltage range was reduced, and the average voltage was moved toward the center point on the volt-var curve. These observations indicate that the volt-var function reduced voltage variability and regulated it toward the nominal voltage.
Function AccuracyThe assigned volt-var curve and the measurement data from the sites are shown in Figure 14. All sites followed the volt-var curve well, including periods when the measured points were in the dead band or on the slope of the volt-var curve.
Automatic Voltage Regulation (AVR) FunctionThe option for the AVR function is provided by the plant control-lers. It behaves in a closed-loop fashion. That is, there is a target voltage and dead band (or allowed range of voltages). In this case,
Figure 14. Volt-var Function Accuracy
Figure 15. Example of Voltage Regulation at Kelly
11176929
National Grid Solar Phase II Program Report 12 May 2020
Field Performance Assessment of Advanced Grid Support Functions Implemented via Plant Controllers
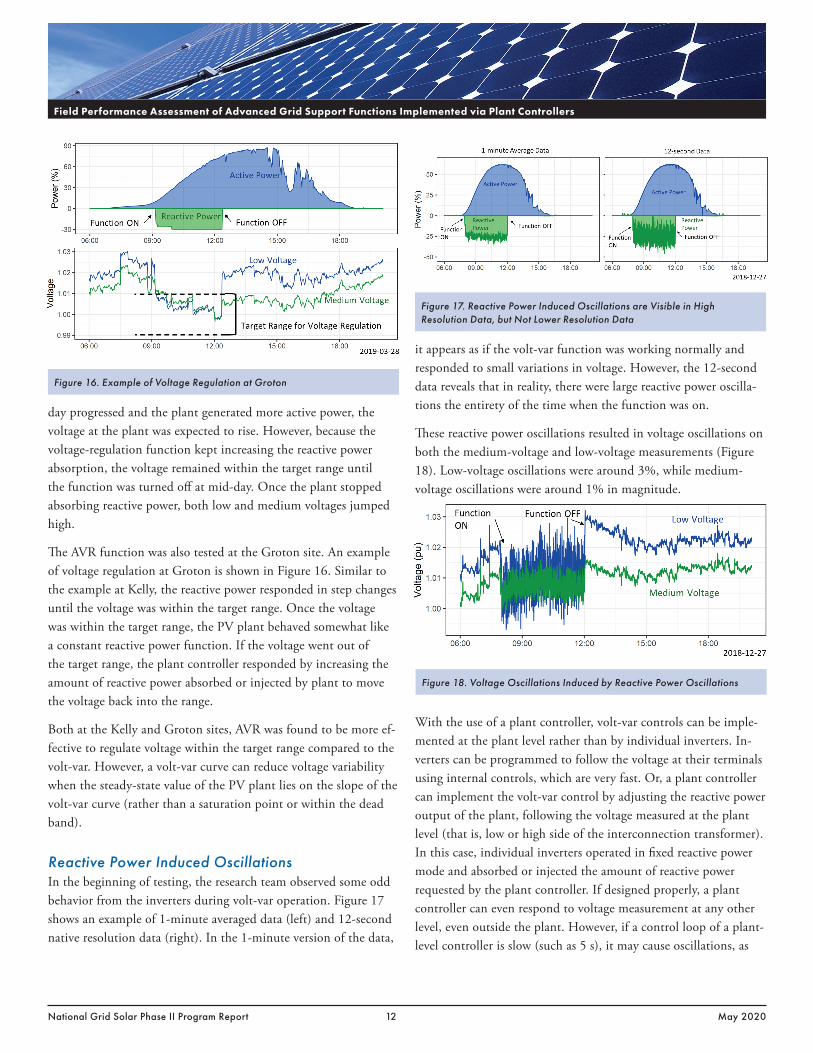
day progressed and the plant generated more active power, the voltage at the plant was expected to rise. However, because the voltage-regulation function kept increasing the reactive power absorption, the voltage remained within the target range until the function was turned off at mid-day. Once the plant stopped absorbing reactive power, both low and medium voltages jumped high.
The AVR function was also tested at the Groton site. An example of voltage regulation at Groton is shown in Figure 16. Similar to the example at Kelly, the reactive power responded in step changes until the voltage was within the target range. Once the voltage was within the target range, the PV plant behaved somewhat like a constant reactive power function. If the voltage went out of the target range, the plant controller responded by increasing the amount of reactive power absorbed or injected by plant to move the voltage back into the range.
Both at the Kelly and Groton sites, AVR was found to be more ef-fective to regulate voltage within the target range compared to the volt-var. However, a volt-var curve can reduce voltage variability when the steady-state value of the PV plant lies on the slope of the volt-var curve (rather than a saturation point or within the dead band).
Reactive Power Induced OscillationsIn the beginning of testing, the research team observed some odd behavior from the inverters during volt-var operation. Figure 17 shows an example of 1-minute averaged data (left) and 12-second native resolution data (right). In the 1-minute version of the data,
it appears as if the volt-var function was working normally and responded to small variations in voltage. However, the 12-second data reveals that in reality, there were large reactive power oscilla-tions the entirety of the time when the function was on.
These reactive power oscillations resulted in voltage oscillations on both the medium-voltage and low-voltage measurements (Figure 18). Low-voltage oscillations were around 3%, while medium-voltage oscillations were around 1% in magnitude.
With the use of a plant controller, volt-var controls can be imple-mented at the plant level rather than by individual inverters. In-verters can be programmed to follow the voltage at their terminals using internal controls, which are very fast. Or, a plant controller can implement the volt-var control by adjusting the reactive power output of the plant, following the voltage measured at the plant level (that is, low or high side of the interconnection transformer). In this case, individual inverters operated in fixed reactive power mode and absorbed or injected the amount of reactive power requested by the plant controller. If designed properly, a plant controller can even respond to voltage measurement at any other level, even outside the plant. However, if a control loop of a plant-level controller is slow (such as 5 s), it may cause oscillations, as
Figure 17. Reactive Power Induced Oscillations are Visible in High Resolution Data, but Not Lower Resolution Data
Figure 16. Example of Voltage Regulation at Groton
Figure 18. Voltage Oscillations Induced by Reactive Power Oscillations
11176929
National Grid Solar Phase II Program Report 13 May 2020
Field Performance Assessment of Advanced Grid Support Functions Implemented via Plant Controllers
AcknowledgementsThe Electric Power Research Institute (EPRI) and National Grid (NG) prepared this report.
Primary Authors:
Cameron Riley, EPRI Aminul Huque, EPRI Samer Arafa, NG
Contributors:
Tom Key, EPRI Harmony Smith, NG Justin Woodard, NG Ali Alrayes, NG/MIT LRO
EPRI CONTACT:
Aminul Huque, Principal Project Manager 865.218.8051, [email protected]
Distributed Energy Resources Integration (174)
NATIONAL GRID CONTACTS:
Samer Arafa, Lead Engineer 781.907.2647, [email protected]
Justin Woodard, Principal Engineer 781.907.1617, [email protected]
shown in Figure 18 and Figure 17. To mitigate these oscillations, the plant controller’s ramp rate of reactive power was changed to be less than 1% per second. Limiting the ramp rate of reactive power was successful at removing the oscillations.
SummaryAdvanced grid-support functions like power factor, volt-var, and automatic voltage regulation (AVR) were successfully demonstrat-ed at multiple PV sites, which are part of National Grid’s Solar Phase II Program. All functions had a measurable impact on volt-age (that is, they helped to keep the voltage closer to the target). The AVR function was most effective at moving the voltage into a target range. Volt-var was able to move the voltage toward the tar-get but was not able to bring it all the way within the dead band, mainly due to limitations of reactive power. Volt-var was most effective at reducing voltage variability with the voltage conditions observed in this project.
This project demonstrated the implementation of advanced grid support functions at the plant-level through a plant controller. To comply with new IEEE 1547-2018 requirements, especially for larger scale DER plants, plant controllers will become a critical component of the system. In most cases, plant controllers do not go through the same level of detailed certification testing like individual inverters. Hence, field verification of plant controllers, especially during a commissioning process, is critically important to identify any unwanted behavior like the voltage oscillations observed in this project. In addition, power quality meters with higher data resolution are valuable for larger plants to capture any voltage and/or power quality issues that may not be visible through revenue meters.
11176929

The Electric Power Research Institute, Inc. (EPRI, www.epri.com) conducts
research and development relating to the generation, delivery and use of electric-
ity for the benefit of the public. An independent, nonprofit organization, EPRI
brings together its scientists and engineers as well as experts from academia and
industry to help address challenges in electricity, including reliability, efficiency,
affordability, health, safety and the environment. EPRI also provides technology,
policy and economic analyses to drive long-range research and development
planning, and supports research in emerging technologies. EPRI members repre-
sent 90% of the electricity generated and delivered in the United States with inter-
national participation extending to nearly 40 countries. EPRI’s principal offices
and laboratories are located in Palo Alto, Calif.; Charlotte, N.C.; Knoxville, Tenn.;
Dallas, Texas; Lenox, Mass.; and Washington, D.C.
Together . . . Shaping the Future of Electricity
3002019417 May 2020
Electric Power Research Institute 3420 Hillview Avenue, Palo Alto, California 94304-1338 • PO Box 10412, Palo Alto, California 94303-0813 USA 800.313.3774 • 650.855.2121 • [email protected] • www.epri.com
© 2020 Electric Power Research Institute (EPRI), Inc. All rights reserved. Electric Power Research Institute, EPRI, and TOGETHER . . . SHAPING THE FUTURE OF ELECTRICITY are registered service marks of the Electric Power Research Institute, Inc.11176929