field measurements for calibration of simplifi ed models of
TRANSCRIPT

Vol. 19, No. 1 EARTHQUAKE ENGINEERING AND ENGINEERING VIBRATION January, 2020
Earthq Eng & Eng Vib (2020) 19: 87-104 DOI: https://doi.org/10.1007/s11803-020-0549-y
Field measurements for calibration of simplifi ed models of the stiff ening eff ect of infi ll masonry walls in high-rise
RC framed and shear-wall buildings
Zhou Yun1, 2, 3†, Pei Yilin1‡, Zhou Yi1§, Hyeon-Jong Hwang1* and Yi Weijian1†
1. College of Civil Engineering, Hunan University, Changsha 410082, China 2. Hunan Provincial Key Lab on Damage Diagnosis for Engineering Structures, Hunan University, Changsha 410082, China 3. Key Laboratory for Green & Advanced Civil Engineering Materials and Application Technology of Hunan Province, Hunan University, Changsha 410082, China
Abstract: As a type of nonstructural component, infi ll walls play a signifi cant role in the seismic behavior of high-rise buildings. However, the stiff ness of the infi ll wall is generally either ignored or considered by simplifi ed empirical criteria that lead to a period shortening. The diff erence can be greatly decreased by using a structural identifi cation methodology. In this study, an ambient vibration test was performed on four on-site reinforced concrete high-rise buildings, and the design results were compared with the PKPM models using corresponding fi nite element (FE) models. A diagonal strut model was used to simulate the behavior of the infi ll wall, and the identifi ed modal parameters measured from the on-site test were employed to calibrate the parameters of the diagonal strut in the FE models. The SAP2000 models with calibrated elastic modulus were used to evaluate the seismic response in the elastic state. Based on the load-displacement relationship of the infi ll wall, nonlinear dynamic analysis models were built in PERFORM-3D and calibrated using the measured modal periods. The analysis results revealed that the structural performance under small/large earthquake records were both strengthened by infi ll walls, and the contribution of infi ll walls should be considered for better accuracy in the design process.
Keywords: high-rise building; ambient vibration test; model calibration; infi ll wall; seismic performance; nonlinear dynamic analysis
Correspondence to: Zhou Yun, College of Civil Engineering, Hunan University, Changsha 410082, China Tel: +86-18684920470 E-mail: [email protected]
†Professor; ‡Postgraduate Student; §Master; *Associate professor Supported by: National Key Research and Development Program
of China under Grant Nos. 2016YFC0701400 and 2016YFC0701308, the Key Research and Development Program of Hunan Province under Grant No. 2017SK2220, and the National Natural Science Foundation of China (NSFC) under Grant No. 51878264
Received September 8, 2018; Accepted May 27, 2019
1 Introduction
Due to widely used lightweight materials, high-rise buildings have become more fl exible and thus more sensitive to external excitations. As a type of horizontal load, seismic action is critical to high-rise building design. The seismic response is aff ected by nonstructural components including infi ll walls, which has been concluded from previous substantial earthquake disasters. The use of masonry infi ll walls signifi cantly increases the initial stiff ness of building structures, but abrupt stiff ness degradation occurs after
the infi ll walls are damaged (Chaulagain et al., 2016; Dhakal et al., 2016). Furthermore, the irregular and unreasonable arrangement of the infi ll wall may also induce an adverse eff ect on the structural responses (e.g., torsion eff ect, short-column eff ect, and weak layer failure). However, the contribution of the infi ll wall to the stiff ness is generally ignored in the seismic design of building structures (Sanada and Konishi, 2011). To consider the structural performance infl uenced by the stiff ness of the infi ll wall, a natural period reduction factor is recommended in current design codes (Kaushik et al., 2012). Chinese design code JGJ 3-2010 (2010) specifi es the factor of 0.7 to 1.0, and the Canadian design code (NRCC, 2005) specifi es 0.8. Moreover, a series of specifi c formulas is utilized to estimate the natural period of reinforced concrete (RC) frames with infi ll walls (Zhou et al., 2017).
The installation of infi ll walls decreases the natural period of structures, which can be measured from an on-site ambient vibration test (Li and Wu, 2004). The ambient vibration test in high-rise buildings exhibits a large diff erence of the fundamental frequency between the predictions and actual measured records due to improper modeling approaches of nonstructural components (Li et al., 2004, 2010). The seismic capacity of high-rise

88 EARTHQUAKE ENGINEERING AND ENGINEERING VIBRATION Vol. 19
buildings is aff ected by the dynamic characteristics related to the mass and stiff ness distributions. Thus, the mass and stiff ness of the infi ll walls should be considered in the evaluation of the seismic capacity.
The structural identifi cation (St-Id) method, proposed by Liu and Yao (1978), is a systematic approach for characterizing the structural behavior of an unknown system on the basis of the input and output test data. St-Id was summarized as a six-step analysis-test-decision integration cycle by ASCE St-Id of Constructed Systems Committee as follows (ASCE, 2011): (1) Objectives, observation, and conceptualization; (2) A priori fi nite element (FE) modeling; (3) Uncontrolled and controlled tests; (4) Processing, validation, and interpretation of data; (5) Model calibration and parameter identifi cation; and (6) Utilization of the calibrated model for simulation and decision-making. Over the last few decades, the state of the art in St-Id of constructed systems has advanced signifi cantly, and dozens of successful applications for structural systems have been documented (Catbas et al., 2013).
The identifi ed dynamic characteristics obtained from an on-site test can be employed to update the related parameters of the FE model (Brownjohn, 2003). The measurement of the structural dynamic response from ambient vibration tests, such as microtremors, wind vibration, and traffi c vibration, is increasingly important to obtain the fundamental period of high-rise buildings. Based on the on-site test record, the FE model can be calibrated to minimize the diff erence between the predictions and measured dynamic characteristics, and the calibrated FE model is applicable to structural analysis (Xu et al., 2003). Other applications mainly include structural health monitoring, seismic vulnerability evaluation, and vibration control (Brownjohn and Pan, 2008).
Uncertainty in the modeling of infi ll walls was introduced in an a priori FE model of high-rise buildings, which was generally utilized to estimate modal information before implementing the ambient excitation test for an actual structure. The current computational models to simulate the mechanical behavior of the infi ll wall are broadly divided into FE micro-model and macro-model. In the micro-model, the infi ll wall is considered as a continuous element addressing local details, and the material properties of the mortar, brick, and other constituent elements can be built. The FE micro-model is generally regarded as the most precise analysis method for infi ll wall modeling (Hans et al., 2010), although considerable calculation time is required (Asteris et al., 2013). The macro-model can be developed based on the observed seismic behavior and test results (Asteris et al., 2011). According to Polyakov (1960), an infi ll wall can be converted into a diagonal strut within its panel. Holmes (1961) further improved a simplifi ed model with an equivalent pin-jointed diagonal strut. Smith (1962) presented a mathematical equation to estimate the equivalent width of the diagonal strut.
Mainstone (1971) proposed an empirical equation for the equivalent strut width based on test results, which was simultaneously included in FEMA-274 (1997) and FEMA-306 (1999) guidelines and has been widely used in the analysis of RC frames with infi ll walls (Fardis and Panagiotakos, 1997; Negro and Colombo, 1997; Balendra and Huang, 2003). Eurocode 8 (2004) prescribes the detailed arrangement of the infi ll wall at the fi rst story, but the calculation procedure is relatively complicated in the design procedure.
Based on Chinese seismic design code GB 50011-2010 (2010), mode-superposition response spectrum analysis and linear dynamic analysis are applied to the structural analysis under small earthquakes. Under large earthquakes, the pushover analysis method and nonlinear dynamic analysis are used to consider plastic behavior. A similar analytical procedure is adopted in Eurocode 8 (2004) and American design codes (ASCE, 2006), although these codes diff er in the selection of the site category, seismic grouping, and structural vibration period.
The dynamic characteristics of the RC frame structures with infi ll walls have also been widely discussed. Henderson et al. (2003) demonstrated that an actual masonry infi ll wall can resist lateral load more eff ectively than suggested by the design code procedures. Su et al. (2005) indicated that nonstructural components signifi cantly increase the global lateral stiff ness of structures. Hashmi and Madan (2008) reported that an infi ll wall decreases the lateral deformation and damage of frame structures. According to Kose and Karslioglu (2010), the use of infi ll walls decreases the fi rst mode period of structures and increases the spectral acceleration coeffi cient in response analysis. Zhang et al. (2011) performed numerical analysis to investigate the eff ect of infi ll walls on the failure pattern of RC frames, and reported that the infi ll eff ect needs to be considered in structural design. Nautiyal et al. (2013) found that the base shear of a four-story frame is increased by an infi ll wall in the equivalent diagonal strut method. Su and Lee (2013) proposed a coeffi cient-based method for the seismic fragility analysis and ultimate spectral displacement assessment of RC buildings using infi ll walls, which is applicable to both the performance evaluation of existing buildings and conceptual design of new buildings. Nwofor and Chinwah (2014) discovered that the shear strength of a building structure with infi ll walls decreases with an increase of the opening ratio of the infi ll walls. Luis et al. (2014) reported that the openings at the corner of infi ll walls decrease the strength and stiff ness of the infi lled frames, which should not be used in high-seismicity regions. Ashok et al. (2015) observed that an infi ll wall increases the seismic resistance of frame structures. Al-Nimry et al. (2015) conducted nonlinear static analysis of 112 low-rise and medium-rise buildings with infi ll walls, and found that approximately 40% of the existing buildings require detailed analysis to better evaluate their seismic

No. 1 Zhou Yun et al.: Eff ect of an infi ll wall on linear and nonlinear seismic performance of high-rise buildings 89
vulnerabilities. Milheiro et al. (2016) recommended that nonlinear analysis be performed to consider the infi ll wall contribution to the design of new buildings and the evaluation of the seismic performance of existing buildings. Abhijeet and Vaibhav (2017) observed that the maximum defl ection and story drift ratio are restricted in high-rise buildings with infi ll walls and outrigger systems.
The core ideology of the St-Id approach lies in the estimation of the structural response performed by the calibrated FE model. The discrepancy between the seismic analysis result of high-rise buildings and actual structural behavior is mainly caused by the uncertainty of the modeling process (particularly, the eff ect of nonstructural components, such as infi ll walls, is neglected). Although the uncalibrated FE model without consideration of infi ll walls is generally used in seismic analysis, the diff erence in seismic performance between the uncalibrated and calibrated FE model has seldom been studied. In the present study, the FE model was calibrated by using the actual period measured from the ambient vibration test, and the structural performance was evaluated by the calibrated FE models. The mode-superposition response spectrum analysis method and nonlinear dynamic analysis method were adopted to evaluate the elastic behavior under small earthquakes and plastic behavior under large earthquakes, respectively. Figure 1 shows the detailed procedure. The eff ect of an infi ll wall on the seismic performance of structures was discussed, and the seismic analysis results calculated by the calibrated model and uncalibrated model were carefully compared.
2 On-site tests of Laibin high-rise buildings
Target buildings were tested in downtown Laibin
in Guangxi, China. Ten residential RC buildings with heights of approximately 100 meters were carefully selected from more than 200 high-rise buildings. The infi ll wall of the structures was built by brick masonry and cement mortar. To achieve a convenient and scientifi c comparison, four representative high-rise buildings (BAYG 2#, JSXQ 3#, XYY A#, and SHHM 2#) were selected from each residential region for dynamic testing. The heights of BAYG 2#, JSXQ 3#, XYY A#, and SHHM 2# were 87.0 m with 26 stories, 122.7 m with 39 stories, 86.1 m with 24 stories, and 107.4 m with 33 stories, respectively. Figure 2 shows the building information and instrumentation layout. BAYG 2# is a frame-shear wall structure, and the other three buildings are shear wall structures. Twelve kinds of beam sections (section range 150 mm × 300 mm‒300 mm × 800 mm) were used, and the majority of the column section was about 500 mm × 500 mm (section range 350 mm × 400 mm‒700mm × 700 mm). In BAYG 2#, JSXQ 3#, XYY A#, and SHHM 2#, the total number of infi ll wall panels was 86, 104, 118, and 76 in each story, and the thickness of the infi ll wall was 220 mm, 180 mm, 270 mm, and 300 mm, respectively. The thickness of the RC walls was 240 mm‒500 mm. The infi ll wall was constructed by MU10 porous shale bricks combined with M5 cement mortar, and the corresponding masonry compressive strength was 2.4 MPa and Poisson’s ratio was 0.2. The tested structures were built at the same construction site where the soil type was limestone with plain fi lls, and supported by piles with man-excavated shaft. The fi eld category was classifi ed as class 2, and the seismic intensity was classifi ed as degree 6 according to Chinese design code GB 50011-2010. Other detailed test information can be found in the study of Zhou et al. (2017).
In this study, the stochastic subspace identifi cation method (SSI) was used to analyze the signals measured from the ambient vibration test (Peeters, 2000). For
Fig. 1 Flowchart of two-stage seismic analysis for high-rise buildings

90 EARTHQUAKE ENGINEERING AND ENGINEERING VIBRATION Vol. 19
structural design, PKPM software only considers the equivalent mass of infi ll walls, while the corresponding stiff ness is ignored. Table 1 compares the fi rst three periods calculated by the SATWE module in PKPM with the measurements to identify the diff erences. The ratio of the measured period to prediction ranged from 0.339 to 0.450 when the period reduction coeffi cients specifi ed in Chinese design code JGJ 3-2010 were used (i.e., 0.7 to 0.8 for frame-shear wall structures, and 0.8 to 1.0 for shear wall structures). Figure 3 compares the calculated mode shapes with the measurements in building JSXQ 3#, demonstrating similar behavior.
3 Elastic FE model for response spectrum analysis
To evaluate the linear dynamic behavior of a high-
rise building, the mode-superposition response spectrum method was used according to Chinese seismic design code GB 50011-2010 (2010). The accuracy of the FE model analysis for high-rise buildings is aff ected by the modeling behavior of the structural components including the slab and shear wall. In the SATWE module of PKPM software, a one-dimensional element was adopted to simulate the structural performance of the column, beam, and diagonal strut (Tan et al., 2015). The shear wall was simulated by the general shell element, and the slab could be assumed to have infi nite stiff ness or simulated by elastic theory. As general FE analysis software, SAP2000 employs frame elements to describe the behavior of the beam and column, and the shell element with membrane characteristics was adopted for the slab and shear wall in three-dimensional structures (Mwafy et al., 2006).
(a) (b)
(c) (d)Fig. 2 Floor plan of four high-rise buildings: (a) BAYG 2#; (b) JSXQ 3#; (c) XYY A#; (d) SHHM 2# (dotted pink line indicates the infi ll wall)
Table 1 Calculated and measured natural periods of the four buildings
Buildings T/T coeffi cient Items 1st mode (s) 2nd mode (s) 3rd mode (s)BAYG 2# 0.74 Measured 1.245 1.122 0.958
Calculated 3.584 3.311 2.651JSXQ 3# 0.93 Measured 1.621 1.479 1.287
Calculated 3.605 3.487 3.344XYY A# 0.78 Measured 0.917 0.865 0.800
Calculated 2.297 1.970 1.875SHHM 2# 0.85 Measured 1.433 1.294 1.214
Calculated 3.722 3.702 3.168 Note: T/T coeffi cient denotes the calculated torsion period divided by the translation period

No. 1 Zhou Yun et al.: Eff ect of an infi ll wall on linear and nonlinear seismic performance of high-rise buildings 91
The high-rise building model was built in the SATWE module of PKPM before transferring it to SAP2000. First, the accuracy and calculation errors of the models built in SAP2000 and PKPM should be estimated, and the identical modeling strategy was adopted for each modeling. The beam element was employed for the beam and column, and the thin-shell element was adopted to simulate the behavior of the shear wall and fl oor slab. As shown in Fig. 4, a pair of equivalent diagonal struts that resist compression force only was used to simulate an infi ll panel (Paulay and Priestley, 1992; Furtado et al., 2015). The diagonal strut model provides suffi cient accuracy to represent the major characteristics of the load-displacement relationship of the infi ll wall. The mechanical properties, such as initial stiff ness, can be extracted from the curve. A constant thickness of the diagonal strut was assumed in each story. Similar to the modeling strategy in PKPM, the mass of the infi ll wall was converted into dead load, and then imposed on the corresponding beam. The density of the diagonal strut was set to zero. The complete quadratic combination (CQC) calculation method was employed to consider the structural torsional eff ect.
3.1 Initial stiff ness of diagonal strut for infi ll walls
Strut width is the key parameter of the diagonal strut in FE analysis, which was proposed by Mainstone (1971), as follows:
0.4=0.175 h d (1)
where h is the dimensionless parameter that refl ects the relative stiff ness of the infi ll wall; and d is the diagonal length of the panel.
h can be calculated as follows:
0.25m sin(2 )( )4h
E thEIh
(2)
where Em, t , and h are the elastic modulus, thickness, and height of the infi ll wall, respectively; is the angle between the diagonal strut and beam; E is the elastic modulus of the frame materials; and h and I are the height and moment inertia of the column, respectively.
The initial stiff ness ke of the infi ll wall is defi ned as follows:
2me 2 (cos )E tk
L
(3)
where L is the length of the equivalent diagonal strut.
3.2 Model verifi cation for response spectrum analysis
Table 2 shows the types of FE models for the four selected high-rise buildings. Model 1 indicates the PKPM design model, Model 2 indicates the SAP2000 analysis model for comparison, and Model 3 adds the stiff ness eff ect of the infi ll wall to Model 2. Figure 5 shows the natural periods of the fi rst 12 modes calculated by Model 1 and Model 2 of JSXQ 3#. The identical analysis results indicate that the model of SAP2000 can represent the PKPM model well with regard to structural design.
100
80
60
40
20
0-10 0 10 20 30 3020100
H (m
)
Y (m) X (m)
Measured Calculated
(a) 1st mode (Y)
100
80
60
40
20
040 20 0 -10 0 10 2030H
(m)
Y (m) X (m)
Measured Calculated(b) 2nd mode (X)
100
80
60
40
20
040 20 0 40 20 0
H (m
)
Y (m)X (m)
Measured Calculated(c) 3rd mode (T)
Fig. 3 Comparison between the measured and calculated modes in building JSXQ 3# (Note: X/Y denotes the X/Y direction lateral swaying mode, T denotes the torsional mode)
Fmax
Fcr
Fr
Load
(kN
)
αhke
ke
δcr δcapδr δc
Displacement (mm)
Diagonal strut model
Fig. 4 Load-displacement relationship of a diagonal strut for infi ll walls

92 EARTHQUAKE ENGINEERING AND ENGINEERING VIBRATION Vol. 19
In Model 3 with diagonal struts, the infi ll wall was built using MU10 shale porous bricks and M5 cement mortar (i.e., masonry compressive strength of 2.4 MPa, and Poisson′s ratio of 0.2). According to the test report of the contractor, the initial elastic modulus of the infi lls was selected as 1.85× 10⁴ N/mm2. Because of the large diff erence of modal periods between the analysis result by FE software and measurement in the building JSXQ 3#, the elastic modulus of the infi ll wall was modifi ed by a trial and error analysis to 1.45×10⁴ N/mm2. As shown in Fig. 6, the modal period of JSXQ 3# predicted by the calibrated Model 3 agreed well with the measurement.
4 FE model for nonlinear dynamic analysis
In nonlinear behavior of a structure under large
earthquakes, the lateral stiff ness of the infi ll wall gradually decreases as the damage develops (Almeida et al., 2016). To investigate the nonlinear seismic behavior of the structure using the calibrated infi ll wall model, PERFORM-3D, specialized software for performance-based seismic analysis, was used (Mamun and Saatcioglu, 2017). The building models in PKPM were transformed by NosaCAD to PERFORM-3D for nonlinear dynamic analysis (Wu, 2012). The load cases in PERFORM-3D were identical to those in the SATWE module of PKPM, and a rigid fl oor was assumed for simple calculation.
Beams that have relatively small axial forces, are therefore usually not necessary to account for P-M interaction, while columns with relatively large axial forces, are therefore necessary to account for P-M interaction. Thus, beams usually bend in only one plane, and it is not necessary to consider biaxial bending or biaxial shear. While columns usually bend along about both cross section axes, biaxial bending and biaxial shear need to be considered. In PERFORM-3D, the element that consists of an intermediate elastic segment and a terminal elastic-plastic segment is used to describe the nonlinear behavior of frame members. The trilinear moment-curvature hysteretic models are utilized in the elastic-plastic segment of the beam under bending moment, and the fi ber model is adopted in the elastic-plastic segment to describe the nonlinear behavior of the column under moment and axial force at both ends (Epackachi et al., 2012). The general shear wall element developed by PERFORM-3D was used in the wall model to consider the complex stress state (Burak and Comlekoglu, 2013). The coupling beam component is simulated by the beam element with a shear hinge to describe the nonlinear shear stiff ness. The diagonal strut model for the nonlinear behavior of the infi ll wall is considered in PERFORM-3D (Wu et al., 2014). Figure 7 shows the load-displacement relationship of the infi ll wall in PERFORM-3D. The curve YULRX describes the concrete behavior, and the degeneration coeffi cients for the energy dissipation capacity are 1.0 (point Y), 0.9 (point U), 0.7 (point L), 0.4 (point R), and 0.3 (point X). The trilinear curve ‘YUX’ describes the behavior of reinforcing bars. Figure 7(b) shows the hysteretic curve for one ma sonry diagonal at the bottom story of JSXQ 3# under RSN 304 action.
Table 2 Analysis models of high-rise buildings
Models Software Mass of the infi ll wall
Stiff ness of the infi ll wall
Period reduction coeffi cient Description
Model 1 PKPM Yes None Yes Design modelModel 2 SAP2000 Yes None None Comparison with the
PKPM modelModel 3 SAP2000 Yes Diagonal strut None Response spectrum analysisModel 4 PERFORM-3D Yes None Yes Comparison with the
PKPM modelModel 5 PERFORM-3D Yes Diagonal strut None Nonlinear dynamic analysis
4
3
2
1
00 2 4 6 8 10 12 Order (n)
Perio
d (s
)
Model 1 (PKPM)Model 2 (SAP2000)
Fig. 5 Comparison of natural periods between Model 1 and Model 2 in JSXQ 3#
2
1
00 2 4 6 8 10 12 Order (n)
Perio
d (s
)
Measured resultsUncalibrated valueCalibrated value
Fig. 6 Natural periods of Model 3 with/without calibration in JSXQ 3#

No. 1 Zhou Yun et al.: Eff ect of an infi ll wall on linear and nonlinear seismic performance of high-rise buildings 93
4.1 Load-displacement relationship of infi ll walls
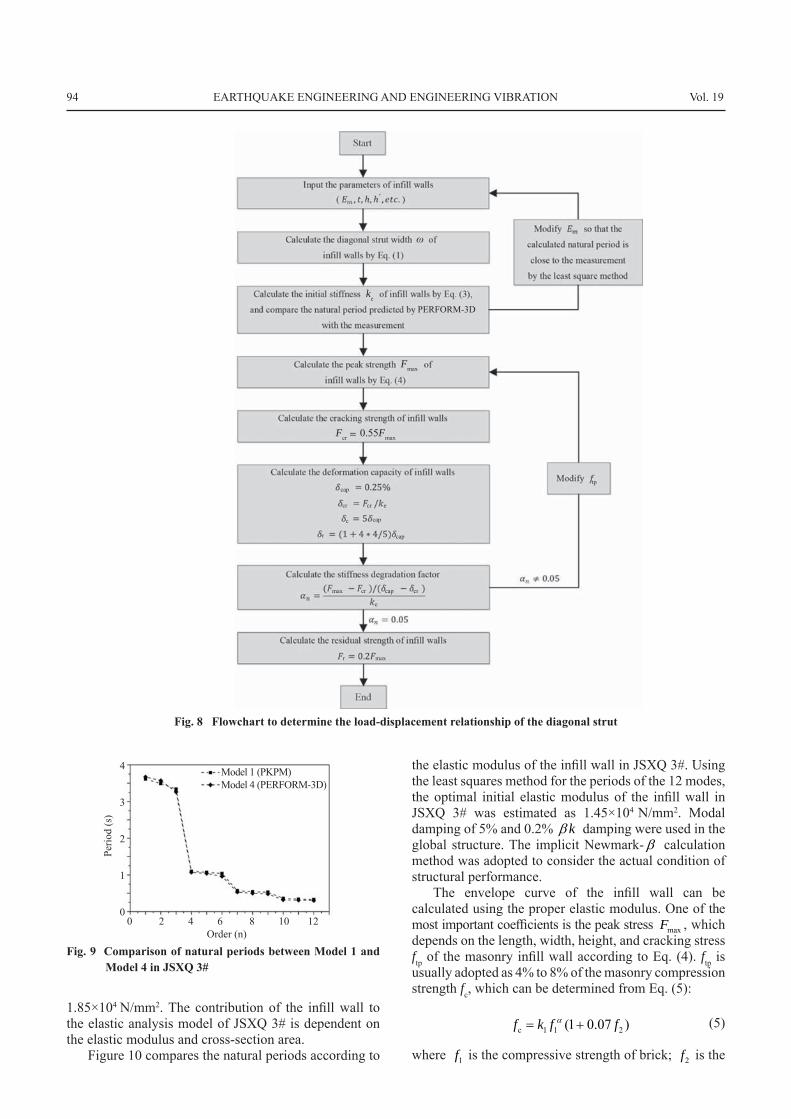
Figure 8 shows the procedure to calculate the load-displacement relationship of the infi ll wall. The peak strength can be determined from Eq. (4), proposed by Zarnic and Gostic (1998) and revised by Dolsek and Fajfar (2008):
in tp 2max 0.818 (1 1)I
I
L tfF C
C (4a)
in1.925I
LCh
(4b)
where Lin is the length of the infi ll wall; and ftp is the cracking stress of the masonry brick obtained from the diagonal compression test.
The mechanical properties including the peak strength and residual strength of the infi ll wall can be extracted from the load-displacement relationship of the nonlinear diagonal strut model. As shown in Fig. 4, the stiff ness of the infi ll wall is degraded to ehk after crack initiation. According to Manzouri (1995) and Dolsek and Fajfar (2008), the cracking strength Fcr of the infi ll wall is approximately 0.55 times the peak strength (i.e.,
cr max=0.55F F ). The displacement cap corresponding to the peak strength can be approximately defi ned as 0.25% of the story drift ratio, on the basis of the test
results performed by Manzouri (1995) and Shing et al. (2009). Dolsek and Fajfar (2008) suggested that the residual strength of the infi ll wall is 0.2 times the peak strength, and the corresponding displacement can be calculated by the displacement c at zero strength. c is approximately fi ve times greater than cap based on a series of tests implemented by Carvalho and Coelho (2001).
4.2 Model verifi cation for nonlinear dynamic analysis
Model 4 indicates that the contribution of infi ll walls to structural stiff ness is considered using the period reduction factor in PERFORM-3D. As shown in Fig. 9, the modal periods of JSXQ 3# calculated by PERFORM-3D are basically consistent with those of PKPM, which indicates that the PERFORM-3D analysis model is reasonable for nonlinear analysis.
In Model 5, the modeling of the diagonal strut for the infi ll wall is added to Model 4 (refer to Table 2). Table 3 shows the design parameters of the infi ll walls in JSXQ 3#. The height of the fi rst story is approximately 3.8 m, the height of the other stories is 2.9 m, and the width of the infi ll wall ranges from 1 m to 5.5 m. The width and cross-sectional area of the diagonal strut can be calculated by Eq. (1). For C40 and C45 concrete used in the frame, the elastic modulus is defi ned as 3.25×10⁴ N/mm2
and 3.35×10⁴ N/mm2, respectively. Compared with the measurement from the on-site dynamic test, the initial elastic modulus of the masonry infi lls was re-defi ned as
Load
Y
U LX ′
RX
Initial stiff ness
Stiff ness strengthen
Strength degradation
No strength degradation
Maxdeformation
(a)Displacement
20
0
-20
-40
-60
-80
-100
-120
-140-3 -2 -1 0 Displacement (mm)
(b)Fig. 7 Envelope performance of masonry diagonal components: (a) Load-displacement relationship; (b) Hysteretic curve of JSXQ 3# under RSN 304 action
Load
(kN
)
Table 3 Diagonal strut width according to design parameters in JSXQ 3#
Height of infi ll wall (mm)
Width of infi ll wall
(mm)
Width of diagonal strut
(mm)
Cross-section area of diagonal
strut (mm2)
Height of infi ll wall
(mm)
Width of infi ll wall
(mm)
Width of diagonal
strut (mm)
Cross-section area of diagonal
strut (mm2)h = 2900 1000 337 60649 h = 3800 1000 424 76385
2000 392 70538 2000 453 815713000 482 86815 3000 518 931904000 592 106474 4000 603 1085055000 712 128159 5000 701 126179
94 EARTHQUAKE ENGINEERING AND ENGINEERING VIBRATION Vol. 19
1.85×10⁴ N/mm2. The contribution of the infi ll wall to the elastic analysis model of JSXQ 3# is dependent on the elastic modulus and cross-section area.
Figure 10 compares the natural periods according to
the elastic modulus of the infi ll wall in JSXQ 3#. Using the least squares method for the periods of the 12 modes, the optimal initial elastic modulus of the infi ll wall in JSXQ 3# was estimated as 1.45×10⁴ N/mm2. Modal damping of 5% and 0.2% k damping were used in the global structure. The implicit Newmark- calculation method was adopted to consider the actual condition of structural performance.
The envelope curve of the infi ll wall can be calculated using the proper elastic modulus. One of the most important coeffi cients is the peak stress maxF , which depends on the length, width, height, and cracking stress
ftp of the masonry infi ll wall according to Eq. (4). ftp is
usually adopted as 4% to 8% of the masonry compression strength fc, which can be determined from Eq. (5):
c 1 1 2(1 0.07 )f k f f (5)
where 1f is the compressive strength of brick; 2f is the
Fig. 9 Comparison of natural periods between Model 1 and Model 4 in JSXQ 3#
4
3
2
1
00 2 4 6 8 10 12 Order (n)
Perio
d (s
)
Model 1 (PKPM)Model 4 (PERFORM-3D)
Fig. 8 Flowchart to determine the load-displacement relationship of the diagonal strut
ω
ke
PERFORM-3D
Fmax
Fcr 0.55Fmax
cap
cr cr e
cap
r
max cr cap cr
e
r max
tp
c
cap

No. 1 Zhou Yun et al.: Eff ect of an infi ll wall on linear and nonlinear seismic performance of high-rise buildings 95
compressive strength of mortar; and 1k , and 2k are the coeffi cients related to the type of brick specifi ed in the design code. The reasonable range of ftp can be acquired based on fc, and the specifi c value of ftp is determined based on the stiff ness degradation coeffi cient n .
For example, the infi ll wall of JSXQ 3# was composed of perforated shale brick with cement mortar, and fc was calculated as 3.3 MPa in Eq. (5). The reasonable range of ftp was 0.13 MPa to 0.27 MPa (i.e., 4 to 8% of fc), and the envelope curve of the infi ll wall was estimated according to the procedure in Fig. 8. Note that a 16% to 20% change of the elasticity modulus of the infi ll wall would generate the 15% to 35% decrease/increase of the initial stiff ness in the envelope curve, and the global component performance is also aff ected as shown in Fig. 11. Figure 12 shows the envelope curves of the infi ll walls with various widths at the standard fl oor (h = 2.9 m) of JSXQ 3#, and ftp in all cases satisfi ed the reasonable range of 0.13 MPa to 0.27 MPa.
5 Response spectrum analysis results under small earthquakes
5.1 Discussion of seismic infl uence coeffi cient
In the design of four high-rise buildings, fi eld category class 2 specifi ed in the Chinese code corresponds to the fi eld with a mean shear wave velocity
30V between 260 m/s and 510 m/s in US code (Lu and
Zhao, 2007). As shown in Fig. 13, the natural periods of the 1st mode in the high-rise buildings are expected to lie in the long period region of the target response spectrum, which decreases the seismic infl uence coeffi cient. The measured and calculated natural periods of the four buildings were marked in the response spectrum.
Table 4 shows the detailed information used in the response spectrum analysis. Both the PKPM and initial SAP2000 FE models overestimated the natural periods of the actual building structures because of the lack of calibration, which underestimated the seismic infl uence factor. After the calibration of the analysis models, the fundamental periods agreed well with the measured modal data, and then the calibrated models generated nearly the same seismic infl uence factor as shown in Fig. 13. Thus, the conventional design process ignoring the stiff ness eff ect of infi ll walls had the
2
1
0
Perio
d (s
)
Measured results
E = 12500 N/mm2
E = 14500 N/mm2
E = 17500 N/mm2
0 2 4 6 8 10 12 Order (n)
Fig. 10 Natural period variances according to the elastic modulus of infi ll walls in JSXQ 3#
200
100
00 10 20 30 40 Displacement (mm)
E = 12500 N/mm2
E = 14500 N/mm2
E = 17500 N/mm2
Load
(kN
)
Fig. 11 Elasticity modulus adjustment of the infi ll wall in JSXQ 3#
200
100
00 10 20 30 40 Displacement (mm)
Load
(kN
)
Fig. 12 Envelope curves of infi ll walls in JSXQ 3#
Width = 2 mWidth = 4 mWidth = 5 m
ftp = 0.211ftp = 0.218
ftp = 0.170
Table 4 Seismic coeffi cients for response spectrum analysis
Coeffi cient αmax η1 η2 γ Tg ζValue 0.04 0.02 1 0.9 0.35 0.05
Note: αmax denotes the maximum seismic infl uence coeffi cient, η1 denotes the slope regulation coeffi cient of the linear decrease stage, η2 denotes the damping modifi cation factor, γ denotes the attenuation index, Tg denotes the design basic earthquake acceleration, and ζ denotes the damping ratio

96 EARTHQUAKE ENGINEERING AND ENGINEERING VIBRATION Vol. 19
potential to generate an inaccurate result because of the underestimated seismic infl uence factor , even when the period reduction coeffi cient was considered.
5.2 Inter-story shear force
Figure 14 shows the inter-story shear distributions of Model 1 and Model 3 calculated by the mode-superposition response spectrum analysis in the X-direction. The shear force at the bottom story of the Model 3 was approximately 1.5 to 2 times greater than that of Model 1 due to the contribution of the infi ll wall to the structural stiff ness and resistance to seismic loading.
5.3 Inter-story drift
Figure 15 shows the story drift distributions of Model 1 and Model 3 for the four high-rise buildings. The roof displacement of Model 1 was 3 to 6 times greater than that of Model 3.
Figure 16 shows the inter-story drift ratio distributions of Model 1 and Model 3, and both values satisfi ed the drift requirement of the design codes. The inter-story drift ratio is defi ned as the maximum inter-story drift divided by the height of each fl oor ( u h ), which should be less than the requirement of the structural horizontal displacement to prevent the degradation of the stability and operational performance of the structure. The maximum inter-story drift ratio of Model 1 was 3 to 6 times greater than that of Model 3.
The Chinese design code JGJ 3-2010 (2010) specifi es the period reduction factor of 0.7 to 0.8 for a frame-shear structure and 0.8 to 1.0 for a shear wall structure. The Canadian design code (NRCC, 2005) specifi es the coeffi cient for the natural frequency of 0.8 for infi ll structures. Although the period reduction factor was utilized in PKPM, the inter-story shear force calculated by Model 1 was approximately 0.5 times less than that of Model 3, and the horizontal drift and inter-story drift ratio of Model 1 was approximately 3 to 4 times greater than that of Model 3 (refer to Figs. 14 to 16). Thus, the recommended values need to be revised to better evaluate the shear force and drift ratio in elastic state.
0.04
0.03
0.02
0.01
α (T
)
0 1 2 3 4 5 6 Period (s)
Measured (SSI)Model 1 (PKPM)Model 2 (SAP2000)Model 3 (SAP2000)
Fig. 13 Seismic infl uence factors in various analysis models
30
20
10
00 1000 2000 Inter-story shear force (kN)
Stor
y (n
)
Model 1 (PKPM)Model 3 (SAP2000)
(a)
50
40
30
20
10
00 2000 4000 6000 Inter-story shear force (kN)
Stor
y (n
)
Model 1 (PKPM)Model 3 (SAP2000)
(b)
BAYG 2# JSXQ 3#
30
20
10
00 2000 4000 Inter-story shear force (kN)
Stor
y (n
)
Model 1 (PKPM)Model 3 (SAP2000)
(c)
XYY A# 40
30
20
10
0
Stor
y (n
)
Model 1 (PKPM)Model 3 (SAP2000)
(d)
SHHM 2#
0 2000 4000 Inter-story shear force (kN)
Fig. 14 Shear force distribution of buildings under small earthquakes: (a) BAYG 2#; (b) JSXQ 3#; (c) XYY A#; (d) SHHM 2#

No. 1 Zhou Yun et al.: Eff ect of an infi ll wall on linear and nonlinear seismic performance of high-rise buildings 97
30
20
10
00 20 40 60 Inter-story drift (mm)
BAYG 2#Model 1 (PKPM)Model 3 (SAP2000)
Stor
y (n
)
(a)
50
40
30
20
10
00 20 40 60 80 Inter-story drift (mm)
JSXQ 3#Model 1 (PKPM)Model 3 (SAP2000)
Stor
y (n
)
(b)
30
20
10
00 10 20 30 Inter-story drift (mm)
XYY A#Model 1 (PKPM)Model 3 (SAP2000)
Stor
y (n
)
(c)
40
30
20
10
0 0 20 40 60 Inter-story drift (mm)
SHHM 2#Model 1 (PKPM)Model 3 (SAP2000)
Stor
y (n
)
(d)Fig. 15 Story drift of buildings under small earthquakes: (a) BAYG 2#; (b) JSXQ 3#; (c) XYY A#; (d) SHHM 2#
30
20
10
00 0.2 0.4 0.6 0.8 1.0 Inter-story ratio (0.001 rad)
BAYG 2#Model 1 (PKPM)Model 3 (SAP2000)
Stor
y (n
)
(a)
50
40
30
20
10
00 0.2 0.4 0.6 Inter-story ratio (0.001 rad)
JSXQ 3#Model 1 (PKPM)Model 3 (SAP2000)
Stor
y (n
)
(b)
30
20
10
0
XYY A#Model 1 (PKPM)Model 3 (SAP2000)
Stor
y (n
)
(c)
40
30
20
10
0
SHHM 2#Model 1 (PKPM)Model 3 (SAP2000)
Stor
y (n
)
(d)Fig. 16 Inter-story drift ratio under small earthquakes: (a) BAYG 2#; (b) JSXQ 3#; (c) XYY A#; (d) SHHM 2#
0 0.2 0.4 Inter-story ratio (0.001 rad)
0 0.2 0.4 0.6 Inter-story ratio (0.001 rad)

98 EARTHQUAKE ENGINEERING AND ENGINEERING VIBRATION Vol. 19
6 Nonlinear dynamic analysis results under large earthquakes
6.1 Earthquake records
In nonlinear dynamic analysis, the seismic records should be carefully selected based on the spectrum
characteristics, eff ective magnitude acceleration, and seismic duration (GB 50011-2010, 2010). Three qualifi ed seismic waves in PEER were selected for each high-rise building (refer to Table 5), and the seismic waves were scaled compared with the corresponding target response spectrum (refer to Fig. 17). The seismic waves were applied to FE Models 4 and 5 of four high-rise buildings to conduct nonlinear dynamic analysis.
Table 5 Earthquake records for nonlinear dynamic analysis
Buildings No. Record No. Earthquake records Time Mag. D5-95 V30 (m/s) PGA (cm/s2)BAYG 2# 1 RSN66 San Fernando 1971 6.61 23.9 328.09 41.26
2 RSN300 Irpinia_Italy-02 1980 6.20 20.0 455.93 172.273 RSN906 Big Bear-01 1992 6.46 21.5 328.09 79.07
JSXQ 3# 1 RSN304 Irpinia_Italy-02 1980 6.20 22.1 496.46 20.792 RSN921 Big Bear-01 1992 6.46 23.2 312.47 76.713 RSN937 Big Bear-01 1992 6.46 22.4 416.15 36.11
XYY A# 1 RSN88 San Fernando 1971 6.61 23.6 389.00 151.772 RSN300 Irpinia_Italy-02 1980 6.20 20.0 455.93 172.273 RSN1046 Northridge-01 1994 6.69 22.0 339.60 59.51
SHHM 2# 1 RSN140 Tabas_Iran 1978 7.35 24.2 302.64 102.752 RSN300 Irpinia_Italy-02 1980 6.20 20.0 455.93 172.273 RSN906 Big Bear-01 1992 6.46 21.5 328.09 79.07
Note: D5-95 denotes the signifi cant duration from 5% to 95% of Arias intensity; V30 denotes the shear wave velocity in the upper 30 m; and PGA denotes the peak ground acceleration
600
400
200
00 1 2 3 4 Period
Acc
eler
atio
n re
spon
se S
a (cm
/s2 ) RSN 66
RSN 300RSN 906Mean response spectrumTarget response spectrum
(a)
BAYG 2#
(c) (d)
SHHM 2#
Fig. 17 Seismic response spectra and target response spectra: (a) BAYG 2#; (b) JSXQ 3#; (c) XYY A#; (d) SHHM 2#
600
400
200
00 1 2 3 4 Period
Acc
eler
atio
n re
spon
se S
a (cm
/s2 ) RSN 304
RSN 921RSN 937Mean response spectrumTarget response spectrum
JSXQ 3#
600
400
200
00 1 2 3 4 Period
Acc
eler
atio
n re
spon
se S
a (cm
/s2 ) RSN 88
RSN 300RSN 1046Mean response spectrumTarget response spectrum
XYY A#600
400
200
00 1 2 3 4 Period
Acc
eler
atio
n re
spon
se S
a (cm
/s2 ) RSN 140
RSN 300RSN 906Mean response spectrumTarget response spectrum
(b)

No. 1 Zhou Yun et al.: Eff ect of an infi ll wall on linear and nonlinear seismic performance of high-rise buildings 99
6.2 Inter-story shear force
Figure 18 shows the shear force distribution of the column, shear wall, and infi ll wall. The global structural stiff ness was strengthened by the infi ll wall in Model 5, which increased the inter-story shear force up to 30% to 50%. In Model 4 of BAYG 2#, the inter-story shear force was mainly resisted by the shear wall. On the other hand, the infi ll wall in Model 5 resisted a large amount of shear force according to the calculation results, which may cause the fi rst shear failure in the infi ll wall. In the other three shear wall structures, the contribution of the infi ll wall to the shear resistance was less than that of BAYG 2#. This is because of the specifi c arrangement of the infi ll wall or the diff erent structure system used.
6.3 Inter-story drift
Figure 19 shows the story drift of Model 4 and Model 5. Model 5 exhibits 20% to 50% lower story drift due to the contribution of the infi ll wall to the lateral stiff ness. Note that the contribution of the infi ll wall to the stiff ness of the frame-shear wall structure is greater than that of the shear wall structures under large earthquakes.
Figure 20 shows the inter-story drift ratio of Model 4 and Model 5. The drift ratio increases and then decreases from the bottom story to roof story. The maximum inter-story drift ratio occurred at the lower story as the global structural stiff ness was increased by the infi ll wall,
and 20% to 50% lower drift ratios were presented in Model 5. The discrepancy of the inter-story drift ratio between the two models for BAYG 2# (i.e., frame-shear wall structure) was greater than that of the other three buildings (i.e., shear wall structure). The inter-story drift ratio of the frame-shear wall structure was less than 0.005 rad, and the ratio of the shear wall structures was less than 0.0025 rad, which satisfi ed the Chinese design code requirement of 0.01 rad and 0.0083 rad for the frame-shear wall structure and shear wall structure, respectively.
6.4 Seismic energy dissipation
Figure 21 shows the mean energy dissipation estimated by Model 4 and Model 5 for nonlinear behavior of the structures under three selected seismic waves. Compared with Model 4, the enhancement of the structural stiff ness by the infi ll wall in Model 5 increased the energy dissipation of the structures. Regarding the dissipated energy distribution of the structural components, a large amount of seismic energy was dissipated by the fl exural behavior of beams of BAYG 2# in Model 4. However, the contribution of the beams to the energy dissipation was signifi cantly decreased, and the infi ll wall contribution increased in Model 5 with the infi ll wall. Similar to the previous analysis results, the infi ll wall dissipated most of the earthquake energy. This result indicates that the infi ll wall is a more critical
30
20
10
00 5000 10000 Inter-story shear force (kN)
Global structure (Model 4)Global structure (Model 5)Column (Model 4)Column (Model 5)Shear wall (Model 4)Shear wall (Model 5)Infi lled wall (Model 5)
(a)
BAYG 2#
(c) (d)
SHHM 2#
Fig. 18 Shear force distribution of buildings under large earthquakes: (a) BAYG 2#; (b) JSXQ 3#; (c) XYY A#; (d) SHHM 2#
50
40
30
20
10
0
JSXQ 3#
XYY A#
(b)
Stor
y (n
)
Stor
y (n
)
Global structure (Model 4)Global structure (Model 5)Shear wall (Model 5)Infi lled wall (Model 5)
0 5000 10000 15000 20000 Inter-story shear force (kN)
30
20
10
0
Stor
y (n
)
40
30
20
10
0
Stor
y (n
)
Global structure (Model 4)Global structure (Model 5)Shear wall (Model 5)Infi lled wall (Model 5)
Global structure (Model 4)Global structure (Model 5)Shear wall (Model 5)Infi lled wall (Model 5)
0 5000 10000 15000 Inter-story shear force (kN)
0 5000 10000 15000 Inter-story shear force (kN)

100 EARTHQUAKE ENGINEERING AND ENGINEERING VIBRATION Vol. 19
30
20
10
00 200 400 600 Inter-story drift (mm)
(a)
BAYG 2#
(c) (d)
SHHM 2#
Fig. 19 Story drift of buildings under large earthquakes: (a) BAYG 2#; (b) JSXQ 3#; (c) XYY A#; (d) SHHM 2#
50
40
30
20
10
0
JSXQ 3#
XYY A#
(b)
Stor
y (n
)
Stor
y (n
)
0 100 200 300 400 Inter-story drift (mm)
30
20
10
0
Stor
y (n
)
40
30
20
10
0
Stor
y (n
)
Model 4 results (RSN 66)Model 4 results (RSN 300)Model 4 results (RSN 906)Model 5 results (RSN 66)Model 5 results (RSN 300)Model 5 results (RSN 906)Model 4 mean resultsModel 5 mean results
Model 4 results (RSN 304)Model 4 results (RSN 921)Model 4 results (RSN 937)Model 5 results (RSN 304)Model 5 results (RSN 921)Model 5 results (RSN 937)Model 4 mean resultsModel 5 mean results
0 100 200 Inter-story drift (mm)
Model 4 results (RSN 88)Model 4 results (RSN 300)Model 4 results (RSN 1046)Model 5 results (RSN 88)Model 5 results (RSN 300)Model 5 results (RSN 1046)Model 4 mean resultsModel 5 mean results
Model 4 results (RSN 140)Model 4 results (RSN 300)Model 4 results (RSN 906)Model 5 results (RSN 140)Model 5 results (RSN 300)Model 5 results (RSN 906)Model 4 mean resultsModel 5 mean results
0 100 200 300 Inter-story drift (mm)
30
20
10
00 0.002 0.004 0.006 Inter-story drift ratio (rad)
(a)
BAYG 2#
(c) (d)
SHHM 2#
Fig. 20 Inter-story drift ratio under large earthquakes: (a) BAYG 2#; (b) JSXQ 3#; (c) XYY A#; (d) SHHM 2#
50
40
30
20
10
0
JSXQ 3#
XYY A#
(b)
Stor
y (n
)
Stor
y (n
)
30
20
10
0
Stor
y (n
)
40
30
20
10
0
Stor
y (n
)
Model 4 (RSN 66)Model 4 (RSN 300)Model 4 (RSN 906)Model 5 (RSN 66)Model 5 (RSN 300)Model 5 (RSN 906)Model 4 mean resultsModel 5 mean resultsMaximum results14th story
8th story
0 0.002 0.004 Inter-story drift ratio (rad)
28th story
22th story
Model 4 (RSN 304)Model 4 (RSN 921)Model 4 (RSN 937)Model 5 (RSN 304)Model 5 (RSN 921)Model 5 (RSN 937)Model 4 mean resultsModel 5 mean resultsMaximum results
0 0.001 0.002 0.003 Inter-story drift ratio (rad)
Model 4 (RSN 88)Model 4 (RSN 300)Model 4 (RSN 1046)Model 5 (RSN 88)Model 5 (RSN 300)Model 5 (RSN 1046)Model 4 mean resultsModel 5 mean resultsMaximum results
Model 4 (RSN 140)Model 4 (RSN 300)Model 4 (RSN 906)Model 5 (RSN 140)Model 5 (RSN 300)Model 5 (RSN 906)Model 4 mean resultsModel 5 mean resultsMaximum results
0 0.002 0.004 Inter-story drift ratio (rad)
11th story 11th story11th story
5th story

No. 1 Zhou Yun et al.: Eff ect of an infi ll wall on linear and nonlinear seismic performance of high-rise buildings 101
member than the other structural m embers including the beam, column, and shear wall.
Although the FE model of high-rise buildings is calibrated by the natural modal parameters in the linear elastic stage, the nonlinear behavior can be changed, which may diff er from the actual situation as a complex process for model calibration is required. Further, the eff ects of torsion and eccentricity on the structural behavior should be taken into account for the asymmetric structural fl oor plan condition. An innovative ideology was simply introduced in this study, but further research on nonlinear performance is needed for deeper analysis.
7 Conclusions
In the present study, linear and nonlinear dynamic seismic assessments of high-rise buildings were performed to consider the eff ect of infi ll walls. Based on the St-Id ide ology, FE models with crossed diagonal struts were built in SAP2000 and PERFORM-3D, and the design parameters of the infi ll wall were calibrated by comparing the modal periods with the measurements from ambient vibration tests. Two refi ned FE models were employed to evaluate the seismic performance of the structures: response spectrum analysis under small
earthquakes and nonlinear dynamic analysis under large earthquakes. The main conclusions are as follows:
(1) When the contribution of the infi ll wall to the stiff ness is not considered, a large discrepancy of the modal periods between the calculated results of PKPM and measured values was observed. To consider the eff ect of infi ll walls in static analysis, the crossed diagonal struts were used in FE models of SAP2000 for four high-rise buildings. The structural dynamic characteristics obtained from ambient vibration tests were applied to calibrate the FE model, and the updated models better predicted the modal periods.
(2) Response spectrum analysis was performed by the calibrated SAP2000 model and PKPM model to evaluate the elastic seismic performance of the structures under small earthquakes. The analysis results showed that compared with the predictions made by the calibrated model of SAP2000, the PKPM model estimated an approximately 50% lower inter-story shear force and 3 to 4 times greater story drift and drift ratio. Thus, the period reduction factor of design codes could be revised to better evaluate the structural performance in the elastic state.
(3) On the basis of the initial elastic modulus calibrated using the periods measured from the actual buildings, the envelope curve with nonlinear
Fig. 21 Comparison of diff erent members under large earthquakes: (a) BAYG 2#; (b) JSXQ 3#; (c) XYY A#; (d) SHHM 2#
14
12
10
8
6
4
2
0
Ener
gy d
issi
patio
n (×
108
N. m
m)
BAYG 2#
Model 4 Model 5
ColumnShear wallInfi ll wallBeamTotal energy
Structural component
35
30
25
20
15
10
5
0
JSXQ 3#
Model 4 Model 5
Shear wallInfi ll wallBeamTotal energy
Structural component
XYY A#
Model 4 Model 5
Shear wallInfi ll wallBeamTotal energy
Structural component
16
14
12
10
8
6
4
2
0
SHHM 2#
Model 4 Model 5
Shear wallInfi ll wallBeamTotal energy
Structural component
(a) (b)
(c) (d)
Ener
gy d
issi
patio
n (×
108
N. m
m)
Ener
gy d
issi
patio
n (×
108
N. m
m)
Ener
gy d
issi
patio
n (×
108
N. m
m)
14
12
10
8
6
4
2
0

characteristics of infi ll wall was calculated by the detailed constitutive relationship formulas with the proper elastic modulus. For nonlinear dynamic analysis, the diagonal strut model to describe the eff ect of infi ll walls was applied to PERFORM-3D.
(4) Nine earthquake records were selected for nonlinear dynamic analysis of the four high-rise buildings with or without infi ll walls. The analysis results showed that the maximum inter-story drift ratio of the buildings satisfi ed the requirement of the design codes. Infi ll walls signifi cantly contributed to increasing the global lateral stiff ness to 30% to 50%, which decreased the inter-story drift ratio to 20% to 50%. Note that the eff ect of infi ll walls on the shear demand and drift ratio is signifi cant in the frame-shear wall structure, rather than the shear wall structure.
(5) The use of infi ll walls increased the energy dissipation capacity in both the frame-shear wall structure and shear wall structure. The contribution of the beam to the energy dissipation decreased, and the contribution of infi ll walls to energy dissipation increased.
Acknowledgement
The authors sincerely appreciate the funding support provided to this research by the National Key Research and Development Program of China (No. 2016YFC0701400, 2016YFC0701308), the Key Research and Development Program of Hunan Province (No. 2017SK2220), and the National Natural Science Foundation of China (NSFC) (No. 51878264).
References
ASCE (2006), Minimum Design Loads for Buildings and Other Structures, Reston, VA.ASCE (2011), Structural Identifi cation of Constructed Systems: A State-of-the-art Report, ASCE-SEI Structural Identifi cation of Constructed Systems Committee, Reston, VA.Asteris PG, Antoniou ST, Sophianopoulos DS and Chrysostomou CZ (2011), “Mathematical Macromodeling of Infi lled Frames: State of the Art,” Journal of Structural Engineering, 137(12): 1508–1517.Asteris PG, Cotsovos DM, Chrysostomou CZ, Mohebkhah A and Al-Chaar GK (2013), “Mathematical Micromodeling of Infi lled Frames: State of the Art,” Engineering Structures, 56(12): 1905‒1921.Ashok E, Dinesh SV and Dattatreya JK (2015), “Seismic Vulnerability Assessment and Comparison of RC Buildings with and without Infi ll Using Pushover Analysis,” Journal of Civil Engineering and Environment Technology, 2(11): 7‒11.Al-Nimry H, Resheidat M and Qeran S (2015), “Rapid Assessment for Seismic Vulnerability of Low and Medium Rise Infi lled RC Frame Buildings,” Earthquake
Engineering and Engineering Vibration, 14(2): 275‒293.Almeida JP, Tarquini D and Beyer K (2016), “Modelling Approaches for Inelastic Behaviour of RC Walls: Multi-level Assessment and Dependability of Results,” Archives of Computational Methods in Engineering, 23(1): 69‒100.Abhijeet VC and Vaibhav VS (2017), “Pushover Analysis of High Rise Building and Outrigger System with or without In-fi lled Walls,” International Research Journal of Engineering and Technology, 4(7): 1439‒1445.Balendra T and Huang X (2003), “Overstrength and Ductility Factors for Steel Frames Designed According to BS 5950,” Journal of Structural Engineering, 129(8): 1019‒1035.Brownjohn JM (2003), “Ambient Vibration Studies for System Identifi cation of Tall Buildings,” Earthquake Engineering & Structural Dynamics, 32(1): 71‒95.Brownjohn JMW and Pan TC (2008), “Identifying Loading and Response Mechanisms from Ten Years of Performance Monitoring of A Tall Building,” Journal of Performance of Constructed Facilities, 22(1): 24‒34.Burak B and Comlekoglu HG (2013), “Eff ect of Shear Wall Area to Floor Area Ratio on the Seismic Behavior of Reinforced Concrete Buildings,” Journal of Structural Engineering, 139(11): 1928‒1937.Carvalho EC and Coelho E (2001), “Seismic Assessment, Strengthening and Repair of Structures,” Ecoest2-Icons Report, 2: 3‒9.Catbas FN, Kijewski-Correa T and Aktan AE (2013), “Structural Identifi cation of Constructed Systems: Approaches, Methods, and Technologies for Eff ective Practice of St-Id,” American Society of Civil Engineers (ASCE), Structural Engineering Institute (SEI).Chaulagain H, Rodrigues H, Spacone E and Varum H (2016), “Seismic Safety Assessment of Existing Masonry Infi ll Structures in Nepal,” Earthquake Engineering and Engineering Vibration, 15(2): 251‒268.Dhakal RP, Pourali A, Tasligedik AS, Yeow T, Baird A, MacRae G, Pampanin S and Palermo A (2016), “Seismic Performance of Nonstructural Components and Contents in Buildings: an Overview of NZ Research,” Earthquake Engineering and Engineering Vibration, 15(1): 1‒17.Dolsek M and Fajfar P (2008), “The Eff ect of Masonry Infi lls on the Seismic Response of A Four Storey Reinforced Concrete Frame: A Probabilistic Assessment,” Engineering Structures, 30(7): 1991‒2001.Euro pean Committee for Standardization (2004), Design of structures for earthquake resistance, Eurocode 8, CEN, Brussels, Belgium.Epackachi S, Mirghaderi R and Esmaili O (2012), “Seismic Evaluation of A 56-story Residential Reinforced Concrete High-rise Building Based on Nonlinear Dynamic Time History Analysis,” Structural Design of Tall & Special Buildings, 21(4): 233‒248.FEMA 274 (1997), NEHRP Commentary on the NEHRP
102 EARTHQUAKE ENGINEERING AND ENGINEERING VIBRATION Vol. 19

Guidelines for the Seismic Rehabilitation of Buildings, Federal Emergency Management Agency, Washington.Fardis MN and Panagiotakos TB (1997), “Seismic Design and Response of Bare and Masonry-infi lled Reinforced Concrete Buildings, Part ii: Infi lled Structures,” Journal of Earthquake Engineering, 1(1): 219‒256.FEMA 306 (1999), Evaluation of Earthquake Damaged Concrete and Masonry Wall Buildings: Basic Procedures Manual, Federal Emergency Management Agency, Washington.Furtado A, Rodrigues H and Arede A (2015), “Modelling of Masonry Infi ll Walls Participation in the Seismic Behaviour of RC Buildings Using Opensees,” International Journal of Advanced Structural Engineering, 7(2): 117‒127.GB 50011-2010 (2010), Code for Seismic Design of Buildings, Beijing: China Architecture and Building Press.Holmes M (1961), “Steel Frames with Brickwork and Concrete Infi lling,” Proceedings of the Institution of Civil Engineers, 19(4): 473‒478.Henderson RC, Fricke KE, Jones WD, Beavers JE and Bennett RM (2003), “Summary of A Large- and Small-scale Unreinforced Masonry Infi ll Test Program,” Journal of Structural Engineering, 129(12):1667‒1675.Hashmi AK and Madan A (2008), “Damage Forecast for Masonry Infi lled Reinforced Concrete Framed Buildings Subjected to Earthquakes in India,” Current Science, 94(1): 61‒73.Hans S, Boutin C, Ibraim E and Roussillon P (2010), “In Situ Experiments and Seismic Analysis of Existing Buildings. Part I: Experimental Investigations,” Earthquake Engineering & Structural Dynamics, 34(12): 1531‒1546.JGJ 3-2010 (2010), Technical Specifi cation for Concrete Structures of Tall Building, Beijing: China Architecture and Building Press.Kose MM and Karslioglu O (2010), “Eff ects of Infi lls on High-rise Buildings: A Case Study,” Structural Design of Tall & Special Buildings, 18(8): 907‒920.Kaushik HB, Rai DC and Jain SK (2012), “Code Approaches to Seismic Design of Masonry-Infi lled Reinforced Concrete Frames: A State-of-the-Art Review,” Earthquake Spectra, 22(4): 961‒983.Liu SC and Yao JTP (1978), “Structural Identifi cation Concept,” Journal of the Structural Division, 104(12): 1845‒1858.Li QS and Wu JR (2004), “Full-Scale Measurements and Numerical Evaluation of Wind-induced Vibration of A 63-story Reinforced Concrete Tall Building,” Engineering Structures, 26(12): 1779‒1794.Li QS, Wu JR, Liang SG, Xiao YQ and Wong CK (2004), “Correlation of Dynamic Characteristics of A Super-Tall Building from Full-Scale Measurements and Numerical Analysis with Various Finite Element
Models,” Earthquake Engineering & Structural Dynamics, 33(14): 1311‒1336.Lu HS, Zhao FX (2007), “Site Coeffi cients Suitable to China Site Category,” Acta Seismologica Sinica, 29(1): 67‒76.Luis DD, Laura L and F abrizio M (2014), “Strength and Stiff ness Reduction Factors for Infi lled Frames with Openings,” Earthquake Engineering and Engineering Vibration, 13(3): 437‒454.Li QS, Zhi LH, Tuan YT, Kao CS and Su SC (2010), “Full-scale Measurements and Analysis of Wind-induced Response of Taipei-101 Tower,” Journal of Building Structures, 31(3): 24‒31.Mamun AA and Saatcioglu M (2017), “Seismic Performance Evaluation of Moderately Ductile RC Frame Structures Using Perform-3d,” 16th World Conference on Earthquake Engineering, Santiago Chile.Mainstone RJ (1971), “Summary of Paper 7360, On the Stiff ness and Strengths of Infi lled Frames,” Ice Proceedings, 49(2): 230.Manzouri T (1995), “Nonlinear Finite Element Analysis and Experimental Evaluation of Retrofi tting Techniques for Unreinforced Masonry Structures,” University of Colorado-Boulder, USA.Milheiro J, Rodrigues H and Arede Antonio (2016), “Evaluation of the Contribution of Masonry Infi ll Panels on the Seismic Behaviour of Two Existing Reinforced Concrete Buildings,” KSCE Journal of Civil Engineering, 20(4): 1365‒1374.Mwafy A, Elnashai A, Sigbjornsson R and Salama A (2006), “Signifi cance of Severe Distant and Moderate Close Earthquakes on Design and Behavior of Tall Buildings,” Structural Design of Tall & Special Buildings, 15(4): 391‒416.Negro P and Colombo A (1997), “Irregularities Induced by Nonstructural Masonry Panels in Framed Buildings,” Engineering Structures, 19(7): 576‒585.NRCC (2005), National Building Code of Canada.Nautiyal P, Singh S, Batham G and Publication I (2013), “A Comparative Study of the Eff ect of Infi ll Walls on Seismic Performance of Reinforced Concrete Buildings,” International Journal of Civil Engineering & Technology, 4(4): 208‒218.Nwofor TC and Chinwah JG (2014), “Finite Element Mode ling of Shear Strength of Infi lled Frames with Openings,” International Journal of Engineering & Technology, 2(6): 992‒1001.Pacifi c Earthquake Engineering Research Center, http://ngawest2. berkeley.edu.Paulay T and Priestley MJN (1992), Seismic Design of Reinforced Concrete and Masonry Buildings, Wiley.Polyakov SV (1960), “On the Interaction between Masonry Filler Walls and Enclosing Frame when Loaded in the Plane of the Wall,” Translations in Earthquake Engineering, 2(3): 36‒42.
No. 1 Zhou Yun et al.: Eff ect of an infi ll wall on linear and nonlinear seismic performance of high-rise buildings 103

Peeters B (2000), “System Identifi cation and Damage Detection in Civil Engineering,” System Identifi cation and Damage Detection in Civil Engineering, Katholieke University, Leuven, Belgium.Smith BS (1962), “Lateral Stiff ness of Infi lled Frames,” Journal of the Structural Division, 88(6): 183‒226.Su RKL, Chandler AM, Sheikh MN and Lam NTK (2005), “Infl uence of Nonstructural Components on Lateral Stiff ness of Tall Buildings,” Structural Design of Tall & Special Buildings, 14(2): 143‒164.Shing PB, Stavridis A, Koutromanos I, Willam K, Blackard B, Kyriakides MA and Arnold S (2009), “Seismic Performance of Non-Ductile RC Frames with Brick Infi ll,” ATC and SEI Conference on Improving the Seismic Performance of Existing Buildings and Other Structures, 1117‒1128.Sanada Y and Konishi D (2011), “Eff ects of Nonstructural Brick Infi lls on An Indonesian Earthquake-Damaged Building,” Procedia Engineering, 14: 2077‒2085.Su RKL and Lee CL (2013), “Development of Seismic Fragility Curves for Low-Rise Masonry Infi lled Reinforced Concrete Buildings by a Coeffi cient-Based Method,” Earthquake Engineering and Engineering Vibration, 12(2): 319‒332.Tan DX, Zhou Y, Mi ST, Yi WJ, Xie LM and Jiang YZ (2015), “Ambient Vibration Dynamic Test and Finite Element Analysis for High-Rise Buildings,” China Civil
Engineering Journal, 48(9): 40‒50. (in Chinese)Wu X (2012), “Model Transformation from NosaCAD to ABAQUS and PERFORM-3D and Nonlinear Structure Analysis by These Software,” Building Structure, 42(S2): 207‒212. (in Chinese)Wu XH, Sun FT, Lu XL and Qian J (2014), “Nonlinear Time History Analysis of China Pavilion for Expo 2010 Shanghai China,” Structural Design of Tall & Special Buildings, 23(10): 721‒739.Xu YL, Chen SW and Zhang RC (2003), “Modal Identifi cation of Di Wang Building under Typhoon York Using the Hilbert-Huang Transform Method,” Structural Design of Tall & Special Buildings, 12(1): 21‒47.Zarnic R and Gostic S (1998), “Non-linear Modelling of Masonry Infi lled Frames,” Proceedings of 11th European Conference on Earthquake Engineering, Paris.Zhang CQ, Zhou Y, Zhou DY and Lu XL (2011), “Study on the Eff ect of the Infi ll Walls on the Seismic Performance of a Reinforced Concrete Frame,” Earthquake Engineering and Engineering Vibration, 10(4): 507‒517.Zhou Y, Zhou Y, Yi WJ, Tan DX and Mi ST (2017), “Operational Modal Analysis and Rational Finite-Element Model Selection for Ten High-Rise Buildings Based on On-Site Ambient Vibration Measurements,” Journal of Performance of Constructed Facilities, 31(5): 04017043.
104 EARTHQUAKE ENGINEERING AND ENGINEERING VIBRATION Vol. 19