field investigation on rilling in the experimental sparacia area, south italy
TRANSCRIPT

Field investigation on rilling 263
Copyright © 2007 John Wiley & Sons, Ltd. Earth Surf. Process. Landforms 33, 263–279 (2008)DOI: 10.1002/esp
Earth Surface Processes and LandformsEarth Surf. Process. Landforms 33, 263–279 (2008)Published online 11 July 2007 in Wiley InterScience(www.interscience.wiley.com) DOI: 10.1002/esp.1544
Field investigation on rilling in the experimentalSparacia area, South ItalyCarmelo Bruno, Costanza Di Stefano and Vito Ferro*Dipartimento ITAF, Università degli Studi di Palermo, Viale delle Scienze, Palermo, Italy
AbstractIn this paper the results of a field investigation on rilling carried out in the experimentalSparacia area are reported.
The measurements were made on a plot 6 m wide and 22 m long subjected to naturalrainfalls. For ten rainfalls the total soil loss (interrill and rill erosion) was collected in astorage system consisting of two tanks arranged in series at the base of the plot. Rillmorphology (rill length and cross-sections) was measured for five rainfall events, while therill profile was surveyed for three events.
First the contribution of each component (rill and interrill erosion) to total soil loss wasestablished. Then the analysis allowed establishment of a power relationship between the rilllength and the rill volume. Finally, for three events detailed information on rill erosion andrill morphology allowed verification of the applicability of WEPP and estimation of the rillerodibility constant. Copyright © 2007 John Wiley & Sons, Ltd.
Keywords: soil erosion; rill characteristics; rill and interrill erosion rates; rill erodibility;WEPP model
*Correspondence to: Vito Ferro,Dipartimento ITAF, Universitàdegli Studi di Palermo, Viale delleScienze, 90128 Palermo, Italy.E-mail: [email protected]
Received 14 February 2007;Revised 28 April 2007;Accepted 12 May 2007
Introduction
During severe rainfall events, overland flow concentrates, causing rill development and high erosion rates. The rillcomponent of the erosion process is due to the channelized transport of the sediment particles both detached from theinterrill areas and scoured from the rill wetted perimeter (Foster, 1982; Nearing et al., 1997).
Although the knowledge of soil erosion mechanisms and dynamics has increased, and many empirical (Renardet al., 1997) and process-oriented (Nearing et al., 1989) models were developed, rill research is still limited.
Most available experimental rill research, carried out both in laboratory (Bryan and Poesen, 1989; Brunton andBryan, 2000; Gilley et al., 1990; Huang et al., 1996; Mancilla et al., 2005) and field conditions (De Santisteban et al.,2005, Helming et al., 1999; Rejman and Brodowski, 2005), was carried out using soil with different texture andnatural and simulated rainfalls. The aim of this available research was to observe rill network formation (Mancilla etal., 2005), to define the initial condition for rilling (Bryan et al., 1998; Govers and Poesen, 1988; Slattery and Bryan,1992; Torri et al., 1987), to study the development of rill head morphology (Brunton and Bryan, 2000), to estimatethe main hydraulic variables (cross-section area, wetted perimeter, hydraulic radius, mean velocity, shear stress)(Foster et al., 1984; Gilley et al., 1990; Gimenéz et al., 2004; Govers, 1992) and to propose mathematical modelsfor estimating soil loss due to rill erosion (Foster, 1982; Nearing et al., 1989).
Following the Horton point of view, the initial development of a rill is linked to some hydraulic characteristics ofthe channelized flow such as the mean velocity (Slattery and Bryan, 1992), the Froude number (Savat and De Ploey,1982) and the bottom shear stress (Torri et al., 1987). Rill formation is controlled both by the overtaking of the criticalvalue of the selected hydraulic variable (as an example, when the actual flow velocity is greater than the minimumvalue, named critical, for starting rill formation) and to the rilling resistance of the soil covering the hillslope.
From a morphological point of view the rill evolution is due to its upstream headcut migration and channel incision.The rill head, which assumes a morphological feature ranging from a knickpoint and a sloping plane, is an areasubjected to intense soil erosion phenomena controlled by soil erodibility, slope of the contributing area upstream ofthe headcut and flow discharge (Meyer et al., 1975; Foster, 1982).

264 C. Bruno, C. Di Stefano and V. Ferro
Copyright © 2007 John Wiley & Sons, Ltd. Earth Surf. Process. Landforms 33, 263–279 (2008)DOI: 10.1002/esp
Figure 1. Development of a rill network according to Brunton and Bryan (2000).
Figure 1 shows the shear-velocity-based model of rill network development proposed by Brunton and Bryan (2000).When shear velocity of the main flow exceeds the threshold value a channel incision occurs (Figure 1(b)). As theinitial knickpoint migrates upslope, reducing the channel thalweg slope, the local base level for the side slope islowered and the effective side slope is increased (Figure 1(c)). Shear velocity in tributary areas exceeds thresholdvalue due to increased local slope. Headcut incision in the main channel and in tributaries continues to migrateupslope (Figure 1(d)). Rill incision starts because, for a given slope channel i, the maximum value of the shear stressoccurs at the channel axis (Ferro, 2006; Graf, 1984).
Rills generally have an irregular cross-section shape and the mean velocity, the water depth and the bottom shearstress assume different values along the rill path (Abrahams et al., 1996; Foster et al., 1984; Govers, 1992).
If the particle detachment into the rill is assumed to be due to the shear stress along the rill perimeter (Foster andMeyer, 1975), the rill detachment rate can be evaluated using equations similar to the ones used for the river flowcase. As an example, the WEPP model estimates the maximum rill detachment rate Dr (detachment capacity) using themodified sediment transport equation of DuBoys and O’Brien (Graf, 1984; Bagarello and Ferro, 1999):
Dr = Kr(τ − τc)m (1)
in which Kr is the rill erodibility parameter, lumping the effects of different factors such as grain size distribution, rockfragment cover, soil structure and its stability, τ is the bottom shear stress, τc is its threshold value and m is a constant(Foster et al., 1984).
The uncertainties and difficulties of physically based models, due to both the equations used and the estimatecriteria of the numerous input parameters, have stimulated different authors to propose simple schemes for estimatingchannelized erosion (rill and ephemeral gully erosion).
Nachtergaele et al. (2001), using a data set of 58 ephemeral gullies in the Belgian loess-derived soils, proposed thissimple equation for estimating the total eroded volume V expressed in m3:
V = a Lb (2)
in which L is the total length (m) of the ephemeral gully and a and b are two numerical coefficients equal to,respectively, 0·048 and 1·29.
According to Capra et al. (2005), channelized flow produces two different actions: first the deepening of the rillor ephemeral gully channel occurs and then the lengthening of the hydraulic path and the widening of the rill

Field investigation on rilling 265
Copyright © 2007 John Wiley & Sons, Ltd. Earth Surf. Process. Landforms 33, 263–279 (2008)DOI: 10.1002/esp
Figure 2. Relationship between length and eroded volume for ephemeral gully measurements.
cross-section prevails. Capra et al. (2005), comparing different topographic indices, showed that the total channellength is the best estimator of the erosion volume and verified that Equation (2), with a = 0·034 and b = 1·42, can beused to estimate the ephemeral gully erosion in Sicily.
Rejman and Brodowski (2005) carried out some rill surveys on plots of different lengths (20, 10, 5 and 2·5 m),located on a uniform slope of 12%. Rills were monitored during three consecutive rainfall events. Relationship (2) canbe applied, using a total length L equal to the plot length, with a = 0·0182 and b = 0·9516.
Casalì et al. (1999) carried out a field study, during the period October 1994–September 1997, to monitor theappearance and the evolution of ephemeral gullies in southern Navarra (Spain).
Figure 2 shows that Equation (2), with a = 0·071 and b = 1·1237, can be used to represent the ephemeral gullymeasurements carried out by Casalì et al. (1999), Nachtergaele et al. (2001) and Capra et al. (2005).
The analysis of previous studies suggested that research is required to develop models using simple input variables,such as rill length, which are useful to estimate the severity of rilling in a given region. Improvements of bothequations used in physically based models of rill erosion and parameter estimates, such as rill erodibility, are required.
Finally, taking into account that more efforts have been employed to model interrill erosion than rill erosion, therelevance of rill phenomena should be tested.
In this paper the results of a field investigation on rilling carried out at the experimental Sparacia area, in SouthItaly, are reported. At first, the contribution of each component (rill and interrill erosion) to total soil loss is estab-lished. Then, applying the dimensional analysis and the self-similarity theory, a power relationship between the rilllength and rill volume is deduced. Finally, using detailed information on rill erosion obtained by three natural rainfallevents, the applicability of the WEPP scheme is verified.
Experimental Lay-out and Measurement Technique
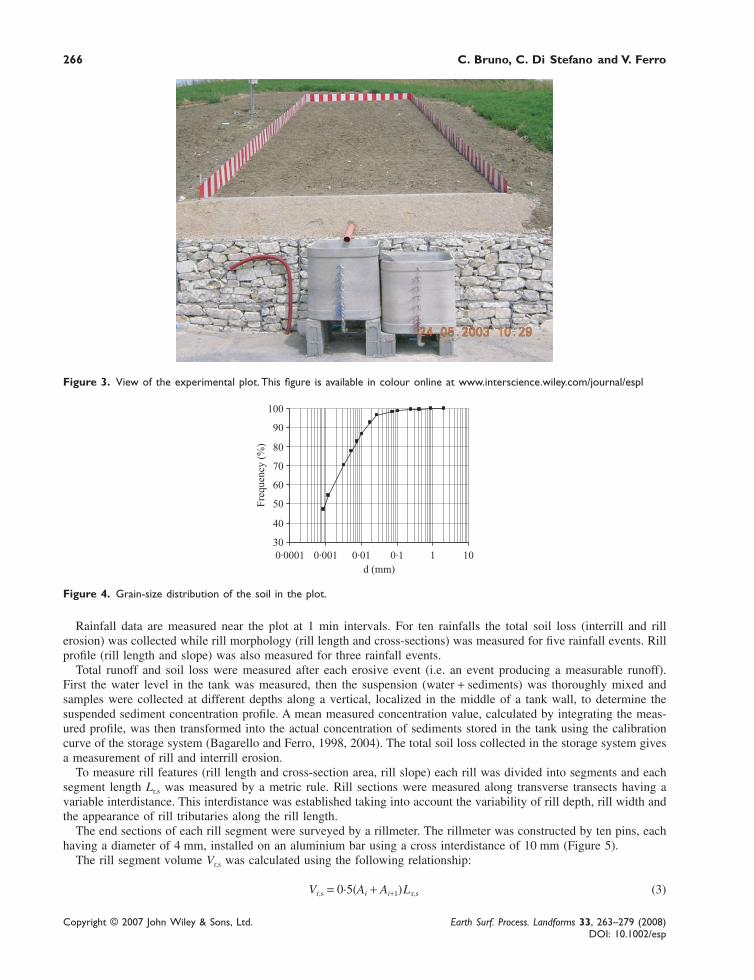
The experimental station for soil erosion measurement, ‘Sparacia’, of the Agricultural Faculty of the PalermoUniversity is located in western Sicily, South Italy, approximately 100 km south of Palermo (Bagarello and Ferro,2004). The rill measurements are made in a bounded plot 6·0 m wide and 22·0 m long and having a uniform 22·0%slope (Figure 3) subjected to natural rainfall.
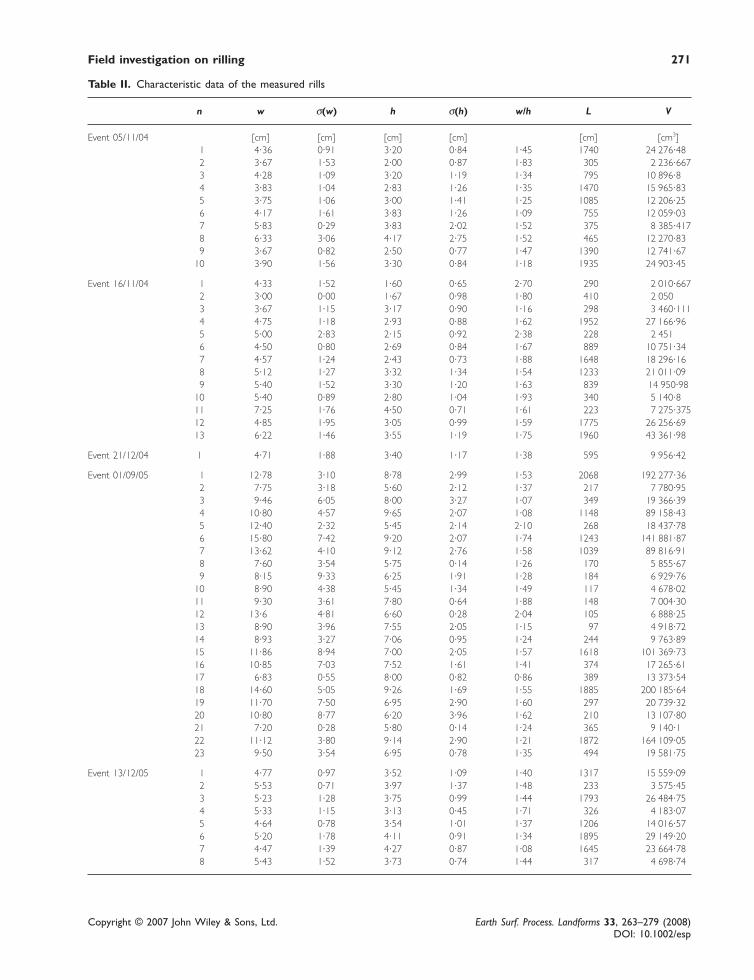
The area has a typical Mediterranean semi-arid climate, with an average annual rainfall of 700 mm. The soil is avertic with a clay texture (Figure 4) and a negligible gravel content. The depth of the A horizon is approximately0·30 m. The vertic character of the soil does not affect the rill measurement accuracy, as the measurements of rillgeometry are made at the end of the rainfall event and before the soil develops a polygonal pattern of surfaceshrinkage cracks due to soil drying.
266 C. Bruno, C. Di Stefano and V. Ferro
Copyright © 2007 John Wiley & Sons, Ltd. Earth Surf. Process. Landforms 33, 263–279 (2008)DOI: 10.1002/esp
Figure 3. View of the experimental plot. This figure is available in colour online at www.interscience.wiley.com/journal/espl
Rainfall data are measured near the plot at 1 min intervals. For ten rainfalls the total soil loss (interrill and rillerosion) was collected while rill morphology (rill length and cross-sections) was measured for five rainfall events. Rillprofile (rill length and slope) was also measured for three rainfall events.
Total runoff and soil loss were measured after each erosive event (i.e. an event producing a measurable runoff).First the water level in the tank was measured, then the suspension (water + sediments) was thoroughly mixed andsamples were collected at different depths along a vertical, localized in the middle of a tank wall, to determine thesuspended sediment concentration profile. A mean measured concentration value, calculated by integrating the meas-ured profile, was then transformed into the actual concentration of sediments stored in the tank using the calibrationcurve of the storage system (Bagarello and Ferro, 1998, 2004). The total soil loss collected in the storage system givesa measurement of rill and interrill erosion.
To measure rill features (rill length and cross-section area, rill slope) each rill was divided into segments and eachsegment length Lr,s was measured by a metric rule. Rill sections were measured along transverse transects having avariable interdistance. This interdistance was established taking into account the variability of rill depth, rill width andthe appearance of rill tributaries along the rill length.
The end sections of each rill segment were surveyed by a rillmeter. The rillmeter was constructed by ten pins, eachhaving a diameter of 4 mm, installed on an aluminium bar using a cross interdistance of 10 mm (Figure 5).
The rill segment volume Vr,s was calculated using the following relationship:
Vr,s = 0·5(Ai + Ai+1)L r,s (3)
Figure 4. Grain-size distribution of the soil in the plot.

Field investigation on rilling 267
Copyright © 2007 John Wiley & Sons, Ltd. Earth Surf. Process. Landforms 33, 263–279 (2008)DOI: 10.1002/esp
Figure 5. Rillmeter used for measuring the cross-sections. This figure is available in colour online at www.interscience.wiley.com/journal/espl
in which Ai is the initial cross-section area of the rill segment and Ai+1 is the final cross-section. The total volume V ofa rill is calculated by adding the volumes Vr,s of all segments into which the rill is divided.
To determine the weight of soil corresponding to the total rill volume, the soil bulk density was experimentallydetermined by sampling soil samples uniformly distributed on the erosion plot. The sampling was carried out usingcylindric samplers (Bryan et al., 1998), having a diameter of 8 cm and a height equal to 5 cm, which were oven-driedat 105 °C for 48 hours. A first sampling was carried out at the start of the experiments (denoted 2004 sampling inFigure 6(a)) and the mean soil bulk density value, equal to 1577 kg m−3, was applied for all events monitored in 2004.The high values of the bulk density registered at the beginning of the experiment (2004) may be due to the rearrange-ment of the soil surface to obtain a uniform slope, carried out at the end of the plot equipment construction.
A second sampling was carried out in February 2005 (denoted 2005 sampling in Figure 6(a)) and the mean soil bulkdensity value, equal to 1221 kg m−3, was applied for all events monitored in 2005. The third sampling (denoted 2007sampling in Figure 6(b)), which was carried out in January 2007, gives a bulk density frequency distribution, which isoverlaid on the 2005 distribution. In other words, Figure 6(b) demonstrates that bulk density frequency distribution didnot change in the measurement period 3 March 2005–28 February 2006, and bulk density assumes values typical fora clay soil.
After each erosive event the plan of the rill network was deduced by a photographic relief (Figure 7) correctedusing the transverse and longitudinal bands painted on the plot boundaries. Figure 8 shows, as an example for theevent of 5 November 2004, the plan view of the rill network.
For three events (21 December 2004, 1 September 2005 and 13 December 2005), a detailed survey of the rillprofile, useful to calculate the slope of each rill segment, was carried out by a total topographic station. For these lastthree events the photographic relief was also carried out in order to positively test the reliability of this relief method,which was only used for the two events 5 November 2004 and 16 November 2004.
At the end of the rill measurements carried out for each erosive event, the plot soil surface was tilled to obliteratethe existing rills.

268 C. Bruno, C. Di Stefano and V. Ferro
Copyright © 2007 John Wiley & Sons, Ltd. Earth Surf. Process. Landforms 33, 263–279 (2008)DOI: 10.1002/esp
Figure 6. Frequency distribution of the soil bulk density.
Characteristic Data of the Erosive Events
In the measurement period September 2004–February 2006 ten erosive events occurred; for each event total runoffand soil loss (rill + interrill erosion) is available.
For each event, Table I lists the total rainfall Pe (mm), the rainfall erosivity factor Re (MJ mm ha−1 h−1) of Wischmeier(Renard et al., 1997), the total soil loss TLSe (g m−2) and the type of erosion process.
For five events (5 November 2004, 16 November 2004, 21 December 2004, 1 September 2005 and 13 December2005), rill formation occurred and the soil loss due to, respectively, interrill erosion, ILSe (g m−2), and rill erosionRLSe (g m−2) was calculated (Table I).
For the other five events, in which no rill network developed, the total soil loss was ascribed to interrill erosion(TLSe = ILSe).
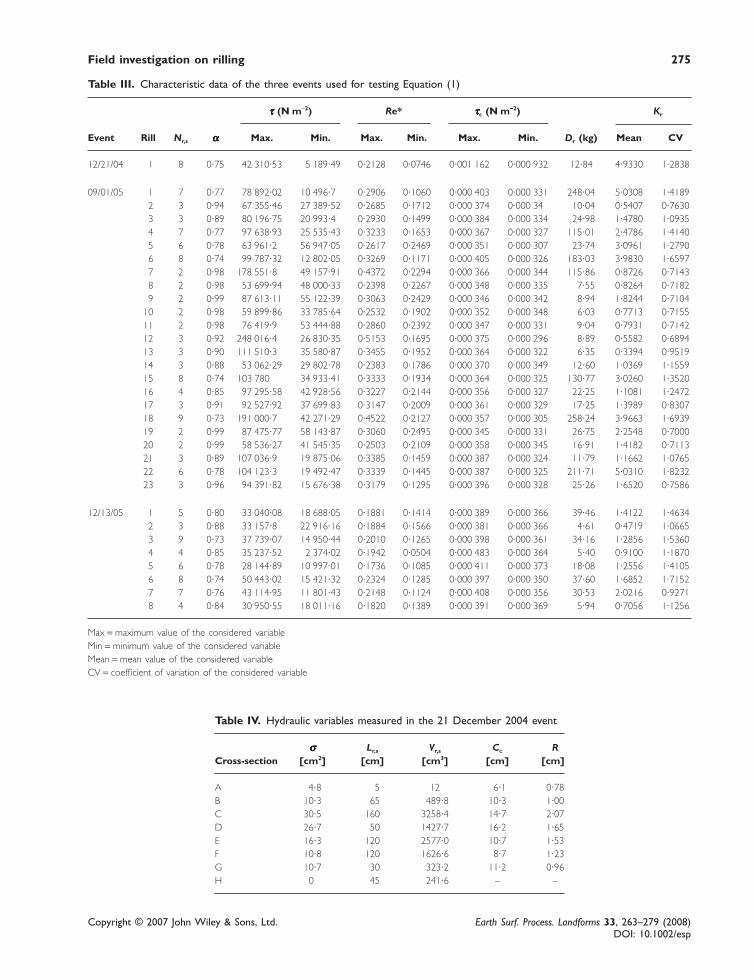
Table II shows, for the five events (5 November 2004, 16 November 2004, 21 December 2004, 1 September 2005 and13 December 2005) in which rills occurred, the number of rills n, the mean rill width w, the standard deviation of thewidth σ(w), the mean rill depth h, the standard deviation of the depth σ(h), the ratio w/h, the rill length L and volume V.
Figure 7. Photographic relief of the rill network. This figure is available in colour online at www.interscience.wiley.com/journal/espl

Field investigation on rilling 269
Copyright © 2007 John Wiley & Sons, Ltd. Earth Surf. Process. Landforms 33, 263–279 (2008)DOI: 10.1002/esp
Figure 8. Plan view of the rill network.

270 C. Bruno, C. Di Stefano and V. Ferro
Copyright © 2007 John Wiley & Sons, Ltd. Earth Surf. Process. Landforms 33, 263–279 (2008)DOI: 10.1002/esp
Table I. Characteristic data of the erosion events
Re
Pe MJ mm TLSe Type of ILSe RLSe InRill RillEvent mm ha−1 h−1 g m−2 erosion g m−2 g m−2 % % kr
17/09/04 15·0 53·49 22·66 interrill 22·66 0·00 100·00 0·00 –13/10/04 27·0 323·23 25·88 interrill 25·88 0·00 100·00 0·00 –05/11/04 49·4 122·18 1722·70 rill + interrill 25·88 1 624·10 5·72 94·28 0·000 81416/11/04 53·8 341·59 1000·67 rill + interrill 98·60 576·33 42·41 57·59 0·001 01221/12/04 57·0 102·88 505·76 rill + interrill 424·34 118·95 76·48 23·52 0·001 77703/03/05 37·0 34·71 18·51 interrill 18·51 0·00 100·00 0·00 –12/04/05 65·0 156·56 10·00 interrill 10·00 0·00 100·00 0·00 –01/09/05 65·0 988·75 15554·68 rill + interrill 4791·13 10 763·55 30·80 69·20 0·006 91013/12/05 97·8 333·95 1524·84 rill + interrill 264·07 1 260·78 17·32 82·68 0·001 23628/02/06 24·2 48·22 96·36 interrill 96·36 0·00 100·00 0·00 –
For each event the rill number has a large variability, while the range of the cross-section size (mean width andmean depth) is limited. The aspect ratio w/h is always greater than unity, showing that the rill erosion determines achannel having a very wide rectangular cross-section.
Relationship between Rill and Interrill Erosion
For five erosive events rill development did not occur and the measured soil loss was considered to be interrill erosion.For five events (5 November 2004, 16 November 2004, 21 December 2004, 1 September 2005 and 13 December2005) rill formation occurred and the proportion of total soil loss due to, respectively, interrill erosion, ILSe (g m−2),and rill erosion, RLSe (g m−2), was calculated (Table I).
For each erosive event Table I also lists the percentage of total soil loss due to interrill erosion, InRill%, and to rillerosion, Rill%.
Figure 9 shows, for the five events in which a rill network was monitored, a rough relationship between rill erosionRLSe (g m−2) and total erosion TLSe (g m−2). Notwithstanding the wide range of experimental pairs, for these moni-tored events rill erosion is dominant and can be assumed to be equal to 69·5% of the total soil loss.
For the five events in which rill erosion did not occur, Table I also shows that the soil loss ILSe ranges from 10 to96 g m−2 and for the other event, in which rills developed, interrill soil loss ILSe ranges from 193 to 4183 g m−2.
Figure 9. Relationship between rill erosion RLSe (g m−2) and total erosion TLSe (g m−2).
Field investigation on rilling 271
Copyright © 2007 John Wiley & Sons, Ltd. Earth Surf. Process. Landforms 33, 263–279 (2008)DOI: 10.1002/esp
Table II. Characteristic data of the measured rills
n w σ(w) h σ(h) w/h L V
Event 05/11/04 [cm] [cm] [cm] [cm] [cm] [cm3]1 4·36 0·91 3·20 0·84 1·45 1740 24 276·482 3·67 1·53 2·00 0·87 1·83 305 2 236·6673 4·28 1·09 3·20 1·19 1·34 795 10 896·84 3·83 1·04 2·83 1·26 1·35 1470 15 965·835 3·75 1·06 3·00 1·41 1·25 1085 12 206·256 4·17 1·61 3·83 1·26 1·09 755 12 059·037 5·83 0·29 3·83 2·02 1·52 375 8 385·4178 6·33 3·06 4·17 2·75 1·52 465 12 270·839 3·67 0·82 2·50 0·77 1·47 1390 12 741·67
10 3·90 1·56 3·30 0·84 1·18 1935 24 903·45
Event 16/11/04 1 4·33 1·52 1·60 0·65 2·70 290 2 010·6672 3·00 0·00 1·67 0·98 1·80 410 2 0503 3·67 1·15 3·17 0·90 1·16 298 3 460·1114 4·75 1·18 2·93 0·88 1·62 1952 27 166·965 5·00 2·83 2·15 0·92 2·38 228 2 4516 4·50 0·80 2·69 0·84 1·67 889 10 751·347 4·57 1·24 2·43 0·73 1·88 1648 18 296·168 5·12 1·27 3·32 1·34 1·54 1233 21 011·099 5·40 1·52 3·30 1·20 1·63 839 14 950·98
10 5·40 0·89 2·80 1·04 1·93 340 5 140·811 7·25 1·76 4·50 0·71 1·61 223 7 275·37512 4·85 1·95 3·05 0·99 1·59 1775 26 256·6913 6·22 1·46 3·55 1·19 1·75 1960 43 361·98
Event 21/12/04 1 4·71 1·88 3·40 1·17 1·38 595 9 956·42
Event 01/09/05 1 12·78 3·10 8·78 2·99 1·53 2068 192 277·362 7·75 3·18 5·60 2·12 1·37 217 7 780·953 9·46 6·05 8·00 3·27 1·07 349 19 366·394 10·80 4·57 9·65 2·07 1·08 1148 89 158·435 12·40 2·32 5·45 2·14 2·10 268 18 437·786 15·80 7·42 9·20 2·07 1·74 1243 141 881·877 13·62 4·10 9·12 2·76 1·58 1039 89 816·918 7·60 3·54 5·75 0·14 1·26 170 5 855·679 8·15 9·33 6·25 1·91 1·28 184 6 929·76
10 8·90 4·38 5·45 1·34 1·49 117 4 678·0211 9·30 3·61 7·80 0·64 1·88 148 7 004·3012 13·6 4·81 6·60 0·28 2·04 105 6 888·2513 8·90 3·96 7·55 2·05 1·15 97 4 918·7214 8·93 3·27 7·06 0·95 1·24 244 9 763·8915 11·86 8·94 7·00 2·05 1·57 1618 101 369·7316 10·85 7·03 7·52 1·61 1·41 374 17 265·6117 6·83 0·55 8·00 0·82 0·86 389 13 373·5418 14·60 5·05 9·26 1·69 1·55 1885 200 185·6419 11·70 7·50 6·95 2·90 1·60 297 20 739·3220 10·80 8·77 6·20 3·96 1·62 210 13 107·8021 7·20 0·28 5·80 0·14 1·24 365 9 140·122 11·12 3·80 9·14 2·90 1·21 1872 164 109·0523 9·50 3·54 6·95 0·78 1·35 494 19 581·75
Event 13/12/05 1 4·77 0·97 3·52 1·09 1·40 1317 15 559·092 5·53 0·71 3·97 1·37 1·48 233 3 575·453 5·23 1·28 3·75 0·99 1·44 1793 26 484·754 5·33 1·15 3·13 0·45 1·71 326 4 183·075 4·64 0·78 3·54 1·01 1·37 1206 14 016·576 5·20 1·78 4·11 0·91 1·34 1895 29 149·207 4·47 1·39 4·27 0·87 1·08 1645 23 664·788 5·43 1·52 3·73 0·74 1·44 317 4 698·74

272 C. Bruno, C. Di Stefano and V. Ferro
Copyright © 2007 John Wiley & Sons, Ltd. Earth Surf. Process. Landforms 33, 263–279 (2008)DOI: 10.1002/esp
This result can be explained taking into account the interaction between rill and interrill phenomena. In fact the rillformation and development increases the total sediment transport efficiency because the interrill eroded sediments aretransported by overland flow into the rill channels, and rill flow, which is aimed from higher velocity values than theoverland flow, is able to transport the interrill eroded sediments and sediment particles eventually detached from therill wetted perimeter. In other words, the existence and the interaction of the two erosion processes (interrill and rill)controls the hillslope sediment delivery processes.
Rill Erosion
The erosion process, acting on a soil having a bulk density ρs and a characteristic particle diameter d50, producing a rillsegment having a length Lr,s, a volume Vr,s, a mean width w and a maximum scour depth H, can be expressed by thefollowing functional relationship:
f (Vr,s, L r,s, w, H, ρs, d50, i) = 0 (4)
in which i is the mean intensity of the rainfall producing the erosion process.Since the functional relationship represents a physical phenomenon that does not depend on the choice of measure-
ment units, according to the Π-theorem of the dimensional analysis (Barenblatt, 1987), Equation (4) can be expressedusing four dimensionless groups Πi (i = 1–4):
φ (Π1, Π2, Π3, Π4) = 0 (5)
in which φ is a functional symbol.In particular, using Lr,s, ρs and i as dimensionally independent, the Π1 group is determined by the following
relationship:
Π1 = Lαr,sρβ
s iγ Vr,s (6)
in which α, β and γ are numerical constants. Substituting in Equation (6) the measurement units of each variable, thefollowing equation is obtained:
Π1 = mα Nβ s2β m−4β mγ s−γ m3 (7)
Since the Π1 group is dimensionless, the numerical values of α, β and γ have to be derived by solving the followingsystem of three equations derived from Equation (7):
0 = 3 + α − 4β + γ (8a)
0 = β (8b)
0 = 2β − γ (8c)
Using the solutions of Equations (8), Equation (6) gives
Π1 =V
Lr,s
r,s3
(9)
Following the above-mentioned procedure for the other dimensionless groups, we obtain
Π2 =w
Lr,s
(10a)
Π3 =H
Lr,s
(10b)
Π450 =
d
Lr,s
(10c)
and Equation (1) can be rewritten as follows:
φ V
L
w
L
H
L
d
Lr,s
r,s r,s r,s r,s3
50 0, , , ⎛
⎝⎜⎞
⎠⎟= (11)

Field investigation on rilling 273
Copyright © 2007 John Wiley & Sons, Ltd. Earth Surf. Process. Landforms 33, 263–279 (2008)DOI: 10.1002/esp
Figure 10. Relationship between the dimensional groups WHmax/L r,s2 and Vr,s/L r,s
3.
For a given soil (d50 = constant), the rill erosion process can be expressed by the following equation:
V
LF F
wH
Lr,s
r,s r,s3 2 3 2
( ) = ⋅ =⎛
⎝⎜⎞
⎠⎟Π Π (12)
in which F is a functional symbol.Since the F function vanishes for H → 0, the phenomenon is incompletely self-similar (Barenblatt, 1979, 1987)
with respect to wH/L2r,s:
V
La
wH
L
n
r,s
r,sr
r,s
r
3 2 =
⎛
⎝⎜⎞
⎠⎟(13)
in which ar and nr are two numerical constants.For the five events (5 November 2004, 16 November 2004, 21 December 2004, 1 September 2005 and 13 Decem-
ber 2005) in which rill formation occurred, Figure 10 shows the comparison between the measured pairs (wH/L2r,s, Vr,s/
L3r,s) and Equation (13) with ar = 0·3782 and nr = 0·9242.Equation (13) can be rewritten in the following form:
Vr,s = ar(wH)nrL r,s3−2nr (14)
If the rill section can be assumed quasi-constant along the rill profile, then Equation (14) becomes
Vr,s = krLr,s3−2nr (15)
in which kr is a constant whose value depends on the rainfall event.For the five events in which rill formation occurred, Equation (15) can be simply rewritten
Vr,s = krL r,s1·16 (16)
and the measurements (Lr,s, Vr,s) were used for estimating the kr values. Notwithstanding the scattering of the experi-mental pairs, Figure 11 shows the trend of kr with the rainfall erosivity factor Re.
To estimate the total eroded volume V, expressed as m3, of a rill, Equation (16) can be rewritten
V V k LN
r
N
= == =
⋅∑ ∑r,s
r,sr,s
r,s
r,s r,s
1 1
116 (17)
in which the summation is extended to all rill segments Nr,s into which a rill is divided.Taking into account the relationship

274 C. Bruno, C. Di Stefano and V. Ferro
Copyright © 2007 John Wiley & Sons, Ltd. Earth Surf. Process. Landforms 33, 263–279 (2008)DOI: 10.1002/esp
Figure 11. Relationship between kr and the rainfall erosivity factor Re.
r,sr,s
r,s
=
⋅ ⋅∑ =1
116 116N
L L α (18)
in which α is a numerical constant, Equation (18) assumes the mathematical shape of Equation (2) with b = 1·16.If the rill length is divided into Nr,s rill segments having a constant length l, Equation (18) becomes
r,s r,s
r,s r,s
=
⋅
=
⋅
∑ ∑=⎛
⎝⎜⎞
⎠⎟1
116
1
116N N
l l α (19)
Equation (19) can be rewritten
Nr,sl1·16 = α(Nr,sl)
1·16 (19)
and the following expression of α is deduced:
α = N r,s−0·16 (20)
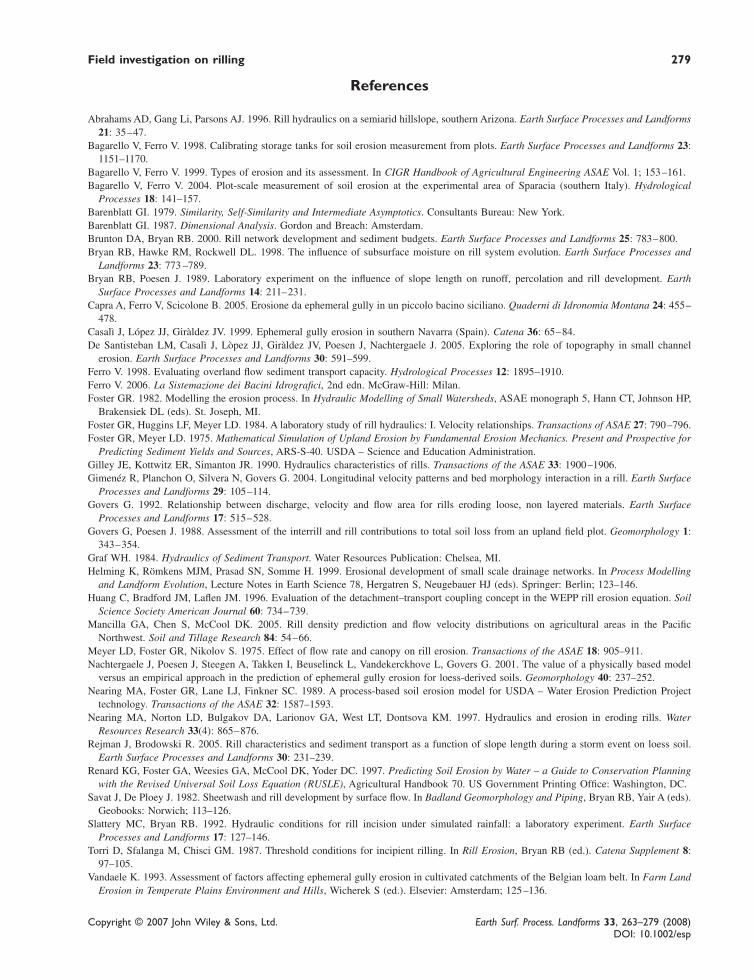
Equation (21) for Nr,s = 8 gives α = 0·72, which is near to the value (0·74) obtained in this investigation dividingthe rill length into eight rill segments with a variable length. Table III lists for three events (21 December 2004,1 September 2005 and 13 December 2005) the number Nr,s of rill segments and α values.
Figure 12 shows the comparison between Equation (2) with b = 1·16 and the pairs (L, V) available for the fiveerosive events. Figure 12 also shows that the V–L relationship determined for the ephemeral gullies (a = 0·071 andb = 1·12) can be assumed to be parallel to the one obtained for the Sicilian rills (a = 0·0038 and b = 1·16). In otherwords, Equation (2) can be applied for rill (a = 0·0038) and ephemeral gullies (a = 0·071) using a different scale factorfor the power relationship.
Equation (2) confirms, according to Vandaele (1993), that the channelized erosion phenomenon is a linear process,in which the rill length increases more rapidly than the rill cross-section area. In other words, the rill length can beconsidered a severity index of the rill erosion process.
Figure 13 shows, as an example for the rainfall event of 21 December 2004, the relief of the rill cross-sectionscarried out by the rillmeter. Table IV shows, for the same cross-sections, some characteristic data (cross-section areaσ, rill segment length Lr,s, rill segment volume Vr,s, wetted perimeter Cc and hydraulic radius R).
Examining Figure 13 allows establishment of the morphological evolution of the rill cross-section. The upstreamsections A and B are narrow and deep, while moving downstream the rill cross-section tends to enlarge, conservingthe depth (see cross-sections C and D). Finally, in the terminal reach (cross-sections E–G) the cross-section areadiminishes because of a decreasing flow transport capacity (the rill slope diminishes).
In the upstream sections A and B headcutting is the main phenomenon controlling channel incision. For cross sectionsC and D the upstream sediment load is lower than the rill flow transport capacity and the channelized flow scours the
Field investigation on rilling 275
Copyright © 2007 John Wiley & Sons, Ltd. Earth Surf. Process. Landforms 33, 263–279 (2008)DOI: 10.1002/esp
Table III. Characteristic data of the three events used for testing Equation (1)
τττττ (N m−2) Re* τττττc (N m−−−−−2) Kr
Event Rill Nr,s ααααα Max. Min. Max. Min. Max. Min. Dr (kg) Mean CV
12/21/04 1 8 0·75 42 310·53 5 189·49 0·2128 0·0746 0·001 162 0·000 932 12·84 4·9330 1·2838
09/01/05 1 7 0·77 78 892·02 10 496·7 0·2906 0·1060 0·000 403 0·000 331 248·04 5·0308 1·41892 3 0·94 67 355·46 27 389·52 0·2685 0·1712 0·000 374 0·000 34 10·04 0·5407 0·76303 3 0·89 80 196·75 20 993·4 0·2930 0·1499 0·000 384 0·000 334 24·98 1·4780 1·09354 7 0·77 97 638·93 25 535·43 0·3233 0·1653 0·000 367 0·000 327 115·01 2·4786 1·41405 6 0·78 63 961·2 56 947·05 0·2617 0·2469 0·000 351 0·000 307 23·74 3·0961 1·27906 8 0·74 99 787·32 12 802·05 0·3269 0·1171 0·000 405 0·000 326 183·03 3·9830 1·65977 2 0·98 178 551·8 49 157·91 0·4372 0·2294 0·000 366 0·000 344 115·86 0·8726 0·71438 2 0·98 53 699·94 48 000·33 0·2398 0·2267 0·000 348 0·000 335 7·55 0·8264 0·71829 2 0·99 87 613·11 55 122·39 0·3063 0·2429 0·000 346 0·000 342 8·94 1·8244 0·7104
10 2 0·98 59 899·86 33 785·64 0·2532 0·1902 0·000 352 0·000 348 6·03 0·7713 0·715511 2 0·98 76 419·9 53 444·88 0·2860 0·2392 0·000 347 0·000 331 9·04 0·7931 0·714212 3 0·92 248 016·4 26 830·35 0·5153 0·1695 0·000 375 0·000 296 8·89 0·5582 0·689413 3 0·90 111 510·3 35 580·87 0·3455 0·1952 0·000 364 0·000 322 6·35 0·3394 0·951914 3 0·88 53 062·29 29 802·78 0·2383 0·1786 0·000 370 0·000 349 12·60 1·0369 1·155915 8 0·74 103 780 34 933·41 0·3333 0·1934 0·000 364 0·000 325 130·77 3·0260 1·352016 4 0·85 97 295·58 42 928·56 0·3227 0·2144 0·000 356 0·000 327 22·25 1·1081 1·247217 3 0·91 92 527·92 37 699·83 0·3147 0·2009 0·000 361 0·000 329 17·25 1·3989 0·830718 9 0·73 191 000·7 42 271·29 0·4522 0·2127 0·000 357 0·000 305 258·24 3·9663 1·693919 2 0·99 87 475·77 58 143·87 0·3060 0·2495 0·000 345 0·000 331 26·75 2·2548 0·700020 2 0·99 58 536·27 41 545·35 0·2503 0·2109 0·000 358 0·000 345 16·91 1·4182 0·711321 3 0·89 107 036·9 19 875·06 0·3385 0·1459 0·000 387 0·000 324 11·79 1·1662 1·076522 6 0·78 104 123·3 19 492·47 0·3339 0·1445 0·000 387 0·000 325 211·71 5·0310 1·823223 3 0·96 94 391·82 15 676·38 0·3179 0·1295 0·000 396 0·000 328 25·26 1·6520 0·7586
12/13/05 1 5 0·80 33 040·08 18 688·05 0·1881 0·1414 0·000 389 0·000 366 39·46 1·4122 1·46342 3 0·88 33 157·8 22 916·16 0·1884 0·1566 0·000 381 0·000 366 4·61 0·4719 1·06653 9 0·73 37 739·07 14 950·44 0·2010 0·1265 0·000 398 0·000 361 34·16 1·2856 1·53604 4 0·85 35 237·52 2 374·02 0·1942 0·0504 0·000 483 0·000 364 5·40 0·9100 1·18705 6 0·78 28 144·89 10 997·01 0·1736 0·1085 0·000 411 0·000 373 18·08 1·2556 1·41056 8 0·74 50 443·02 15 421·32 0·2324 0·1285 0·000 397 0·000 350 37·60 1·6852 1·71527 7 0·76 43 114·95 11 801·43 0·2148 0·1124 0·000 408 0·000 356 30·53 2·0216 0·92718 4 0·84 30 950·55 18 011·16 0·1820 0·1389 0·000 391 0·000 369 5·94 0·7056 1·1256
Max = maximum value of the considered variableMin = minimum value of the considered variableMean = mean value of the considered variableCV = coefficient of variation of the considered variable
Table IV. Hydraulic variables measured in the 21 December 2004 event
σσσσσ Lr,s Vr,s CC RCross-section [cm2] [cm] [cm3] [cm] [cm]
A 4·8 5 12 6·1 0·78B 10·3 65 489·8 10·3 1·00C 30·5 160 3258·4 14·7 2·07D 26·7 50 1427·7 16·2 1·65E 16·3 120 2577·0 10·7 1·53F 10·8 120 1626·6 8·7 1·23G 10·7 30 323·2 11·2 0·96H 0 45 241·6 – –

276 C. Bruno, C. Di Stefano and V. Ferro
Copyright © 2007 John Wiley & Sons, Ltd. Earth Surf. Process. Landforms 33, 263–279 (2008)DOI: 10.1002/esp
Figure 12. Comparison between Equation (2) and the pairs (L, V ) available for five erosive events.
Figure 13. Rill cross-sections.

Field investigation on rilling 277
Copyright © 2007 John Wiley & Sons, Ltd. Earth Surf. Process. Landforms 33, 263–279 (2008)DOI: 10.1002/esp
Figure 14. Shear stress along the rill thalweg.
wetted perimeter. For the terminal sections (E–G) transport of the particles scoured in the upstream reaches is thedominant process. In other words, in the first part of the rill length the channelized flow is able to erode the wettedperimeter and to transport the eroded particles, while in the terminal part of the rill length the actual sediment load ishigh and the flow is only able to transport the particles coming from upstream without scouring the rill perimeter.
For each rill segment the flow shear stress τ was calculated as τ = γ Ri, with γ the water specific weight and i the rillsegment slope.
The shear stress profile along the rill length agrees with the observed morphological evolution of the rill cross-section. Figure 14 shows that the flow shear stress initially increases with the ratio x/L, with x the coordinate along therill axis, and then decreases, confirming that in the terminal part of the rill the flow is detachment limited while beingable to transport the sediment particles eroded from upstream.
Using the WEPP model for estimating rill erosion needs the estimate of the rill erodibility constant. For three events(21 December 2004, 1 September 2005 and 13 December 2005), detailed information on rill erosion and rill morpho-logy allowed testing of the applicability of WEPP and estimation of rill erodibility constant.
The first step is to calculate the shear Reynolds number:
Re* =gRid50
ν(22)
in which d50 is the soil particle diameter for which the soil particles are finer and ν is the water kinematic viscosity.Taking into account that the shear Reynolds number always assumes values less than unity, the critical value of theShields number Yc was calculated by the following relationship (Ferro, 1998, 2006):
Yc Re*
=⋅
⋅
01150 2104
(23)
Using Equation (23) the critical shear stress τc was calculated and the pairs (τ − τc, Dr), in which Dr is the rilldetachment rate expressed as weight (kg), were plotted. Figure 15 shows that Equation (1) can be applied, distinguish-ing between the measurements carried out for the head of the rill and for the other rill segments. In the first case m isequal to 0·8. Using the rill segments downstream of the rill head, a value of 1·5 is obtained. In other words, when thedominant erosion process is rill headcutting, a value of the exponent m equal to 0·8 can be assumed. When scouring isthe dominant erosion process, a value of the exponent equal to 1·5 should be used. In this last case using Equation (1)also allows us to estimate a rill erodibility constant equal to 0·98 kg m3 N−1·5.
Conclusions
Although the knowledge of the soil erosion mechanisms and dynamics has been increased and many empirical andprocess-oriented models have been developed, rill erosion research is still limited.
The analysis of previous studies suggested that research is required to develop simple models useful to estimate theseverity of rilling in a given region. Improvements of both equations used in physically based models of rill erosionand parameter estimate, such as rill erodibility, are also required. Taking into account that more efforts have beenemployed to model interrill erosion than rill erosion, the relevance of rill phenomena should be also tested.

278 C. Bruno, C. Di Stefano and V. Ferro
Copyright © 2007 John Wiley & Sons, Ltd. Earth Surf. Process. Landforms 33, 263–279 (2008)DOI: 10.1002/esp
Figure 15. Comparison between Equation (1) and the pairs (τ − τc, Dr).
In this paper the results of a field investigation on rilling carried out at the experimental Sparacia area, South Italy,are reported.
The analysis of the measured erosive events allowed establishment of the proportion of both rill erosion and interrillerosion on total soil loss. The measurements showed that rill erosion increases the total sediment transport efficiencybecause rill flow is able to transport both the interrill eroded sediments and sediment particles eventually detachedfrom the rill wetted perimeter.
The measurements, carried out for ten rainfall events, also allowed verification of a relationship between rill lengthand rill volume, which was theoretically deduced by the dimensional analysis and self-similarity theory. This equationshows that rill length can be usefully employed as a severity index of the rilling process.
The morphological evolution of the rill cross-section showed that in the first part of the rill length the channelizedflow is able to erode the wetted perimeter and to transport the eroded particles, while in the terminal part of the rill theactual sediment load is high and the flow is only able to transport the particles coming from upstream withoutscouring the rill perimeter. The shear stress profile along the rill length confirmed that in the terminal part of the rillthe flow is detachment limited, while it is able to transport the upstream eroded sediment particles.
Finally for the available erosive events, the applicability of Equation (2) was tested and the rill erodibility constantwas estimated. In particular, the analysis showed that the m exponent of Equation (2) is dependent on the dominanterosion process (headcutting, scouring).
AcknowledgementsThis research was supported by a grant from Project FEROS – Assessorato Agricoltura e Foreste della Regione Siciliana – IXServizio Regionale allo Sviluppo.
All authors participated equally in setting up the research, analysing the results and writing the paper.
Field investigation on rilling 279
Copyright © 2007 John Wiley & Sons, Ltd. Earth Surf. Process. Landforms 33, 263–279 (2008)DOI: 10.1002/esp
References
Abrahams AD, Gang Li, Parsons AJ. 1996. Rill hydraulics on a semiarid hillslope, southern Arizona. Earth Surface Processes and Landforms21: 35–47.
Bagarello V, Ferro V. 1998. Calibrating storage tanks for soil erosion measurement from plots. Earth Surface Processes and Landforms 23:1151–1170.
Bagarello V, Ferro V. 1999. Types of erosion and its assessment. In CIGR Handbook of Agricultural Engineering ASAE Vol. 1; 153–161.Bagarello V, Ferro V. 2004. Plot-scale measurement of soil erosion at the experimental area of Sparacia (southern Italy). Hydrological
Processes 18: 141–157.Barenblatt GI. 1979. Similarity, Self-Similarity and Intermediate Asymptotics. Consultants Bureau: New York.Barenblatt GI. 1987. Dimensional Analysis. Gordon and Breach: Amsterdam.Brunton DA, Bryan RB. 2000. Rill network development and sediment budgets. Earth Surface Processes and Landforms 25: 783–800.Bryan RB, Hawke RM, Rockwell DL. 1998. The influence of subsurface moisture on rill system evolution. Earth Surface Processes and
Landforms 23: 773 –789.Bryan RB, Poesen J. 1989. Laboratory experiment on the influence of slope length on runoff, percolation and rill development. Earth
Surface Processes and Landforms 14: 211–231.Capra A, Ferro V, Scicolone B. 2005. Erosione da ephemeral gully in un piccolo bacino siciliano. Quaderni di Idronomia Montana 24: 455–
478.Casalì J, López JJ, Giràldez JV. 1999. Ephemeral gully erosion in southern Navarra (Spain). Catena 36: 65–84.De Santisteban LM, Casalì J, Lòpez JJ, Giràldez JV, Poesen J, Nachtergaele J. 2005. Exploring the role of topography in small channel
erosion. Earth Surface Processes and Landforms 30: 591–599.Ferro V. 1998. Evaluating overland flow sediment transport capacity. Hydrological Processes 12: 1895–1910.Ferro V. 2006. La Sistemazione dei Bacini Idrografici, 2nd edn. McGraw-Hill: Milan.Foster GR. 1982. Modelling the erosion process. In Hydraulic Modelling of Small Watersheds, ASAE monograph 5, Hann CT, Johnson HP,
Brakensiek DL (eds). St. Joseph, MI.Foster GR, Huggins LF, Meyer LD. 1984. A laboratory study of rill hydraulics: I. Velocity relationships. Transactions of ASAE 27: 790–796.Foster GR, Meyer LD. 1975. Mathematical Simulation of Upland Erosion by Fundamental Erosion Mechanics. Present and Prospective for
Predicting Sediment Yields and Sources, ARS-S-40. USDA – Science and Education Administration.Gilley JE, Kottwitz ER, Simanton JR. 1990. Hydraulics characteristics of rills. Transactions of the ASAE 33: 1900–1906.Gimenéz R, Planchon O, Silvera N, Govers G. 2004. Longitudinal velocity patterns and bed morphology interaction in a rill. Earth Surface
Processes and Landforms 29: 105–114.Govers G. 1992. Relationship between discharge, velocity and flow area for rills eroding loose, non layered materials. Earth Surface
Processes and Landforms 17: 515–528.Govers G, Poesen J. 1988. Assessment of the interrill and rill contributions to total soil loss from an upland field plot. Geomorphology 1:
343–354.Graf WH. 1984. Hydraulics of Sediment Transport. Water Resources Publication: Chelsea, MI.Helming K, Römkens MJM, Prasad SN, Somme H. 1999. Erosional development of small scale drainage networks. In Process Modelling
and Landform Evolution, Lecture Notes in Earth Science 78, Hergatren S, Neugebauer HJ (eds). Springer: Berlin; 123–146.Huang C, Bradford JM, Laflen JM. 1996. Evaluation of the detachment–transport coupling concept in the WEPP rill erosion equation. Soil
Science Society American Journal 60: 734–739.Mancilla GA, Chen S, McCool DK. 2005. Rill density prediction and flow velocity distributions on agricultural areas in the Pacific
Northwest. Soil and Tillage Research 84: 54–66.Meyer LD, Foster GR, Nikolov S. 1975. Effect of flow rate and canopy on rill erosion. Transactions of the ASAE 18: 905–911.Nachtergaele J, Poesen J, Steegen A, Takken I, Beuselinck L, Vandekerckhove L, Govers G. 2001. The value of a physically based model
versus an empirical approach in the prediction of ephemeral gully erosion for loess-derived soils. Geomorphology 40: 237–252.Nearing MA, Foster GR, Lane LJ, Finkner SC. 1989. A process-based soil erosion model for USDA – Water Erosion Prediction Project
technology. Transactions of the ASAE 32: 1587–1593.Nearing MA, Norton LD, Bulgakov DA, Larionov GA, West LT, Dontsova KM. 1997. Hydraulics and erosion in eroding rills. Water
Resources Research 33(4): 865–876.Rejman J, Brodowski R. 2005. Rill characteristics and sediment transport as a function of slope length during a storm event on loess soil.
Earth Surface Processes and Landforms 30: 231–239.Renard KG, Foster GA, Weesies GA, McCool DK, Yoder DC. 1997. Predicting Soil Erosion by Water – a Guide to Conservation Planning
with the Revised Universal Soil Loss Equation (RUSLE), Agricultural Handbook 70. US Government Printing Office: Washington, DC.Savat J, De Ploey J. 1982. Sheetwash and rill development by surface flow. In Badland Geomorphology and Piping, Bryan RB, Yair A (eds).
Geobooks: Norwich; 113–126.Slattery MC, Bryan RB. 1992. Hydraulic conditions for rill incision under simulated rainfall: a laboratory experiment. Earth Surface
Processes and Landforms 17: 127–146.Torri D, Sfalanga M, Chisci GM. 1987. Threshold conditions for incipient rilling. In Rill Erosion, Bryan RB (ed.). Catena Supplement 8:
97–105.Vandaele K. 1993. Assessment of factors affecting ephemeral gully erosion in cultivated catchments of the Belgian loam belt. In Farm Land
Erosion in Temperate Plains Environment and Hills, Wicherek S (ed.). Elsevier: Amsterdam; 125–136.