field evaluation of a stormceptor model stc 1200
TRANSCRIPT

F I E L D M O N I T O R I N G
Field Evaluation of a Stormceptor® Model STC 1200
Westwood, Massachusetts
Prepared by: Stormceptor Group of Companies
June, 2004

Field Monitoring Evaluation of a Westwood, Massachusetts Stormceptor® US Model STC 1200 June to November, 1997
S T O R M C E P T O R ®
- i -
TABLE OF CONTENTS
1.0 General ............................................................................................................................................1
1.1 Site Description ................................................................................................................................1 1.2 Stormceptor Model STC 1200 .........................................................................................................2
2.0 Monitoring Methodology...................................................................................................................2 3.0 Monitoring Results ...........................................................................................................................3
3.1 Rainfall .............................................................................................................................................4 3.2 Total Suspended Solids ...................................................................................................................4 3.3 Particle Size Distribution ..................................................................................................................5 3.4 Total Petroleum Hydrocarbons (TPH)..............................................................................................6 3.5 Heavy Metals ...................................................................................................................................7
APPENDICES
APPENDIX 1 LABORATORY ANALYTICAL REPORTS – POLLUTANT ANALYSIS APPENDIX 2 LABORATORY ANALYTICAL REPORT – PARTICLE SIZE ANALYSIS
LIST OF TABLES Table 1-1. Summary of performance data for a Stormceptor model STC 1200..........................................1 Table 0-2. Stormceptor model STC 1200 physical characteristics ..............................................................2 Table 3-1. Hydrologic Summary of Monitored Events .................................................................................4 Table 3-2. Monitoring data for TSS during First Flush Conditions...............................................................4 Table 3-3. Monitoring data for TSS by individual runoff events ...................................................................5 Table 3-4. Particle size distribution of sediment in lower chamber of the unit.............................................6 Table 3-5. Summary of first flush TPH removal ............................................................................................7 Table 3-6. TPH for individual runoff events..................................................................................................7 Table 3-7. Cadmium, Chromium and Lead Removal Efficiency During First Flush, Event 2 ......................9 Table 3-8. Removal Efficiency for entire Event 2.........................................................................................9 Table 3-9. Concentration and Removal Efficiency for Barium During First Flush Conditions .....................9 Table 3-10. Monitoring data for Barium for Individual Runoff Events ..........................................................9
LIST OF FIGURES Figure 1-1. Westwood, Massachusetts Site.................................................................................................2 Figure 3-1. Plot of particle size distribution in Stormceptor lower chamber.................................................6

Field Monitoring Evaluation of a Westwood, Massachusetts Stormceptor® US Model STC 1200 June to November, 1997
S T O R M C E P T O R ®
- 1 -
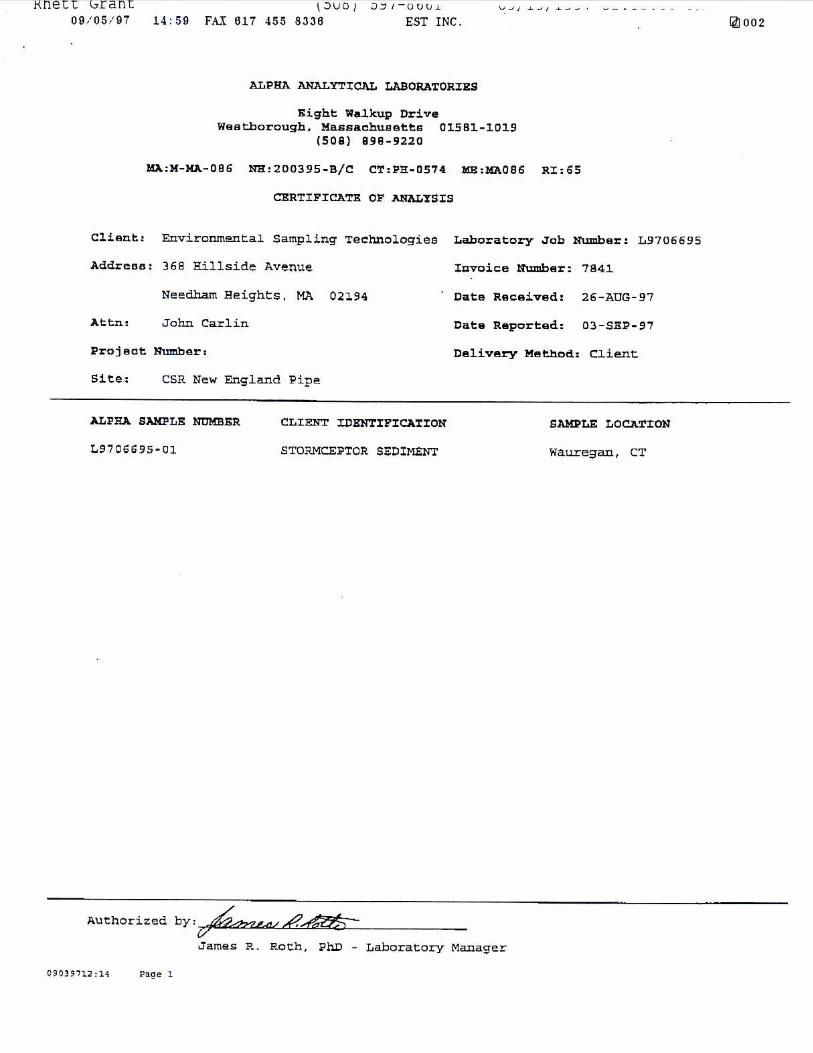
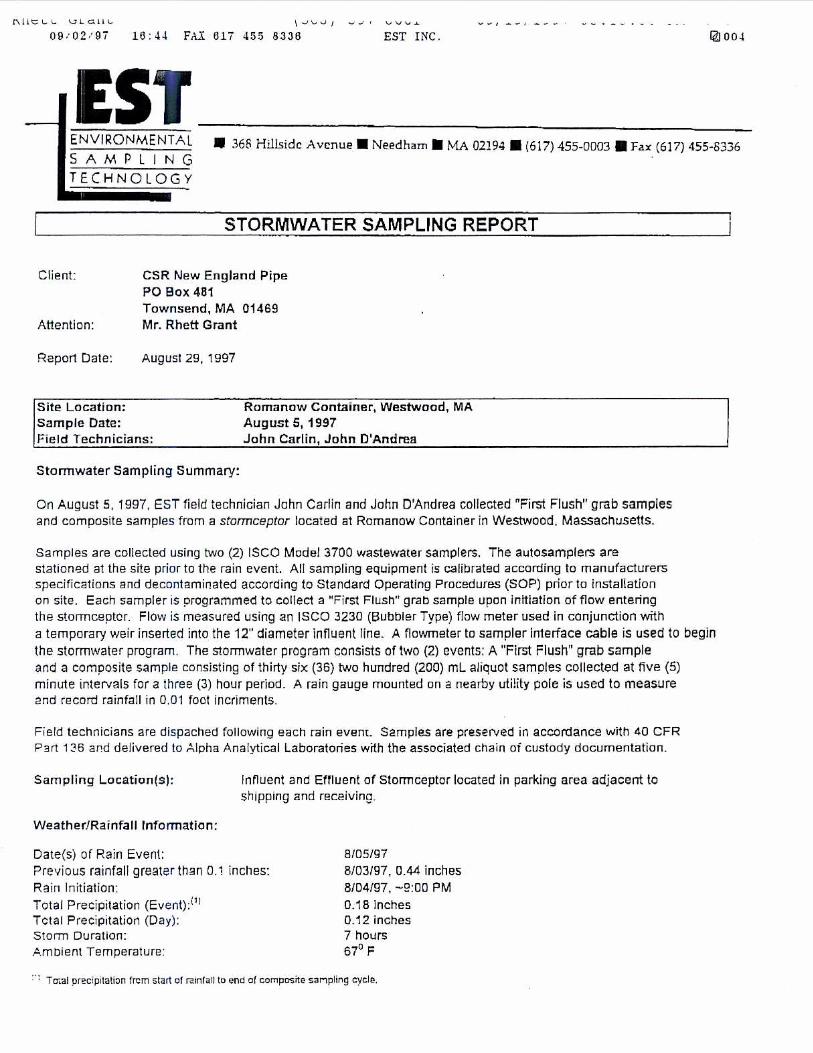
1.0 General Massachusetts firm, Environmental Sampling and Technology (EST) completed the field monitoring of a Stormceptor Model STC 1200 between June, 1997 and November, 1997. EST, located in Needham, Massachusetts, is a specialist organization experienced in the monitoring and sampling of stormwater runoff. Alpha Analytical Laboratories Inc., located in Westboro, Massachusetts, was engaged to complete the analytical laboratory work on samples obtained upstream and downstream of the Stormceptor unit. A total of five events were monitored during this period. A summary of the results are shown in Table 1-1. Laboratory reports of the analysis are provided Appendix A.
Table 1-1. Summary of performance data for a Stormceptor model STC 1200
Pollutant Sample Description Overall Removal Efficiency
First Flush 96% Overall 92%
Total Suspended Solids
Simulated(1) 92% Particle Size Distribution
Distribution less than 60 um
27%
First Flush 93% Total Petroleum Hydrocarbons Overall 81%
First Flush 73% Barium (Ba) Overall 55% First Flush 92% Lead (Pb) Overall 83%
Cadmium (Cd) First Flush 29% Chromium (Cr) First Flush 67%
(1) Expected removal efficiency based on estimates of TSS removal by the Stormceptor Sizing Program Version 4.0.0, using a continuous rainfall/runoff pollutant export simulation.
(2) The overall removal efficiencies are based on a reduction of mass load. First flush efficiency is based on reduction of average concentration during first flush conditions rather than reduction in mass load.
(3) Data for heavy metals are based on limited events, since the majority of the concentrations were less than detection limits. The relatively high removal efficiencies indicated by the data for heavy metals is unlikely to be achieved over the long term, based on data from other sites and given the partitioning between dissolved and particulate fraction.
1.1 Site Description The Stormceptor model STC 1200 accepts runoff from a 0.74 acre (0.3 ha) paved hardstand area associated with the unloading and loading of articulated vehicles from the Romanow Container Distribution Centre at 346 University Avenue, Westwood, Massachusetts. A photograph of the site is shown in Figure 1-1.

Field Monitoring Evaluation of a Westwood, Massachusetts Stormceptor® US Model STC 1200 June to November, 1997
S T O R M C E P T O R ®
- 2 -
Figure 1-1. Westwood, Massachusetts Site.
1.2 Stormceptor Model STC 1200 Key physical characteristics of the Stormceptor Model STC 1200 are shown in Table 1-1.
Table 1-2. Stormceptor model STC 1200 physical characteristics
Water Quality Flow Before By-Pass
0.64 cfs (18 l/s)
Orifice Plate Diameter
6 inches (150 mm)
Sediment Storage Capacity
Hydrocarbon Storage Capacity
Diameter of Lower Chamber
72” (1800 mm)
Depth of Lower Chamber (pipe invert to top of slab)
71” (1775 mm)
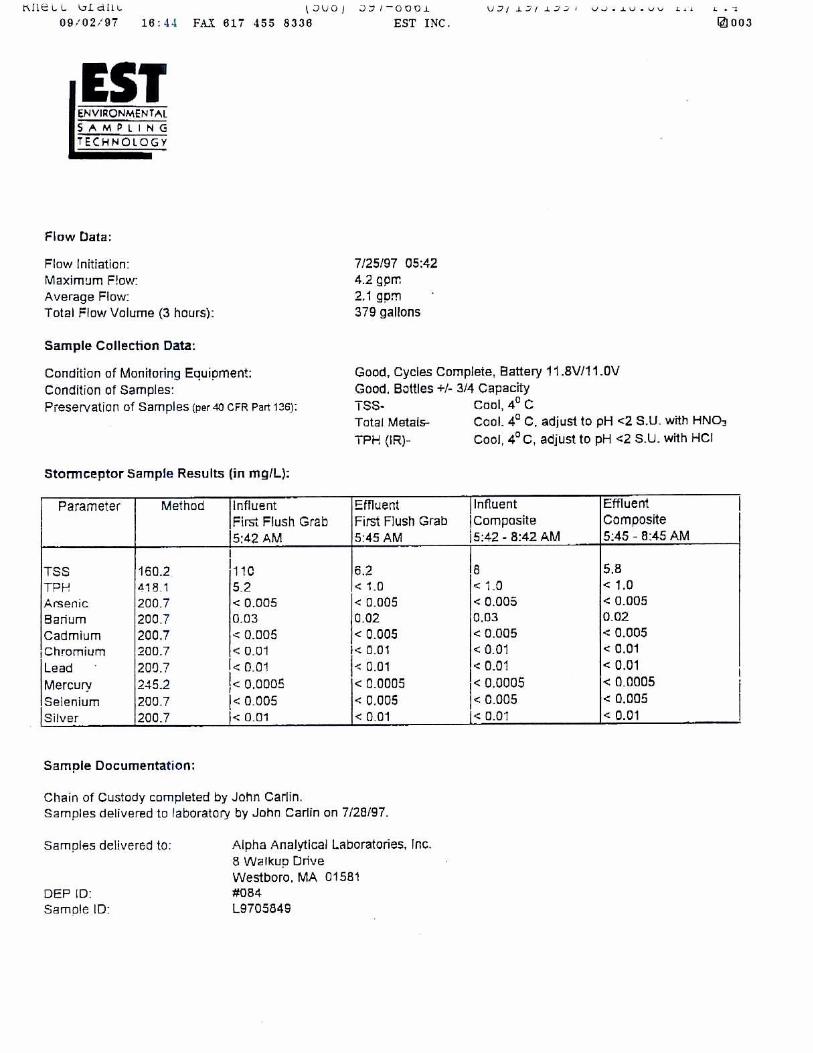
2.0 Monitoring Methodology Monitoring of the Stormceptor was completed with the installation of ISCO 3700 automatic samplers immediately upstream and downstream of the device. Each sampler was programmed to collect a “first flush” sample upon initiation of flow entering the Stormceptor and a composite sample consisting of 36 - 250 mL aliquot samples collected at five minute intervals over a three hour period. Flow was measured using an ISCO 3230 bubble flow module positioned upstream of the Stormceptor unit. An interface

Field Monitoring Evaluation of a Westwood, Massachusetts Stormceptor® US Model STC 1200 June to November, 1997
S T O R M C E P T O R ®
- 3 -
between the flow meter and the automatic samplers was used to initiate the sampling program. A rain gauge was also mounted on a nearby pole which recorded rainfall data in 1/100 inch (0.25 mm) increments. The primary focus of the sampling program was to determine the performance of the Stormceptor product to remove and retain Total Suspended Solids, Total Petroleum Hydrocarbons and Heavy Metals across a range of hydrologic conditions. A sediment sample was also obtained from the base of the Stormceptor unit following the monitoring program in order to analyze the particle size gradation of captured material. The contaminants measured included:
• Total Suspended Solids (TSS) • Total Petroleum Hydrocarbons (TPH) • Arsenic (As) • Barium (Ba) • Cadmium (Cd) • Chromium (Cr) • Selenium (Se) • Lead (Pb) • Mercury (Hg) • Silver (Ag)
3.0 Monitoring Results All removal efficiencies are calculated using the aggregate pollutant loading reduction method (WDOE, 1999) as shown in the equation below.
100)(
)()((%)Re 1
1 1
××
×−×=
∑
∑ ∑
nnn
n nnnnn
VEff
VEffVIniencymovalEffic
where, In = Composite Influent concentration measured for event n Eff = Composite Effluent concentration measured for event n V = Total storm volume for event n n = Event number

Field Monitoring Evaluation of a Westwood, Massachusetts Stormceptor® US Model STC 1200 June to November, 1997
S T O R M C E P T O R ®
- 4 -
3.1 Rainfall A total of five events were monitored for the study. A summary of the hydrologic parameters measured are listed in Table 3-1.
Table 3-1. Hydrologic Summary of Monitored Events
Rainfall Event
Date Total Depth
Storm Duration
Total Volume Peak Flow
1 Jul 25, 1997 0.18 in (4.6 mm) 11 hrs 379 gal.
(1.43 m3) 0.009 cfs (0.26 L/s)
2 Aug 5, 1997 0.18 in (4.6 mm) 7 hrs 122 gal.
(0.46 m3) 0.004 cfs (0.11 L/s)
3 Aug 21, 1997 0.25 in (6.4 mm) 24 hrs 304 gal.
(1.15 m3) 0.005 cfs (0.15 L/s)
4 Sep 29, 1997 N/A N/A 672 gal. (2.54 m3)
0.007 cfs (0.20 L/s)
5 Oct 25, 1997 0.75 in (19.0 mm) 16 hrs 2569 gal.
(9.72 L/s) 0.016 cfs (0.46 L/s)
3.2 Total Suspended Solids Total suspended solids concentrations and mass load were determined across the five monitored events upstream and downstream of the Stormceptor unit. The final event sampled on the October 25, 1997 provided a composite sample concentration below the detention limit of 5 mg/l upstream and downstream of the unit and has not been included in calculating the total removal efficiency. Samples to capture the first flush of suspended solids were also collected for the first three events, although the mass load during the first flush conditions were unable to be computed since a volumetric determination of what constituted a first flush was not completed. The monitoring data during the first flush is shown in Table 3-2.
Table 3-2. Monitoring data for TSS during First Flush Conditions
Runoff Event Upstream Concentration
(mg/L)
Downstream Concentration
(mg/L)
Removal Efficiency
(%) July 25, 1997 110 6.2 94.4 August 5, 1997 320 5.0 98.4 August 21, 1997 26 5.6 78.5 Average TSS 152 5.6 96.3%
The average total suspended solids concentration during the first flush conditions was 152 mg/l upstream of the Stormceptor unit and 5.6 mg/l downstream, indicating retention of over 96% of suspended solids during the initial runoff period. These average concentrations represent a simple arithmetic mean of the individual event data, since a mass load could not be computed. Therefore the average first flush concentrations are not necessarily an absolute true measure of the overall first flush conditions, since there is no consideration or inherent weighting given to the variation in mass load between the three events. This aside, the data does provide a reasonable overall assessment of product performance under first flush conditions. The efficiency during individual events is not impacted by this same

Field Monitoring Evaluation of a Westwood, Massachusetts Stormceptor® US Model STC 1200 June to November, 1997
S T O R M C E P T O R ®
- 5 -
deficiency. The concentrations upstream and downstream of the Stormceptor presented in tabular form above are shown in Figure 2 below. Total suspended solids concentrations across the individual runoff events is shown in Table 3-3 below and presented graphically in Figure 3. The event mean concentration upstream and downstream of the Stormceptor for the entire monitoring program was 74 mg/l and 5.6 mg/l. The total mass load measured upstream of the Stormceptor was 415 grams and downstream was 31.3 grams, providing an overall removal efficiency across the monitoring period of 92%. It is noted once again that the overall event mean concentrations have utilized the mass loads rather than a simple arithmetic mean of the concentration levels (as was the case for the first flush condition), and therefore are considered to be an accurate description.
Table 3-3. Monitoring data for TSS by individual runoff events
TSS mg/l
Mass Load mg
Runoff Event
Upstream Downstream Upstream Downstream
Removal Efficiency
Jul 25, 1997 8 5.8 11.4 8.3 27.5% Aug 5, 1997 400 5.3 184.8 2.4 98.7% Aug 21, 1997 86 6.8 99.1 7.8 92.1% Sep 29, 1997 47 5.0 119.6 12.7 89.4%
TSS EMC/Total 74 5.6 415 31.3 92.5%
The performance of the Stormceptor exhibited by this monitoring program would generally be considered high in comparison to most design specifications. In general, the Stormceptor System is specified within the North American market to achieve a minimum total suspended solids removal efficiency of 80%. Utilizing the recorded particle size distribution documented below, and 52 years of continuous historical rainfall records for Boston, Massachusetts (Boston Logan Airport), the Stormceptor Sizing Program estimates a removal efficiency of 92% total suspended solids and the treatment of 90% of the total annual volume of runoff. The estimate made by the software is therefore consistent with the data collected during the monitoring program. If the particle size distribution from the site was finer and consistent with the standard fine distribution used for sizing the Stormceptor System, the removal efficiency predicted by the program is 87%.
3.3 Particle Size Distribution During the monitoring program, a sample of sediment was collected from the accumulated material from the lower chamber of the Stormceptor unit to obtain a grain size analysis. The results of the analysis are shown in Table 3-1 below and indicate that approximately 27% of the collected material has a particle size less than 60 µm (silt and clay particles).

Field Monitoring Evaluation of a Westwood, Massachusetts Stormceptor® US Model STC 1200 June to November, 1997
S T O R M C E P T O R ®
- 6 -
Figure 3-1. Plot of particle size distribution in Stormceptor lower chamber
The suspended solids collected are relatively coarse in comparison to other Stormceptor monitoring with approximately 50% of the material being classified as fine gravel. This relatively coarse grading has undoubtedly influenced the relatively high capture and retention efficiencies noted above for TSS and is most likely a result of the local geomorphology of the region. The material is also relatively coarse in comparison to the body of research regarding particle size distributions typically found in suspended solids exported from urbanized catchments in North America. Table 3-4 summarizes the particle size distribution found in the Stormceptor unit.
Table 3-4. Particle size distribution of sediment in lower chamber of the unit.
Sediment Material
Grain Size Description
Particle Size Range (um)
Percent of Total Sample
Gravel Fine 2000 – 6000 49% Coarse 600 – 2000 12% Medium 200 – 600 6%
Sand
Fine 60 – 200 6% Silt or Clay <60 27%
3.4 Total Petroleum Hydrocarbons (TPH) The concentration of TPH was determined upstream and downstream of the Stormceptor during the initial runoff period (first flush) for the first three events, and composite concentrations determined across the whole runoff period for five individual events. In three of the five events, the composite concentration was below the detection limit of 1 mg/l upstream and downstream of the Stormceptor unit. The concentration during the first flush was more elevated upstream of the Stormceptor but was generally at or below detection limits downstream. Monitoring data during the initial runoff period are listed in Table 3-5. The arithmetic mean first flush concentration was 25.1 mg/l upstream and 1.7 mg/l downstream of the Stormceptor unit indicating overall

Field Monitoring Evaluation of a Westwood, Massachusetts Stormceptor® US Model STC 1200 June to November, 1997
S T O R M C E P T O R ®
- 7 -
capture of 93% of the first flush hydrocarbon load. The first flush concentration was relatively elevated in comparison to the generally low concentrations for the overall runoff events.
Table 3-5. Summary of first flush TPH removal
Runoff Event Upstream Concentration
mg/l
Downstream Concentration
mg/l
Removal Efficiency
Jul 25, 1997 5.2 <1 80.8% Aug 5, 1997 32 <1 96.9% Aug 21, 1997 38 3.2 91.6% Average TPH 25.1 1.7 93.2%
Hydrocarbon event mean concentrations are shown in Table 3-6. The average overall concentration of total petroleum hydrocarbons exported from the site upstream of the Stormceptor was 6.8 mg/l. The average concentration downstream of the Stormceptor unit was 1.3 mg/l. Based on the total mass of hydrocarbons upstream and downstream of the Stormceptor, the product captured a total of 81% of the hydrocarbon load exported from the site.
Table 3-6. TPH for individual runoff events.
TSS mg/l
Mass Load mg
Runoff Event
Upstream Downstream Upstream Downstream
Removal Efficiency
Aug 5, 1997 4.8 <1 2217.6 462.0 79.2% Aug 21, 1997 7.6 1.4 8755.2 1612.8 81.6%
TPH EMC/Total Mass Load
6.8 1.29 10972.8 2074.8 81.1%
3.5 Heavy Metals The concentration of Arsenic (As), Barium (Ba), Cadmium (Cd), Chromium (Cr), Lead (Pb), Mercury (hg), Selenium (Se) and Silver (Ag), was determined upstream and downstream of the Stormceptor for the five runoff events. As with other constituents, concentrations for Barium were also determined during the first flush for the first three events. The concentration of Arsenic, Mercury, Selenium and Silver were all below detection limits for the entire monitoring program. The concentration of cadmium and Chromium were also below detection, although an elevated first flush concentration was present for Event 2 of the 5 August 1997, which allowed data for this individual event to be obtained. Event 2 also provided the only measurable quantity of Lead (during both first flush and for the overall event). The concentration of Cadmium, Chromium and Lead during the first flush conditions of Event 2 sampled on August 5, 1997 are shown in

Field Monitoring Evaluation of a Westwood, Massachusetts Stormceptor® US Model STC 1200 June to November, 1997
S T O R M C E P T O R ®
- 8 -
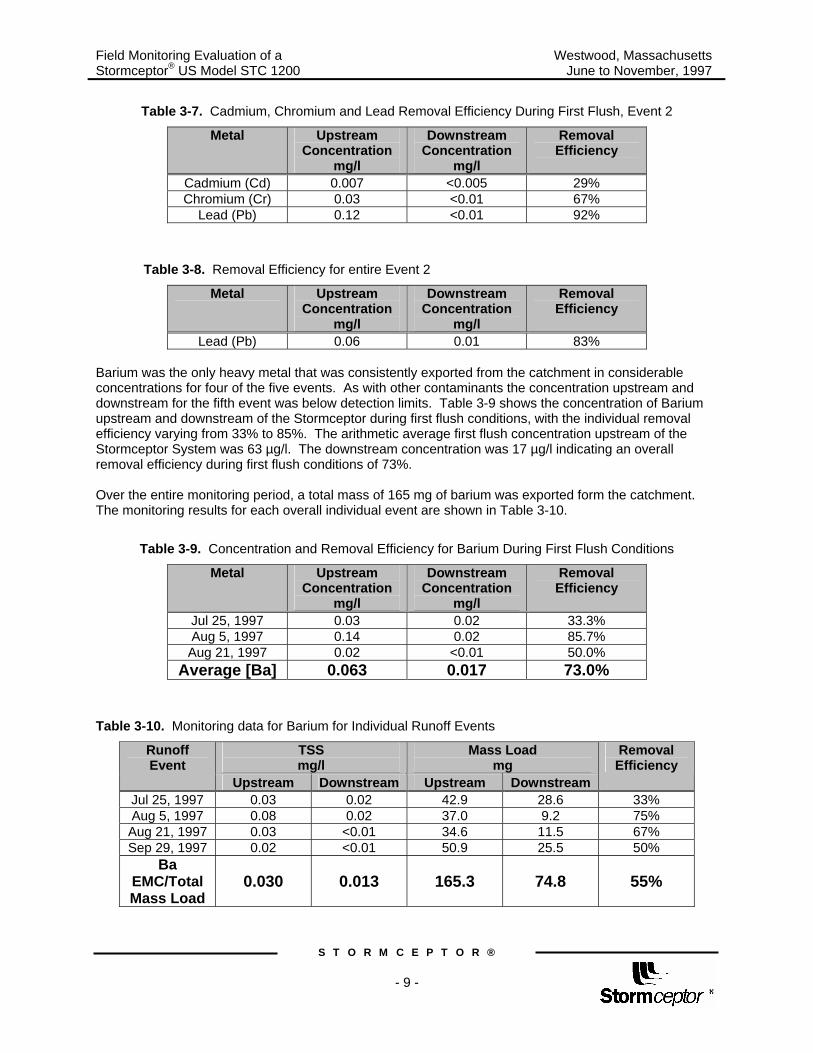
Table 3-7. The concentration of lead across the entire runoff event on August 5, 1997 is shown in Table 3-8. The elevated heavy metal concentrations during event 2 coincide with this event also providing by far the greatest total suspended solids concentration during both the initial first flush runoff and for the whole runoff event.
Field Monitoring Evaluation of a Westwood, Massachusetts Stormceptor® US Model STC 1200 June to November, 1997
S T O R M C E P T O R ®
- 9 -
Table 3-7. Cadmium, Chromium and Lead Removal Efficiency During First Flush, Event 2
Metal Upstream Concentration
mg/l
Downstream Concentration
mg/l
Removal Efficiency
Cadmium (Cd) 0.007 <0.005 29% Chromium (Cr) 0.03 <0.01 67%
Lead (Pb) 0.12 <0.01 92%
Table 3-8. Removal Efficiency for entire Event 2
Metal Upstream Concentration
mg/l
Downstream Concentration
mg/l
Removal Efficiency
Lead (Pb) 0.06 0.01 83% Barium was the only heavy metal that was consistently exported from the catchment in considerable concentrations for four of the five events. As with other contaminants the concentration upstream and downstream for the fifth event was below detection limits. Table 3-9 shows the concentration of Barium upstream and downstream of the Stormceptor during first flush conditions, with the individual removal efficiency varying from 33% to 85%. The arithmetic average first flush concentration upstream of the Stormceptor System was 63 µg/l. The downstream concentration was 17 µg/l indicating an overall removal efficiency during first flush conditions of 73%. Over the entire monitoring period, a total mass of 165 mg of barium was exported form the catchment. The monitoring results for each overall individual event are shown in Table 3-10.
Table 3-9. Concentration and Removal Efficiency for Barium During First Flush Conditions
Metal Upstream Concentration
mg/l
Downstream Concentration
mg/l
Removal Efficiency
Jul 25, 1997 0.03 0.02 33.3% Aug 5, 1997 0.14 0.02 85.7% Aug 21, 1997 0.02 <0.01 50.0%
Average [Ba] 0.063 0.017 73.0%
Table 3-10. Monitoring data for Barium for Individual Runoff Events
TSS mg/l
Mass Load mg
Runoff Event
Upstream Downstream Upstream Downstream
Removal Efficiency
Jul 25, 1997 0.03 0.02 42.9 28.6 33% Aug 5, 1997 0.08 0.02 37.0 9.2 75% Aug 21, 1997 0.03 <0.01 34.6 11.5 67% Sep 29, 1997 0.02 <0.01 50.9 25.5 50%
Ba EMC/Total Mass Load
0.030 0.013 165.3 74.8 55%

Field Monitoring Evaluation of a Westwood, Massachusetts Stormceptor® US Model STC 1200 June to November, 1997
S T O R M C E P T O R ®
- 10 -
The mass load downstream of the Stormceptor was 75 mg, indicating retention of 55% of the Barium load across the four runoff events. The event mean concentration from the catchment was 30 µg/l. The event mean concentration downstream of the Stormceptor was 13 µg/l. Individual removal efficiencies varied from 33% to 75%. Like other heavy metal elements, Event 2, which occurred on August 5, 1997, provided by far the greatest concentration in Barium, both during the first flush and for the overall event. There appears to be a strong correlation between all heavy metal components and the concentration of total suspended solids as noted previously. Event 2, also provided the highest removal efficiency for suspended solids, and this too is reflected in the highest removal efficiencies achieved across all heavy metals, including Barium. It is noted that the composite concentration of total suspended solids for Event 2 (400 mg/l) is some five times higher than the next highest concentration, for Event 3 (August 21, 1997) 86 mg/l, the actual mass load, while still being greater than other events, is not as pronounced as the concentration. It therefore appears that the most significant influence on heavy metal concentrations it eh concentration of total suspended solids rather than the total mass load.

R E S E A R C H A N D D E V E L O P M E N T
APPENDIX 1
LABORATORY ANALYTICAL REPORTS POLLUTANT ANALYSIS


R E S E A R C H A N D D E V E L O P M E N T
APPENDIX 2
LABORATORY ANALYTICAL REPORTS PARTICLE SIZE ANALYSIS