field and laboratory procedures for investigating the...
TRANSCRIPT

Field and laboratory procedures for investigating the fouling process within railway track ballast Brennan Bailey, D. Jean Hutchinson & Duncan Gordon Department of Geological Sciences and Geological Engineering, Queen’s University, and the GeoEngineering Centre at Queen’s-RMC, Kingston, Ontario, Canada Greg Siemens Department of Civil Engineering, Royal Military College of Canada, and the GeoEngineering Centre at Queen’s-RMC, Kingston, Ontario, Canada Mario Ruel CN Rail, Montreal, Quebec, Canada ABSTRACT This project details the field and laboratory methods designed and employed to investigate railway track fouling near Joliette, QC. A field trenching methodology was developed to obtain samples at specific locations within the rail embankment. During the investigation, the exposed trench wall was assigned a geotechnical classification based on the level of fouling and field observations of the density of the material. Laboratory work was then conducted, including sieving and hydrometer tests, to determine the grain size distribution. LA Abrasion tests were conducted to examine the potential for the ballast rock to abrade under impact loading, and mineralogical analyses have been initiated to examine the origin of the fine grained materials. The data was entered into a geotechnical database for use in the analysis of the fouling process. By analysis of the difference in grain size distributions, abrasion characteristics and mineralogy of the ballast rock types, the physical relationships between railway ballast, subgrade, and track fouling can be investigated. RÉSUMÉ Ce projet de détails les méthodes de terrain et de laboratoire conçus et utilisés pour étudier l'encrassement des voies ferrées près de Joliette, QC. Une méthodologie tranchées terrain a été élaboré pour obtenir des échantillons à des endroits précis dans le remblai ferroviaire. Au cours de l'enquête, la paroi de la tranchée exposés a été attribué une classification géotechnique basée sur le niveau de l'encrassement et observations sur le terrain de la densité du matériau. Le travail en laboratoire a ensuite été menée, y compris les essais de tamisage et le densimètre, pour déterminer la distribution granulométrique. LA tests d'abrasion ont été menées pour examiner le potentiel de la roche de ballast pour roder sous chargement d'impact, et des analyses minéralogiques ont été entrepris pour examiner l'origine des matériaux à grains fins. Les données ont été entrées dans une base de données géotechnique pour l'utilisation dans l'analyse du processus de l'encrassement. Par l'analyse de la différence dans les distributions de taille des grains, caractéristiques à l'abrasion et la minéralogie des roches de ballast, les relations physiques entre le ballast de chemin de fer, plate-forme, et de l'encrassement des voies peut être étudié. 1 INTRODUCTION The fouling of railway ballast, wherein fine grained materials become mixed with the coarse aggregate used to construct the rail track bed, is a wide-spread issue for railways world-wide. Eventually, as fouling progresses, the fine grained material will accumulate on the ballast surface, as shown in Figure 1.
Figure 1. Exposure of clean ballast (left) and heavily fouled ballast (right), on the surface of the rail embankment.
Fouling creates conditions of poor drainage and increased deformation of the embankment, resulting in accelerated track lifting and maintenance activities (Selig and Waters, 1994).
Rail ballast is rock aggregate ranging in size between 25 mm and 65 mm, placed in a 0.3 m thick layer underlying the rail track, to provide stability and free draining conditions. It overlies the sub-ballast layer, which is not controlled by specification, but generally comprises sand sized particles. The Fouling Index by Selig and Waters (1994) characterizes fouled ballast as ballast with > 10% material weight passing the 4.76 mm sieve, the particle size range which constitutes fine sand, silt, and clay particles. This can cause soft track conditions and destabilization of the embankment, leading to slow orders for passing trains, until the problem can be mitigated. Since the track is under regular and constant use, detailed

investigation and study into the causes of fouling are limited in scope and duration by the need to maintain track usability. This paper describes the sample collection process, testing and analytical process, from compiling and interpreting the data of 150 samples.
Historically, the study of fouling in-situ has been limited to shallow test pits, cone penetrometers tests, and geophysics. Previous studies have incorporated seismic surveys of model tracks, based on identifying zones of low shear strain modulus which indicates fouled ballast (Anbazhagan et al, 2011), or the use of ground penetrating radar to define the depth of fouling, based on the presence of water retained within the fouled sections (Grainger, 2001; Hyslip et al, 2003; Sussman et al, 2003). Studies incorporating shallow test pits and cone penetrometer testing yielded good characterization data for the extent and nature of track fouling, but ultimately were not able to discriminate the source of the fouling material (Brough et al, 2003 a and b). Drilling of railway track embankments is costly and permits some geotechnical characterization, but only a limited volume of sample material is available for laboratory analysis.
Track ballast investigations have also been conducted with mineralogical analysis and petrography, which yielded important observations into the chemical weathering potential, abrasion ability, and shear characteristics of different ballast rocks (Watters et al, 1987). These previous ballast fouling investigations were sufficient to characterize the extent, nature, and strength parameters of fouled ballast in great detail. However, the amount and resolution of the gathered data was not sufficient to produce conclusions regarding the source of the fouling material, along with its subsequent progression into the track ballast.
To expand on historical ballast investigations, CN Rail provided the opportunity to sample the ballast and sub-ballast during a longer-duration, extensive track undercutting maintenance program. This required the development of a field program to collect data for later laboratory investigation to investigate the source and progression of the track fouling phenomena. A 6 week field investigation was conducted on a stretch of CN Rail track within the Jolliette, QC sub between May, 2010 and June, 2010, concurrent with the undercutting maintenance of a 16 km section of track. A detailed geotechnical and mineralogical analysis of fouled and unfouled ballast units was explored through trenching and sampling on site, and subsequent laboratory work.
Maintenance of the track during the undercutting process involves lifting the rails, cutting the top 0.3m of ballast out, replacing the recycled ballast, and lowering the rails. This is followed by the additional stages of adding new ballast and tamping and shaping the new ballast. The new ballast comprises a combination of fresh ballast and ballast returned from a grizzly screen which removes the rock pieces that no longer meet the ballast size specification. Fourteen different machines are required to perform the different components of this work. 2 BACKGROUND
2.1 Study Site The Joliette Sub field site was chosen to align with scheduled undercutting maintenance, which provided access to the equipment and railway personnel required for ballast investigation. The study area lies between the towns of Joliette and St. Justin, QC, as shown in Figure 2.
Figure 2. Location of Joliette Sub and track research area. The track under study is standard gauge, with wooden ties, and is a part of the CN east-west mainline servicing the eastern half of Canada. The surficial geology of this section of track comprises the clay plains characteristic of the St. Lawrence lowlands (Berry and Torrance, 1998), as described more fully in Bailey et al (2011, this conference).
The rock types found within the track ballast were predominately amygdaloidal basalt and limestone, both of which are derived from local quarries. Slag and granitic rocks were also found within the samples. The range of rock types within the track ballast was due to historic undercutting operations replacing worn ballast with different materials at different times.
The three primary hypotheses postulated to describe the possible modes of fouling were used as the main criteria for designing the field and laboratory work. The possible modes are in-place abrasion of ballast (with local, distributed impact), intrusion from an external source (with regional impact), and pumping of subgrade through the ballast (with local, focused impact) (Figure 3).

Figure 3. Potential sources of fouling materials within railway embankments.
2.2 Specified Ballast The 1996 Canadian National Railway’s Specification for Crushed Rock Ballast calls for specific criteria to ensure durability and stability of the ballast layer. The grain size distribution range for fresh ballast is presented in Table 1 and Figure 4. Table 1: CN Rail ballast grain size distribution specification (1996).
Sieve Size % Passing
Coarse Gravel
2 ½ “ 63 mm 100 2 ” 50 mm 75 to 100
1 ½ “ 37.5 mm 45 to 80 1 “ 25 mm 0 to 35
Fine Gravel ¾ “ 19 mm 0 to 5 ½ “ 12.5 mm -
Sand No. 4 4.75 mm -
Fine Grained No. 200 0.075 mm 0 to 1
Figure 4: Grain size distribution for CN Specified ballast, based on CN Specification (1996). The ballast rock should be strong, with minimal structure that may form planes of weakness. Less than 30% of the material can be ‘flat’, defined as having height/length dimensions greater than 1:2. At least three of faces of each piece must be freshly broken. Lastly, the ballast must have less than 20% abrasion loss, as tested in the
LA Abrasion equipment. These specifications are designed to provide a ballast layer with long lasting strength to support train loads, while providing suitable drainage for the track (CN Ballast Specification, 1996). 3 FIELD INVESTIGATION METHODS Samples were taken during the undercutting project conducted on the Joliette Subdivision between track mile code 83.5 to 101.3. The availability of a backhoe and a suitable location for its setup beside the tracks limited the research team’s ability to select specific trenching locations. In addition, trenches had to be established within a section of track that would be immediately undercut and repaired once research was complete. This was necessary to ensure that the track structure was re-built by the end of the track-shutdown maintenance to permit normal train operation the following day. Thus, nightly trenching and research were primarily controlled by the starting position of the undercutter train prior to the start of maintenance. To minimize conflicts with maintenance operations, a maximum of two trenching sites were permitted each night by CN maintenance personnel. A total of 38 locations were studied and trenched between late April and mid June, 2010.
Geotechnical characterization and trenching of study sites was carried out to meet a specific list of study criteria. The sampling method developed had to capture the fine material, along with the coarse ballast, so as to later produce accurate grain size distributions from sieving and hydrometer tests. Sampling depths and locations were also kept in a standard configuration for each trench, to allow for subsequent comparative analysis of ballast material from all sampling sites. A geotechnical classification of the degree of fouling, and site/trench photographs were recorded for each study site. A database, permitting evaluation of the site fouling was constructed, incorporating these results.
3.1 Site Characterization Geotechnical data was recorded for each trenching site, including track geometry and any unique site conditions, such as proximity to a road crossing. Photographs of the surrounding terrain, track surface, track shoulders, and ditches were taken before excavation took place. Further characterization included measuring the track geometry; embankment width, height, and ditch depth. Any voids found within the embankment material were also measured and recorded. Land use information was recorded to help determine if track geometry or surrounding land use correlates to the degree of fouling within a rail embankment. All of this information has been incorporated into a database to permit evaluation of observed surface conditions in relation to fouling severity.
The apparent fouling severity of the ballast at the study site was also subjectively characterized as high, medium, or low fouling. Examples from trench excavations are shown in Figure 5. The subjective rating of the degree of fouling depended on the amount of mud intrusion observed, and the cohesiveness of the mixture.

Figure 5: Examples of the condition of the ballast under the centre of the wooden tie. Left: Joliette Mile 92.8, lightly fouled; Right: Joliette Mile 98.7, heavily fouled. 3.2 Trenching Exploratory trenches were excavated parallel to rail ties and perpendicular to the rail, using a backhoe. The removal of a tie, by CN personnel, was required to provide adequate space for the backhoe shovel to dig a trench between the ties. In the first stage, each trench was excavated to approximately 1m width, 3m length and 1m depth. Samples were taken from the locations and depths defined in Figure 6. Once the trench was completed, in the second stage, samples of the material exposed under the ties were excavated by hand.
Figure 6: Plan view of a standard gauge rail track and project sampling codes.
Due to the width of the backhoe bucket (~ 60 cm), the first stage samples included material from between the ties and from under the removed tie. Thus, samples coded as BT (between tie) comprise roughly 1/3 of UT (under tie) material and 2/3 of BT (between tie) materials. Lifts of ~15 cm were removed by the backhoe operator at a time to allow for sampling at specific depths and locations within the embankment. The most common sampling depths were: 15 cm, 30 cm, 45 cm, and 60 cm (all relative the top of the ties). The removal of the tie also permitted sampling from the sections of the embankment not otherwise accessible – the shoulder and sections below the rails. 3.3 First Stage Sampling Procedure
During the first stage, samples were taken from the ballast excavated using the backhoe shovel. Sample bags were prepared with the date, mile marker, sample code, and depth. Specific depths and locations within the embankment were then communicated to the back-hoe operator, to facilitate rapid sampling of the ballast and sub-ballast units. The sampling procedure included the following steps: • Once the area of interest was excavated, ballast
material within the hoe bucket was either accepted or rejected, based on the following criteria for visual inspection: o Material was taken from the required depth and
location. o Material was not over-contaminated with material
from other depths/horizontal extents, or organic/miscellaneous material.
o There was an adequate amount of material within the bucket to create a representative sample.
• Material was removed from the hoe-bucket with a small spade and placed into open sample bags, with care taken to lose as little material as possible. o Sampling was done from the top, middle, and
bottom of the excavated ballast section to ensure a representative sample was collected.
o Due to the cohesiveness of nearly all sampled ballast, it is expected that there was minimal fines loss during transfer.
• Sample bags were closed, bound and stored in a safe location to prevent any loss of sampled material.
The benefit of the sampling approach was that a great deal of sample material (~ 100 kg) was collected within a 30 minute period. This method allowed for the generation of a substantial number of discrete data points within each exploration trench, and the possibility to excavate many trenches during the course of the field work. Trenching ahead of the maintenance crew also permitted a rare opportunity to cross-cut existing track to study the in-place condition of the ballast and sub-ballast layers.
Care was taken during the excavation process to minimize the chance that the sample will include more than a single depth or position within the track. Without proper vigilance, samples between the 0–15 cm and 15–30 cm zones could be easily mixed. If the grain size distribution changes significantly with depth, due to fouling for example, the grain size distribution for a sample mixed over several depths would return a skewed grain size distribution curve for the sample point. The quality of the samples taken also relied to a great extent on the skill and patience of the backhoe operator.
3.4 Second Stage Sampling Procedure
The second sampling stage involved extracting ballast material from the trench wall by hand. The 38 research trenches were excavated to a depth of ~ 1 m, allowing for
sampling of the ballast within the trench wall and the sub-ballast underneath. The geotechnical characterization of the fouling level was recorded, and photographs were taken of the condition, density, fouling type, and colour of the vertical section under the center of the tie and also under the steel rail and tie.
A set of samples was then taken from the trench wall, following the sample location and labelling plan shown in Figure 5. When the ballast was thicker than 30cm under the tie, two samples were taken from the bottom of the tie to 15 cm below, and from 15 cm to 30 cm below. If there was not sufficient ballast thickness within the trench, only a single sample could be taken under the rail and tie.
Sampling was done to permit assessment of a vertical column of ballast across many trenches, to allow for analysis and comparison of the distribution of sand sized particles and fine grained material. Sampling was conducted by hand with a steel trowel. The material excavated was deposited directly into a rectangular plastic sample collection box. Due to the density and cohesiveness of much of the fouled ballast, the sample box was essential to catch any fine grained material that fell off the trench wall during the trowel excavation. Using the trench wall sampling method, a number of data points were gathered at controlled and consistent depths, in the vertical section under the rail, within the shoulders, and along a vertical section under the center of the tie.
4 LABORATORY ASSESSMENT OF BALLAST
SAMPLES After field investigation, laboratory tests on the ballast and sub-ballast samples were conducted, to determine the grain size distribution, abrasion characteristics, and lithological/mineralogical makeup. The results were recorded in a database for use in correlation and analysis.
Five separate laboratory procedures were used to procure geotechnical data from the ballast sampled. The five tests include: large pan sieving, small stack sieving, hydrometer testing, LA Abrasion testing, and Atterberg limits. A workflow diagram of the laboratory procedures is presented in Figure 7.
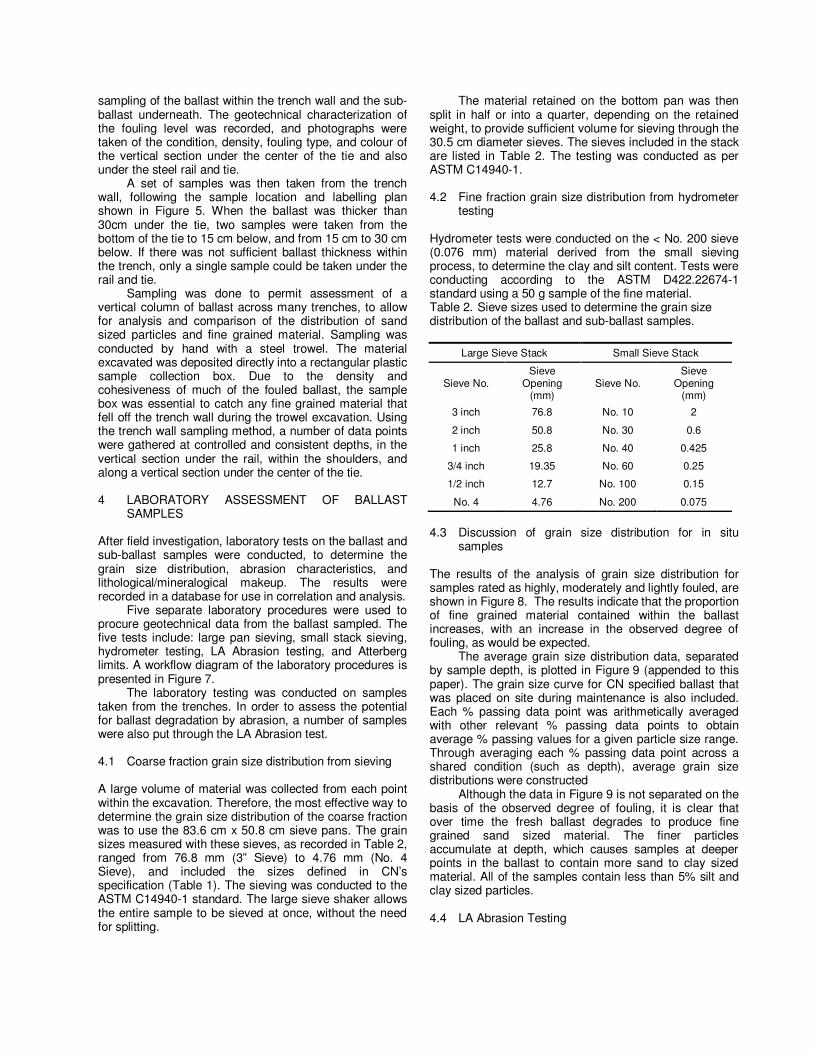
The laboratory testing was conducted on samples taken from the trenches. In order to assess the potential for ballast degradation by abrasion, a number of samples were also put through the LA Abrasion test. 4.1 Coarse fraction grain size distribution from sieving A large volume of material was collected from each point within the excavation. Therefore, the most effective way to determine the grain size distribution of the coarse fraction was to use the 83.6 cm x 50.8 cm sieve pans. The grain sizes measured with these sieves, as recorded in Table 2, ranged from 76.8 mm (3” Sieve) to 4.76 mm (No. 4 Sieve), and included the sizes defined in CN’s specification (Table 1). The sieving was conducted to the ASTM C14940-1 standard. The large sieve shaker allows the entire sample to be sieved at once, without the need for splitting.
The material retained on the bottom pan was then split in half or into a quarter, depending on the retained weight, to provide sufficient volume for sieving through the 30.5 cm diameter sieves. The sieves included in the stack are listed in Table 2. The testing was conducted as per ASTM C14940-1.
4.2 Fine fraction grain size distribution from hydrometer
testing Hydrometer tests were conducted on the < No. 200 sieve (0.076 mm) material derived from the small sieving process, to determine the clay and silt content. Tests were conducting according to the ASTM D422.22674-1 standard using a 50 g sample of the fine material. Table 2. Sieve sizes used to determine the grain size distribution of the ballast and sub-ballast samples.
Large Sieve Stack Small Sieve Stack
Sieve No. Sieve
Opening (mm)
Sieve No. Sieve
Opening (mm)
3 inch 76.8 No. 10 2
2 inch 50.8 No. 30 0.6
1 inch 25.8 No. 40 0.425
3/4 inch 19.35 No. 60 0.25
1/2 inch 12.7 No. 100 0.15
No. 4 4.76 No. 200 0.075
4.3 Discussion of grain size distribution for in situ
samples The results of the analysis of grain size distribution for samples rated as highly, moderately and lightly fouled, are shown in Figure 8. The results indicate that the proportion of fine grained material contained within the ballast increases, with an increase in the observed degree of fouling, as would be expected.
The average grain size distribution data, separated by sample depth, is plotted in Figure 9 (appended to this paper). The grain size curve for CN specified ballast that was placed on site during maintenance is also included. Each % passing data point was arithmetically averaged with other relevant % passing data points to obtain average % passing values for a given particle size range. Through averaging each % passing data point across a shared condition (such as depth), average grain size distributions were constructed
Although the data in Figure 9 is not separated on the basis of the observed degree of fouling, it is clear that over time the fresh ballast degrades to produce fine grained sand sized material. The finer particles accumulate at depth, which causes samples at deeper points in the ballast to contain more sand to clay sized material. All of the samples contain less than 5% silt and clay sized particles.
4.4 LA Abrasion Testing

LA Abrasion testing was undertaken to assess the wear characteristics of the rock types used in the ballast. Testing was done following ASTM Standard C131.3530-1, working with a total sample weight of 10 kg. As per the standard, the test sample comprised 5 kg of the sample between 2” and 1.5” particle diameter, and 5 kg of the sample between 1.5” and 1” particle diameter. Before abrasion testing commenced, the samples were sorted by rock-type, photographed, and weighed to determine the weight of each rock type in the LA mix.
The LA abrasion samples were taken from the material collected from a single trench, as often as possible. This required the mixing of coarse grained samples from several locations within the same trench, to procure the 10 kg test sample. LA abrasion tests were also conducted on specified ballast, which was put
Figure 8: Grain size distributions for layers within the ballast, sampled from sites observed in the field to be lightly, moderately and highly fouled. Separate samples were taken for each increment of 15cm in depth below the base of the tie. The base of tie can be seen at the top of each of the photographs.
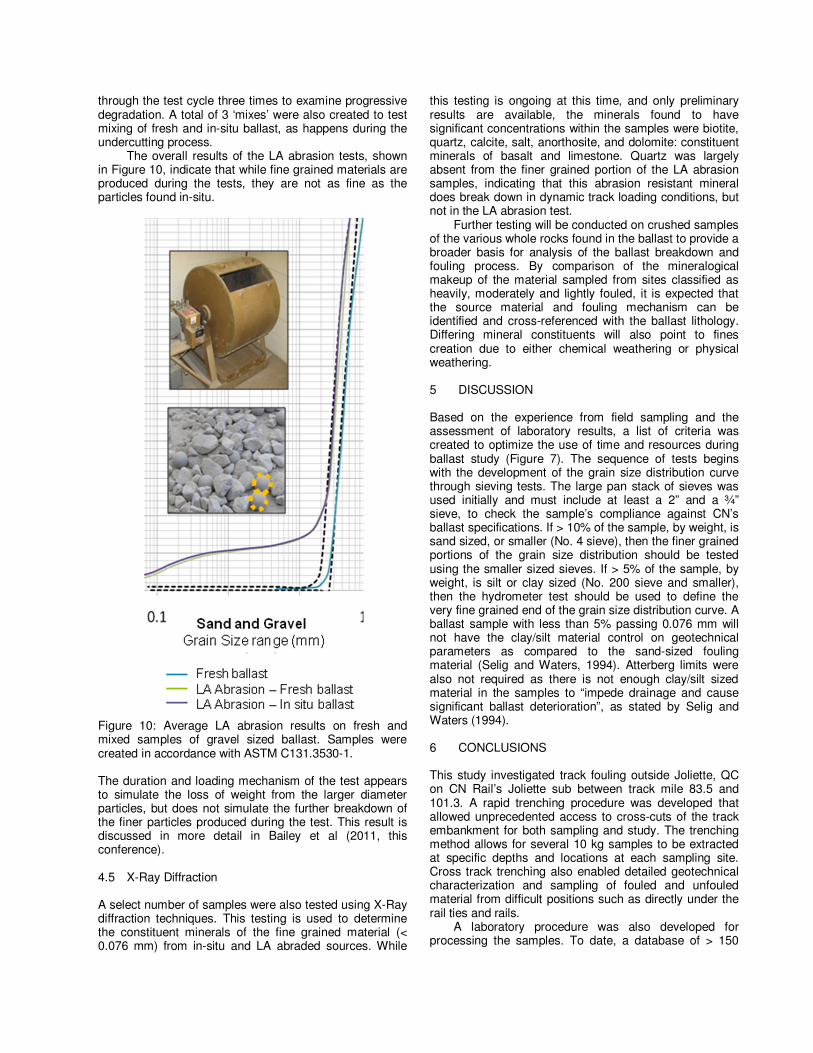
through the test cycle three times to examine progressive degradation. A total of 3 ‘mixes’ were also created to test mixing of fresh and in-situ ballast, as happens during the undercutting process.
The overall results of the LA abrasion tests, shown in Figure 10, indicate that while fine grained materials are produced during the tests, they are not as fine as the particles found in-situ.
Figure 10: Average LA abrasion results on fresh and mixed samples of gravel sized ballast. Samples were created in accordance with ASTM C131.3530-1. The duration and loading mechanism of the test appears to simulate the loss of weight from the larger diameter particles, but does not simulate the further breakdown of the finer particles produced during the test. This result is discussed in more detail in Bailey et al (2011, this conference). 4.5 X-Ray Diffraction A select number of samples were also tested using X-Ray diffraction techniques. This testing is used to determine the constituent minerals of the fine grained material (< 0.076 mm) from in-situ and LA abraded sources. While
this testing is ongoing at this time, and only preliminary results are available, the minerals found to have significant concentrations within the samples were biotite, quartz, calcite, salt, anorthosite, and dolomite: constituent minerals of basalt and limestone. Quartz was largely absent from the finer grained portion of the LA abrasion samples, indicating that this abrasion resistant mineral does break down in dynamic track loading conditions, but not in the LA abrasion test.
Further testing will be conducted on crushed samples of the various whole rocks found in the ballast to provide a broader basis for analysis of the ballast breakdown and fouling process. By comparison of the mineralogical makeup of the material sampled from sites classified as heavily, moderately and lightly fouled, it is expected that the source material and fouling mechanism can be identified and cross-referenced with the ballast lithology. Differing mineral constituents will also point to fines creation due to either chemical weathering or physical weathering.
5 DISCUSSION Based on the experience from field sampling and the assessment of laboratory results, a list of criteria was created to optimize the use of time and resources during ballast study (Figure 7). The sequence of tests begins with the development of the grain size distribution curve through sieving tests. The large pan stack of sieves was used initially and must include at least a 2” and a ¾” sieve, to check the sample’s compliance against CN’s ballast specifications. If > 10% of the sample, by weight, is sand sized, or smaller (No. 4 sieve), then the finer grained portions of the grain size distribution should be tested using the smaller sized sieves. If > 5% of the sample, by weight, is silt or clay sized (No. 200 sieve and smaller), then the hydrometer test should be used to define the very fine grained end of the grain size distribution curve. A ballast sample with less than 5% passing 0.076 mm will not have the clay/silt material control on geotechnical parameters as compared to the sand-sized fouling material (Selig and Waters, 1994). Atterberg limits were also not required as there is not enough clay/silt sized material in the samples to “impede drainage and cause significant ballast deterioration”, as stated by Selig and Waters (1994). 6 CONCLUSIONS This study investigated track fouling outside Joliette, QC on CN Rail’s Joliette sub between track mile 83.5 and 101.3. A rapid trenching procedure was developed that allowed unprecedented access to cross-cuts of the track embankment for both sampling and study. The trenching method allows for several 10 kg samples to be extracted at specific depths and locations at each sampling site. Cross track trenching also enabled detailed geotechnical characterization and sampling of fouled and unfouled material from difficult positions such as directly under the rail ties and rails.
A laboratory procedure was also developed for processing the samples. To date, a database of > 150

sample points has been generated, detailing ballast grain size distribution, clay/silt content, abrasion characteristics, land use patterns, and ballast rock type.
Analysis of this data set will permit assessment of the source material and ballast degradation mechanism, as well as the extent, severity and progression of ballast fouling to be determined. ACKNOWLEDGEMENTS The writers would like to acknowledge the contribution of CN Rail personnel, including Mario Beaupre, for organizing and accommodating the field research. Also, thanks to the Royal Military College and Joe Dipietrantonio for facilitating the use of laboratory equipment. 4th year Geological Engineering students, Jenn Day, Michaela Kuuskman, and Claire MacCallum, are thanked for their laboratory work on the fine grained portion of these materials, carried out for a 4th year engineering design project.
Financial assistance provided by CN Rail, CP, and NSERC through a CRD grant are gratefully acknowledged.
REFERENCES Anbazhagan, P., Indraratna, B., Rujikiatkamjorn, C. and
Su, L. 2010. Using a seismic survey to measure the shear modulus of clean and fouled ballast, Geomechanics and Geoengineering, 5 (2), 117-126.
Berry, R.W., and Torrance, J.K. 1998. Mineralogy, grain-size distribution and geotechnical behaviour of Champlain Clay core samples. Quebec. The Canadian Mineralogist, 36, 1625-1636.
Brough, M., Stirling, A., Ghataora, G., and Madelin, K. 2003. Evaluation of railway trackbed and formation: a case study. NDT&E International, 36, 145-156.
Brough, M.J. Ghataora, G.S., Stirling, A.B., Madelin, K.B.. Rogers, C.D.F., and Chapman, D.N. 2003. Investigation of railway track subgrade. 1: In-situ assessment. Proceedings of the Institution of Civil Engineers, Issue TR3, 145-154.
Grainger, P. 2001. New trackbed investigation techniques. Proceedings of the Institution of Civil Engineers - Transport, 147 (4), 221-215.
Hyslip, J.P., Smith, S.S., Olhoeft, G., and Selig, E. 2003. Assessment of railway track substructure condition using ground penetrating radar. Proc. Annual Meeting American Railway Engineering and Maintenance-of-way Association, Chicago.
Selig, E.T., and Waters, J.M. 1994. Track Geotechnology and Substructure Management. Thomas Telford Services Ltd, London, UK.
Sussman, R.T., Selig, E.T., and Hyslip, J.P. 2003. Railway track condition indicators from ground penetrating radar. NDT&E International, 36, 157-167.
Watters, B.R., Klassen, M.J, and Clifton, A.W. 1987. The evaluation of ballast materials using petrographic criteria. Session on Performance of aggregate in railroad, Transportation Research Board, Washington, D.C.

Figure 7: Laboratory work flow for processing ballast and sub-ballast samples.
Figure 9: Average grain size distribution curves for ballast samples taken from different depths, and sub-ballast material.