fidusia abstrak the synergy between islamic financial
TRANSCRIPT
Jurnal Fidusia Volume 4 No 1 – April 2021│1
THE IMPACT OF SYNERGY BETWEEN ICB AND ISLAMIC FINTECH
LENDING ON THE ICB’S FINANCIAL PERFORMANCES
1Muhammad Anif Afandi,
2Slamet Tedy Siswoyo
1,2 Study Program of Associate’s Degree of Banking and Finance, Faculty of Economics
and Business, Universitas Muhammadiyah Metro
E-mail: [email protected] 1
FIDUSIA
Jurnal Ilmiah Keuangan
dan Perbankan
ISSN Cetak : 2621-2439
ISSN Online : 2621-2447
Kata kunci: Synergy, Islamic
Commercial Bank, Islamic
FinTech Lending, Financial
Performances
ABSTRAK
The synergy between Islamic financial institutions is one key in the
development of Islamic economics as stated in the Masterplan for
Islamic Economics of Indonesia 2019 - 2024. In 2018, three Islamic
Commercial Banks (ICB), namely Bank Mega Syariah (BMS), Bank
BNI Syariah (BNIS) and Bank Syariah Mandiri (BSM) conducting
synergy with Islamic FinTech lending in the form of shadow investors.
Through this study carried out analysis of the impact of synergy between
ICB and Islamic FinTech lending on the ICB’s financial performances
as one reflection of the success of the synergy and economic indicators
that reflect the responsibility of the ICB to the regulator. Wilcoxon
signed-ranks test is used as a data analysis technique with the results of
study showing that sequentially the synergy most profitable for the BSM
because of the positive impact on financial performances, especially in
the aspect of capital, profitability, efficiency and asset quality. While,
for BNIS known synergy has a positive impact on financial
performances, especially in the aspect of capital, liquidity and
efficiency. Meanwhile, for BMS is known that the synergy only has a
positive impact on financial performances, especially in the aspect of
asset quality. The results of this study are beneficial for the ICB, Islamic
FinTech lending as well as the regulator as material to the evaluation or
formulation of policy regarding synergy between ICB and Islamic
FinTech lending in Indonesia.
Sinergi antar lembaga keuangan syariah merupakan salah satu kunci
dalam pengembangan ekonomi syariah seperti yang tertuang dalam
Masterplan Ekonomi Syariah 2019 – 2024. Pada tahun 2018, tiga Bank
Umum Syariah (BUS) yaitu Bank Mega Syariah (BMS), Bank BNI
Syariah (BNIS) dan Bank Syariah Mandiri (BSM) melakukan sinergi
dengan FinTech lending syariah dalam bentuk shadow investors.
Melalui penelitian ini, ingin dilakukan analisis dampak sinergi antara
BUS dan FinTech lending syariah tersebut terhadap kinerja keuangan
BUS sebagai salah satu cerminan dari keberhasilan sinergi tersebut dan
indikator ekonomi yang mencerminkan tanggung jawab BUS kepada
regulator. Wilcoxon signed-ranks test digunakan sebagai teknik analisis
data dengan hasil penelitian yang menunjukkan bahwa secara
berurutan sinergi tersebut paling menguntungkan bagi BSM karena
berdampak positif terhadap kinerja keuangannya khususnya pada aspek
permodalan, rentabilitas, efisiensi dan kualitas aset. Sedangkan, bagi
BNIS diketahui sinergi tersebut berdampak positif terhadap kinerja
keuangannya khususnya pada aspek permodalan, likuiditas dan
efisiensi. Sementara itu, bagi BMS diketahui sinergi tersebut hanya
berdampak positif terhadap kinerja keuangannya khususnya pada aspek
kualitas aset. Hasil penelitian ini bermanfaat baik bagi BUS, FinTech
lending syariah maupun regulator sebagai bahan evaluasi maupun

Jurnal Fidusia Volume 4 No 1 – April 2021│2
perumusan kebijakan sinergi antara BUS dan FinTech lending syariah
di Indonesia.
I. INTRODUCTION
In the beginning, consulting firms such as McKinsey&Company (2016) and
PricewaterhouseCoopers (2016), mainstream media outlets such as The Economist
(2015) and The New York Times (2016) as well as other parties reported that the
presence of FinTech lending as new-entrants in the financial industry is predicted to
become a new competitor and disrupt the business model of its incumbents namely
banking. However, the situation is not entirely the case but rather the opposite, they
instead do a partnership that can deliver benefits for both the industry, the
community and the economy in general.
According to Kelly, Ferenzi and McGrath (2017), financial institutions
including bank has competitive advantages such as brand/name recognition, large
customer base, diverse financial products, comprehensive customer data, experience
in term of risk management, access to capital and other. Meanwhile, FinTech has the
competitive advantages including the culture of innovation, cheaper, speed,
disruptive mindset, technological expertise, customer data analytics and other. If
from each of the competitive advantages owned by banking and FinTech is
synergized, then it can give mutual benefits such as increasing reach to the
customers, improving of the position of the competitive advantages owned by each
industry and increasing the efficiency of the product (Kelly, Ferenzi and McGrath,
2017).
The good news comes from three Islamic Commercial Banks (ICB) in
Indonesia (before two of them conducted merger) because they have been conducting
synergy with Islamic FinTech lending in the form of shadow investors since 2018.
Synergy conducted by ICB and Islamic FinTech lending is in accordance with what
is expected in the institutional development of Islamic finance to support national
economic development as stipulated in the Masterplan for Islamic Economics of
Indonesia 2019 - 2024 (Bappenas, 2019). Synergy is also a real step in strengthening
the ecosystem of sharia economy in Indonesia, which required collaboration between
institutions and economic actors as a whole.
The synergy between ICB and Islamic FinTech lending is fresh and such an
interesting topic to study scientifically, especially to be able to compare the impact of
synergy on the financial performances of each ICB that can be used as one reflection
of the success of the synergy and indicators to measure corporate responsibility to the
regulator (Aminah, Soewito, Erina, Khairudin and Damayanti, 2019). However,
studies on this topic were still very rarely as conducted by Chotib, Rifa'i and Hidayat
(2019) and Haris, Iqbal and Hadiyati (2020). Both of these studies use qualitative
research approach that aims to explain the models of the synergy that can be
conducted by ICB and FinTech as well as to formulate the benefits and challenges of
synergy between ICB and FinTech.
In addition, other studies discussed the financial performances of ICB in
Indonesia in a wide variety of contexts such as determinants of financial
performances of ICB (Mukhibad and Khafid, 2018; Muflih and Human, 2019),
comparison of the financial performances of ICB with Conventional Commercial
Banks (CCB) (Ika and Abdullah, 2011; Toin, 2014; Fakhri, Anwar, Ismal and

Jurnal Fidusia Volume 4 No 1 – April 2021│3
Ascarya, 2019), comparison of the financial performances of ICB in Indonesia with
ICB in another country (Septiari and Mazlifani, 2018), comparison of the financial
performances of ICB before and after the global financial crisis (Setyawati, Suroso,
Suryanto and Nurjannah, 2017; Muhammad and Triharyono, 2019), comparison of
the financial performances of ICB before and after spin-off (Siswantoro, 2014; Al-
Arif, Nachrowi, Nasution and Mahmud, 2017) and calculation of the financial
performances of ICB using a variety of methods (Rusydiana and Sanrego, 2018;
Hidayat Oktaviani and Aminudin, 2019).
Based on the previous studies above, there is a research gap that can be filled
through this study, which is one of the objectives of this study conducted. The
difference of this study with previous studies based on the research gap: first, this
study used quantitative research approach with the method of Wilcoxon signed-ranks
test that aims to compare the impact of the synergy between ICB and Islamic
FinTech lending on the financial performances of the three ICB before and during
synergy with Islamic FinTech lending. Second, the context of this study is a new
issue and interesting topic to conduct study in depth. The results of this study are
beneficial both for the ICB, Islamic FinTech lending and the regulator as material to
the evaluation and formulation of policy regarding synergy between ICB and Islamic
FinTech lending in Indonesia.
II. LITERATURE REVIEW
A. The Synergy between ICB and Islamic FinTech Lending and Its Impact on
the ICB’s Financial Performances
In its operations, ICB and Islamic FinTech lending has a relative
semblance which is conducting of funding and financing even though on the
Islamic FinTech lending only serves as a facilitator between investors and
customers. However, although similar, but each service has a competitive
advantage. The competitive advantages of banking services compared FinTech
lending such as brand/name recognition, large customer base, diverse financial
products, comprehensive customer data, experience in term of risk
management, access to capital and other. While, the competitive advantages of
FinTech lending services than banking services such as culture of innovation,
cheaper, speed, disruptive mindset, technological expertise, customer data
analytics and other (Kelly, Ferenzi and McGrath, 2017).
Amid the competitive advantages owned by banking and FinTech
lending services, the two financial institutions can perform a synergy that can
provide mutual benefits such as increasing reach to the customers, increasing
the position of the competitive advantages owned by each industry and
increasing the efficiency of the product (Kelly, Ferenzi and McGrath, 2017).
The synergy between both institutions is ultimately expected to be a positive
influence on the financial performances of each industry especially for ICB to
be a reflection of the success of synergy and as an indicator for measuring the
responsibility of the company to the regulator (Aminah, Soewito, Erina,
Khairudin and Damayanti, 2019).
B. Previous Studies
As has been described in the previous chapter that previous studies on
this topic tend to be limited and require further study that serves to analyze the

Jurnal Fidusia Volume 4 No 1 – April 2021│4
impact of the synergy between ICB and Islamic FinTech lending on the ICB’s
financial performances. In this section described regarding the two previous
studies in the context of this study so that it can become the research base and
determine the research gap or novelty.
Chotib, Rifa'i and Hidayat (2019) conducted studied regarding the
synergy between FinTech lending and banking as a marketing strategy for
banking in Indonesia. Using a qualitative research approach with the method of
phenomenology, the study concluded that the existence of FinTech lending as a
new player in the financial industry should be taken advantage by the banks to
make synergy with the FinTech lending as a way to expand financing to
MSMEs and as a marketing strategy for banking.
Haris, Iqbal and Hadiyati (2020) conducted a study on the synergy
between the Islamic bank and FinTech in the development of MSMEs in
Indonesia. Using a qualitative research approach using interview method to the
regulator for banking and FinTech as well as both industries, the results of the
study concluded that the model of the synergy that can be carried out by Islamic
banks and FinTech divided into six models, namely cross selling, channeling
and joint financing, referral, shadow investors, outsourcing platform,
acquisition or FinTech consortium.
The two previous studies above tend to still use the qualitative research
approach and have not yet measure the impact of synergy on the financial
performances of ICB. Therefore, based on the research gap above, this study is
conducted using a quantitative research approach using the method of Wilcoxon
signed-ranks test to determine differences in the financial performances of ICB
before and during synergy with Islamic FinTech lending which is measured
using indicators of capital, profitability, efficiency, liquidity and asset quality.
III. RESEARCH METHODS
A. Data
This study uses secondary data with the type of data quarterly starting
from quarter-I 2016 to quarter-IV 2019 sourced from the website of the three
ICB which conducting synergy with Islamic FinTech lending in Indonesia since
2018 namely Bank Mega Syariah (BMS), Bank BNI Syariah (BNIS) and Bank
Syariah Mandiri (BSM) to compare the financial performances of the three ICB
before and during synergy with Islamic FinTech lending.
The financial performances of the ICB are measured using proxy of
some financial ratios namely Capital Adequacy Ratio (CAR) which reflects
capital, Return on Assets (ROA) which reflects profitability, Operational
Efficiency Ratio (OER) which reflects efficiency, Financing to Deposit Ratio
(FDR) which reflects liquidity and Non-Performing Financing (NPF) which
reflects asset quality (Toin, 2014; Anwar, 2016).
B. Research Method
After conducted data collection, further conducted data processing using
the method of paired t-test. According to Gerald (2018), the method of paired t-
test can be used when the observation data collected in the form of data pairs. In
other words, two data samples that are used have a dependency or can explain

Jurnal Fidusia Volume 4 No 1 – April 2021│5
the other samples. The model paired t-test used in this study as follows (Gerald,
2018):
(1)
where:
= number of samples (n = 16)
= mean difference between the first result and the second result from each
individual data which is calculated using the formula where i =
1, 2, 3, …. , n (each individual data used), = the first result from each
individual data used, = the second result from each individual data used and
= mean value of the total difference between the first result and the second
result from each individual data used.
Hypothesis:
H0 = data are no significant difference
H1 = data are significant difference
However, because the sample used in this study consisted only 16
individual data to compare the financial performance of the three ICB before
and during synergy with Islamic FinTech lending, then before testing the paired
t-test necessary to test the data normality using the indicator value of the
Kolmogorov-Smirnov and Shapiro-Wilk which each must have a value > 0.05. If from the results of the normality test found the data not normally
distributed, then H0 is accepted and paired t-test cannot be done and replaced
with non-parametric statistics test to calculate the mean difference between the
first result and the second result from each individual data using the Wilcoxon
signed-ranks test which is calculated using the following formula (Oyeka and
Ebuh, 2012):
(2)
where:
= Z score result of the calculation of Wilcoxon signed-ranks test
= number of positive ranking
= number of samples used (n = 16)
Hypothesis:
H0 = data are no significant difference
H1 = data are significant difference
IV. RESULTS AND DISCUSSIONS
A. The Results of Data Normality Test
Prior to test of the paired t-test in particular to the relatively small
samples used, it is necessary to test the data normality to ensure the accuracy of
the use of paired t-test method. The output of data normality test used in this
study is shown in the table as follows:
Jurnal Fidusia Volume 4 No 1 – April 2021│6
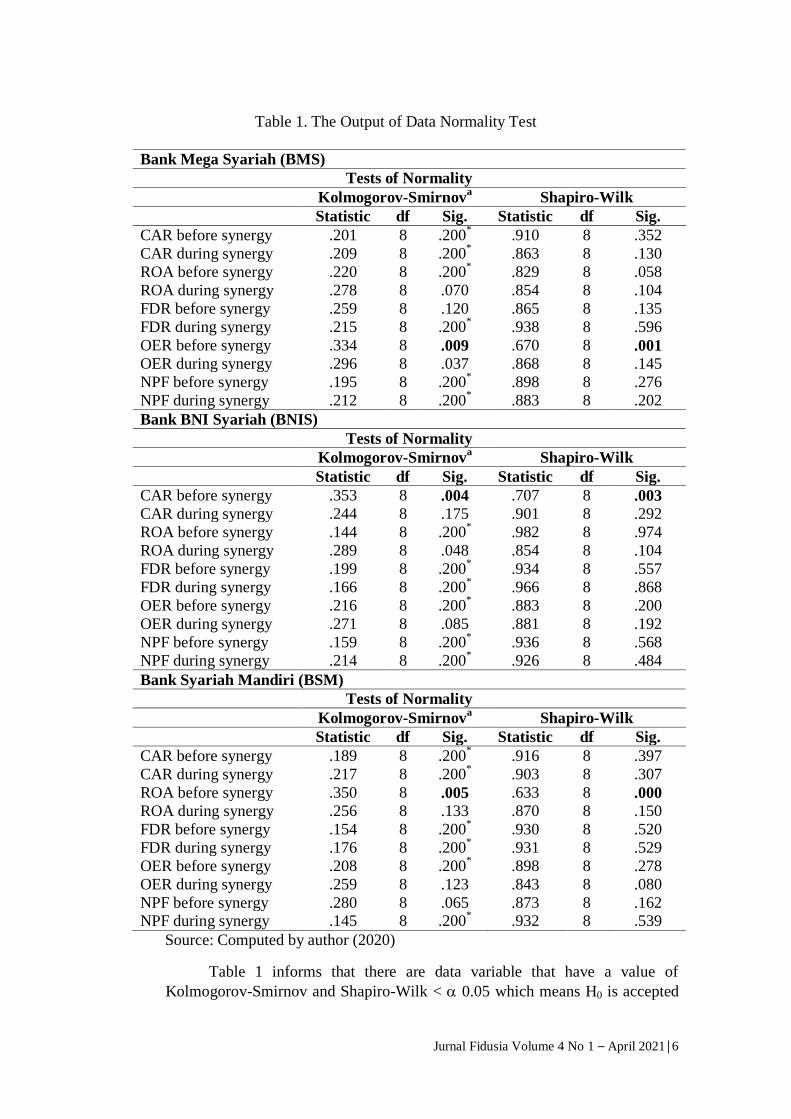
Table 1. The Output of Data Normality Test
Bank Mega Syariah (BMS)
Tests of Normality
Kolmogorov-Smirnova Shapiro-Wilk
Statistic df Sig. Statistic df Sig.
CAR before synergy .201 8 .200* .910 8 .352
CAR during synergy .209 8 .200* .863 8 .130
ROA before synergy .220 8 .200* .829 8 .058
ROA during synergy .278 8 .070 .854 8 .104
FDR before synergy .259 8 .120 .865 8 .135
FDR during synergy .215 8 .200* .938 8 .596
OER before synergy .334 8 .009 .670 8 .001
OER during synergy .296 8 .037 .868 8 .145
NPF before synergy .195 8 .200* .898 8 .276
NPF during synergy .212 8 .200* .883 8 .202
Bank BNI Syariah (BNIS)
Tests of Normality
Kolmogorov-Smirnova Shapiro-Wilk
Statistic df Sig. Statistic df Sig.
CAR before synergy .353 8 .004 .707 8 .003
CAR during synergy .244 8 .175 .901 8 .292
ROA before synergy .144 8 .200* .982 8 .974
ROA during synergy .289 8 .048 .854 8 .104
FDR before synergy .199 8 .200* .934 8 .557
FDR during synergy .166 8 .200* .966 8 .868
OER before synergy .216 8 .200* .883 8 .200
OER during synergy .271 8 .085 .881 8 .192
NPF before synergy .159 8 .200* .936 8 .568
NPF during synergy .214 8 .200* .926 8 .484
Bank Syariah Mandiri (BSM)
Tests of Normality
Kolmogorov-Smirnova Shapiro-Wilk
Statistic df Sig. Statistic df Sig.
CAR before synergy .189 8 .200* .916 8 .397
CAR during synergy .217 8 .200* .903 8 .307
ROA before synergy .350 8 .005 .633 8 .000
ROA during synergy .256 8 .133 .870 8 .150
FDR before synergy .154 8 .200* .930 8 .520
FDR during synergy .176 8 .200* .931 8 .529
OER before synergy .208 8 .200* .898 8 .278
OER during synergy .259 8 .123 .843 8 .080
NPF before synergy .280 8 .065 .873 8 .162 NPF during synergy .145 8 .200
* .932 8 .539
Source: Computed by author (2020)
Table 1 informs that there are data variable that have a value of
Kolmogorov-Smirnov and Shapiro-Wilk < 0.05 which means H0 is accepted
Jurnal Fidusia Volume 4 No 1 – April 2021│7
or in other words, the individual data used in this study did not meet the
assumption of data normality test so that paired t-test cannot be conducted and
replaced with non-parametric statistics test that do not require the assumption of
data normality to calculate the mean difference of each individual data using the
method of Wilcoxon signed-ranks test.
B. The Results of The Wilcoxon Signed-Ranks Test
1. The comparison of ICB’s CAR before and during synergy with Islamic FinTech
lending
Capital is a very important aspect for the banking industry because
of the size of the capital reflects the bank’s ability to cover the risk of
losses that might occur. All activity on the ICB generally has the risk of
loss, so that needs to be done to control the risk due to the losses incurred
can reduce the level of bank capital (Toin, 2014). Below is shown a
comparison of the level of capital from the three ICB using the proxy of
CAR before and during synergy with Islamic FinTech lending.
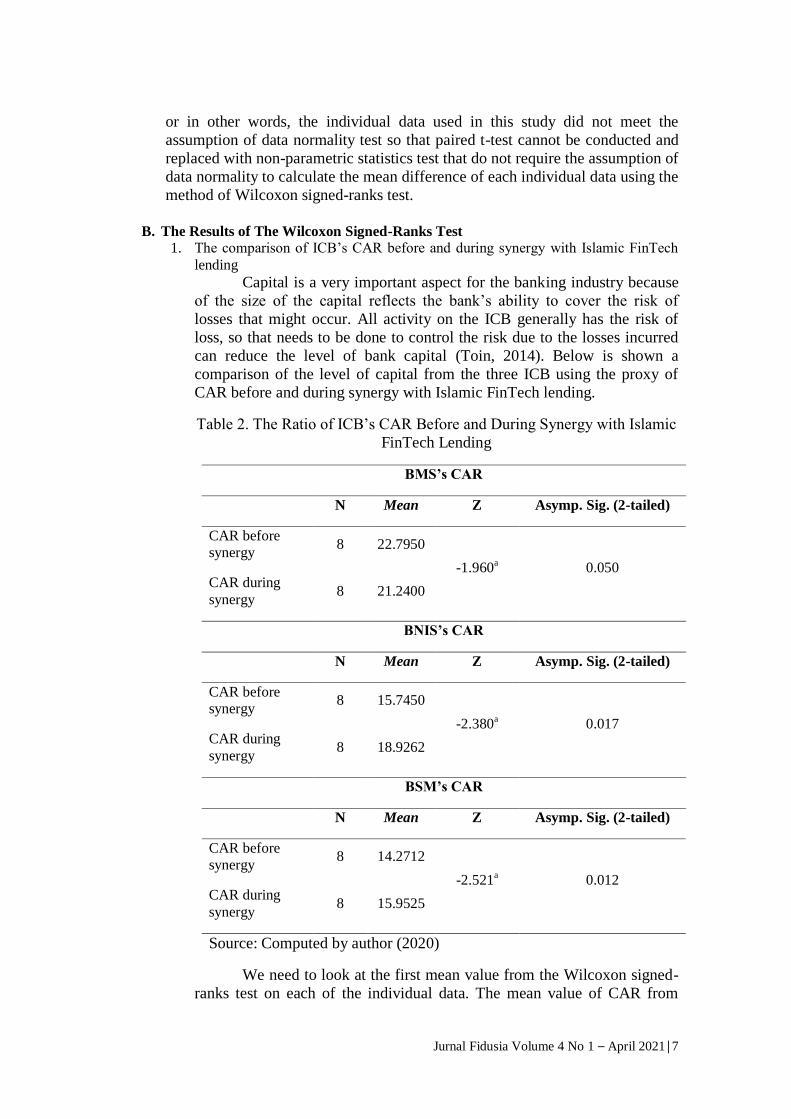
Table 2. The Ratio of ICB’s CAR Before and During Synergy with Islamic
FinTech Lending
BMS’s CAR
N Mean Z Asymp. Sig. (2-tailed)
CAR before
synergy 8 22.7950
-1.960a 0.050
CAR during
synergy 8 21.2400
BNIS’s CAR
N Mean Z Asymp. Sig. (2-tailed)
CAR before
synergy 8 15.7450
-2.380a 0.017
CAR during
synergy 8 18.9262
BSM’s CAR
N Mean Z Asymp. Sig. (2-tailed)
CAR before
synergy 8 14.2712
-2.521a 0.012
CAR during
synergy 8 15.9525
Source: Computed by author (2020)
We need to look at the first mean value from the Wilcoxon signed-
ranks test on each of the individual data. The mean value of CAR from

Jurnal Fidusia Volume 4 No 1 – April 2021│8
BNIS and BSM is known to have a higher value during the two ICB
conducting synergy with Islamic FinTech lending. Meanwhile, the mean
value of BMS’s CAR is known to have a lower value during BMS
conducting synergy with Islamic FinTech lending.
Statistically, the meaning of the difference in mean value before
and during the three ICB conducting synergy with Islamic FinTech lending
will be answered by the Wilcoxon signed-ranks test. Based on the
Wilcoxon signed-ranks test on the CAR of the three ICB resulting value of
the Z score and p-value Asymp. Sig. (2-tailed) respectively -1.960a, -
2.380a, -2.521
a and 0.050, 0.017, 0.012 < 0.05 so H0 is rejected or in
other words, there is significant differences in CAR before and during the
BNIS and BSM conducting synergy with Islamic FinTech lending although
on the BMS’s CAR known has decreased during conducting synergy with
Islamic FinTech lending.
2. Comparison of ICB’s ROA before and during synergy with Islamic FinTech
lending
The success of banking management in obtaining the advantages
can be seen from the ratio of Return on Assets (ROA). The higher the value
of ROA meaning that the bank is using its assets effectively so as to
produce a high profit and the implications for the achievement of stability
of bank soundness (Anwar, 2016). A comparison of the profitability of the
ICB with a proxy of ROA before and during synergy with Islamic FinTech
lending is shown in the table as follows:
Table 3. The Ratio of ICB’s ROA Before and During Synergy with Islamic
FinTech Lending
BMS’s ROA
N Mean Z Asymp. Sig. (2-tailed)
ROA before
synergy 8 2.4850
-2.521a 0.012
ROA during
synergy 8 0.8325
BNIS’s ROA
N Mean Z Asymp. Sig. (2-tailed)
ROA before
synergy 8 1.4800
-0.980a 0.327
ROA during
synergy 8 1.6212
BSM’s ROA

Jurnal Fidusia Volume 4 No 1 – April 2021│9
N Mean Z Asymp. Sig. (2-tailed)
ROA before
synergy 8 0.5638
-2.521a 0.012
ROA during
synergy 8 1.2000
Source: Computed by author (2020)
The table above informs the mean ROA from the three ICB before
and during synergy with Islamic FinTech lending. Mean value of ROA
from BNIS and BSM is known to have a higher value during synergy with
Islamic FinTech lending. Whereas, the mean value from BMS’s ROA
actually lower during synergy with Islamic FinTech lending.
Statistically, based on Wilcoxon signed-ranks test found that the
value of the Z score and p-value Asymp. Sig. (2-tailed) BSM’s ROA
respectively is -2.521a and 0.012 < 0.05 so H0 is rejected or in other
words, there is significant differences in BSM’s ROA before and during
synergy with Islamic FinTech lending. In addition, the value of the Z score
and p-value Asymp. Sig. (2-tailed) of BNIS’s ROA known is -0.980a and
0.327 > 0.05 which means H0 is accepted or in other words there is no significant difference of BNIS’s ROA before and during synergy with
Islamic FinTech lending. Whereas, the value of the Z score and p-value
Asymp. Sig. (2-tailed) of BMS’s ROA known is -2.251a and 0.012 < 0.05
so H0 is rejected or in other words, there is significant differences in BMS’s
ROA before and during synergy with Islamic FinTech lending although it
decreased during BMS synergy with Islamic FinTech lending.
3. Comparison of ICB’s FDR before and during synergy with Islamic FinTech
Lending
Another indicator of the financial performances of the ICB is the
liquidity that can be shown through the value of FDR. Banking liquidity is
said to be good if it has the value of the FDR which is low because the
funds obtained are not entirely distributed to the mudharib so that the bank
has sufficient funds to cover its obligations to shahibul maal. However, the
value of FDR that low also reflect the bank is less productive (Anwar,
2016). The comparison of the liquidity of the ICB with a proxy of FDR
before and during synergy with Islamic FinTech lending is shown in the
table as follows:
Table 4. The Ratio of ICB’s FDR Before and During Synergy with Islamic
FinTech Lending
BMS’s FDR
N Mean Z Asymp. Sig. (2-tailed)
FDR before 8 95.1788 -0.210a 0.833

Jurnal Fidusia Volume 4 No 1 – April 2021│10
synergy
FDR during
synergy 8 95.2038
BNIS’s FDR
N Mean Z Asymp. Sig. (2-tailed)
FDR before
synergy 8 83.9888
-2.103a 0.035
FDR during
synergy 8 78.9488
BSM’s FDR
N Mean Z Asymp. Sig. (2-tailed)
FDR before
synergy 8 79.4738
-0.980a 0.327
FDR during
synergy 8 77.9612
Source: Computed by author (2020)
Table 4 describes that the mean value of FDR of the three ICB
before and during synergy with Islamic FinTech lending. The mean value
of BMS is known to have a higher during synergy with Islamic FinTech
lending. Whereas, the mean value of BNIS’s and BSM’s FDR is exactly
the opposite which is lower during synergy with Islamic FinTech lending.
Based on the Wilcoxon signed-ranks test can be known the
significant of mean difference on each of the individual data statistically.
The data of BMS’s FDR are known to have Z score and p-value Asymp.
Sig. (2-tailed) respectively -2.210a and 0.833 > 0.05 so H0 is accepted or
in other words there is no significant difference between the BMS’s FDR
before and during synergy with Islamic FinTech lending. Meanwhile, the
data of BNIS’s FDR known to have Z score and p-value Asymp. Sig. (2-
tailed) respectively -2.103a and 0.035 < 0.05 so H0 is rejected or in other
words, there is significant difference between the BNIS’s FDR before and
during synergy with Islamic FinTech lending although with the difference
of FDR which declined during the BNIS synergy with Islamic FinTech
lending. Whereas, the data of BSM’s FDR is known to have Z score and p-
value Asymp. Sig. (2-tailed) respectively -0.980a
and 0.327 > 0.05 so H0
is accepted or in other words there is no significant difference between the
BSM’s FDR before and during synergy with Islamic FinTech lending.
4. Comparison of ICB’s OER before and during synergy with Islamic FinTech
lending

Jurnal Fidusia Volume 4 No 1 – April 2021│11
The level of efficiency of the ICB can be measured by using the
ratio of OER. This ratio is the ratio between operating expenses to
operating income. The higher the value of OER illustrates the inefficiency
of the banking and vice versa the lower the value of OER shows the
efficiency of the banking (Toin, 2014). Comparison of the efficiency level
of the three ICB with a proxy of OER before and during synergy with
Islamic FinTech lending is shown in the table as follows:
Table 5. The Ratio of ICB’s OER Before and During Synergy with Islamic
FinTech Lending
BMS’s OER
N Mean Z Asymp. Sig. (2-tailed)
OER before
synergy 8 88.4812
-2.521a 0.012
OER during
synergy 8 94.1800
BNIS’s OER
N Mean Z Asymp. Sig. (2-tailed)
OER before
synergy 8 86.7788
-2.100a 0.036
OER during
synergy 8 83.4450
BSM’s OER
N Mean Z Asymp. Sig. (2-tailed)
OER before
synergy 8 94.0775
-2.521a 0.012
OER during
synergy 8 87.2263
Source: Computed by author (2020)
Table 5 explains that the mean value of BMS’s and BSM’s OER to
have a higher during the two ICB synergy with Islamic FinTech lending.
Meanwhile, the mean value of BNIS’s OER known lower during the BNIS
synergy with Islamic FinTech lending.
Statistically, the significant difference in mean value based on
Wilcoxon signed-ranks test toward the data of BMS’s and BSM’s OER is
known to have Z score and p-value Asymp. Sig. (2-tailed) respectively -
2.210a, -2.210
a and 0.012, 0.012 < 0.05 so H0 is rejected or in other

Jurnal Fidusia Volume 4 No 1 – April 2021│12
words there is a significant difference between the BMS’s and BSM’s OER
before and during synergy with Islamic FinTech lending although with
differences of OER increased (inefficient). Whereas, the data of BNIS’s
OER known to have the value of Z score and p-value Asymp. Sig. (2-
tailed) respectively -2.100a and 0.036 < 0.05 so H0 is rejected or in other
words there is a significant difference between the BNIS’s OER before and
during synergy with Islamic FinTech lending.
5. Comparison of ICB’s NPF Ratio before and during synergy with Islamic FinTech
Lending
NPF ratio can be used as a reflection of assets quality of the ICB.
The assets quality said to be productive if it can generate profit from the
activity carried out (Anwar, 2016). The high and the low value of the NPF
ratio describes the ability of the bank to manage financing that is given to
the mudharib so that it can generate profits. Comparison of ICB’s asset
quality with proxy of NPF ratio before and during synergy with Islamic
FinTech lending is shown in the table as follows:
Table 6. The Ratio of ICB’s NPF Before and During Synergy with Islamic
FinTech Lending
BMS’s NPF
N Mean Z Asymp. Sig. (2-tailed)
NPF before
synergy 8 3.5125
-2.521a 0.012
NPF during
synergy 8 2.1550
BNIS’s NPF
N Mean Z Asymp. Sig. (2-tailed)
NPF before
synergy 8 3.0325
-0.350a 0.726
NPF during
synergy 8 3.0675
BSM’s NPF
N Mean Z Asymp. Sig. (2-tailed)
NPF before
synergy 8 5.1662
-2.521a 0.012
NPF during
synergy 8 3.2400

Jurnal Fidusia Volume 4 No 1 – April 2021│13
Source: Computed by author (2020)
Table 6 reveals the difference in mean value before and during the
three ICB synergy with Islamic FinTech lending. The mean value of
BMS’s and BSM’s NPF is known to have a lower during synergy with
Islamic FinTech lending. Whereas, the mean value of BNIS’s NPF known
to be higher during synergy with Islamic FinTech lending.
To know the meaning in statistics of the difference mean value,
then the Wilcoxon signed-ranks test is conducted. The data of BMS’s and
BSM’s NPF is known to have the value of Z score and p-value Asymp. Sig.
(2-tailed) respectively -2.521a, -2.521
a and 0.012, 0.012 < 0.05 so H0 is
rejected or in other words there is a significant difference between BMS’s
and BSM’s NPF before and during synergy with Islamic FinTech lending.
Whereas, the data of BNIS’s NPF known to have the value of Z score and
p-value Asymp. Sig. (2-tailed) respectively -0.350a
and 0.726 > 0.05 so H0 is accepted or in other words there is no significant difference between
BNIS’s NPF before and during synergy with Islamic FinTech lending.
C. Benefits and Challenges the Synergy between ICB and Islamic FinTech Lending
The synergy between ICB and Islamic FinTech lending can provide the
mutual benefits for both the industry and also customers, especially MSMEs.
The benefits of synergy for both industries which are competitive advantages
owned by ICB such as broad customer base and the competitive advantages of
Islamic FinTech lending such as speed and efficiency can be used as a medium
of cooperation to enhance the development of Islamic finance in Indonesia
(Haris, Iqbal and Hadiyati, 2020). The success in the synergy between ICB and
Islamic FinTech lending is expected to increase the reach of Islamic financial
institutions to MSMEs so that it can improve Islamic financial literacy and
inclusion in Indonesia (Haris, Iqbal and Hadiyati, 2020). In addition, the
synergy between ICB and Islamic FinTech lending can also be profitable for the
ICB because it can be a marketing media for ICB (Chotib, Rifa'i and Hidayat,
2019). The benefits of the synergy of the customers particularly MSMEs is the
availability of innovative financial product for MSMEs and fast transaction
because the whole process is done by online system (Haris, Iqbal and Hadiyati,
2020).
However, as the benefits derived, there are several challenges that must
be faced in the synergy between ICB and Islamic FinTech lending. First, the
availability of human resources who understand FinTech and information
technology. Second, regulation and certification for labors and experts in the
field of Islamic FinTech lending, accounting for Islamic FinTech lending,
digital documents, Electronic Know Your Customer (E-KYC) and other. Third,
the supporting infrastructure such as the availability of the qualified internet
network and evenly distributed in the entire territory of Indonesia. Fourth, the
understanding of the stakeholders regarding Islamic FinTech lending and
coordination between institutions and the ministry to introduce Islamic FinTech
lending more widely. Fifth, the risk of financing in Islamic FinTech lending is
relatively high and the reputation of Islamic FinTech lending which has not
been so good in the eyes of society (Haris, Iqbal and Hadiyati, 2020).

Jurnal Fidusia Volume 4 No 1 – April 2021│14
V. CONCLUSIONS AND RECOMMENDATIONS
A. Conclusions
Based on the results and discussions that has been done can be concluded
that paired t-test cannot be performed in this study because the data used do not
meet the assumption of normality so that it is replaced with non-parametric
statistics test using Wilcoxon signed-ranks test to calculate the mean difference
of each individual data on the aspect of financial performances of the three ICB
before and during synergy with Islamic FinTech lending.
From the perspective of the capital using proxy of CAR on the BMS
known that there is significant difference before and during BMS synergy with
Islamic FinTech lending although with a tendency of CAR decreased during the
synergy. From the perspective of the profitability using a proxy of ROA known
that there is significant difference before and during BMS synergy with Islamic
FinTech lending although with a tendency of ROA decreased during synergy.
From the perspective of liquidity with a proxy FDR known that there is no
significant difference before and during BMS synergy with Islamic FinTech
lending. From the perspective of efficiency by proxy of OER known that there is
significant difference before and during BMS synergy with Islamic FinTech
lending although with a tendency of OER increased during the synergy. From
the perspective of asset quality with proxy of NPF known that there is
significant difference before and during BMS synergy with Islamic FinTech
lending.
From the perspective of capital by proxy of CAR on the BNIS known
that there is significant difference before and during BNIS synergy with Islamic
FinTech lending. From the perspective of profitability with a proxy of ROA
known that there is no significant difference before and during BNIS synergy
with Islamic FinTech lending. From the perspective of liquidity with a proxy
FDR known that there is significant difference before and during BNIS synergy
with Islamic FinTech lending. From the perspective of efficiency by proxy of
OER known that there is significant difference before and during the BNIS
synergy with Islamic FinTech lending. From the perspective of asset quality
with proxy of NPF known that there is no significant difference before and
during BNIS synergy with Islamic FinTech lending.
From the perspective of the capital by proxy of CAR on the BSM known
that there is significant difference before and during BSM synergy with Islamic
FinTech lending. From the perspective of the profitability with a proxy of ROA
known that there is significant difference before and during BSM synergy with
Islamic FinTech lending. From the perspective of liquidity with a proxy FDR
known that there is no significant difference before and during BSM synergy
with Islamic FinTech lending. From the perspective of efficiency by proxy of
OER known that there is significant difference before and during BSM synergy
with Islamic FinTech lending. From the perspective of asset quality with proxy
of NPF known that there is significant difference before and during BSM
synergy with Islamic FinTech lending.
B. Recommendations
Based on the results and discussions can be seen that the synergy by the
three ICB and Islamic FinTech lending proved to have a positive impact on the

Jurnal Fidusia Volume 4 No 1 – April 2021│15
financial performances of each ICB reflecting the success of synergy even
though cannot be said to be optimal because it has not been influential as a
whole on all indicators of the financial performances including capital,
profitability, liquidity, efficiency and asset quality. Not optimal the impact of
synergy on the financial performances of ICB can also be caused by the age of
the cooperation is relatively new and the presence of pandemic Covid-19 which
of course negatively affect the activity of ICB and Islamic FinTech lending.
Therefore, by looking at the potential mutual benefits from the synergy
between ICB and Islamic FinTech lending, then it can be asked of the
recommendations to all stakeholders. First, the optimization of the support of the
regulator in this case is FSA to the synergy between ICB and Islamic FinTech
lending in the form of regulation which set the models of the synergy that can be
done to accelerate the completion of regulations regarding Sharia Restricted
Intermediary Account (SRIA). Second, the similarity of vision and mission in
the development of Islamic finance between all stakeholders for example the
FSA, DSN-MUI and industry. Third, the synergy between ICB and Islamic
FinTech lending can be achieved if the support system of Islamic FinTech
lending in this case the Islamic bank is also growing good which is supported by
a regulation favouring of Islamic bank.
REFERENCES
Al Arif, M. N. R., Nachrowi, D. N., Nasution, M. E., & Mahmud, T. M. Z. (2017). The
Islamic Banking Spin-Off: Lesson from Indonesian Islamic Banking Experiences.
Journal of King Abdulaziz University: Islamic Economics, 30(2), 117 – 133.
10.4197/Islec.30-2.11 Aminah., Soewito., Erina, N., Khairudin., & Damayanti, T. (2019). Financial
Performance and Market Share in Indonesia Islamic Banking: Stakeholder
Theory Perspective. International Journal of Scientific & Technology Research,
8(1), 14 – 18.
Anwar, A. A. (2016). Analysis of Indonesian Islamic and Conventional Banking Before and After 2008. International Journal of Economics and Finance, 8(11), 193 –
199.
Badan Perencanaan Pembangunan Nasional. (2019). Masterplan Ekonomi Syariah
Indonesia 2019 – 2024. Jakarta: Bappenas.
Chotib, M., Rifa’i, K., & Hidayat, N. (2019). The Synergy of Financial Technology anf
Banking Industry as A Marketing Strategy in Indonesia. International Journal of
Scientific & Technology Research, 8(10), 1619 – 1625.
Fakhri, U. N., Anwar, S., Ismal, R., Ascarya. (2019). Comparison and Predicting
Financial Performance of Islamic and Conventional Banks in Indonesia to
Achieve Growth Sustainability. Al-Uqud: Journal of Islamic Economics, 3(2),
174 – 186. 10.26740/al-uqud.v3n2.p174-186
Gerald, B. (2018). A Brief Review of Independent, Dependent and One Sample t-test.
International Journal of Applied Mathematics and Theoretical Physics, 4(2), 50 –
54. 10.11648/j.ijamtp.20180402.13
Haris, M., Iqbal, M., & Hadiyati, P. (2020). Synergy of Sharia Banks and Financial
Technology in the Development of Micro, Small and Medium Business in

Jurnal Fidusia Volume 4 No 1 – April 2021│16
Indonesia. Jurnal Reviu Akuntansi dan Keuangan, 10(1), 115 – 126.
10.22219/jrak.v10i1.11258
Hidayat, R., Oktaviani, Y., & Aminudin. (2019). Financial Performance of Islamic
Banking in Indonesia with Maqashid Sharia Approach. Manajemen Bisnis, 9(1),
85 – 97.
Ika, S. R., & Abdullah, N. (2011). A Comparative Study of Financial Performance of
Islamic Banks and Conventional Banks in Indonesia. International Journal of
Business and Social Science, 2(15), 199 – 207.
Kelly, S., Ferenzy, D., & Mcgrath, A. (2017). How Financial Institutions and Fintechs
are Partnering for Inclusion: Lessons from the Frontliners. Institut of
International Finance, Center for Financial Inclusion.
McKinsey&Company. (2016). FinTechnicolor: The New Picture in Finance. Retrieved
July 17, 2020, from https://www.mckinsey.com
Muflih, M., & Insani, D. S. (2019). Determinants of Islamic Bank Performance:
Evidence from Indonesian Islamic Banking Industry. IOP Conf. Series: Materials
Science and Engineering 662 072001. 10.1088/1757-899X/662/7/072001
Muhammad, R., & Triharyono, C. (2019). Anaysis of Islamic Banking Financial
Performance During and After Global Financial Crisis. Jurnal Ekonomi &
Keuangan Islam, 5(2), 80 – 86. 10.20885/JEKI.vol5.iss2.art5
Mukhibad, H., & Khafid, M. (2018). Financial Performance Determinant of Islamic
Banking in Indonesia. Jurnal Keuangan dan Perbankan, 22(3), 506 – 517.
Oyeka, I. C. A., & Ebuh, G. U. (2012). Modified Wilcoxon Signed-Rank Test. Open
Journal of Statistics, 2, 172 – 176. 10.4236/ojs.2012.22019
PricewaterhouseCoopers. (2016). Customers in The Spotlight (How FinTech is
Reshaping Banking). PwC: Global FinTech Survey 2016.
Rusydiana, A. S., & Sanrego, Y. D. (2018). Measuring The Performance of Islamic
Banking in Indonesia: An Application of Maslahah-Efficiency Quadrant (MEQ).
Journal of Islamic Monetary Economics and Finance, 3(Special Issue), 79 – 98.
Septiari, D., & Mazlifani, R. N. (2018). The Financial Performance Comparison of
Islamic Bank in Indonesia with Islamic Bank in UK. Journal of Applied
Accounting and Taxation, 3(1), 38 – 43.
Setyawati, I., Suroso, S., Suryanto, T., & Nurjannah, D. S. (2017). Does Financial
Performance of Islamic Banking Better? Panel Data Estimation. European
Research Studies Journal, 20(2A), 592 – 606.
Siswantoro, D. (2014). Analysis of Islamic Bank’s Performance and Strategy After
Spin-Off as Islamic Full-Fledged Scheme in Indonesia. Procedia – Social and
Behavioral Science, 164, 41 – 48. 10.1016/j.sbspro.2014.11.048
The Economist. (2015). The Fintech Revolution. Retrieved July 17, 2020, from
https://www.economist.com/leaders/2015/05/09/the-fintech-revolution
The New York Times. (2016). Fintech Firms Are Taking On the Big Banks, but Can
They Win? Retrieved July 17, 2020, from
https://www.nytimes.com/2016/04/07/business/dealbook/fintech-firms-are-
taking-on-the-big-banks-but-can-they-win.html
Toin, D. R. Y. (2014). Analisis Kinerja Perbankan: Studi Komparasi antara Perbankan
Syariah dan Konvensional. Jurnal Siasat Bisnis, 18(2), 202 – 209.