fhwa/ca10-1102 work zone intrusion countermeasure ... · work zone intrusion countermeasure...
TRANSCRIPT

Technical Report Documentation Page 1. Report No. FHWA/CA10-1102
2. Government Accession No.
3. Recipient's Catalog No.
4. Title and Subtitle WORK ZONE INTRUSION COUNTERMEASURE IDENTIFICATION, ASSESSMENT, AND IMPLEMENTATION GUIDELINES
5. Report Date May 2010 6. Performing Organization Code
7. Author(s) Gerald L. Ullman, Melisa D. Finley, and LuAnn Theiss
8. Performing Organization Report No.
9. Performing Organization Name and Address Texas Transportation Institute The Texas A&M University System College Station, Texas 77843-3135
10. Work Unit No. (TRAIS) 11. Contract or Grant No. 65A0248
12. Sponsoring Agency Name and Address California Department of Transportation Department of Transportation Division of Research and Innovation 1101 R Street Sacramento, CA 95811
13. Type of Report and Period Covered Final Report14. Sponsoring Agency Code
15. Supplementary Notes Project performed in cooperation with the California Department of Transportation and the Federal Highway Administration. 16. Abstract In this report, Texas Transportation Institute researchers documented the efforts undertaken to investigate and categorize the different types of work zone intrusion crashes that occur on California roadways, and to conduct a detailed comparative critique of how each of the various countermeasures available may mitigate those types of work zone intrusions. Researchers used the New York State Department of Transportation work zone incident database and telephone surveys of California Department of Transportation and highway contractor personnel in California to gain insights into the frequency, characteristics, and crash sequences that comprise vehicle intrusion crashes at California work zones. Intrusion crashes make up a relatively small portion of crashes at work zones, and comprise a greater proportion of nighttime crashes than daytime crashes, although most intrusion crashes happen during daytime work operations. The biggest share of vehicle intrusion crashes occurs at lane closure operations. Intrusion crashes also occur at mobile operations, flagging operations, and during traffic control set-up and removal activities. When intrusions crashes occur, they most often involve collisions with work vehicles/equipment or work materials/debris rather than with a highway worker. In addition, a significant portion of intrusion crashes are the result of deliberate driver decisions and actions to enter the work area. Several countermeasures were identified to address intrusion crashes. Some emphasize increased attention to current procedures or possible expansion of procedures, and are fairly low cost to implement. Others are technological countermeasures, and can have fairly significant costs associated with them. An assessment of implementation costs to possible reduction in work zone intrusion crash costs was performed and is documented in the report. Based on these findings, researchers developed guidance on which work zone intrusion countermeasures are most appropriate for a given set of roadway conditions and planned work zone activities (included as an appendix). 17. Key Words Work Zone Safety, Intrusion Crashes, Temporary Traffic Control
18. Distribution Statement No restrictions. This document is available to the public through NTIS: National Technical Information Service Springfield, Virginia 22161 http://www.ntis.gov
19. Security Classif.(of this report) Unclassified
20. Security Classif.(of this page) Unclassified
21. No. of Pages 150
22. Price
Form DOT F 1700.7 (8-72) Reproduction of completed page authorized

DISCLAIMER STATEMENT
This document is disseminated in the interest of information exchange. The contents of this report reflect the views of the authors who are responsible for the facts and accuracy of the data presented herein. The contents do not necessarily reflect the official views or policies of the State of California or the Federal Highway Administration. This publication does not constitute a standard, specification or regulation. This report does not constitute an endorsement by the Department of any product described herein.
For individuals with sensory disabilities, this document is available in Braille, large print, audiocassette, or compact disk. To obtain a copy of this document in one of these alternate formats, please contact: the Division of Research and Innovation, MS-83, California Department of Transportation, P.O. Box 942873, Sacramento, CA 94273-0001.

WORK ZONE INTRUSION COUNTERMEASURE IDENTIFICATION, ASSESSMENT, AND IMPLEMENTATION
GUIDELINES
Report FHWA/CA10-1102
in cooperation with the Federal Highway Administration and the California Department of Transportation
TEXAS TRANSPORTATION INSTITUTETHE TEXAS A&M UNIVERSITY SYSTEM
COLLEGE STATION, TEXAS
WORK ZONE INTRUSION COUNTERMEASURE IDENTIFICATION, ASSESSMENT, AND
IMPLEMENTATION GUIDELINES
by
Gerald L. Ullman, P.E., Ph.D. Senior Research Engineer
Texas Transportation Institute
Melisa D. Finley, P.E. Associate Research Engineer Texas Transportation Institute
and
LuAnn Theiss, P.E.
Associate Research Engineer Texas Transportation Institute
Caltrans Contract 65A0248 Project Title: Errant Motorists’ Intrusions into Highway Work Zones
Performed in cooperation with the California Department of Transportation
May 2010
TEXAS TRANSPORTATION INSTITUTE The Texas A&M University System College Station, Texas 77843-3135

v
DISCLAIMER
This research was performed in cooperation with the California Department of
Transportation (Caltrans) and the Federal Highway Administration. The contents of this report
reflect the views of the authors, who are responsible for the facts and the accuracy of the data
presented herein. The contents do not necessarily reflect the official view or policies of the State
of California or the Federal Highway Administration. This report does not constitute a standard,
specification, or regulation. This report is not intended for construction, bidding, or permit
purposes. The State of California does not endorse products or manufacturers. Trade or
manufacturers’ names appear herein solely because they are considered essential to the object of
this report. The engineer in charge of the project was Gerald L. Ullman, P.E. (TX-66876).
vi
ACKNOWLEDGMENTS
This project was conducted in cooperation with the California Department of
Transportation (Caltrans). The project was overseen by a Caltrans Project Monitoring
Committee that included Linda Simpson, Joel Allen, Len Nelson, Vincent Rodriguez, Celso
Izquierdo, and Craig Copelan. William Okwu served as the Project Manager. The assistance
and direction provided by these individuals over the course of the project is gratefully
acknowledged.
The authors would also like to acknowledge the following individuals and agencies that
provided information and/or photos of the identified countermeasures:
• Jerry Britton of Dorman Varitext,
• Tim Cox of Plastic Safety Systems,
• Carl Fors of Speed Measurement Laboratories,
• Steve Hall of Traffic Safety Supplies,
• Eric Hemphill of the North Texas Tollway Authority,
• David Krahulec of Horizon Signal Technologies,
• Clarence Labar of Empco-Lite,
• Angie Lidster of TRAF-Tech,
• Dan Poffenberger of Trantex Transportation Products,
• Marv Sohlo of the Minnesota DOT,
• New York DOT, and
• Texas DOT.
vii
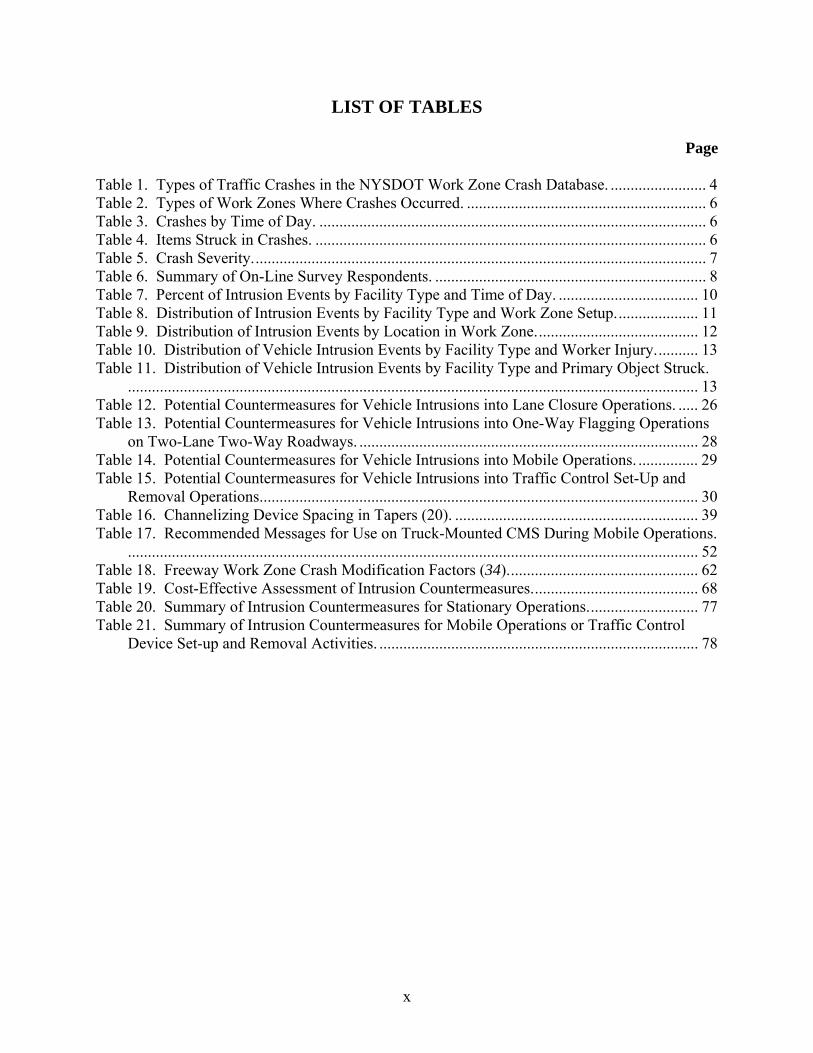
TABLE OF CONTENTS
Page List of Figures ............................................................................................................................... ix List of Tables ................................................................................................................................. x Executive Summary ..................................................................................................................... xi Chapter 1: Introduction ............................................................................................................... 1
Statement of the Problem ............................................................................................................ 1 Contents of this Report ............................................................................................................... 1
Chapter 2: Extent and Characteristics of Work Zone Intrusion Crashes .............................. 3 Intrusion Crash Trends in the NYSDOT Work Zone Accident Database .................................. 4 Survey of Caltrans and Highway Contractor Personnel ............................................................. 7
On-Line Survey to Gauge Extent of Intrusion Experiences ................................................... 7 Detailed Telephone Survey of Intrusion Experiences ............................................................ 8 Summary ............................................................................................................................... 14
Common Work Zone Intrusion Crash Sequences ..................................................................... 15 Typical Work Zone Intrusion Scenarios at Lane Closure Operations .................................. 19 Typical Work Zone Intrusion Scenarios at Flagging Operations ......................................... 20 Typical Work Zone Intrusion Scenarios at Mobile Operations ............................................ 21 Typical Work Zone Intrusion Scenarios at Traffic Control Set-Up and Removal Operations............................................................................................................................................... 21
Conclusions ............................................................................................................................... 22 Chapter 3: Strategies and Technologies to Reduce Work Zone Intrusion Crashes ............. 25
Potential Countermeasures for Intrusions into Lane Closure Operations ................................. 31 Entire Work Zone ................................................................................................................. 31 Advance Warning Area ......................................................................................................... 33 Transition Area ..................................................................................................................... 38 Activity Area ......................................................................................................................... 41
Potential Countermeasures for Intrusions into Flagging Operations ........................................ 44 Advance Warning Area ......................................................................................................... 45 Flagger Station ...................................................................................................................... 45 Activity Area ......................................................................................................................... 48
Potential Countermeasures for Intrusions into Mobile Operations ........................................... 48 Potential Countermeasures for Intrusions into Traffic Control Set-up and Removal Operations................................................................................................................................................... 55 Summary ................................................................................................................................... 57
Chapter 4: Work Zone Intrusion Countermeasure Crash Cost Reduction Analyses .......... 59 Introduction ............................................................................................................................... 59 Computation of Crash Costs ..................................................................................................... 59
Overview ............................................................................................................................... 59 Methodology ......................................................................................................................... 60
Results of Countermeasure Evaluations ................................................................................... 64 Summary ................................................................................................................................... 73
Chapter 5: Conclusions and Recommendations ...................................................................... 75 Chapter 6: References ................................................................................................................ 81

viii
Appendix A: Work Zone Intrusion Countermeasures Implementation Guidelines ............85 Appendix B: Crash Cost Functions .........................................................................................115
ix
LIST OF FIGURES Page Figure 1. Vehicle Intrusion Crash Sequences: Lane Closure Operations. ................................... 16 Figure 2. Vehicle Intrusion Crash Sequences: Flagging Operations. .......................................... 17 Figure 3. Vehicle Intrusion Crash Sequences: Mobile Operations. ............................................. 18 Figure 4. Vehicle Intrusion Crash Sequences: Traffic Control Set-Up and Removal Operations.
............................................................................................................................................... 18 Figure 5. Portable Plastic Rumble Strips. .................................................................................... 35 Figure 6. Example of Early Merge Advance Warning Sign. ....................................................... 36 Figure 7. DSD Trailer. ................................................................................................................. 37 Figure 8. Sequential Warning Light System. ............................................................................... 40 Figure 9. Example of Steel Barrier. ............................................................................................. 41 Figure 10. Examples of AFADs. .................................................................................................. 47 Figure 11. Portable Traffic Signal. .............................................................................................. 48 Figure 12. Truck-Mounted DSDs Evaluated in Previous TTI Research. .................................... 53 Figure 13. Truck-Mounted DSDs Evaluated in Wisconsin. ........................................................ 53 Figure 14. Caltrans Balsi Beam. .................................................................................................. 55
x
LIST OF TABLES Page Table 1. Types of Traffic Crashes in the NYSDOT Work Zone Crash Database. ........................ 4 Table 2. Types of Work Zones Where Crashes Occurred. ............................................................ 6 Table 3. Crashes by Time of Day. ................................................................................................. 6 Table 4. Items Struck in Crashes. .................................................................................................. 6 Table 5. Crash Severity. ................................................................................................................. 7 Table 6. Summary of On-Line Survey Respondents. .................................................................... 8 Table 7. Percent of Intrusion Events by Facility Type and Time of Day. ................................... 10 Table 8. Distribution of Intrusion Events by Facility Type and Work Zone Setup. .................... 11 Table 9. Distribution of Intrusion Events by Location in Work Zone. ........................................ 12 Table 10. Distribution of Vehicle Intrusion Events by Facility Type and Worker Injury. .......... 13 Table 11. Distribution of Vehicle Intrusion Events by Facility Type and Primary Object Struck.
............................................................................................................................................... 13 Table 12. Potential Countermeasures for Vehicle Intrusions into Lane Closure Operations. ..... 26 Table 13. Potential Countermeasures for Vehicle Intrusions into One-Way Flagging Operations
on Two-Lane Two-Way Roadways. ..................................................................................... 28 Table 14. Potential Countermeasures for Vehicle Intrusions into Mobile Operations. ............... 29 Table 15. Potential Countermeasures for Vehicle Intrusions into Traffic Control Set-Up and
Removal Operations. ............................................................................................................. 30 Table 16. Channelizing Device Spacing in Tapers (20). ............................................................. 39 Table 17. Recommended Messages for Use on Truck-Mounted CMS During Mobile Operations.
............................................................................................................................................... 52 Table 18. Freeway Work Zone Crash Modification Factors (34). ............................................... 62 Table 19. Cost-Effective Assessment of Intrusion Countermeasures. ......................................... 68 Table 20. Summary of Intrusion Countermeasures for Stationary Operations. ........................... 77 Table 21. Summary of Intrusion Countermeasures for Mobile Operations or Traffic Control
Device Set-up and Removal Activities. ................................................................................ 78
xi
EXECUTIVE SUMMARY
Vehicle intrusion crashes in highway work zones injure both vehicle occupants and
workers, and so are of concern to both the California Department of Transportation (Caltrans)
and highway contractors. Whereas efforts to warn workers of a vehicle intrusion have existed
for some time, less consideration has been given to efforts that reduce the frequency of intrusions
in the first place. Many driver behavior modification strategies and technologies exist that could
raise the awareness of drivers approaching a work zone or modify their speed selection, and
potentially reduce intrusion crash frequency and severity. However, it is likely that such relative
benefits will vary depending on the characteristics of the intrusion crashes targeted, roadway and
work zone conditions, and so on.
In this report, researchers documented the efforts undertaken to investigate and categorize
the different types of work zone intrusion crashes that occur on California roadways, and to
conduct a detailed comparative critique of how each of the various countermeasures available
may mitigate those types of work zone intrusions. Researchers used the New York State
Department of Transportation (NYSDOT) work zone incident database and telephone surveys of
Caltrans and highway contractor personnel in California to gain insights into the frequency,
characteristics, and crash sequences that comprise vehicle intrusion crashes at California work
zones. Researchers examined the narratives of the various intrusion crashes to try to identify the
main categories of crash scenarios that occurred. Prototypical crash sequences were developed
around four basic work zone operation categories:
• lane and shoulder closure operations,
• flagging operations,
• mobile operations, and
• traffic control set-up and removal operations.
Within each of these basic work zone situations, several different sequences leading to
work zone intrusion crashes were defined. These sequences were differentiated on whether or
not the action taken appeared to be a deliberate decision on the part of the driver, then on the
primary contributing actions or factors leading to the intrusion. Researchers then identified
potential reasons that could have contributed to the occurrence of the work zone intrusion crash
sequences and matched possible strategies and technologies that could be deployed to mitigate
these crashes. More than 40 possible countermeasures, split between procedural strategies and
xii
technology deployments, were identified. These countermeasures were then critiqued based on
feasibility and practicality of deployment, and potential for mitigating intrusion crashes. For
several of the countermeasures, a cost-effectiveness comparison of implementation costs to crash
cost reduction potential was performed.
Based on the assessment of intrusion crash characteristics, the following conclusions can
be drawn:
• Intrusion crashes make up a relatively small portion of crashes at work zones (7.5
percent of traffic crashes that occur during daytime work operations, 12.4 percent
of traffic crashes during nighttime work operations).
• Although intrusion crashes comprise a greater proportion of nighttime crashes
than daytime crashes, most (69.9 percent) intrusion crashes happen during
daytime work operations.
• The biggest share (58.7 percent) of vehicle intrusion crashes occurs at lane
closure operations. Intrusion crashes also occur at mobile operations, flagging
operations, and during traffic control set-up and removal activities, but each of
these make up less than 10 percent of the intrusion crashes.
• When intrusions crashes occur, they most often involve collisions with work
vehicles/equipment or work materials/debris; only about 17 percent of intrusion
crashes involve a collision with a highway worker.
• A significant portion of intrusion crashes are the result of deliberate driver
decisions and actions to enter the work area. The relative frequency of such
deliberate events differs by type of work operation in place, but ranges from 22 to
63 percent of all intrusion crashes occurring at those types of operations.
Researchers identified a number of procedural and technological countermeasures viewed
as viable for addressing work zone intrusion crashes. Several countermeasures, especially those
that emphasize increased attention to current procedures or possible expansion of procedures, are
fairly low cost to implement. Technological countermeasures, on the other hand, can have fairly
significant costs associated with them. Several countermeasures that do involve some costs of
implementation were further examined as part of this research. Based on that analysis, the
following items are the most easily justified:

xiii
• use of larger channelizing devices,
• reducing the spacing of transverse barricades or channelizing devices in closed
travel lanes, and
• speed display trailers.
The next two items meet cost-effectiveness criteria once traffic volumes reach moderate
levels:
• drone radar devices and
• closer spacing of channelizing devices.
At still higher traffic volume levels, the following countermeasures can be justified:
• temporary transverse rumble strips,
• steel (portable) barrier,
• automated traffic control device placement and retrieval devices, and
• use of enforcement.
Finally, the following items are more difficult to justify on the basis of their crash cost
reduction potential, but may be appropriate for other reasons in certain situations:
• sequential warning light systems,
• flagger replacement devices, and
• truck-mounted positive protection devices.
Guidance on which work zone intrusion countermeasures are the most appropriate for a
given set of roadway conditions and planned work activities is provided in Appendix A.


1
CHAPTER 1: INTRODUCTION
STATEMENT OF THE PROBLEM
Vehicle intrusion crashes in highway work zones injure both vehicle occupants and
workers, and so are of concern to both the California Department of Transportation (Caltrans)
and highway contractors. Whereas efforts to warn workers of a vehicle intrusion have existed
for some time, less consideration has been given to efforts that reduce the frequency of intrusions
in the first place. Many driver behavior modification strategies and technologies exist that could
raise the awareness of drivers approaching a work zone or modify their speed selection, and
potentially reduce intrusion crash frequency and severity. However, it is likely that such relative
benefits will vary depending on the characteristics of the intrusion crashes targeted, roadway and
work zone conditions, and so on. Therefore, research was needed to investigate and categorize
the different types of work zone intrusion crashes that occur on California roadways, and to
conduct a detailed comparative critique of how each of the various countermeasures available
may mitigate those types of work zone intrusions. In addition, researchers developed guidance
for temporary traffic control designers and field personnel regarding which work zone intrusion
countermeasures are most appropriate for a given set of roadway conditions and planned work
zone activities.
CONTENTS OF THIS REPORT
This report describes the methodology and results of the analyses conducted to provide
Caltrans with improved guidance on using driver behavior modification strategies and
technologies to reduce vehicle intrusion crashes in work zones. Appendix A contains the
guidance regarding which work zone intrusion countermeasures are most appropriate for a given
set of roadway conditions and planned work zone activities.


3
CHAPTER 2: EXTENT AND CHARACTERISTICS OF WORK ZONE INTRUSION CRASHES
One of the primary difficulties in using typical statewide crash databases is the lack of
information typically recorded by the investigating officer regarding the work zone itself. This
lack of detail makes it nearly impossible to accurately assess specific work zone influences upon
crash occurrence or severity. This lack of detail also limits the extent to which certain types of
crashes, such as vehicle intrusions, can be targeted for further study.
In the mid 1980’s, the Construction Division of the New York State Department of
Transportation (NYSDOT) initiated a program to compile detailed information on traffic crashes
and worker construction accidents that occur on their construction projects. Since the mid
1990’s, this program has been used by Department staff and contractors to generate reports for
nearly all traffic crashes and worker construction accidents. These reports are supplemented by
standard police accident reports for many traffic crashes, and some worker accidents as well. A
detailed database is maintained by NYSDOT that is used to generate annual reports of work zone
incidents, track overall safety trends, and to prepare special reports addressing specific safety
issues. One of the data fields (crash type) includes specific codes to identify intrusion crashes
involving workers, construction vehicles and equipment, or construction materials and debris.
Officially, NYSDOT defines an intrusion crash in the database as a vehicle or object which
penetrates the actual work space within the work zone and strikes one of the above items listed.
Researchers used the NYSDOT work zone incident database and telephone surveys of
Caltrans and highway contractor personnel in California to gain insights into the frequency,
characteristics, and crash sequences that comprise vehicle intrusion crashes at California work
zones (NYSDOT was the only agency with such a database available). Overall, researchers
obtained six years of NYSDOT work zone traffic crash data (2000 to 2005), received 306
responses from Caltrans and highway contractor field personnel to an online survey developed to
gauge the extent of work zone intrusions in California, and interviewed 62 on-line survey
respondents who indicated that they had specific in-depth knowledge of one or more intrusion
incidents.

4
INTRUSION CRASH TRENDS IN THE NYSDOT WORK ZONE ACCIDENT DATABASE
Overall, the NYSDOT data indicate that vehicle intrusions into a work space comprise
only a small portion of all crashes that occur in work zones. As shown in Table 1, intrusions
make up only 7.5 percent of daytime work zone crashes in the database when work is occurring,
and 12.4 percent of work zone crashes that occurred at night during work activities. (A small
subset of intrusion crashes [4 percent] also occurred during hours when work activity was not
occurring). Interestingly, the percentages of intrusion crashes are less than what are defined as
non-intrusion crashes occurring with workers, construction equipment, or construction debris
(e.g., a crash involving a worker conducting a task outside the actual work space). In addition,
impacts with truck-mounted attenuators (TMAs) on work vehicles were also higher at night
(2.7 percent during the day and 9.8 percent at night). It should be noted that these data do not
indicate that the frequency or rates of intrusion crashes are higher at night; rather, these data only
imply that a slightly higher percentage of crashes which do occur at night do involve work zone
intrusions.
Table 1. Types of Traffic Crashes in the NYSDOT Work Zone Crash Database.
Key Crash Types
Daytime Work Operations,
Daytime Crashes(n=1762)
Nighttime Work Operations,
Nighttime Crashes (n=315)
Rear End Other Multi-Vehicle Single Vehicle Run-Off-Road Intrusion Impacts with Workers, Equipment, or Debris Non-intrusion Impacts with Workers, Equipment, or Debris Impacts with TMA Other Miscellaneous Types
49.0% 16.8% 9.4% 7.5%
10.8%
2.7% 3.8%
35.6% 14.3% 9.8%
12.4%
15.6%
9.8% 2.5%
Part of the reason for the different percentages of intrusion crashes (as well as the TMA
and non-intrusion crashes with workers, construction vehicles/equipment, or materials/debris)
during the day versus night may be the fact that more night work activities are preformed with
only channelizing devices separating the work space and traffic, whereas a greater proportion of
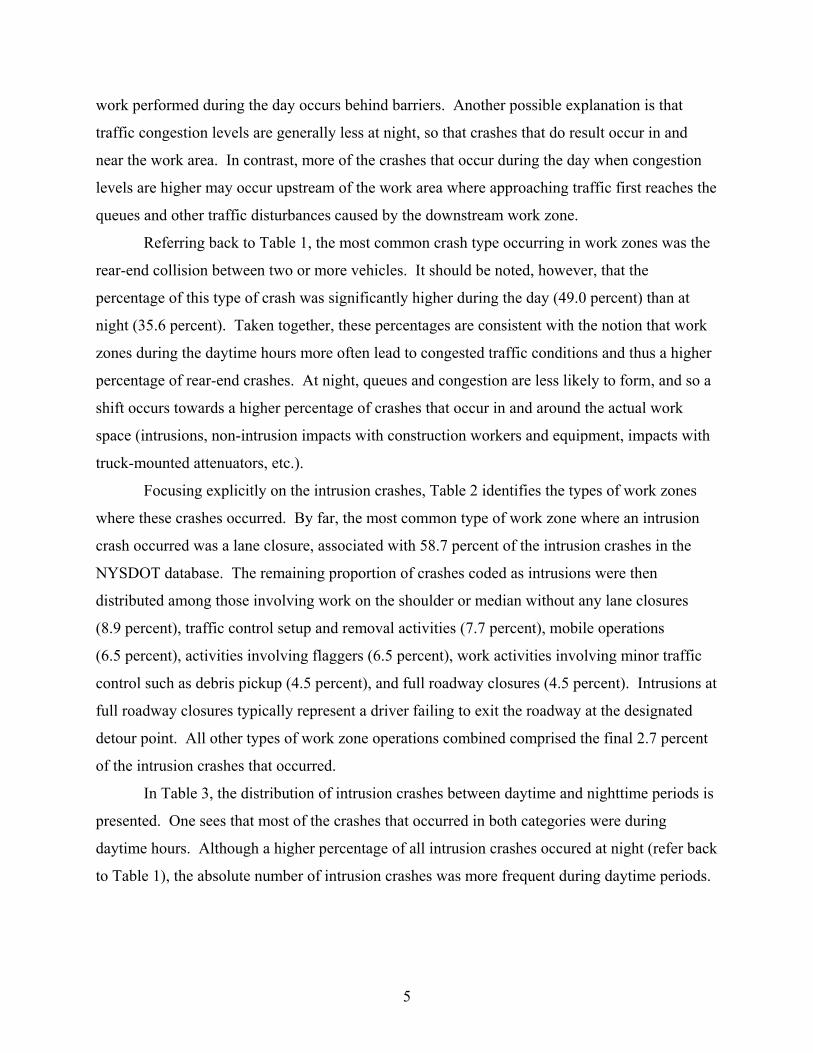
5
work performed during the day occurs behind barriers. Another possible explanation is that
traffic congestion levels are generally less at night, so that crashes that do result occur in and
near the work area. In contrast, more of the crashes that occur during the day when congestion
levels are higher may occur upstream of the work area where approaching traffic first reaches the
queues and other traffic disturbances caused by the downstream work zone.
Referring back to Table 1, the most common crash type occurring in work zones was the
rear-end collision between two or more vehicles. It should be noted, however, that the
percentage of this type of crash was significantly higher during the day (49.0 percent) than at
night (35.6 percent). Taken together, these percentages are consistent with the notion that work
zones during the daytime hours more often lead to congested traffic conditions and thus a higher
percentage of rear-end crashes. At night, queues and congestion are less likely to form, and so a
shift occurs towards a higher percentage of crashes that occur in and around the actual work
space (intrusions, non-intrusion impacts with construction workers and equipment, impacts with
truck-mounted attenuators, etc.).
Focusing explicitly on the intrusion crashes, Table 2 identifies the types of work zones
where these crashes occurred. By far, the most common type of work zone where an intrusion
crash occurred was a lane closure, associated with 58.7 percent of the intrusion crashes in the
NYSDOT database. The remaining proportion of crashes coded as intrusions were then
distributed among those involving work on the shoulder or median without any lane closures
(8.9 percent), traffic control setup and removal activities (7.7 percent), mobile operations
(6.5 percent), activities involving flaggers (6.5 percent), work activities involving minor traffic
control such as debris pickup (4.5 percent), and full roadway closures (4.5 percent). Intrusions at
full roadway closures typically represent a driver failing to exit the roadway at the designated
detour point. All other types of work zone operations combined comprised the final 2.7 percent
of the intrusion crashes that occurred.
In Table 3, the distribution of intrusion crashes between daytime and nighttime periods is
presented. One sees that most of the crashes that occurred in both categories were during
daytime hours. Although a higher percentage of all intrusion crashes occured at night (refer back
to Table 1), the absolute number of intrusion crashes was more frequent during daytime periods.

6
Table 2. Types of Work Zones Where Crashes Occurred.
Type of Work Zone Operation Percent of Intrusion Crashes
(n=249) Lane Closures Work on Shoulder or Median Traffic Control Setup and Removal Activities Mobile Operations Activities Involving Flaggers Work Activities Involving Minor Traffic Control Full Roadway Closures Other Miscellaneous Operations
58.7% 8.9% 7.7% 6.5% 6.5% 4.5% 4.5% 2.7%
Table 3. Crashes by Time of Day.
Time of Intrusion Crashes Percent of Intrusion Crashes Daytime Nighttime
69.9% 30.1%
In Table 4, the relative percentage of each type of item struck during the intrusion event
(workers, construction vehicle or equipment, or construction materials or debris) is summarized.
In the intrusion crashes of interest in this analysis, one sees that impacts with workers occurs less
frequently than the other types of impacts (15.7 percent). More of the collisions occur with
construction vehicles or equipment in the work space (49.0 percent) and construction material or
debris (35.3 percent).
Table 4. Items Struck in Crashes.
Item Struck Percent of Intrusion Crashes Worker Construction Vehicle or Equipment Construction Material or Debris
15.7% 49.0% 35.3%
Table 5 illustrates the severity of crashes documented in the NYSDOT database.
Approximately forty-four percent of intrusion crashes involve an injury or fatality, while 56.2
percent are property damage only.

7
Table 5. Crash Severity.
Crash Severity Percent of Intrusion Crashes Severe (Injury & Fatalities) Property Damage Only
43.8% 56.2%
In summary, the NYSDOT database does provide an overall indication of the extent and
characteristics of work zone highway intrusion crashes. In addition to these general statistics, the
database has a detailed narrative for most of the crash records, which can be used to establish
some general chain-of-event sequences that characterize these crashes. However, before
presenting these sequences, researchers conducted a series of telephone interviews to gather
experiences about work zone intrusion crashes in California. The purpose of these interviews
was to determine whether the experiences and general trends of work zone intrusions in
California were similar to those in New York, such that the statistics computed from the
NYSDOT database can be considered as a good surrogate of the California experiences. The
results of these interviews are summarized in the next section.
SURVEY OF CALTRANS AND HIGHWAY CONTRACTOR PERSONNEL
On-Line Survey to Gauge Extent of Intrusion Experiences
In December 2007, researchers developed and sent out a phase I on-line survey to gather
Caltrans and highway contractor field personnel input into work zone intrusion experiences. The
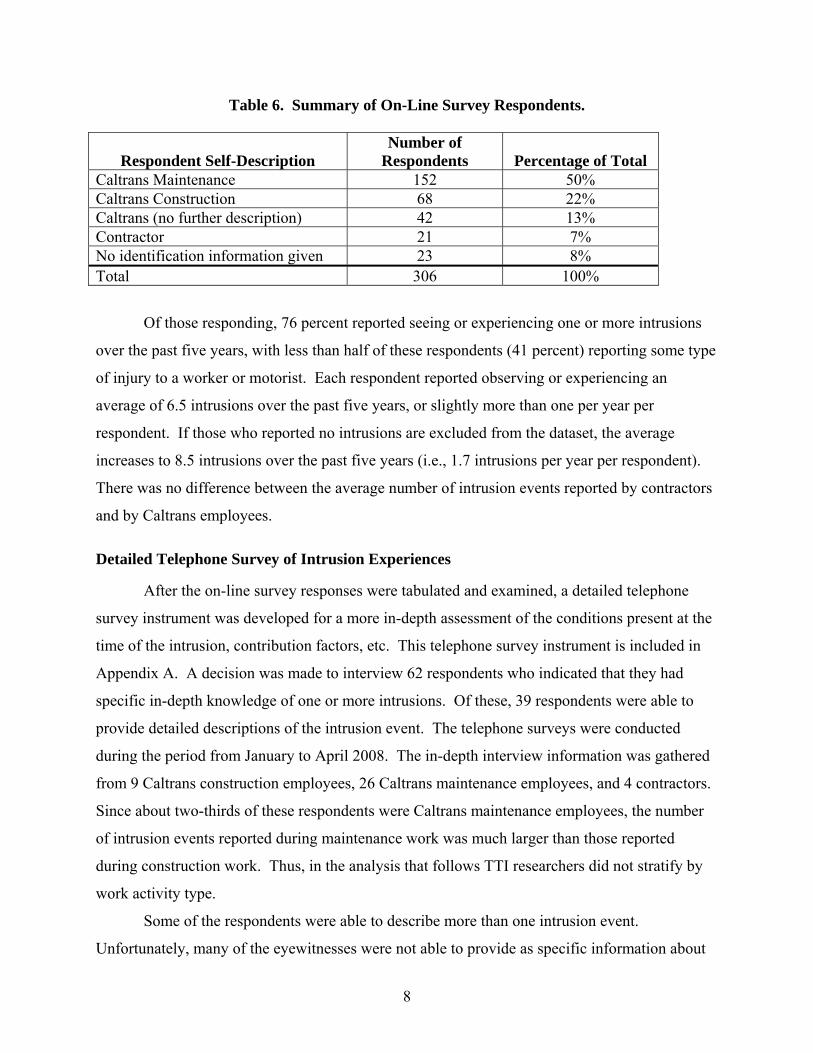
identification of respondents is summarized in Table 6. Researchers received a total of
306 responses. Fifty percent of the responses came from Caltrans maintenance personnel,
22 percent from Caltrans construction personnel, 13 percent from Caltrans employees who did
not specify a department, 7 percent from highway contractors, and remaining participants were
unidentified individuals. Responses were received from all districts except District 9 and
District 12.
8
Table 6. Summary of On-Line Survey Respondents.
Respondent Self-Description Number of
Respondents Percentage of Total Caltrans Maintenance 152 50% Caltrans Construction 68 22% Caltrans (no further description) 42 13% Contractor 21 7% No identification information given 23 8% Total 306 100%
Of those responding, 76 percent reported seeing or experiencing one or more intrusions
over the past five years, with less than half of these respondents (41 percent) reporting some type
of injury to a worker or motorist. Each respondent reported observing or experiencing an
average of 6.5 intrusions over the past five years, or slightly more than one per year per
respondent. If those who reported no intrusions are excluded from the dataset, the average
increases to 8.5 intrusions over the past five years (i.e., 1.7 intrusions per year per respondent).
There was no difference between the average number of intrusion events reported by contractors
and by Caltrans employees.
Detailed Telephone Survey of Intrusion Experiences
After the on-line survey responses were tabulated and examined, a detailed telephone
survey instrument was developed for a more in-depth assessment of the conditions present at the
time of the intrusion, contribution factors, etc. This telephone survey instrument is included in
Appendix A. A decision was made to interview 62 respondents who indicated that they had
specific in-depth knowledge of one or more intrusions. Of these, 39 respondents were able to
provide detailed descriptions of the intrusion event. The telephone surveys were conducted
during the period from January to April 2008. The in-depth interview information was gathered
from 9 Caltrans construction employees, 26 Caltrans maintenance employees, and 4 contractors.
Since about two-thirds of these respondents were Caltrans maintenance employees, the number
of intrusion events reported during maintenance work was much larger than those reported
during construction work. Thus, in the analysis that follows TTI researchers did not stratify by
work activity type.
Some of the respondents were able to describe more than one intrusion event.
Unfortunately, many of the eyewitnesses were not able to provide as specific information about

9
intrusion events as others. Their recollection of events was more anecdotal in nature. In
addition, some of their accounts did not actually result in an intrusion crash, but were
descriptions of hazardous situations that could have resulted in an intrusion crash.
Interestingly, one of the more common descriptions provided by the interviewees was
that of a motorist who “intentionally” penetrated into a work zone with their vehicle. Interview
respondents hypothesized several different motivations for why the motorists had chosen to
intrude into the work zones. In some cases, motorists were reported to have “cut through” the
work zones to reach an intended cross street or driveway. Other motorists simply moved into the
closed lane or shoulder to read a map, talk on the phone, or look for items in the vehicle. In one
instance, a motorist stopped in an active lane closure on the freeway to ask a worker for
directions. These deliberate actions that resulted in an intrusion were not included in the
tabulations below, unless they appeared to have occurred accidentally because the motorist was
confused and made an incorrect travel path choice decision.
Upon completion of the more in-depth interviews, the researchers were able to catalog
30 different intrusion events. Twenty seven vehicle intrusions were recalled by those
interviewed, versus three object intrusions. Two object intrusion events occurred on the freeway
and involved heavy trucks; one was a lost load of cardboard and the other was a flat tire. One
state highway object intrusion event was a light truck tire. Other objects were mentioned by
respondents as intruding into the work zone from a passing vehicle, such as a pickup truck bed
liner, but details about the event were not available and thus not included in this analysis. Other
anecdotal information included the intentional throwing of items, such as glass beverage bottles,
by passing motorists who had been delayed by the construction and/or maintenance activities.
Table 7 contains the resulting distribution of intrusion events by roadway type and time
of day. Almost two-thirds of the intrusion events documented occurred on freeway facilities.
Based on the sample information, most intrusion events (80 percent) occurred during daytime
hours, similar to the findings from the NYSDOT database analysis. More nighttime intrusion
events occurred on freeways than on state highways, but this is not surprising since the current
trend is to conduct night work on higher volume facilities that would most likely result in
congestion if the work was conducted during the day.

10
Table 7. Percent of Intrusion Events by Facility Type and Time of Day.
Time of Day
Facility Type Total
(n=30) Freeway (n=19)
State Highway (n=11)
Daytime 47%c 33%e 80% Nighttime 17%d 3% 20% Total (n=30) 64%a 36%b 100%
a Two events were object intrusions involving debris from heavy trucks. b One event was an object intrusion involving a tire. c One event involved an impaired driver. d Two events involved an impaired driver. e Two event involved an impaired driver and occurred during pilot car operations.
Five of the 30 events studied (17 percent) involved impaired drivers; however, only two
of these five events occurred at night. During each of these two nighttime impaired driver
intrusions, a California Highway Patrol (CHP) officer was onsite, and the intrusion occurred
downstream from the officer’s position, implying that not even enforcement presence was
enough to inhibit this type of intrusion event. The remaining three impaired driver events
occurred during daytime hours. Two of these daytime intrusion events occurred on state
highways during pilot car operations when an impaired driver attempted to pass another vehicle
by using a closed lane. In fact, one of the impaired drivers attempted to pass the pilot car itself.
Researchers further stratified the intrusion events by the type of work zone operation in
Table 8. Stationary lane closures, mobile operations, shoulder closures, and work activities
beyond the shoulders make up the majority of intrusions reported on freeways. During mobile
operations, the intrusion crashes that occur are typically vehicles which strike a TMA on the
back of the first work vehicle in the work convoy. On state highways, the predominant activity
where intrusion crashes occur are alternating one-way flow operations on two-lane highways
using flaggers to stop traffic at each end of the work zone. Stationary lane closures (for multi-
lane roadways) and mobile operations on state highways also comprise a significant portion of
intrusion crashes. The numbers are again similar to those computed from the NYSDOT
database, although the latter did have a slightly higher percentage of intrusion events occurring at
lane closure operations. Again, the discrepancy between these data sources could be due to the
high number of Caltrans maintenance personnel included in the telephone survey and the fact

11
that many maintenance activities are often accomplished without formal lane closures. The
NYSDOT database, in contrast, contains a large number of crashes that occurred at construction
operations when highway contractors were present.
Table 8. Distribution of Intrusion Events by Facility Type and Work Zone Setup.
Work Zone Setup Freeway (n=19)
State Hwy (n=11)
Totals (n=30)
Stationary Lane Closure 37%a 19% 30% Mobile Operation 21%b 19% 20% Ramp Closure 5% 0% 3% Shoulder Closure 16%c 8% 13% Work Beyond Shoulder 21% 8% 17% Alternating One-Way Traffic Flow Operations on Two-Lane Highways 0% 46% 17%
Total 100% 100% 100% a Three nighttime events
b Two nighttime events c One nighttime event
The frequency of intrusion events occurring when work is being performed beyond the
shoulder is somewhat surprising, because workers are typically located some distance from the
open travel lanes. Of these five events in the Caltrans surveys, one occurred when a worker who
was preparing to set up traffic control devices (TCDs) prior to initiating a work activity was
struck by an errant vehicle. In another event, a heavy truck struck a TCD which broke apart and
then hit a worker. The remaining three events resulted from passing vehicles departing the
roadway for unknown reasons and striking work vehicles, causing one passenger fatality.
Although the overall sample size is limited, the information does indicate the need to consider
more than just work activities that occur in the actual travel lanes.
Flagging operations were another category of work activities noted by the interviewees
where vehicle intrusions had occurred. It is generally assumed that many worker/vehicle
conflicts occur at flagger positions during lane closures on two-lane roadways. Interestingly,
however, only one of five intrusion events at alternating one-way operations occurred at the
flagger location. During this one event, a motorist drove past the flagger without making eye
contact and was stopped by another worker upon approaching the work activity area. Instead,
the majority of the intrusion events during these operations occurred within the work zone while
12
following a pilot car. In addition to the two impaired driver incidents previously discussed, the
remaining incidents involved flying object debris, and one motorist’s failure to properly follow a
pilot car. In this case, it is not understood whether the driver’s failure to follow the pilot car was
intentional or due to driver confusion or inattentiveness.
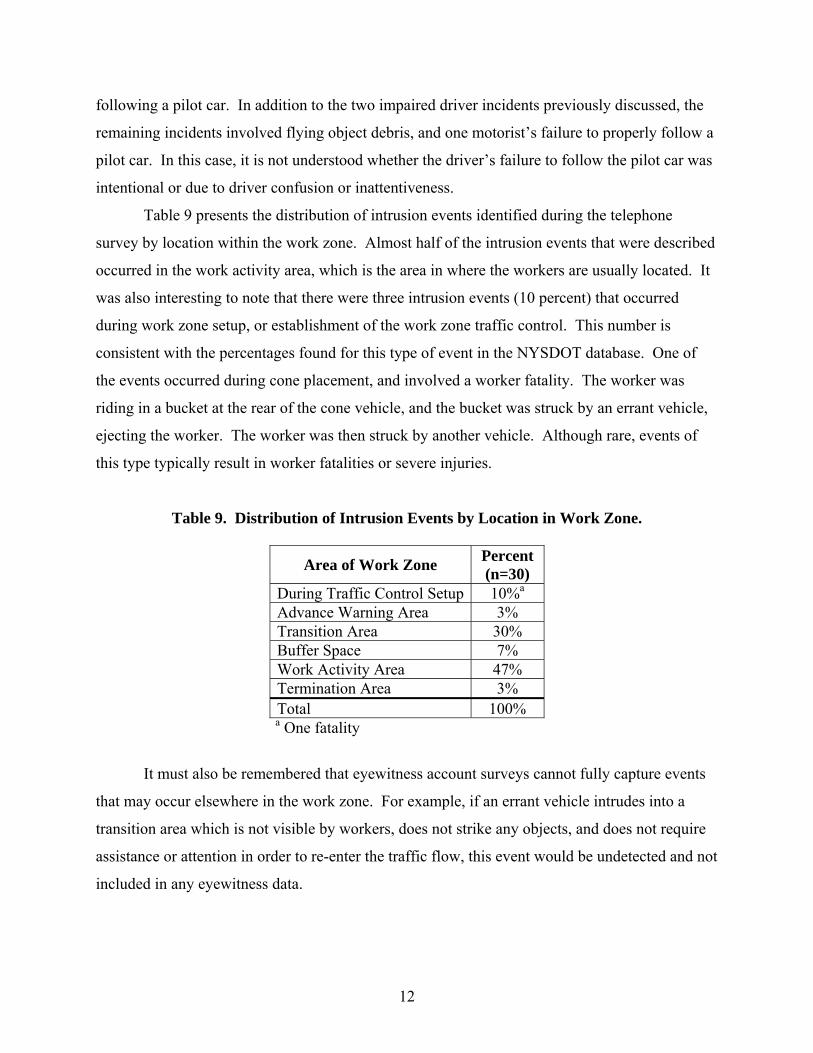
Table 9 presents the distribution of intrusion events identified during the telephone
survey by location within the work zone. Almost half of the intrusion events that were described
occurred in the work activity area, which is the area in where the workers are usually located. It
was also interesting to note that there were three intrusion events (10 percent) that occurred
during work zone setup, or establishment of the work zone traffic control. This number is
consistent with the percentages found for this type of event in the NYSDOT database. One of
the events occurred during cone placement, and involved a worker fatality. The worker was
riding in a bucket at the rear of the cone vehicle, and the bucket was struck by an errant vehicle,
ejecting the worker. The worker was then struck by another vehicle. Although rare, events of
this type typically result in worker fatalities or severe injuries.
Table 9. Distribution of Intrusion Events by Location in Work Zone.
Area of Work Zone Percent (n=30)
During Traffic Control Setup 10%a Advance Warning Area 3% Transition Area 30% Buffer Space 7% Work Activity Area 47% Termination Area 3% Total 100%
a One fatality
It must also be remembered that eyewitness account surveys cannot fully capture events
that may occur elsewhere in the work zone. For example, if an errant vehicle intrudes into a
transition area which is not visible by workers, does not strike any objects, and does not require
assistance or attention in order to re-enter the traffic flow, this event would be undetected and not
included in any eyewitness data.
13
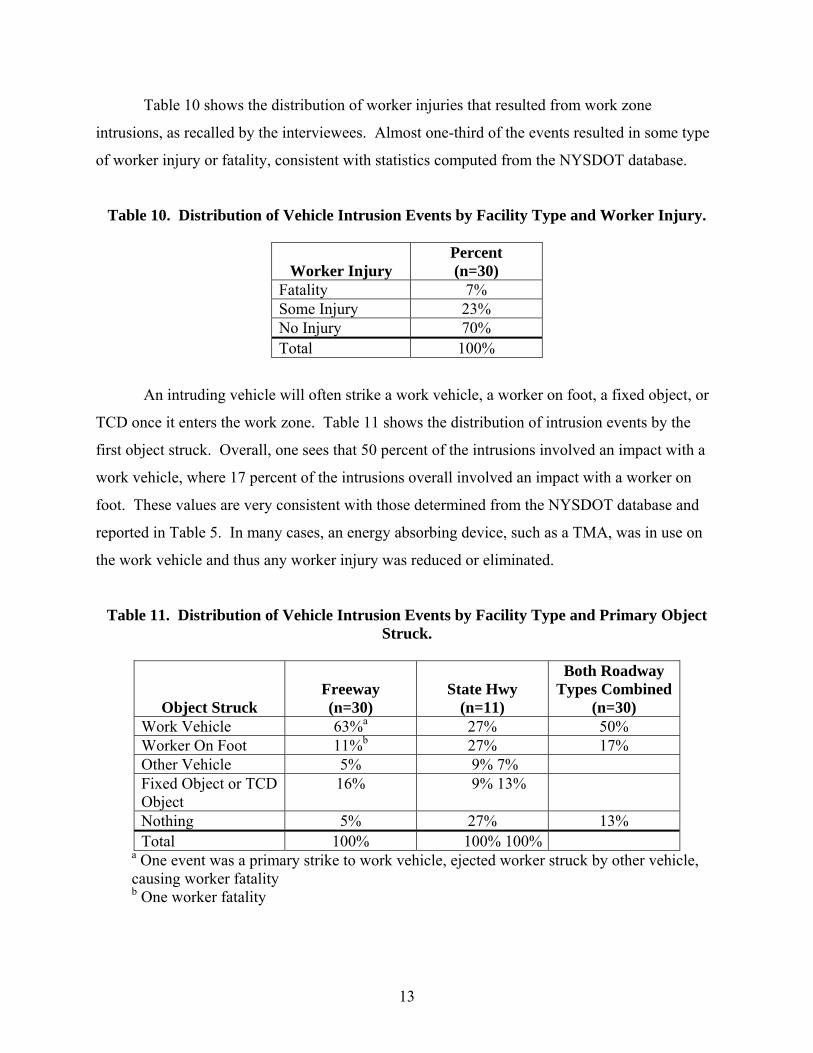
Table 10 shows the distribution of worker injuries that resulted from work zone
intrusions, as recalled by the interviewees. Almost one-third of the events resulted in some type
of worker injury or fatality, consistent with statistics computed from the NYSDOT database.
Table 10. Distribution of Vehicle Intrusion Events by Facility Type and Worker Injury.
Worker Injury Percent (n=30)
Fatality 7% Some Injury 23% No Injury 70% Total 100%
An intruding vehicle will often strike a work vehicle, a worker on foot, a fixed object, or
TCD once it enters the work zone. Table 11 shows the distribution of intrusion events by the
first object struck. Overall, one sees that 50 percent of the intrusions involved an impact with a
work vehicle, where 17 percent of the intrusions overall involved an impact with a worker on
foot. These values are very consistent with those determined from the NYSDOT database and
reported in Table 5. In many cases, an energy absorbing device, such as a TMA, was in use on
the work vehicle and thus any worker injury was reduced or eliminated.
Table 11. Distribution of Vehicle Intrusion Events by Facility Type and Primary Object Struck.
Object Struck Freeway (n=30)
State Hwy (n=11)
Both Roadway Types Combined
(n=30) Work Vehicle 63%a 27% 50% Worker On Foot 11%b 27% 17% Other Vehicle 5% 9% 7% Fixed Object or TCD Object
16% 9% 13%
Nothing 5% 27% 13% Total 100% 100% 100%
a One event was a primary strike to work vehicle, ejected worker struck by other vehicle, causing worker fatality b One worker fatality

14
There does appear to be a difference in these trends by roadway type, however. Whereas
nearly two-thirds of the freeway intrusions involved an impact with a work vehicle, only
27 percent of those occurring on state highways involved a work vehicle impact. Conversely,
only 11 percent of the intrusions at freeway work zones involved a worker on foot, compared
27 percent of intrusions on state highways. In other words, intrusion crashes on state highways
are equally likely to involve a work vehicle or a worker on foot; on freeways, intrusion crashes
are about 6 times more likely to involve a work vehicle than a worker on foot. Whether this is
due to a higher density of work vehicles at freeway sites as compared to work zones on state
highways, or other reasons, cannot be determined from these data.
Finally, researchers noted that five events described by the interviewees involved a
primary strike to a worker, compared to four events that involved a secondary strike to a worker
following an initial impact with a work vehicle, some construction materials or devices, or
another vehicle. In several instances, the initial impact occurred outside of the work space (i.e.,
was not an initial intrusion event). Two of the events involving workers were fatalities, and the
other seven resulted in some injury to the worker. As previously described, the first fatal event
occurred when a worker was riding in a bucket at the back of a vehicle setting cones, and the
bucket was struck. The worker was ejected and struck by another vehicle. The second fatal
event occurred during the day when an impaired driver penetrated a line of channelizing devices,
entered a work activity area and killed a worker.
Summary
Overall, the data that could be obtained through the telephone interviews was found to be
less detailed and precise than that contained in the NYSDOT database. This was to be expected,
as researchers were asking survey respondents to recall events that may have occurred many
months or even years in the past. Even though the level of detail was less, the results of this
analysis suggest that the general trends in work zone intrusion crashes identified in the NYSDOT
database were consistent with those experienced by Caltrans personnel and highway contractors
working for Caltrans. Consequently, researchers believe it is appropriate and acceptable to use
the data from the NYSDOT database regarding intrusion crashes and non-intrusion crashes
involving workers, construction vehicles or equipment, and construction materials or debris in
conjunction with the information collected from the telephone interviews in identifying and

15
quantifying the common chain-of-event sequences that characterize those types of crashes. The
derivation and description of those sequences are discussed in the following section.
COMMON WORK ZONE INTRUSION CRASH SEQUENCES
Researchers examined the narratives of the various intrusion crashes in the NYSDOT
database as well as the discussions from the Caltrans interviews to try and identify the main
categories or crash scenarios that occurred. For many of the crashes, the available narrative did
not provide significant detail or insights that could be used for this purpose. For example, many
of the narratives simply stated “vehicle 1 entered the closed lane and struck a construction
vehicle/worker/material,” which is of limited value in attempting to understand how and why the
intrusion occurred. However, other narratives were much more detailed, and did allow
researchers to collate and establish several prototypical sequences that occurred multiple times in
the database.
For purposes of this technical memorandum, the prototypical sequences have been
developed around four basic work zone operation categories:
• lane and shoulder closure operations (Figure 1),
• flagging operations (Figure 2),
• mobile operations (Figure 3), and
• traffic control set-up and removal operations (Figure 4).
As noted in the previous sections, these operations comprise 58.7 percent, 6.5 percent,
6.5 percent, and 7.7 percent, respectively, of the work zone intrusion crashes documented in the
NYSDOT database. The interviews with Caltrans and highway contractor personnel also
indicated that these operations were commonly associated with intrusion events. A fifth category
of intrusions at miscellaneous operations did not yield any meaningful crash sequence trends that
differed substantively from those developed from the above four work zone situations.
Within each of these basic work zone situations, several different sequences leading to
work zone intrusion crashes were defined. These sequences were first differentiated on whether
or not the action taken appeared to be a deliberate decision on the part of the driver. Next, the
primary contributing action or factor leading to the intrusion was identified. Finally, some
differentiation was made within some of the key contributing actions or factors to further
describe the overall crash sequence of the intrusion event.

16
Chooses to Enter Work Area
Deliberate Actions
Driver deliberately decides to enter closed lane to reach exit, intersection, or driveway (19%)
Driver follows work vehicle into work area (5%) Chooses to Operate Vehicle
While Impaired
Driver is drowsy or otherwise impaired, enters closed lane for unknown reason (21%) Surprised by Stoppage Approaching driver fails to recognize slowed traffic in work zone, veers to avoid rear-
end collision, enters work area (8%) Approaching driver fails to recognize slowed traffic, commits a rear-end collision with
vehicle in travel lane, then continues into work area (12%) Approaching driver fails to recognize slowed traffic, commits a rear-end collision with
vehicle in travel lane, continues into work area, and pushes other vehicle into work area as well (5%)
Non-Deliberate Actions Surprised by Other Debris in open lane, driver swerves into closed lane to avoid (2%) Lane change by an adjacent vehicle in open lanes next to closed lane forces driver into
work space (5%) Driver loses control due to vehicle malfunction or weather or initial impact, enters closed
lane (9%) Two drivers approach a lane closure taper, one fails to recognize that lane is ending,
cannot find adequate gap in open lane to merge into, enters work zone taper and buffer area (5%)
Driver approaches in closed lane or shoulder and fails to recognize lane is closed, enters taper and buffer area (3%)
Confused by Temporary Traffic Control
Channelizing devices not properly set, driver incorrectly chooses to use closed lane (4%) Driver chooses to enter roadway going in wrong direction, enters work area from
downstream end (2%)
Figure 1. Vehicle Intrusion Crash Sequences: Lane Closure Operations.
17
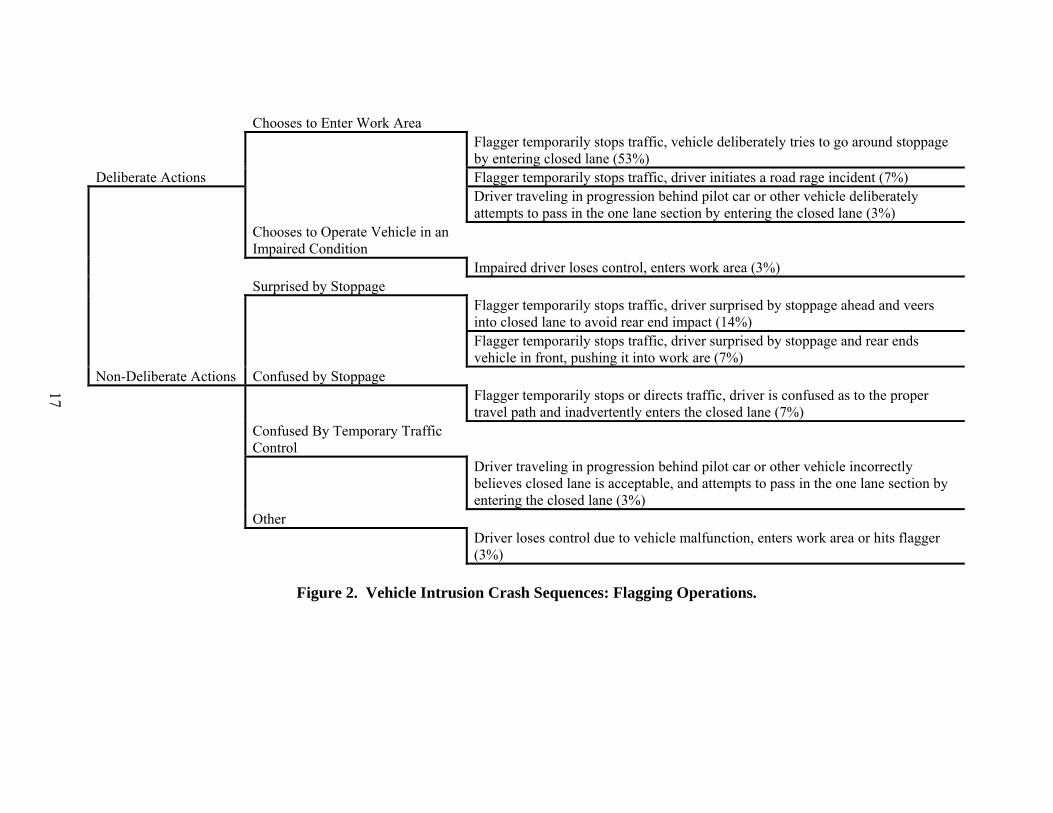
Chooses to Enter Work Area
Flagger temporarily stops traffic, vehicle deliberately tries to go around stoppage by entering closed lane (53%)
Deliberate Actions Flagger temporarily stops traffic, driver initiates a road rage incident (7%) Driver traveling in progression behind pilot car or other vehicle deliberately
attempts to pass in the one lane section by entering the closed lane (3%) Chooses to Operate Vehicle in an
Impaired Condition
Impaired driver loses control, enters work area (3%) Surprised by Stoppage Flagger temporarily stops traffic, driver surprised by stoppage ahead and veers
into closed lane to avoid rear end impact (14%) Flagger temporarily stops traffic, driver surprised by stoppage and rear ends
vehicle in front, pushing it into work are (7%) Non-Deliberate Actions Confused by Stoppage Flagger temporarily stops or directs traffic, driver is confused as to the proper
travel path and inadvertently enters the closed lane (7%) Confused By Temporary Traffic
Control
Driver traveling in progression behind pilot car or other vehicle incorrectly believes closed lane is acceptable, and attempts to pass in the one lane section by entering the closed lane (3%)
Other Driver loses control due to vehicle malfunction, enters work area or hits flagger
(3%)
Figure 2. Vehicle Intrusion Crash Sequences: Flagging Operations.
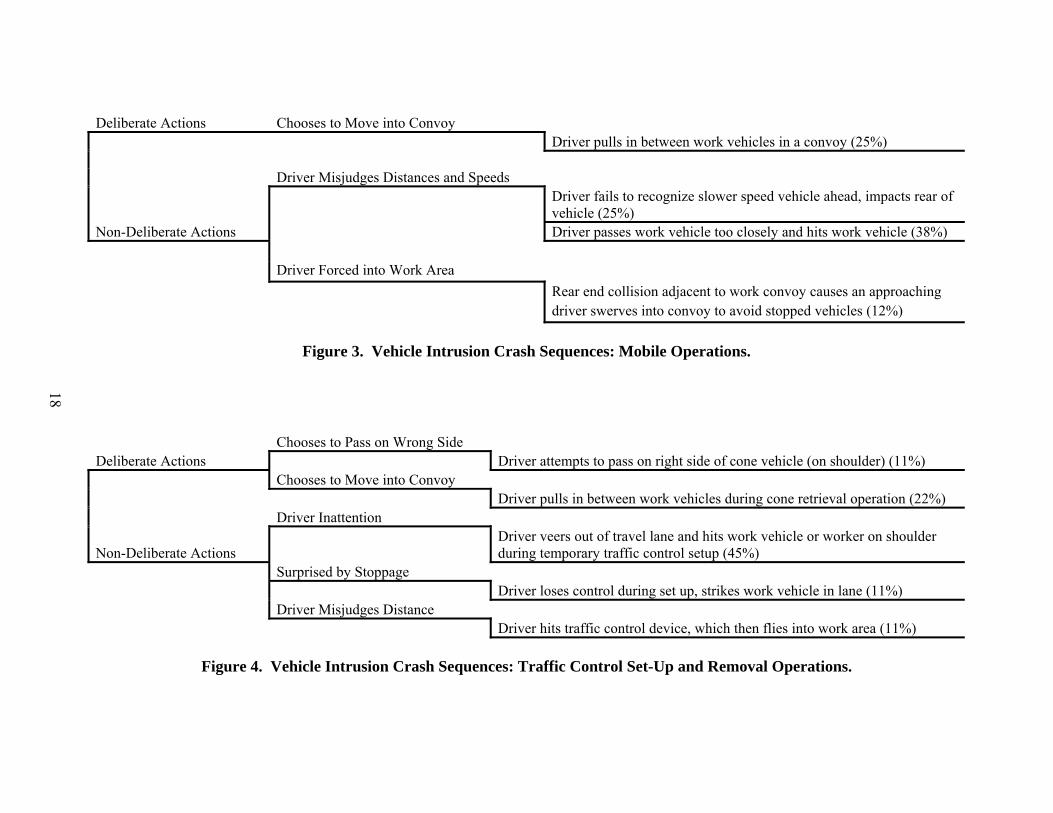
18
Deliberate Actions Chooses to Move into Convoy Driver pulls in between work vehicles in a convoy (25%) Driver Misjudges Distances and Speeds Driver fails to recognize slower speed vehicle ahead, impacts rear of
vehicle (25%) Non-Deliberate Actions Driver passes work vehicle too closely and hits work vehicle (38%) Driver Forced into Work Area Rear end collision adjacent to work convoy causes an approaching
driver swerves into convoy to avoid stopped vehicles (12%)
Figure 3. Vehicle Intrusion Crash Sequences: Mobile Operations. Chooses to Pass on Wrong Side Deliberate Actions Driver attempts to pass on right side of cone vehicle (on shoulder) (11%) Chooses to Move into Convoy Driver pulls in between work vehicles during cone retrieval operation (22%) Driver Inattention Non-Deliberate Actions
Driver veers out of travel lane and hits work vehicle or worker on shoulder during temporary traffic control setup (45%)
Surprised by Stoppage Driver loses control during set up, strikes work vehicle in lane (11%) Driver Misjudges Distance Driver hits traffic control device, which then flies into work area (11%)
Figure 4. Vehicle Intrusion Crash Sequences: Traffic Control Set-Up and Removal Operations.
19
Typical Work Zone Intrusion Scenarios at Lane Closure Operations
The largest frequency of work zone intrusion events occurred at lane closure operations.
Figure 1 presents the crash sequence analysis tree for these operations. The relative frequency of
these individual crash sequences for this type of work zone operation is shown as percentages
next to each statement at the right side of the figure (the percentages add to 100).
Overall, the researchers concluded that deliberate decisions and actions on the part of the
driver account for almost one-half of the intrusion events that occur at lane closure operations.
In most instances, the deliberate action taken is the decision to drive impaired, accounting for
21 percent of all lane closure intrusion events. Another 19 percent of the intrusions occurred
because it appeared that drivers deliberately chose to enter the closed lane to reach a desired exit,
intersection, or driveway. Finally, intrusions by drivers who simply followed a work vehicle into
the closed lane accounted for 5 percent of the intrusions at lane closure operations in the
database.
The remaining intrusions at lane closure operations were judged by researchers to have
not been the result of a deliberate decision by the driver. Rather, drivers were either confused or
surprised by the work zone situation, which led to driving decisions and behaviors that ultimately
resulted in one or more vehicles intruding into the work zone. Specifically, one-fourth of the
intrusions at lane closure operations occurred because drivers were surprised by a stoppage of
traffic in the travel lane. The surprise condition then resulted in a driver veering directly into the
work zone to avoid a rear-end collision with the vehicle immediately in front (8 percent of lane
closure intrusions), in a driver actually having a rear-end collision with another vehicle in the
travel lane and then continuing into the work zone (12 percent of lane closure intrusions), or in a
driver colliding (rear-end) with another vehicle and then pushing that vehicle into the work zone
as well (5 percent of lane closure intrusions).
Another one-quarter of the lane closure intrusions were caused by other “surprises” that
eventually led to drivers entering the closed lane. In 9 percent of the lane closure intrusions, a
vehicle malfunction/weather event/impact with a traffic control device or other factor causes a
driver to lose control of the vehicle and enter the closed lane somewhere within the length of
work zone. In another 5 percent of the intrusions, a vehicle operating in an adjacent lane
swerved towards a second vehicle, causing the second vehicle to swerve away from that first
20
vehicle and into the closed lane. In 2 percent of the lane closure intrusions, debris in the travel
lanes caused a driver to swerve into the closed lane.
Two crash sequences identified under the “surprised by other” category of events
involved vehicles approaching the merging taper of the lane closure that ended up entering the
closed travel lane. In 5 percent of the lane closure intrusions, two vehicles operating next to one
another approached the taper, forcing the vehicle in the lane to be closed through the taper and
into the closed lane area. In another 3 percent of the lane closure intrusions, a vehicle
approaching the taper ran through the taper and into the closed lane area when there was not
another vehicle nearby that appeared to force this maneuver (i.e., the intruding driver could have
changed lanes into the open lane, but did not).
The final categories of lane closure intrusions appeared to be the result of advance
signing or channelizing devices that were not set properly (devices missing, spacing too far apart,
etc.) which confused drivers into entering the closed lane. In 2 percent of the lane closure
intrusions, drivers entered the roadway downstream of the lane closure traveling in the wrong
direction, and entered the work zone and the closed lane from the downstream direction.
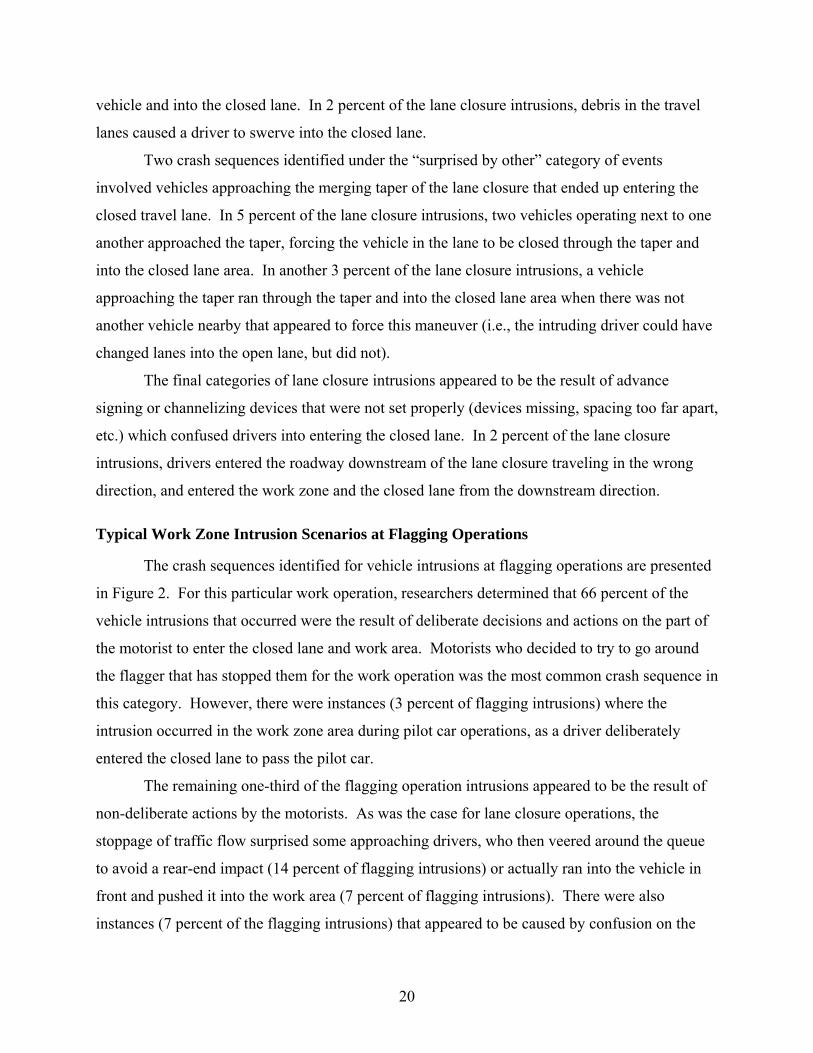
Typical Work Zone Intrusion Scenarios at Flagging Operations
The crash sequences identified for vehicle intrusions at flagging operations are presented
in Figure 2. For this particular work operation, researchers determined that 66 percent of the
vehicle intrusions that occurred were the result of deliberate decisions and actions on the part of
the motorist to enter the closed lane and work area. Motorists who decided to try to go around
the flagger that has stopped them for the work operation was the most common crash sequence in
this category. However, there were instances (3 percent of flagging intrusions) where the
intrusion occurred in the work zone area during pilot car operations, as a driver deliberately
entered the closed lane to pass the pilot car.
The remaining one-third of the flagging operation intrusions appeared to be the result of
non-deliberate actions by the motorists. As was the case for lane closure operations, the
stoppage of traffic flow surprised some approaching drivers, who then veered around the queue
to avoid a rear-end impact (14 percent of flagging intrusions) or actually ran into the vehicle in
front and pushed it into the work area (7 percent of flagging intrusions). There were also
instances (7 percent of the flagging intrusions) that appeared to be caused by confusion on the

21
part of the motorist as to the directions being given by the flagger. In addition, similar to the
sequence described under the deliberate actions, 3 percent of the flagging intrusions occurred
during pilot car operations where the accident narrative indicated that the driver was confused
and attempted to pass the progression of vehicles by traveling in the closed lane (exactly how the
field personnel knew the driver was confused and not making a deliberate decision to use the
closed lane was not evident from the narrative).
Typical Work Zone Intrusion Scenarios at Mobile Operations
Figure 3 illustrates the crash sequences identified for intrusions into mobile operations.
For those intrusions that were deliberately performed by the driver, all occurred because the
driver chose to pass the upstream work vehicle and then incorrectly enter the closed lane within
the work convoy moving down the roadway (25 percent of the mobile operation intrusions were
of this type).
For the remaining mobile operation intrusions that were judged to be non-deliberate
actions, misjudgment by the driver approaching a work convoy appeared to be responsible two-
thirds (63 percent) of the mobile operation intrusions. Twenty-five percent of the mobile
operation intrusions were actually rear-end collisions between the approaching vehicle and the
upstream work vehicle, while another one-third (38 percent of mobile operation intrusions) were
vehicle impacts with the sides of the work vehicles (presumably because the drivers misjudged
the distance between their vehicle and the work vehicle). Another 12 percent of the mobile
operation intrusions occurred because other vehicles in the open lanes around the work convoy
were stopped for some reason, and an approaching driver veered into the work convoy area to
avoid a rear-end collision with those stopped vehicles.
Typical Work Zone Intrusion Scenarios at Traffic Control Set-Up and Removal Operations
Similar to the trends observed for mobile operations, a smaller proportion of vehicle
intrusions that occurred during traffic control set-up and removal operations (33 percent) were
the result of deliberate actions by the motorists (see Figure 4). Most of these (22 percent)
occurred because drivers pulled their vehicles into the convoy of work vehicles during a cone
retrieval operation, with a few others resulting from drivers who decided to try to pass the traffic
control vehicle on the right shoulder during installation or removal activities. The intrusions that

22
were not deliberate actions by motorists (67 percent of the intrusions during traffic control set-up
and removal) appeared to be due to either driver inattention that led to their failure to maintain
their vehicle in the travel lane, to drivers being surprised by the stoppage of traffic in the travel
lane around the set-up and removal activity, or to drivers hitting a traffic control device which
then entered into the work area and struck a worker.
CONCLUSIONS
Based on the results of the NYSDOT database analysis and telephone surveys of Caltrans
and highway contractor personnel in California, researchers gained a number of insights into the
frequency, characteristics, and crash sequences that comprise vehicle intrusion crashes at
California work zones. The following bullet list summarizes these key points.
• Intrusion crashes make up a relatively small portion of crashes at work zones.
During daytime operations, 7.5 percent of traffic crashes that occur involve some
type of vehicle intrusion into the work area. This percentage does increase
somewhat at night (12.4 percent).
• Although intrusion crashes comprise a greater proportion of nighttime crashes
than daytime crashes, most of the intrusion crashes that do occur (69.9 percent)
happen during daytime work operations.
• Based on the NYSDOT database, the biggest share (58.7 percent) of vehicle
intrusion crashes occurs at lane closure operations. Intrusion crashes also occur at
mobile operations, flagging operations, and during traffic control set-up and
removal activities, but each of these make up less than 10 percent of the intrusion
crashes. These same work operations were also cited during interviews with
Caltrans and highway contractor personnel in California, although the relative
percentages were slightly different.
• When intrusions crashes occur, they most often involve collisions with work
vehicles/equipment or work materials/debris; only 15.7 percent of intrusion
crashes in the NYSDOT database involved a collision with a highway worker.
For the Caltrans/highway contractor interviews, 17 percent of the intrusion events
documented involved an impact with a worker, which tend to be fairly severe
events.
23
• A significant portion of intrusion crashes are the result of deliberate driver
decisions and actions to enter the work area. The relative frequency of such
deliberate events differs by type of work operation in place, but ranges from 22 to
63 percent of all intrusion crashes occurring at those types of operations.
• Depending on the type of work operation in place on a roadway, researchers
identified between 2 and 10 different crash sequences that were not deliberate
actions by drivers which ultimately resulted in an intrusion crash.


25
CHAPTER 3: STRATEGIES AND TECHNOLOGIES TO REDUCE
WORK ZONE INTRUSION CRASHES
Next, researchers identified potential reasons that could have contributed to the
occurrence of the work zone intrusion crash sequences discussed in Chapter 2 and matched
possible strategies and technologies that could be deployed to mitigate these crashes. The
objective of the task was to identify all potential countermeasures that could possibly address a
particular intrusion crash sequence, regardless of its potential costs and practicality. In
Chapter 4, researchers discuss their critique of each scenario/countermeasure combination on the
basis of potential likelihood for crash reduction, cost of implementation, operation, and
maintenance, and practicality of implementation.
Table 12 through Table 15 show the results of the countermeasure brainstorming process
for the intrusion crash sequences for the following four basic work zone operation
configurations, respectively:
• lane closure operations,
• flagging operations,
• mobile operations, and
• traffic control set-up and removal operations.
For brevity, researchers combined similar crash sequences in these tables when the assumed
contributing factors and potential countermeasures were the same. Thus, in some cases the
events (and the percentages) listed in the tables do not exactly match those shown in Chapter 2.
As expected, several of the intrusion crash countermeasures identified may be used to
address more than one crash sequence. The following sections include a more detailed
discussion of the comprehensive list of possible intrusion crash countermeasures identified by
researchers. When available, researchers included data regarding the benefits of the technologies
and strategies.
26
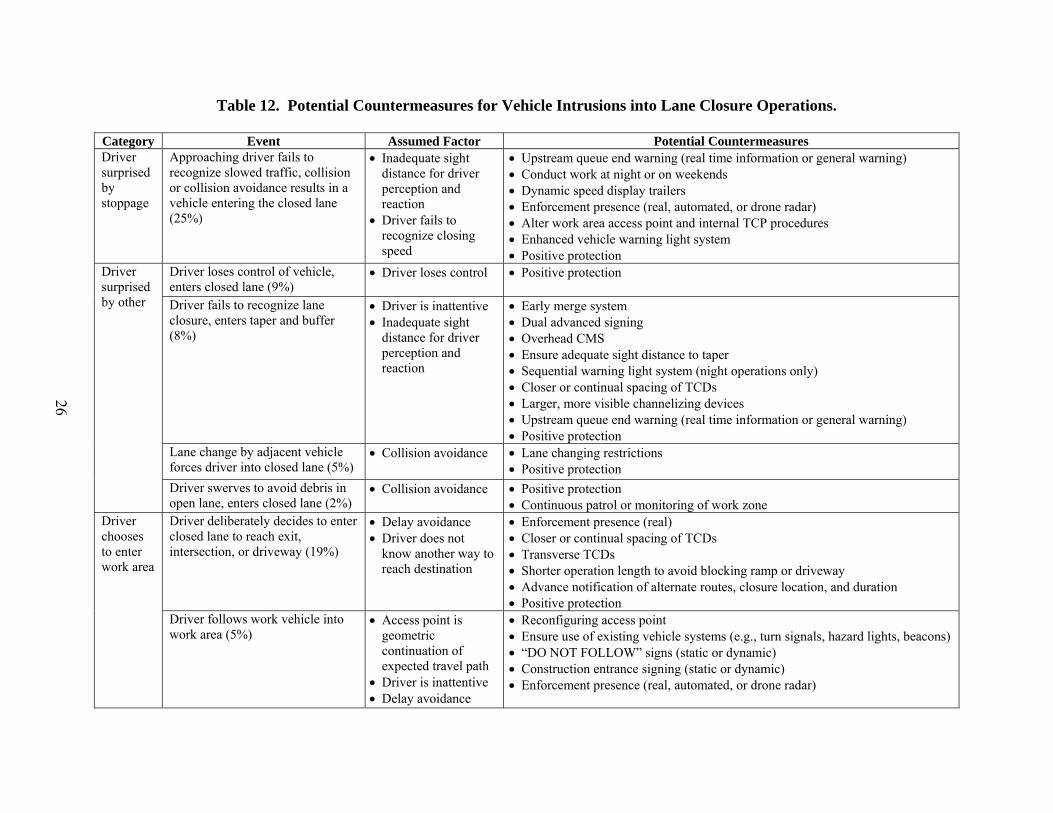
Table 12. Potential Countermeasures for Vehicle Intrusions into Lane Closure Operations. Category Event Assumed Factor Potential Countermeasures Driver surprised by stoppage
Approaching driver fails to recognize slowed traffic, collision or collision avoidance results in a vehicle entering the closed lane (25%)
• Inadequate sight distance for driver perception and reaction
• Driver fails to recognize closing speed
• Upstream queue end warning (real time information or general warning) • Conduct work at night or on weekends • Dynamic speed display trailers • Enforcement presence (real, automated, or drone radar) • Alter work area access point and internal TCP procedures • Enhanced vehicle warning light system • Positive protection
Driver surprised by other
Driver loses control of vehicle, enters closed lane (9%)
• Driver loses control • Positive protection
Driver fails to recognize lane closure, enters taper and buffer (8%)
• Driver is inattentive • Inadequate sight
distance for driver perception and reaction
• Early merge system • Dual advanced signing • Overhead CMS • Ensure adequate sight distance to taper • Sequential warning light system (night operations only) • Closer or continual spacing of TCDs • Larger, more visible channelizing devices • Upstream queue end warning (real time information or general warning) • Positive protection
Lane change by adjacent vehicle forces driver into closed lane (5%)
• Collision avoidance • Lane changing restrictions • Positive protection
Driver swerves to avoid debris in open lane, enters closed lane (2%)
• Collision avoidance • Positive protection • Continuous patrol or monitoring of work zone
Driver chooses to enter work area
Driver deliberately decides to enter closed lane to reach exit, intersection, or driveway (19%)
• Delay avoidance • Driver does not
know another way to reach destination
• Enforcement presence (real) • Closer or continual spacing of TCDs • Transverse TCDs • Shorter operation length to avoid blocking ramp or driveway • Advance notification of alternate routes, closure location, and duration • Positive protection
Driver follows work vehicle into work area (5%)
• Access point is geometric continuation of expected travel path
• Driver is inattentive • Delay avoidance
• Reconfiguring access point • Ensure use of existing vehicle systems (e.g., turn signals, hazard lights, beacons) • “DO NOT FOLLOW” signs (static or dynamic) • Construction entrance signing (static or dynamic) • Enforcement presence (real, automated, or drone radar)

27
Table 12. Potential Countermeasures for Vehicle Intrusions into Lane Closure Operations (continued).
Category Event Assumed Factor Potential Countermeasures Driver chooses to operate vehicle while impaired
Driver enters closed lane (21%) • Driver is under influence of alcohol or drugs
• Driver is drowsy
• Enforcement presence (real, automated, or drone radar) • Closer or continual spacing of TCDs • Transverse TCDs • Temporary transverse rumble strips • Sequential warning light system (night operations only) • Positive protection
Driver is confused by TTC
Channelizing devices not properly set, driver incorrectly chooses to use closed lane (4%)
• Driver is confused by TTC • Proper set-up and maintenance of TTC
Driver chooses to enter roadway going in wrong direction, enters work area from downstream end (2%)
• Driver is confused by TTC • Closer or continual spacing of TCDs • Transverse TCDs • Downstream spotter
TCP = traffic control plan; TCD = traffic control device; CMS = changeable message sign; TTC = temporary traffic control

28
Table 13. Potential Countermeasures for Vehicle Intrusions into One-Way Flagging Operations
on Two-Lane Two-Way Roadways.
Event Assumed Factor Potential Countermeasures Driver ignores flagger instruction, enters closed lane (60%)
• Delay avoidance • Enforcement presence (real) • Transverse TCDs/LCDs • Advance notice of work activity • Replace flagger with police officer • Limit lane closure length
Driver enters closed lane to pass pilot vehicle or another vehicle in progression (3%)
• Delay avoidance • Closer or continual spacing of TCDs • Transverse TCDs • Limit lane closure length • Enforcement (real) • Positive protection
Impaired driver enters work area (3%) • Driver is under influence of alcohol or drugs
• Driver is drowsy
• Enforcement presence (real or drone radar) • Closer or continual spacing of TCDs • Transverse TCDs • Temporary transverse rumble strips
Approaching driver fails to recognize stopped traffic, collision or collision avoidance results in a vehicle entering the closed lane (21%)
• Inadequate sight distance for driver perception and reaction
• Failure to recognize closing speed
• Temporary transverse rumble strips • Advance warning messages on PCMSs • Dynamic speed display trailers • Enforcement presence (real, automated, or drone)
Driver uncertain of correct travel path at flagger station, inadvertently enters the closed lane (7%)
• Driver is confused by TTC • Transverse TCDs/LCDs
While travelling in progression, driver incorrectly believes that the closed lane is open and enters it to pass pilot vehicle or other vehicle (3%)
• Driver is confused by TTC • Closer or continual spacing of TCDs • Transverse TCDs • Positive protection
Driver loses control of vehicle, enters work area or hits flagger (3%)
• Loss of control • AFADs • Portable traffic signal system • Positive protection
TCD = traffic control device; LCD = longitudinal channelizing device; PCMS = portable changeable message sign; AFAD = automated flagger assistance device
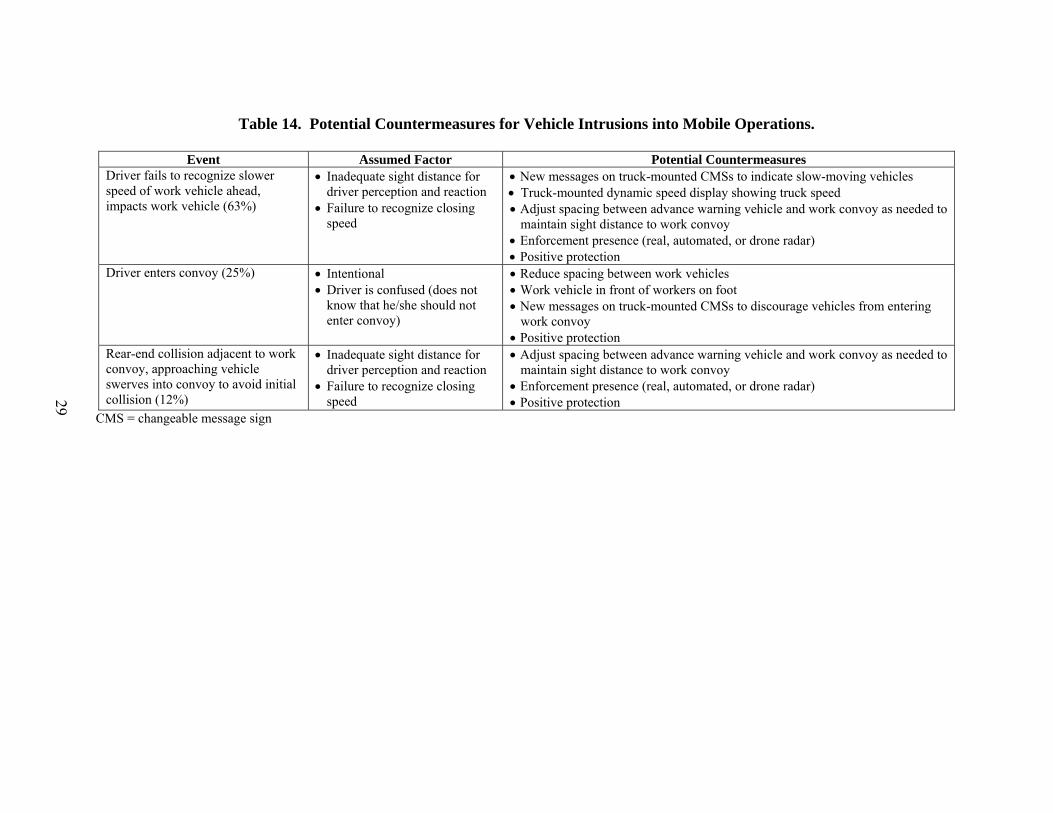
29
Table 14. Potential Countermeasures for Vehicle Intrusions into Mobile Operations.
Event Assumed Factor Potential Countermeasures
Driver fails to recognize slower speed of work vehicle ahead, impacts work vehicle (63%)
• Inadequate sight distance for driver perception and reaction
• Failure to recognize closing speed
• New messages on truck-mounted CMSs to indicate slow-moving vehicles • Truck-mounted dynamic speed display showing truck speed • Adjust spacing between advance warning vehicle and work convoy as needed to
maintain sight distance to work convoy • Enforcement presence (real, automated, or drone radar) • Positive protection
Driver enters convoy (25%) • Intentional • Driver is confused (does not
know that he/she should not enter convoy)
• Reduce spacing between work vehicles • Work vehicle in front of workers on foot • New messages on truck-mounted CMSs to discourage vehicles from entering
work convoy • Positive protection
Rear-end collision adjacent to work convoy, approaching vehicle swerves into convoy to avoid initial collision (12%)
• Inadequate sight distance for driver perception and reaction
• Failure to recognize closing speed
• Adjust spacing between advance warning vehicle and work convoy as needed to maintain sight distance to work convoy
• Enforcement presence (real, automated, or drone radar) • Positive protection
CMS = changeable message sign

30
Table 15. Potential Countermeasures for Vehicle Intrusions into Traffic Control Set-Up and Removal Operations.
Event Assumed Factor Potential Countermeasures
Driver attempts to pass work vehicle on shoulder (11%) • Delay avoidance • Additional work vehicle on shoulder Driver enters between work vehicles (22%) • Intentional
• Driver is confused (did not know he/she should not enter convoy)
• Reduce spacing between work vehicles • Work vehicle in front of workers on foot • New messages on truck-mounted CMSs to
discourage vehicles from entering work convoy • Positive protection
Driver veers out of travel lane and hits work vehicle or worker on shoulder (44%)
• Driver is inattentive • Enforcement presence (real, automated, or drone radar)
• Enhanced vehicle warning light system • Automated TCD set-up/removal • Positive protection
Driver loses control, strikes work vehicle in lane (11%) • Loss of control • Automated TCD set-up/removal • Positive protection
Driver strikes TCD, which then flies into work area (11%) • Intentional • Driver is inattentive • Driver loses control • Driver is confused by TTC • Collision avoidance
• Enforcement (real, automated, or drone radar) • Positive protection • Follow proper TTC set-up and removal
procedures
CMS = changeable message sign; TCD = traffic control device; TTC = temporary traffic control
31
POTENTIAL COUNTERMEASURES FOR INTRUSIONS INTO LANE CLOSURE OPERATIONS
As shown in Table 12, intrusions into stationary lane closures occur for a variety of
reasons. Almost 50 percent of these events occurred because the driver was either surprised by
slowed or stopped traffic or by some other unexpected event (e.g., lane closure, lane changes by
other vehicles, etc.). In another 24 percent of these events, it appears that drivers deliberately
entered the lane closure in order to avoid delay, because they did not know another way to reach
their destination, or because they just kept following a work vehicle. While 21 percent of lane
closure intrusions may be linked to driver impairment, another 6 percent may be a result of
drivers being confused by the temporary traffic control set-up.
Researchers identified a large number of potential countermeasures that may be used to
reduce intrusions into lane closure operations (Table 12). For ease of discussion, researchers will
discuss the countermeasures that can be used throughout the entire work zone first, followed by
those that can be applied in the advance warning area, transition area, and activity area,
respectively.
Entire Work Zone
The following countermeasures can be used to decrease the potential for intrusion crashes
throughout the entire lane closure operation:
• ensure proper set-up and maintenance of temporary traffic control,
• continual patrol or monitoring of open travel lanes, and
• provide enforcement (real, automated, or drone radar).
For the majority of the lane closure intrusion events described above, the information
contained in the NYSDOT database did not allow researchers to determine whether or not the
temporary traffic control was properly set-up. Nevertheless, researchers were able to verify that
the temporary traffic control was improperly set-up in 4 percent of these events. For the
remainder of the events, researchers assumed that the temporary traffic control was correct and
that the intrusion crash was due to some other factor. Obviously, proper set-up and maintenance
of temporary traffic control is important for the safety of both motorists and workers; it appears
that failures to properly implement temporary traffic control do contribute to a small proportion
of intrusions that occur.

32
In a small number of the lane closure intrusion crashes (2 percent), debris in the open
travel lane caused drivers to swerve into the closed lane. Continuous patrol or monitoring of the
work zone may be used to ensure that debris or other road conditions do not present hazards for
passing motorists.
Police presence may also reduce the occurrence of intrusions into lane closure operations
by drawing attention to the work zone and reducing speeds. Previous research (1,2) has shown
enforcement to be the most effective method of speed control available in work zones. However,
the relationship between speed reductions and the occurrence of intrusion crashes is unknown.
The most commonly mentioned enforcement approaches in the literature include (3):
• Circulating (also referred to as mobile) patrols – These can be accomplished in
both marked and unmarked patrol vehicles. In addition, determination of
violators can occur through the use of radar units mounted in the vehicle or by
physically following the vehicle and noting the speed required to maintain a
consistent following distance. Speed reductions with circulating patrols typically
range from 2 to 4 mph (3).
• Stationary patrols – These can also be accomplished in both marked and
unmarked vehicles. This technique can be accomplished with a single officer and
vehicle, or with multiple officers and vehicles. If the former, the lone officer has
full responsibility for identifying violators, engaging in pursuit, and then stopping
the violator and issuing the citation. In the latter, one officer identifies violators,
and then notifies additional officer(s) downstream who stop the violator and issue
the citation. Speed reductions with stationary patrols typically range from 3 to
12 mph (3).
• Police traffic controllers – This technique requires the officer to be positioned
outside of their vehicle. The officer does not necessarily perform specific traffic
control duties such as stopping vehicles, indicating to drivers where to travel, etc.
(although they could). Rather, the emphasis is simply on being visible,
establishing eye contact, and using other non-verbal communication techniques
(i.e., the “slow down” hand signal) with the approaching driver to improve
compliance, since the officer generally does not engage in pursuit if a violation

33
occurs. Speed reductions when police traffic controllers are used typically range
from 3 to 14 mph (3).
Whereas the use of automated speed enforcement is fairly common in Europe, and is
being used sparingly in a few local jurisdictions across the U.S., its application to work zones has
just begun (4,5). Currently, the Washington State Department of Transportation (WSDOT) is
conducting a pilot project utilizing automated speed enforcement cameras mounted in a small
sport utility vehicle parked next to the highway to cite drivers driving too fast through
construction work zones. Automated enforcement programs are also operational in Illinois and
in Maryland (5). This technology is used to electronically identify violators and to capture an
image of the vehicle imbedded with speed/location/date/time information about the violation.
The registered owner of the vehicle is determined via the license plate number, and a citation is
issued and mailed to the owner of the vehicle. In a recent study of this system in Illinois, speed
data were collected at the speed-radar photo enforcement (SPE) device and a location 1.5 miles
downstream in the work zone. The results showed that SPE is effective in reducing the average
speed and increasing compliance with the work zone speed limit. The reduction in the mean
speed varied from 3 to 6 mph near the SPE; however, the speed reduction at the downstream
location was not significant (1 to 3 mph) (6). These systems can be fairly expensive to initiate
and operate. Of course, the potential does exist to issue a larger number of citations than can
normally be accomplished by a uniformed officer located at the site, and thus offset the costs of
operation.
Drone radar can be used to imply the presence of enforcement in the work zone area.
Drone radar devices emit radio signals that activate radar detectors used by the traveling public.
These devices are commercially available and are typically mounted on work vehicles, arrow
panels, or portable changeable message signs (PCMSs). Although actual speed reductions may
be small, this device may effectively alert drivers to an upcoming change in the highway
environment when their radar detector is activated (7,8).
Advance Warning Area
The advance warning area is an area where drivers are often surprised by traffic queues
or other hazards. These types of events may be a result of a driver being inattentive, failing to
recognize their closing speed, or having inadequate sight distance for the perception of and

34
reaction to the surprising queue or hazard. Several advance warning area enhancements may
have increased “attention getting” ability, which may reduce the opportunity for inattentive
drivers to commit intrusions:
• ensure adequate sight distance to lane closure taper;
• use dual advanced signing;
• use overhead changeable message sign (CMS) to warn drivers of upcoming or
current work zone conditions;
• use temporary transverse rumble strips;
• use an early merge system;
• consider working at night or on weekends;
• use an upstream queue end warning (real time information or general warning);
• use dynamic speed display (DSD) trailers; and
• provide advance notification of work activity, alternate routes, closure location
and duration.
As part of the initial patrol through the work zone, sight distance should be checked using
speeds at which vehicles normally travel on that roadway. Early detection of sight distance
issues may prevent intrusions, particularly where traffic control devices may simply be extended
beyond upstream horizontal or vertical curvature.
According to the Caltrans Standard Plans for Construction of Local Streets and Roads
(9), dual advance warning signing (i.e., warning signs on both sides of the roadway) are required
for lane closures on freeways and expressways when less than half of the available lanes remain
open to traffic (i.e., going from three lanes to one lane open). However, dual advance warning
signing is not required when at least half of the travel lanes remain open (i.e., going from three
lanes to two lanes open). Assuming a right lane is closed, dual signing provides a better
opportunity for drivers in the left lane to see advance warning signs that might otherwise be
blocked from their view by traffic in the right lane, particularly on a roadway with higher
volumes of truck traffic. In addition, dual signing notifies drivers in the open travel lanes of the
right lane closure in hopes that they will remain in the open travel lanes and not enter the right
lane upstream of the lane closure. Overhead changeable message signs, which are more likely to
be visible from all traffic lanes, can also be used to warn drivers of the upcoming work zone
conditions.

35
Temporary transverse rumble strips may also be used to alert drivers that they are
approaching a work zone by generating audible and tactile warnings. Temporary transverse
rumble strips are typically used in long-term maintenance work zones. Conventional rumble
strips adhere to the pavement surface and are often placed in an array of several strips placed
perpendicular to traffic at 18 inch intervals. More recently, portable plastic rumble strips have
been developed. These devices are weighted, may be used without an adhesive, and are suitable
for shorter duration work (Figure 5). Previous research (10,11,12) has shown that temporary
transverse rumble strips in work zones typically result in a 2 to 5 mph speed reduction. Even
when only very small speed reductions are achieved, temporary transverse rumble strips may
effectively alert drivers to an upcoming change in the highway environment, and thus achieve a
safety benefit.
Figure 5. Portable Plastic Rumble Strips.
The early merge system (also known as a dynamic no passing zone) encourages drivers to
exit the closed lane as soon as possible and thus is intended to reduce the number of forced
merges near the beginning of the lane closure. The early merge system uses intelligent
transportation systems (ITS) sensors to monitor traffic in the open lane on the approach to the
work area. As shown in Figure 6, advance warning signs are used to display no passing
messages (e.g., “NO PASSING WHEN FLASHING” or “LEFT LANE DO NOT PASS WHEN
FLASHING”). These types of messages are intended to discourage “queue-jumpers” from
merging into the open lane at the beginning of the lane closure and causing additional delay to
those who merged early. Thus, the early merge system aims to reduce aggressive driving and

36
unsafe merge maneuvers. A study in Michigan (13) found that the average peak period travel
time delay decreased by over 30 percent, the average number of stops and duration of stops were
decreased, and the number of aggressive driving maneuvers (late merges) during peak hours was
significantly reduced. Early merge systems may be used for lane closures on high speed
facilities under low volume conditions. For a two-to-one lane closure, volumes should be
between 2,000 and 3,000 vehicles per hour; for a three-to-two lane closure, volumes should be
between 3,000 and 3,800 vehicles per hour (14).
Figure 6. Example of Early Merge Advance Warning Sign.
Drivers often misjudge their closing speed when approaching a queue or other hazard.
Several available countermeasures may help with this problem. When possible, the schedule of
work should be reviewed to determine if the work can be performed during night and/or
weekend periods when traffic volumes may be lower. When backups are expected, an upstream
queue end warning system can monitor the speed of vehicles within and upstream of a work
zone. When reduced speeds are detected, an upstream PCMS or other warning system (such as
static signs with flashers) are activated to warn drivers of the slower-moving traffic ahead.
Warnings messages may include “BE PREPARED TO STOP,” “SLOW TRAFFIC AHEAD,” or
may give the actual speed of the slower-moving traffic (e.g., “30 MPH TRAFFIC AHEAD”). A
study in Texas (15) found that a queue end warning system reduced the number of vehicle
conflicts, such as sudden breaking and forced lane changes to avoid rear-end crashes, by 2 to
7 percent. Speed variance was also significantly reduced, which may reduce the potential for
rear-end crashes and result in safer traffic operations.

37
Dynamic speed display (DSD) trailers showing the speed of approaching vehicles (i.e.,
“YOUR SPEED” signs) paired with a regulatory or advisory speed limit sign allows drivers to
see their own speed and compare it to the recommended vehicle speed for the work zone (Figure
7). DSD trailers have been shown to reduce speeds by 2 to 10 mph and decrease the percent of
vehicles exceeding the speed limit (16,17,18). Even when only very small speed reductions are
achieved, DSD trailers may effectively alert drivers to an upcoming change in the highway
environment, and thus achieve a safety benefit. DSD trailers are more effective at locations
where the sign supports a clear and real need for a driver to reduce their speed or where the
perception of regular enforcement exists. The effect of DSD trailers over time (especially if left
at a location continuously and not enforced) is uncertain but believed to diminish as drivers
become more accustomed to their presence in the work zone.
Figure 7. DSD Trailer.
Another innovative use of DSD trailers was evaluated on Interstate 80 near Lincoln,
Nebraska (19). The system deployed consisted of three DSD trailers placed at approximately
one-quarter mile intervals in advance of the work zone. Each trailer was equipped with a light-
emitting diode (LED) speed display, a radar unit that measured the speed of the downstream
traffic, two flashing strobes to warn drivers of stopped or slow-moving traffic, a ”SPEED OF
TRAFFIC AHEAD” sign mounted over the speed display, and a “USE EXTREME CAUTION
WHEN FLASHING” sign mounted beneath the speed display. When slow or stopped traffic
was detected, the speed of the downstream traffic was displayed and the strobe lights were
38
activated. When no slowdown was present, the strobe lights were off and either the speed of the
downstream traffic or the work zone speed limit, which ever was lower, was displayed. The
results of the evaluation indicated that the speed messages were effective at reducing the speed
of vehicles approaching queued traffic. In addition, drivers began decelerating sooner and
reduced their speed over a longer distance.
Unfortunately, some drivers deliberately choose to enter the closed lane in order to
bypass congestion or reach an exit, intersection, or driveway. Providing advance notification of
lane closures via PCMS, highway advisory radio (HAR), or other media will allow drivers to
make more informed decisions (e.g., take an alternate route, avoid roadway during lane closure
times, etc.) and thus potentially reduce work zone intrusions. If no alternate routes are available,
information regarding the lane closure duration and location can still be provided.
Transition Area
The transition area is where lane closures begin. As shown in Table 12, 8 percent of
intrusion incidents into the taper occur because the driver fails to recognize the lane closure.
While several of the potential countermeasures discussed in the previous section are also used to
alert drivers about an upcoming lane closure, there are three additional countermeasures that may
be used in the lane closure taper itself:
• use larger channelizing devices,
• use closer-space or continual traffic control devices, and
• use a sequential warning light system.
National Cooperative Highway Research Program (NCHRP) Report 476 (20) contains
guidelines for identifying the special problems associated with night work that require safety
enhancements above and beyond the minimum requirements specified in the Manual on Uniform
Traffic Control Devices (MUTCD) (21). During lane closures, positive guidance at decision points
becomes more critical for drivers at night. Therefore, channelizing devices that are larger and more
visible than those required for daytime applications are desirable. In addition, channelizing devices
should be closely spaced to more clearly define closed lanes at night. Table 16 shows the
channelizing device spacing in tapers recommended for use by NYSDOT to discourage work zone
intrusions in lane and shoulder closures. With larger channelizing devices, such as drums, the
close device spacing appears to create a more continuous array of retroreflective devices and thus

39
reduces the risk of drivers entering the closed lane (deliberately and non- deliberately). To date,
no evaluations of these channelizing device enhancements have been conducted.
Table 16. Channelizing Device Spacing in Tapers (20).
Estimated Operating Speed
(mph) Maximum Spacing
(ft) 20 20 30 30
40+ 40
In some situations, it may be desired to provide continuous delineation of the taper (i.e.,
no spacing between devices). This can be accomplished with longitudinal channelizing devices
(LCDs). LCDs are lightweight, deformable channelizing devices that can be connected together
to form a solid line of traffic control devices. LCDs look similar to water-filled barrier, but they
are not positive protection devices. LCDs may be used instead of a line of cones, drums, or
barricades. However, currently no guidance is provided regarding the work zone configurations
and conditions where LCDs should be considered in lieu of these other devices (21). Ongoing
research at the Texas Transportation Institute (TTI) is being conducted to determine whether
LCDs used in a continuous line application in work zones improve safety and operations relative
to the use of other types of channelizing devices.
At night, a sequential warning light system can also be attached to the drums that form
the lane closure taper. This warning light system is composed of a series of synchronized
individual flashing warning lights that produce the perception of light that “moves” repeatedly in
a sequential manner from the beginning of the taper to the end of the taper (Figure 8). TTI
research (22) showed that this system significantly reduced the percent of both passenger
vehicles and trucks in the closed lane 1000 ft upstream of the lane closure.
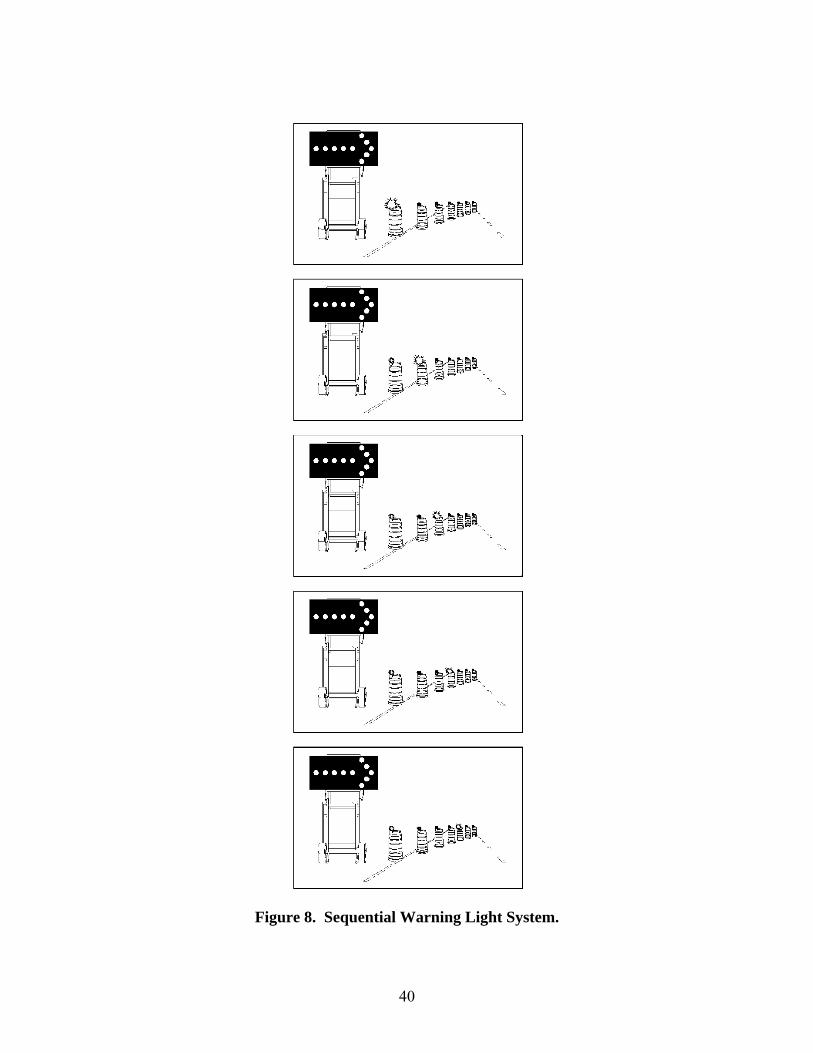
40
Figure 8. Sequential Warning Light System.
~'",ll'm~~', ;,_
/::':

41
Activity Area
The activity area is where work takes place; thus, workers and equipment are located in this
area. Obviously, positive protection can be used to reduce work zone intrusions into the activity
area. However, traditional positive protection devices (e.g., concrete barrier) are not feasible
with shorter term operations. Recently, steel barrier segments that can be quickly unloaded at a
worksite and linked together to provide longitudinal crash protection have been developed to
protect workers from work space intrusions during work activities that last only a short time at
any one location (Figure 9). Some steel barrier designs include retractable wheels that can be
lowered so that the steel sections can be moved by hand laterally across travel lanes as needed to
create protected work spaces. Other designs include wheels and vehicle attachments that allow
the barrier to be moved along with the work activity as it progresses down the roadway. To date,
steel barrier has not been extensively deployed. Consequently, its effectiveness and practicality
have not been verified. However, steel barrier is expected to reduce vehicle intrusions into the
work area.
Figure 9. Example of Steel Barrier.
Other intrusion countermeasures that can be used in the activity area are:
• use closer-spaced or continual traffic control devices,
• use transverse traffic control devices,
• limit the length of lane closures to avoid blocking ramps or driveways,
• implement lane change restrictions, and
• use a downstream spotter.
42
Closer or continual spacing of traffic control devices can also be used throughout the lane
closure to improve delineation of the proper travel path and prohibit drivers from entering the closed
lane. When travel lanes are closed for long distances it may appear that no work activity is
taking place. Thus, impaired or careless drivers who enter the closed lane may travel some
distance before encountering the work operation or some other hazard. Channelizing devices
placed transversely across the closed lanes can be used to warn errant drivers who may have
moved into the closed travel lane without realizing it was still an active closure. NCHRP
Report 476 (20) recommends that transverse traffic control devices be located approximately
every 750 ft so that an obstacle is presented to a driver about every 10 seconds for vehicles
traveling 45 to 50 mph. While Caltrans currently requires transverse traffic control devices in
lane closures on freeways and expressways (9), these devices are spaced more than twice the
distance (2000 ft) recommended in the NCHRP report. However, to date the use of transverse
traffic control devices has not been evaluated so it is uncertain how the device spacing impacts
the probability of an intrusion crash.
Transverse traffic control devices also prohibit drivers who deliberately enter the closed
lane to bypass congestion or access exits, driveways, etc. from progressing down the roadway
inside the closed lane. In addition, when feasible, limiting the length of the lane closure may
reduce delay and decrease the number of access points blocked; thereby, hopefully reducing the
need for drivers to deliberately enter the lane closure.
Researchers attributed a small portion of the lane closure intrusion events (5 percent) to
vehicle conflicts that occur when vehicles change lanes adjacent to the closed lane. Lane
changing restrictions (i.e., not allowing vehicles to change lanes while traveling through the
work zone) may reduce vehicle conflicts and thus potentially decrease the chance of an intrusion.
Occasionally, drivers enter the roadway going in the wrong direction and enter the closed
lane from the downstream end (2 percent of lane closure intrusion events). While closer or
continual spacing of traffic control devices and transverse traffic control devices can also be used
to deter the occurrence of these types of events, detection of this type of event by a downstream
spotter may enhance worker safety. Although the intrusion may not be prevented, the spotter
may be able to provide a warning to other workers or possibly stop the intruding vehicle before
any injuries occur.

43
Typically, work area access points are short openings with little or no area for trucks to
decelerate or accelerate. Thus, drivers sometimes fail to recognize the slow speed of work
vehicles trying to enter or exit the work area. In addition, drivers occasionally follow the trucks into
the work area. Potential countermeasures for these types of intrusions include:
• reconfigure access point;
• alter internal traffic control plan procedures to prevent truck slow-down in active
travel lane;
• use construction entrance signing (static or dynamic);
• use “DO NOT FOLLOW” signs (static or dynamic);
• ensure that work vehicle warning lights are used when appropriate (e.g., turn
signals, hazard lights, beacons, etc.); and
• use enhanced vehicle warning light system.
In some cases, the work area access points are located such that they appear to be a
continuation of the expected travel path. Reconfiguring the access point to make it more
apparent that the construction entrance is not the intended travel path may reduce the chance that
drivers will inadvertently follow the work trucks into the work area. In addition, altering the
layout of the access point, as well as internal traffic control plan procedures (i.e., the
coordination of the flow of construction vehicles, equipment, and workers), can allow work
trucks to enter and exit the work area at higher speeds; thus, alleviating the need for them to
decelerate and accelerate in an active travel lane.
Static or dynamic construction entrance signing located near or immediately upstream of
the access point may also be used to notify drivers about trucks entering and exiting the roadway.
Example messages include:
• “CONSTRUCTION ENTRANCE,”
• “WORK ZONE VEHICLES ONLY,”
• “TRUCKS ENTERING ROADWAY/REDUCE SPEED,”
• “TRUCKS ENTERING 1000 FT/BE PREPARED TO STOP,” and
• “TRUCKS EXITING 2000 FT/DO NOT FOLLOW TRUCKS.”
Static or dynamic “DO NOT FOLLOW” signing can also be located near access points or
on the back of work vehicles to tell drivers not to follow work vehicles into the work area. In
44
addition to the fifth example message above, the following messages may be used “DO NOT
FOLLOW INTO WORK AREA” and “CONSTRUCTION VEHICLE DO NOT FOLLOW.”
Typically, the messages discussed above are displayed to drivers whether or not a truck is
actually entering or exiting the work area. Work zone ITS may be used to activate messages on
a PCMS only when trucks are detected; thus, hopefully improving the driver’s trust of the
message. Static signs with flashing beacons may also be used to display more real-time
messages. When a truck is detected, the beacons would flash; otherwise the beacons would
remain off.
There are several types of construction vehicle enhancements that can be utilized to deter
intrusion crashes. Specific operational procedures, such as requiring the use of turn signals,
hazard lights, and beacons by construction vehicle drivers, may provide additional information
for drivers to anticipate the upcoming maneuvers of the work vehicle. Traditionally, amber
warning lights have been used on work vehicles and equipment to alert drivers to potentially
hazardous conditions. However, currently there are various types (e.g., light bars, arrow sticks,
strobes, beacons, LEDs, etc.) and colors (e.g., blue and white) of warning lights available.
Recently as part of NCHRP Project 13-02 (23), researchers developed guidelines for the
selection and application of warning lights on roadway operations equipment. Recommended
lighting requirements included:
• no specific type of light over another;
• the use of amber or white lighting on maintenance vehicles;
• lights should flash, with a pattern that alternates from one side of the vehicle to
the other being preferable to a pattern in which lights on both sides of the vehicle
flash at the same time; and
• positioning the lighting such that it appears against a portion of the vehicle and
not against the sky (however, this limits the ability of the light to be seen from all
directions; thus, it may be necessary to replicate lights in multiple directions).
POTENTIAL COUNTERMEASURES FOR INTRUSIONS INTO FLAGGING OPERATIONS
Flagging operations mainly occur on two-lane, two-way roadways where one lane of
travel must be closed to conduct the work. Table 13 shows that intrusions into one-way flagging
45
operations can occur in several areas, including in the advance warning area (21 percent), at the
flagging position (70 percent), and in the work area (9 percent). In the sections that follow,
researchers will discuss the potential countermeasures that can be applied in the advance warning
area, at the flagger station, and in the activity area, respectively.
Advance Warning Area
The intrusion incidents in the advance warning area were all attributed to the approaching
driver failing to recognize stopped or slowed traffic. The following countermeasures should be
considered to deter these types of intrusions:
• use temporary transverse rumble strips,
• use advance warning messages on PCMSs,
• use DSD trailers, and
• provide enforcement (real).
As mentioned in the lane closure discussion, temporary transverse rumble strips may be
used to alert drivers that they are approaching a work zone by generating audible and tactile
warnings. Recently in Florida (24) researchers found over an 8 mph reduction in speeds 600 ft
upstream of the flagger when four sets of temporary transverse rumble strips were applied
between 500 and 1500 ft upstream of the flagger.
PCMS messages may also be used to warn drivers of an upcoming work zone and slow or
stopped traffic. As discussed in the lane closure section, there are several ways that DSD trailers
can be used to inform drivers of the need to slow down and allow them to compare their speed to
anticipated speeds of vehicles in front of them. Previous research (16,17,18,25,26) has shown
that speed-related PCMS messages and DSD trailers provide reasonable speed reductions in the
short-term (0 to 10 mph); however, their effect over time is uncertain. Enforcement in
conjunction with these devices or by itself may also reduce the occurrence of intrusions at
flagging operations.
Flagger Station
In addition to enforcement (real or drone radar) and temporary rumble strips, the
following methods may be employed to reduce work zone intrusions at the flagger station:

46
• use closer-spaced or continual traffic control devices,
• use transverse traffic control devices/LCDs,
• provide advance notice of work activity,
• limit length of lane closures to avoid blocking driveways,
• replace flagger with police officer, and
• use automated flagger assistance devices.
Flaggers are often susceptible to strikes from both directions of traffic. As mentioned
previously, closer spacing of traffic control devices, transverse traffic control devices and LCDs
may be used to improve delineation of the lane closure and prohibit drivers from entering the
closed lane. These devices can also be used to block off access to the shoulder in order to
discourage drivers from going around the closed lane on the shoulder.
In some cases, drivers ignore the flagger’s instruction to stop and try to proceed into the
open lane. Most likely these drivers are trying to avoid delay. Providing advance notice of the
lane closure on PCMSs allows drivers to avoid the work zone if desired. In addition, limiting the
length of the lane closure may reduce delays and thus decrease the potential for drivers to get
impatient and try to go around the flagger. To further improve compliance with flagger
instructions, uniformed officers may be located at the flagging station or used to direct traffic
(i.e., be the flagger) in lieu of workers.
In lieu of a flagger, several devices can be used to control the right-of-way when a lane
closure is needed on a two-lane, two-way road. Automated flagger assistance devices (AFADs)
are portable traffic control systems designed to be operated by a flagger located off the roadway
(27). One type uses a STOP/SLOW sign to control the right-of-way (Figure 10a), while the
other type utilizes red and yellow lenses (Figure 10b). AFADs must be operated by a qualified
flagger and the flagger operating the AFAD cannot leave the AFAD unattended at any time
while the AFAD is controlling the right-of-way. However, AFADs can be remotely operated
either by a single flagger, at one end of the lane closure or at a central location, or by two
flaggers, one near each device’s location. AFADs should not be used for long-term stationary
work. Typical applications include bridge maintenance, haul road crossings, and pavement
patching. There are concerns that AFADs may confuse drivers or garner less respect and thus
result in decreased compliance.

47
a) STOP/SLOW AFAD b) Red/Yellow Lens AFAD
Figure 10. Examples of AFADs.
Portable traffic signals are traffic signals mounted on trailers that can be used to control
the right-of-way in a work zone (Figure 11). Communications between the signals are provided
by hard wiring, radio frequency transceiver, or by preset timing. Thus, portable traffic signals
can actually replace flaggers; thereby, removing flaggers from direct exposure to approaching
traffic and allowing flaggers to perform other critical work tasks. Appropriate timing is critical
to the success of portable traffic signals. Excessive wait time can lead to driver confusion and
frustration, possibly resulting in decreased compliance. Portable traffic signals are appropriate
for use in longer term work zones, as well as some short-term operations. Examples of typical
applications include: long-term bridge construction, short-term pavement repair, and short-term
bridge maintenance.
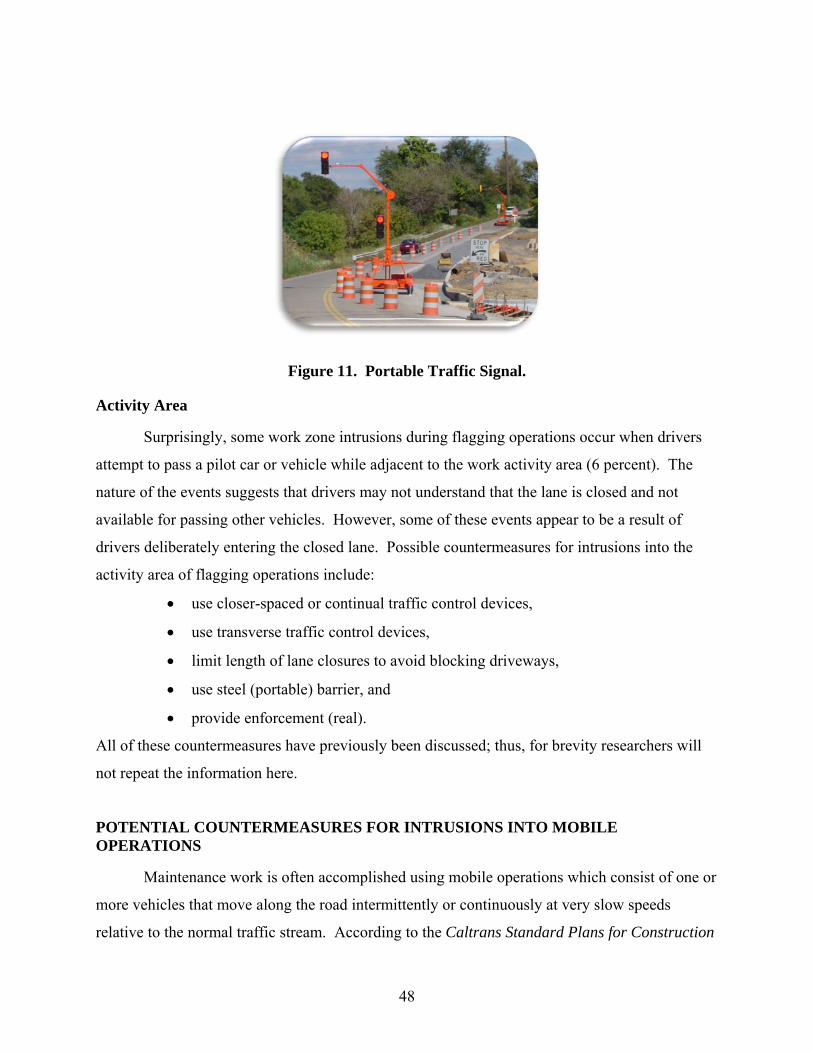
48
Figure 11. Portable Traffic Signal.
Activity Area
Surprisingly, some work zone intrusions during flagging operations occur when drivers
attempt to pass a pilot car or vehicle while adjacent to the work activity area (6 percent). The
nature of the events suggests that drivers may not understand that the lane is closed and not
available for passing other vehicles. However, some of these events appear to be a result of
drivers deliberately entering the closed lane. Possible countermeasures for intrusions into the
activity area of flagging operations include:
• use closer-spaced or continual traffic control devices,
• use transverse traffic control devices,
• limit length of lane closures to avoid blocking driveways,
• use steel (portable) barrier, and
• provide enforcement (real).
All of these countermeasures have previously been discussed; thus, for brevity researchers will
not repeat the information here.
POTENTIAL COUNTERMEASURES FOR INTRUSIONS INTO MOBILE OPERATIONS
Maintenance work is often accomplished using mobile operations which consist of one or
more vehicles that move along the road intermittently or continuously at very slow speeds
relative to the normal traffic stream. According to the Caltrans Standard Plans for Construction
49
of Local Streets and Roads (9), for mobile operations Caltrans currently requires both a shadow
vehicle with a truck-mounted attenuator (TMA) in the blocked lane immediately upstream of the
work vehicles and an advance warning vehicle on the shoulder upstream of the work convoy.
Where sufficient shoulder is not available, the advance warning vehicle may encroach into the
traffic lane staying as close to the edge of the shoulder as practical. On two-lane highways the
advance warning vehicle has a truck-mounted “SLOW TRAFFIC AHEAD” sign (static or
dynamic signs can be used). On multilane highways, the advance warning vehicle is required to
have a truck-mounted CMS displaying “ROAD WORK AHEAD” and “LANE CLOSED
AHEAD” when the outside or median lane is closed and “ROAD WORK AHEAD” and
“INTERIOR/CENTER LANE CLOSED” when the interior lane is closed.
Even though Caltrans is currently using an advance warning vehicle and, in some
instances, truck-mounted CMSs (both of which are considered intrusion countermeasures), the
extent to which these countermeasures are actually present at intrusion crash locations is
unknown. According to Table 8, 20 percent of the work zone intrusions in California occur in
mobile operations (second only to lane closures, 30 percent). Furthermore, these intrusion events
occur equally on both freeways and state highways (21 percent and 19 percent, respectively).
Caltrans and highway contractor personnel stated that these mobile operation intrusions typically
involve vehicles which strike the TMA on the back of the shadow vehicle (i.e., the first work
vehicle encountered by drivers). This was also the primary reason for mobile operation
intrusions in New York (63 percent). In addition, according to the NYSDOT database another
25 percent of mobile operation intrusions may be attributed to drivers pulling between the work
vehicles (i.e., entering the work convoy).
Researchers identified the following potential countermeasures that may be used to
reduce intrusions into mobile operations (Table 14):
• use effective messages on truck-mounted CMSs to indicate slow-moving vehicles
or to discourage vehicles from entering the work convoy,
• use truck-mounted DSD showing truck speed,
• adjust spacing between advance warning vehicle and work convoy as needed to
maintain adequate sight distance to work convoy,
• maintain close spacing between work vehicles in convoy,
• provide a work vehicle in front of workers on foot,

50
• use truck-mounted positive protection (intermittent operations only), and
• provide enforcement (real or drone radar).
TTI researchers believe that truck-mounted CMSs have superior target value and thus
possibly provide more advance warning time to drivers than static signing. However, the amount
and order of information presented, the legibility distance of the message, and the content of the
message all impact the effectiveness of these devices. Research has shown the drivers require
2 seconds of reading time for each unit of information on a CMS (28). This implies that drivers
need 2 seconds of reading time (once the message is legible) to adequately read and process the
single-unit message (e.g., “SLOW TRAFFIC AHEAD”) currently used with mobile operations
on two-lane highways. For the two-unit message currently used on multi-lane highways (e.g.,
“ROAD WORK AHEAD” and “LANE CLOSED AHEAD”), drivers need 4 seconds of reading
time.
Given that agencies have only limited control over vehicle speeds operating on a
roadway, it is the design of the truck-mounted CMS message that must be adjusted so as to
provide adequate legibility distances. Unfortunately, this is not easily accomplished on truck-
mounted CMSs because the number of characters available per line is dependent upon the
character height and the character height is dependent upon the number of message lines used.
On a typical truck-mounted CMS, the height of the letters in two-line and three-line messages is
only 10 inches and 6 inches, respectively. A recent TTI study (29) found that the 85th percentile
legibility distance for 9-inch and 10.6-inch letter heights on an LED CMS were 228 ft and 324 ft,
respectively. While researchers did not evaluate a 6-inch letter height, it can be assumed that this
letter height would provide less than 200 ft of legibility distance. These limitations imply that
new shorter messages (possibly using abbreviations) and multiple-phase messages should be
developed for truck-mounted CMSs to ensure that the drivers have adequate time to read and
react to the messages presented.
As shown in Table 14, the messages on the truck-mounted CMSs should be used to warn
drivers that they are approaching a slow moving work convoy (driver misjudgment of the work
vehicle’s slower speed appeared to be responsible for over 60 percent of the mobile operation
intrusions) or to discourage drivers from entering between the work vehicles (25 percent of the
mobile operation intrusions were of this type). Researchers believe that drivers may not
understand that the message “SLOW TRAFFIC AHEAD” is referring to a mobile work convoy,

51
since this message can also be used to warn drivers about congestion. Also, the two-phase
message used for moving lane closures in the outside or median lanes (“ROAD WORK
AHEAD” and “LANE CLOSED AHEAD”) does not tell the driver which lane is closed; thus,
the driver must wait until they can see the work convoy to make a driving decision. Use of the
words “RIGHT” and “LEFT” may encourage drivers to move out of the closed lane further
upstream of the work convoy.
Recently, TTI researchers conducted laboratory and field studies of candidate messages
and deployment configurations of truck-mounted CMSs used in support of various mobile
operations for the Wyoming Department of Transportation (30). Based on the evaluations,
researchers identified the following key points that should be kept in mind when designing and
displaying messages on truck-mounted CMS.
• The character heights typically used on truck-mounted CMS only provide enough
sight distance to allow 2 units-of-information (or phrases) to be displayed in a
message.
• For most applications, the two critical units that should be displayed on a truck-
mounted CMS are: 1) a problem/roadwork descriptor and 2) an action statement.
• A message cannot contain more than 2 phases.
• Message elements should not flash or scroll.
• Abbreviations should be used when necessary to keep the message to two phases,
and should be used in accordance with accepted practices.
Finally, the selection of message elements should be based on the identification of
specific concerns for the type of operation and road. These concerns include (but are not limited
to):
• communication of the convoy situation,
• communication of passing or action information,
• avoidance of paint tracking during striping, and
• speed differential.
Based on the findings of the Wyoming research and message design principles,
researchers created the sampling of recommended messages for use on truck-mounted CMS
during mobile operations in Table 17. These messages are defined by the type of work, road
type, and identified concerns being addressed by the message.
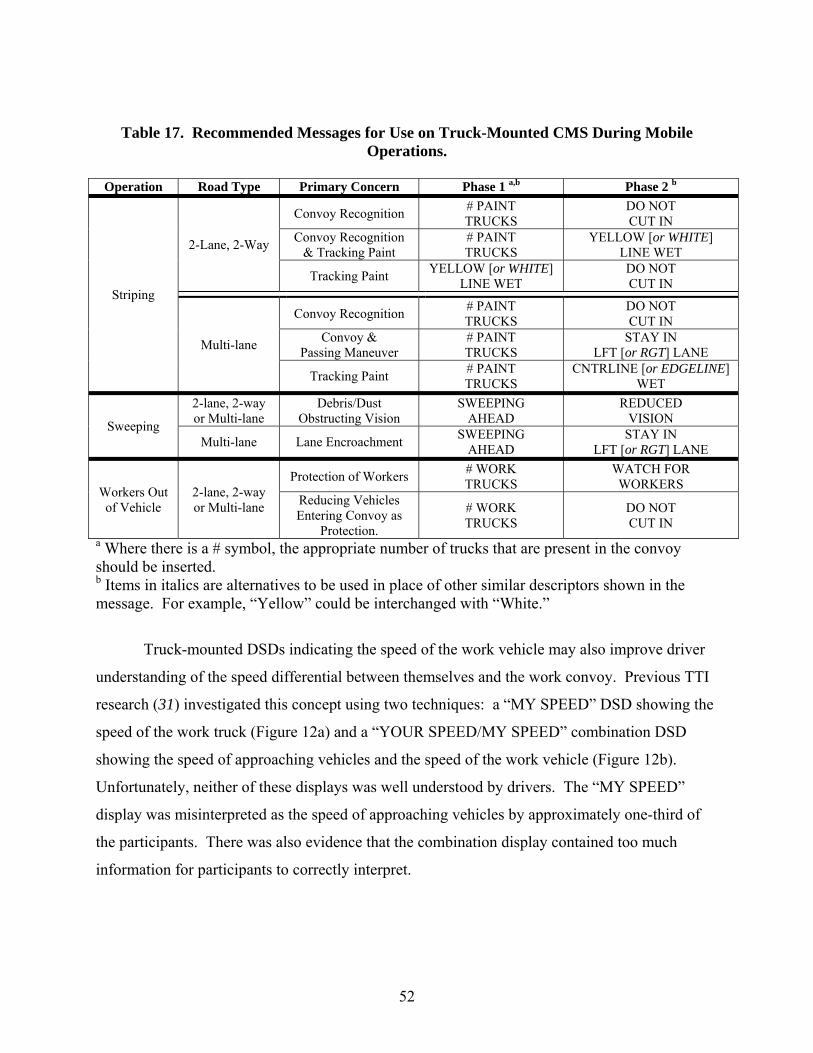
52
Table 17. Recommended Messages for Use on Truck-Mounted CMS During Mobile Operations.
Operation Road Type Primary Concern Phase 1 a,b Phase 2 b
Striping
2-Lane, 2-Way
Convoy Recognition # PAINT TRUCKS
DO NOT CUT IN
Convoy Recognition & Tracking Paint
# PAINT TRUCKS
YELLOW [or WHITE] LINE WET
Tracking Paint YELLOW [or WHITE] LINE WET
DO NOT CUT IN
Multi-lane
Convoy Recognition # PAINT TRUCKS
DO NOT CUT IN
Convoy & Passing Maneuver
# PAINT TRUCKS
STAY IN LFT [or RGT] LANE
Tracking Paint # PAINT TRUCKS
CNTRLINE [or EDGELINE] WET
Sweeping
2-lane, 2-way or Multi-lane
Debris/Dust Obstructing Vision
SWEEPING AHEAD
REDUCED VISION
Multi-lane Lane Encroachment SWEEPING AHEAD
STAY IN LFT [or RGT] LANE
Workers Out of Vehicle
2-lane, 2-way or Multi-lane
Protection of Workers # WORK TRUCKS
WATCH FOR WORKERS
Reducing Vehicles Entering Convoy as
Protection.
# WORK TRUCKS
DO NOT CUT IN
a Where there is a # symbol, the appropriate number of trucks that are present in the convoy should be inserted. b Items in italics are alternatives to be used in place of other similar descriptors shown in the message. For example, “Yellow” could be interchanged with “White.”
Truck-mounted DSDs indicating the speed of the work vehicle may also improve driver
understanding of the speed differential between themselves and the work convoy. Previous TTI
research (31) investigated this concept using two techniques: a “MY SPEED” DSD showing the
speed of the work truck (Figure 12a) and a “YOUR SPEED/MY SPEED” combination DSD
showing the speed of approaching vehicles and the speed of the work vehicle (Figure 12b).
Unfortunately, neither of these displays was well understood by drivers. The “MY SPEED”
display was misinterpreted as the speed of approaching vehicles by approximately one-third of
the participants. There was also evidence that the combination display contained too much
information for participants to correctly interpret.
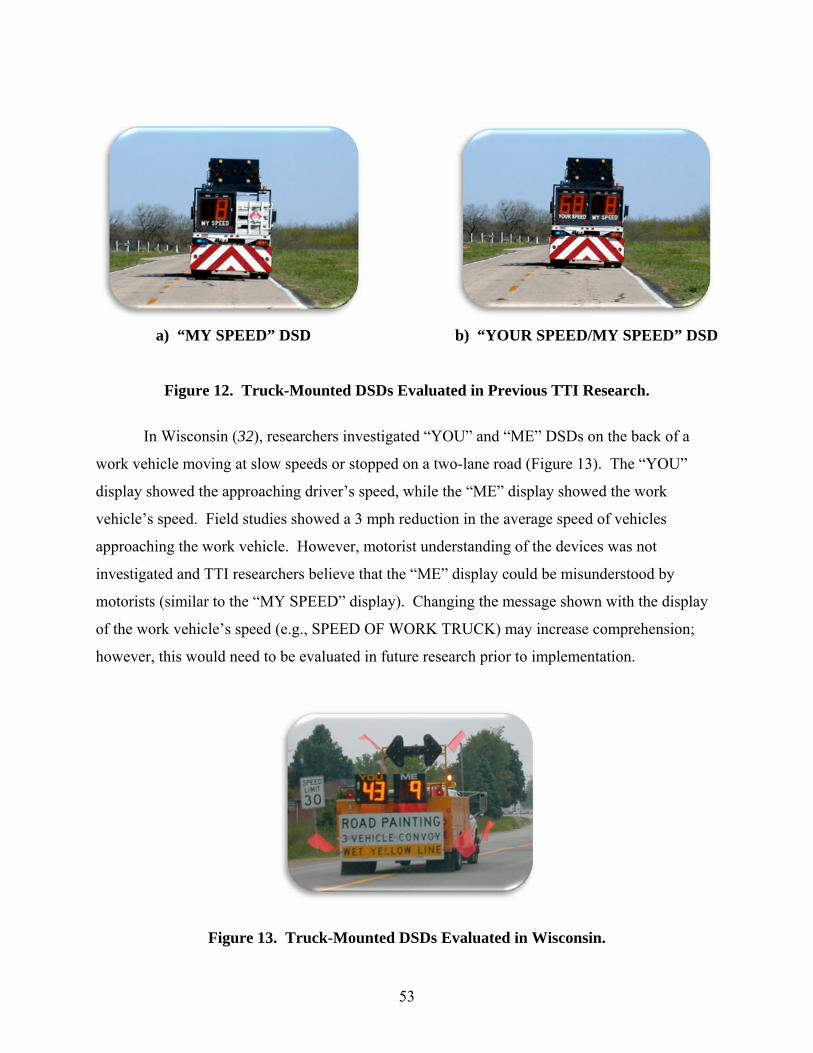
53
a) “MY SPEED” DSD b) “YOUR SPEED/MY SPEED” DSD
Figure 12. Truck-Mounted DSDs Evaluated in Previous TTI Research.
In Wisconsin (32), researchers investigated “YOU” and “ME” DSDs on the back of a
work vehicle moving at slow speeds or stopped on a two-lane road (Figure 13). The “YOU”
display showed the approaching driver’s speed, while the “ME” display showed the work
vehicle’s speed. Field studies showed a 3 mph reduction in the average speed of vehicles
approaching the work vehicle. However, motorist understanding of the devices was not
investigated and TTI researchers believe that the “ME” display could be misunderstood by
motorists (similar to the “MY SPEED” display). Changing the message shown with the display
of the work vehicle’s speed (e.g., SPEED OF WORK TRUCK) may increase comprehension;
however, this would need to be evaluated in future research prior to implementation.
Figure 13. Truck-Mounted DSDs Evaluated in Wisconsin.
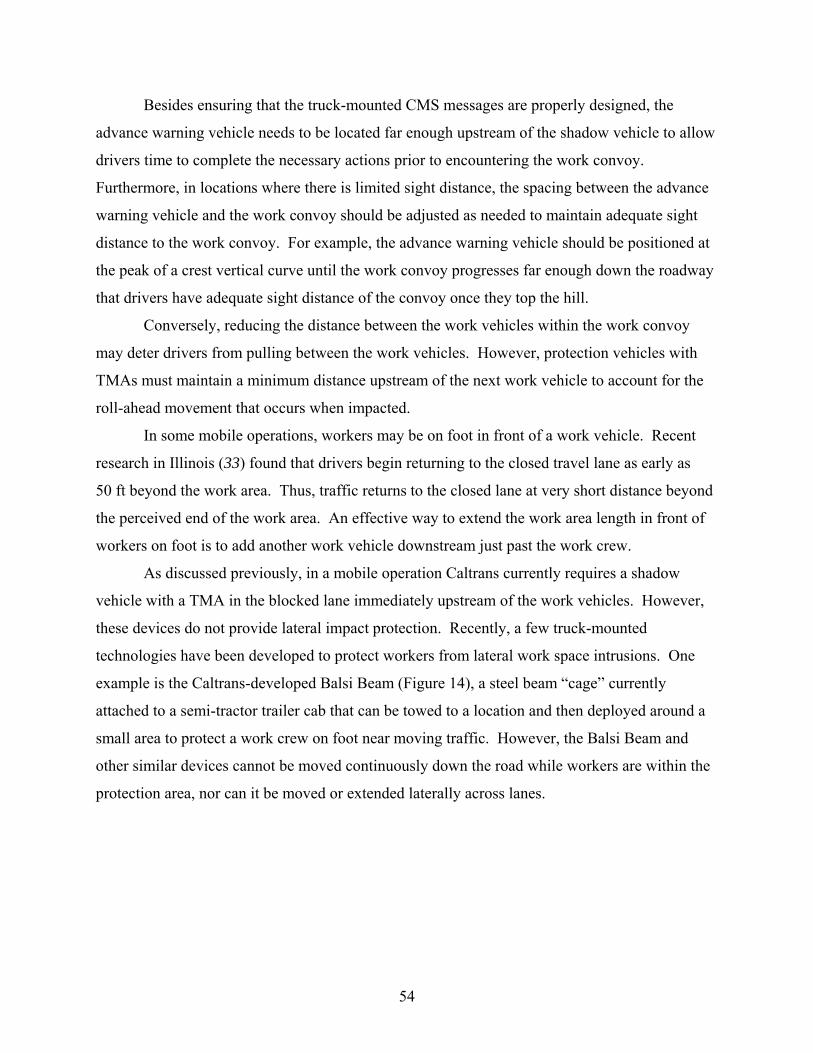
54
Besides ensuring that the truck-mounted CMS messages are properly designed, the
advance warning vehicle needs to be located far enough upstream of the shadow vehicle to allow
drivers time to complete the necessary actions prior to encountering the work convoy.
Furthermore, in locations where there is limited sight distance, the spacing between the advance
warning vehicle and the work convoy should be adjusted as needed to maintain adequate sight
distance to the work convoy. For example, the advance warning vehicle should be positioned at
the peak of a crest vertical curve until the work convoy progresses far enough down the roadway
that drivers have adequate sight distance of the convoy once they top the hill.
Conversely, reducing the distance between the work vehicles within the work convoy
may deter drivers from pulling between the work vehicles. However, protection vehicles with
TMAs must maintain a minimum distance upstream of the next work vehicle to account for the
roll-ahead movement that occurs when impacted.
In some mobile operations, workers may be on foot in front of a work vehicle. Recent
research in Illinois (33) found that drivers begin returning to the closed travel lane as early as
50 ft beyond the work area. Thus, traffic returns to the closed lane at very short distance beyond
the perceived end of the work area. An effective way to extend the work area length in front of
workers on foot is to add another work vehicle downstream just past the work crew.
As discussed previously, in a mobile operation Caltrans currently requires a shadow
vehicle with a TMA in the blocked lane immediately upstream of the work vehicles. However,
these devices do not provide lateral impact protection. Recently, a few truck-mounted
technologies have been developed to protect workers from lateral work space intrusions. One
example is the Caltrans-developed Balsi Beam (Figure 14), a steel beam “cage” currently
attached to a semi-tractor trailer cab that can be towed to a location and then deployed around a
small area to protect a work crew on foot near moving traffic. However, the Balsi Beam and
other similar devices cannot be moved continuously down the road while workers are within the
protection area, nor can it be moved or extended laterally across lanes.
55
Figure 14. Caltrans Balsi Beam.
Police presence in the work convoy may also reduce the occurrence of intrusions into
mobile operations. A police vehicle could be located on the shoulder upstream of the work
convoy to reduce rear-end crashes or in the closed lane downstream (or in front of) the shadow
vehicle to deter drivers from entering the convoy. It is important to note that the police vehicle
should not be located in the travel lane upstream of (or behind) the shadow vehicle, since they
are not designed to physically protect the rear of the work convoy. Drone radar could also be
used to mitigate intrusion crashes into mobile operations. Researchers discussed the benefits of
active enforcement and drone radar in lane closure section and thus that information is not
repeated here.
POTENTIAL COUNTERMEASURES FOR INTRUSIONS INTO TRAFFIC CONTROL SET-UP AND REMOVAL OPERATIONS
Drivers may be confused by temporary traffic control that is being changed as they pass
by, particularly when channelizing devices are partially set. To avoid driver confusion, proper
temporary traffic control set-up and removal procedures should be followed at all times. As
shown in Table 15, drivers tend to commit the same types of intrusions during traffic control set-
up and removal as seen with mobile operations and flagging operations that use pilot cars. This
is not surprising, since traffic control set-up and removal is a type of mobile operation and is
susceptible to vehicles entering the convoy (22 percent of intrusions into set-up and removal
56
operations). Researchers identified the following potential countermeasures that may be used to
reduce intrusions into traffic control set-up and removal operations:
• use effective messages on truck-mounted CMSs to discourage vehicles from
entering the work convoy,
• maintain close spacing between work vehicles in convoy,
• provide work vehicle in front of workers on foot,
• use additional work vehicle on shoulder,
• provide enforcement (real),
• use enhanced vehicle warning light system,
• use automated traffic control device set-up/removal, and
• use positive protection.
As with other types of mobile operations, using effective messages on truck-mounted
CMSs, reducing the spacing between work vehicles, and adding a work vehicle in front of
workers on foot in the closed travel lane are methods that can be used to discourage vehicles
from entering the traffic control set-up/removal operation. During intermittent stops, the
Caltrans-developed Balsi Beam or other similar devices could be use to protect workers.
In some instances, drivers may attempt to pass a work vehicle on the shoulder during set-
up and removal operations (11 percent of intrusions). The addition of another work vehicle on
the shoulder may be a suitable countermeasure to discourage this behavior.
The most common type of intrusion during set-up and removal operations occurs when a
driver veers out of the travel lane and strikes a work vehicle or worker on the shoulder
(44 percent). Researchers assumed that the primary contributing factor in these cases was driver
inattentiveness. As discussed previously, enforcement (real or drone radar) is a countermeasure
that should be considered in cases where a driver needs to be alerted to unexpected roadway
conditions. Enhanced vehicle warning light systems on work vehicles may also be used to alert
drivers.
The use of automated equipment to set-up and remove traffic control devices (i.e., cones
and drums) may be desirable to keep workers from standing in the active travel lane during these
operations. Although a driver may still veer out of the travel lane or accidentally lose control
(11 percent of intrusions into set-up and removal operations) and strike a work vehicle, injury
57
severity could potentially be reduced by removing the worker from the pavement. Caltrans has
already funded a significant amount of research on this topic.
Drivers may also strike a traffic control device, which flies into the work area (11 percent
of intrusions into set-up and removal operations). Unfortunately, sometimes drivers deliberately
hit traffic control devices in the vicinity of workers. Again, active enforcement near the work
activity should reduce the occurrence of these deliberate actions.
SUMMARY
Within Chapter 3, researchers provided a detailed discussion of over 40 potential
countermeasures (regardless of potential cost, practicality, or effectiveness) that could be used to
mitigate the occurrence of the work zone intrusion crash sequences identified in Chapter 2. In all
work zones, proper set-up and maintenance of temporary traffic control is important for the
safety of both motorists and workers. In addition, continuous patrol or monitoring of all work
zones may be used to ensure that debris or other road conditions do not present hazards for
passing motorists. Two other potential countermeasures identified for all four types of work
zone operations considered (lane closure operations, flagger operations, mobile operations, and
traffic control set-up and removal operations) were enforcement presence (real or drone radar)
and positive protection.
The majority of the remaining potential countermeasures were identified for lane closure
situations (including flagging operations). However, about one-fourth of the countermeasures
could be used to reduce work zone intrusions into mobile operations (including traffic control
set-up and removal operations). Due to the potential for adverse effects, the following two
countermeasures were removed from further consideration:
• truck-mounted DSD showing truck speed and
• enhanced vehicle warning light system.


59
CHAPTER 4: WORK ZONE INTRUSION COUNTERMEASURE CRASH COST
REDUCTION ANALYSES
INTRODUCTION
In this chapter, the methodology and results are presented for the work zone intrusion
crash cost analyses. The intent these analyses is to provide some degree of objectivity and
consistency in comparing the expected costs of intrusion countermeasure implementation under
various work zone scenarios to the possible reduction in crash costs that may be realized by the
implementation of the countermeasure. Conceptually, locations and conditions where potential
crash cost reductions exceed countermeasure costs would be candidates for implementation,
whereas locations and conditions where countermeasure costs exceed potential crash cost
savings would not.
It must be emphasized here that these analyses should be considered as a general guide, a
starting point for decision-makers regarding the types of conditions under which the potential
countermeasures may prove cost-effective. In reality, it is difficult to predict with any certainty
the crash costs expected for a particular work zone, let alone those that involve vehicle intrusions
into the work area. Current crash prediction models generally use traffic volume, roadway type,
and maybe one or two road geometric variables as independent variables. In reality, many other
site characteristics can ultimately affect the likelihood and severity of a crash occurring at a
location. Add to this the fact that decisions regarding how a particular work zone is set up or
moved along the roadway can likewise influence crash frequency and severity, and one can see
that the potential exists for large deviations from an “average” estimate. Consequently, the
results of the analysis only provide order-of-magnitude indications of anticipated crash cost
values.
COMPUTATION OF CRASH COSTS
Overview
A series of crash prediction models previously developed from other research studies
were utilized in this analysis. For freeway facilities, the crash prediction models came from a
traffic safety evaluation study of daytime and nighttime freeway work zones (34). California
60
was actually one of the states used in that study, and so a work zone crash prediction model
directly applicable to California freeways was used. For other roadway types, work zone
specific data were not available; only general crash prediction models were available (35, 36).
Researchers used these models to estimate crash frequencies on those types of facilities, and then
applied crash modification factors to account for the increased risks experienced during work
zone operations. The adjustment factors themselves came from the daytime and nighttime work
zone study listed above, since similar factors for work zones on other facility types do not
currently exist.
Methodology
Currently, most efforts to predict crash frequencies on a given roadway segment or to
estimate the effectiveness of a particular countermeasure in reducing crash frequencies rely on
Empirical Bayesian (EB) techniques. EB techniques increase the precision of estimation and
correct for regression-to-the-mean bias (37). The technique involves the creation of a safety
performance function (SPF), based on data from several roadway segments as a reference group,
to provide a generalized estimate of the expected crash frequency as a function of roadway type,
geometric features, and traffic volumes. In the absence of site-specific crash data, these SPFs are
the estimated crash frequency expected on a given type of facility over a given time period.
Freeway/Expressway Facilities
For freeway facilities in California, separate SPFs were initially estimated for daytime
and nighttime periods (6 am to 7 pm and 7 pm to 6 am) on freeways with 4 or 5 lanes, 6 or 7
lanes, and 8 or more lanes. The SPFs were negative binomial (NB) regression models
(consistent with the state of the art in the safety field) developed with crash frequency as the
dependent variable and site characteristics as independent variables. The analysis focused on
total injury and fatal crashes and total property damage only (PDO) crashes. The model form
was log-linear. With this model form, the expected crash frequency is related to the independent
variables as follows:
)....exp(* 22110 nn XXXLY ββββ +++= (1) where:

61
Y is the expected frequency of crashes per year;
L is the length of the section (miles);
X1 through Xn are independent variables (e.g., traffic volume shoulder width, etc.); and
0β through nβ are coefficients that need to be estimated.
In a negative binomial model, the variance is related to the mean as follows:
2))(()()( iii yEkyEyVar += (2)
where:
)( iyVar is the variance,
)( iyE is the mean, and
k is the dispersion parameter.
For the models that were estimated, the CURE procedure (38) was used to determine if
the functional form of the independent variables was reasonable. Models were estimated using
PROC GLIMMIX in Statistical Analysis Software (SAS).
The SPF model coefficients developed through that effort can be found in the project
documentation (34). These SPFs represented normal non-work zone conditions. A series of
crash modification factors (CMFs) were then applied to these models to account for the increased
crash risk that exists when a work zone is in place. Separate CMFs were developed for daytime
and nighttime periods, and for each of the three following work periods:
• work activity occurring in the work zone, temporary lane closures in place;
• work activity occurring in the work zone, no temporary lane closures in place; and
• work zone inactive, no temporary lane closures in place.
The CMFs were developed for injury and fatal crashes, for property-damage-only (PDO)
crashes, and for all crash severity types combined. The work zone CMFs are presented in
Table 18. Generally speaking, the CMFs are higher for PDO crashes than for injury and fatal
crashes. For inactive and active work zones when temporary lane closures are not in place, the
nighttime CMFs are slightly higher than the daytime CMFs. However, when work activity with
a temporary lane closure is required, the CMFs are approximately equal for both time periods,
and are higher than for the other two work zone conditions. Multiplying the appropriate CMF by

62
the SPF provides an estimate of the crash frequencies expected on a given type of roadway for a
given work zone condition.
These computations yielded the expected number of severe and PDO crashes under each
of the three work zone conditions. Researchers also multiplied these expected crash values by
CMFs to determine the expected number of intrusion crashes occurring under each work zone
condition. These factors were taken from the analysis of the NYSDOT crash database described
earlier in this report which indicated:
• 7.5 percent of daytime work zone crashes were intrusion crashes and
• 12.4 percent of nighttime work zone crashes were intrusion crashes.
Table 18. Freeway Work Zone Crash Modification Factors (34).
Work Zone Condition Crash Modification Factor (CMF) Nighttime Daytime
Work Zone Active with Temporary Lane Closuresa: PDO Crashes Injury and Fatal Crashes All Crashes Combined
1.748 1.423 1.609
1.808 1.455 1.663
Work Zone Active without Temporary Lane Closures: PDO Crashes Injury and Fatal Crashes All Crashes Combined
1.666 1.414 1.577
1.398 1.174 1.314
Work Zone Inactive without Temporary Lane Closures: PDO Crashes Injury and Fatal Crashes All Crashes Combined
1.330 1.114 1.237
1.196 1.051 1.127
a It is assumed that these crash modifications can also be used to characterize the increased crash risks that exist at mobile operations when located in an actual travel lane
The crash frequencies estimated using the appropriate SPF and work zone CMF were
then multiplied by a per-crash cost value. The following recent crash cost values on facilities
with operating speeds of 50 mph or higher were used (39):
• injury crash (fatality or injury) – $206,015 and
• PDO crash – $7,800.
The computations yielded estimates of the crash costs per year’s worth of exposure under
each work zone condition as a function of roadway average annual daily traffic (AADT). These
yearly costs ultimately were then converted to an hourly cost to allow comparison to costs of the
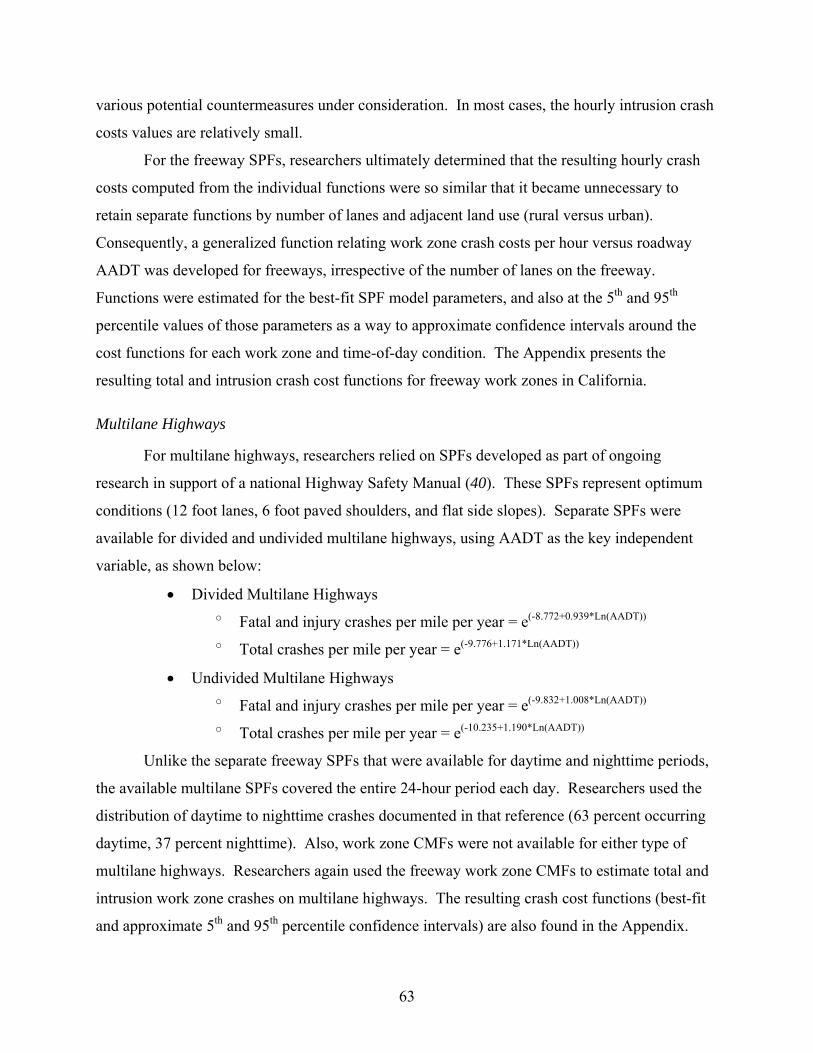
63
various potential countermeasures under consideration. In most cases, the hourly intrusion crash
costs values are relatively small.
For the freeway SPFs, researchers ultimately determined that the resulting hourly crash
costs computed from the individual functions were so similar that it became unnecessary to
retain separate functions by number of lanes and adjacent land use (rural versus urban).
Consequently, a generalized function relating work zone crash costs per hour versus roadway
AADT was developed for freeways, irrespective of the number of lanes on the freeway.
Functions were estimated for the best-fit SPF model parameters, and also at the 5th and 95th
percentile values of those parameters as a way to approximate confidence intervals around the
cost functions for each work zone and time-of-day condition. The Appendix presents the
resulting total and intrusion crash cost functions for freeway work zones in California.
Multilane Highways
For multilane highways, researchers relied on SPFs developed as part of ongoing
research in support of a national Highway Safety Manual (40). These SPFs represent optimum
conditions (12 foot lanes, 6 foot paved shoulders, and flat side slopes). Separate SPFs were
available for divided and undivided multilane highways, using AADT as the key independent
variable, as shown below:
• Divided Multilane Highways o Fatal and injury crashes per mile per year = e(-8.772+0.939*Ln(AADT))
o Total crashes per mile per year = e(-9.776+1.171*Ln(AADT))
• Undivided Multilane Highways o Fatal and injury crashes per mile per year = e(-9.832+1.008*Ln(AADT))
o Total crashes per mile per year = e(-10.235+1.190*Ln(AADT))
Unlike the separate freeway SPFs that were available for daytime and nighttime periods,
the available multilane SPFs covered the entire 24-hour period each day. Researchers used the
distribution of daytime to nighttime crashes documented in that reference (63 percent occurring
daytime, 37 percent nighttime). Also, work zone CMFs were not available for either type of
multilane highways. Researchers again used the freeway work zone CMFs to estimate total and
intrusion work zone crashes on multilane highways. The resulting crash cost functions (best-fit
and approximate 5th and 95th percentile confidence intervals) are also found in the Appendix.

64
Generally speaking, the crash costs per hour per mile for both the divided and undivided
multilane highways tend to be less than those for freeway facilities at the same AADT level. The
reason for this is that the HSM procedure also includes a separate SPF and methodology for
estimating the crashes that occur at highway intersections on these facilities. For this analysis,
the intersection crash costs were ignored because of a lack of available information as to average
intersection spacing and how such spacing would play into typical work zone installations.
Rather than unduly complicate the analysis, researchers propose simply to recognize the
limitations of these functions as basic roadway segments and interpret and assess the likely
potential of countermeasures being considered with this fact in mind.
Two-Lane, Two-Way Highways
For two-lane, two-way highway crashes, only a total crash SPF was available (36):
Total crashes per mile per year = 10-6*AADT*365*e(-0.312)
Of this total, 67.9 percent were estimated to be PDO and 32.1 were expected to be injury
and fatal crashes. The same distribution procedure by time-of-day as was used for multilane
highways was again used here. Similarly, the freeway work zone CMFs were also again used
due to a lack of availability of two-lane, two-way work zone CMFs.
The Appendix once again provides the total and intrusion crash cost functions for two-
lane highways that were used in this analysis. The influence of individual intersections were
once again excluded from the analysis, and simply recognized when assessing the likelihood of a
countermeasure being able to offset its costs through a reduction in crash costs. It should be
noted that researchers were unable to define a reasonable standard error of the model parameters
for the equation, and so were not able to approximate a confidence interval for the functions.
Generally speaking, though, the lower traffic volumes on many rural two-lane highways yields
crash costs in work zones that are very small on a per-hour basis.
RESULTS OF COUNTERMEASURE EVALUATIONS
The preliminary list of potential countermeasures identified in Chapter 2 served as the
starting point of this analysis. Several items from that list were judged to be procedural

65
countermeasures that do not require significant additional expenditures or other
agency/contractor resources, and so could and should be implemented as part of normal traffic
control activities in most situations. In addition, some of the countermeasures identified had
highly variable implementation costs, depending on the magnitude of the deployment and level
of sophistication of the technology utilized (e.g., simple radar-activated warning sign at a
specific location versus a complete work zone intelligent transportation system installed
throughout the project). In general, not enough data exists as to the effectiveness in these
widely-ranging designs to allow a reasonable cost-effectiveness assessment to be useful.
Consequently, these types of countermeasures were not explicitly evaluated in this analysis. For
those situations in which a traffic control designer were interested in assessing whether a
particular countermeasure would be cost-effective for their particular work zone, the tables and
graphs provided in the Appendix could be used to compare possible crash cost benefits directly
with the costs of a particular countermeasure deployment being considered.
After eliminating several strategies as described, researchers examined the following list
of 11 potential countermeasures in this cost-effectiveness assessment (expressed in terms of
lowest to highest estimated hourly cost to deploy at a site):
• drone radar devices;
• use of larger channelizing devices;
• closer channelizing device spacing;
• more frequent spacing of transverse channelizing devices in closed lanes;
• temporary transverse rumble strips;
• sequential warning light system;
• speed display trailers;
• flagger replacement devices;
• steel (portable) barrier;
• use of automated traffic control channelizing device set-up and removal
technology;
• truck-mounted positive protection systems;
• provision of law enforcement (i.e., COZEEP, MAZEEP); and
• Automated speed enforcement technology.

66
For these countermeasures, researchers approximated the hourly cost of deployment/use
based on available literature, recent bid prices on the CALTRANS or other state DOT websites,
or vendor estimates. For many of the intrusion countermeasures evaluated, their potential
benefits extend beyond the reduction in intrusion crash potential. Consequently, it was
appropriate to consider their total crash cost reduction potential as well as the potential intrusion
crash cost reduction potential. These costs were then compared to the hourly crash cost
functions described above. Two comparisons were made:
1. At what AADT level would deployment of the countermeasure be offset by the
elimination of a reasonable estimate of possible reduction in intrusion crash costs?
2. At what AADT level would the deployment costs of the countermeasure be offset
by a reasonable estimate of possible reduction in total crash costs during the
particular work zone condition?
In this analysis, what was considered “reasonable” varied based on prior knowledge or
expectations of how the countermeasure would affect driver behavior (and, intuitively, safety).
For example, the increased use of law enforcement at work zones has been shown in various
studies to result in actual crash reductions of 20 percent or more (41). However, these crash
reductions were computed based on an analysis of the entire duration of the project, and so that
reduction value may be very conservative for times when an enforcement vehicle and officer is
actually present and visible in the work zone. In another case, the use of speed display trailers
has not been evaluated in terms of their potential crash cost reduction benefits. However,
operational studies have suggested that they can typically result in small (2-3 mph) reduction in
speeds, although larger speed reductions have been observed in some instances (42). Recent
crash modification analysis suggest that a 2 mph reduction in speeds on a facility typically
operating at 70 mph can be expected to reduce injury crashes by approximately 9 percent (43).
Presumably, some of these crashes are reduced in severity, whereas other crashes are eliminated
entirely. In any event, taking these two findings together, researchers estimated (conservatively)
that speed display trailers have the potential to reduce total work zone crash costs by up to
5 percent. Intuitively, some of these crashes would be intrusion crashes, but the actual extent to
which such crashes would be reduced is unknown.
For other countermeasures, the potential crash cost reduction will come exclusively from
a reduction in crash severity. Positive protection devices, such as the truck-mounted barriers or

67
steel barriers, are an example of these types of countermeasures. Crashes that may have been
intrusions into the work area and resulted in severe injuries to workers and motorists are changed
to impacts with the protection devices. Although the likelihood of some type of impact is not
changed, it is assumed that the redirection of the vehicle from entering the work area will result
in less severe injuries (on average) and in less property damage overall.
To simplify the assessment of possible countermeasures, four general levels of crash cost
reduction potential were defined:
• Limited crash cost reduction potential – countermeasures in this category were
expected to be able to reduce up to 33 percent of the intrusion crash costs at a
work zone, or 3 percent of the total crash costs;
• Minor crash cost reduction potential – countermeasures in this category were
expected to be able to reduce intrusion crash costs between 33 and 50 percent, or
5 percent of total crash costs at the work zone;
• Moderate crash cost reduction potential – countermeasures in this category were
expected to be able to reduce intrusion crash costs by 75 percent, or total crash
costs by 10 percent; and
• Significant crash cost reduction potential – countermeasures in this category were
expected to be able to eliminate all intrusion crash costs, or reduce total crash
costs by 25 percent.
Ultimately, none of the countermeasures evaluated were expected to completely
eliminate intrusion crash costs. Only a few countermeasures, such as law enforcement presence,
were expected to achieve significant reductions in overall crash cost potential. Referring back to
the crash cost graphs in the Appendix, the fact that the confidence intervals of the crash cost
estimates diverge so much at higher AADT values was also considered by researchers in the
assessment. As a result, several possible countermeasures are considered plausible and are
suggested for additional consideration at work operations on higher volume work zones, even if
the comparison of implementation costs to the average crash cost functions does not strictly
warrant a recommendation.
Table 19 summarizes the results of the analyses. From a cost-effectiveness perspective,
drone radar devices are relatively inexpensive devices to deploy, costing $4 or less per hour of
use (assuming the device can be used for at least 100 hours). Even assuming a very limited crash
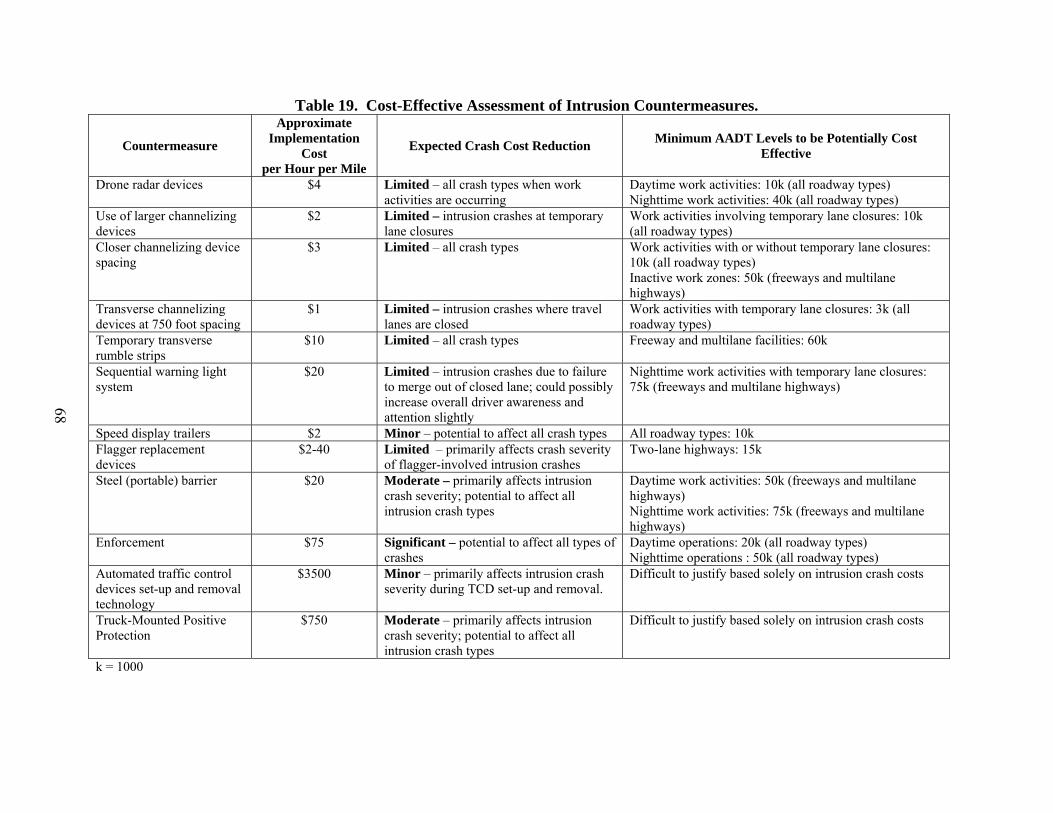
68
Table 19. Cost-Effective Assessment of Intrusion Countermeasures.
Countermeasure
Approximate Implementation
Cost per Hour per Mile
Expected Crash Cost Reduction Minimum AADT Levels to be Potentially Cost Effective
Drone radar devices $4 Limited – all crash types when work activities are occurring
Daytime work activities: 10k (all roadway types) Nighttime work activities: 40k (all roadway types)
Use of larger channelizing devices
$2 Limited – intrusion crashes at temporary lane closures
Work activities involving temporary lane closures: 10k (all roadway types)
Closer channelizing device spacing
$3 Limited – all crash types Work activities with or without temporary lane closures: 10k (all roadway types) Inactive work zones: 50k (freeways and multilane highways)
Transverse channelizing devices at 750 foot spacing
$1 Limited – intrusion crashes where travel lanes are closed
Work activities with temporary lane closures: 3k (all roadway types)
Temporary transverse rumble strips
$10 Limited – all crash types Freeway and multilane facilities: 60k
Sequential warning light system
$20 Limited – intrusion crashes due to failure to merge out of closed lane; could possibly increase overall driver awareness and attention slightly
Nighttime work activities with temporary lane closures: 75k (freeways and multilane highways)
Speed display trailers $2 Minor – potential to affect all crash types All roadway types: 10k Flagger replacement devices
$2-40 Limited – primarily affects crash severity of flagger-involved intrusion crashes
Two-lane highways: 15k
Steel (portable) barrier $20 Moderate – primarily affects intrusion crash severity; potential to affect all intrusion crash types
Daytime work activities: 50k (freeways and multilane highways) Nighttime work activities: 75k (freeways and multilane highways)
Enforcement $75 Significant – potential to affect all types of crashes
Daytime operations: 20k (all roadway types) Nighttime operations : 50k (all roadway types)
Automated traffic control devices set-up and removal technology
$3500 Minor – primarily affects intrusion crash severity during TCD set-up and removal.
Difficult to justify based solely on intrusion crash costs
Truck-Mounted Positive Protection
$750 Moderate – primarily affects intrusion crash severity; potential to affect all intrusion crash types
Difficult to justify based solely on intrusion crash costs
k = 1000

69
cost reduction potential, these devices would be justifiable at work zones during periods of
daytime work activity (with or without temporary lane closures present) once AADTs reach
10,000 vehicles per day (vpd) on any type of facility (freeways, multi-lane highways, or two-lane
highways). During nighttime work operations, AADTs would need to be somewhat higher to be
cost-effective (perhaps 40,000 vpd or more). The expectation is that the radar devices would be
removed during periods of inactivity at the work zone, so that drivers do not become accustomed
to their presence and disregard the signal.
The purpose of using larger channelizing devices (i.e., drums instead of cones) is that
the larger devices can present a more imposing presence to a lane closure and reduce the
potential for vehicles to run into the merging taper or to inadvertently enter into the closed lane
once into the actual activity area. It is unlikely that larger devices can have much of an effect on
non-intrusion crashes, so the categorization as “limited” effect is based exclusively on intrusion
crash cost reduction potential. Based on this characterization, this strategy was also judged to be
justifiable at work operations involving temporary lane closures (either day or night) once
AADTs reach approximately 10,000 vpd, regardless of the type of roadway. For work
operations that do not involve temporary lane closures, it is assumed that larger devices would be
used on the shoulder or off of the paved travel surface if necessary anyway, and so there would
not offer any incremental benefit.
Similarly, deployment of channelizing devices at closer spacings are intended to present
a more imposing closure to motorists approaching and passing by a closed section of roadway. It
is believed that closer spacing makes it more difficult for those attempting to deliberately intrude
into the work area, and merging tapers will be more visually detectable to approaching motorists,
reducing the potential for them to run through the taper and into the work activity area. The
hourly costs of this strategy are also fairly small, and so can again be justified when work
activities are occurring at about 10,000 vpd (day or night) for all roadway types. During periods
of work inactivity, though, it appears that this strategy can be cost-effective when AADTs are
about 50,000 vpd or higher (and thus more appropriate as a countermeasure on multilane
facilities).
As another strategy to help curtail deliberate attempts to use closed travel lanes and/or
reduce inadvertent travel in the closed lane, researchers examined the Caltrans procedures
regarding the deployment of periodic transverse channelizing devices or barricades.

70
Currently, these devices are used in closed lanes on freeways and expressways every 2000 feet.
Researchers examined the cost-effectiveness of decreasing that spacing to 750 feet, which is
recommended elsewhere in the literature (20). Presently, the incremental cost to reduce the
spacing would be less than $1 per hour per mile. At such a small incremental cost, this strategy
can be justified at all freeway work zones that involve closed travel lanes, and could be expanded
to other types of multilane highways, once AADTs reach 3,000 vpd.
Several agencies have looked at the use of temporary transverse rumble strips,
installed upstream of work zones (either with or without lane closures) as a way to alert drivers
and reduce the crash potential. Given that significant portion of intrusions do appear to be the
result of a driver being surprised by a condition in the work zone and either swerving to avoid
the hazard or hitting the hazard and then entering the work space, this technology is expected to
have some effect on intrusions as well. However, the cost of temporary strips that are adhered to
the pavement are fairly significant, estimated at $10 per hour for a one-week work zone (the
adhesive strips are not easily reusable at different locations), but would decrease for longer-term
work zones. Meanwhile, the strips are assumed to have a limited effect on all types of crash
costs at the work zone. Consequently, the use of this technology appears to be justifiable
primarily on higher-volume facilities (i.e., 60,000 vpd multilane highways and freeways).
Again, as the duration of the work zone increases, the AADT threshold decreases. Also, if future
research indicates a higher level of crash cost reduction potential, the AADT threshold would
likewise decrease.
The sequential warning light system for temporary lane closures has been shown to be
detected farther upstream of a nighttime lane closure and positively affect driver behavior.
Assuming a reasonable replacement rate of about two or three lights per week to account for
periodic hits by merging traffic, the device appears to involve an hourly cost of $20 per hour per
mile of work zone (assuming that the system has an influence on safety over an approximate 0.5-
mile segment of roadway), and is targeted primarily for nighttime lane closures on freeways and
multilane highways. Its effectiveness in terms of crash reductions is assumed to be limited, in
that it attempts to reduce those crashes that occur because drivers do not recognize the lane is
closed until they are too close to the merging taper. The potential does exist for the technology
to increase driver attention somewhat and reduce other types of crashes farther into the work
zone, but the magnitude of this effect is not known. For situations where driver awareness and
71
response to traditional lane closures at night do not appear sufficient (and so the expected crash
cost potential at the work zone is likely to be much higher than average), this system may be
justifiable at higher AADT levels (i.e., 75,000 or more) at night.
Speed display trailers have been shown to be able to reduce speeds slightly. As
discussed above, these devices have been categorized as having minor potential effectiveness in
reducing all types of work zone crashes, including intrusion crashes. The device is estimated to
have an hourly cost of about $2 per hour, based on current lease prices of these devices.
Consequently, their use can be justified on all roadway types at AADTs of 10,000 vpd or higher.
On two-lane highways, intrusion crashes involving flaggers can be very serious.
Consequently, flagging replacement devices were examined as part of this evaluation. These
technologies include the use of automated flagger assistance devices (AFADs) and portable
traffic signals. AFADs still require the use of a flagger (albeit removed from the path of
approaching vehicles and so with a lower crash risk potential), whereas portable traffic signals
operate without constant attention by a worker and so are more appropriate for long-term
operations including times when work is not occurring). The estimated effectiveness of these
technologies is limited, as they are designed to only address the flagger-involved intrusion
crashes at the end locations of alternating one-lane operations on two-lane highways. Costs of
these technologies are highly variable, depending on whether they are purchased or leased, their
expected service lives, etc. For this analysis, a range of $2-$40 per hour per mile was used (this
assumes the average length of the one-way section is one mile long). Based on these
assumptions, AFADs at the lower range of the cost range could be justified on two-lane
highways once AADTs reach or exceed 15,000 vpd. Systems at the higher end of the range
would likely not be justifiable at any AADT level, as the potential crash cost savings would not
offset implementation costs. Certainly, the potential does exist for the elimination of one flagger
in some locations where a single flagger can control both directions of travel; such an operation
would reduce the operating costs of the contractor and reduce the overall implementation cost of
the device.
Steel (portable) barrier technology has recently been introduced in the U.S. The
technology allows for much quicker installation and removal at projects where protection against
vehicle intrusions is most important. The effectiveness of the technology is considered to be
moderate, in that it can reduce a significant portion of intrusion crash costs in the vicinity of

72
workers and equipment operating near moving traffic by reducing the severity of such crashes
(the frequency of these types of crashes is assumed to not be affected). Currently, the technology
is fairly expensive to obtain, and is estimated to cost approximately $20 per hour per mile (if the
technology is able to provide a 10-year service life). Even so, this technology appears to be
justifiable on freeways and multilane highways during daytime operations when AADTs exceed
50,000 vpd and nighttime operations for AADTs exceeding 75,000 vpd.
The use of law enforcement has been shown to consistently reduce vehicle speeds when
located within work zones, and the provision of enforcement in work zones has been associated
with a substantial reduction in all types of work zone crashes, including intrusion crashes. A cost
value of $75 per hour (which is believed to be the current approximate cost in California) was
used in the analysis. The effectiveness of enforcement for crash reduction is estimated to be
between 25 and 40 percent. Using these values, the analysis indicates that enforcement use in
work zones can be justified on freeways and multilane highways during daytime operations
when AADTs are as low as 20,000 vpd and at nighttime operations at AADTs as low as 50,000
vpd. Automated speed enforcement technology may be justifiable at even lower AADTs (due to
the ability to offset operating costs with citation revenues), but requires enabling legislation in
order to implement.
Automated channelizing device installation and removal technology has been of
interest to Caltrans and other highway agencies and contractors in recent years. This technology
is viewed positively for its ability to remove workers from the edge of the placement and
retrieval vehicle (which presumably reduced the risk of injury to workers should an impact from
an approaching vehicle occur or from having the worker fall from the vehicle). There are also
potential efficiency savings with some of the technologies by reducing the number of workers
required to put out and pick up TCDs. However, the overall effectiveness of the technology is
believed to be minor in terms of reducing intrusion crash severity and costs (the frequency of
vehicle crashes is assumed to remain the same). Because it affects potential crash costs over a
very limited distance, it has a very high estimated hourly cost (assuming a 50-foot influence area
for an hour each day over a 10-year service life). Consequently, it is very difficult to justify the
use of the technology for vehicle intrusion crash reduction alone. However, the potential for
reducing worker backovers and runovers by work equipment may justify its use under much less
stringent conditions.

73
Finally, truck-mounted barrier technology has been designed to be driven to a
particular worksite and protect workers in very close proximity to traffic in a very limited work
space (generally 100 feet or less). Researcher perceive these devices as having moderate effect
on intrusion crash costs, dramatically reducing the severity (but not frequency) of those vehicles
intruding into the actual work space. Their ability to protect workers on foot is excellent,
especially for those operations in extremely close proximity to moving traffic. Unfortunately,
these technologies currently have a very high cost at this time (estimated to be equivalent to $750
per hour per mile of protection over a 10-year service life). Consequently, the devices currently
are difficult to justify based on the type of crash cost analysis as was done for this report. A
longer service life or other operational benefits (one vendor of this type of technology has
anecdotal information to suggest that the device can improve traffic flow past the work site and
reduce traffic delays slightly) would reduce the AADT threshold accordingly. However, it is
likely that agencies making use of this technology will do so primarily with risk reduction to its
highway workers on foot as a priority, rather than as a strictly economic decision.
SUMMARY
It is important to again reiterate the limitations of the analyses results presented in this
section. Data were very limited in terms of the effectiveness of most countermeasures in crash
reductions and so had to be assumed based on engineering judgment. Likewise, cost values for
many of the countermeasures were unavailable and had to be assumed (along with service lives)
in order to come up with a per-hour, per-mile estimate. Generalized safety performance
functions were used for most roadway types, and cost modification factors due to various types
of work zone operations under either daytime or nighttime conditions were available only for
freeway facilities.
Those limitations notwithstanding, the evaluation indicates that there are several intrusion
countermeasure strategies and technologies that appear justifiable from a crash cost reduction
perspective. Although some of these countermeasures are justifiable on the basis of total crash
cost reduction potential, each is believed to also have the potential to address some or all of the
intrusion crash events that occur in work zones. Because they have very low hourly costs
associated with them, the following items are the most easily justified:
• use of larger channelizing devices,

74
• reducing the spacing of transverse barricades or channelizing devices in closed
travel lanes, and
• speed display trailers.
The next two items meet cost-effectiveness criteria once traffic volumes reach moderate
levels:
• drone radar devices and
• closer spacing of channelizing devices
At still higher traffic volume levels, the following countermeasures can be justified:
• temporary transverse rumble strips,
• sequential warning light systems,
• flagger replacement devices,
• steel (portable) barrier, and
• use of enforcement.
Finally, the following items are more difficult to justify on the basis of their crash cost
reduction potential, but may be appropriate for other reasons in certain situations:
• automated TCD placement and retrieval technology, and
• truck-mounted positive protection devices.
Obviously, meeting the justification criteria according the analysis just provided alone is
not sufficient to implement any or all of the above proposed countermeasures. The analysis
relates implementation costs, which are borne directly by a highway agency such as Caltrans, to
user costs that are borne by the motoring public. Although some intrusions undoubtedly involve
Caltrans or contractor workers and thus involve additional expenditures by the agency, the
majority of crash costs are borne by society as a whole. Agency budgets must ultimately dictate
when and where these countermeasures can be implemented. It is likely that many work zones
where a countermeasure could be justified based on this analysis cannot be implemented because
of a lack of sufficient agency funding.

75
CHAPTER 5: CONCLUSIONS AND RECOMMENDATIONS
In this report, researchers documented the efforts undertaken to investigate and categorize
the different types of work zone intrusion crashes that occur on California roadways, and to
conduct a detailed comparative critique of how each of the various countermeasures available
may mitigate those types of work zone intrusions. Researchers used the NYSDOT work zone
incident database and telephone surveys of Caltrans and highway contractor personnel in
California to gain insights into the frequency, characteristics, and crash sequences that comprise
vehicle intrusion crashes at California work zones. Researchers examined the narratives of the
various intrusion crashes to try to identify the main categories of crash scenarios that occurred.
Prototypical crash sequences were developed around four basic work zone operation categories:
• lane and shoulder closure operations,
• flagging operations,
• mobile operations, and
• traffic control set-up and removal operations.
Within each of these basic work zone situations, several different sequences leading to
work zone intrusion crashes were defined. These sequences were differentiated on whether or
not the action taken appeared to be a deliberate decision on the part of the driver, then on the
primary contributing actions or factors leading to the intrusion. Researchers then identified
potential reasons that could have contributed to the occurrence of the work zone intrusion crash
sequences and matched possible strategies and technologies that could be deployed to mitigate
these crashes. More than 40 possible countermeasures, split between procedural strategies and
technology deployments, were identified. These countermeasures were then critiqued based on
feasibility and practicality of deployment, and potential for mitigating intrusion crashes. For
several of the countermeasures, a cost-effectiveness comparison of implementation costs to crash
cost reduction potential was performed.
Based on the assessment of intrusion crash characteristics, the following conclusions can
be drawn:
76
• Intrusion crashes make up a relatively small portion of crashes at work zones (7.5
percent of traffic crashes that occur during daytime work operations, 12.4 percent
of traffic crashes during nighttime work operations).
• Although intrusion crashes comprise a greater proportion of nighttime crashes
than daytime crashes, most (69.9 percent) intrusion crashes happen during
daytime work operations.
• The biggest share (58.7 percent) of vehicle intrusion crashes occurs at lane
closure operations. Intrusion crashes also occur at mobile operations, flagging
operations, and during traffic control set-up and removal activities, but each of
these make up less than 10 percent of the intrusion crashes.
• When intrusions crashes occur, they most often involve collisions with work
vehicles/equipment or work materials/debris; only about 17 percent of intrusion
crashes involve a collision with a highway worker.
• A significant portion of intrusion crashes are the result of deliberate driver
decisions and actions to enter the work area. The relative frequency of such
deliberate events differs by type of work operation in place, but ranges from 22 to
63 percent of all intrusion crashes occurring at those types of operations.
Tables 20 and 21 provide a summary of the procedural and technological
countermeasures researchers view as viable for addressing work zone intrusion crashes. Several
countermeasures, especially those that emphasize increased attention to current procedures or
possible expansion of procedures, are fairly low cost to implement. Technological
countermeasures, on the other hand, can have fairly significant costs associated with them.
Several countermeasures that do involve some costs of implementation were further examined as
part of this research. Based on that analysis, the following items are the most easily justified:
• use of larger channelizing devices,
• reducing the spacing of transverse barricades or channelizing devices in closed
travel lanes, and
• speed display trailers.

77
Table 20. Summary of Intrusion Countermeasures for Stationary Operations.
Type of Work Operation Countermeasure Category Procedural Strategy
Stationary - Procedural
Low-cost/no-cost to implement (advance planning and policy-setting is key)
• Alter work area access point and internal TCP procedures to prevent truck slow-down in active travel lane
• Limit lane closure length to avoid blocking ramp or driveway
• Reconfigure construction vehicle access point to minimize impacts to traffic or confuse following drivers
• Ensure adequate sight distance to merging and shifting tapers
• Ensure use of existing vehicle warning systems (e.g., turn signals, hazard lights, beacons, etc.)
• Proper setup and maintenance of TTC • Utilize CMS when available upstream of the work
zone to warn drivers Moderately low cost (consists of commonly-available signs, devices, or lights)
• Increased use of dual advance signing • Closer or continual spacing of channelizing devices • Enhanced vehicle warning light system • Lane changing restrictions • Larger, more visible channelizing devices • Transverse TCDs • Upstream queue end warning (general warning on
static signs) Staffing solutions (involve additional personnel or reallocation of personnel)
• Replace flagger with police officer • Use of a flagger at the access point • Downstream spotter • Continuous patrol or monitoring of work zone • Enforcement presence
Moderate expense • Improve advance information to drivers through traveler information systems or other means
Stationary - Technology Moderate expense • AFADs • Portable traffic signals • Construction entrance signing (dynamic) • “DO NOT FOLLOW” truck-mounted signs • Dynamic speed display trailers • Sequential warning light system (night operations
only) • Early merge system • Temporary transverse rumble strips • Upstream queue end warning (real time/dynamic)
Moderately high expense • Steel barrier (positive protection) TCP = Traffic Control Plan; TTC = Temporary Traffic Control; CMS = Changeable Message Sign; TCDs = Traffic Control Devices; AFADs = Automated Flagger Assistance Devices

78
Table 21. Summary of Intrusion Countermeasures for Mobile Operations or Traffic
Control Device Set-up and Removal Activities.
Type of Work Operation Countermeasure Category Procedural Strategy
Mobile - Procedural Low-cost/no-cost to implement (advance planning and policy-setting is key)
• Additional work vehicle positioned on shoulder • Adjust spacing between advance warning vehicle
and work convoy as needed to maintain adequate sight distance to work convoy
• Follow proper TTC set-up and removal procedures • Utilize messages on truck-mounted CMSs to
discourage vehicles from entering work convoy • Utilize messages on truck-mounted CMSs to
indicate slow-moving vehicles • Reduce spacing between work vehicles • Utilize CMS when available upstream of the work
zone to warn drivers Moderately low cost (consists of commonly-available signs (static), devices, or lights)
• Enhanced vehicle warning light system
Staffing solutions (involve additional personnel or reallocation of personnel)
• Use of enforcement
Mobile – Technology High expense • Automated TCD setup & removal technology • Truck mounted positive protection
TTC = Temporary Traffic Control; CMS = Changeable Message Sign; TCDs = Traffic Control Devices
The next two items meet cost-effectiveness criteria once traffic volumes reach moderate
levels:
• drone radar devices and
• closer spacing of channelizing devices.
At still higher traffic volume levels, the following countermeasures can be justified:
• temporary transverse rumble strips,
• sequential warning light systems,
• flagger replacement devices,
• steel (portable) barrier, and
• use of enforcement.
Finally, the following items are more difficult to justify on the basis of their crash cost
reduction potential, but may be appropriate for other reasons in certain situations:

79
• automated TCD placement and retrieval technology, and
• truck-mounted positive protection devices.
Guidance on which work zone intrusion countermeasures are the most appropriate for a
given set of roadway conditions and planned work activities is provided in Appendix A.


81
CHAPTER 6: REFERENCES
1. G.L. Ullman and D.R. Riesland. Catalog of Work Zone Speed Control Methods.
Research Report FHWA/TX-89/1161-2. Texas Transportation Institute, College Station, Texas, May 1990.
2. Richards, S.H. and C.L. Dudek. Implementation of Work Zone Speed Control Measures. In Transportation Research Record 1086. TRB, National Research Council, Washington, DC, 1986, pp. 36-42.
3. Ullman, G.L., S.D. Schrock, M.A. Brewer, P. Sankar, J.E. Bryden, M. Corkran, C.W. Hubbs. Traffic Enforcement Strategies in Work Zones, Interim Report, NCHRP Project No. 3-80, June 2006.
4. Blackburn, R.R. and D.T Gilbert. Photographic Enforcement of Traffic Laws. NCHRP Synthesis of Highway Practice 219. TRB, National Research Council, Washington, D.C., 1995.
5. Benekohal, R.F., M. Chitturi, A. Hajbabaie, M. Wang, and J.C. Medina. Automated Speed Photo Enforcement Effects on Speeds in Work Zones. In Transportation Research Record 2055, TRB, National Research Council, Washington, DC, 2008, pp. 11-20.
6. Medina, J.C., R.F. Benekohal, A. Hajbabaie, M. Wang, and M.V. Chitturi. Downstream Effects of Speed Photo-Radar Enforcement and Other Speed Reduction Treatments in Work Zones. In Transportation Research Record 2107. TRB, National Research Council, Washington, DC. 2009. pp. 24-33.
7. Ullman, G.L. Effect of Radar Transmissions on Traffic Operations at Highway Work Zones. In Transportation Research Record 1304, TRB, National Research Council, Washington, DC, 1991, pp. 261-269.
8. Eckenrode, R.T., W.A. Sarasua, J.H. Mattox III, J.H. Ogle, and M. Chowdhury. Revisiting the Use of Drone Radar to Reduce Speed in Work Zones. In Transportation Research Record 2015, TRB, National Research Council, Washington D.C., 2007, pp. 19-27.
9. Standard Plans (U.S. Customary Units). California Department of Transportation, May 2006. Available at http://www.dot.ca.gov/hq/esc/oe/project_plans/highway_plans/stdplans_US-customary-units_06/viewable_pdf/2006-Std-Plns-for-Web.pdf. Accessed January 7, 2009.
10. Meyer, E. Guidelines for the Application of Removable Rumble Strips. Report No. K-TRAN: KU-02-3. The University of Kansas, Lawrence, Kansas, August 2006.
11. Andrew, L.B. and J.E. Bryden. A Work Zone Intrusion Initiative to Reduce Highway Construction Accidents. Presented at the 80th Annual TRB meeting, January 2001.
12. Morgan, R.L. Temporary Rumble Strips. Report FHWA/NY/SR-03/140, New York State Department of Transportation, July 2003.
13. Intelligent Transportation Systems in Work Zones: A Case Study, Dynamic Lane Merge System Reducing Aggressive Driving and Optimizing Throughput at Work Zones in Michigan. Report No. FHWA-HOP-04-033, Federal Highway Administration, U.S. Department of Transportation, Washington, D.C., October 2004. Available at http://ops.fhwa.dot.gov/wz/technologies/michigan/index.htm. Access December 8, 2009.
14. ITS Safety and Mobility Solutions: Improving Travel Through America’s Work Zones. American Traffic Safety Services Association, Fredericksburg, Virginia, 2008.
82
15. Pesti, G., P. Wiles, R.L. Cheu, P. Songchitruksa, J. Shelton, and S. Cooner. Traffic
Control Strategies for Congested Freeways and Work Zones. Research Report FHWA/TX-08/0-5326-2. Texas Transportation Institute, College Station, Texas, October 2008.
16. McCoy, P.T., J.A. Bonneson, and J.A. Kollbaum. Speed Reduction Effects of Speed Monitoring Displays with Radar in Work Zones on Interstate Highways. In Transportation Research Record 1509, TRB, National Research Council, Washington D.C., 1995, pp. 65-72.
17. Fontaine, M.D., P.J. Carlson, and H.G. Hawkins, Jr. Evaluation of Traffic Control Devices for Rural High-Speed Maintenance Work Zones: Second Year Activities and Final Recommendations. Report No. FHWA/TX-01/1879-2. Texas Transportation Institute, College Station, Texas, October 2000.
18. Chen, Y., X. Qin, D.A. Noyce, and C. Lee. Evaluation of Strategies to Manage Speed in Highway Work Zones. Presented at the 86th Annual TRB meeting, January 2007.
19. Pesti, G. Alternative Way of Using Speed Trailers: Evaluation of the D-25 Speed Advisory Sign System. Presented at the 84th Annual Transportation Research Board Meeting, Washington, D.C., January 2005.
20. Bryden, J.E. and D. Mace. Guidelines for Design and Operation of Nighttime Traffic Control for Highway Maintenance and Construction. NCHRP Report 476. TRB, National Research Council, Washington, D.C., 2002.
21. Manual on Uniform Traffic Control Devices for Streets and Highways. 2003 Edition with Revisions Number 1 and 2 Incorporated. Federal Highway Administration, Washington, D.C., November 2004. Available at http://mutcd.fhwa.dot.gov/. Accessed January 21, 2009.
22. Finley, M.D., G.L. Ullman, and C.L. Dudek. Work Zone Lane Closure Warning Light System. Texas Transportation Institute, College Station, Texas, September 1999.
23. Gibbons, R.B., S.E. Lee, B. Williams, and C.C. Miller. Selection and Application of Warning Lights on Roadway Operations Equipment. NCHRP Report 624. TRB, National Research Council, Washington D.C., 2008.
24. Evaluation of Temporary Removable Rumble Strips for Speed Reduction 09-1970 McAvoy, D., P.T. Savolainen, V. Reddy, J.B. Santos, and T.K. Datta. Presented at the 88th Annual Transportation Research Board Meeting, January 11-15, 2009, Washington, D.C.
25. Garber, N.J. and S.T. Patel. Control of Vehicle Speeds in Temporary Traffic Control Zones (Work Zones) Using Changeable Message Signs with Radar. In Transportation Research Record 1509, TRB, National Research Council, Washington D.C., 1995, pp. 73-81.
26. Wang, C., K.K. Dixon, and D. Jared. Evaluating Speed-Reduction Strategies for Highway Work Zones. In Transportation Research Record 1824, TRB, National Research Council, Washington D.C., 2003, pp. 44-53.
27. Manual on Uniform Traffic Control Devices for Streets and Highways. 2009 Edition. Federal Highway Administration, Washington, D.C., December 2009. Available at http://mutcd.fhwa.dot.gov/. Accessed December 18,2009.
83
28. Dudek, C.L. and R. D. Huchingson. Manual on Real-Time Motorist Information
Displays. Report No. FHWA-IP-86-16. Federal Highway Administration, U.S. Department of Transportation, Washington, D.C., August 1986.
29. Ullman, G.L., B.R. Ullman, C.L. Dudek, and N.D. Trout. Legibility Distances of Smaller Character Light-Emitting Diode (LED) Dynamic Message Signs for Arterial Roadways. Texas Transportation Institute, College Station, Texas, July 2004.
30. Ullman, B.R., N.D. Trout, and G.L. Ullman. Recommended Messages for Truck-Mounted Changeable Message Signs During Mobile Operations. Report FHWA-WY-09-07F. Texas Transportation Institute, College Station, Texas, November 2009.
31. Finley, M.D., B.R. Ullman, and N.D. Trout. Traffic Control Devices and Practices to Improve the Safety of Mobile and Short Duration Maintenance Operations. Report 0-4174-2. Texas Transportation Institute, College Station, Texas, December 2004.
32. Notbohm, T., A. Drakopoulos, and G. Vergou. Smart Work Zone Deployment Initiative Wisconsin Evaluations: Mobile/Stationary Speed Boards (You/Me Boards) Wisconsin Evaluation. Summer 2001.
33. Steele, D.A., and W.R. Vavrik. Improving the Safety of Moving Lane Closures. Report ICT-09-049. Applied Research Associates, Inc., Champaign, Illinois, June 2009.
34. Ullman, G.L., M.D. Finley, J.E. Bryden, R. Srinivasan, and F.M. Council. Traffic Safety Evaluation of Nighttime and Daytime Work Zones. NCHRP Report 627. TRB, National Research Council, Washington, DC, 2008.
35. Lord, D., S.R. Geedipally, B.N. Persaud, S.P. Wasington, I. van Schalkwyk, J.N. Ivan, C. Lyon, and T. Jonsson. Methodology to Predict the Safety Performance of Rural Multilane Highways. NCHRP Web-Only Document 126. February 2008. Accessible at http://onlinepubs.trb.org/onlinepubs/nchrp/nchrp_w126.pdf.
36. Hughes, W., K. Eccles, D. Harwood, I. Potts, and E. Hauer. Development of a Highway Safety Manual. NCHRP Web-Only Document 62. March 2004. Accessible at http://onlinepubs.trb.org/onlinepubs/nchrp/nchrp_w62.pdf.
37. Hauer, E., D. W. Harwood, F. M. Council, and M. S. Griffith. Estimating Safety by the Empirical Bayesian Method: A Tutorial. Transportation Research Record 1784, Transportation Research Board, National Research Council, Washington, D.C., 2002, pp. 126-131.
38. Hauer, E., and J. GBamfo. Two Tools for Finding what Function Links the Dependent Variable to the Explanatory Variables. In Proceedings of the ICTCT 1997 Conference, Lund, Sweden, 1997.
39. F. Council, E. Saloshnja, T. Miller, and B. Persaud. Crash Cost Estimates by Maximum Police-Reported Injury Severity within Selected Crash Geometries. Report No. FHWA-HRT-05-051. Federal Highway Administration, U.S. Department of Transportation, Washington, D.C., October 2005.
40. Lord, D. S.R. Geedipally, B.N. Persaud, S.P. Washington, I. van Schalkwyk, J.N. Ivan, C. Lyon, and T. Jonsson. Methodology to Predict the Safety Performance of Rural Multilane Highways. NCHRP Web-Only Document 126. TRB, National Research Council, Washington, DC. February 2008.
41. JHK & Associates. Traffic Safety in Highway Construction Zones “Enhanced Enforcement Services.” Prepared for California Department of Transportation, Sacramento, CA, November 1990.
84
42. Fontaine, M.D. and P.J. Carlson. Evaluation of Speed Displays and Rumble Strips at
Rural Maintenance Work Zones. In Transportation Research Record 1745, TRB, National Research Council, Washington, DC, 2001, pp. 627-38.
43. Harkey, D.L., R. Srinivasan, J. Baek, F.M. Council, K. Eccles, N. Lefler, F. Gross, B. Persaud, E. Hauer, and J. Bonneson. Accident Modification Factors for Traffic Engineering and ITS Improvements. NCHRP Report 617. TRB, National Research Council, Washington, DC, 2008.
85
APPENDIX A: WORK ZONE INTRUSION COUNTERMEASURES
IMPLEMENTATION GUIDELINES

86
INTRODUCTION
Vehicle intrusion crashes in highway work zones injure both vehicle occupants and workers, and so are of concern to both the California Department of Transportation (Caltrans) and highway contractors. Whereas efforts to warn workers of a vehicle intrusion have existed for some time, less consideration has been given to efforts that reduce the frequency of intrusions in the first place. This document provides guidance on which work zone intrusion countermeasures are most appropriate for a given set of roadway conditions and planned work zone activities. The guidance provided herein is based on research conducted under Caltrans Contract 65A0248, Errant Motorists’ Intrusions into Highway Work Zones. The methodology and results of the analyses conducted to develop this guidance is documented in the final technical report (1).
OVERVIEW OF WORK ZONE INTRUSION CRASHES
Based on the results of the New York State Department of Transportation (NYSDOT) database analysis and telephone surveys of Caltrans and highway contractor personnel in California, a number of insights into the frequency, characteristics, and crash sequences that comprise vehicle intrusion crashes at California work zones can be obtained. For example:
• Intrusion crashes make up a relatively small portion of crashes at work
zones(7.5 percent of traffic crashes that occur during daytime work operations, 12.4 percent of traffic crashed during nighttime work operations.
• Although intrusion crashes comprise a greater proportion of nighttime crashes than daytime crashes, most of the intrusion crashes that do occur (69.9 percent) happen during daytime work operations.
• The biggest share (58.7 percent) of vehicle intrusion crashes occurs at lane closure operations. Intrusion crashes also occur at mobile operations, flagging operations, and during traffic control set-up and removal activities, but each of these make up less than 10 percent of the intrusion crashes.
• When intrusions crashes occur, they most often involve collisions with work vehicles/equipment or work materials/debris; only about 17 percent of intrusion crashes typically involve a collision with a highway worker.
• A significant portion of intrusion crashes are the result of deliberate driver decisions and actions to enter the work area. The relative frequency of such deliberate events differs by type of work operation in place, but ranges from 22 to 63 percent of all intrusion crashes occurring at those types of operations.
Table 1 shows the main work zone intrusion crash sequences that occur. Mobile operations are activities that move continuously or intermittently along the roadway (including traffic control set-up and removal activities), whereas stationary activities include lane closure and flagging operations. The majority of intrusion crashes in mobile operations occur when a driver fails to recognize the slower speed of the work vehicle, when a driver enters between the work vehicles in a convoy, or when a driver veers out of the travel lane onto the shoulder where work is occurring. Similarly, almost one-fourth of intrusion crashes in stationary operations occur when a driver fails to recognize slowed or stopped traffic upstream or within a lane
87
closure. In addition, a large portion of intrusion crashes in stationary operations can be attributed to drivers deliberately choosing to enter the close lane and impaired drivers.
Table 1. Work Zone Intrusion Crash Sequences for Mobile and Stationary Operations.
Type of
Work Operation Work Zone Intrusion Crash Sequence (Percent of Category)
Mobile Driver fails to recognize slower speed of work vehicle and strikes work vehicle (29.4%) Driver enters between work vehicles in a convoy and strikes worker or work vehicle (23.5%) Driver veers out of travel lane and strikes worker or work vehicle on shoulder (23.5%) Driver attempts to pass work vehicle on shoulder (5.9%) Driver loses control and strikes worker or work vehicle in lane (5.9%) Driver swerves into work convoy to avoid impacting rear-end collision adjacent to work convoy (5.9%) Driver strikes traffic control device, which then flies into work area and strikes worker (5.9%)
Stationary Driver deliberately decides to enter the closed lane (27.0%) Driver fails to recognize slowed or stopped traffic, collision or collision avoidance results in driver entering the closed lane (23.3%) Impaired driver enters closed lane (17.6%) Driver loses control and enters closed lane (7.5%) Driver fails to recognize lane closure and enters taper and buffer space (6.9%) Driver enters closed lane due to improper setup of channelizing devices (4.4%) Lane change by adjacent driver forces another driver into the closed lane (3.8%) Driver follows work vehicle into work area (3.8%) Driver swerves to avoid debris and enters closed lane (1.9%) Driver uncertain of correct travel path or believes closed lane is open and inadvertently enters the closed lane (1.9%) Drivers enters the roadway in the wrong direction and enters closed lane at the downstream end (1.9%)
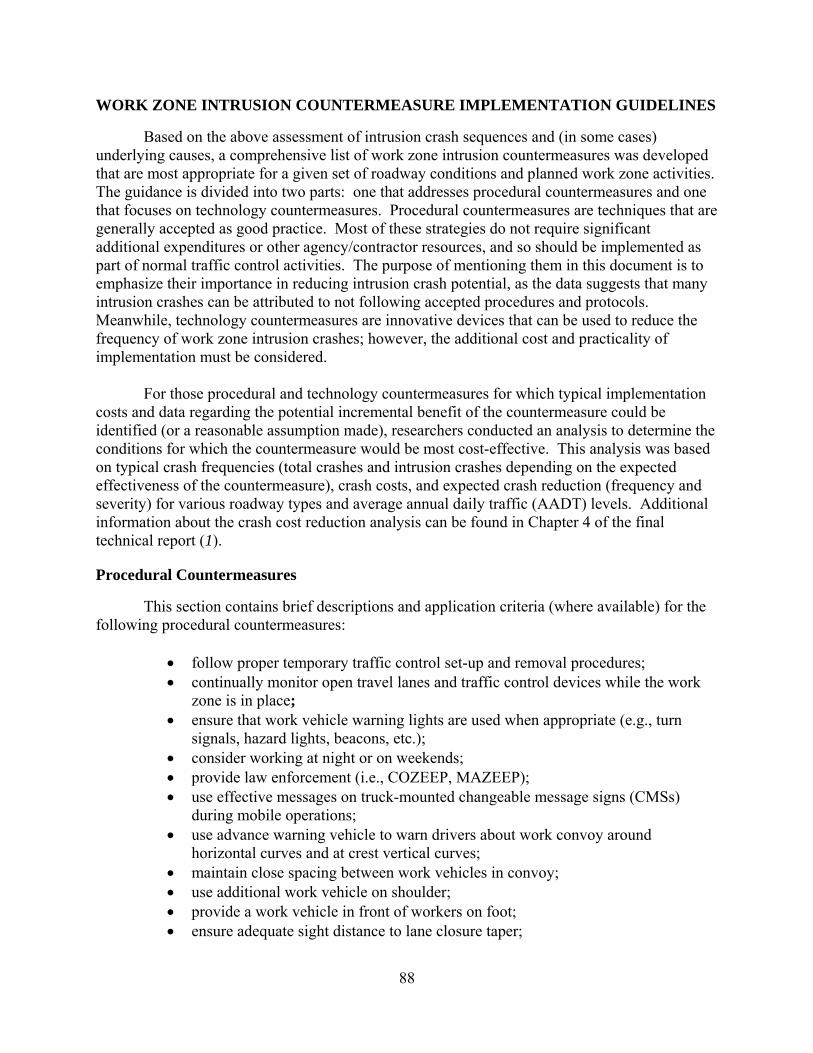
88
WORK ZONE INTRUSION COUNTERMEASURE IMPLEMENTATION GUIDELINES
Based on the above assessment of intrusion crash sequences and (in some cases) underlying causes, a comprehensive list of work zone intrusion countermeasures was developed that are most appropriate for a given set of roadway conditions and planned work zone activities. The guidance is divided into two parts: one that addresses procedural countermeasures and one that focuses on technology countermeasures. Procedural countermeasures are techniques that are generally accepted as good practice. Most of these strategies do not require significant additional expenditures or other agency/contractor resources, and so should be implemented as part of normal traffic control activities. The purpose of mentioning them in this document is to emphasize their importance in reducing intrusion crash potential, as the data suggests that many intrusion crashes can be attributed to not following accepted procedures and protocols. Meanwhile, technology countermeasures are innovative devices that can be used to reduce the frequency of work zone intrusion crashes; however, the additional cost and practicality of implementation must be considered.
For those procedural and technology countermeasures for which typical implementation
costs and data regarding the potential incremental benefit of the countermeasure could be identified (or a reasonable assumption made), researchers conducted an analysis to determine the conditions for which the countermeasure would be most cost-effective. This analysis was based on typical crash frequencies (total crashes and intrusion crashes depending on the expected effectiveness of the countermeasure), crash costs, and expected crash reduction (frequency and severity) for various roadway types and average annual daily traffic (AADT) levels. Additional information about the crash cost reduction analysis can be found in Chapter 4 of the final technical report (1).
Procedural Countermeasures
This section contains brief descriptions and application criteria (where available) for the following procedural countermeasures:
• follow proper temporary traffic control set-up and removal procedures; • continually monitor open travel lanes and traffic control devices while the work
zone is in place; • ensure that work vehicle warning lights are used when appropriate (e.g., turn
signals, hazard lights, beacons, etc.); • consider working at night or on weekends; • provide law enforcement (i.e., COZEEP, MAZEEP); • use effective messages on truck-mounted changeable message signs (CMSs)
during mobile operations; • use advance warning vehicle to warn drivers about work convoy around
horizontal curves and at crest vertical curves; • maintain close spacing between work vehicles in convoy; • use additional work vehicle on shoulder; • provide a work vehicle in front of workers on foot; • ensure adequate sight distance to lane closure taper;

89
• use dual advanced signing in advance of lane closures; • use overhead CMSs to warn drivers of upcoming or current work zone conditions; • use larger channelizing devices; • provide advance notice of work activity, alternate routes, closure location, and
closure duration; • use closer-spaced or continual traffic control devices; • use transverse traffic control devices; • limit the length of lane closures to avoid blocking ramps or driveways; • implement lane change restrictions; • reconfigure work area access point; • alter internal traffic control procedures to prevent truck slow-down in active travel
lane; and • use a downstream spotter.
Some of these countermeasures are applicable to all work zones, while others are only applicable to either mobile or stationary operations. While most of these countermeasures are generally accepted as good practice and may even be currently used by Caltrans, data suggests that many intrusion crashes can be attributed to not following accepted procedures and protocols. Thus, these procedural strategies are discussed in this guidance document to emphasize their importance in reducing intrusion crash potential.
Most of these strategies do not require significant additional expenditures or other
agency/contractor resources, and so should be implemented as part of normal traffic control activities. For a few of the procedural countermeasures, researchers were able to determine conditions for which the countermeasure would be most cost-effective.
Following Proper Traffic Control Device Set-Up and Removal Procedures
The intrusion data indicate that drivers can become confused by temporary traffic control that is only partially set or is being changed as they pass by and inadvertently move into a closed travel lane or work activity area. To avoid driver confusion, proper temporary traffic control set-up and removal procedures should be followed at all times. Periodic reviews of traffic control crews should be made to ensure that they are adhering to established protocols, such as:
• putting out advance warning signs first, • not running across travel lanes to put out signs, and • picking up channelizing devices in reverse order of installation.
Continually Monitoring Open Travel Lanes and Traffic Control Devices
In a small number of the lane closure intrusion crashes, debris in the open travel lane caused drivers to swerve into the closed lane. In addition, careless placement or movement of a traffic control device into an open lane can also lead to errant motorist behavior and intrusion into a closed travel lane. Therefore continuous patrolling and monitoring of the work zone should occur to ensure that debris or other road conditions do not present hazards for passing motorists.
90
Ensure That Work Vehicle Warning Lights are Used When Appropriate
Some intrusion crashes result from drivers following a work vehicle into the work area. Emphasis should be placed on work vehicle operators to following standard operational procedures when entering work areas and use turn signals, hazard lights, and beacons to provide additional information for drivers to anticipate the upcoming maneuvers of the work vehicle. Failure to activate these devices for this purpose invites indecision and confusion by motorists. In cases where the hazard lights and beacons are already activated because the vehicle is traveling slowly, activation of the turn signal is even more important.
Consider Working at Night or On Weekends
Over 50 percent of all intrusion crashes occurred because a driver failed to recognize slowed or stopped traffic within or upstream of a lane closure or the slow speed of a mobile work convoy. When possible, the schedule of work should be reviewed to determine if the work can be performed at night and/or over weekend periods when traffic volumes may be lower and such slowdowns are less likely. The following National Cooperative Highway Research Program (NCHRP) documents are useful resources to review when considering night work:
• NCHRP Report 475: A Procedure for Assessing and Planning Nighttime
Highway Construction and Maintenance (2); • NCHRP Report 476: Guidelines for Design and Operation of Nighttime Traffic
Control for Highway Maintenance and Construction (3); and • NCHRP Report 627: Traffic Safety Evaluation of Nighttime and Daytime Work
Zones (4).
Provide Law Enforcement
The provision of enforcement has been shown to consistently reduce vehicle speeds when located within work zones, and the provision of enforcement in work zones has been associated with a substantial (20 percent or more) reduction in all types of work zone crashes. It is expected that enforcement can likewise reduce the likelihood of intrusion crashes. Although enforcement use does involve a fairly substantial hourly cost to the highway agency, the benefits appear to outweigh costs once traffic volumes reach moderate levels. Based strictly on an expected crash cost reduction (1), enforcement use in work zones can be justified on freeways and divided multilane highways during daytime operations when the AADT exceeds 20,000 vehicles per day (vpd) and at nighttime operations when the AADT exceeds 50,000 vpd. Because enforcement can also provide other types of benefits not included explicitly in these computations, its use at even lower traffic volume levels may be justifiable in some instances.
Use Effective Messages on Truck-Mounted Changeable Message Signs during Mobile Operations
Maintenance work is often accomplished using mobile operations which consist of one or more vehicles that move along the road intermittently or continuously at very slow speeds relative to the normal traffic stream. Even though Caltrans currently uses an advance warning vehicle, shadow vehicle, and in some instances truck-mounted CMSs (all of which are considered intrusion countermeasures) (5), 20 percent of the work zone intrusions in California
91
occur in mobile operations. These intrusions typically involve vehicles which strike the truck-mounted attenuator (TMA) on the back of the shadow vehicle (i.e., the first work vehicle encountered by drivers) or drivers pulling between the work vehicles (i.e., entering the work convoy).
Truck-mounted CMSs have superior target value and thus possibly provide more advance
warning time to drivers than static signing. However, the amount and order of information presented, the legibility distance of the message, and the content of the message all impact the effectiveness of these devices. Even though Caltrans currently uses truck-mounted CMSs, the messages displayed may not be optimum for warning drivers that they are approaching a slow moving work convoy (driver misjudgment of the work vehicle’s slower speed appeared to be responsible for approximately 30 percent of the mobile operation intrusions) or for discouraging drivers from entering between the work vehicles (approximately 25 percent of the mobile operation intrusions were of this type). The following principles should be followed when designing and displaying messages on truck-mounted CMSs:
• The character heights typically used on truck-mounted CMS only provide enough
sight distance to allow 2 units-of-information (or phrases) to be displayed in a message.
• For most applications, the two critical units that should be displayed on a truck-mounted CMS are a problem/roadwork descriptor and an action statement.
• A message cannot contain more than 2 phases. • Message elements should not flash or scroll. • Abbreviations should be used when necessary to keep the message to two phases,
and should be used in accordance with accepted practices. Specific recommended messages for use on truck-mounted CMSs during mobile
operations are shown in Table 2 (6). These messages are defined by the type of work, road type, and identified concerns being addressed by the message.
Use Advance Warning Vehicle to Warn Drivers about Work Convoy around Horizontal Curves and at Crest Vertical Curves
When used, the advance warning vehicle needs to be located far enough upstream of the shadow vehicle to allow drivers time to complete the necessary actions prior to encountering the work convoy. In mountainous and rolling terrain locations where there is limited sight distance, it is important that the driver of the advance warning vehicle continually monitor the spacing to the convoy. The advance warning vehicle should lag back around horizontal curves and at the peak of a crest vertical curve until the work convoy progresses far enough down the roadway that drivers have adequate sight distance of the convoy once they top the hill. The advance warning vehicle can then proceed quickly down the curve to catch up with the convoy.
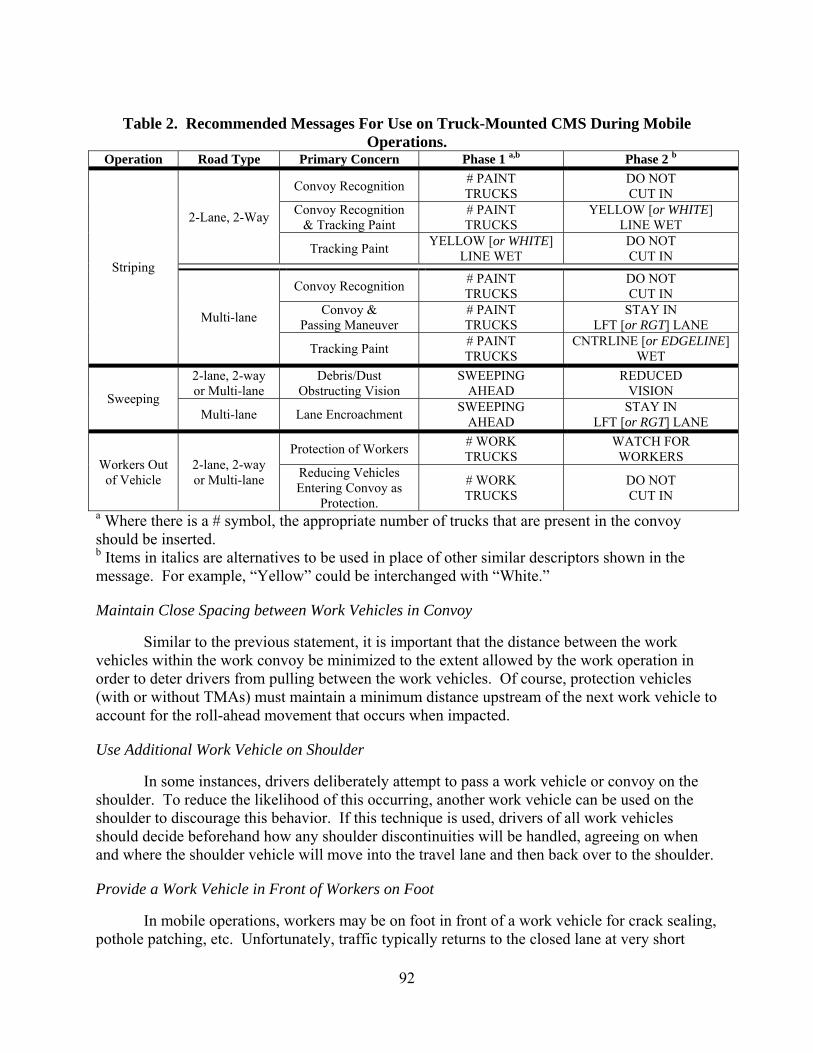
92
Table 2. Recommended Messages For Use on Truck-Mounted CMS During Mobile
Operations. Operation Road Type Primary Concern Phase 1 a,b Phase 2 b
Striping
2-Lane, 2-Way
Convoy Recognition # PAINT TRUCKS
DO NOT CUT IN
Convoy Recognition & Tracking Paint
# PAINT TRUCKS
YELLOW [or WHITE] LINE WET
Tracking Paint YELLOW [or WHITE] LINE WET
DO NOT CUT IN
Multi-lane
Convoy Recognition # PAINT TRUCKS
DO NOT CUT IN
Convoy & Passing Maneuver
# PAINT TRUCKS
STAY IN LFT [or RGT] LANE
Tracking Paint # PAINT TRUCKS
CNTRLINE [or EDGELINE] WET
Sweeping
2-lane, 2-way or Multi-lane
Debris/Dust Obstructing Vision
SWEEPING AHEAD
REDUCED VISION
Multi-lane Lane Encroachment SWEEPING AHEAD
STAY IN LFT [or RGT] LANE
Workers Out of Vehicle
2-lane, 2-way or Multi-lane
Protection of Workers # WORK TRUCKS
WATCH FOR WORKERS
Reducing Vehicles Entering Convoy as
Protection.
# WORK TRUCKS
DO NOT CUT IN
a Where there is a # symbol, the appropriate number of trucks that are present in the convoy should be inserted. b Items in italics are alternatives to be used in place of other similar descriptors shown in the message. For example, “Yellow” could be interchanged with “White.”
Maintain Close Spacing between Work Vehicles in Convoy
Similar to the previous statement, it is important that the distance between the work vehicles within the work convoy be minimized to the extent allowed by the work operation in order to deter drivers from pulling between the work vehicles. Of course, protection vehicles (with or without TMAs) must maintain a minimum distance upstream of the next work vehicle to account for the roll-ahead movement that occurs when impacted.
Use Additional Work Vehicle on Shoulder
In some instances, drivers deliberately attempt to pass a work vehicle or convoy on the shoulder. To reduce the likelihood of this occurring, another work vehicle can be used on the shoulder to discourage this behavior. If this technique is used, drivers of all work vehicles should decide beforehand how any shoulder discontinuities will be handled, agreeing on when and where the shoulder vehicle will move into the travel lane and then back over to the shoulder.
Provide a Work Vehicle in Front of Workers on Foot
In mobile operations, workers may be on foot in front of a work vehicle for crack sealing, pothole patching, etc. Unfortunately, traffic typically returns to the closed lane at very short
93
distance beyond the perceived end of the work area. An effective way to extend the work area length in front of workers on foot is to add another work vehicle downstream just past the work crew. The work vehicle should be immediately in front of the workers, and the shadow vehicle should stay back just far enough to provide sufficient roll-ahead distance before reaching the workers. If these vehicles are properly spaced, the distance between the shadow and lead vehicles would be small enough to discourage a passing vehicle from moving into the work area, yet would be long enough to keep the shadow vehicle from running into the workers should an approaching vehicle strike the back of the shadow vehicle.
Ensure Adequate Sight Distance to the Lane Closure Taper
As part of the initial patrol through the work zone, sight distance to the lane closure taper should be checked using speeds at which vehicles normally travel on that roadway. Early detection of sight distance issues may prevent intrusions, particularly where traffic control devices may simply be extended beyond upstream horizontal or vertical curvature. The amount of sight distance should always exceed the stopping sight distance for the facility. However, on higher-volume roadways, it is desirable to provide more than this amount to allow extra time for vehicles in the closed lane to find suitable gaps in the open lane traffic stream before reaching the merging taper.
Use Dual Advanced Signing in Advance of Lane Closures
Currently, Caltrans requires dual advance warning signing (i.e., warning signs on both sides of the roadway) for lane closures on freeways and expressways when less than half of the available lanes remain open to traffic (i.e., going from three lanes to one lane open) (5). However, dual advance warning signing may also be useful under less restrictive conditions, as it can provide a better opportunity for drivers in the left lane to see advance warning signs that might otherwise be blocked from their view by traffic in the right lane, particularly on a roadway with higher volumes of truck traffic. In addition, dual signing notifies drivers in the open travel lanes of the lane closure in hopes that they will remain in the open travel lanes and not enter the closed lane upstream of the lane closure.
Use Overhead CMSs to Warn Drivers of Upcoming or Current Work Zone Conditions
Overhead CMSs, which are more likely to be visible from all traffic lanes, should be used whenever available upstream of a work zone to warn drivers of upcoming or current conditions. Field personnel should make sure that the transportation management center (TMC) operators who have responsibility for the CMS are aware of the work zone and have whatever information needed (e.g., which lane is closed, how long the work zone will be in place, etc.) to create and display a useful, effective message for approaching motorists.
Use Larger Channelizing Devices
The purpose of using larger channelizing devices (i.e., drums instead of cones) is that the larger devices can present a more imposing appearance at a lane closure and reduce the potential for vehicles to run into the merging taper or to inadvertently enter into the closed lane once into the actual activity area. This strategy does appear to be justifiable at work operations involving temporary lane closures (either day or night) once the AADT reaches approximately 10,000 vpd,
94
regardless of the type of roadway. For work operations that do not involve temporary lane closures, it is assumed that larger devices would be used on the shoulder or off of the paved travel surface, if necessary, and so there would not be any incremental benefit.
Provide Advance Notice of Work Activity, Alternate Routes, Closure Location, and Closure Duration
Unfortunately, a substantial proportion of drivers deliberately choose to enter a closed lane or ignore a flagger’s instruction to stop, which leads to 27 percent of the intrusion crashes that occur. It is hypothesized that many of these drivers make such decisions because they are in a hurry or are unaware of how they should reach their intended destination (an exit, intersection, or driveway). Providing advance notification of lane closures, detours, alternative routes, etc. via overhead CMS, portable changeable message signs (PCMSs), highway advisory radio (HAR), or other media will allow drivers to make more informed decisions (e.g., take an alternate route, avoid roadway during lane closure times, etc.) and thus potentially reduce work zone intrusions. If no alternate routes are available, information regarding the lane closure duration and location can still be provided to prepare the driver about the change in travel patterns that will be required.
Use Closer-Spaced or Continual Traffic Control Devices
Closer spacing of traffic control devices than is currently required is intended to present a more imposing closure to motorists approaching and passing by a closed section of roadway. It is believed that closer spacing makes it more difficult for those attempting to deliberately intrude into the work area and makes the merging taper more visually detectable to approaching motorists, reducing the potential for drivers to pass through the taper and into the work activity area. The hourly costs of this strategy are fairly small, and so can be justified when work activities are occurring on all types of roadways with about 10,000 vpd (day or night). During periods of work inactivity, it appears that this strategy can also be cost-effective when the AADT is about 50,000 vpd or higher (and thus more appropriate as a countermeasure on multilane facilities).
In locations where deliberate intrusions into the lane closure are unusually high, it may be
desired to provide continuous delineation (i.e., no spacing between traffic control devices). This may be accomplished with longitudinal channelizing devices (LCDs), which can be connected together to form a solid line of traffic control devices. While LCDs look similar to water-filled barrier, they do not provide positive protection. As would be expected, it will be more expensive to create a wall using LCDs, so they are most appropriate for conditions in which a substantial intrusion problem is occurring or anticipated (such as when a high-volume exit ramp may be temporarily closed during a paving operation or maintenance activity, for example).
Use Transverse Traffic Control Devices
Another strategy to help curtail deliberate attempts to use closed travel lanes and/or reduce inadvertent travel in the closed lane is the use of periodic transverse channelizing devices or barricades (5). Currently, Caltrans procedures are to use these devices in closed lanes on freeways and expressways every 2000 feet. Researchers examined the cost-effectiveness of decreasing that spacing to 750 feet, which is recommended elsewhere in the literature (3).
95
Presently, the incremental cost to reduce the spacing would be less than $1.00 per hour per mile. At such a small incremental cost, this strategy can be justified at all freeway work zones that involved closed travel lanes, and could be expanded to other types of multilane highways, once the AADT reaches 3,000 vpd.
Limit the Length of Lane Closures to Avoid Blocking Ramps or Driveways
When feasible, the length of a lane closure should be as short as feasible in order to reduce delay and decrease the number of access points blocked, thereby reducing the need for drivers to deliberately enter the lane closure.
Implement Lane Change Restrictions
A small portion of the lane closure intrusion events can be attributed to vehicle conflicts that occur when vehicles change lanes adjacent to the closed lane, and force the vehicle next to the closed lane into the work area. In locations where more than one travel lane remains open, lane changing restrictions (i.e., not allowing vehicles to change lanes while traveling through the work zone) should be used to reduce vehicle conflicts and thus potentially decrease the chance of an intrusion.
Reconfigure Work Area Access Point
Typically, work area access points are short openings with little or no area for trucks to decelerate or accelerate. Therefore, drivers sometimes fail to recognize the slow speed of work vehicles trying to enter or exit the work area, and are forced to swerve into the work area to avoid a collision. In addition, drivers occasionally follow the trucks into the work area on purpose, failing to recognize that they are following a work vehicle off of the travel lanes. In some of these situations, it may be that the work area access points are located such that they appear to be a continuation of the expected travel path. Reconfiguring the access point to make it more apparent that the construction entrance is not the intended travel path should be considered in order to reduce the chance that drivers will inadvertently follow the work trucks into the work area.
Alter Internal Traffic Control Procedures to Prevent Truck Slow-Down in Active Travel Lane
In addition to reconfiguring the access point, it may be possible to alter the internal traffic control plan procedures (i.e., the coordination of the flow of construction vehicles, equipment, and workers), to allow work trucks to enter and exit the work area at higher speeds; thus, alleviating the need for them to decelerate and accelerate in an active travel lane.
Use a Downstream Spotter
Occasionally, drivers enter the roadway going in the wrong direction and enter the closed lane from the downstream end. This can especially be problematic in work activity areas located near entrance or exit ramps. Detection of this type of event by a downstream spotter (i.e., a worker that understands the potential for this type of intrusion event and can keep a look out for its occurrence) may enhance worker safety. Although the intrusion may not be prevented, the

96
spotter may be able to provide a warning to other workers or possibly stop the intruding vehicle before any injuries occur.
Technologies
In addition to the procedural strategies previously discussed, technologies can be used to further reduce the frequency work zone intrusion crashes. For each of the following technologies, researchers developed guidance sheets that provide a brief description of each technology, its effectiveness (if known), general cost information, application criteria, and other considerations:
• automated traffic control device set-up and removal technology, • drone radar devices, • flagger replacement devices, • sequential warning light system, • speed display trailers, • steel (portable) barrier, • temporary transverse rumble strips, • truck-mounted positive protection systems, • construction entrance signing, • “DO NOT FOLLOW” signing, • early merge system, • upstream queue end warning, and • automated speed enforcement technology.
For the first eight of these technology countermeasures, researchers were able to determine conditions for which the countermeasure would be most cost-effective. Unfortunately, some of the technology countermeasures cannot easily be justified on the basis of their crash cost reduction potential. However, the following limitations of the analysis must be considered.
• Data were very limited in terms of the effectiveness of most countermeasures in crash
reductions and so had to be assumed based on engineering judgment. • Cost values for many of the countermeasures were unavailable and had to be assumed
(along with service lives) in order to come up with a per-hour, per-mile estimate. Considering these limitations and the fact that these technologies may be appropriate for other reasons in certain situations (e.g., work zones where a higher frequency of intrusion crashes are expected to occur or are occurring), researchers included them in this guidance document.
Due to highly variable implementation costs and lack of adequate data regarding the
potential incremental benefit of the countermeasure, researchers could not assess the conditions for which the last five technology countermeasures would be most cost-effective. Thus, general application criteria are discussed.

97
AUTOMATED TRAFFIC CONTROL DEVICE SET-UP AND REMOVAL TECHNOLOGY Description: The use of automated traffic control device set-up and removal equipment keeps workers from standing in the active travel lane during these operations or from leaning out over the work vehicle to place or pickup devices. Although a driver may still strike the automated vehicle in the active travel lane, the risk of injury and injury severity could potentially be reduced by having the worker off the pavement. The automated cone-setting truck concept was initially developed in California, and Caltrans is currently using cone-setting trucks on a limited basis. Effectiveness: Automated traffic control device technology is viewed positively since it does prevent workers from being on foot during traffic control device set-up and removal. There also might be potential efficiency savings with some of the technologies by reducing the number of workers required to put out and pick up traffic control devices. Overall, the effectiveness of the technology is believed to be minor in terms of reducing intrusion crash severity and costs (the frequency of vehicle crashes is assumed to remain the same). Cost: The cost to purchase a cone-setting truck ranges from $36,000 to $110,000 for the vehicle and machine. Recognizing that this technology is used for only a limited (i.e., 15 minutes or less) amount of time at the beginning and again at the end of a work shift, researchers estimated the pro-rated cost of its use during set up and take down to be equivalent to about $3500 per hour. Suggested criteria: Based on an intrusion crash cost reduction analysis, it is difficult to justify the use of automated traffic control device technology on can be justified under any conditions. However, the potential for reducing worker backovers and runovers by work equipment may justify its use under highest-risk working conditions. Other considerations:
• Maintenance costs also need to be considered in decisions whether to use this technology. • Potential for worker(s) to be ejected from automated vehicle if the vehicle is struck
should be evaluated.
98
DRONE RADAR Description: Drone radar devices emit radio signals that activate radar detectors used by the traveling public. Therefore, drone radar can be used to imply the presence of enforcement in the work zone area. These devices are commercially available and are typically mounted on work vehicles, arrow panels, or changeable message signs. Effectiveness: Drone radar reduces the number of vehicles traveling at excessive speeds (i.e., 10 mph or more over the speed limit) by 6 to 33 percent. However, drone radar only typically reduces mean vehicle speeds by 2 to 3 mph. This device may also effectively alert drivers to an upcoming change in the highway environment when their radar detector is activated. Cost: Drone radar devices cost approximately $400 per unit. Solar power units can be purchased for an additional cost. Suggested Criteria: Based on a crash cost reduction analysis, drone radar devices are justifiable at work zones during periods of daytime work activity (with or without temporary lane closures present) once the average annual daily traffic reaches 10,000 vehicles per day. During nighttime work operations, the average annual daily traffic needs to be somewhat higher to be cost-effective (e.g., 40,000 vehicles per day). Other considerations:
• Drone radar devices should be removed during periods of inactivity at the work zone, so that drivers do not become accustomed to their presence and disregard the signal.

99
FLAGGER REPLACEMENT DEVICES Description: In lieu of a flagger, several devices can be used to control the right-of-way when a lane closure is needed on a two-lane, two-way road. Automated flagger assistance devices (AFADs) are portable traffic control systems designed to be operated by a flagger located off the roadway. There are two types of AFADs. One type uses a remotely controlled STOP/SLOW sign to control the right-of-way, while the other type utilizes remotely controlled red and yellow lenses and a gate arm to control right-of-way.
Portable traffic signals are traffic signals mounted on trailers that can be used to control the right-of-way in a work zone. Communications between the signals are provided by hard wiring, radio frequency transceiver, or by preset timing. Thus, portable traffic signals can actually replace flaggers; thereby, removing flaggers from direct exposure to approaching traffic and allowing flaggers to perform other critical work tasks.
Effectiveness: AFADs allow flaggers to be positioned off the roadway away from moving traffic; thereby, reducing the likelihood of a flagger getting struck by a vehicle. AFADs might also increase the sight distance to the lane closure. However, there are concerns that AFADs may confuse drivers or garner less respect and thus result in decreased compliance. Replacing flaggers with portable traffic signals is expected to eliminate crashes where vehicles strike flaggers and improve the efficiency of the operation. Appropriate timing is critical to the success of portable traffic signals. Excessive wait time can lead to driver confusion and frustration, possibly resulting in decreased compliance. Cost: An AFAD costs between $7500 and $13,500 (dependent upon system type). A portable traffic signal costs between $28,000 and $80,000 (dependent upon system type and additional components desired).
100
Selection criteria: These two technologies would be expected to address only the flagger-involved intrusion crashes at the end locations of alternating one-lane operations on two-lane highways. In addition, costs of these technologies can be fairly high. Certainly, the use of portable traffic signals at many locations is based on reduced flagger labor costs to continuously staff a work zone for many days, and so its potential as an intrusion crash countermeasure is a secondary benefit. For AFADs, however, safety is a primary decision criteria (although some locations may be effectively operated by two AFADs and a single flagger positioned to see both ends of the work zone). Those considering the use of AFADs should consult the discussion in the technical report (1) about assessing implementation costs and comparing that value to the potential crash cost reduction that could be achieved. At the low range of costs for such devices, it does appear that they can be justifiable once AADTs reach about 15,000 vpd. Other considerations:
• AFADs are included in the recently released 2009 Manual on Uniform Traffic Control Devices (MUTCD).
• AFADs shall only be used in situations where there is only one lane of approaching traffic in the direction to be controlled.
• AFADs should not be used for long-term stationary work. • AFADs must be operated by a qualified flagger and the flagger operating the AFAD
cannot leave the AFAD unattended at any time while the AFAD is controlling the right-of-way. However, AFADs can be remotely operated either by a single flagger, at one end of the lane closure or at a central location, or by two flaggers, one near each device’s location.
• Portable traffic signals are appropriate for use in longer term work zones, as well as some short-term operations.
• If a portable traffic signal malfunctions and switches to flashing red operation, drivers must be able to see whether there is another vehicle on the opposite approach.
101
SEQUENTIAL WARNING LIGHT SYSTEM Description: Lane closures require drivers to physically move out of a closed lane; thus, it is important to positively indicate the direction the driver should travel, especially at night when visibility is reduced and lane closures may not be expected. A sequential warning light system is comprised of a series of individual flashing warning lights that are attached to channelizing drums in the merging taper. The lights are synchronized to produce the perception of a light that repeatedly “moves” in a sequential manner from the beginning to the end of the merging. Effectiveness: Field studies at a nighttime work zone in Texas resulted in a 7 percent reduction in the number of passenger vehicles and a 12 percent reduction in the number of commercial vehicles in the closed lane 1000 ft upstream of the lane closure when the sequential warning light system was used. However, its effectiveness in terms of crash reductions is assumed to be limited, in that it attempts to reduce those crashes that occur because drivers do not recognize the lane is closed until they are too close to the merging taper. The potential does exist for the technology to increase driver attention somewhat and reduce other types of crashes farther into the work zone, but the potential for this to occur is not known. Cost: Each individual warning light costs approximately $150, so it would cost about $2000 to implement the system in a merging taper designed for 60 mph (13 lights). Batteries may be an additional cost. Selection criteria: Based on the device’s limited potential effectiveness, coupled with a fairly high hourly cost, implies that this technology could currently be justifiable only on higher volume facilities (i.e., AADTs of 75,000 or more) at night. Other considerations:
• Language allowing the use of sequential warning light systems was included in the recently released 2009 Manual on Uniform Traffic Control Devices (MUTCD).

102
SPEED DISPLAY TRAILERS Description: Speed displays are dynamic message signs that use radar to measure and record the speed of approaching vehicles. The measured speed and speed limit are then displayed to passing drivers in an effort to decrease speeds and increase compliance with the work zone speed limit. Speed displays mounted on trailers are portable and thus can be deployed at any roadside location that provides sufficient room. Effectiveness: Speed display trailers have been shown to reduce speeds by 2 to 10 mph and decrease the percent of vehicles exceeding the speed limit. These devices may also alert drivers to an upcoming change in the highway environment. However, minor potential effectiveness in reducing all types of work zone crashes, including intrusion crashes is expected. Speed display trailers are more effective at locations where the sign supports a clear and real need for a driver to reduce their speed or where the perception of regular enforcement exists. The effect of speed display trailers over time (especially if left at a location continuously and not enforced) is uncertain but believed to diminish as drivers become more accustomed to their presence in the work zone. Cost: Speed display trailers cost between $5500 and $20,000 (dependent upon the type of technology used and additional components desired) and can be leased for approximately $50 a week. Selected criteria: Based on a crash cost reduction analysis, speed display trailers can be justified on most types of roadways once traffic demands reach 10,000 vehicles per day or higher. Other considerations:
• When used, a plan should be established for moving the speed display trailers on a regular basis in order to keep them from losing their effectiveness over time.
• As roadways get wider, the angle at which vehicle speeds are being measured by the sign increases which introduces a measurement error into the system. In extreme cases, the reported speed on the trailer can be several miles an hour slower than the actual speed of the vehicle. Roadways with high traffic volumes are not particularly useful for speed display trailers, as there are too many vehicles in the range of the radar at any one time to establish a clear speed measurement. This results in erratic sign operation and a loss of effectiveness.
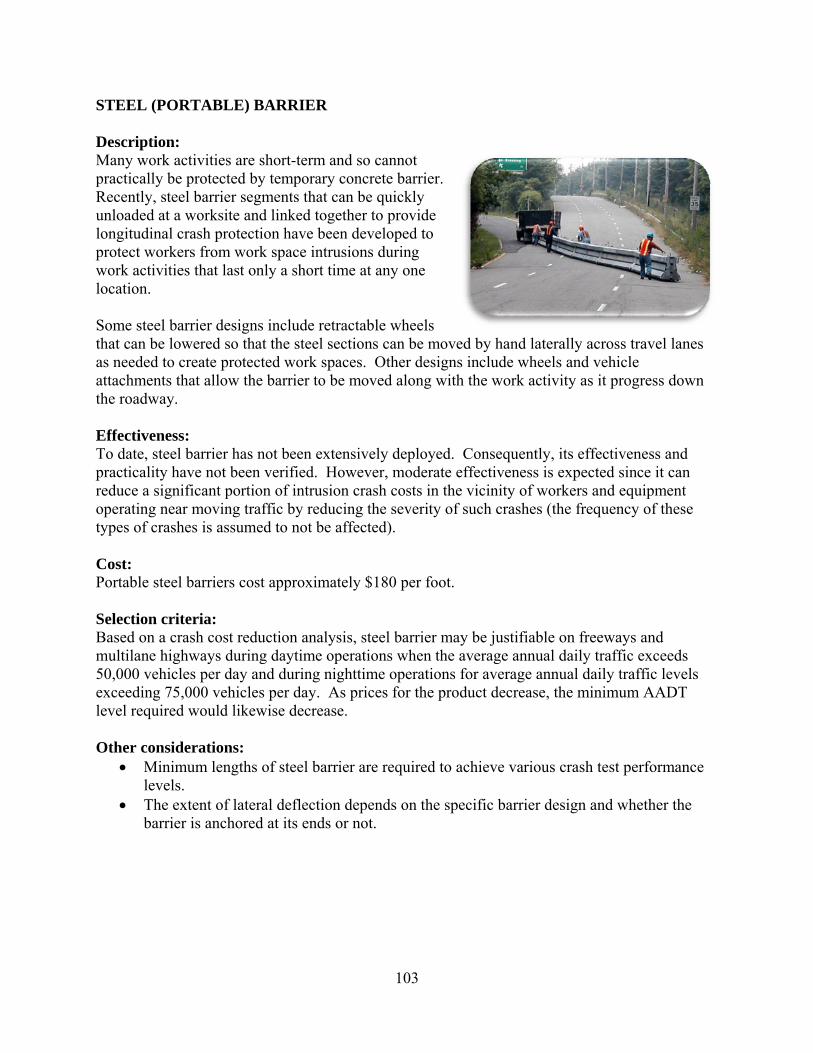
103
STEEL (PORTABLE) BARRIER Description: Many work activities are short-term and so cannot practically be protected by temporary concrete barrier. Recently, steel barrier segments that can be quickly unloaded at a worksite and linked together to provide longitudinal crash protection have been developed to protect workers from work space intrusions during work activities that last only a short time at any one location. Some steel barrier designs include retractable wheels that can be lowered so that the steel sections can be moved by hand laterally across travel lanes as needed to create protected work spaces. Other designs include wheels and vehicle attachments that allow the barrier to be moved along with the work activity as it progress down the roadway. Effectiveness: To date, steel barrier has not been extensively deployed. Consequently, its effectiveness and practicality have not been verified. However, moderate effectiveness is expected since it can reduce a significant portion of intrusion crash costs in the vicinity of workers and equipment operating near moving traffic by reducing the severity of such crashes (the frequency of these types of crashes is assumed to not be affected). Cost: Portable steel barriers cost approximately $180 per foot. Selection criteria: Based on a crash cost reduction analysis, steel barrier may be justifiable on freeways and multilane highways during daytime operations when the average annual daily traffic exceeds 50,000 vehicles per day and during nighttime operations for average annual daily traffic levels exceeding 75,000 vehicles per day. As prices for the product decrease, the minimum AADT level required would likewise decrease. Other considerations:
• Minimum lengths of steel barrier are required to achieve various crash test performance levels.
• The extent of lateral deflection depends on the specific barrier design and whether the barrier is anchored at its ends or not.
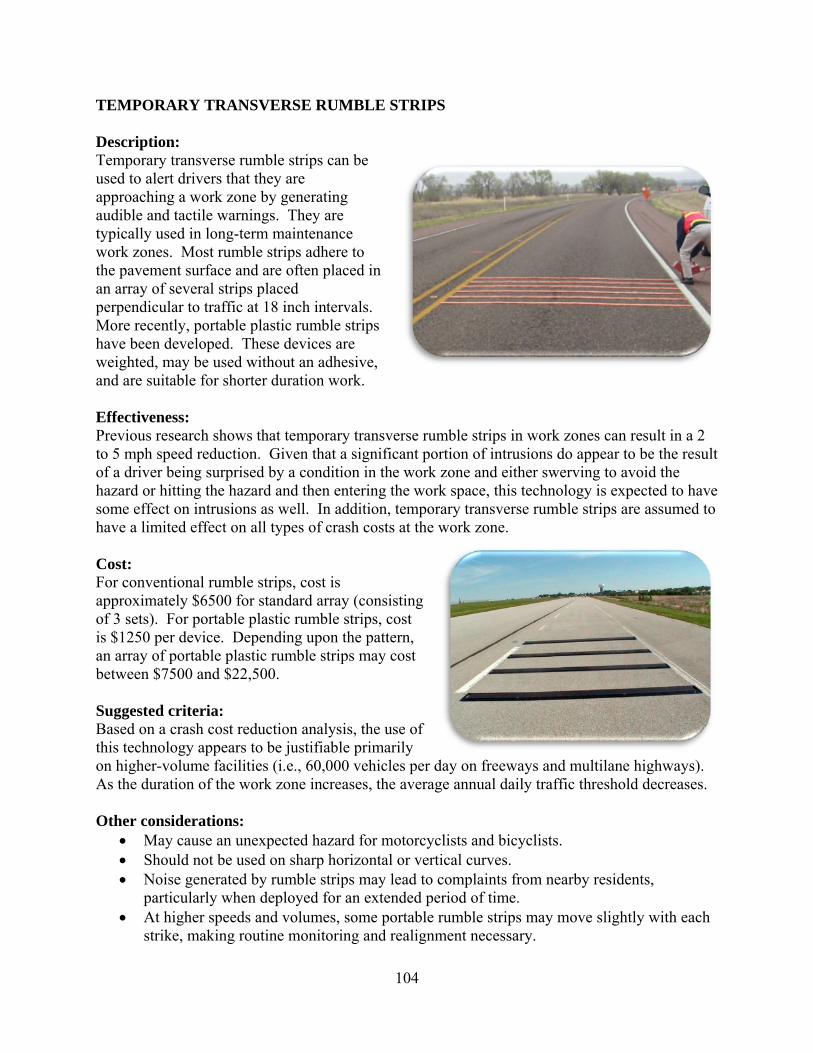
104
TEMPORARY TRANSVERSE RUMBLE STRIPS Description: Temporary transverse rumble strips can be used to alert drivers that they are approaching a work zone by generating audible and tactile warnings. They are typically used in long-term maintenance work zones. Most rumble strips adhere to the pavement surface and are often placed in an array of several strips placed perpendicular to traffic at 18 inch intervals. More recently, portable plastic rumble strips have been developed. These devices are weighted, may be used without an adhesive, and are suitable for shorter duration work. Effectiveness: Previous research shows that temporary transverse rumble strips in work zones can result in a 2 to 5 mph speed reduction. Given that a significant portion of intrusions do appear to be the result of a driver being surprised by a condition in the work zone and either swerving to avoid the hazard or hitting the hazard and then entering the work space, this technology is expected to have some effect on intrusions as well. In addition, temporary transverse rumble strips are assumed to have a limited effect on all types of crash costs at the work zone. Cost: For conventional rumble strips, cost is approximately $6500 for standard array (consisting of 3 sets). For portable plastic rumble strips, cost is $1250 per device. Depending upon the pattern, an array of portable plastic rumble strips may cost between $7500 and $22,500. Suggested criteria: Based on a crash cost reduction analysis, the use of this technology appears to be justifiable primarily on higher-volume facilities (i.e., 60,000 vehicles per day on freeways and multilane highways). As the duration of the work zone increases, the average annual daily traffic threshold decreases. Other considerations:
• May cause an unexpected hazard for motorcyclists and bicyclists. • Should not be used on sharp horizontal or vertical curves. • Noise generated by rumble strips may lead to complaints from nearby residents,
particularly when deployed for an extended period of time. • At higher speeds and volumes, some portable rumble strips may move slightly with each
strike, making routine monitoring and realignment necessary.

105
TRUCK-MOUNTED POSITIVE PROTECTION SYSTEMS Description: Many work activities move slowly or intermittently along the roadway, and so cannot be protected by temporary concrete barrier. Shadow vehicles with truck-mounted attenuators (TMAs) are typically used to protect workers on foot in mobile operations. However, these devices do not provide lateral impact protection. Recently, a few truck-mounted technologies have been developed to protect workers from lateral work space intrusions. One example is the Caltrans-developed Balsi Beam, a steel beam “cage” currently attached to a semi-tractor trailer cab that can be towed to a location and then deployed around a small area to protect a work crew on foot near moving traffic. Effectiveness: To date, the Balsi Beam and other similar devices have not been extensively deployed. Consequently, their effectiveness and practicality have not been verified. However, they are expected to have a moderate effect on intrusion crash costs, reducing the severity (but not frequency) of those vehicles intruding into the actual work space. Cost: The Balsi Beam and other similar devices cost between $171,000 and $250,000 to purchase. Suggested criteria: Based on an intrusion crash cost reduction analysis alone, it is difficult to justify truck-mounted positive protection systems under any volume conditions. Better information on service life and crash costs when the technology is deployed will be needed before a better estimate of appropriate deployment conditions can be made. Still, it is likely that agencies making use of this technology will do so primarily with risk reduction to its highway workers on foot as a priority, rather than as a strictly economic decision. Other considerations:
• The Balsi Beam and other similar devices cannot be moved continuously down the road while workers are within the protection area, nor can it be moved or extended laterally across lanes.

106
CONSTRUCTION ENTRANCE SIGNING Description: Sometimes drivers fail to recognize the slow speed of work vehicles trying to enter or exit the work area and must take evasive actions to avoid hitting the work vehicle. Static or dynamic construction entrance signing can be located near access points to warn drivers that a work vehicle is entering or exiting the travel lanes. Example messages include:
• “TRUCKS ENTERING ROADWAY/REDUCE SPEED,” • “TRUCKS ENTERING 1000 FT/BE PREPARED TO STOP,” and • “TRUCKS EXITING 2000 FT/DO NOT FOLLOW TRUCKS.”
Typically, these signs are displayed to drivers whether or not a truck is actually entering or exiting the work area. Work zone intelligent transportation systems may be used to activate messages on portable changeable message signs (PCMS) only when trucks are detected; thus, hopefully improving the driver’s trust of the message. Static signs with flashing beacons may also be used to display more real-time messages. When a truck is detected, the beacons would flash; otherwise the beacons would remain off. Effectiveness: Static and dynamic construction entrance signing can alert drivers to work vehicles that are slowly decelerating or accelerating in preparation to enter or exit the work area. Thus, construction entrance signing has the potential to decrease crashes involving work vehicles and secondary crashes upstream (i.e., rear-end crashes due to queuing). Providing real-time information allows drivers to associate the message with an actual event, increasing awareness and trust of the system. Cost: Static warning signs cost approximately $250 each. PCMS cost approximately $5500 each, but can be leased for approximately $11.00 an hour. An installed static sign assembly with flashing beacons costs approximately $2500 and radar vehicle detection systems cost approximately $6500. The cost of work zone intelligent transportation systems varies and is highly dependent upon the technology used.
No Acceleration Lane
HAUL ROAD
NOTE: Some temporary traffic control devices may have been omitted from this diagram for clarity purposes.
Vehicle Detection Systemactivates CMS warningon public roadway. Systemmay be radio control devicesoperated by the truck drivers.
E
OptionalSigning
OR

107
Suggested criteria: Due to highly variable implementation costs and lack of adequate data regarding the potential incremental benefit of the countermeasure, a cost-effectiveness assessment could not be conducted. However, some type of construction entrance signing should be considered at locations where work vehicles are expected to enter or exit the active travel lanes with little or no area for the vehicles to decelerate or accelerate, especially on high speed, rural roadways and if sight distance is limited. Other considerations:
• It is normally preferable to separate construction access and egress from high-speed travel lanes to avoid creating high-speed differentials between work vehicles and motorists. If such separation cannot be accomplished, improving driver awareness of the presence of exiting and entering work traffic is the next logical alternative.

108
“DO NOT FOLLOW” SIGNS Description: Sometimes drivers follow work vehicles into the work area, especially at night. Static or dynamic “DO NOT FOLLOW” signing can be located near construction entrances or on the back of work vehicles to warn drivers not to follow work vehicles into the construction area. Example messages include:
• “CONSTRUCTION VEHICLE DO NOT FOLLOW,” • “DO NOT FOLLOW INTO WORK AREA,” and • “TRUCKS EXITING 2000 FT/DO NOT FOLLOW TRUCKS.”
Work zone intelligent transportation systems may be used to activate messages on portable changeable message signs (PCMS) only when trucks are detected; thus, hopefully improving the driver’s trust of the message. Effectiveness: Static and dynamic “DO NOT FOLLOW” signs tell drivers not to follow work vehicles into the work area. Therefore, these signs have the potential to reduce vehicle intrusions into the work area and conflicts between drivers and workers. Providing real-time information allows drivers to associate the message with an actual event; hopefully increasing their awareness and trust of the system. Cost: Static warning signs cost approximately $250 each, while truck-mounted changeable message signs cost approximately $8000 each. Portable changeable message signs (PCMS) cost approximately $5500 each, but can be leased for approximately $11.00 an hour. Radar vehicle detection systems cost approximately $6500. The cost of work zone intelligent transportation systems varies and is highly dependent upon the technology used. Suggested criteria: Due to highly variable implementation costs and lack of adequate data regarding the potential incremental benefit of the countermeasure, a cost-effectiveness assessment could not be conducted. However, “DO NOT FOLLOW” signage should be considered at locations where
No Deceleration Lane
HAUL ROAD
NOTE: Some temporary traffic control devices may have been omitted from this diagram for clarity purposes.
Vehicle Detection Systemactivates CMS warningon public roadway. Systemmay be radio control devicesoperated by the truck drivers.
E

109
construction entrances appear to be continuations of the expected travel path or where drivers repeatedly enter the work area behind work vehicles. Other considerations:
• It is normally preferable to separate construction access and egress from high-speed travel lanes to avoid creating high-speed differentials between work vehicles and motorists. If such separation cannot be accomplished, improving driver awareness of the presence of exiting and entering work traffic is the next logical alternative.

110
EARLY MERGE SYSTEM Description: The early merge system (also known as a dynamic no passing zone) encourages drivers to exit the closed lane as soon as possible and thus is intended to reduce the number of forced merges near the beginning of the lane closure. The early merge system uses intelligent transportation systems sensors to monitor traffic in the open lane on the approach to the work area. Advance warning signs are used to display no passing messages (e.g., “NO PASSING WHEN FLASHING” or “LEFT LANE DO NOT PASS WHEN FLASHING”). These types of messages are intended to discourage “queue-jumpers” from merging into the open lane at the beginning of the lane closure and causing additional delay to those who merged early. Thus, the early merge system aims to reduce aggressive driving and unsafe merge maneuvers. Effectiveness: An early merge system may be used to discourage last minute lane changes near the beginning of the lane closure, reduce aggressive driving, and reduce unsafe merge maneuvers. It also provides significant advance warning so drivers have adequate distance to merge prior to reaching the beginning of the lane closure. A Michigan Department of Transportation (MDOT) study showed that average peak period travel time delay decreased by over 30 percent, the average number of stops and duration of stops were decreased, and the number of aggressive driving maneuvers (late merges) during peak hours was significantly reduced. Cost: The complexity of each system varies, so cost is a function of the number of signs required, the type of detection and communication methods employed, duration of use, and whether the system is leased or purchased. MDOT leased an early merge system for use over two six-month periods at a cost of $120,000. The system consisted of five sign trailers, each with microwave sensors, wireless radio communications and solar, rechargeable power systems. Suggested criteria: Due to highly variable implementation costs and lack of adequate data regarding the potential incremental benefit of the countermeasure, a cost-effectiveness assessment could not be conducted. However, early merge systems may be used for lane closures on high speed facilities under low volume conditions. Based on previous research, for a two-to–one lane closure, volumes should be between 2,000 and 3,000 vehicles per hour; for a three-to-two lane closure, volumes should be between 3,000 and 3, 800 vehicles per hour.

111
Other considerations: • Best suited for commuter traffic and sufficient project duration to allow drivers to adapt
to the system. • Enforcement is necessary to ensure compliance with the early merge system. • If the system is leased, the transportation agency does not have to maintain the equipment
or store it after use.
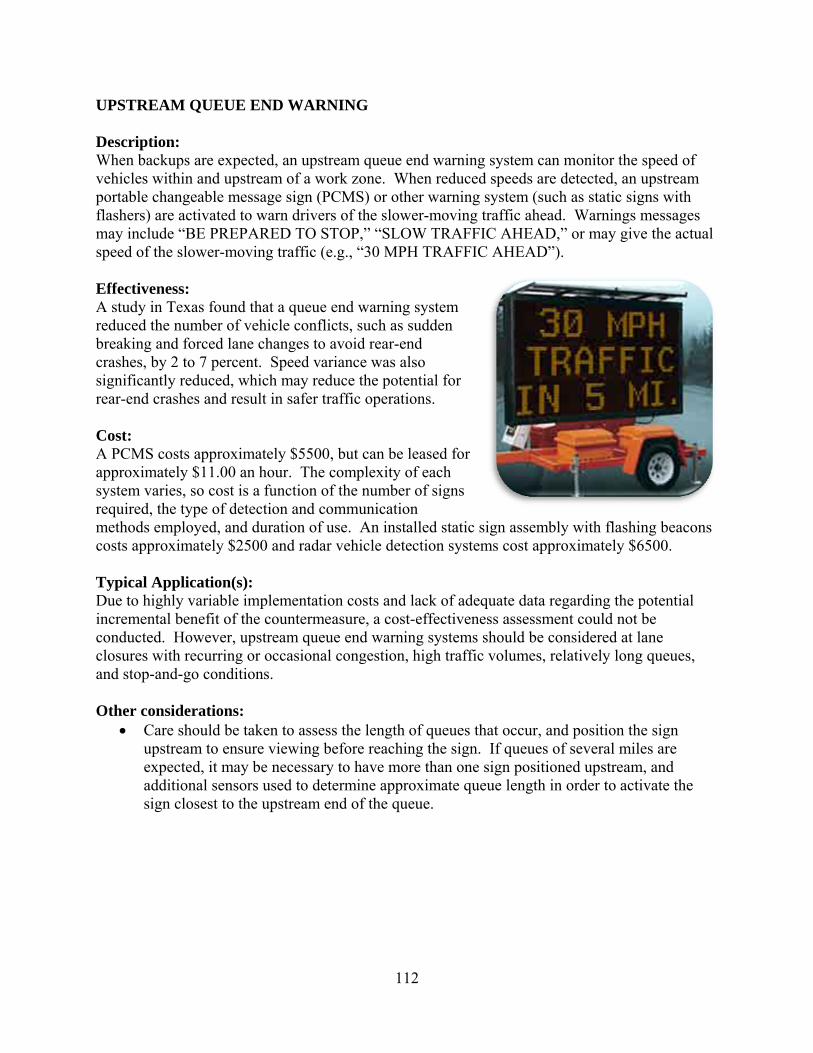
112
UPSTREAM QUEUE END WARNING Description: When backups are expected, an upstream queue end warning system can monitor the speed of vehicles within and upstream of a work zone. When reduced speeds are detected, an upstream portable changeable message sign (PCMS) or other warning system (such as static signs with flashers) are activated to warn drivers of the slower-moving traffic ahead. Warnings messages may include “BE PREPARED TO STOP,” “SLOW TRAFFIC AHEAD,” or may give the actual speed of the slower-moving traffic (e.g., “30 MPH TRAFFIC AHEAD”). Effectiveness: A study in Texas found that a queue end warning system reduced the number of vehicle conflicts, such as sudden breaking and forced lane changes to avoid rear-end crashes, by 2 to 7 percent. Speed variance was also significantly reduced, which may reduce the potential for rear-end crashes and result in safer traffic operations. Cost: A PCMS costs approximately $5500, but can be leased for approximately $11.00 an hour. The complexity of each system varies, so cost is a function of the number of signs required, the type of detection and communication methods employed, and duration of use. An installed static sign assembly with flashing beacons costs approximately $2500 and radar vehicle detection systems cost approximately $6500. Typical Application(s): Due to highly variable implementation costs and lack of adequate data regarding the potential incremental benefit of the countermeasure, a cost-effectiveness assessment could not be conducted. However, upstream queue end warning systems should be considered at lane closures with recurring or occasional congestion, high traffic volumes, relatively long queues, and stop-and-go conditions. Other considerations:
• Care should be taken to assess the length of queues that occur, and position the sign upstream to ensure viewing before reaching the sign. If queues of several miles are expected, it may be necessary to have more than one sign positioned upstream, and additional sensors used to determine approximate queue length in order to activate the sign closest to the upstream end of the queue.
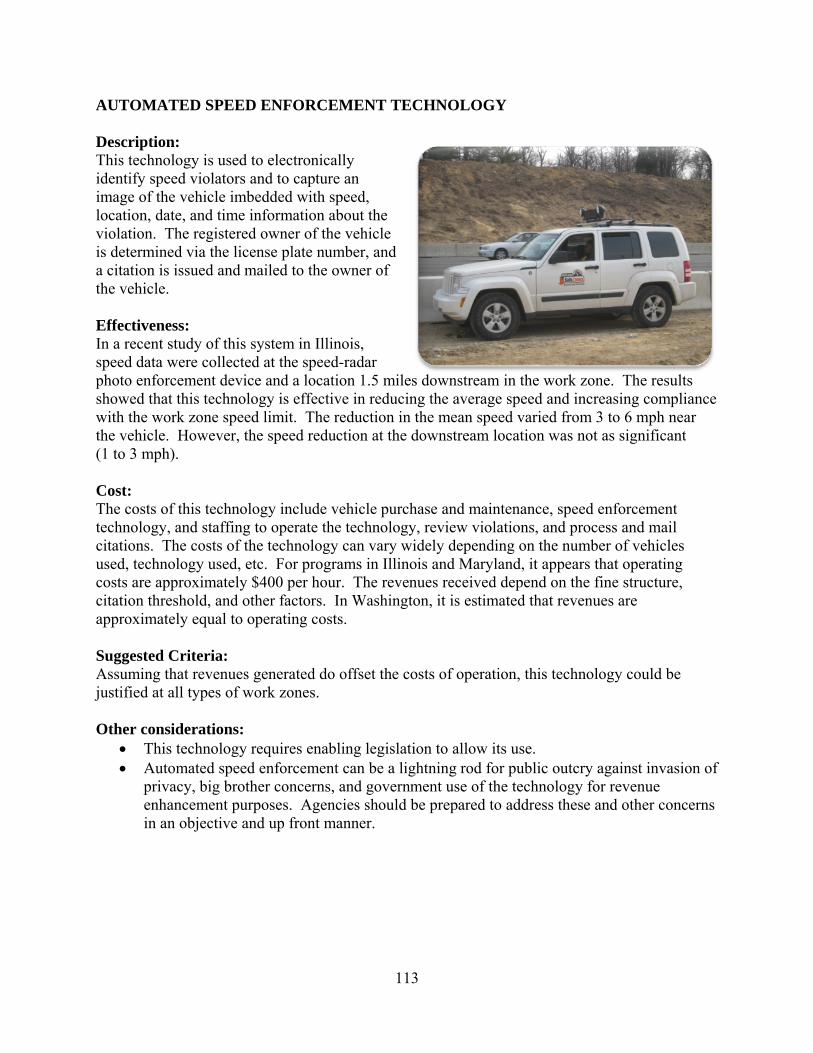
113
AUTOMATED SPEED ENFORCEMENT TECHNOLOGY Description: This technology is used to electronically identify speed violators and to capture an image of the vehicle imbedded with speed, location, date, and time information about the violation. The registered owner of the vehicle is determined via the license plate number, and a citation is issued and mailed to the owner of the vehicle. Effectiveness: In a recent study of this system in Illinois, speed data were collected at the speed-radar photo enforcement device and a location 1.5 miles downstream in the work zone. The results showed that this technology is effective in reducing the average speed and increasing compliance with the work zone speed limit. The reduction in the mean speed varied from 3 to 6 mph near the vehicle. However, the speed reduction at the downstream location was not as significant (1 to 3 mph). Cost: The costs of this technology include vehicle purchase and maintenance, speed enforcement technology, and staffing to operate the technology, review violations, and process and mail citations. The costs of the technology can vary widely depending on the number of vehicles used, technology used, etc. For programs in Illinois and Maryland, it appears that operating costs are approximately $400 per hour. The revenues received depend on the fine structure, citation threshold, and other factors. In Washington, it is estimated that revenues are approximately equal to operating costs. Suggested Criteria: Assuming that revenues generated do offset the costs of operation, this technology could be justified at all types of work zones. Other considerations:
• This technology requires enabling legislation to allow its use. • Automated speed enforcement can be a lightning rod for public outcry against invasion of
privacy, big brother concerns, and government use of the technology for revenue enhancement purposes. Agencies should be prepared to address these and other concerns in an objective and up front manner.

114
REFERENCES
1. Ullman, G.L., M.D. Finley, and L.T. Theiss. Work Zone Intrusion Countermeasure Identification, Assessment, and Implementation Guidelines. Report No. FHWA/CA10-1102. Texas Transportation Institute, College Station, Texas, May 2010.
2. Bryden, J.E., and D. J. Mace. A Procedure for Assessing and Planning Nighttime Highway Construction and Maintenance. NCHRP Report 475. Transportation Research Board, National Research Council, Washington, D.C., 2002.
3. Bryden, J.E., and D. J. Mace. Guidelines for Design and Operation of Nighttime Traffic Control for Highway Maintenance and Construction. NCHRP Report 476. Transportation Research Board, National Research Council, Washington, D.C., 2002.
4. Ullman, G.L., M.D. Finley, J.E. Bryden, R. Srinivasan, and F.M. Council. Traffic Safety Evaluation of Nighttime and Daytime Work Zones. NCHRP Report 627. Transportation Research Board, National Research Council, Washington, D.C., 2008.
5. Standard Plans (U.S. Customary Units). California Department of Transportation, May 2006. Available at http://www.dot.ca.gov/hq/esc/oe/project_plans/highway_plans/stdplans_US-customary-units_06/viewable_pdf/2006-Std-Plns-for-Web.pdf. Accessed January 7, 2009.
6. Ullman, B.R., N.D. Trout, and G.L. Ullman. Recommended Messages for Truck-Mounted Changeable Message Signs During Mobile Operations. Report FHWA-WY-09-07F. Texas Transportation Institute, College Station, Texas, November 2009.

115
APPENDIX B: CRASH COST FUNCTIONS

116
(a) Daytime
(b) Nighttime
Figure A-1. Total Crash Cost Functions for Freeway Facilities: Work Zone Active with
Temporary Lane Closures.
$‐
$200
$400
$600
$800
$1,000
$1,200
$1,400
$1,600
$1,800
$2,000
0 50 100 150 200 250
Crash Co
sts pe
r Hou
r of W
ork Activity
per M
ile of W
ork Zo
ne
Roadway AADT (thousands)
95th
Ave
5th
$‐
$100
$200
$300
$400
$500
$600
$700
$800
$900
0 50 100 150 200 250
Crash Co
sts pe
r Hou
r of W
ork Activity
per M
ile of W
ork Zo
ne
Roadway AADT (thousands)
95th
Ave
5th

117
(a) Daytime
(b) Nighttime
Figure A-2. Intrusion Crash Cost Functions for Freeway Facilities: Work Zone Active
with Temporary Lane Closures.
$‐
$50
$100
$150
$200
$250
0 50 100 150 200 250Intrusion Crash Co
sts pe
r Hou
r of W
ork
Activity pe
r Mile
of W
ork Zo
ne
Roadway AADT (thousands)
95th
Ave
5th
$‐
$20
$40
$60
$80
$100
$120
$140
$160
$180
0 50 100 150 200 250Intrusion Crash Co
sts pe
r Hou
r of W
ork
Activity pe
r Mile
of W
ork Zo
ne
Roadway AADT (thousands)
95th
Ave
5th

118
(a) Daytime
(b) Nighttime
Figure A-3. Total Crash Cost Functions for Freeway Facilities: Work Zone Active without
Temporary Lane Closures.
$‐
$200
$400
$600
$800
$1,000
$1,200
$1,400
$1,600
$1,800
$2,000
0 50 100 150 200 250
Crash Co
sts pe
r Hou
r of W
ork Activity
per M
ile of W
ork Zo
ne
Roadway AADT (thousands)
95th
Ave
5th
$‐
$100
$200
$300
$400
$500
$600
$700
$800
$900
$1,000
0 50 100 150 200 250
Crash Co
sts pe
r Hou
r of W
ork Activity
per M
ile of W
ork Zo
ne
Roadway AADT (thousands)
95th
Ave
5th

119
(a) Daytime
(b) Nighttime
Figure A-4. Intrusion Crash Cost Functions for Freeway Facilities: Work Zone Active
without Temporary Lane Closures.
$0
$20
$40
$60
$80
$100
$120
$140
$160
$180
0 50 100 150 200 250Intrusion Crash Co
sts pe
r Hou
r of W
ork
Activity pe
r Mile
of W
ork Zo
ne
Roadway AADT (thousands)
95th
Ave
5th
$‐
$20
$40
$60
$80
$100
$120
$140
$160
$180
0 50 100 150 200 250Intrusion Crash Co
sts pe
r Hou
r of W
ork
Activity pe
r Mile
of W
ork Zo
ne
Roadway AADT (thousands)
95th
Ave
5th
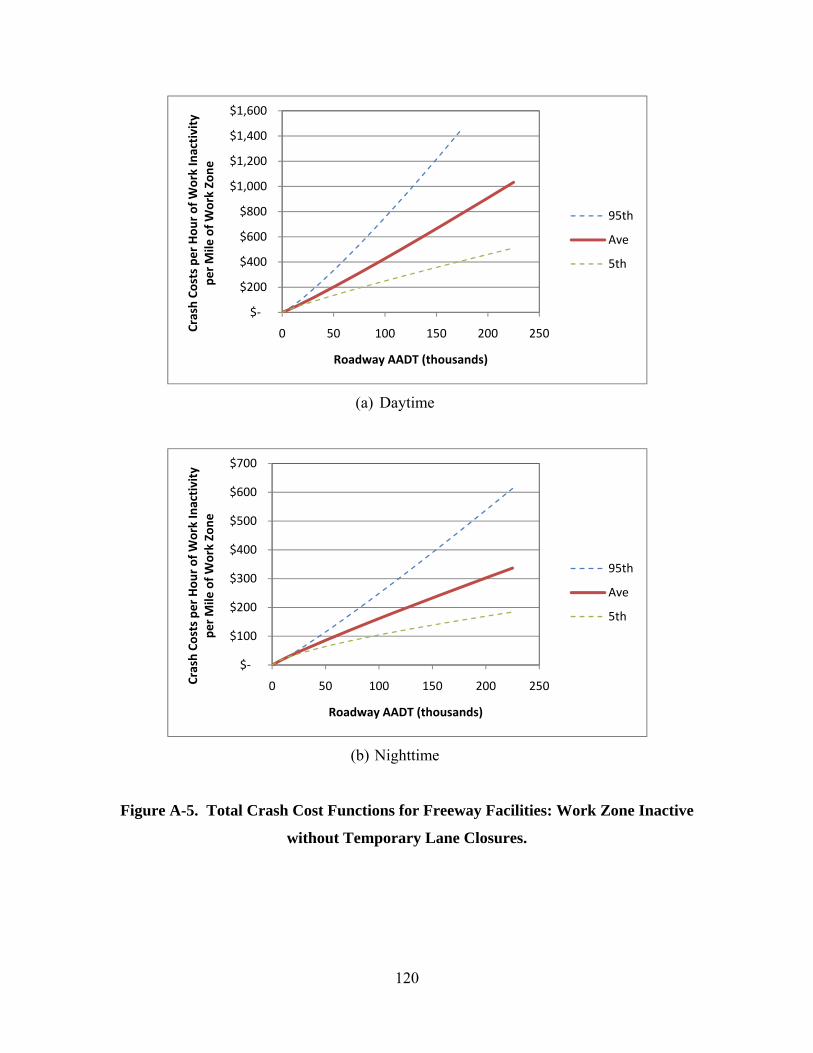
120
(a) Daytime
(b) Nighttime
Figure A-5. Total Crash Cost Functions for Freeway Facilities: Work Zone Inactive
without Temporary Lane Closures.
$‐
$200
$400
$600
$800
$1,000
$1,200
$1,400
$1,600
0 50 100 150 200 250Crash Co
sts pe
r Hou
r of W
ork Inactivity
per M
ile of W
ork Zo
ne
Roadway AADT (thousands)
95th
Ave
5th
$‐
$100
$200
$300
$400
$500
$600
$700
0 50 100 150 200 250Crash Co
sts pe
r Hou
r of W
ork Inactivity
per M
ile of W
ork Zo
ne
Roadway AADT (thousands)
95th
Ave
5th
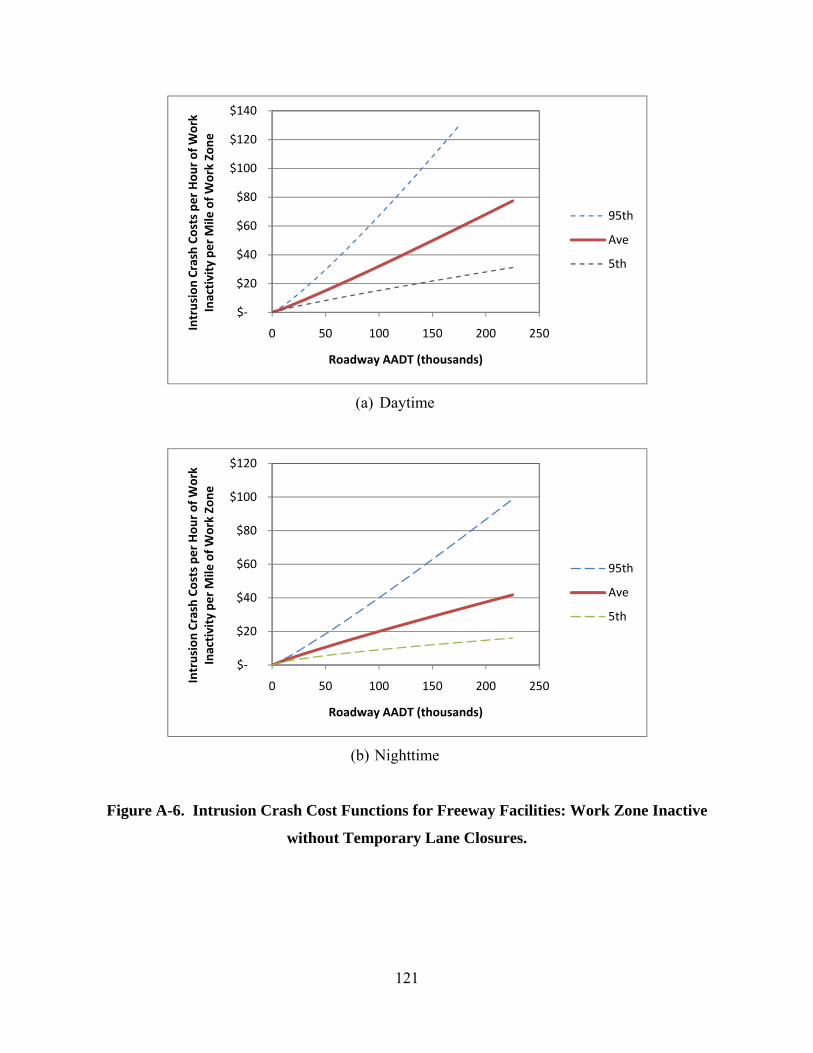
121
(a) Daytime
(b) Nighttime
Figure A-6. Intrusion Crash Cost Functions for Freeway Facilities: Work Zone Inactive
without Temporary Lane Closures.
$‐
$20
$40
$60
$80
$100
$120
$140
0 50 100 150 200 250Intrusion Crash Co
sts pe
r Hou
r of W
ork
Inactivity per M
ile of W
ork Zo
ne
Roadway AADT (thousands)
95th
Ave
5th
$‐
$20
$40
$60
$80
$100
$120
0 50 100 150 200 250Intrusion Crash Co
sts pe
r Hou
r of W
ork
Inactivity per M
ile of W
ork Zo
ne
Roadway AADT (thousands)
95th
Ave
5th

122
(a) Daytime
(b) Nighttime
Figure A-7. Total Crash Cost Functions for Multi-Lane Divided Roadway Segments
Between Intersections: Work Zone Active with Temporary Lane Closures.
$‐
$200
$400
$600
$800
$1,000
$1,200
0 20 40 60 80 100 120
Crash Co
sts pe
r Hou
r of W
ork Activity
per M
ile of W
ork Zo
ne
Roadway AADT (thousands)
95th
Ave
5th
$‐
$100
$200
$300
$400
$500
$600
$700
$800
0 20 40 60 80 100 120
Crash Co
sts pe
r Hou
r of W
ork Activity
per M
ile of W
ork Zo
ne
Roadway AADT (thousands)
95th
Ave
5th
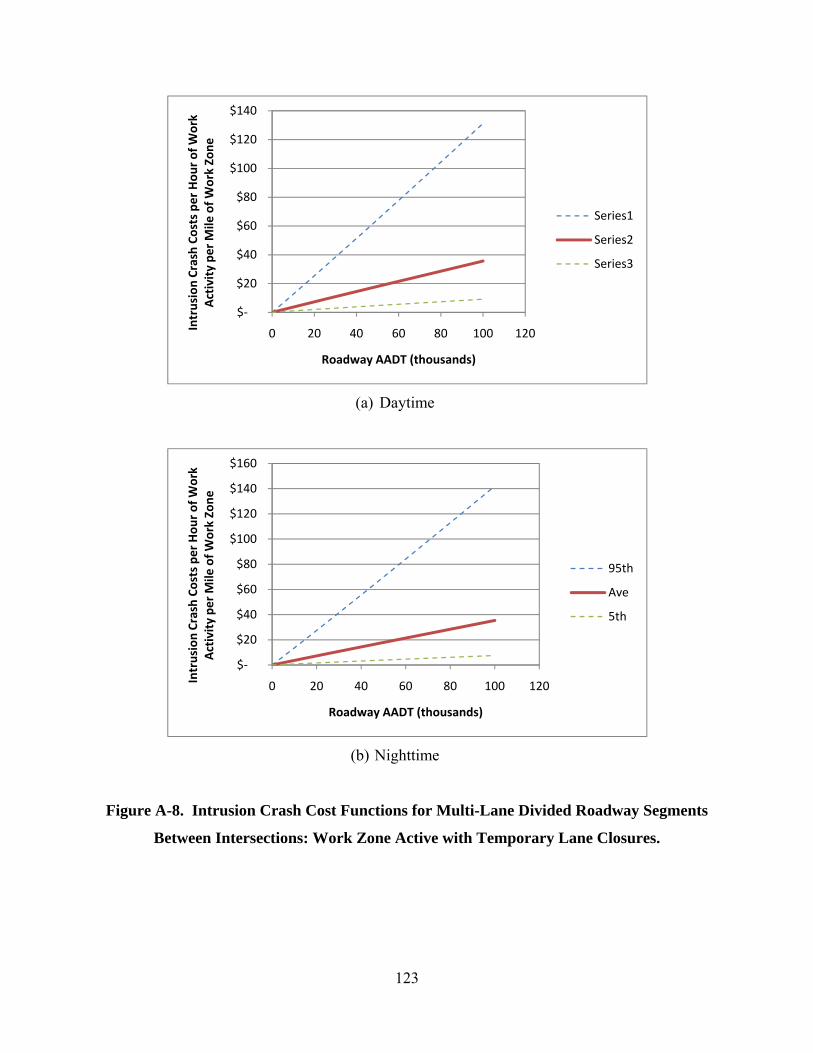
123
(a) Daytime
(b) Nighttime
Figure A-8. Intrusion Crash Cost Functions for Multi-Lane Divided Roadway Segments
Between Intersections: Work Zone Active with Temporary Lane Closures.
$‐
$20
$40
$60
$80
$100
$120
$140
0 20 40 60 80 100 120Intrusion Crash Co
sts pe
r Hou
r of W
ork
Activity pe
r Mile
of W
ork Zo
ne
Roadway AADT (thousands)
Series1
Series2
Series3
$‐
$20
$40
$60
$80
$100
$120
$140
$160
0 20 40 60 80 100 120Intrusion Crash Co
sts pe
r Hou
r of W
ork
Activity pe
r Mile
of W
ork Zo
ne
Roadway AADT (thousands)
95th
Ave
5th
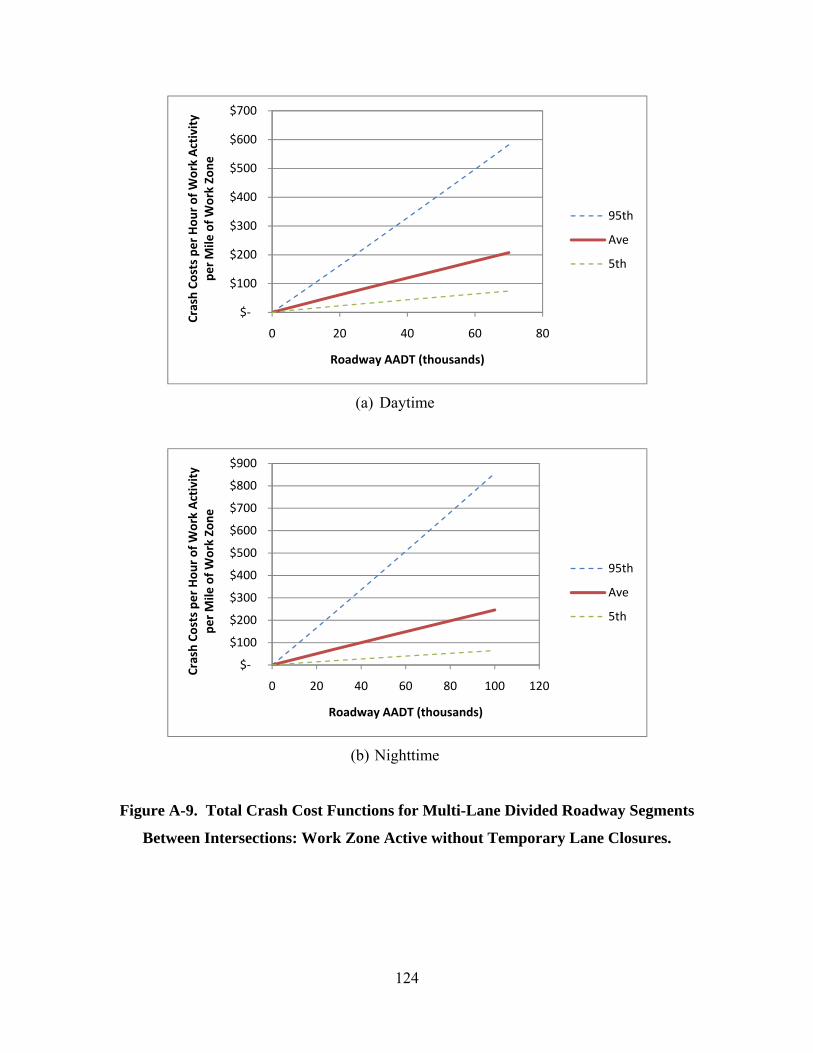
124
(a) Daytime
(b) Nighttime
Figure A-9. Total Crash Cost Functions for Multi-Lane Divided Roadway Segments
Between Intersections: Work Zone Active without Temporary Lane Closures.
$‐
$100
$200
$300
$400
$500
$600
$700
0 20 40 60 80
Crash Co
sts pe
r Hou
r of W
ork Activity
per M
ile of W
ork Zo
ne
Roadway AADT (thousands)
95th
Ave
5th
$‐
$100
$200
$300
$400
$500
$600
$700
$800
$900
0 20 40 60 80 100 120
Crash Co
sts pe
r Hou
r of W
ork Activity
per M
ile of W
ork Zo
ne
Roadway AADT (thousands)
95th
Ave
5th

125
(a) Daytime
(b) Nighttime
Figure A-10. Intrusion Crash Cost Functions for Multi-Lane Divided Roadway Segments
Between Intersections: Work Zone Active without Temporary Lane Closures.
$0
$10
$20
$30
$40
$50
$60
0 20 40 60 80Intrusion Crash Co
sts pe
r Hou
r of W
ork
Activity pe
r Mile
of W
ork Zo
ne
Roadway AADT (thousands)
95th
Ave
5th
$‐
$20
$40
$60
$80
$100
$120
$140
$160
0 20 40 60 80 100 120Intrusion Crash Co
sts pe
r Hou
r of W
ork
Activity pe
r Mile
of W
ork Zo
ne
Roadway AADT (thousands)
95th
Ave
5th
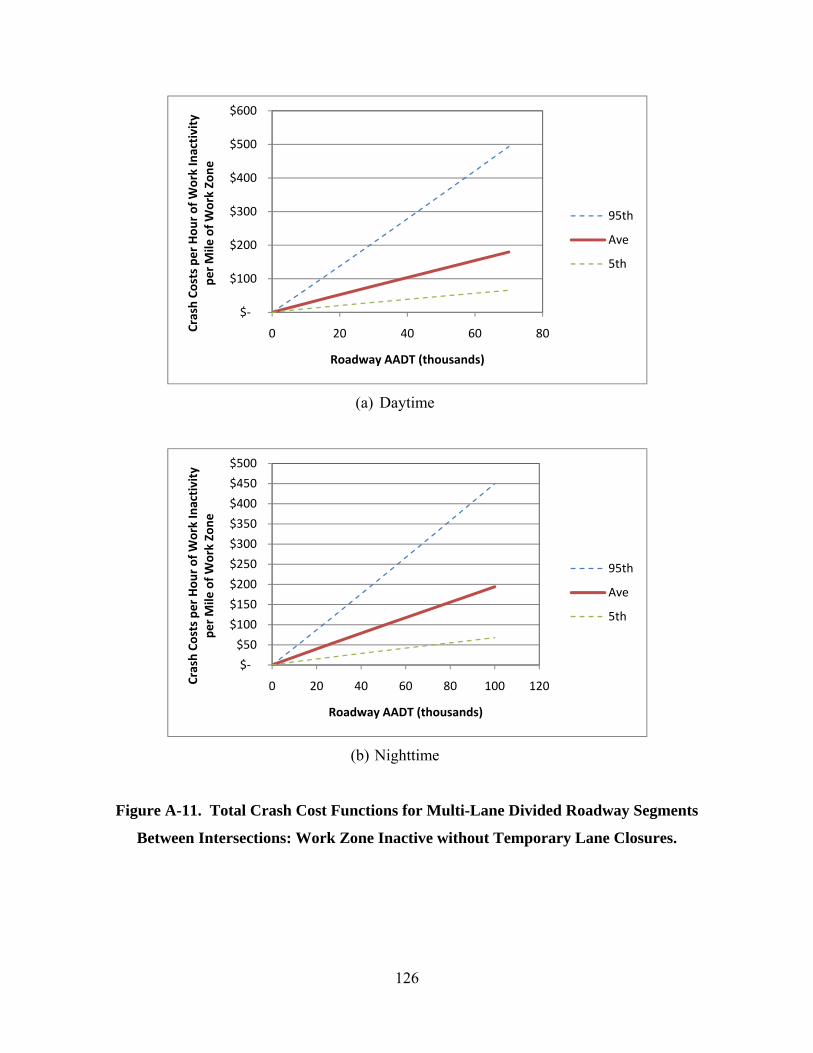
126
(a) Daytime
(b) Nighttime
Figure A-11. Total Crash Cost Functions for Multi-Lane Divided Roadway Segments
Between Intersections: Work Zone Inactive without Temporary Lane Closures.
$‐
$100
$200
$300
$400
$500
$600
0 20 40 60 80Crash Co
sts pe
r Hou
r of W
ork Inactivity
per M
ile of W
ork Zo
ne
Roadway AADT (thousands)
95th
Ave
5th
$‐
$50
$100
$150
$200
$250
$300
$350
$400
$450
$500
0 20 40 60 80 100 120Crash Co
sts pe
r Hou
r of W
ork Inactivity
per M
ile of W
ork Zo
ne
Roadway AADT (thousands)
95th
Ave
5th

127
(a) Daytime
(b) Nighttime
Figure A-12. Intrusion Crash Cost Functions for Multi-Lane Divided Roadway Segments
Between Intersections: Work Zone Inactive without Temporary Lane Closures.
$‐
$10
$20
$30
$40
$50
$60
$70
0 20 40 60 80 100 120Intrusion Crash Co
sts pe
r Hou
r of W
ork
Inactivity per M
ile of W
ork Zo
ne
Roadway AADT (thousands)
95th
Ave
5th
$‐
$10
$20
$30
$40
$50
$60
$70
$80
0 20 40 60 80 100 120Intrusion Crash Co
sts pe
r Hou
r of W
ork
Inactivity per M
ile of W
ork Zo
ne
Roadway AADT (thousands)
95th
Ave
5th
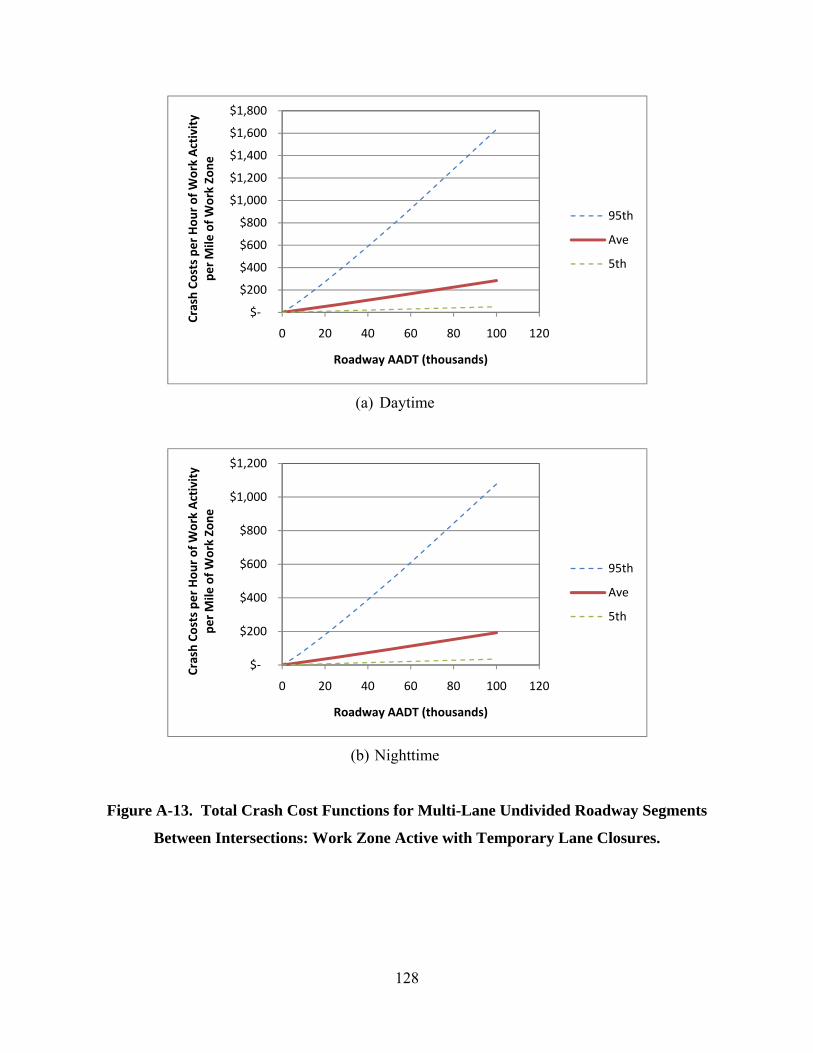
128
(a) Daytime
(b) Nighttime
Figure A-13. Total Crash Cost Functions for Multi-Lane Undivided Roadway Segments
Between Intersections: Work Zone Active with Temporary Lane Closures.
$‐
$200
$400
$600
$800
$1,000
$1,200
$1,400
$1,600
$1,800
0 20 40 60 80 100 120
Crash Co
sts pe
r Hou
r of W
ork Activity
per M
ile of W
ork Zo
ne
Roadway AADT (thousands)
95th
Ave
5th
$‐
$200
$400
$600
$800
$1,000
$1,200
0 20 40 60 80 100 120
Crash Co
sts pe
r Hou
r of W
ork Activity
per M
ile of W
ork Zo
ne
Roadway AADT (thousands)
95th
Ave
5th
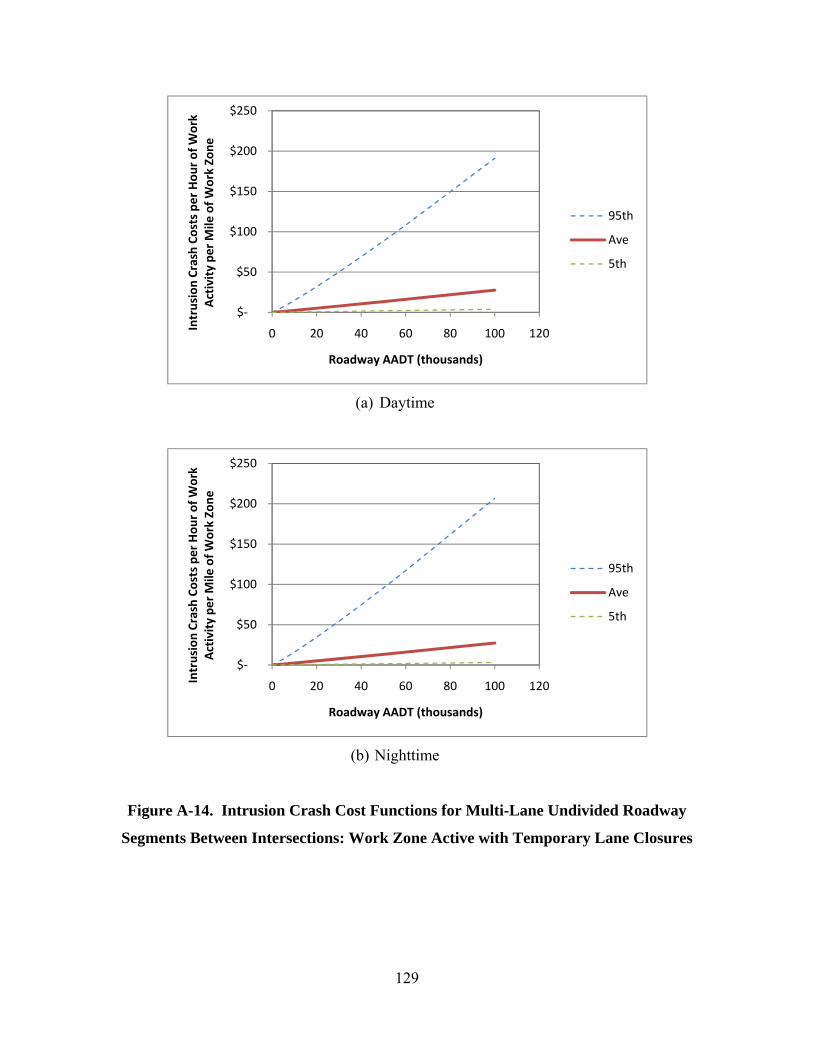
129
(a) Daytime
(b) Nighttime
Figure A-14. Intrusion Crash Cost Functions for Multi-Lane Undivided Roadway
Segments Between Intersections: Work Zone Active with Temporary Lane Closures
$‐
$50
$100
$150
$200
$250
0 20 40 60 80 100 120Intrusion Crash Co
sts pe
r Hou
r of W
ork
Activity pe
r Mile
of W
ork Zo
ne
Roadway AADT (thousands)
95th
Ave
5th
$‐
$50
$100
$150
$200
$250
0 20 40 60 80 100 120Intrusion Crash Co
sts pe
r Hou
r of W
ork
Activity pe
r Mile
of W
ork Zo
ne
Roadway AADT (thousands)
95th
Ave
5th

130
(a) Daytime
(b) Nighttime
Figure A-15. Total Crash Cost Functions for Multi-Lane Undivided Roadway Segments
Between Intersections: Work Zone Active without Temporary Lane Closures.
$‐
$200
$400
$600
$800
$1,000
$1,200
$1,400
0 20 40 60 80 100 120
Crash Co
sts pe
r Hou
r of W
ork Activity
per M
ile of W
ork Zo
ne
Roadway AADT (thousands)
95th
Ave
5th
$‐
$200
$400
$600
$800
$1,000
$1,200
$1,400
0 20 40 60 80 100 120
Crash Co
sts pe
r Hou
r of W
ork Activity
per M
ile of W
ork Zo
ne
Roadway AADT (thousands)
95th
Ave
5th

131
(a) Daytime
(b) Nighttime
Figure A-16. Intrusion Crash Cost Functions for Multi-Lane Undivided Roadway
Segments Between Intersections: Work Zone Active without Temporary Lane Closures.
$0
$20
$40
$60
$80
$100
$120
0 20 40 60 80 100 120Intrusion Crash Co
sts pe
r Hou
r of W
ork
Activity pe
r Mile
of W
ork Zo
ne
Roadway AADT (thousands)
95th
Ave
5th
$‐
$50
$100
$150
$200
$250
0 20 40 60 80 100 120Intrusion Crash Co
sts pe
r Hou
r of W
ork
Activity pe
r Mile
of W
ork Zo
ne
Roadway AADT (thousands)
95th
Ave
5th
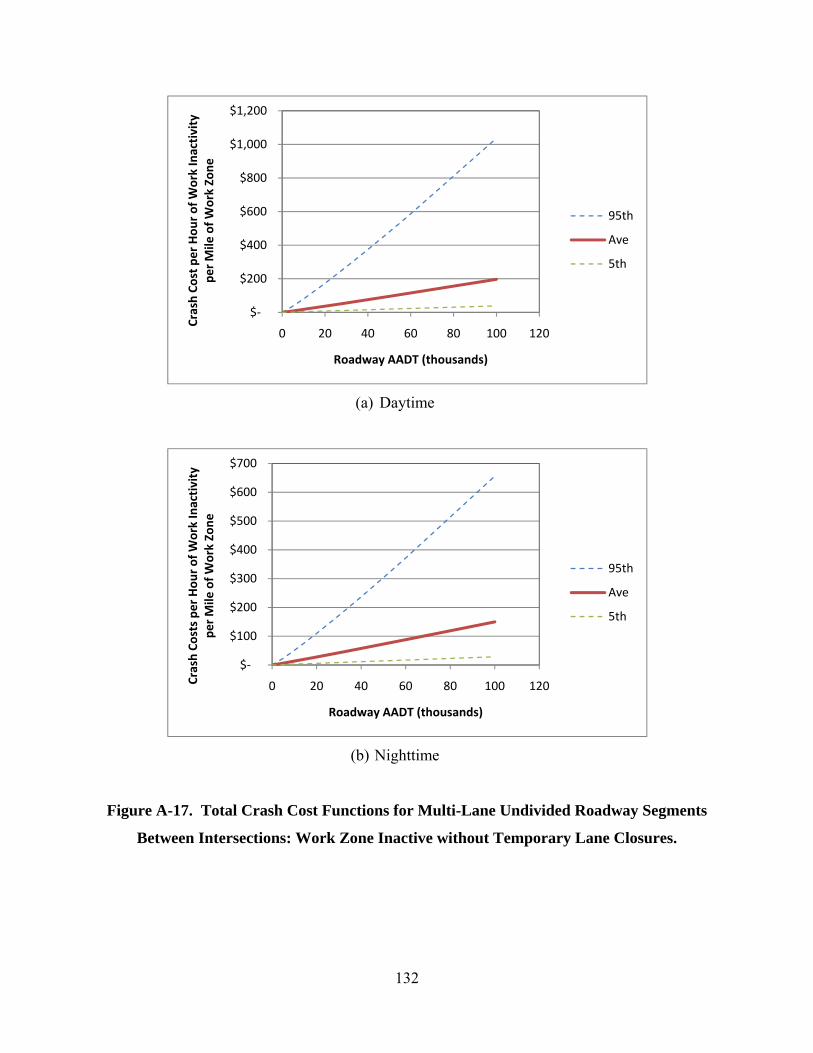
132
(a) Daytime
(b) Nighttime
Figure A-17. Total Crash Cost Functions for Multi-Lane Undivided Roadway Segments
Between Intersections: Work Zone Inactive without Temporary Lane Closures.
$‐
$200
$400
$600
$800
$1,000
$1,200
0 20 40 60 80 100 120
Crash Co
st per Hou
r of W
ork Inactivity
per M
ile of W
ork Zo
ne
Roadway AADT (thousands)
95th
Ave
5th
$‐
$100
$200
$300
$400
$500
$600
$700
0 20 40 60 80 100 120Crash Co
sts pe
r Hou
r of W
ork Inactivity
per M
ile of W
ork Zo
ne
Roadway AADT (thousands)
95th
Ave
5th
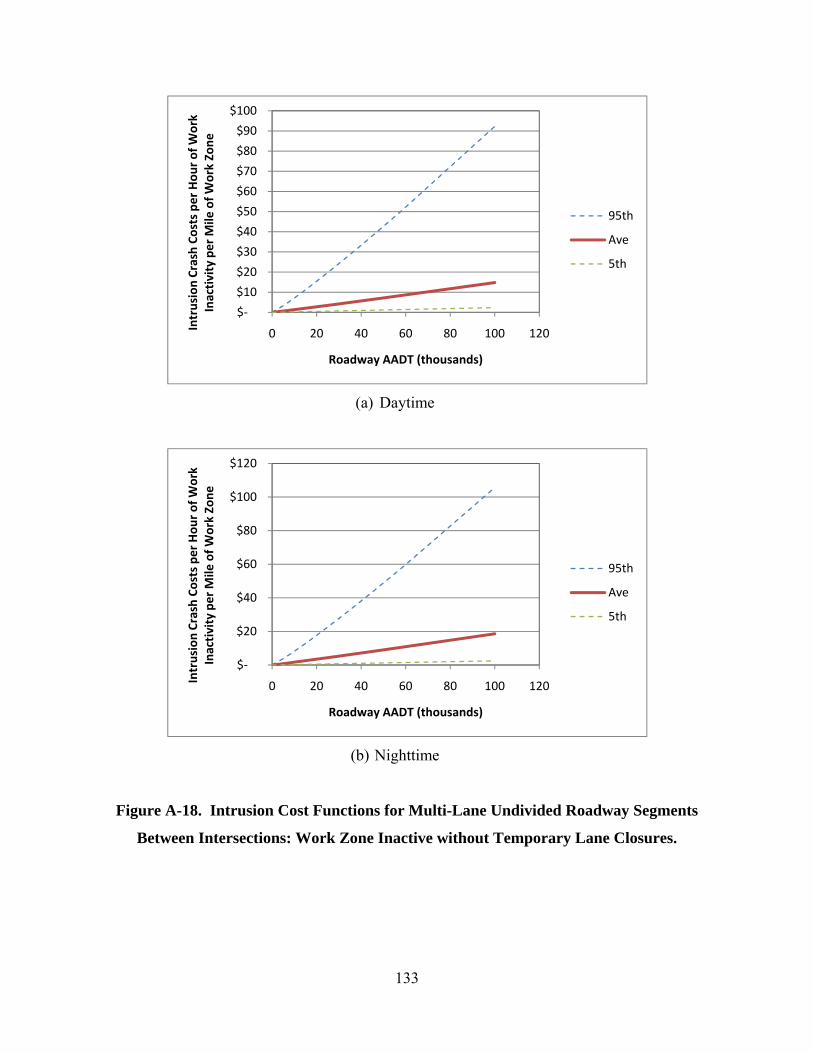
133
(a) Daytime
(b) Nighttime
Figure A-18. Intrusion Cost Functions for Multi-Lane Undivided Roadway Segments
Between Intersections: Work Zone Inactive without Temporary Lane Closures.
$‐
$10
$20
$30
$40
$50
$60
$70
$80
$90
$100
0 20 40 60 80 100 120Intrusion Crash Co
sts pe
r Hou
r of W
ork
Inactivity per M
ile of W
ork Zo
ne
Roadway AADT (thousands)
95th
Ave
5th
$‐
$20
$40
$60
$80
$100
$120
0 20 40 60 80 100 120Intrusion Crash Co
sts pe
r Hou
r of W
ork
Inactivity per M
ile of W
ork Zo
ne
Roadway AADT (thousands)
95th
Ave
5th

134
Figure A-19. Total Crash Cost Functions for Rural Two-Lane Highway Segments Between
Intersections: Work Zone Active with Temporary Lane Closures.
Figure A-20. Intrusion Crash Cost Functions for Rural Two-Lane Highway Segments
Between Intersections: Work Zone Active with Temporary Lane Closures.
$0
$50
$100
$150
$200
$250
$300
$350
$400
$450
0 10 20 30 40 50
Crash Co
sts Pe
r Hou
r of W
ork Activity
per M
ile of W
ork Zo
ne
Roadway AADT (thousands)
Daytime
Nighttime
$0
$5
$10
$15
$20
$25
$30
$35
0 10 20 30 40 50Intrusion Crash Co
sts Pe
r Hou
r of W
ork
Activity Pe
r Mile
of W
ork Zo
ne
Roadway AADT (thousands)
Daytime
Nighttime
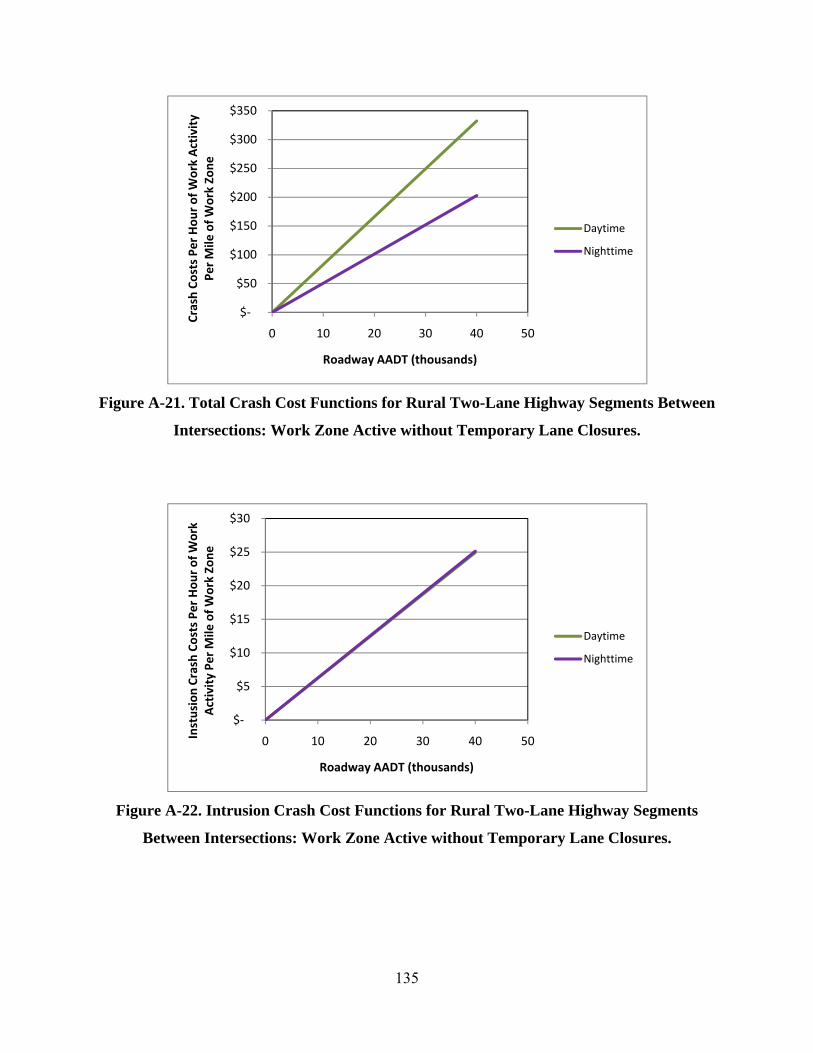
135
Figure A-21. Total Crash Cost Functions for Rural Two-Lane Highway Segments Between
Intersections: Work Zone Active without Temporary Lane Closures.
Figure A-22. Intrusion Crash Cost Functions for Rural Two-Lane Highway Segments
Between Intersections: Work Zone Active without Temporary Lane Closures.
$‐
$50
$100
$150
$200
$250
$300
$350
0 10 20 30 40 50
Crash Co
sts Pe
r Hou
r of W
ork Activity
Per Mile
of W
ork Zo
ne
Roadway AADT (thousands)
Daytime
Nighttime
$‐
$5
$10
$15
$20
$25
$30
0 10 20 30 40 50Instusion Crash Co
sts Pe
r Hou
r of W
ork
Activity Pe
r Mile
of W
ork Zo
ne
Roadway AADT (thousands)
Daytime
Nighttime
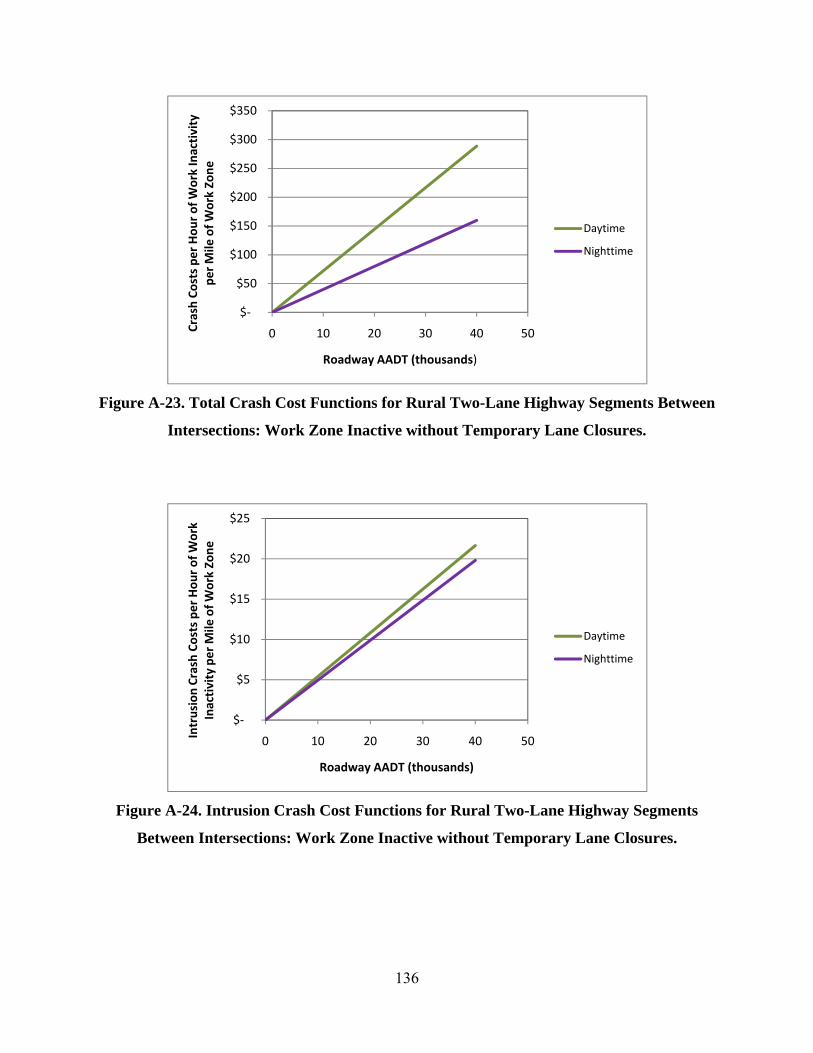
136
Figure A-23. Total Crash Cost Functions for Rural Two-Lane Highway Segments Between
Intersections: Work Zone Inactive without Temporary Lane Closures.
Figure A-24. Intrusion Crash Cost Functions for Rural Two-Lane Highway Segments
Between Intersections: Work Zone Inactive without Temporary Lane Closures.
$‐
$50
$100
$150
$200
$250
$300
$350
0 10 20 30 40 50Crash Co
sts pe
r Hou
r of W
ork Inactivity
per M
ile of W
ork Zo
ne
Roadway AADT (thousands)
Daytime
Nighttime
$‐
$5
$10
$15
$20
$25
0 10 20 30 40 50Intrusion Crash Co
sts pe
r Hou
r of W
ork
Inactivity per M
ile of W
ork Zo
ne
Roadway AADT (thousands)
Daytime
Nighttime