fhwa-nj-2003-016 - state.nj.us · development of high-performance concrete for transportation...
TRANSCRIPT

Development of High-Performance Concrete for
Transportation Structures in New Jersey
FINAL REPORT August 2003
Submitted by
FHWA-NJ-2003-016
NJDOT Research Project Manager Anthony Chmiel
Hani Nassif, Ph.D., P.E. Assistant Professor
Dept. of Civil & Environmental Engineering Center for Advanced Infrastructure & Transportation (CAIT)
Rutgers, The State University of New Jersey Piscataway, NJ 08854-8014
Nakin Suksawang, Ph.D. Candidate Research Assistant
In cooperation with
New Jersey Department of Transportation
Division of Research and Technology and
U.S. Department of Transportation Federal Highway Administration

Disclaimer Statement
"The contents of this report reflect the views of the author(s) who is (are) responsible for the facts and the
accuracy of the data presented herein. The contents do not necessarily reflect the official views or policies of the New Jersey Department of Transportation or the Federal Highway Administration. This report does not constitute
a standard, specification, or regulation."
iii

TECHNICAL REPORT STANDARD TITLE PAGE 1. Report No. 2.Government Accession No. 3. Recipient’s Catalog No. FHWA-NJ-2003-016
4. Title and Subtitle 5. Report Date August 2003 6. Performing Organization Code
Development of High Performance Concrete for Transportation Structures in New Jersey
CAIT/Rutgers
7. Author(s) 8. Performing Organization Report No. Hani Nassif and Nakin Suksawang FHWA-NJ-2003-016
9. Performing Organization Name and Address 10. Work Unit No.
11. Contract or Grant No.
Dept. of Civil & Environmental Engineering Center for Advanced Infrastructure & Transportation (CAIT) Rutgers, The State University of New Jersey Piscataway, NJ 08854
12. Sponsoring Agency Name and Address 13. Type of Report and Period Covered Final Report 1-01 to 8-03
14. Sponsoring Agency Code
15. Supplementary Notes
16. Abstract The primary objective of this research is to identify high performance concrete (HPC) mix proportions that are suitable for transportation infrastructure in New Jersey. Two classes of concrete with compressive strengths ranging from 6 to 12 ksi are developed. Extensive information is available in the literature covering various aspects of HPC. Show case projects have been built in a number of northeast states including New Hampshire and Virginia. The research plan involves: (i) review of existing information, (ii) selection of mix proportions suitable for New Jersey using local aggregates and the proportions in Class A concrete, (iii) evaluation of trial mixes prepared in the laboratory and at least one ready-mix industry, (iv) evaluation of mechanical and long-term properties, and (v) preparation of specifications for the implementation of HPC in future projects.
17. Key Words 18. Distribution Statement
High Performance Concrete, Durability, Silica Fume, Fly Ash
19. Security Classif (of this report) 20. Security Classif. (of this page) 21. No of Pages 22. Price
Unclassified Unclassified
124
Form DOT F 1700.7 (8-69)
Federal Highway Administration U.S. Department of Transportation Washington, D.C.
New Jersey Department of Transportation PO 600 Trenton, NJ 08625

Acknowledgements
The authors would like to thank the New Jersey Department of Transportation (NJDOT) as well as Tony Chmiel, NJDOT project manager, Jose Lopez, Nick Vitillo, and Eileen
Connelly, for their help and assistance during the period of the project. Also, the assistance of students Kevin Robine, Maqbool Mohamad, David Fusco, Pat Jameison,
Amer Mohamad, and Joe Davis is thankfully acknowledged.
ii

TABLE OF CONTENTS
Page SUMMARY...................................................................................................................... 1 INTRODUCTION............................................................................................................. 1
Scope of the Study....................................................................................................... 2 General Background .................................................................................................... 2 Pozzolan ...................................................................................................................... 3
Fly Ash...................................................................................................................... 3 Silica Fume............................................................................................................. 11 Combination of Silica Fume and Fly Ash in Concrete............................................. 14 Slag ........................................................................................................................ 15
RESEARCH APPROACH ............................................................................................. 16 Phase I....................................................................................................................... 17
Properties of Materials............................................................................................ 17 Mix Proportion......................................................................................................... 20 Mix Design Procedure ............................................................................................ 21 Mixing, (ASTM C 192) ............................................................................................ 22 Slump Test, (ASTM C143)...................................................................................... 22 Air Content, (ASTM C173)...................................................................................... 22 Consolidating Method ............................................................................................. 23 Curing Method ........................................................................................................ 23 Testing Procedures................................................................................................. 24 Results and Discussion .......................................................................................... 25
Phase II...................................................................................................................... 40 Freeze-Thaw Test (ASTM C666)............................................................................ 40 Scaling Test (ASTM C672) ..................................................................................... 41 Chloride Permeability, (ASTM C1202-94)............................................................... 43 Results and Discussion .......................................................................................... 44
Phase III..................................................................................................................... 51 Mix Proportions....................................................................................................... 52 Autogenous Shrinkage ........................................................................................... 53 Drying Shrinkage .................................................................................................... 53 Results and Discussion .......................................................................................... 53 Drying Shrinkage .................................................................................................... 55 Autogenous Shrinkage ........................................................................................... 57
Phase IV .................................................................................................................... 61 Mix Design.............................................................................................................. 61 Creep Chamber ...................................................................................................... 61 Sample Preparations .............................................................................................. 67 Loading................................................................................................................... 67 Results and Discussion .......................................................................................... 68
CONCLUSIONS AND RECOMMENDATIONS ............................................................. 72 APPENDIX .................................................................................................................... 73 REFERENCES............................................................................................................ 111
iii

LIST OF FIGURES Page Figure 1. Gradation of fine aggregates 18Figure 2. Gradation of coarse aggregates 19Figure 3. The effect of w/b ratio on the compressive strength of HPC with a
combination of 7percent silica fume and 15 percent fly ash 28
Figure 4a. Effect of fly ash on the compressive strength of HPC with a w/b = 0.39
29
Figure 4b. Effect of silica fume on the compressive strength of HPC with a w/b = 0.39
30
Figure 5. Effect of pozzolans on the compressive strength of HPC with a w/b = 0.39
30
Figure 6. The effect of pozzolans on compressive strength of HPC with w/b = 0.39
31
Figure 7. Effect of w/b ratio on compressive strength of low-strength HPC with 5 percent silica fume
32
Figure 8. Effect of w/b ratio on compressive strength of low-strength HPC with 30 percent fly ash
32
Figure 9. Effect of w/b ratio on compressive strength of low-strength HPC with 5 percent silica fume and 30 percent fly ash
33
Figure 10. Effect of aggregate on compressive strength of HPC with w/b = 0.39
33
Figure 11. Drying shrinkage of HPC with w/b ratio of 0.37 34Figure 12. Drying shrinkage of HPC with w/b ratio of 0.33 35Figure 13. Drying shrinkage of HPC with w/b ratio of 0.29 35Figure 14. Scatter plot of the modulus of elasticity 36Figure 15. Treatment of different curing methods on specimens 37Figure 16. Method of applying burlap and curing compound on to specimens 37Figure 17. Compressive strength for various curing methods 38Figure 18. Compressive strength of different burlap curing durations 39Figure 19. Effect of curing method on drying shrinkage 39Figure 20. A sonometer 40Figure 21. Freeze-thaw apparatus 41Figure 22. Laboratory freezer for scaling test 42Figure 23. Scaling test sample 42Figure 24. Rapid chloride permeability test equipment 44Figure 25. Effect of w/b ratio on RCPT 45Figure 26. Effect of high volume of pozzolan on RCPT 46Figure 27. Effect of pozzolan on RCPT (w/b = 0.39) 46Figure 28. Effect of fly ash on RCPT (w/b = 0.39) 47Figure 29. Effect of silica fume on RCPT (w/b = 0.39) 48Figure 30. Effect of pozzolan on RCPT of HPC (w/b = 0.39) 48Figure 31. Effect of aggregate size on RCPT (w/b = 0.39) 49Figure 32a. Effect of low strength HPC on RCPT 50
iv

LIST OF FIGURES (CONT.) Page Figure 32b. Effect of low strength HPC on RCPT 50Figure 33. Effect of curing method on RCPT 51Figure 34. Autogenous shrinkage specimens 52Figure 35. VWSG installation 53Figure 36. Effect of curing method on drying shrinkage 55Figure 37. Effect of pozzolan on drying shrinkage 56Figure 38. Effect of type of aggregate on drying shrinkage 56Figure 39. Effect of superplasticizer on drying shrinkage 57Figure 40a. Effect of curing methods on autogenous shrinkage 58Figure 40b. Effect of pozzolans on autogenous shrinkage 58Figure 41. Effect of type of aggregate on autogenous shrinkage 59Figure 42. Effect of curing method on the internal temperature of concrete 60Figure 43. Effect of pozzolan on the internal temperature of concrete 60Figure 44. Environmental chamber 64Figure 45a. Creep rig 64Figure 45b. Creep rig design 65Figure 46. Embedded VWSG 66Figure 47. External VWSG 66Figure 48. Data logger 67Figure 49. Loaded creep rigs 68Figure 50. Effect of w/b ratio on specific creep 69Figure 51. Effect of cement type on specific creep 69Figure 52. Effect of silica fume on specific creep 70Figure 53. Effect of fly ash on specific creep 70Figure 54a. Effect of combination of silica fume and fly ash on specific creep 71Figure 54b. Effect of combination of silica fume and fly ash on specific creep 71Figure 55. Compressive strength (w/b = 0.44) 80Figure 56. Compressive strength (w/b = 0.39) 80Figure 57. Compressive strength (w/b = 0.37) 81Figure 58. Compressive strength (w/b = 0.35) 81Figure 59. Compressive strength (w/b = 0.33) 82Figure 60. Compressive strength (w/b = 0.29) 82Figure 61. Drying shrinkage (w/b = 0.37) 83Figure 62. Drying shrinkage (w/b = 0.33) 83Figure 63. Drying shrinkage (w/b = 029) 84Figure 64. Effect of curing on autogenous shrinkage of mix L1 84Figure 65. Effect of curing on autogenous shrinkage of mix L2 85Figure 66. Effect of curing on autogenous shrinkage of mix L3 85Figure 67. Effect of curing on autogenous shrinkage of mix L4 86Figure 68. Effect of curing on autogenous shrinkage of mix M1 86
v

LIST OF FIGURES (CONT.) Page Figure 69. Effect of curing on autogenous shrinkage of mix M2 87Figure 70. Effect of curing on autogenous shrinkage of mix M3 87Figure 71. Effect of curing on autogenous shrinkage of mix M4 88Figure 72. Effect of pozzolans on mix of w/b ratio 0.29 with dry curing 88Figure 73. Effect of pozzolans on mix of w/b ratio 0.29 with Curing
Compound 89
Figure 74. Effect of pozzolans on mix of w/b ratio 0.29 with burlap curing 89Figure 75. Effect of aggregates on autogenous shrinkage with dry curing 90Figure 76. Effect of w/b on autogenous shrinkage with dry curing 90Figure 77. Effect of w/b on autogenous shrinkage with curing compound 91Figure 78. Effect of w/b on autogenous shrinkage with burlap curing 91Figure 79. Effect of amount of superplasticizer on the autogenous shrinkage
with dry curing 92
Figure 80. Temperature variations inside the sample of mix L1 92Figure 81. Temperature variations inside the sample of mix L2 93Figure 82. Temperature variations inside the sample of mix L3 93Figure 83. Temperature variation inside the samples with different pozzolans
and with burlap curing 94
Figure 84. Effect of curing on long-term shrinkage of mix L1 94Figure 85. Effect of curing on long-term shrinkage of mix L2 95Figure 86. Effect of curing on long-term shrinkage of mix L3 95Figure 87. Effect of curing on long-term shrinkage of mix L4 96Figure 88. Effect of curing on long-term shrinkage of mix M1 96Figure 89. Effect of curing on long-term shrinkage of mix M2 97Figure 90. Effect of curing on long-term shrinkage of mix M3 97Figure 91. Effect of curing on long-term shrinkage of mix M4 98Figure 92. Effect of pozzolans on long-term shrinkage with dry curing 98Figure 93. Effect of pozzolans on long-term shrinkage when with curing
compound 99
Figure 94. Effect of pozzolans on long-term shrinkage with burlap curing 99Figure 95. Effect of aggregates on long-term shrinkage with dry curing 100Figure 96. Effect of w/b on long-term shrinkage with dry curing 100Figure 97. Effect of w/b on long-term shrinkage with curing compound 101Figure 98. Effect of w/b on long-term shrinkage with burlap curing 101Figure 99. Effect of amount of superplasticizer on long-term shrinkage with
dry curing 102
Figure 100. Effect of curing methods on drying shrinkage of mix L1 102Figure 101. Effect of curing methods on drying shrinkage of mix L2 103Figure 102. Effect of curing methods on drying shrinkage of mix L3 103Figure 103. Effect of curing methods on drying shrinkage of mix L4 104Figure 104. Effect of curing methods on drying shrinkage of mix M1 104Figure 105. Effect of curing methods on drying shrinkage of mix M2 105Figure 106. Effect of curing methods on drying shrinkage of mix M3 105
vi

LIST OF FIGURES (CONT) Page Figure 107. Effect of curing methods on drying shrinkage of mix M4 106Figure 108. Effect of pozzolans on drying shrinkage with dry curing 106Figure 109. Effect of pozzolans on drying shrinkage with curing compound 107Figure 110. Effect of pozzolans on drying shrinkage with burlap curing 107Figure 111. Effect of aggregates on drying shrinkage with dry curing 108Figure 112. Effect of w/b on drying shrinkage with dry curing 108Figure 113. Effect of w/b on drying shrinkage with curing compound 109Figure 114. Effect of w/b on drying shrinkage with burlap curing 109Figure 115. Effect of amount of superplasticizer on drying shrinkage with dry
curing 110
LIST OF TABLES Page Table 1. Gradation of fine aggregate 18Table 2. Gradation of coarse aggregate 19Table 3. The Information of the supplies 20Table 4. Mix proportions 20Table 5a. Fresh mix properties 25Table 5b. Fresh mix properties (cont.) 26Table 6a. Selected mix design 27Table 6b. Selected mix design (cont.) 28Table 7. Classification of chloride permeability 43Table 8. Mix proportions for phase III 52Table 9. Mix proportioning and fresh concrete properties 54Table 10 Compressive strength results of phase III mixes 54Table 11. Creep mix design for mixes containing fly ash and silica fume 62Table 12. Creep mix design for mixes containing either fly ash or silica fume 63Table 13. Compressive strength (w/b = 0.44) 73Table 14. Compressive strength (w/b = 0.39) 74Table 15. Compressive strength (w/b = 0.37) 75Table 16. Compressive strength (w/b = 0.35) 76Table 17. Compressive strength (w/b = 0.33) 77Table 18. Compressive strength (w/b = 0.29) 78Table 19. Compressive strength (w/b = 0.40) 79Table 20. Compressive strength (w/b = 0.365) 79Table 21. Compressive strength (w/b = 0.30) 79
vii

SUMMARY The primary objective of this research is to identify high performance concrete (HPC) mix proportions that are suitable for transportation infrastructure in New Jersey. HPC with compressive strengths ranging from 6 to 12 ksi were developed. Mineral and chemical admixtures were used to develop the HPC mixes. The mineral admixtures were added as cement replacements (by weight) to enhance the durability of concrete and they consisted of silica fume, Class F fly ash, and granulated blast-furnace slag. As for the chemical admixtures, superplasticizer and air entraining agent were also used to obtain good workability and freeze-thaw resistance, respectively. The research involved (1) review of existing information, (2) development of mix proportions suitable for New Jersey using local aggregates, (3) evaluation of concrete properties, (4) determinant of the effect of various curing methods on early-age and long term performance, and (5) preparation of standard specifications. The review of the existing information consisted of extensive literature reviews on HPC. These literature reviews are summarized in the literature review section of this report. The development of mix proportions, evaluation of concrete properties, and determinant of the effect of various curing methods, are all described in more detail in the research approach section. The properties that are investigated include compressive strength; modulus of elasticity, early-age (autogenous) and drying shrinkage, creep due to compressive load, rapid chloride permeability, scaling, and freeze-thaw. The results of these tests are used for developing standard specifications and recommendations that are summarized in the conclusions and recommendations section. INTRODUCTION For many years, scientists and engineers have been improving on the development of concrete technology. Concrete is no longer a simple material that only includes cement, water, and aggregates but a more involved mixture. Many pozzolanic materials (such as silica fume, and fly ash) and chemical admixtures (such as superplasticizer and air entraining agent) are being added to improve the quality of the concrete. Part of this is because of the growing number of deteriorating bridge decks in the northeastern region of the United States where the concrete decks are more prone to a chemical attack from deicing salt. The transition from the cold to hot environment is also another cause of the deterioration of concrete in this region. Hence compressive strength no longer constitutes the only criterion in specifying the concrete, but other factors, such as durability, become more pronounced. HPC has been developed to highlight the durability of concrete.
1

Scope of the Study The main objective of this research is to develop HPC mixes using resources readily available in New Jersey. Both mineral and chemical admixtures were used to develop the HPC mixture. The mineral admixture consisted of silica fume, Class F fly ash, and granulated blast furnaces slag. Chemical admixture, superplasticizer and air entraining agent, is also added to obtain good workability and freeze-thaw resistant, respectively. In the development of the mix design, the performance of the concrete is evaluated by measuring its mechanical and durability properties. These properties include compressive strength; modulus of elasticity, early-age (autogenous) and drying shrinkage, creep due to compressive load, rapid chloride permeability, scaling, and freeze-thaw. The results of these tests are used for developing specification and recommendation. Furthermore, HPC curing practices are also included in this study because poor curing practices may adversely affect both the mechanical and durability performance of HPC. The general curing practices discussed in this study include moist or wet curing; air-dry curing; seal curing by coating the concrete with curing compound, and curing with wet burlap. General Background There are many definitions for HPC but one quality that is recognized by all professional organization is durability. HPC must exhibited high durability and therefore HPC usually contained mineral and chemical admixtures. In order to comprehend the used of these admixtures, one must understand the microstructure of concrete. The microstructure of concrete may be divided into three main components—hydrate cement paste, aggregate particles, and the transition zone. The hydrate cement paste contributes to about 50 to 60 percent of the volume of concrete. It consists of the calcium silicate hydrates (CSH) gel. The main compounds of the CSH gel are tricalcium silicate (C3S) and dicalcium silicate (C2S). The CSH gel affects the strength of concrete. The high early strength of concrete results from a higher percentage of C3S. On the other hand, the later strength gain depends on the percentage of C2S, provided that there is a presence of water, i.e. moist cured. CSH gel is also the main compound for determining concrete durability since this is the strong bond between aggregate and cement paste it prevent penetration of water or chemical into the concrete.
2

Aggregate particles of concrete often play a minor role in concrete; they usually influence the modulus of elasticity of concrete. However, for concrete with a low water-to-cement ratio (w/c), they play a bigger role in the mechanical properties of the concrete. Because of the combination of a higher bonding strength between aggregates and hydrate cement paste and weaker fracture strength of aggregates, the concrete fracture strength formerly controlled by the hydrated cement paste is now controlled by the fracture strength of aggregates. In addition, for aggregates with a high alkaline silica reactant, the durability of concrete will be controlled by the reactivity of the aggregates. The transition zone is a weak link between the aggregate particles and the hydrate cement paste. It is composed of a thin layer of hydrate cement paste. The weakness of the transition zone is linked to the migration of water from aggregates; this water locally increases the w/c ratio and forms calcium hydroxide [Ca(OH)2]. Ca(OH)2 is a relatively weak compound that could be easily attacked by acidic material such as sulfate. Therefore, it is important to eliminate Ca(OH)2 in concrete. The voids constitute another component that influences the strength and durability of concrete. The voids in concrete could be divided into two types—capillary voids and air voids. Capillary voids are created by the evaporation of excess water in concrete. They are usually found in concrete with a high w/c ratio. Air voids can be classified as either entrap or entrain air in concrete. Entrap air voids are trapped air in concrete created by a poor consolidation process. These voids are usually larger in size and could lead to the premature failure of concrete. On the other hand, air entrain voids are small air voids purposely placed in concrete to resist freezing and thawing. Pozzolan Pozzolan by definition is a siliceous or siliceous and aluminous material, which in the presence of moisture chemically reacts with Ca(OH)2 to form strong cementing material (CSH-gel). Hence, pozzolans reduce the weak bonds in concrete, making the concrete stronger, decreasing permeability, and increasing its durability against chemical attack. These materials include fly ash, rice husk ash, silica fume, and granulated blast-furnace slag. Only fly ash and silica fume will be discussed extensively because the mix designs in this study are developed using these two pozzolanic materials. Fly Ash Fly ash is considered a pozzolanic material because it is composed of a high portion of silica and alumina that react with Ca(OH)2 to form cementitious material. Fly ash has fine particles with sizes ranging from 1 to 100 µm. The average size of fly ash is in the range of 9 to 15 µm. Fly ash could be divided into two categories.
3

The main difference between them is the calcium contents or, more specifically, the lime (CaO) contents. The first category is referred to as high-calcium fly ash, which contains between 15 to 35 percent of CaO. This ash is generally obtained from the combustion of lignite and bituminous coals. The ASTM C 618 (1) also refers to it as Class C fly ash. The second category is low-calcium fly ash, which usually contains less than 5 percent of CaO. Low-calcium fly ash is a product of the combustion of anthracite and bituminous coals. The ASTM C 618 specifies it as Class F fly ash. Besides the difference in calcium contents, high-calcium fly ash also contains a lower amount of unburned carbon. It usually contains less than 2 percent whereas low-calcium fly ash contains between 2 to 10 percent. Because of the difference in calcium content, the reactivity between the two types of fly ash is different. Low-calcium or Class F fly ash is less reactive and needs about 2 weeks to hydrate. Its reactivity depends largely on the composition and mineralogy of portland cement, as well as the fly ash particle size. The finer the size of the particles, the more reactive the ash becomes. The optimum size of the particle for Class F fly ash is 10 µm. The fine particle also contains a lower amount of carbon. On the other hand, high-calcium or Class C fly ash is more reactive and needs about 3 days to hydrate. In some cases it could be reactive enough to possess hydraulic properties. Effect of Fly Ash on Fresh Concrete The effect of fly ash on fresh or hard concrete depends on the composition, fineness, and consistency of the fly ash. The high level of variation in fly ash composition from different sources creates a problem. Fly ash is an industrial by-product, or in other words, it is the waste product collected during the coal combustion; therefore no quality control exists for the ash added to concrete. The quality control is also very hard to achieve because of the irregularity of the power consumption throughout the days and from place to place. Today, some suppliers treat and classify fly ash used in concrete to improve the quality of fly ash. One of the most important characteristics of freshly mixed concrete is the water requirement of the matrix. Concrete containing fly ash will either increase or decrease the water requirement of concrete. Researchers generally agree with Minick et al (2) that the increase or decrease in the water requirement is based on the loss of ignition or carbon content and the fineness of fly ash. The increase in the water requirement of concrete could be explained by the absorption of moisture by carbon particles and the interference between coarse fly ash particles, as well as the aggregates that cause the matrix to be more viscous. Therefore, some low-calcium or Class F fly ash could decrease the flow ability of concrete because the carbon content could be as high as 12 percent. Notably, the high carbon content in fly ash is caused by the large and coarse particles in fly ash.
4

The lower water requirement phenomenon of fly ash is debatable. However, one widely accepted explanation is the increase in paste volume (3). The paste volume increases because in practice fly ash is added to the mix as a portland cement replacement by weight and not by volume. Because portland cement is denser than fly ash, the volume of the paste increases; this contributes to the increase in flow ability. Also, fly ash particles, which are smooth and spherical in shape, act as a ball bearing between the cement particles; this increases the workability and mobility of the concrete. Another factor that effects the water requirement of fly ash is its particle size. Fly ash with a small particle size improves the workability as well as the quality of fly ash (7, 23). Fly ash with a small particle size contains higher volume of both the glass contents and spherical particles. Thus it reduces superplasticizer, improves workability, and improves the strength development of concrete. Fly ash with a nominal size of 10 micron or less performs the best. Bleed-water is another important characteristic of fresh concrete. Excessive bleeding could cause segregation and delamination of the top layer of the concrete if the bleed-water is accidentally added to the top surface of fresh concrete during the finishing process. However, if the concrete is not allowed to bleed, plastic shrinkage could occur on a hot windy day. Plastic shrinkage is easily solved by proper protection of the finished concrete; therefore, less bleed-water is warranted. Both Class C and F fly ash decrease the bleed-water in concrete by introducing fine particles that flocculate and obstruct its flow. Class C fly ash reduces the bleed water more than Class F fly ash (18). Hydration is the chemical reaction between cement and water or (for HPC) mineral admixtures and water. When concrete hydrates it dissipates heat; this is called the heat of hydration. Heat of hydration is very important because, when excessive in concrete, it could lead to thermal cracking. Thermal cracking occurs when the thermal expansion of concrete is greater than its tensile strength. Fly ash reduces the heat of hydration in concrete. This is a result of the slow reaction between the pozzolan (SiO2, Al2O3) and calcium hydroxide (Ca(OH)2). Because of this low heat of hydration, fly ash is often used for mass concrete or as a substitution for Type II and IV portland cement. On the other hand, its slow reaction retards the setting time of concrete (see reference 2, 3, 4, and 5). The retardation caused by fly ash could be as high as 200 percent more than regular concrete. It depends on the composition, as well the quantity, of fly ash being added to the cement. This is usually the case in the event that low-calcium or Class F fly ash with high carbon content is used to replace a portion of portland cement. The opposite is also true; in high-calcium or Class C fly ash, the composition could be reactive, leading to a quickly set concrete. Despite the slower setting time, it is still within the 8-hour limit set by ASTM C150(1).
5

Another factor that effect fly ash concrete at the plastic stage is curing. Killoh et al look at the influence of curing at different relative humidity on the hydration and porosity of a portland/fly ash paste (29). They use small samples of portland/fly ash (70/30) paste with water binder ratio of 0.59, initially cured for 7 days and then exposed to different relative humidity. At 28 and 91 days a thermogravimetry and methanol absorption are performed to measure the reaction and porosity. The test result shows that the pozzolanic reaction falls when the relative humidity is below 80 percent. The porosity of concrete despite falls slightly under saturated condition, the large diameter porosity is 3 times higher under drying condition than saturated condition. Therefore the relative humidity must be kept at 95 percent, at least in the early curing age, in order to decrease the porosity in concrete.
Effect of Fly Ash on Mechanical Properties of Concrete The compressive strength of concrete containing fly ash is generally lower than that of regular concrete, especially in its early ages (see reference 3, 11, 16, 17, and 18). The 1-day strength of concrete containing fly ash could be as low as 50 percent of the 1-day strength of regular concrete. This is more prominent when using low-calcium or Class F fly ash because the rate of the alkaline-to-silica reaction is slower. As for high-calcium or Class C fly ash, the results are two-fold depending on the reactivity of the lime particles in the ash. If the lime content is highly reactive, the compressive strength could be higher than regular concrete even at 1 day and vise verse (18). Despite the lower early-age compressive strength of fly ash concrete, the long-term compressive strength for both low- and high-calcium fly ash is comparable with regular concrete after 90 days; this is because of the late (usually after 2 weeks) hydration of fly ash. Both laboratory and field data confirm the long-term strength increase of fly ash. Dunstan et al have investigated the long-term effect of concrete with a high volume of fly ash by coring samples from different 10-year-old concrete pavements in the United Kingdom (6). They established that the concrete strength is still increasing. In some cases the strength increases up to 50 percent higher that obtained at 28 days. Because of the early-age strength reduction of fly ash concrete, attempt has been made to minimize the strength loss. Berry et al try to diminish the strength reduction by classifying fly ash into different fractions (7). From their study they find the compressive strength reduction decreases as the material fraction of fly ash becomes smaller. Fly ash with 10 µm particle size or with a smaller fraction has the lowest compressive strength reduction at an early age and a surplus of the regular concrete compressive strength at a later age. Another method for reducing the strength loss is an addition of silica fume (3) or by using Type III portland cement (24). Bilodeau and Malhotra discovered that there is a strength increase of about 1,160-psi over Type I portland cement.
6

However, Type III cement shortened the setting time of high-volume fly ash and increased the autogenous temperature of concrete (but the temperature rise is still lower than Type III cement alone). The drying shrinkage remains the same as Type I cement. Moreover, using heat curing could also reduce the early-age strength loss. Carette et al study the development of heat-curing cycles for concrete containing fly ash for the precast industry (28). The heating cycles use in the study were 2 or 4 hours preset time, follow by heat curing for a period of 8, 12, 16, or 20 hours at curing temperature of 55, 70 or 90OC. The specimens are then left to cool at room temperature for 2 hours. They determine that heat curing could increase the early age compressive strength of concrete and therefore fly ash could be used for precast elements. In the investigation, two heat cycles is suggested, 12 hours heat curing at 90OC with a preset time of 2 hours or a 24 hours cycles at 55 to 70OC with a preset time of 4 hours. However for other mix proportion other heating cycles need to be modified in the lab. The strength reduction also directly causes the modulus of elasticity of concrete containing fly ash to be lower than that of regular concrete. However, based on compressive strength criteria, the modulus of elasticity of concrete containing fly ash is comparable with that of regular concrete having the same strength. It is also observed in many research projects that the modulus of elasticity increases parallel to the compressive strength. Only one difference exists between concrete containing fly ash or any other pozzolanic material and regular concrete; in the latter the transition zone is less dense, and, thus, the cement paste dictates the mechanical properties. On the other hand, in concrete containing pozzolanic material the transition zone is denser. Hence, the cement paste becomes stronger than the aggregate, which alter the failure criteria from cement paste to aggregate. As a result, the mechanical properties are controlled by the properties of the aggregates at low water-to-binder (w/b) ratio. As mentioned earlier, dense microstructures are caused by the calcium hydroxide in cement reacting to pozzolan to create calcium silica hydrate (CSH-gel) (therefore eliminating the transition zone or weak link between the binder and the aggregates). Many researchers illustrated this by comparing the calcium hydroxide level in concrete with and without a pozzolanic material additive. Their data shows a decrease of Ca(OH)2 in concrete containing pozzolanic material (8, 9, 10) . As far as the effect of fly ash on the creep and drying shrinkage of concrete, the results presented by many researchers contradict each other and are, therefore, inconclusive. The main reason for this is the inherent sensitivity of the test. Both creep and drying shrinkage depends on the exact chemical composition of the matrix. Generally, concrete containing less than 20 percent of fly ash will have a creep strain either lower or comparable with that of regular concrete in the long run. The justification for this effect is the smaller percentage of compressive strength reduction, as well as the late hydration, which increases the rate of compressive strength at a later date.
7

Some mix results show both increase and decrease of drying shrinkage to concrete containing fly ash in comparison with regular concrete. However, the drying shrinkage property is likely to be affected in a manner similar to creep (3). Nasser and Al-Manaseer looked at the shrinkage and creep of concrete containing 50 percent fly ash (20). The shrinkage result showed about 11 percent higher than ordinary portland cement concrete. Whereas the creep is lower for concrete containing fly ash, 13 percent for unsealed and 39 percent for sealed specimens. Furthermore, the creep of concrete has a linear relationship with stress to compressive strength ratios. Luther and Hansen also compare the creep and shrinkage of high-strength silica fume concrete with fly ash concrete with similar strength (33). The result shows that there is no significant different in creep of silica fume concrete with fly ash concrete. On the other hand the shrinkage of silica fume concrete is equal or better than fly ash concrete. Other mechanical properties, tensile strength, modulus of rupture, and modulus of elasticity of the concrete are the same. Other mechanical property that has been studied is the effect of fly ash on the fatigue behaviors. Tse et al study the fatigue behavior of concrete containing fly ash (19). In their study they subjected specimens of different percentage of fly ash of either Class C or F to fatigue load. The results show that Class C fly ash with less than 50 percent portland cement replacement performed better than plain concrete. However, the reverse effect is true for Class F fly ash. The reason for this is due to the lower compressive strength of concrete with Class F fly ash. The effect of curing on the mechanical properties of concrete is also examined. Swamy and Mahmud study the mechanical properties of concrete containing 50 percent Class F fly ash with low water-cement ratios of 0.32 to 0.42 (21). Furthermore they also investigated the curing on concrete containing fly ash. The result showed that high early strength could be obtained with slump in excess of 150 mm. The concrete containing fly ash had a higher strength gain of 50 to 100 percent from 28 days to one year than ordinary portland cement concrete that has a strength increase of 18 to 25 percent under wet curing. Also under air curing, the strength development of concrete containing fly ash was steadier and reaches the target strength but for ordinary portland cement concrete the strength were below the target strength of 25 to 35 percent. Nevertheless, air curing has a negative on mechanical properties of concrete for both ordinary and fly ash concrete. Overall, the effect of the mechanical properties of fly ash on concrete is highly dependent on the composition and the fineness of the fly ash. Fly ash with a higher calcium level tends to be more effective in the compressive strength largely because of the accelerated rate of hydration. Interestingly, the loss of ignition or carbon content in fly ash has no direct effect on the mechanics of concrete.
8
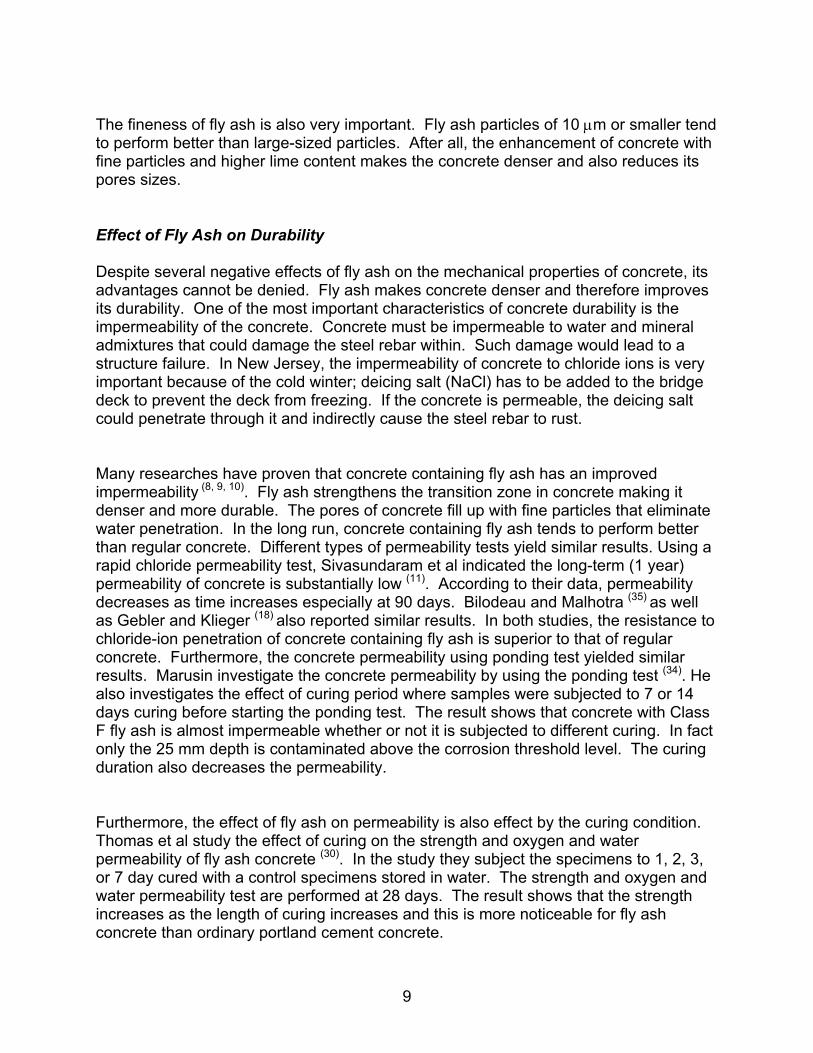
The fineness of fly ash is also very important. Fly ash particles of 10 µm or smaller tend to perform better than large-sized particles. After all, the enhancement of concrete with fine particles and higher lime content makes the concrete denser and also reduces its pores sizes. Effect of Fly Ash on Durability Despite several negative effects of fly ash on the mechanical properties of concrete, its advantages cannot be denied. Fly ash makes concrete denser and therefore improves its durability. One of the most important characteristics of concrete durability is the impermeability of the concrete. Concrete must be impermeable to water and mineral admixtures that could damage the steel rebar within. Such damage would lead to a structure failure. In New Jersey, the impermeability of concrete to chloride ions is very important because of the cold winter; deicing salt (NaCl) has to be added to the bridge deck to prevent the deck from freezing. If the concrete is permeable, the deicing salt could penetrate through it and indirectly cause the steel rebar to rust. Many researches have proven that concrete containing fly ash has an improved impermeability (8, 9, 10). Fly ash strengthens the transition zone in concrete making it denser and more durable. The pores of concrete fill up with fine particles that eliminate water penetration. In the long run, concrete containing fly ash tends to perform better than regular concrete. Different types of permeability tests yield similar results. Using a rapid chloride permeability test, Sivasundaram et al indicated the long-term (1 year) permeability of concrete is substantially low (11). According to their data, permeability decreases as time increases especially at 90 days. Bilodeau and Malhotra (35) as well as Gebler and Klieger (18) also reported similar results. In both studies, the resistance to chloride-ion penetration of concrete containing fly ash is superior to that of regular concrete. Furthermore, the concrete permeability using ponding test yielded similar results. Marusin investigate the concrete permeability by using the ponding test (34). He also investigates the effect of curing period where samples were subjected to 7 or 14 days curing before starting the ponding test. The result shows that concrete with Class F fly ash is almost impermeable whether or not it is subjected to different curing. In fact only the 25 mm depth is contaminated above the corrosion threshold level. The curing duration also decreases the permeability. Furthermore, the effect of fly ash on permeability is also effect by the curing condition. Thomas et al study the effect of curing on the strength and oxygen and water permeability of fly ash concrete (30). In the study they subject the specimens to 1, 2, 3, or 7 day cured with a control specimens stored in water. The strength and oxygen and water permeability test are performed at 28 days. The result shows that the strength increases as the length of curing increases and this is more noticeable for fly ash concrete than ordinary portland cement concrete.
9

The same effect is also observed for the oxygen and water permeability. Longer curing is needed to obtain lower permeability in concrete. Another important durability factor for concrete is the ability to resist chemical attacks. Chemical attacks such as sulfate cause the concrete to deteriorate and rupture because of the expansion of concrete from the alkaline-silica reaction, which produces ettringite and gypsum. This occurs when a substantial amount of sulfate exists in the aggregates or the soil within the area. The addition of fly ash improves the concrete resistance to sulfate. The resistance depends on the type and the amount of fly ash used. Generally, Class F fly ash performs better than Class C fly ash because of the high-calcium content, which is more reactive with the sulfate. This is supported by numerous literatures. Freeman and Carrasquillo look at the sulfate resistance of fly ash concrete(25). They use Class C or Class F fly ash to replace 25 to 35 percent of Type II portland cement. For mixtures with Class F fly ash, the sulfate resistance performs equally or better than Type II cement alone. On the other hand Class C fly ash has lower resistance to sulfate resistance. However if the ash is intergounded into the cement, the sulfate resistance improves. Sturrup et al also published similar results in their study of the durability of fly ash concrete (4). They discover that a replacement of 25 percent of fly ash could reduce alkali silicate expansions. Another, literatures is shown in Ramachandran et al paper where they use high volume fly ash to control alkali-aggregate reactivity (36). The use of high volume fly ash found to be effective in reducing the expansion due to alkali-aggregate reactivity. Despite these durability benefits, there are some durability factors that need to be cautious when using fly ash. These durability factors include, deicer scaling and freezing and thawing resistance. These durability factors are very important in New Jersey because of the high temperature changes. The ability of concrete to resist freezing and thawing cycles as well as deicer scaling depends on the entrain air in concrete. Generally, concrete with 6 percent air content performs well in freezing and thawing as well as deicer scaling. Whiting (26) study the resistance of deicer scaling of concrete containing fly ash. The specimens are subjected normal construction curing practice of 7 days moist curing. In his study the result shows that the deicer scaling resistance is reduced with the reduction in portland cement. A fly ash replacement of 50 percent by weight of portland cement performs unsatisfactory in the deicer resistance. Also to increase the resistance to deicer salt the water to binder should be kept low. Barrow et al, who study the temperature of concrete containing either Class C or F fly ash, also supported Whiting conclusion (31). In their study, the resistance to scaling in the present of deicer salt of fly ash concrete is not as good as regular concrete. Similarly, freezing and thawing resistance of fly ash concrete is also not good as regular concrete. Nasser and Lai study the freezing and thawing resistance of concrete containing high volume of fly ash (27). They observe that concrete with 50 percent of fly ash perform unsatisfactory.
10

They suggested the reason that contributes to this is because of the slow migration of portlandite and ettringite crystals from C-S-H to the air voids or in other words, the percentage of entrained air in fly ash concrete decreases. Gebler and Klieger also study the effect of air entraining concrete containing fly ash (12). In their study they discovered that concrete containing fly ash generally performs well in freezing and thawing, but the fly ash does not improve the freezing and thawing resistance more than regular concrete. They also suggested that Class C fly ash performs better than Class F fly ash. In their study, Class F fly ash concrete samples exhibit a higher weight loss; they suspected the silica content has an adverse effect on the freezing and thawing of concrete. However, concrete containing fly ash performs comparably with regular concrete. Class F fly ash has a negative effect on freezing and thawing because the plastic concrete containing Class F fly ash loses more air than Class C fly ash or regular concrete. The higher organic matter content, carbon content, and loss of ignition in Class F fly ash cause this. Silica Fume Silica fume is a highly reactive pozzolanic material primarily composed of silicon dioxide (SiO2) in noncrystalline form. It is a light to dark gray or bluish green-gray powder produced by an electric arc furnace during the manufacture of silicon or ferrosilicon alloy. It has a spherical like fly ash, but it is 100 times smaller, with an average diameter size of 0.1 µm. Its specific surface area is very large compared to portland cement (20,000 m2/kg (by nitrogen absorption method) versus 300 m2/kg, respectively). Effect of silica fume on fresh mix concrete Silica fume is a highly active pozzolan; it is essentially silicon dioxide in noncrystalline form, having a large specific surface area. Like other pozzolans, SiO2 reacts to Ca(OH)2 with the presence of water to form C-S-H. Because of the small size and the large surface area of silica fume, it absorbs a lot of water, making the water-demand for silica fume concrete very high and the setting time of the concrete very fast. In general, concrete containing silica fume has either a superplasticizer or retarder added to it. The superplasticizer increases the flow of concrete without affecting the w/c ratio. Superplasticizer propels the water from the silica fume particles to increase the workability of the concrete for a few minutes; because of this, superplasticizer also retards the mix. On the other hand, when the workability of concrete is not an issue, a retarder is used to slow down the reaction to increase the working time with concrete. Besides increasing the setting time and workability, these two chemical admixtures offer other benefits. One of the advantages is their effect on the rate of change of heat in concrete. Concrete containing silica fume releases a very high heat of hydration.
11

As discussed by Roy, the rate of hydration of silica fume is very high because of the intense reaction between the silica fume and portland cement (13). This high heat could cause microcracking if the concrete is subjected to wind; this is the major disadvantage of silica fume concrete. Another disadvantage of silica fume on concrete is the high viscosity, making the concrete difficult to pump. An additional advantage of silica fume is the cohesiveness it offers the mix, causing less bleed-water. In fact, silica fume concrete does not release any bleed-water at all. This is a major advantage, as well as a disadvantage. The advantage is the elimination of segregation because no extra water exists on the top surface of the concrete. However, because water is not released, its evaporation could leave pores in the concrete if the concrete is not properly consolidated. Mechanical properties of silica fume concrete Silica fume is known for its ability to increase the strength of concrete because of its chemistry and hydration. Silica fume, when added to portland cement, reacts rapidly to form C-S-H. As a matter of fact, for very low w/c ratio concrete, the aggregate, rather than the cement paste, controls the concrete strength. Because of the higher strength of silica fume concrete, other mechanical properties of the concrete also improve. Charif et al study the mechanical properties of silica fume concrete as part of a vast research program concerning the calculation and the reduction of concrete slab deformations (39). Their final results indicate concrete containing silica fume can increase the compressive strength by 100 to 150 percent. The elastic modulus can be increased by 20 to 30 percent. The tensile strength can be increased by 40 to 60 percent. The creep deformations can be reduced by 30 to 60 percent. Creep is a very important concrete property, especially for prestressed concrete. Prestressed concrete is usually designed to have higher compressive strength, thus silica fume concrete is perfect for this application. There are numerous paper published investigating creep and shrinkage of silica fume concrete. Persson correlated laboratory and field tests of creep in HPC carried out between 1991 and 1999 (44). For this purpose, about 400 cylinders made out of eight mix compositions of HPC were studied in the laboratory. Half the number of HPC was sealed; half of the studies were carried out on air-cured HPC. Parallel tests on strength, internal relative humidity, RH, and hydration were carried out on about 900 cubes made of HPC from the same batch as the cylinders. Fragments from the strength tests were used to observe RH. Shrinkage was studied in relation to creep. The results and analyses of the laboratory studies show a large influence of the maturity, as well as of the mix composition, of the HPC on the measured creep. The creep coefficient of HPC is smaller than in normal concrete. In contrast, shrinkage of HPC is somewhat larger than in normal concrete.
12

Similar creep result is reported by Al-Khaja, who investigated high strength concrete mixes with and without silica fume in the Arabian Gulf region (40). In his study, silica fume considerably reduces creep of concrete, given 1 month reduction strain of 18.5-percent for creep. Wiegrink et al, whom study the shrinkage cracking of high strength concrete, show similar shrinkage result (41). According to their study, silica fume concrete shows higher shrinkage and lower creep. Cracking for high-strength silica fume concrete develops much faster and is significantly wider than that of normal-strength concrete. Moreover, not only the drying shrinkage increases but also autogenous shrinkage for silica fume is very significant since this could be as high as drying shrinkage. Kanstad et al. perform a study to address the effect of silica fume on the early age crack sensitivity of HPC (43). Tests were performed on concrete containing silica fume ranging from 0 to 15 percent, with a w/c ratio of 0.40. They canvassed realistic temperatures, tensile strength, modulus of elasticity, and autogenous shrinkage. All tests were conducted under isothermal conditions. Data were collected for 7 days for autogenous shrinkage. They concluded an increase in silica fume content raises the tensile strength and modulus of elasticity but also causes more of autogenous shrinkage. Despite the higher drying shrinkage, increasing the curing time could reduce this. Hindy et al report the drying shrinkage results of ready-mixed concrete containing silica fume (38). The concrete containing silica fume and ordinary concrete have a compressive strength of 98 MPa (14,200 psi) and 80 MPa (11,600psi) at 91 days, respectively. The effect of curing time, curing conditions, silica fume content, and w/c ratio were investigated. The drying shrinkage for both concretes decreases as the curing time increases or as the w/c ratio decreases. They also compared the drying shrinkage of small specimens with an actual-sized column made with the two concretes. From the comparison, the shrinkage measured using the small specimens overestimate the drying shrinkage of the actual-sized columns. In addition to compressive creep, an attempt has been made to study the tensile creep properties of silica fume concrete. Koveler et al study the effect of the tensile creep behavior of concrete at early ages (42). They found the use of 10 percent silica fume increases the early age tensile creep of high strength concrete in comparison with concrete without silica fume at the same w/c ratio of 0.33. Durability characteristic of silica fume concrete Silica fume improves the durability of concrete tremendously because of its denser microstructures. Many researchers (14, 15), including these authors, have observed the permeability of concrete decreases when about 10 percent of silica fume is added to it.
13

Gagné et al investigate the chloride-ion attack on low water-cement ratio pastes containing silica fume (15). As it is well established that concrete is more perceptible on chloride-ion attack when the pH of concrete is below 13. This is due to the leaching of calcium ions that facilitates the penetration of chloride ions. In their investigation they subject the specimens that consist of Type III cement, Type III cement with 6 percent silica fume, and French CPA-HPR cement with 6 percent silica fume paste, to 3 percent sodium chloride solution at a pH level of 11.5 and 13. Mercury intrusion porosimetry, X-ray diffraction, scanning elecron microscopy and electron microprobe measurements are the techniques used for the study. From their result, they concluded that silica fume decrease chloride penetration at the pH level of 11.5. Another report that shows the superior durability of silica fume concrete is by Berke, who investigates the effect of silica fume on the resistance of steel corrosion, erosion, and chemical attacks (48). In his study, concrete with embedded steel rebar are produced with varying level of silica fume from 0 to 15 percent by cement weight (0 to 30 percent for chemical testing). Other parameters in the investigation are the water-to-cement ratio and calcium nitrate. Polarization resistance and macrocell corrosion techniques are used to measure the corrosion rate in the steel rebar. The specimens are immersed in 3 percent NaCl solution for both methods. The United States Army Corp of Engineers method CRD-C 63-80 is used to perform the erosion test. The chemical testing is performed in 5 percent acetic acid, 1 percent sulfuric acid, 5 percent formic acid, and mixed sulfates. From his results, silica fume improves the resistance to steel corrosion, erosion, and chemical attack. Nevertheless, one major disadvantage associated with silica fume concrete is micro-cracks. Silica fume concrete, if improperly cured, will crack while it sets because of the temperature differential that stresses it. The temperature differential results from the heat of hydration, which is relatively high for silica fume concrete. It causes the concrete to expand whereas the cool ambient temperature causes it to contract. This expansion and contraction could bring about enough stress for the concrete to crack. Combination of Silica Fume and Fly Ash in Concrete Silica fume and fly ash are a perfect combination since they complement each other. The advantage of one enhanced the disadvantage of the other. For instant, silica fume increases the strength whereas fly ash decreases the strength of concrete at an early age. Thus, adding silica fume to fly ash concrete would increases the early-age strength. On the other hand, adding fly ash to silica fume concrete would increases the slump and also prevents early-age shrinkage of concrete resulting in a more durable concrete.
14

Besides an improvement on the concrete mechanical property, there is also an improvement on the durability property. Gautefall, and Havdahl study the effect of silica fume on the mechanism of chloride diffusion into hardened cement paste (14). The specimens consist of both ordinary and blended cement with 10 percent fly ash. The silica fume is used to replace cement by weight ranging from 5 to 15 percent. They also vary the water-to-cement + pozzolan ratio from 0.5 to 0.9. The specimens are immersed in stagnant seawater at 20 ºC for 6 months and then tested for the chloride diffusion using a potentiometer titration procedure. Fick’s second law is used to determine the diffusion coefficient. From their results they conclude that silica fume reduced chloride diffusion. Furthermore, the blended cement specimens out perform the ordinary specimens. Slag Alexander tested blended cement concretes incorporating blast furnace slag and condensed silica fume (CSF) for modulus of elasticity, creep, and shrinkage strains, with the intention of comparing their performance with that of plain portland cement concretes (45). Exposed and sealed specimens were investigated. The results showed the exposure condition of the specimens during testing was critical. The addition of slag possibly caused a small increase in creep and shrinkage at early ages in exposed specimens, but this effect was usually reversed at later ages. Strains were markedly reduced in sealed slag specimens. The addition of CSF effected further moderate reductions in strains. Within-source and between-source variability of portland cement clinkers with regard to movement properties appeared to be considerable. The use of a blended cement resulted in less variability in cumulative strains. Khatri and Gross studied the effect of different supplementary cementitious materials on mechanical properties of HPC (46). They studied the mechanical properties, as well as fresh concrete properties, of concrete containing silica fume, ground-granulated blast furnace slag (slag), fly ash, and general-purpose (GP) portland cement. Concrete mixes were prepared with GP portland cement, high slag cement, and slag cement, and also mixes were prepared with the addition of silica fume and fly ash. The work focused on concrete mixes having a fixed w/b ratio of 0.35 and a constant total binder content of 430 kg/m3. Apart from measuring fresh concrete properties, the evaluated mechanical properties were development of compressive strength, flexural strength, modulus of elasticity, and strain because of creep and drying shrinkage. Results indicated the addition of silica fume to GP portland cement concrete marginally decreased the workability of the concrete but significantly improved the mechanical properties. However the addition of silica fume to high slag cement concrete had a less pronounced effect on the workability and mechanical properties of the concrete.
15

Li et al. studied the effect of blended cement on early age shrinkage and creep (47). Cement was blended with silica fume, granulated slag, and their combination. The test parameters were w/b ratio, aggregate content, blended cement, and dry and sealed curing conditions. It was concluded a lower w/b ratio is associated with higher autogenous shrinkage. The drying shrinkage of concrete mixtures with a higher w/b ratio was lower, provided they had a higher aggregate content than mixture with lower w/b ratio. The blended cement concrete gave higher shrinkage results than the ordinary portland cement. RESEARCH APPROACH This research is divided into four phases. In phase I, HPC mixes are developed using resources readily available in New Jersey. In phase II the developed HPC mixes are tested for their durability; permeability (rapid chloride permeability), scaling, and freeze-thaw tests are performed on the concrete. In phase III and IV shrinkage and creep of HPC, respectively, are investigated. Phase I of the program is to establish an HPC mix design with a targeted compressive strength ranging from 6 to 10 ksi. The final mix design incorporates two types of pozzolanic materials, silica fume and fly ash. The pozzolanic materials are used as a direct replacement of cement by weight. The replacement amounts of silica fume and fly ash are between 5 and 15 percent and between 10 and 25 percent, respectively. A total of eight combinations of pozzolanic materials exist for a given w/b ratio (The binder consists of cement and pozzolans.). The w/b ratios investigated consist of 0.44, 0.39, 0.37, 0.35, 0.33 and 0.29. A total of 48 mixes exist. All mixes are tested for their compressive strength. For selected mixes, the drying shrinkage and the modulus of elasticity are tested. In addition, the effect of curing methods on concrete compressive strength is also investigated. The mix proportioning of these mixes are shown in Table 4. Phase II of the program focused on the durability of the selected mix designs and also the method of curing. The performed durability test consisted of the rapid chloride permeability test (ASTM C1202), the freeze-thaw test (ASTM C666), and the scaling test (ASTM C672). The effect of curing on rapid chloride permeability is also investigated on one mix design. Phase III consisted of mixes related to autogenous shrinkage. A total of eight concrete mixes (seven normal weights and one lightweight aggregate) were made in the laboratory; their mix proportioning is given in Table 4.1. As shown in the table, four parameters were used in the study, 1) w/b ratio, 2) pozzolanic materials, 3) type of aggregates, and 4) superplasticizer content. The investigated w/b ratio consisted of 0.29 and 0.35.
16

A low w/b ratio of 0.29 was used to simulate a worst-case scenario for autogenous shrinkage. As for the combination of pozzolanic materials, the mixture containing only silica fume was considered a control. Fly ash was added to reduce shrinkage; granulated blast furnace slag (GBFS) is also added to the control mix. In this phase, three curing methods were applied to all the samples. The curing conditions consisted of curing with burlap, using a curing compound, and air-dry curing. In phase IV, compressive creep in HPC is studied. The mixes in this phase consist of HPC with compressive strengths ranging from 8 to 12 ksi. The mix design is based on some of the selected mixes, as well as mixes that contain only one pozzolanic material. Furthermore, a w/b ratio of 0.27 is used to obtain a compressive strength of 12 ksi. Other parameters include loading age, aggregates sources, and a percentage of pozzolanic materials. Phase I A comprehensive mix design of various research projects is collected and modified to fit with New Jersey resources. The mix design is based on ACI guidelines for high strength concrete. In this phase the mixes are selected based on the early and long-term performance of their compressive strengths. Properties of Materials The materials used in this project are readily available in New Jersey— with the exception of fly ash, which is obtained from Pennsylvania or Baltimore. Type I portland cement with a specific gravity of 3.15 was used. The mixing water is readily available from the tap at room temperature. The fine aggregate consists of concrete sand obtained from Weldon’s quarry in Fanwood, NJ. The sand has a bulk specific gravity at oven dry of 2.56, a dry-rodded unit weight of 107.17-lb/ft3, and a rate of absorption of 0.36 percent. Figure 1 shows the gradation of the concrete sand. The coarse aggregate consist of 3/8- and 3/4-in crushed stones obtained from the same quarry as the sand. They have a bulk specific gravity at oven dry of 2.81 and 2.84, a dry-rodded unit weight of 98.11 and 96.22 lb/ft3, and a rate of absorption of 1.0 and 1.2 percent, respectively. Figure 2 shows the gradation of the 3/8-in crushed stone. Some of the mix also utilized lightweight aggregate, which consists of shale-type material from New York. The nominal maximum size of the aggregates is 3/4-in. The specific gravity at oven dry is 1.23, the rate of absorption is 9.07 percent, and the dry rodded unit weight is 49.48 lb/ft3. The pozzolans consisted of silica fume, fly ash and slag. The silica fume, super plasticizer, and air entraining agent are obtained from W.R. Grace. The silica fume (FORCE 10000 D) has a specific gravity of 2.22. The superplasticizer consisted of a product called DARACEM 19 and ADVA 100. A product called DARAVAIR 1000 is used for the air entraining agent. Class F fly ash with specific gravity 2.49 was used.
17

0
20
40
60
80
100
0.0010.010.11
Perc
enta
ge P
assi
ng (%
)
Sieve Sizes (in)
Figure 1. Gradation of fine aggregates
Table 1. Gradation of fine aggregate Sieve Size
Percent Passing, %
No. 8 96.77 No. 16 85.57 No. 30 62.41 No. 50 24.28
No. 100 3.89 No. 200 0.66
Pan 0.00
18

0
20
40
60
80
100
0.0010.010.11Sieve Sizes (in)
Perc
enta
ge P
assi
ng (%
)
Figure 2. Gradation of coarse aggregates
Table 2. Gradation of coarse aggregateSieve Size
Percent Passing, %
No. 1/2 100 No. 3/8 61.71 No. 4 8.69 No. 8 1.85 No. 16 1.17 No. 30 0.92 No. 50 0.66
No. 100 0.42 No. 200 0.27 No. Pan 0
19
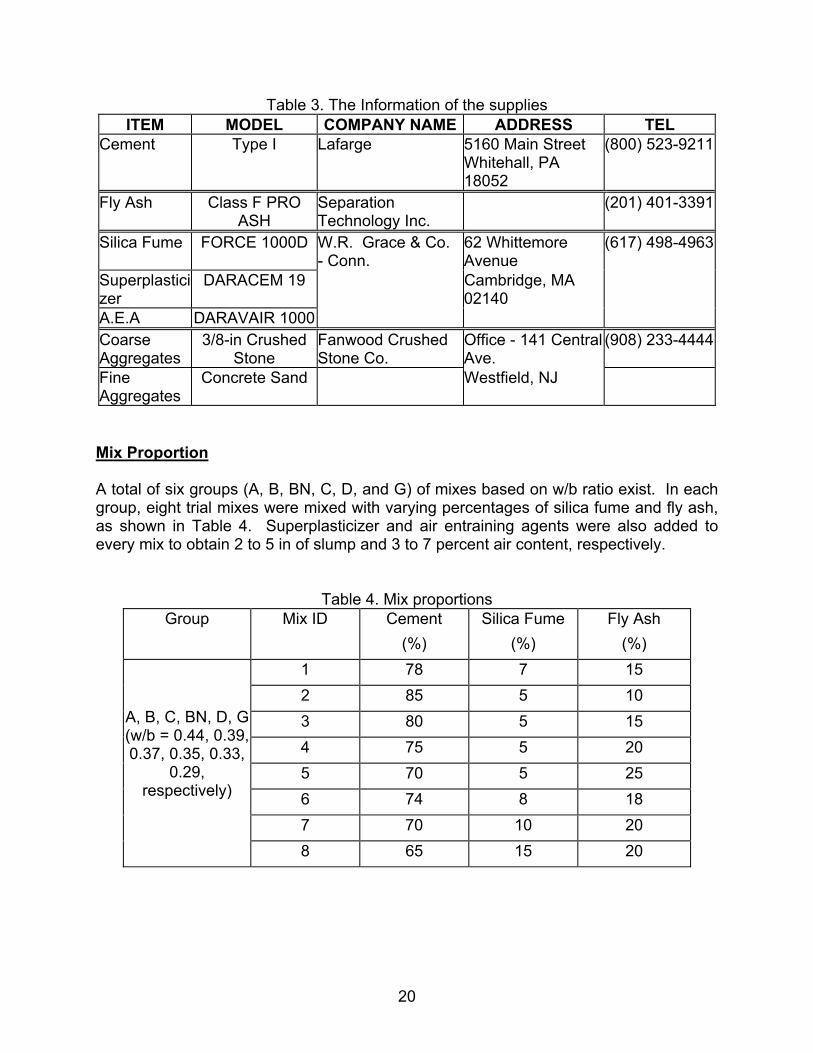
Table 3. The Information of the supplies ITEM MODEL COMPANY NAME ADDRESS TEL
Cement Type I Lafarge 5160 Main Street Whitehall, PA 18052
(800) 523-9211
Fly Ash Class F PRO ASH
Separation Technology Inc.
(201) 401-3391
Silica Fume FORCE 1000D 62 Whittemore Avenue
Superplasticizer
DARACEM 19 Cambridge, MA 02140
A.E.A DARAVAIR 1000
W.R. Grace & Co. - Conn.
(617) 498-4963
Coarse Aggregates
3/8-in Crushed Stone
Fanwood Crushed Stone Co.
Office - 141 Central Ave.
(908) 233-4444
Fine Aggregates
Concrete Sand Westfield, NJ
Mix Proportion A total of six groups (A, B, BN, C, D, and G) of mixes based on w/b ratio exist. In each group, eight trial mixes were mixed with varying percentages of silica fume and fly ash, as shown in Table 4. Superplasticizer and air entraining agents were also added to every mix to obtain 2 to 5 in of slump and 3 to 7 percent air content, respectively.
Table 4. Mix proportions Group Mix ID Cement Silica Fume Fly Ash
(%) (%) (%) 1 78 7 15 2 85 5 10 3 80 5 15 4 75 5 20 5 70 5 25 6 74 8 18 7 70 10 20
A, B, C, BN, D, G (w/b = 0.44, 0.39, 0.37, 0.35, 0.33,
0.29, respectively)
8 65 15 20
20
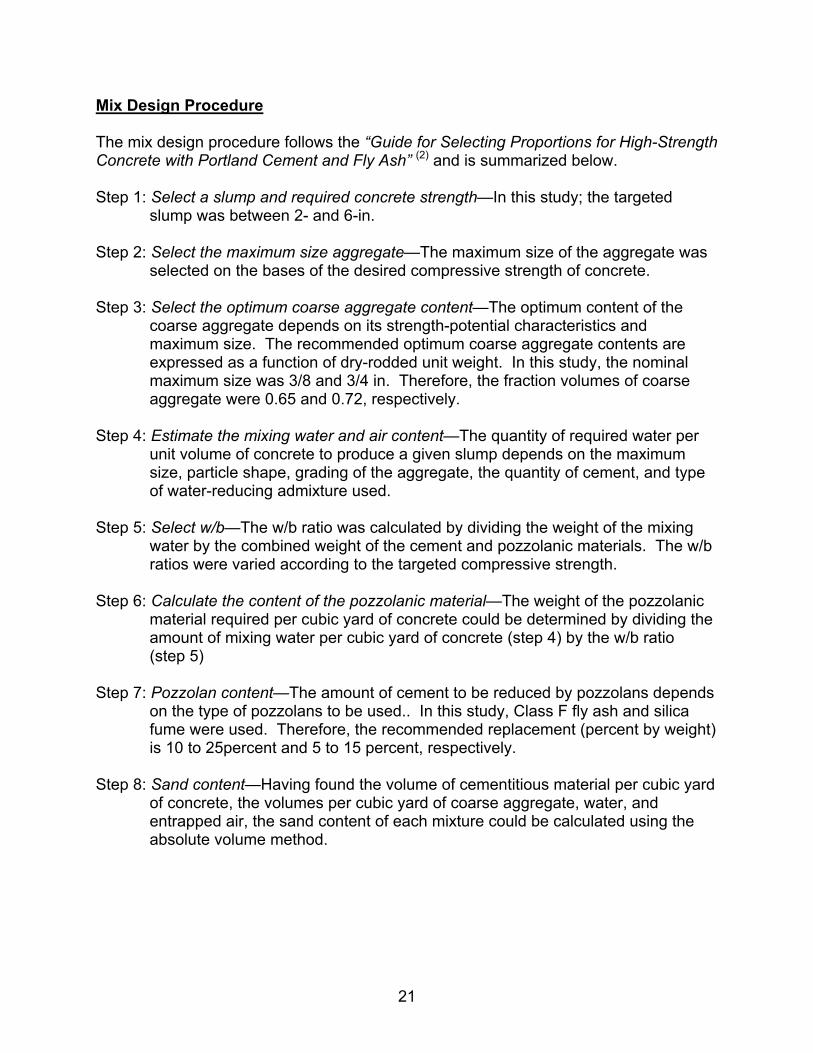
Mix Design Procedure The mix design procedure follows the “Guide for Selecting Proportions for High-Strength Concrete with Portland Cement and Fly Ash” (2) and is summarized below. Step 1: Select a slump and required concrete strength—In this study; the targeted
slump was between 2- and 6-in. Step 2: Select the maximum size aggregate—The maximum size of the aggregate was
selected on the bases of the desired compressive strength of concrete. Step 3: Select the optimum coarse aggregate content—The optimum content of the
coarse aggregate depends on its strength-potential characteristics and maximum size. The recommended optimum coarse aggregate contents are expressed as a function of dry-rodded unit weight. In this study, the nominal maximum size was 3/8 and 3/4 in. Therefore, the fraction volumes of coarse aggregate were 0.65 and 0.72, respectively.
Step 4: Estimate the mixing water and air content—The quantity of required water per
unit volume of concrete to produce a given slump depends on the maximum size, particle shape, grading of the aggregate, the quantity of cement, and type of water-reducing admixture used.
Step 5: Select w/b—The w/b ratio was calculated by dividing the weight of the mixing
water by the combined weight of the cement and pozzolanic materials. The w/b ratios were varied according to the targeted compressive strength.
Step 6: Calculate the content of the pozzolanic material—The weight of the pozzolanic
material required per cubic yard of concrete could be determined by dividing the amount of mixing water per cubic yard of concrete (step 4) by the w/b ratio (step 5)
Step 7: Pozzolan content—The amount of cement to be reduced by pozzolans depends
on the type of pozzolans to be used.. In this study, Class F fly ash and silica fume were used. Therefore, the recommended replacement (percent by weight) is 10 to 25percent and 5 to 15 percent, respectively.
Step 8: Sand content—Having found the volume of cementitious material per cubic yard
of concrete, the volumes per cubic yard of coarse aggregate, water, and entrapped air, the sand content of each mixture could be calculated using the absolute volume method.
21
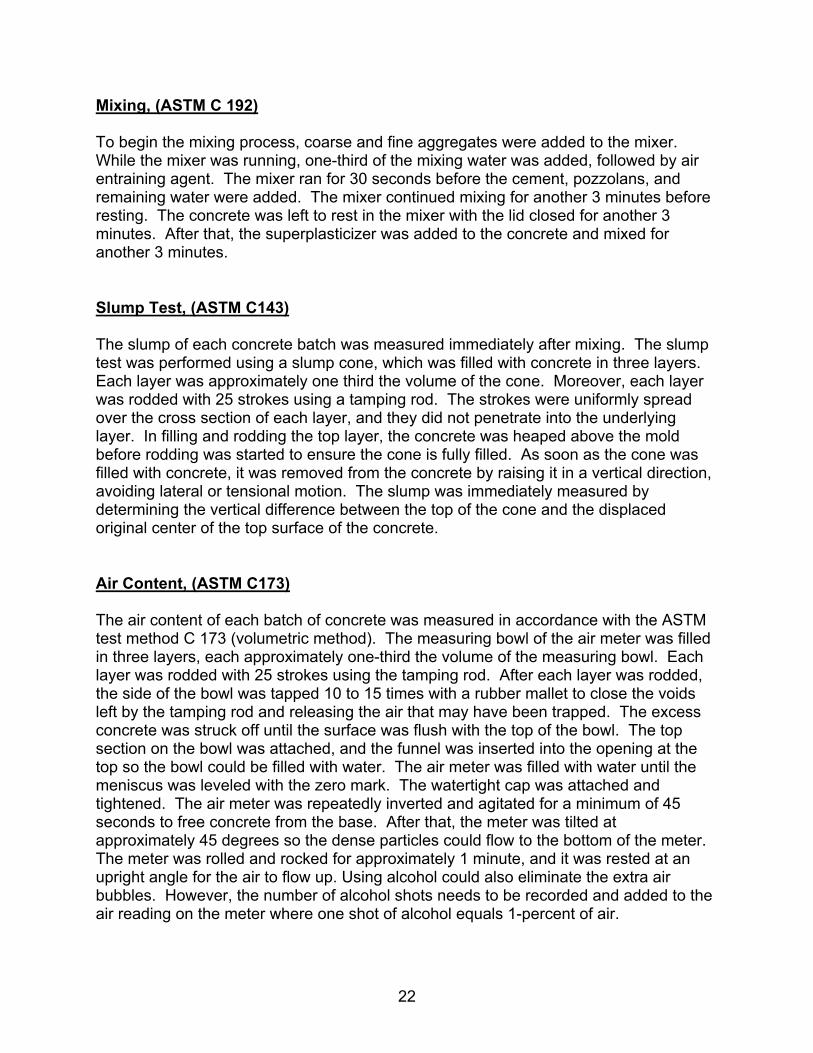
Mixing, (ASTM C 192) To begin the mixing process, coarse and fine aggregates were added to the mixer. While the mixer was running, one-third of the mixing water was added, followed by air entraining agent. The mixer ran for 30 seconds before the cement, pozzolans, and remaining water were added. The mixer continued mixing for another 3 minutes before resting. The concrete was left to rest in the mixer with the lid closed for another 3 minutes. After that, the superplasticizer was added to the concrete and mixed for another 3 minutes. Slump Test, (ASTM C143) The slump of each concrete batch was measured immediately after mixing. The slump test was performed using a slump cone, which was filled with concrete in three layers. Each layer was approximately one third the volume of the cone. Moreover, each layer was rodded with 25 strokes using a tamping rod. The strokes were uniformly spread over the cross section of each layer, and they did not penetrate into the underlying layer. In filling and rodding the top layer, the concrete was heaped above the mold before rodding was started to ensure the cone is fully filled. As soon as the cone was filled with concrete, it was removed from the concrete by raising it in a vertical direction, avoiding lateral or tensional motion. The slump was immediately measured by determining the vertical difference between the top of the cone and the displaced original center of the top surface of the concrete. Air Content, (ASTM C173) The air content of each batch of concrete was measured in accordance with the ASTM test method C 173 (volumetric method). The measuring bowl of the air meter was filled in three layers, each approximately one-third the volume of the measuring bowl. Each layer was rodded with 25 strokes using the tamping rod. After each layer was rodded, the side of the bowl was tapped 10 to 15 times with a rubber mallet to close the voids left by the tamping rod and releasing the air that may have been trapped. The excess concrete was struck off until the surface was flush with the top of the bowl. The top section on the bowl was attached, and the funnel was inserted into the opening at the top so the bowl could be filled with water. The air meter was filled with water until the meniscus was leveled with the zero mark. The watertight cap was attached and tightened. The air meter was repeatedly inverted and agitated for a minimum of 45 seconds to free concrete from the base. After that, the meter was tilted at approximately 45 degrees so the dense particles could flow to the bottom of the meter. The meter was rolled and rocked for approximately 1 minute, and it was rested at an upright angle for the air to flow up. Using alcohol could also eliminate the extra air bubbles. However, the number of alcohol shots needs to be recorded and added to the air reading on the meter where one shot of alcohol equals 1-percent of air.
22

The 1-minute rolling and rocking procedure was repeated until two consecutive readings do not change more than 0.25 percent of air. Consolidating Method Three layers of concrete were filled, each approximately one-third the volume of the mold. Each layer was vibrated using a vibrating table to consolidate the concrete. After each layer is vibrated, the outsides of the mold were taped lightly 10 to 15 times with a rubber mallet. The excess surface of the concrete was struck off and the cylinders were covered with plastic. Curing Method After 18 to 24 hours the specimens were demolded, carefully labeled, and placed in the curing room for moist curing at a temperature of 73 degree Fahrenheit and a rate of humidity of 97-percent. For the study of the effect of curing, the specimens were subjected to the following curing methods: Dry Curing (D)—The dry-cured specimens were left untouched after casting. After the specimens harden, they were demolded and stored in the environmental chamber. This curing method was used to simulate a worst-case scenario. Curing Compound (C)—The exposed surface of the specimens were coated with a thin layer of a commercially available curing compound using a brush, immediately after casting. After the concrete hardens, all the uncoated surfaces were coated using the same method. This method was common practice in industry and sometimes a substitute for moist curing. Burlap Curing (B)—Burlap cured specimens were covered with wet burlap after casting and wrapped when they harden. The burlap was monitored every 2 days to ensure its wetness. This curing method was used to simulate the best curing condition for concrete. The specimens were wrapped with wet burlap until the targeted time was reached. Burlap Curing (B) – Burlap cured specimens were covered with wet burlap, after casting and wrapped when they hardened. The burlap was monitored every two days to ensure its wetness. This curing method was used to simulate the best curing condition for concrete. The specimens were wrapped with wet burlap until the targeted time was reached.
23

Testing Procedures In this phase, the compressive strength, drying shrinkage, and modulus of elasticity were performed on the concrete. The compressive strength was performed on all of the concrete whereas drying shrinkage and modulus of elasticity were performed on selective mixes. Compressive Strength of Cylindrical Concrete Specimens (ASTM C39) The specimens were tested at 1, 3, 7, 14, 28, 56, and 90 days using a 400,000-lb Tinius-Olsen compressive machine. The loading rate of the Tinius-Olsen remained constant. The specimens were either capped using a neoprene pad or capping compound when tested.
Drying Shrinkage (ASTM490-93a) Drying shrinkage samples were cast the same way as described in the method of consolidation except the gauges studs were screwed into the plate of each end of the specimens. The plates were also attached to the molds with a hex screw from the other sides. After the molds were filled with concrete, the hex screw needs to be removed so it would not create any stresses when the concrete is setting. The specimens were removed at the same time as the other specimens. After stripping the specimens from the mold, they were first placed in water so they have the same temperature. After about 15 minutes, the lengths between the two studs, as well as the length of the reference bar, were measured using a comparator. When making the comparator reading, the specimens were slowly rotated and a minimum reading was recorded. The length change was calculated by the following formula:
L = [(Lx-Li)100]/G (1) Where,
Lx = the difference between the length of the specimens and the reference bar at x days.
Li = the difference between the length of the specimens and the reference bar at 1 day.
G = the total length of the specimen = 10 in.
24

Stress-Strain Relationship, (Modulus of Elasticity), (ASTM469) The specimen is placed in the compressive machine with the strain-measuring equipment attached. Two types of strain measuring equipments were used, one consists of a compressometer and the other linear voltage displacement transducer (LVDT). The specimen was loaded at least twice. During the first load, which was primarily for the seating of the gauges, the performance of the gauge was observed. In hydraulically operated machines, the load was applied at a constant rate within a range of 30 to 40 psi/sec, and the load was applied up to approximately 40 percent its ultimate compressive strength. The load and deformation was recorded. To determine the modulus of elasticity, the results are plotted on a graph, in which the slope is the modulus of elasticity. Another method is to directly calculate the modulus of elasticity by using the equation:
E = (S2 – S1)/(ε2 – 0.00005) (2) Where, E = modulus of elasticity S2 = 40 percent of the ultimate stress. S1 = stress at 0.00005 strain ε2= strain where the stress reaches 40 percent of the ultimate strength Results and Discussion Fresh mix concrete Table 5 a and b show the mix proportions in percentages and the amount of chemical admixture added to each mix, as well as the fresh mix concrete properties.
Table 5a. Fresh mix properties FA SP AEA Air content Slump Mix w/b SF (%) (%) (oz/cwt) (%) (%) (in)
A1 0.44 7 15 8 0.1 2.5 1.5 A2 0.44 5 10 8 0.1 4.25 2.25 A3 0.44 5 15 8 0.1 2.5 1.8 A4 0.44 5 20 8 0.1 4 2 A5 0.44 5 25 8 0.1 3.5 2.25 A6 0.44 9 18 8 0.1 3.25 1.5 A7 0.44 10 20 8 0.1 3 1.5 A8 0.44 15 20 8 0.1 3.5 1.5
25

Table 5b. Fresh mix properties (cont.) FA SP AEA Air content Slump Mix w/b SF (%) (%) (oz/cwt) (%) (%) (in)
B1 0.39 7 15 10 0.1 7.5 5.75 B2 0.39 5 10 10 0.1 6.5 4.75 B3 0.39 5 15 10 0.1 5.25 3 B4 0.39 5 20 10 0.1 6 6 B5 0.39 5 25 10 0.1 3.5 3.2 B6 0.39 9 18 10 0.1 3 3 B7 0.39 10 20 10 0.1 3.5 2 B8 0.39 15 20 10 0.1 3 2
B1N 0.35 7 15 20 0.1 5 5.5 B2N 0.35 5 10 20 0.1 4 4 B3N 0.35 5 15 20 0.1 4.5 3 B5N 0.35 5 25 20 0.1 4.25 3.5 B6N 0.35 9 18 20 0.1 4 3.5 B8N 0.35 15 20 20 0.1 2 3 C1 0.37 7 15 10 0.1 1.75 1 C2 0.37 5 10 15 0.1 5 3 C3 0.37 5 15 10 0.1 4 1 C4 0.37 5 20 15 0.1 6 3.75 C5 0.37 5 25 15 0.1 8.5 9 C6 0.37 9 18 10 0.1 4.2 1.75 C7 0.37 10 20 10 0.1 4 0.75 C8 0.37 15 20 13 0.1 4 0.75 D1 0.33 7 15 18 0.1 4 3.5 D2 0.33 5 10 20 0.1 4 4 D3 0.33 5 15 18 0.1 4 3.5 D4 0.33 5 20 16 0.1 3.5 3.5 D5 0.33 5 25 14 0.1 4.5 5.5 D6 0.33 9 18 15 0.1 3.25 0.5 D7 0.33 10 20 15 0.1 3.5 1 D8 0.33 15 20 20 0.1 3 1.5 G1 0.29 7 15 22 0.1 3.5 4 G2 0.29 5 10 20 0.1 3 1.75 G3 0.29 5 15 22 0.1 3 5.375 G4 0.29 5 20 20 0.1 3.5 5.5 G5 0.29 5 25 16 0.1 3 4 G6 0.29 9 18 22 0.1 3 4 G7 0.29 10 20 20 0.1 3.5 3.25 G8 0.29 15 20 22 0.1 3.5 3.5
26

Compressive Strength Generally the mix proportion with the combination of 7 and 15, 5 and 10, 5 and 15, and 9 and 18 percent of silica fume and fly ash, respectively, outperform other mixes in the compression test. In addition, the mix with high early strength also has high long-term compressive strength. However, it is important to note that the mix with the combination of 5 and 15 percent of silica fume and fly ash, respectively, has higher workability. Thus lower the amount of superplasticizer and reducing cost. Two sets of mixes are selected from each group based on their compressive strength shown in table 6a and b. The effect of w/b ratio on compressive strength is also investigated. This effect is plotted on figure 3. From the graph, the compressive strength increases as the w/b ratio decreases. However, no constant relationship exists between the eight combinations. Also some of the 90-day compressive strength decreases. The suspected reason for this is most of the 90-day compressive strengths are very high (roughly 10 ksi). At this capacity, rather than the transition zone between the cement paste and coarse aggregate, the coarse aggregate itself becomes the strength-limited state. Therefore, the cylinder breaks between 10 to 12ksi. Another reason for explaining this is a limitation exists on the available apparatus for testing high strength concrete. Both the capping compound and the metal cap are designed for testing concrete between 4 to 7 ksi.
Table 6a. Selected mix design (Lb/cu yd.) Selected Mix Design
A2 A3 B1 B6 C2 C3 Portland Cement Type
I 85% 80% 78% 73% 85% 80%
Class F Fly Ash 10% 15% 15% 18% 10% 15% Silica Fume 5% 5% 7% 9% 5% 5%
W/CM 0.44 0.44 0.39 0.39 0.37 0.37 Super Plasticizer
(oz/cwt) 8 8 10 10 15 10
AEA (oz/cwt) 1.5 1.5 1.5 1.5 1.5 1.5 Slump 2.25 2.5 4.75 3 3 1
Air Content 4.25 2.5 6.5 3 5 4 28 days Compressive
Strength (psi) 6220 6154 6817 7494 8475 7696
28 days Shrinkage (%) 0.053 N/A 0.0437 0.0570 0.03 0.0357
27
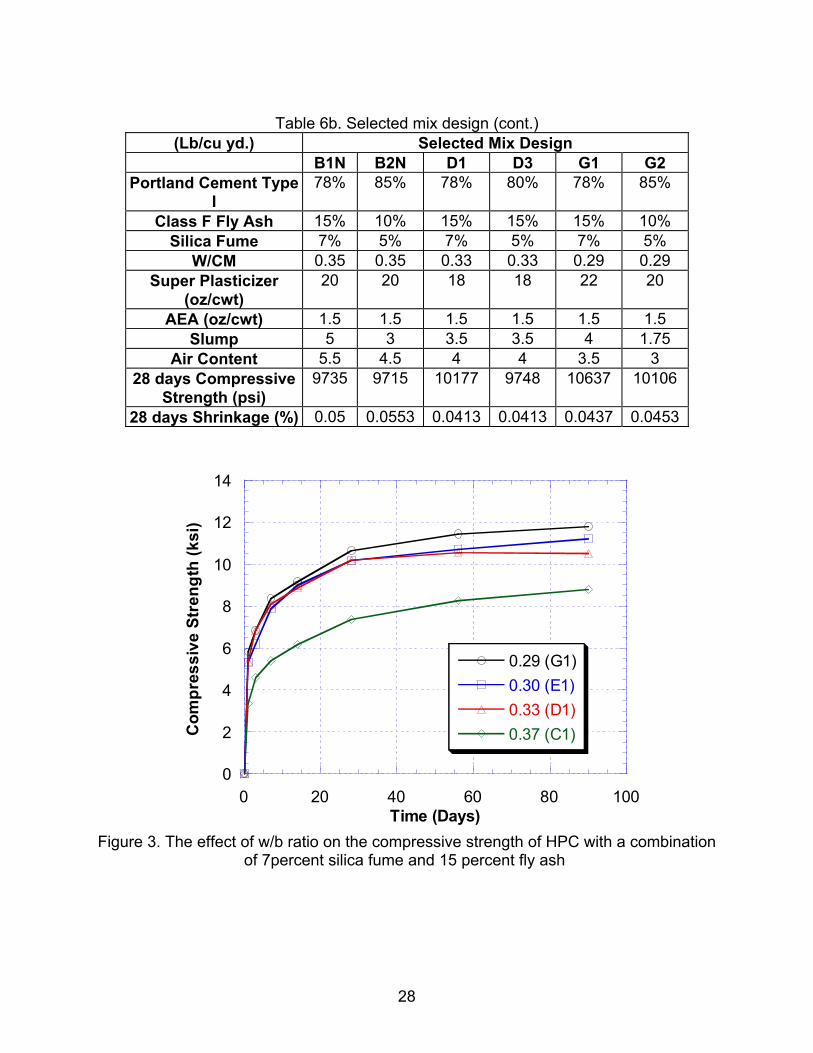
Table 6b. Selected mix design (cont.)
(Lb/cu yd.) Selected Mix Design B1N B2N D1 D3 G1 G2
Portland Cement Type I
78% 85% 78% 80% 78% 85%
Class F Fly Ash 15% 10% 15% 15% 15% 10% Silica Fume 7% 5% 7% 5% 7% 5%
W/CM 0.35 0.35 0.33 0.33 0.29 0.29 Super Plasticizer
(oz/cwt) 20 20 18 18 22 20
AEA (oz/cwt) 1.5 1.5 1.5 1.5 1.5 1.5 Slump 5 3 3.5 3.5 4 1.75
Air Content 5.5 4.5 4 4 3.5 3 28 days Compressive
Strength (psi) 9735 9715 10177 9748 10637 10106
28 days Shrinkage (%) 0.05 0.0553 0.0413 0.0413 0.0437 0.0453
0
2
4
6
8
10
12
14
0 20 40 60 80 100
0.29 (G1)0.30 (E1)0.33 (D1)0.37 (C1)
Time (Days)
Com
pres
sive
Str
engt
h (k
si)
Figure 3. The effect of w/b ratio on the compressive strength of HPC with a combination
of 7percent silica fume and 15 percent fly ash
28

Furthermore, the effect of pozzolans on compressive strength is observed in various mixes. Two parameters are investigated: (i) volume of pozzolanic materials and (ii) w/b ratios. The volumes of pozzolanic materials are investigated by comparing the effects of a single pozzolanic material and a combination of pozzolanic materials on the compressive strength. These comparisons are weighed against a conventional concrete mix (control). Three different levels of each pozzolan are studied; 5, 10, and 15 percent for silica fume and 10, 20, and 30 percent for fly ash. Figures 4a and b summarizes the compressive strength of these mixes. At early age, control or conventional concrete has a higher compressive strength than concrete with fly ash, but at 28 days, the mix containing 10 percent fly ash has a greater compressive strength than the control specimens. The mix containing 20 percent fly ash also has a higher compressive strength than the control mix at 60 days; as a matter of fact, it has the highest compressive strength at 90 days. Regarding the effect of silica fume, all mixes have higher compressive strength than control specimens at all ages; except for the mix containing 15 percent silica fume; it has a strength decrease at 90 days. Figure 5 and 6 illustrate the effect of the combination of pozzolanic materials on the compressive strength. From the graphs, the mix with a smaller combination of fly ash and silica fume performs better in the compressive test than mixes with a high volume of silica fume and fly ash. Generally, mixes that contain more than 25 percent of pozzolanic materials do not yield compressive strengths as high as conventional concrete.
0
2
4
6
8
10
0 20 40 60 80 100
Control10% FA20% FA30% FA
Time (Days)
Com
pres
sive
Str
engt
h (k
si)
Figure 4a. Effect of fly ash on the compressive strength of HPC with a w/b = 0.39
29

0
2
4
6
8
10
0 20 40 60 80 100
Control5% SF10% SF15% SF
Time (Days)
Com
pres
sive
Str
engt
h (k
si)
Figure 4b. Effect of silica fume on the compressive strength of HPC with a w/b = 0.39
0
2
4
6
8
10
0 20 40 60 80 100
Control10% FA5% SF5% SF; 10% FA
Time (Days)
Com
pres
sive
Str
engt
h (k
si)
Figure 5. Effect of pozzolans on the compressive strength of HPC with a w/b = 0.39
30
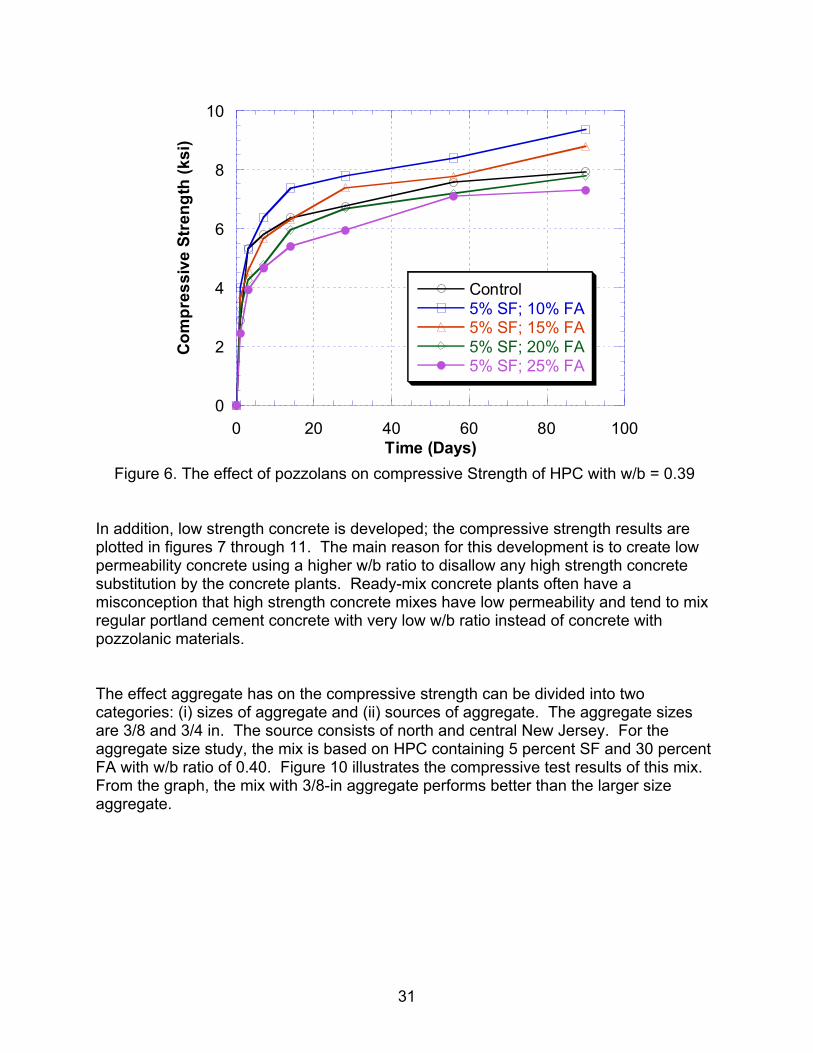
0
2
4
6
8
10
0 20 40 60 80 100
Control5% SF; 10% FA5% SF; 15% FA5% SF; 20% FA5% SF; 25% FA
Time (Days)
Com
pres
sive
Str
engt
h (k
si)
Figure 6. The effect of pozzolans on compressive Strength of HPC with w/b = 0.39
In addition, low strength concrete is developed; the compressive strength results are plotted in figures 7 through 11. The main reason for this development is to create low permeability concrete using a higher w/b ratio to disallow any high strength concrete substitution by the concrete plants. Ready-mix concrete plants often have a misconception that high strength concrete mixes have low permeability and tend to mix regular portland cement concrete with very low w/b ratio instead of concrete with pozzolanic materials.
The effect aggregate has on the compressive strength can be divided into two categories: (i) sizes of aggregate and (ii) sources of aggregate. The aggregate sizes are 3/8 and 3/4 in. The source consists of north and central New Jersey. For the aggregate size study, the mix is based on HPC containing 5 percent SF and 30 percent FA with w/b ratio of 0.40. Figure 10 illustrates the compressive test results of this mix. From the graph, the mix with 3/8-in aggregate performs better than the larger size aggregate.
31

0
2
4
6
8
10
0 20 40 60 80 100
0.400.450.500.55
Time (Days)
Com
pres
sive
Str
engt
h (k
si)
Figure 7. Effect of w/b ratio on compressive strength of low-strength HPC with 5 percent
silica fume
0
2
4
6
8
10
0 20 40 60 80 100
0.400.450.500.55
Time (Days)
Com
pres
sive
Str
engt
h (k
si)
Figure 8. Effect of w/b ratio on compressive strength of low-strength HPC with 30
percent fly ash
32

0
2
4
6
8
10
0 20 40 60 80 100
0.400.450.500.55
Time (Days)
Com
pres
sive
Str
engt
h (k
si)
Figure 9. Effect of w/b ratio on compressive strength of low-strength HPC with 5 percent
silica fume and 30 percent fly ash
0
2
4
6
8
10
0 20 40 60 80 100
3/8" AGGREGATES3/4" AGGREGATES
Time (Days)
Com
pres
sive
Str
engt
h (k
si)
Figure 10. Effect of aggregate on compressive strength of HPC with w/b = 0.39
33

Drying Shrinkage For phase I, the drying shrinkage was performed on some of the mixes. The results are shown in figure 11 through 13. From the figures, mix with 5 and 10 percent and 9 and 18 percent silica fume and fly ash, respectively, consistently outperformed other mixes. These were the same mixes that have the highest compressive strength. In general, mix with low w/b ratio had higher the drying shrinkage; however, the amount of pozzolanic materials had more influence on the drying shrinkage. With an exception of the two optimum mixes, an addition of fly ash decreased the drying shrinkage especially the mix with low w/b ratio. Consistently, mix with 5 and 15 percent silica fume and fly ash, respectively, performed poorly and have the highest drying shrinkage.
0
0.02
0.04
0.06
0.08
0.1
4 7 14 28 56 90
7%SF, 15%FA5%SF, 10%FA5%SF, 15%FA5%SF, 20%FA
5%SF, 25%FA9%SF, 18%FA10%SF, 20%FA15%SF, 20%FA
Time (Days)
Ave
rage
Len
gth
Cha
nge
(%)
Figure 11. Drying shrinkage of HPC with w/b ratio of 0.37
34

0
0.02
0.04
0.06
0.08
0.1
4 7 14 28 56 90
7%SF, 15%FA5%SF, 10%FA5%SF, 15%FA5%SF, 20%FA
5%SF, 25%FA9%SF, 18%FA10%SF, 20%FA15%SF, 20%FA
Time (Days)
Ave
rage
Len
gth
Cha
nge
(%)
Figure 12. Drying shrinkage of HPC with w/b ratio of 0.33
0
0.02
0.04
0.06
0.08
0.1
4 7 14 28 56 90
7%SF, 15%FA5%SF, 10%FA5%SF, 15%FA5%SF, 20%FA5%SF, 25%FA9%SF, 18%FA10%SF, 20%FA15%SF, 20%FA
Time (Days)
Ave
rage
Len
gth
Cha
nge
(%)
Figure 13. Drying shrinkage of HPC with w/b ratio of 0.29
35

Modulus of Elasticity The modulus of elasticity was tested on selective mixes at different ages. The results were compared to ACI 318, as well as ACI 363, equation. ACI 363 equation is based on high strength concrete. Overall, it gives better correlation to the results obtained from the HPC mixes. Figure 14 shows a scatter plot of the modulus of elasticity obtained at different ages. The solid line represents the ACI 363 equation, and the dotted line represents ACI 318 equation.
3000
3500
4000
4500
5000
5500
6000
6500
7000
2 4 6 8 10 12 14
A ll-1 D ay EA ll-3 D a ys EA ll-7 D ays EA ll-1 4 D a ys EA ll-2 8 D a ys EA ll-9 0 D a ys EA C I 3 1 8A C I 3 6 3
Elas
tic M
odul
us (k
si)
C om p ress iv e S tren g th (ks i) Figure 14. Scatter plot of the modulus of elasticity
Curing Methods The effect of using four methods of curing on HPC is considered because of its effect on cracking and strength. The curing conditions consisted of 1) Moist curing; 2) Air-dry curing; 3) Burlap; and 4) Curing compound. Two similar batches of concrete containing 9 percent silica fume and 18 percent fly ash with w/b ratio of 0.39 were mixed. One mix is used for testing a total of 101 4-by-8-in cylinders cured by the four curing methods. All samples are divided into four groups. Group I is moist cured, group II is dry-cured, group III is cured using burlap, and group IV is cured using a curing compound.
36

Group III is further divided into four subgroups to simulate a more realistic curing procedure at the field. These subgroups include curing with burlap for 3, 7, 14, and 90 days.
Figure 15. Treatment of different curing methods on specimens
Figure 16. Method of applying burlap and curing compound on to specimens
Figure 17 shows when using any of the curing methods, the compressive strengths at 1 to 7 days are similar. However, at 28 days, the compressive strength using dry-cured (room temperature), curing compound, and burlap are about 12 percent less than those moist cured. At 56 days, the results are similar with a difference of about 10 percent.
37

Figure 18 shows a minimal 14-day curing duration is needed to ensure a compressive strength close to the specified 28-day compressive strength. A curing duration of only 3 and 7 days can result in reductions of about 5 to 10 percent. In addition, the effect of curing on drying shrinkage was also investigated with the result presented in figure 19. Similarly, the dry cured and compound cured samples performed the worst in drying shrinkage. Specimens that were cured using wet burlap for 3 days also did not performed well. Specimens that were cured for 7 and 14 days using wet burlap performed satisfactory. The moist cured specimens performed the best.
0
2
4
6
8
10
0 10 20 30 40 50 60
Moist CuredDry CuredBurlap 56 DaysCuring Compound
Curing Time (Days)
Com
pres
sive
Str
engt
h (k
si)
Figure 17. Compressive strength for various curing methods
38

0
2
4
6
8
10
0 10 20 30 40 50 60
Burlap 3 DaysBurlap 7 DaysBurlap 14 DaysAir-Dry
Curing Time (Days)
Com
pres
sive
Str
engt
h (k
si)
Figure 18. Compressive strength of different burlap curing durations
-0.02
0
0.02
0.04
0.06
0.08
0.1
0 5 10 15 20 25 30
Moist CuringAir-DryCuring CompundBurlap 3 DaysBurlap 7 DaysBurlap 14 Days
Curing Time (Days)
Ave
rage
Len
gth
Cha
nge
(%)
Figure 19. Effect of curing method on drying shrinkage
39
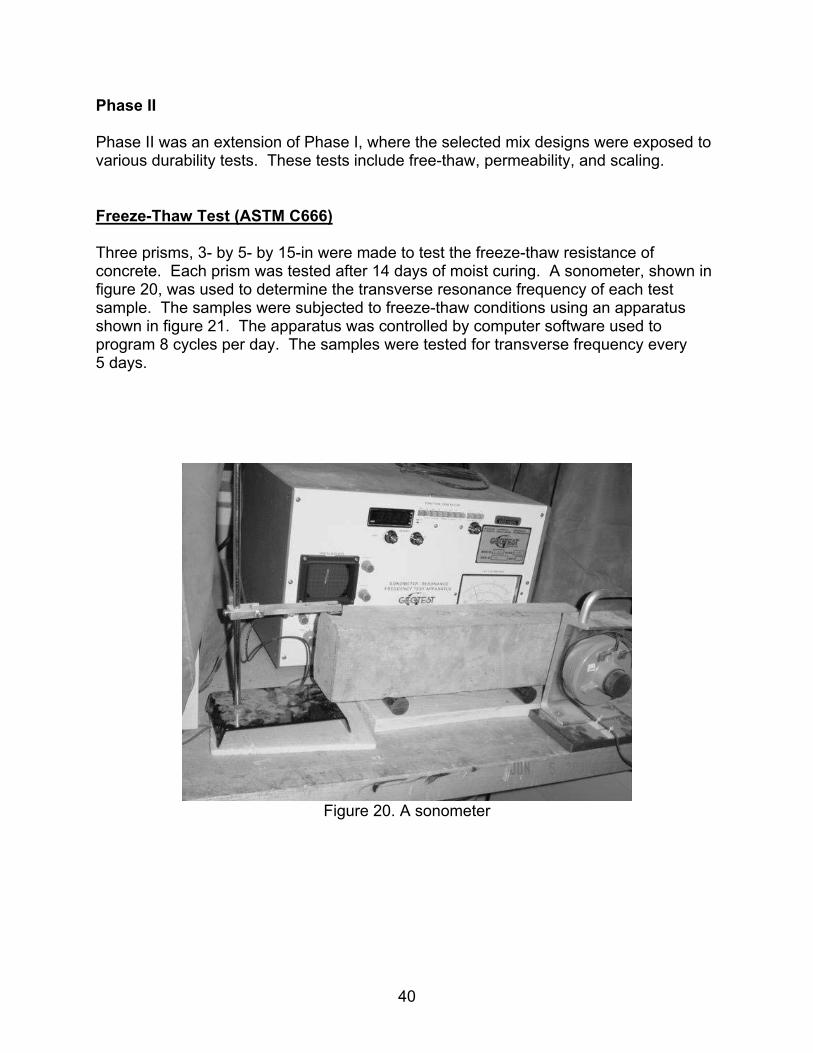
Phase II Phase II was an extension of Phase I, where the selected mix designs were exposed to various durability tests. These tests include free-thaw, permeability, and scaling. Freeze-Thaw Test (ASTM C666) Three prisms, 3- by 5- by 15-in were made to test the freeze-thaw resistance of concrete. Each prism was tested after 14 days of moist curing. A sonometer, shown in figure 20, was used to determine the transverse resonance frequency of each test sample. The samples were subjected to freeze-thaw conditions using an apparatus shown in figure 21. The apparatus was controlled by computer software used to program 8 cycles per day. The samples were tested for transverse frequency every 5 days.
Figure 20. A sonometer
40

Figure 21. Freeze-thaw apparatus
Scaling Test (ASTM C672) Three square slabs, each of a 12-in width and a 3-in height, were tested for their scaling resistance. Samples were also moist cured for 14 days inside the curing room and then left to dry in the environmental chamber for another 14 days. At the end of 28 days, each sample was covered with a thin film of a calcium-chloride and water solution, having a concentration such that each 100 ml of solution contains 4 grams of anhydrous calcium chloride. The specimens were then placed in a freezer (shown in figure 22) for a period of 16 to 18 hours. After that, the samples were removed and placed in the environmental chamber for a period of 6 to 8 hours. These cycles were repeated, and observations were made every 5 days. The test was continued for 50 cycles. A scaling sample is depicted in figure 23.
41

Figure 22. Laboratory freezer for scaling test
Figure 23. Scaling test sample
42

Chloride Permeability, (ASTM C1202-94) The rapid chloride permeability tests were performed at NJDOT chemical laboratory. Four samples were tested for each mix at 28 (36 days in some cases), 56, and 90 days. First the four samples were cut into three lifts of 2-in slices using the water-cooled diamond saw or silicon-carbide saw. A belt sander was used to remove any burrs on the ends of the specimens. After the samples were cut, they were stored in the curing room until the test date. On the test date, the first lifts of each sample were allowed to dry for about 1 hour. After drying, the side surfaces of the specimens were coated with high strength epoxy. The specimens were then left for 24 hours to cure. When the coating was cured, about a gallon of water (depending on the size of the desiccators) had to be boiled and cooled. While doing that, the coated specimens were placed in the desiccators and vacuum for three hours. After three hours, the de-aerated water was drained into the vacuum from a separator funnel, and the vacuum was allowed to pump for 1 additional hour. Then the vacuum was turned off, allowing air to re-enter the desiccators, and the specimens were then soaked under water for 18 hours. The specimens were removed from the water and towel dried. The cells were then coated on the sides with silicon material to prevent the chemical solutions from leaking. One side of the cells was filled with 3.0 percent NaCl solution (negative terminal) and the other (side) filled with 0.3 N NaOH solutions (positive terminal). The wires from the RCPT apparatus were connected with the cells. Then the power of the apparatus was turned on and set to 60 volts. The current was recorded every 30-minutes, for 6 hours. Table 7 shows the classification of chloride permeability. The calculation and of the total charges are performs as follows:
1) Plot current versus time and integrate the area underneath the graph to obtain the coulombs.
2) If the current is record every 30 min use the following equation: Q = 900(I0 + 2I30 + 2I60 + …+ 2I300 + 2I330 + I360) (3)
Where, Q = total charges in coulombs
In = the current at n minutes
Table 7. Classification of chloride permeability Charge Passed
(Coulombs) Chloride
permeability > 4000 High
2000 - 4000 Moderate 1000 - 2000 Low 100 - 1000 Very Low
< 100 Negligible
43
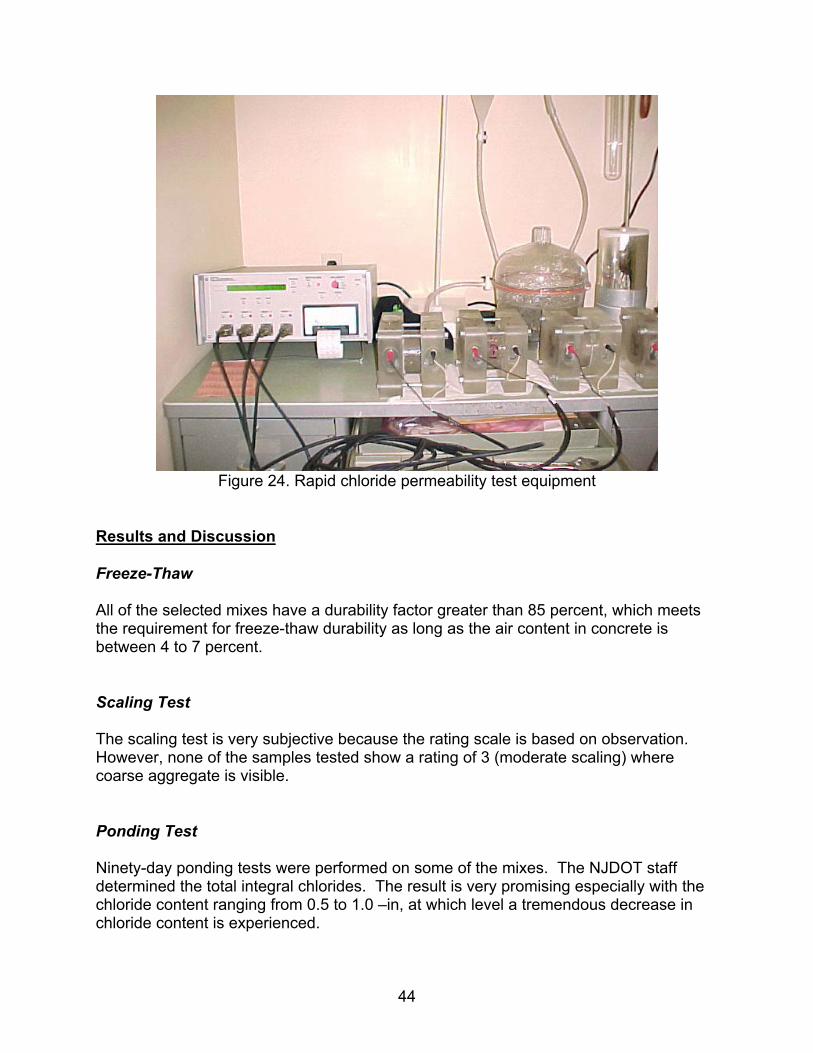
Figure 24. Rapid chloride permeability test equipment
Results and Discussion Freeze-Thaw All of the selected mixes have a durability factor greater than 85 percent, which meets the requirement for freeze-thaw durability as long as the air content in concrete is between 4 to 7 percent. Scaling Test The scaling test is very subjective because the rating scale is based on observation. However, none of the samples tested show a rating of 3 (moderate scaling) where coarse aggregate is visible. Ponding Test Ninety-day ponding tests were performed on some of the mixes. The NJDOT staff determined the total integral chlorides. The result is very promising especially with the chloride content ranging from 0.5 to 1.0 –in, at which level a tremendous decrease in chloride content is experienced.
44

Rapid Chloride Permeability The results from the rapid chloride permeability test (RCPT) yield very low chloride permeability at 90 days for all the tested specimens. From the results, a direct correlation between the w/b ratio and the permeability of concrete could be established. Generally, concrete with low w/c ratio has lower chloride permeability, as shown in figure 25.
0
500
1000
1500
2000
20 30 40 50 60 70 80 90 100
0.440.390.370.3650.350.330.29
Time (Days)
Cou
lom
bs
Figure 25. Effect of w/b ratio on RCPT
However, this is only true if the only variation between the mixtures is the w/b ratio; the pozzolanic effect has more influence on the chloride permeability. The concrete mixture with high volumes of pozzolanic materials decreases the permeability of concrete, as illustrated in figure 26. The RCPT results at 28 days are not a good indication of the permeability of concrete because the permeability readings vary dramatically whereas at 56 days the permeability readings begin to settle. Thus, the comparison is made at 56 days, as illustrated in figure 27. From the graph, as expected, the concrete mixture with 15 percent silica fume and 20 percent fly ash performs the best in RCPT because the mixture has the highest level of pozzolanic material replacement.
45

0
500
1000
1500
2000
20 30 40 50 60 70 80 90 100
0.40: 5% SF, 30% FA
0.365: 5% SF, 10% FA
0.33: 5% SF, 10% FA
Time (Days)
Cou
lom
bs
Figure 26. Effect of high volume of pozzolan on RCPT
0
500
1000
1500
2000
5% SF, 10% FA5% SF, 15% FA5% SF, 20% FA5% SF, 25% FA9% SF, 18% FA10% SF, 20% FA15% SF, 20% FA
1
Cou
lom
bs
Figure 27. Effect of pozzolan on RCPT (w/b = 0.39)
46

The effects of individual pozzolanic material replacement were also observed. Figures 28 and 29 illustrate the effects of fly ash and silica fume on RCPT respectively. Both pozzolans have lower permeability than conventional concrete. The plots show silica fume significantly improves concrete permeability whereas 20 percent of fly ash is needed for the permeability to be classified as very low (less than 1000 coulombs). Furthermore, as shown in figure 30, the RCPT results of these mixtures are compared with the mixtures containing both silica fume and fly ash. RCPT readings of the mixtures with both silica fume and fly ash, as expected, outperform the mixtures with either silica fume or fly ash. The effect of RCPT on the size of aggregate is evaluated, as shown in figure 31. From the curve, a 27-percent increase in permeability is observed when using the larger size aggregate. The bigger voids in concrete with larger size aggregates contribute to this increase in permeability.
0
500
1000
1500
2000
2500
3000
3500
4000
Control10% FA20% FA30% FA
56 90
Cou
lom
bs
Time (Days)
Figure 28. Effect of fly ash on RCPT (w/b = 0.39)
47
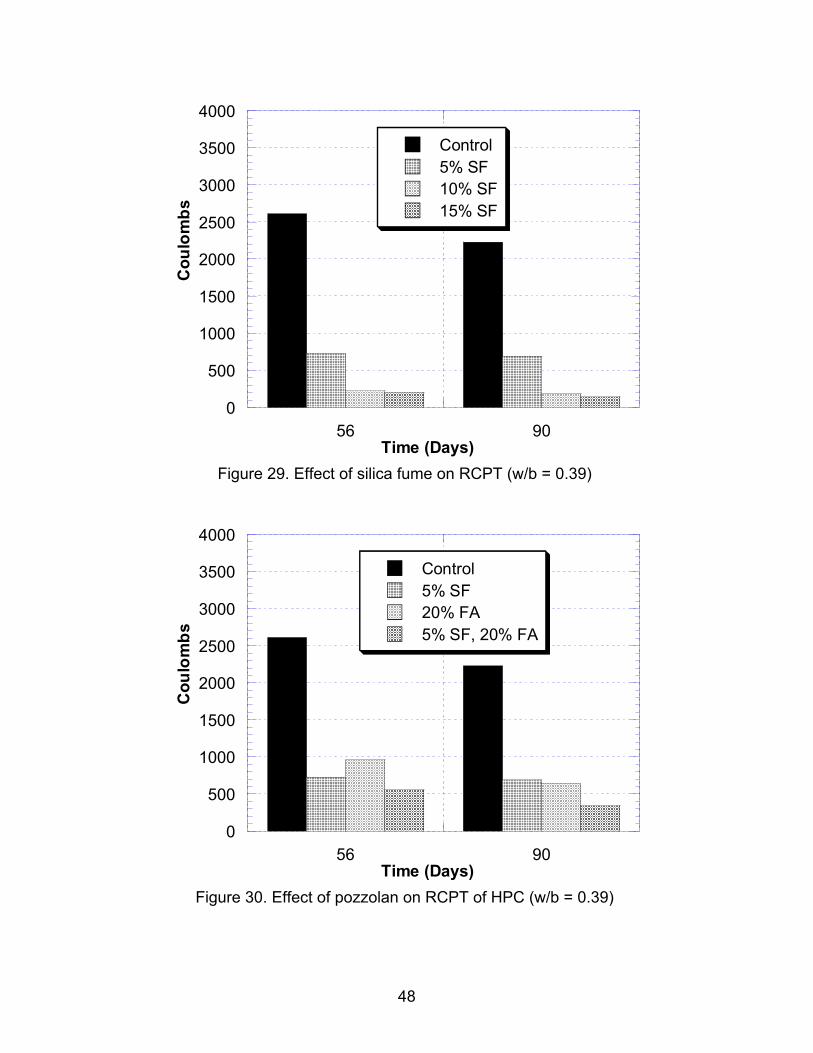
0
500
1000
1500
2000
2500
3000
3500
4000
Control5% SF10% SF15% SF
56 90
Cou
lom
bs
Time (Days)
Figure 29. Effect of silica fume on RCPT (w/b = 0.39)
0
500
1000
1500
2000
2500
3000
3500
4000
Control5% SF20% FA5% SF, 20% FA
56 90
Cou
lom
bs
Time (Days)
Figure 30. Effect of pozzolan on RCPT of HPC (w/b = 0.39)
48

0
200
400
600
800
1000
20 30 40 50 60 70 80 90 100
3/8" Aggregate3/4" Aggregate
Time (Days)
Cou
lom
bs
Figure 31. Effect of aggregate size on RCPT (w/b = 0.39)
Finally, as explained earlier the low strength concrete mixtures were developed, and their results are plotted on Figure 32a and b. From the graphs, mixtures with a combination of fly ash and silica fume at all w/b ratios have very low permeability at the 90-day test. Fly ash is more effective than silica fume, but this is probably attributed to the high amount of fly ash added. Also from the plots, HPC concrete could be developed using a high w/b ratio as long as a high amount of pozzolanic material exists. The coulombs could even be lower if more silica fume is added to the mix.
49

0
1000
2000
3000
4000
5000
6000
7000
8000
20 30 40 50 60 70 80 90 100
0.40: 5%SF, 30%FA0.50: 5%SF, 30%FA0.40: 30%FA0.50: 30%FA0.40: 5%SF0.50: 5%SF
Time (Days)
Cou
lom
bs
Figure 32a. Effect of low strength HPC on RCPT
0
1000
2000
3000
4000
5000
6000
7000
8000
20 30 40 50 60 70 80 90 100
0.45: 5%SF, 30%FA0.55: 5%SF, 30%FA0.45: 30%FA0.55: 30%FA0.45: 5%SF0.55: 5%SF
Time (Days)
Cou
lom
bs
Figure 32b. Effect of low strength HPC on RCPT
50

Curing Methods The effect of curing on RCPT was also investigated, and the results are shown in figure 33. From the plot, the same conclusion, as mentioned earlier, is deduced; the high water demand of the pozzolanic material makes curing a problem for the HPC mix. Therefore, the time in which the concrete is cured has to be increased from 7 to 14 days. As for the RCPT, the concrete that was cured with curing compound performs well compared with 14-day curing.
0
500
1000
1500
2000
2500
3000
3500
4000
28 Days56 Days90 Days
Cou
lom
bs
Dry Burlab3 Days
Burlab7 Days
Burlab14 Days
CuringCompound
Moist
Figure 33. Effect of curing method on RCPT Phase III One of the problems with HPC is early-age shrinkage. Because HPC usually has low w/b ratio and higher water demand than regular concrete, early-age (autogenous) shrinkage, which is usually ignored for regular concrete, becomes more significant and can not be overlooked. In this phase, the effect of early-age shrinkage on HPC was investigated.
51

Mix Proportions
The mix proportion procedure is based on the same procedure as that followed in Phase I. Two w/b ratios, 0.29 and 0.35, were investigated. All mixes contained 10 percent silica fume. Mix L2 and L3 contained an addition of 20 percent fly ash and 20 percent slag respectively. Mix L1 is the same as mix L4 but using lightweight aggregate. Mix M1 and M2 are exactly the same, but mix M1 has a higher dose of superplasticizer. Mix M3 and M4 contain 20 percent fly ash and 20 percent slag respectively. Table 8 summarizes the mix proportions.
Table 8. Mix proportions for phase III Mix w/(c+p) SF (%) FA (%) Slag
(%) SP
(oz/100lb) AEA
(oz/100lb)
L1 0.29 10 0 0 22 2 L2 0.29 10 20 0 22 2 L3 0.29 10 0 20 22 2 L4 0.29 10 0 0 22 2 M1 0.35 10 0 0 20 2 M2 0.35 10 0 0 12 2 M3 0.35 10 20 0 12 2 M4 0.35 10 0 20 12 2
Burlap Cured Curing Compound Air Cured
Figure 34. Autogenous shrinkage specimens
52

Autogenous Shrinkage
The concrete prisms tested for drying shrinkage were used to determine the autogenous shrinkage using the embedded Vibrating Wire Strain Gauge (VWSG) model VCE 4202 by Geokon. The main reason for its use was its sensitivity and low modulus of elasticity allowing the measurement of autogenous shrinkage. The VWSG data was collected immediately after placing the concrete in the molds using a data logger capable of recording data every 10 minutes. After one week, the VWSG was disconnected from the data logger, and a manual portable VWSG readout box was used to record data daily for 28 days. After that, the data was recorded on a weekly basis because the shrinkage rate became less drastic.
Figure 35. VWSG installation
Drying Shrinkage Drying shrinkage was performed the same way as described in Phase I. However, the comparator readings were also compared to the embedded VWSG by taking the total strain minus the autogenous shrinkage strain (strain at 24 hours). Results and Discussion Fresh mix concrete and Compressive Strength Both air content and slump of concrete were recorded for each mix. Table 9 summarizes the results. The compressive strength of the mixes is summarized in table 10. The results to those from Phase I; the strength decreases if the concrete is improperly cured. Note that for the burlap-cured specimens, the wet burlap was removed at 28 days.
53
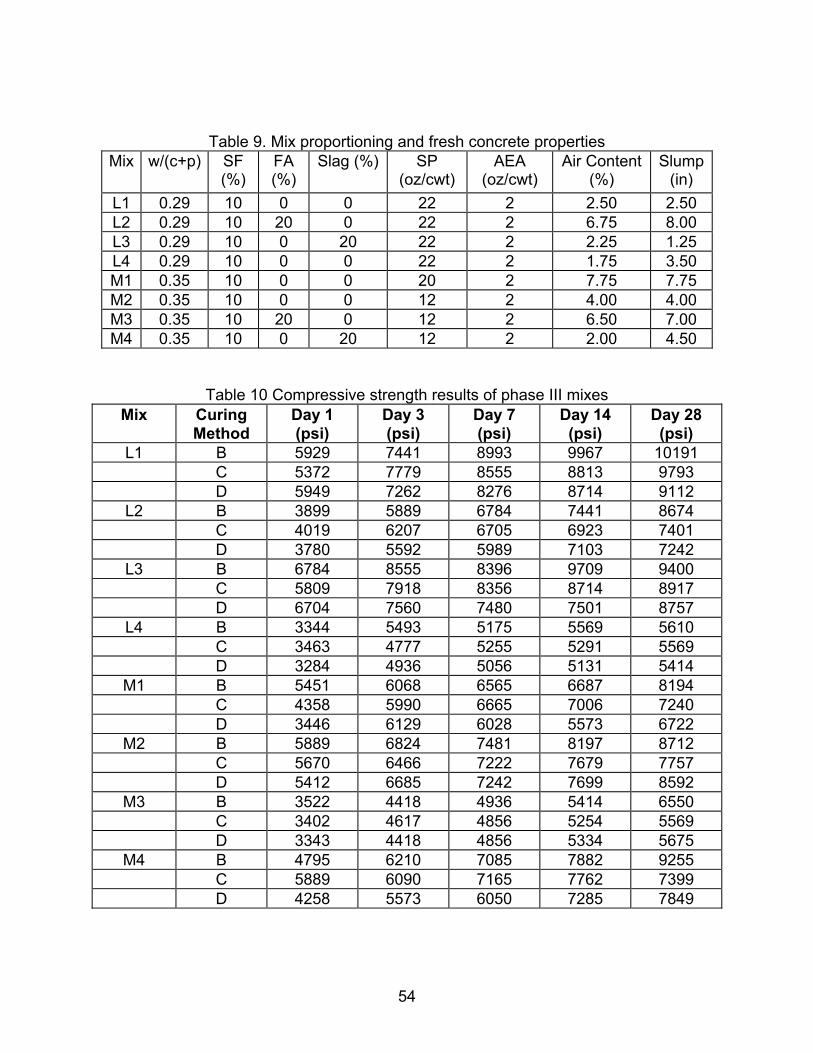
Table 9. Mix proportioning and fresh concrete properties Mix w/(c+p) SF
(%) FA (%)
Slag (%) AEA (oz/cwt)
Air Content (%)
Slump (in)
L1 0.29 10 0 0 22 2.50 2.50 L2 0.29 10 20 0 22 2 8.00 L3 0.29 10 0 20 22 2 2.25 L4 0.29 10 0 0 22 2 1.75 3.50 M1 0.35 10 0 0 20 2 7.75 7.75
0.35 10 0 0 12 2 4.00 4.00 M3 10
SP (oz/cwt)
2 6.75
1.25
M2 0.35 20 0 12 2 6.50 7.00
M4 0.35 10 0 20 12 2 2.00 4.50
Table 10 Compressive strength results of phase III mixes Mix Curing
Method Day 1 (psi)
Day 3 (psi)
Day 7 (psi)
Day 14 (psi) (psi)
L1 B 5929 7441 8993 9967 10191 C 5372 7779 8555 8813 9793 D 5949 7262 8276 8714 9112
L2 B 3899 5889 6784 7441 8674 C 4019 6207 6705 6923 7401 D 3780 5592 5989 7103 7242
L3 B 6784 8555 8396 9709 9400 C 5809 7918 8356 8714 8917 D 6704 7560 7480 7501 8757
L4 B 3344 5493 5175 5569 5610 C 3463 4777 5255 5291 5569 D 3284 4936 5056 5131 5414
M1 B 5451 6068 6565 6687 8194 C 4358 5990 6665 7006 7240 D 3446 6129 6028 5573 6722
M2 B 5889 6824 7481 8197 8712 C 5670 6466 7222 7679 7757 D 5412 6685 7242 7699 8592
M3 B 3522 4418 4936 5414 6550 C 3402 4617 4856 5254 5569 D 3343 4418 4856 5334 5675
M4 B 4795 6210 7085 7882 9255 C 5889 6090 7165 7762 7399 D 4258 5573 6050 7285 7849
Day 28
54
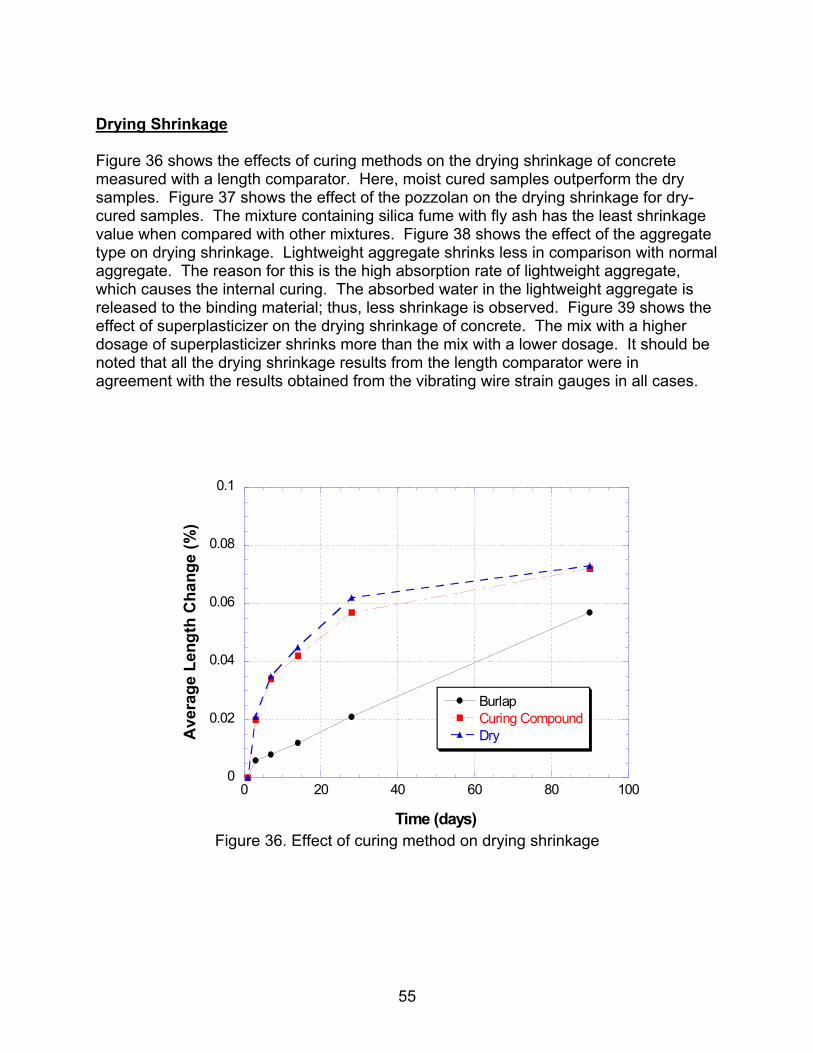
Drying Shrinkage Figure 36 shows the effects of curing methods on the drying shrinkage of concrete measured with a length comparator. Here, moist cured samples outperform the dry samples. Figure 37 shows the effect of the pozzolan on the drying shrinkage for dry-cured samples. The mixture containing silica fume with fly ash has the least shrinkage value when compared with other mixtures. Figure 38 shows the effect of the aggregate type on drying shrinkage. Lightweight aggregate shrinks less in comparison with normal aggregate. The reason for this is the high absorption rate of lightweight aggregate, which causes the internal curing. The absorbed water in the lightweight aggregate is released to the binding material; thus, less shrinkage is observed. Figure 39 shows the effect of superplasticizer on the drying shrinkage of concrete. The mix with a higher dosage of superplasticizer shrinks more than the mix with a lower dosage. It should be noted that all the drying shrinkage results from the length comparator were in agreement with the results obtained from the vibrating wire strain gauges in all cases.
0
0.02
0.04
0.06
0.08
0.1
0 20 40 60 80 100
BurlapCuring CompoundDryA
vera
ge L
engt
h C
hang
e (%
)
Time (days) Figure 36. Effect of curing method on drying shrinkage
55

0
0.02
0.04
0.06
0.08
0.1
0 20 40 60 80 100
SF onlySF+FASF+SlagA
vera
ge L
engt
h C
hang
e (%
)
Time (days) Figure 37. Effect of pozzolan on drying shrinkage
0
0.02
0.04
0.06
0.08
0.1
0 20 40 60 80 100
Normal Aggregates
Light Weight AggregatesAve
rage
Len
gth
Cha
nge
(%)
Time (days) Figure 38. Effect of type of aggregate on drying shrinkage
56

0
0.02
0.04
0.06
0.08
0.1
0 20 40 60 80 100
SP: 20oz/cwt
SP: 12 oz/cwt
Ave
rage
Len
gth
Cha
nge
(%)
Time (days)
Figure 39. Effect of superplasticizer on drying shrinkage
Autogenous Shrinkage Figure 40a shows the effects of the curing method on autogenous shrinkage of concrete in the first 48 hours. For all the w/b ratios, pozzolan contents, aggregate types, and amounts of superplasticizer, it was observed that moist burlap curing helped reduce the shrinkage. Burlap cured samples for all the mixes outperformed in shrinkage followed by samples cured with a curing compound. Dry-cured samples experienced the worst shrinkage, the reason being the hydration process demanded a lot of water, which was not supplied in the dry cured condition. Figure 41 depicts the effect of pozzolans on the autogenous shrinkage of concrete within the first 48 hours of its placement. The mix containing fly ash shows the least autogenous shrinkage. After all, fly ash slows down the rate of the hydration process. Mixtures containing only silica fume or silica fume with slag have higher shrinkage. Figure 42 illustrates the effect of lightweight aggregate on the autogenous shrinkage of concrete in the first 48 hours for the dry-cured samples. Likewise, the lightweight aggregate helps reduce autogenous shrinkage.
57

-1000
-800
-600
-400
-200
0
200
0 12 24 36 48
BurlapCuring CompoundDry
Shrin
kage
Str
ain
(µε)
Time (hours) Figure 40a. Effect of curing methods on autogenous shrinkage
-1000
-800
-600
-400
-200
0
200
0 12 24 36 48
SF onlySF+FASF+Slag
Shrin
kage
Str
ain
(µε)
Time (hours) Figure 40b. Effect of pozzolans on autogenous shrinkage
58
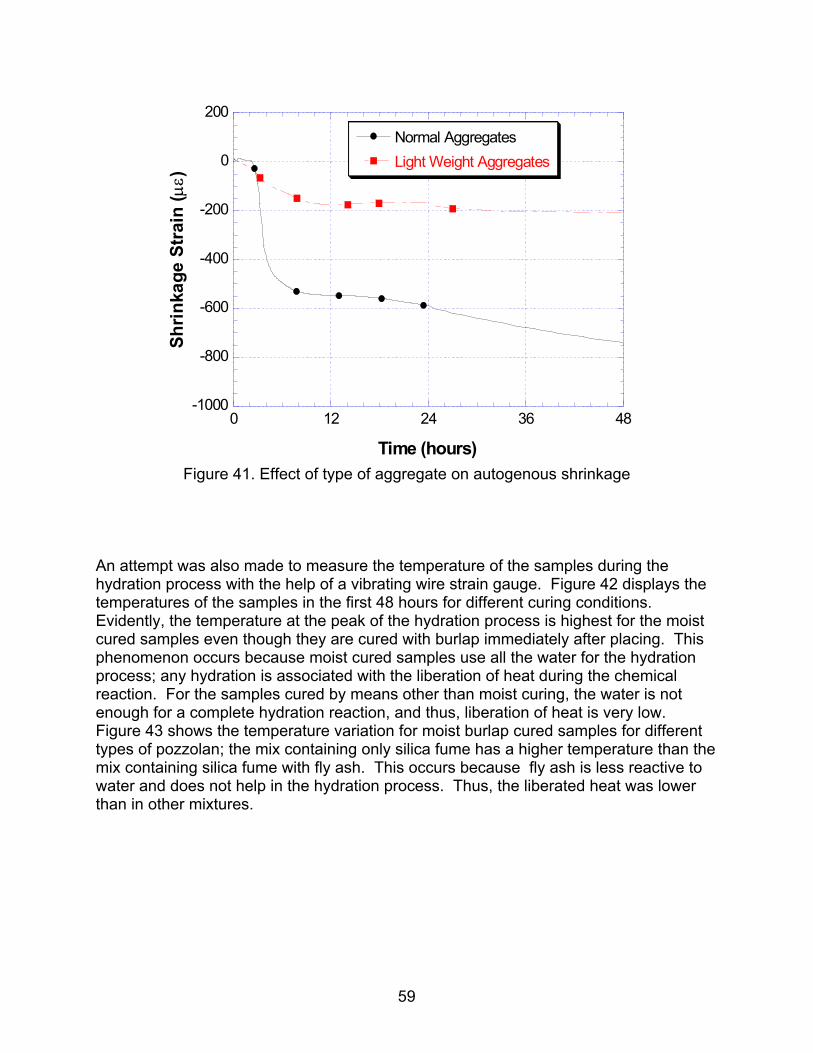
-1000
-800
-600
-400
-200
0
200
0 12 24 36 48
Normal AggregatesLight Weight Aggregates
Shrin
kage
Str
ain
(µε)
Time (hours) Figure 41. Effect of type of aggregate on autogenous shrinkage
An attempt was also made to measure the temperature of the samples during the hydration process with the help of a vibrating wire strain gauge. Figure 42 displays the temperatures of the samples in the first 48 hours for different curing conditions. Evidently, the temperature at the peak of the hydration process is highest for the moist cured samples even though they are cured with burlap immediately after placing. This phenomenon occurs because moist cured samples use all the water for the hydration process; any hydration is associated with the liberation of heat during the chemical reaction. For the samples cured by means other than moist curing, the water is not enough for a complete hydration reaction, and thus, liberation of heat is very low. Figure 43 shows the temperature variation for moist burlap cured samples for different types of pozzolan; the mix containing only silica fume has a higher temperature than the mix containing silica fume with fly ash. This occurs because fly ash is less reactive to water and does not help in the hydration process. Thus, the liberated heat was lower than in other mixtures.
59

20
22
24
26
28
30
0 12 24 36 48
BurlapCuring CompoundDry
Tem
pera
ture
(o C)
Time (hours)
Figure 42. Effect of curing method on the internal temperature of concrete
20
22
24
26
28
30
0 12 24 36 48
SF onlySF+FASF+Slag
Tem
pera
ture
(o C)
Time (hours)
Figure 43. Effect of pozzolan on the internal temperature of concrete
60

Phase IV The implementation of HPC is not only limited to bridge decks but also bridge girders. Today, concrete bridges are designed and constructed using prestressed concrete girders. One of the key elements in designing prestressed concrete is to determine the partial losses of prestressing. These losses are usually assumed, but because the constituents of HPC differ from regular concrete, these losses must be examined for HPC. One of the important prestressing losses is the creep of concrete. Phase IV investigates the compressive creep of HPC. Mix Design
There are a total of eleven mixes that were used in this study. The first three mixes, shown in table 11, are based on the optimum HPC mix developed in phase I. They all have the same percentage of silica fume (5 percent) and fly ash (10 percent) and they have a compressive strength of 8, 10, and 12 ksi, respectively. The other two mixes represent different combinations of pozzolanic materials. Table 12 shows the remaining six mixes used for determining the effect of one type of pozzolan on creep, where the first three contain silica fume only and the remaining three contain fly ash only. Creep Chamber The environmental chamber, used for creep and shrinkage measurements, is a 24- by 16- by 8-ft walk-in chamber made of insulated aluminum walls. The temperature and humidity of the room is controlled by a digital control unit located outside the room next to the entrance. The digital control unit acquires the temperature and humidity readout from an environmental sensor inside the room. This sensor is positioned so the overall temperature and humidity is at the set point. The range of temperature and humidity at which the chamber could be set are 39- to 104-degrees Fahrenheit and 30- to 80-percent respectively. Inside the room, the temperature is adjusted through the heaters and freezer units that occupied one side of the wall. The unit is shielded with aluminum sheet with blowers attached to it so that the air can be circulated. The room is also equipped with a dryer and a humidifier located on the same wall and on top of the chamber, respectively. A total of 18 creep loading rigs are in the chamber. Each rig is designed for testing three 6- by 12-in creep specimens. The rig is build up of two 20- by 20- by 2.5-in plates, two 15- by 15- by 2.5-in plates, five double coiled springs, and four 1-in diameter high strength threaded rods. The two 20- by 20- by 2.5-in plates are used for sandwiching the five double-coiled springs so that one plate, the specimen platform, is free to move and the other is fixed; when the specimens are loaded the springs will be compressed and maintain the applied load.
61

The two 15- by 15- by 2.5in plates are used as a top cover plate and a jacking stand. The five double-coiled springs are designed for a 200-kip load or 7-ksi for 6- by 12-in cylinders. Assuming that the applied load is 30 percent of the ultimate load, the rig is capable of loading concrete with a 23-ksi compressive strength. The load is monitored by a 200-kip load cell located between the specimens and the bottom platform. Figure 45a shows the actual creep rig and figure 45b shows a schematic drawing of the creep rig design.
Table 11. Creep mix design for mixes containing fly ash and silica fume Mix Identification
Raw Materials C5SF10FA G5SF10FA H5SF10FA H5SF20FA H10SF20FAPortland Cement Type I (Lb/yd3) 664 777 988 872 813 Class F Fly Ash (Lb/yd3) 78 149 116 232 232 Silica Fume (Lb/yd3) 39 70 58 58 116 3/8-in Crushed Stone (Lb/yd3) --- --- 1722 1722 1722 3/4-in Crushed Stone (Lb/yd3) 1871 1871 --- --- --- Sand (Lb/yd3) 1191 1015 933 933 933 Water (Lb/yd3) 289 289 314 314 314 W/B 0.37 0.29 0.27 0.27 0.27 Superplasticizer (oz/cwt) 13 20 18 16 30 AEA (oz/cwt) 1.5 1.5 2.2 2.2 2.2 Slump (in) 3 4 3 5.5 2 Air Content (%) 5 3.5 1 2 0.5 28 days Compressive Strength (ksi) 8 10 13 12 12 56 days Compressive Strength (ksi) 9 11 N/A N/A N/A 28 days Shrinkage (%) 0.04 0.05 0.04 0.045 N/A RCP @ 56 days 800 300 <300 <300 <300
62
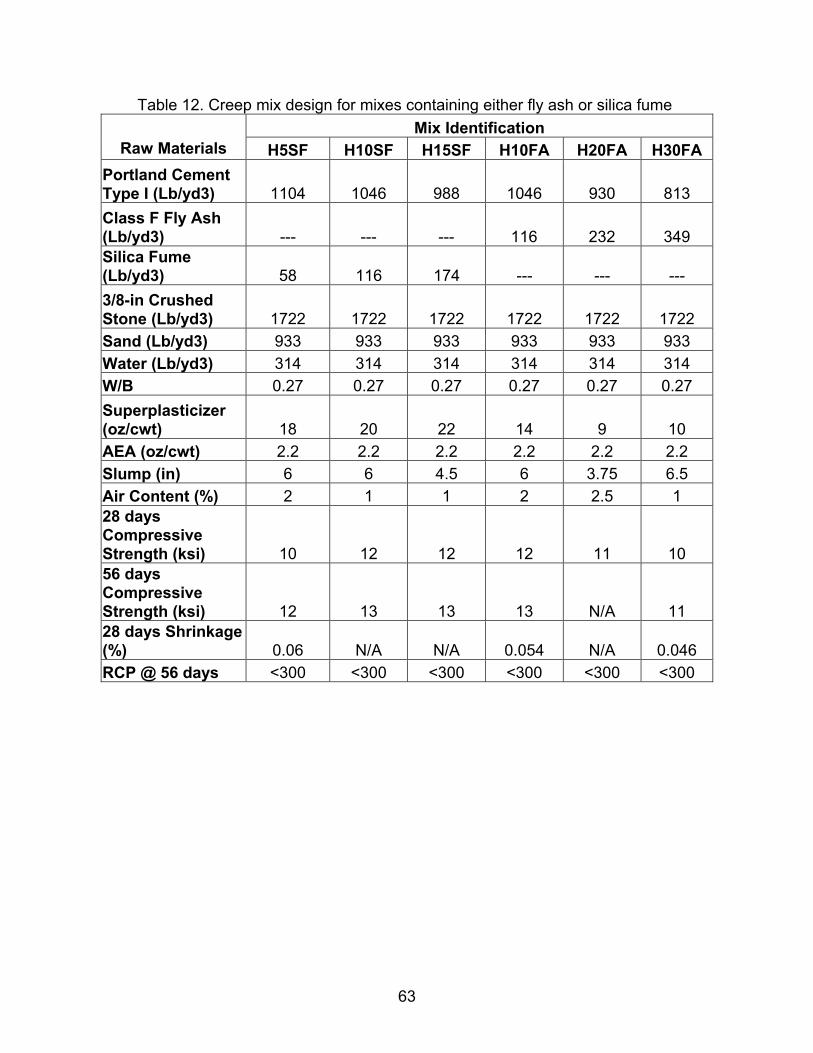
Table 12. Creep mix design for mixes containing either fly ash or silica fume Mix Identification
Raw Materials H5SF H10SF H15SF H10FA H20FA H30FA Portland Cement Type I (Lb/yd3) 1104 1046 988 1046 930 813 Class F Fly Ash (Lb/yd3) --- --- --- 116 232 349 Silica Fume (Lb/yd3) 58 116 174 --- --- --- 3/8-in Crushed Stone (Lb/yd3) 1722 1722 1722 1722 1722 1722 Sand (Lb/yd3) 933 933 933 933 933 933 Water (Lb/yd3) 314 314 314 314 314 314 W/B 0.27 0.27 0.27 0.27 0.27 0.27 Superplasticizer (oz/cwt) 18 20 22 14 9 10 AEA (oz/cwt) 2.2 2.2 2.2 2.2 2.2 2.2 Slump (in) 6 6 4.5 6 3.75 6.5 Air Content (%) 2 1 1 2 2.5 1 28 days Compressive Strength (ksi) 10 12 12 12 11 10 56 days Compressive Strength (ksi) 12 13 13 13 N/A 11 28 days Shrinkage (%) 0.06 N/A N/A 0.054 N/A 0.046 RCP @ 56 days <300 <300 <300 <300 <300 <300
63

Figure 44. Environmental chamber
Figure 45a. Creep rig
64

Creep Rig Design
A
200-kip Load Cell
Middle Plate (20 x 20 x 2.5-in)
Bottom Plate (20 x 20 x 2.5-in)
1-in Ø rod B7
Top Plate (15 x 15 x 2.5-in)
Jacking Plate (15 x 15 x 2.5-in)
200-kip Hydraulic Jack
4.6-in OD Inner Coil Spring
8-in ODOuter Coil Spring
Section A
A
Figure 45b. Creep rig design
The creep and shrinkage strains are measured by vibrating wire strain gauges (VWSGs). Two types are used; one is an embedded gauge, and the other is an external gauge designed by Rutgers University. The embedded gauges, shown in figure 46, are used mainly in shrinkage specimens, and they are capable of measuring both autogenous and drying shrinkage. Furthermore, a conventional stud was also embedded at each end of the specimens so that the drying shrinkage strain from the gauges could be compared to measured strain using a length comparator. External gauges are used for the creep specimens. The creep specimens are instrumented with external gauges using preinstalled threaded bolts; about a 1/2-in of the bolts are exposed so that the external gauges may be attached using lock nuts.
65

On each specimen, three external gauges are installed at 120 degrees to minimize the eccentric loading effects. The average strain of the three external gauges is used to calculate the total strain. The VWSGs are used because they provide long-term durability and accuracy. They are also unaffected by the change in resistance in the attached cable, and they are also temperature compensated. In addition to the three loaded creep specimens, external VWSGs are also installed on control or unloaded specimens to measure the strain caused by drying shrinkage. Figure 47 shows the external gauges on creep specimens.
Figure 46. Embedded VWSG
Figure 47. External VWSG
66

Because of the data-intensive nature of the project, two 96-channel data loggers are used to collect the data. The data loggers automatically collect strain and load data at 10-minute increments. The data can then be exported to Excel or any other program for processing. The data loggers are located next the chamber control unit shown in figure 48.
Figure 48. Data logger
Sample Preparations
Eight 6- by 12-in cylinders are made in order to perform creep testing. Five of the cylinders have embedded bolts, which are used for attaching the external VWSG’s. Two cylinders are used for determining the compressive strength on the loading day. The last cylinder is cut in half and placed on top and bottom of the three loaded cylinders. These half cylinders eliminated local failure on the test specimens. The loaded specimens as well as the two half cylinders are covered with capping compound before loading. The capping compound is used to ensure smooth and flat contact surface between each cylinders. Loading
During the loading day, the specimens are removed from the curing room. Three of the 6- by 12-in cylinders with bolts are used as loaded creep specimens. They are covered with sulfur capping to make a smooth surface before being loaded. Another two cylinders with bolts are used as control specimens. Another two without bolts are loaded in a compression machine to determine the ultimate compressive strength of concrete at the age of loading; thirty-five percent of the ultimate compressive strength is the constant load that should be applied to the specimens while loading.
67

In addition, a third sample without bolts is cut to obtain two 6- by 5-in concrete specimens. The five specimens with bolts are instrumented with external VWSG’s. After fixing the sensors to the five specimens, the three capped specimens are inserted into the creep rig. The two small 6- by 5in small specimens are also capped and assembled inside the rig at the top and bottom of the three other creep specimens. Because of the data-intensive nature of the project, two 96-channel data loggers are used to collect the data. The data loggers automatically collect strain and load data every ten-minutes.
Figure 49. Loaded creep rigs
Results and Discussion There are three main investigations performed in this project. These investigations consisted of 1) the effect of w/b ratio, 2) the effect of cement type, and 3) the effect of pozzolanic materials on compressive creep. In order to determine these effects, the specific creeps were calculated and used for comparison since dividing the creep strain by the applied load normalizes the specific creep. The creep results are plotted in figures 50 to 54. Figure 50 shows the effect of w/b ratio on the specific creep. The mix with higher w/b ratio has higher specific creep. Figure 51 illustrates the effect of cement type on the specific creep. From the figure, there are no significant effects on the cement type on specific creep. The effects of pozzolanic materials are divided into three groups, 1) effect of different percentage of silica fume, 2) different percentage fly ash, and 3) the effects of a combination of silica fume and fly ash on creep. These effects are plotted in figure 52 to 54. From the figures, an addition of silica fume lowers the specific creep whereas fly ash increases the specific creep. However, the specific creep of fly ash concrete could be lower by adding silica fume (and vice versa).
68

0
0.05
0.1
0.15
0.2
0.25
0.3
0 50 100 150 200
W/C=0.29W/C=0.37
Time (Days)
Spec
ific
Cre
ep (µ
ε/ps
i)
Figure 50. Effect of w/b ratio on specific creep
0
0.05
0.1
0.15
0.2
0.25
0 50 100 150 200
Type IType III
Time (Days)
Spec
ific
Cre
ep(µε/
psi)
Figure 51. Effect of cement type on specific creep
69

0
0.05
0.1
0.15
0.2
0.25
0.3
0 50 100 150 200
5%SF10%SF15%SF
Time (Days)
Spec
ific
Cre
ep(µε/
psi)
Figure 52. Effect of silica fume on specific creep
0
0.05
0.1
0.15
0.2
0.25
0.3
0.35
0 50 100 150 200
10%FA20%FA30%FA
Time (Days)
Spec
ific
Cre
ep (µ
ε/ps
i)
Figure 53. Effect of fly ash on specific creep
70

0
0.05
0.1
0.15
0.2
0.25
0.3
0 50 100 150 200
5%SF20%FA5%SF,20%FA
Time (Days)
Spec
ific
Cre
ep (µ
ε/ps
i)
Figure 54a. Effect of combination of silica fume and fly ash on specific creep
0
0.05
0.1
0.15
0.2
0.25
0 50 100 150 200
5%SF10%FA5%SF,10%FA
Time (Days)
Spec
ific
Cre
ep(µε/
psi)
Figure 54b. Effect of combination of silica fume and fly ash on specific creep
71

CONCLUSIONS AND RECOMMENDATIONS The following conclusions and recommendation were drawn from this project:
1) The presence of silica fume increases the early strength of concrete. The optimum range of silica fume is between 5 to 10 percent. Adding more silica fume could improve durability and strength but it is not economical. Moreover, the mix has very low workability, which requires more superplasticizer.
2) Fly ash increases the workability of concrete and therefore helps reduce the use of superplasticizer. However, adding more fly ash reduces the early-age compressive strength of HPC. The optimum range for adding fly ash is between 10 to 20 percent. Adding more fly ash than the optimum range will not be beneficial since there is a 20 percent strength reduction in both the early-age and later age of concrete.
3) Combining silica fume and fly ash enhances the durability and mechanical properties of HPC. In fact, it is highly recommended that a minimum of 5 percent silica fume be added to fly ash concrete to improve its durability. Moreover, the ductility of concrete increases when comparing to ACI recommendation.
4) Curing method plays major role in HPC. Both mechanical and durability properties are greatly influence by the method curing. Early-age cracking could occur if HPC is not properly cured. It is highly recommended that HPC be cured immediately or within 3 hours after the HPC is placed to avoid early-age cracking. This could be done, by either placing wet burlap or fog curing follows by wet burlap when the concrete is finished. The most effective curing method is moist curing. However, since this is not practical, it is recommended that HPC be cured for a minimum of 14 days using wet burlap. The use of curing compound is not effective in providing good curing method since the compound only seals the water from escaping whereas the HPC demands more water during the hydration process.
5) For a very low w/b ratio, fly ash could improve the shrinkage performance. However, the compressive strength will be reduced, and an optimization between early age shrinkage and strength is needed in the case of high strength concrete.
6) Lightweight aggregate reduces the autogenous shrinkage because of its ability to internally cure or in other word self-curing the concrete. However, the mechanical and durability properties of concrete will be affected.
7) Mixes need to be designed for the optimum amount of superplasticizer because higher doses of superplasticizer increase shrinkage and reduce strength.
8) All the HPC mixes are found to have a large relative dynamic modulus after 300 cycles. Thus, a durability factor of 90 percent can be easily achieved providing that there is sufficient air content in the HPC. In addition scaling of concrete is not a problem in HPC. All HPC mixes have a visual rating of 2 or lower.
9) Silica fume reduces the compressive creep of concrete, whereas fly ash increases the creep of concrete. Nevertheless, adding silica fume in fly ash concrete could reduce the compressive creep.
72

APPENDIX
Table 13. Compressive strength (w/b = 0.44) W/B SF FA Compressive Strength 0.44 (%) (%) 1 day 3 days 7 days 14 days 28 days 56 daysA1 7% 15% 1759 3223 4337 4894 6287 6525 1870 3302 4377 5133 6247 6844 1767 3342 4257 4735 6088 6486 1799 3289 4324 4921 6207 6618
A2 5% 10% 1974 3621 4854 5411 6525 7162 1989 3700 4814 5491 6008 7082 2029 3621 4735 5332 6127 6923 1997 3647 4801 5411 6220 7056
A3 5% 15% 1464 3422 4536 5292 6127 7122 1480 3414 4655 5173 6207 7003 1504 3342 4695 5173 6127 7242 1483 3393 4629 5213 6154 7122
A4 5% 20% 1472 3223 4257 5013 6247 6605 1671 3226 4218 5212 6048 6685 1504 3143 4456 5419 6287 6724 1549 3197 4310 5215 6194 6671
A5 5% 25% 1830 3159 3860 4456 5570 6247 1830 3104 3955 4735 5849 6247 1870 3159 4019 4735 5491 6127 1843 3141 3945 4642 5637 6207
A6 9% 18% 1950 3183 4138 5212 6048 6287 1790 3239 4218 5093 5730 6804 2069 3231 4178 5013 6366 6804 1936 3218 4178 5106 6048 6632
A7 10% 20% 1552 3104 4536 5252 6287 7082 1512 3024 4337 5093 6207 6883 1432 3223 4297 5371 6565 6724 1499 3117 4390 5239 6353 6896
A8 15% 20% 1870 3143 4218 5610 6685 7122 1989 3064 4297 5570 6406 6804 1711 3183 4377 5531 6446 6844 1857 3130 4297 5570 6512 6923
73

Table 14. Compressive strength (w/b = 0.39)
W/B SF FA Compressive strength (psi) 0.39 (%) (%) 1 day 3 days 7 days 14 days 28 days 56 daysB1 7% 15% 1997 3740 4854 5809 6963 8037 1989 3581 4894 5968 6923 7837 2069 3621 4854 5849 6565 8117 2018 3647 4867 5875 6817 7997
B2 5% 10% 3143 4417 5371 5968 6764 7162 3104 4098 5570 5730 6844 7480 3064 4019 5292 5809 6764 7719 3104 4178 5411 5836 6791 7454
B3 5% 15% 2706 4058 5133 6048 6764 7759 2145 4098 5053 5929 6804 7716 2188 3820 5093 6008 6605 7918 2346 3992 5093 5995 6724 7798
B4 5% 20% 2228 3143 3979 5173 5650 6963 2149 3223 4019 5212 5889 7242 2308 3382 4138 5013 5849 6724 2228 3249 4045 5133 5796 6976
B5 5% 25% 2149 4138 4854 5929 7083 8276 2570 4218 4615 5690 6923 7790 2379 3979 4894 5451 6963 7759 2366 4112 4788 5690 6990 7942
B6 9% 18% 2546 4138 5252 6446 7560 8356 2913 3860 5650 6605 7401 8037 2801 4058 5252 6167 7520 8196 2753 4019 5385 6406 7494 8196
B7 10% 20% 2507 3899 5411 6366 7003 7998 2602 3740 5053 6048 7162 7679 2753 3907 5332 5929 7122 7639 2621 3849 5265 6114 7096 7772
74

Table 15. Compressive strength (w/b = 0.37)
W/B SF FA Compressive strength (psi) 0.37 (%) (%) 1 day 3 days 7 days 14 days 28 days 56 days 90 daysC1 7% 15% 3318 4576 5332 5730 7361 8117 8754 3350 4615 5451 6446 7202 8356 8833 3334 4536 5371 6287 7520 8271 3334 4576 5385 6154 7361 8248 8794
C2 5% 10% 3422 5252 5968 7162 8475 9390 10342 3478 5093 6207 6923 8594 9430 9549 3446 5173 6127 7003 8356 9191 9151 3449 5173 6101 7029 8475 9337 9681
C3 5% 15% 3287 4615 5570 6645 7719 8600 8913 3127 4894 5849 6724 7679 8555 9072 3207 4735 5730 6685 7679 8754 8992 3207 4748 5716 6685 7692 8636 8992
C4 5% 20% 3159 4281 5491 6366 7480 8793 9231 3167 4337 5332 6127 7480 8236 8594 4615 5252 6207 7082 8754 8276 3163 4411 5358 6233 7347 8594 8700
C5 5% 25% 2586 3661 4615 5570 6207 7560 8594 2403 3724 4456 5730 6127 7878 7958 2515 3708 4576 5690 6088 7719 7799 2501 3698 4549 5663 6141 7719 8117
C6 9% 18% 2825 4058 5093 5968 6605 8117 8077 2885 4019 4814 6048 6963 7639 7998 2889 4098 4934 6008 6645 7759 8037 2866 4058 4947 6008 6738 7838 8037
C7 10% 20% 3183 3740 5013 5929 6844 7281 8395 2913 3820 4894 6048 6746 8114 8117 3008 3836 4934 6008 6923 7679 8356 3035 3799 4947 5995 6838 7691 8289
C8 15% 20% 2865 3907 4894 6207 7082 7958 8515 2801 3883 5173 6048 7043 7998 8117 2793 3860 5013 6167 7242 8037 8276 2820 3883 5027 6141 7122 7998 8303
75

Table 16. Compressive strength (w/b = 0.35) W/B SF FA Compressive strength (psi) 0.35 (%) (%) 1 day 3 days 7 days 14 days 28 days 56 daysB1N 7% 15% 4615 6446 7958 8992 9748 10027
4138 6287 8117 8674 9708 10027 4615 6446 8037 8634 9748 10305 4456 6393 8037 8767 9735 10120
B2N 5% 10% 5411 6565 7639 8356 9629 10345 5371 6486 7958 8594 9788 10305 5371 6844 7719 8515 10027 10300 5384 6632 7772 8488 9815 10325
B3N 5% 15% 4854 6525 7639 8674 8674 9629 4456 6008 7560 8754 9748 9788 4576 6127 7679 8714 9311 9629 4629 6220 7626 8714 9244 9682
B5N 5% 25% 3661 4735 5849 6446 6963 7878 3263 4735 5690 6605 7003 7799 3661 4456 5650 6525 6963 7888 3528 4642 5730 6525 6976 7839
B6N 9% 18% 4019 5491 6923 7838 8515 9669 4138 5411 6804 7799 8741 9669 4019 5610 6764 7958 8754 9666 4059 5504 6830 7865 8670 9669
B8N 15% 20% 3581 5013 6366 7639 8236 9311 3382 4854 6048 7639 8196 9151 3581 4814 6127 7600 8157 9191 3515 4894 6180 7626 8196 9218
76

Table 17. Compressive strength (w/b = 0.33) W/B SF FA Compressive strength (psi) 0.33 (%) (%) 1 day 3 days 7 days 14 days 28 days 56 days 90 daysD1 7% 15% 5411 6883 8037 8992 10000 10902 10425 5292 6844 8157 8793 10345 10425 10504 5332 8077 8833 10186 10265 10600 5345 6864 8090 8873 10177 10531 10510
D2 5% 10% 4814 6486 7639 8515 9151 10504 9947 4655 5849 7480 7759 9748 10067 9788 4735 6287 7520 8435 9470 10345 9828 4735 6207 7546 8236 9456 10305 9854
D3 5% 15% 6127 7043 8037 8594 9430 10902 10743 6127 6764 8196 8913 10027 10942 11141 6167 6923 8077 8754 9788 10027 10902 6140 6910 8103 8754 9748 10624 10929
D4 5% 20% 5252 6366 7242 8117 8674 10265 10822 5570 6247 7679 8674 8515 10504 10902 5400 6287 7401 8356 8754 10385 10854 5411 6300 7441 8382 8648 10385 10859
D5 5% 25% 4938 5610 6645 7401 8992 8674 9430 4615 5531 6605 7162 8754 9390 9470 4735 5570 6565 7242 8276 10106 9500 4763 5570 6605 7268 8674 9390 9467
D6 9% 18% 4178 5531 6247 7034 8754 9788 10027 4218 5332 6326 7639 8435 9350 9470 4098 5411 6406 7440 8515 9191 10027 4165 5425 6326 7371 8568 9443 9841
D7 10% 20% 3581 5411 6406 7401 8793 9708 10504 3549 5334 6645 7799 8674 10027 9868 3573 5371 6525 7560 8913 9947 10663 3568 5372 6525 7587 8793 9894 10345
D8 15% 20% 4854 6207 6844 7958 8674 8754 9788 4934 5889 6605 8077 8714 9032 9868 4894 6008 6724 7998 8833 9629 9800 4894 6035 6724 8011 8740 9138 9819
77

Table 18. Compressive strength (w/b = 0.29)
W/B SF FA Compressive strength (psi) 0.29 (%) (%) 1 day 3 days 7 days 14 days 28 days 56 days 90 daysG1 7% 15% 5690 6844 8196 9311 10265 11579 12016 5929 6883 8435 9032 10823 11300 11777 5809 6804 8395 9112 10823 11419 11539 5809 6844 8342 9152 10637 11433 11777
G2 5% 10% 6127 7639 9231 9788 10106 11976 12414 6366 7560 8833 9510 10265 11698 11857 6247 7600 8913 9669 9947 11738 12414 6247 7600 8992 9656 10106 11804 12228
G3 5% 15% 5650 7480 8594 9311 10902 11101 12414 5491 7321 8754 9430 9151 11220 12374 5531 7361 8674 9390 9669 11141 11817 5557 7387 8674 9377 9907 11154 12202
G4 5% 20% 5809 6406 8117 8316 9708 11141 10902 5411 6724 7639 8754 9788 10743 11220 5650 6605 7878 8594 10027 10902 11000 5623 6578 7878 8555 9841 10929 11041
G5 5% 25% 5013 6048 6923 8236 9072 11061 4934 6207 7043 8395 9151 10920 10186 4974 6127 7162 8276 9271 10743 10200 4974 6127 7043 8302 9165 10908 10204
G6 9% 18% 6008 7242 7998 8594 9907 10345 11976 5720 7321 8196 9231 10027 11141 11618 5889 7162 8117 8873 10504 9868 11300 5872 7242 8104 8899 10146 10451 11631
G7 10% 20% 5411 6605 7679 8754 9311 11220 11200 5292 6600 7719 8515 10027 10584 11000 5371 6700 7639 8634 9470 10862 11000 5358 6635 7679 8634 9603 10889 11067
G8 15% 20% 4775 5889 7321 8674 8833 9708 9708 4735 5890 7162 8714 9788 9231 10186 4814 5900 7242 8634 9072 9390 10000 4775 5893 7242 8674 9231 9443 9965
10226
78

Table 19. Compressive strength (w/b = 0.40)
W/B SF FA Compressive strength (psi) 0.40 (%) (%) 1 day 3 days 7 days 14 days 28 days 56 days 90 daysFA30 5% 30% 2745 4019 4695 5491 6048 7321 7700
2785 3716 4576 5730 6287 7560 7719 2761 3883 4615 5531 6844 7520 7560 2764 3873 4629 5584 6393 7467 7660
FA35 5% 35% 2204 3263 3820 4775 6048 6844 7110 2300 3143 3907 5173 5809 6565 7200 2252 3167 3875 4934 5849 6844 7122 2252 3191 3867 4961 5902 6751 7144
Table 20. Compressive strength (w/b = 0.365) W/B SF FA Compressive strength (psi)
0.365 (%) (%) 1 day 3 days 7 days 14 days 28 days 56 days 90 daysF1 7% 15% 3462 4894 5889 6565 8356 8276 8833 3621 4775 5650 6287 7799 8196 9311 3597 4615 5769 6366 6605 8992 8674 3560 4761 5769 6406 7587 8488 8939
F6 9% 18% 2984 4536 5491 6326 8356 7799 8992 3143 4297 5411 6645 7639 9151 8674 3056 4337 5451 6486 8000 7958 9311 3061 4390 5451 6486 7998 8303 8992
Table 21. Compressive strength (w/b = 0.30) W/B SF FA Compressive strength (psi) 0.30 (%) (%) 1 day 3 days 7 days 14 days 28 days 56 days 90 daysE1 7% 15% 5173 6008 8037 8833 10663 10504 11200
5411 6366 7719 9151 9350 10902 11220 5332 6207 7838 8992 10464 10703 11181 5305 6194 7865 8992 10159 10703 11201
E2 5% 10% 5292 6923 7958 8594 9470 9868 11300 5173 6685 7918 9072 9589 10464 10743 5252 6844 7878 8276 9191 10027 10663 5239 6817 7918 8647 9417 10120 10902
79

0
2
4
6
8
10
12
14
1 3 7 14 28 56
A1A2A3A4
A5A6A7A8
Time (Days)
Com
pres
sive
Str
engt
h (k
si)
Figure 55. Compressive strength (w/b = 0.44)
0
2
4
6
8
10
12
14
1 3 7 14 28 56
B1B2B3B4
B5B6B7B8
Time (Days)
Com
pres
sive
Str
engt
h (k
si)
Figure 56. Compressive strength (w/b = 0.39)
80

0
2
4
6
8
10
12
14
1 3 7 14 28 56 90
C1C2C3C4
C5C6C7C8
Time (Days)
Com
pres
sive
Str
engt
h (k
si)
Figure 57. Compressive strength (w/b = 0.37)
0
2
4
6
8
10
12
14
1 3 7 14 28 56
B1NB2NB3NB5NB6NB8N
Time (Days)
Com
pres
sive
Str
engt
h (k
si)
Figure 58. Compressive strength (w/b = 0.35)
81
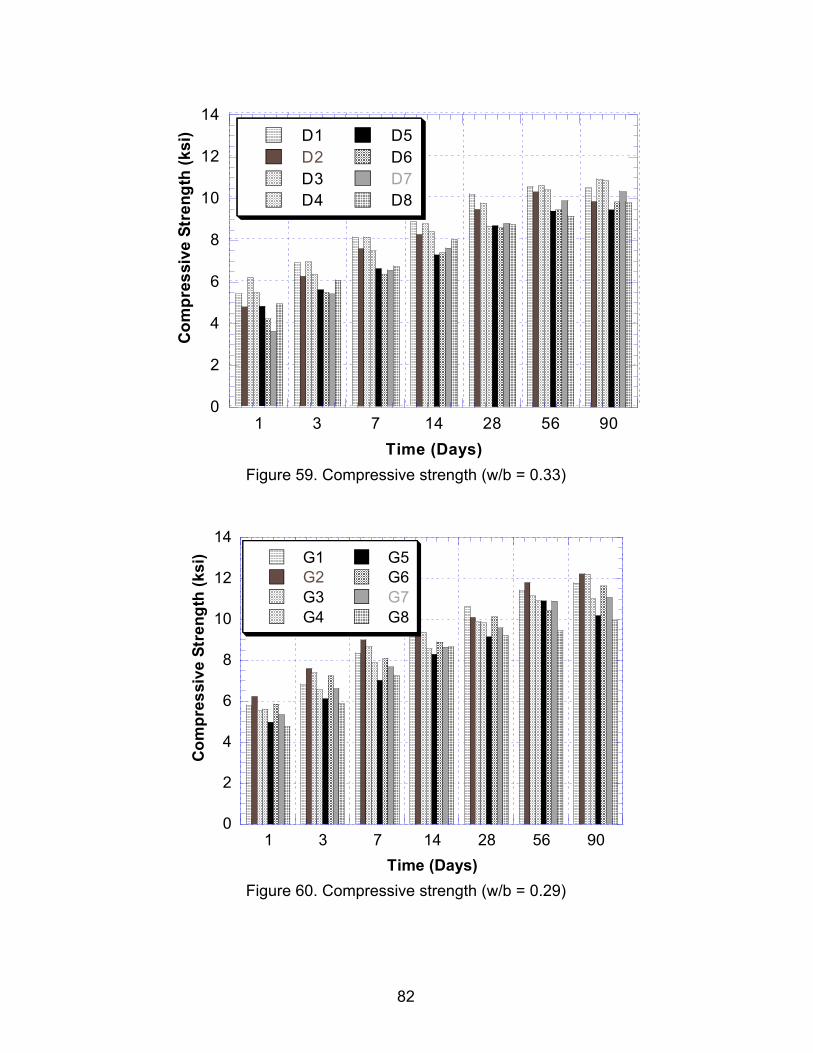
0
2
4
6
8
10
12
14
1 3 7 14 28 56 90
D1D2D3D4
D5D6D7D8
Time (Days)
Com
pres
sive
Str
engt
h (k
si)
Figure 59. Compressive strength (w/b = 0.33)
0
2
4
6
8
10
12
14
1 3 7 14 28 56 90
G1G2G3G4
G5G6G7G8
Time (Days)
Com
pres
sive
Str
engt
h (k
si)
Figure 60. Compressive strength (w/b = 0.29)
82

0
0.02
0.04
0.06
0.08
0.1
4 7 14 28 56 90
7%SF, 15%FA5%SF, 10%FA5%SF, 15%FA5%SF, 20%FA
5%SF, 25%FA9%SF, 18%FA10%SF, 20%FA15%SF, 20%FA
Time (Days)
Ave
rage
Len
gth
Cha
nge
(%)
Figure 61. Drying shrinkage (w/b = 0.37)
0
0.02
0.04
0.06
0.08
0.1
4 7 14 28 56 90
7%SF, 15%FA5%SF, 10%FA5%SF, 15%FA5%SF, 20%FA
5%SF, 25%FA9%SF, 18%FA10%SF, 20%FA15%SF, 20%FA
Time (Days)
Ave
rage
Len
gth
Cha
nge
(%)
Figure 62. Drying shrinkage (w/b = 0.33)
83

0
0.02
0.04
0.06
0.08
0.1
4 7 14 28 56 90
7%SF, 15%FA5%SF, 10%FA5%SF, 15%FA5%SF, 20%FA5%SF, 25%FA9%SF, 18%FA10%SF, 20%FA15%SF, 20%FA
Time (Days)
Ave
rage
Len
gth
Cha
nge
(%)
Figure 63. Drying shrinkage (w/b = 029)
-1000
-800
-600
-400
-200
0
200
0 12 24 36 48
BurlapCuring CompoundDry
Shrin
kage
Str
ain
(µε)
Time (hours)
Figure 64. Effect of curing on autogenous shrinkage of mix L1
84

-1000
-800
-600
-400
-200
0
200
0 12 24 36 48
BurlapCuring CompoundDry
Shrin
kage
(µε)
Time (Hours) Figure 65. Effect of curing on autogenous shrinkage of mix L2
-1000
-800
-600
-400
-200
0
200
0 12 24 36 48
DryCuring CompoundDry
Shrin
kage
(µε)
Time (Hours) Figure 66. Effect of curing on autogenous shrinkage of mix L3
85

-1000
-800
-600
-400
-200
0
200
0 12 24 36 48
BurlapCuring CompoundDry
Shrin
kage
(µε)
Time (Hours) Figure 67. Effect of curing on autogenous shrinkage of mix L4
-1000
-800
-600
-400
-200
0
200
0 12 24 36 48
BurlapCuring CompoundDry
Shrin
kage
(µε)
Time (Hours) Figure 68. Effect of curing on autogenous shrinkage of mix M1
86
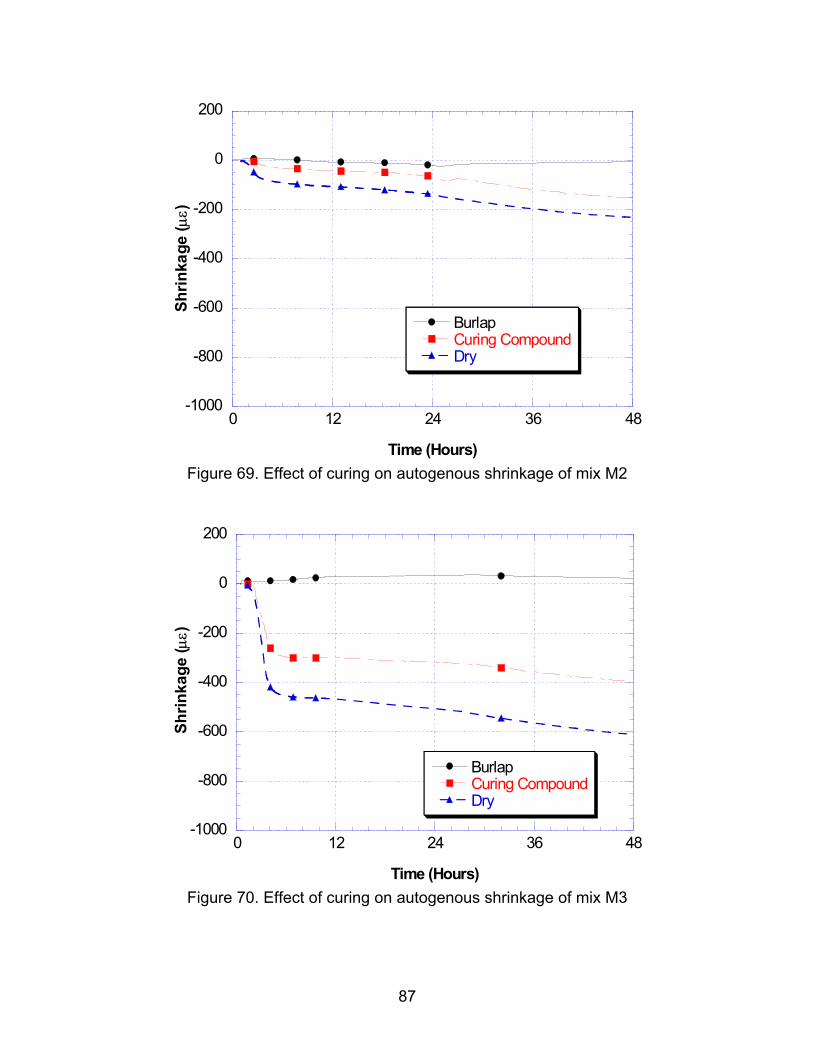
-1000
-800
-600
-400
-200
0
200
0 12 24 36 48
BurlapCuring CompoundDry
Shrin
kage
(µε)
Time (Hours) Figure 69. Effect of curing on autogenous shrinkage of mix M2
-1000
-800
-600
-400
-200
0
200
0 12 24 36 48
BurlapCuring CompoundDry
Shrin
kage
(µε)
Time (Hours) Figure 70. Effect of curing on autogenous shrinkage of mix M3
87

-1000
-800
-600
-400
-200
0
200
0 12 24 36 48
BurlapCuring CompoundDry
Shrin
kage
(µε)
Time (Hours) Figure 71. Effect of curing on autogenous shrinkage of mix M4
-1000
-800
-600
-400
-200
0
200
0 12 24 36 48
SF onlySF+FASF+Slag
Shrin
kage
(µε)
Time (Hours) Figure 72. Effect of pozzolans on mix of w/b ratio 0.29 with dry curing
88

-1000
-800
-600
-400
-200
0
200
0 12 24 36 48
SF onlySF+FASF+Slag
Shrin
kage
(µε)
Time (Hours) Figure 73. Effect of pozzolans on mix of w/b ratio 0.29 with Curing Compound
-1000
-800
-600
-400
-200
0
200
0 12 24 36 48
SF onlySF+FASF+Slag
Shrin
kage
(µε)
Time (Hours) Figure 74. Effect of pozzolans on mix of w/b ratio 0.29 with burlap curing
89

-1000
-800
-600
-400
-200
0
200
0 12 24 36 48
Normal Aggregates
Light Weight AggregatesSh
rinka
ge (µ
ε)
Time (Hours) Figure 75. Effect of aggregates on autogenous shrinkage with dry curing
-1000
-800
-600
-400
-200
0
200
0 12 24 36 48
w/b = 0.29
w/b = 0.35
Shrin
kage
Str
ain
(µε)
Time (Hours) Figure 76. Effect of w/b on autogenous shrinkage with dry curing
90

-1000
-800
-600
-400
-200
0
200
0 12 24 36 48
w/b =0.29
w/b =0.35
Shrin
kage
Str
ain
(µε)
Time (Hours) Figure 77. Effect of w/b on autogenous shrinkage with curing compound
-1000
-800
-600
-400
-200
0
200
0 12 24 36 48
w/b =0.29
w/b =0.35
Shrin
kage
Str
ain
(µε)
Time (hours) Figure 78. Effect of w/b on autogenous shrinkage with burlap curing
91

-1000
-800
-600
-400
-200
0
200
0 12 24 36 48
SP: 20oz/cwt
SP: 12 oz/cwt
Shrin
kage
(µε)
Time (Hours) Figure 79. Effect of amount of superplasticizer on the autogenous shrinkage with dry
curing
20
22
24
26
28
30
0 12 24 36 48
BurlapCuring CompoundDry
Tem
pera
ture
(o C)
Time (Hours) Figure 80. Temperature variations inside the sample of mix L1
92

20
22
24
26
28
30
0 12 24 36 48
BurlapCuring CompoundDry
Tem
pera
ture
(o C)
Time (Hours) Figure 81. Temperature variations inside the sample of mix L2
20
22
24
26
28
30
0 12 24 36 48
BurlapCuring CompoundDry
Tem
pera
ture
(o C)
Time (Hours) Figure 82. Temperature variations inside the sample of mix L3
93

20
22
24
26
28
30
0 12 24 36 48
SF onlySF+FASF+Slag
Tem
pera
ture
(o C)
Time (Hours) Figure 83. Temperature variation inside the samples with different pozzolans and with
burlap curing
-1400
-1200
-1000
-800
-600
-400
-200
0
200
0 20 40 60 80 100
BurlapCuring CompoundDry
Shrin
kage
Str
ain
(µε)
Time (Days) Figure 84. Effect of curing on long-term shrinkage of mix L1
94

-1400
-1200
-1000
-800
-600
-400
-200
0
200
0 20 40 60 80 100
BurlapCuring CompoundDry
Shrin
kage
Str
ain
(µε)
Time (Days) Figure 85. Effect of curing on long-term shrinkage of mix L2
-1400
-1200
-1000
-800
-600
-400
-200
0
200
0 20 40 60 80 100
BurlapCuring CompoundDry
Shrin
kage
Str
ain
(µε)
Time (Days) Figure 86. Effect of curing on long-term shrinkage of mix L3
95
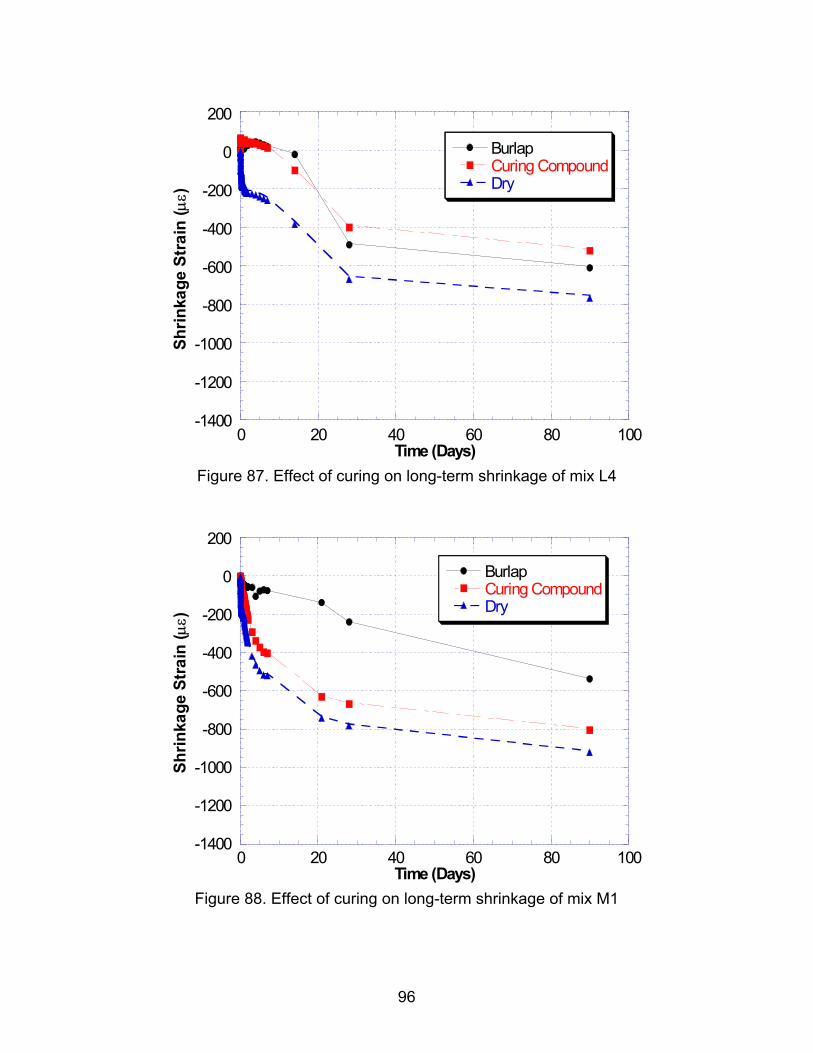
-1400
-1200
-1000
-800
-600
-400
-200
0
200
0 20 40 60 80 100
BurlapCuring CompoundDry
Shrin
kage
Str
ain
(µε)
Time (Days) Figure 87. Effect of curing on long-term shrinkage of mix L4
-1400
-1200
-1000
-800
-600
-400
-200
0
200
0 20 40 60 80 100
BurlapCuring CompoundDry
Shrin
kage
Str
ain
(µε)
Time (Days) Figure 88. Effect of curing on long-term shrinkage of mix M1
96
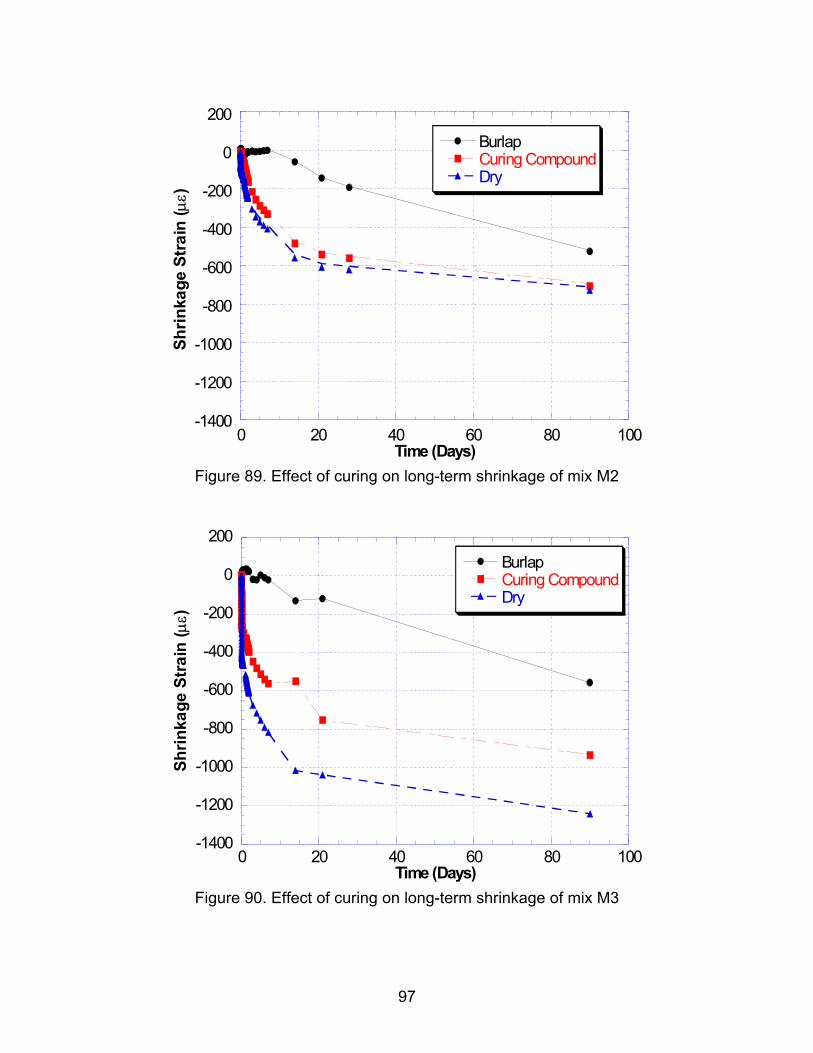
-1400
-1200
-1000
-800
-600
-400
-200
0
200
0 20 40 60 80 100
BurlapCuring CompoundDry
Shrin
kage
Str
ain
(µε)
Time (Days) Figure 89. Effect of curing on long-term shrinkage of mix M2
-1400
-1200
-1000
-800
-600
-400
-200
0
200
0 20 40 60 80 100
BurlapCuring CompoundDry
Shrin
kage
Str
ain
(µε)
Time (Days) Figure 90. Effect of curing on long-term shrinkage of mix M3
97

-1400
-1200
-1000
-800
-600
-400
-200
0
200
0 20 40 60 80 100
BurlapCuring CompoundDry
Shrin
kage
Str
ain
(µε)
Time (Days) Figure 91. Effect of curing on long-term shrinkage of mix M4
-1400
-1200
-1000
-800
-600
-400
-200
0
200
0 20 40 60 80 100
SF onlySF+FASF+Slag
Shrin
kage
Str
ain
(µε)
Time (Days) Figure 92. Effect of pozzolans on long-term shrinkage with dry curing
98

-1400
-1200
-1000
-800
-600
-400
-200
0
200
0 20 40 60 80 100
SF onlySF+FASF+Slag
Shrin
kage
Str
ain
(µε)
Time (Days) Figure 93. Effect of pozzolans on long-term shrinkage when with curing compound
-1400
-1200
-1000
-800
-600
-400
-200
0
200
0 20 40 60 80 100
SF onlySF+FASF+Slag
Shrin
kage
Str
ain
(µε)
Time (Days) Figure 94. Effect of pozzolans on long-term shrinkage with burlap curing
99

-1400
-1200
-1000
-800
-600
-400
-200
0
200
0 20 40 60 80 100
Normal Aggregates
Light Weight AggregatesSh
rinka
ge S
trai
n (µε)
Time (Days) Figure 95. Effect of aggregates on long-term shrinkage with dry curing
-1400
-1200
-1000
-800
-600
-400
-200
0
200
0 20 40 60 80 100
w/b = 0.29
w/b = 0.35
Shrin
kage
Str
ain
(µε)
Time (Days) Figure 96. Effect of w/b on long-term shrinkage with dry curing
100
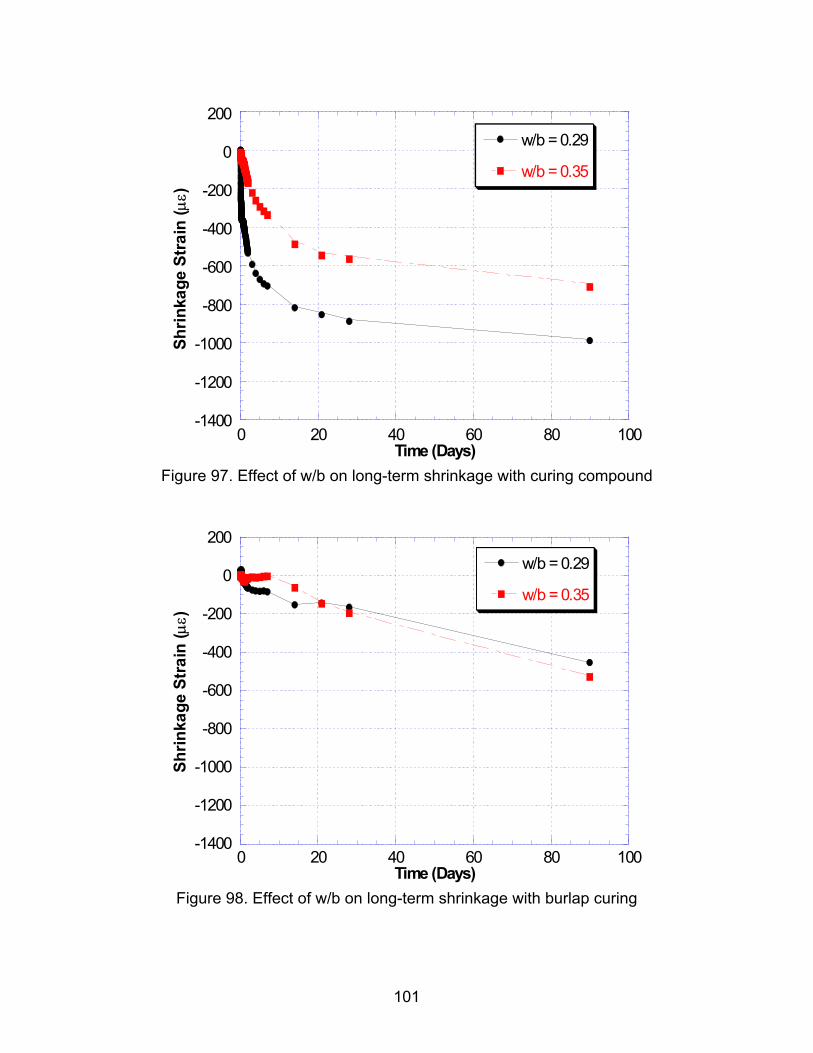
-1400
-1200
-1000
-800
-600
-400
-200
0
200
0 20 40 60 80 100
w/b = 0.29
w/b = 0.35Sh
rinka
ge S
trai
n (µε)
Time (Days) Figure 97. Effect of w/b on long-term shrinkage with curing compound
-1400
-1200
-1000
-800
-600
-400
-200
0
200
0 20 40 60 80 100
w/b = 0.29
w/b = 0.35
Shrin
kage
Str
ain
(µε)
Time (Days) Figure 98. Effect of w/b on long-term shrinkage with burlap curing
101

-1400
-1200
-1000
-800
-600
-400
-200
0
200
0 20 40 60 80 100
SP: 20oz/cwt
SP: 12 oz/cwtSh
rinka
ge S
trai
n (µε)
Time (Days) Figure 99. Effect of amount of superplasticizer on long-term shrinkage with dry curing
0
0.02
0.04
0.06
0.08
0.1
0 20 40 60 80 100
BurlapCuring CompoundDry
Ave
rage
Len
gth
Cha
nge
(%)
Time (Days) Figure 100. Effect of curing methods on drying shrinkage of mix L1
102

0
0.02
0.04
0.06
0.08
0.1
0 20 40 60 80 100
BurlapCuring CompoundDry
Ave
rage
Len
gth
Chan
ge (%
)
Time (Days) Figure 101. Effect of curing methods on drying shrinkage of mix L2
0
0.02
0.04
0.06
0.08
0.1
0 20 40 60 80 100
BurlapCuring CompoundDry
Ave
rage
Len
gth
Cha
nge
(%)
Time (Days) Figure 102. Effect of curing methods on drying shrinkage of mix L3
103

0
0.02
0.04
0.06
0.08
0.1
0 20 40 60 80 100
BurlapCuring CompoundDry
Ave
rage
Len
gth
Chan
ge (%
)
Time (Days) Figure 103. Effect of curing methods on drying shrinkage of mix L4
0
0.02
0.04
0.06
0.08
0.1
0 20 40 60 80 100
BurlapCuring CompoundDry
Ave
rage
Lw
ngth
Cha
nge
(%)
Time (Days) Figure 104. Effect of curing methods on drying shrinkage of mix M1
104

0
0.02
0.04
0.06
0.08
0.1
0 20 40 60 80 100
BurlapCuring CompoundDry
Ave
rage
Len
gth
Chan
ge (%
)
Time (Days) Figure 105. Effect of curing methods on drying shrinkage of mix M2
0
0.02
0.04
0.06
0.08
0.1
0 20 40 60 80 100
BurlapCuring CompoundDry
Ave
rage
Len
gth
Cha
nge
(%)
Time (Days) Figure 106. Effect of curing methods on drying shrinkage of mix M3
105

0
0.02
0.04
0.06
0.08
0.1
0 20 40 60 80 100
BurlapCuring CompoundDry
Ave
rage
Len
gth
Chan
ge (%
)
Time (Days) Figure 107. Effect of curing methods on drying shrinkage of mix M4
0
0.02
0.04
0.06
0.08
0.1
0 20 40 60 80 100
SF onlySF+FASF+Slag
Ave
rage
Len
gth
Cha
nge
(%)
Time (Days) Figure 108. Effect of pozzolans on drying shrinkage with dry curing
106

0
0.02
0.04
0.06
0.08
0.1
0 20 40 60 80 100
SF onlySF+FASF+SlagA
vera
ge L
engt
h C
hang
e (%
)
Time (Days) Figure 109. Effect of pozzolans on drying shrinkage with curing compound
0
0.02
0.04
0.06
0.08
0.1
0 20 40 60 80 100
SF onlySF+FASF+Slag
Ave
rage
Len
gth
Cha
nge
(%)
Time (Days) Figure 110. Effect of pozzolans on drying shrinkage with burlap curing
107

0
0.02
0.04
0.06
0.08
0.1
0 20 40 60 80 100
Normal Aggregates
Light Weight AggregatesAve
rage
Len
gth
Chan
ge (%
)
Time (Days) Figure 111. Effect of aggregates on drying shrinkage with dry curing
0
0.02
0.04
0.06
0.08
0.1
0 20 40 60 80 100
w/b = 0.29
w/b = 0.35
Ave
rage
Len
gth
Cha
nge
(%)
Time (Days) Figure 112. Effect of w/b on drying shrinkage with dry curing
108

0
0.02
0.04
0.06
0.08
0.1
0 20 40 60 80 100
w/b = 0.29
w/b = 0.35
Ave
rage
leng
th C
hang
e (%
)
Time (Days) Figure 113. Effect of w/b on drying shrinkage with curing compound
0
0.02
0.04
0.06
0.08
0.1
0 20 40 60 80 100
w/b = 0.29
w/b = 0.35
Ave
rage
Len
gth
Cha
nge
(%)
Time (Days) Figure 114. Effect of w/b on drying shrinkage with burlap curing
109

0
0.02
0.04
0.06
0.08
0.1
0 20 40 60 80 100
SP: 20oz/cwt
SP: 12 oz/cwt
Ave
rage
Len
gth
Chan
ge (%
)
Time (Days) Figure 115. Effect of amount of superplasticizer on drying shrinkage with dry curing
110

111
REFERENCES 1) Annual Book of ASTM Standard, Volume 04.02, Concrete and Aggregate, 1996 2) Minnick, L. J., Webster, W. C., and Purdy, E. J., “Prediction of the Effect of Fly Ash
in portland Cement Mortar and Concrete,” J. of Materials (ASTM), Vol. 6, No.1, 1971, pp. 163-187.
3) Mehta, P. K., “Pozzolanic and Cementitious Byproducts as Mineral Admixtures for Concrete – A Critical Review,” ACI, SP-79, 1983, pp. 1 – 46.
4) Sturrup, V. R., Hooton, R. D., Clendenning, T. G., “Durability of Fly Ash Concrete,” ACI, SP-79, 1983, pp. 71 – 86.
5) Samarin, A., Munn, R. L., Ashby, J. B., “The Use of Fly Ash in Concrete – Australian Experience,” ACI, SP-79, 1983, pp. 143 – 172.
6) Dunstan, M. R. H., Thomas, M.D.A., Cripwell, J.B., and Harrison, D.J., “Investigation into the Long-Term In-Situ Performance of High Fly Ash Content Concrete Used for Structural Application,” ACI, SP-132, 1992, pp. 1 – 20.
7) Berry, E. E., Hemmings, R. T., Langley, W.S., and Carette, G. G., “Beneficiated Fly Ash Hydration, Microstructure, and Strength Development in Portland Cement Systems,” ACI, SP-114, 1989, pp. 241 – 273.
8) Carette, G. G., Bilodeau, A., Chevrier, R. L., and Malhotra, V. M. "Mechanical Properties of Concrete Incorporating High Volumes of Fly Ash From Sources in the U.S.,” ACI Materials Journal, Nov-Dec 1993, Vol. 90, No. 6, pp 535-544.
9) Costa, U., and Massazza, F., “Some Properties of Pozzolanic Cements Containing Fly Ashes,” ACI, SP-79, 1983, pp. 235 – 254.
10) Gebler, S. Klieger, P., “Effect of Fly Ash on the Air-Void Stability of Concrete,” ACI, SP-79, 1983, pp. 103 – 142.
11) Sivasundaram, V., Carette, G. G., Malhotra, V. M., “Properties of Concrete Incorporating Low Quantity of cement and High Volumes of Low-Calcium Fly Ash,” ACI, SP-114, 1989, pp. 45 – 71.
12) Gebler, S. H., and Klieger, P., “Effect of Fly Ash on the Durability of Air-Entrained Concrete,” ACI, Sp-91, 1986, pp. 483 – 519.
13) Roy, D. M., “Fly Ash and Silica Fume Chemistry and Hydration,” ACI, SP-114, 1989, pp. 117 – 138.
14) Gautefall, O. and Havdahl, J., “Effect of Condensed silica fume on the Mechanism of Chloride Diffusion into Hardened Cement Paste,” ACI, SP – 114, 1989, pp. 849 – 860.
15) Gagné, R., Pigeon, M., Revertégat, E., and Aïtcin, P.C., “Chloride-Ion Attack on Low Water-Cement Ratio Pastes Containing Silica Fume,” ACI, SP – 132, 1992, pp. 1471 – 1490
16) Mehta, P. K., “Pozzolanic and Cementitious By-Products in Concrete – Another Look,” ACI, SP 114, 1989, pp. 1 – 44.
17) Lamond, J. F., “Twenty-five Years’ Experience using Fly Ash in Concrete,” ACI, SP-79, 1983, pp. 47 – 70.
18) Gebler, S. H., Klieger, P., “Effect of Fly Ash on Physical Properties of Concrete,” ACI, SP-91, 1986, pp. 1 – 50.
19) Tse, E. W., Lee, D. Y., and Klaiber, F. W., “Fatigue Behavior of Concrete Containing Fly Ash,” ACI, SP-91, 1986, pp. 273 – 290.
20) Nasser, K. W., and Al-Manaseer, A. A., “Shrinkage and Creep of Concrete Containing 50 Percent Lignite Fly Ash at Different Stress-Strength Ratios,” ACI, SP-91, 1986, pp. 433 – 448.
21) Swamy, R. N., and Mahmud, H. B., “Mix Proportions and Strength Characteristics of Concrete Containing 50 Percent Low-Calcium Fly Ash,” ACI, SP-91, 1986, pp. 413 – 432.
22) Nasser, K. W., and Marzouk, H. M., “Properties of Concrete Made with Sulfate Resisting Cement and Fly Ash,” ACI, SP-79, 1983, pp. 383 – 396.
23) Ukita, K., Ishii, M., Yamamoto, K., Azuma, K., and Kohno, K., “Properties of High Strength Concrete Using “Classified Fly Ash,”” ACI, SP-132, 1992, pp. 37 – 52.
24) Bilodeau, A., and Malhotra, V.M., “Properties of high-Volume Fly Ash Concrete Made with High Early-Strength ASTM Type III Cement,” ACI, SP-153, 1995, pp. 1 – 23.
25) Freeman, R.B., Carrasquillo, R.L., “Effects of Interfrinding Fly Ash on the Sulfate Resistance of Fly Ash Concrete,” ACI, SP-132, 1992, pp. 281 – 297.
26) Whiting, D., “Deicer Scaling Resistance of Lean Concretes Containing Fly Ash,” ACI, SP-114, 1989, pp. 349 – 372.
27) Nasser, K. W., Lai, P.S.H., “Resistance of Fly Ash Concrete to Freezing and Thawing,” ACI, SP-132, 1992, pp. 205 – 226.
28) Carette, G. G., Malhotra, V. M., Bedard, C., De Benedictis, V., Plumat, M., “Development of Heat-Curing Cycles for Portland Cement-Fly Ash Concrete for the Precast Industry,” ACI, SP-91, 1986, pp. 249 – 272.
29) Killoh, D. C., Parrott, L. J., and Patel, R. G., “Influence of Curing at Different Relative Humidities on the Hydration and Porosity of a Portland/Fly Ash Cement Paste,” ACI, SP-114, 1989, pp. 157 – 174.
30) Thomas, M. D. A., Matthews, J. D., Haynes, C. A., “The Effect of Curing on the Strength and Permeability of PFly Ash Concrete,” ACI, SP-114, 1989, pp. 191 – 217.
31) Barrow, R. S., Hadchiti, K. M., Carrasquillo, P. M., and Carrasquillo, R. L., “Temperature Rise and Durability of Concrete Containing Fly Ash,” ACI, SP-114, 1989, pp. 331 – 347.
32) Vandewalle, L., and Mortelmans, F., “The Effect of Curing on the Strength Development of Mortar Containing High Volume of Fly Ash,” ACI, SP-132, 1992, pp. 53 – 63.
33) Luther, M. D. and Hansen, W., “Comparison of Creep and Shrinkage of High-Strength Silica Fume Concretes with Fly Ash Concretes of Similar Strengths,” ACI, SP-114, 1989, pp. 573 – 591.
34) Marusin, S.L., “Influence of Fly Ash and Moist Curing Time on Concrete Permeability,” ACI, SP-132, 1992, pp. 257 – 269.
35) Bilodeau, A., and Malhotra, V.M., “Concrete Incorporating High Volumes of ASTM Class F Fly Ashes: Mechanical Properties and Resistance to Deicer Salt Scaling and to Chloride-Ion Penetration,” ACI, SP-132, 1992, pp. 319 – 349.
112

113
Chemical Attack,” ACI, SP – 114, 1989, pp. 861 – 886.
36) Ramachandran, S., Ramakrishnan, V., and Johnston, D., “The Role of High Volume Fly Ash in Controlling Alkali-Aggregate Reactivity,” ACI, SP-132, 1992, pp. 591 – 613.
37) Thomas, M.D.A., Mukherjee, P.K., Sato, J.A., and Everitt, M.F., “Effect of Fly Ash Composition on Thermal Cracking in Concrete,” ACI, SP-153, 1995, pp. 81 – 98.
38) Hindy, E. E., Miao, B., Chaallal, O., and Aitcin, P.C., "Drying Shrinkage of Ready-Mixed High-Performance Concrete" ACI Materials Journal, May-Jun 1994, Vol. 91, No. 3, pp 300-305.
39) Charif, H., Jaccoud, J-P., and Alou, F. "Reduction of Deformations with the Use of Concrete Admixtures" Admixtures for Concrete: Improvement of Properties, Proceedings of the International Symposium held by RILEM, May 14-17, 1990, Barcelona, Spain; Ed. by E. Vazquez; Chapman and Hall, London, 1990, pp 402-428.
40) Al-Khaja, Waheeb A. “Strength and time-dependent deformations of silica fume concrete for use in Bahrain,” Construction & Building Materials, v 8 n 3, Sept 1994, p 169-172
41) Wiegrink, Karl. Marikunte, Shashidhara. Shah, Surendra P. “Shrinkage cracking of high-strength concrete,” ACI Materials Journal, v 93 n 5, Sep-Oct 1996, p 409-415.
42) Koveler, K., Igarashi, S., and Bentur, A., “Tensile Creep Behavior of High Strength Concretes at Early Ages,” Materials and Structures, V32, June 1999, pp. 383-387.
43) Kanstad, T., Bjøntegaard, O., Sellevold, E.J., Hammer, T.A., and Fidjestøl, P., “Effect of Silica Fume on early age crack sensitivity of High Performance Concrete,” RILEM Proceeding 17: Shrinkage of Concrete-‘Shrinkage 2000’.
44) Persson, B. “Correlating laboratory and field tests of creep in high-performance concrete,” Cement & Concrete Research, v 31 n 3, March 2001, p 389-395.
45) Alexander, M G. “Deformation properties of blended cement concretes containing blast furnace slag and condensed silica fume,” Advances in Cement Research, v 6 n 22, Apr 1994, p 73-81.
46) Khatri, R P. Sirivivatnanon, V. Gross, W. “Effect of different supplementary cementitious materials on mechanical properties of high performance concrete,” Cement & Concrete Research, v 25 n 1, Jan 1995, p 209-220
47) Li, H., Wee, T. H., and Wong, S.F., “Early-Age Creep and Shrinkage of Blended Cement Paste,” ACI Materials Journal, V. 99, No. 1, Jan –Feb 2002.
48) Berke, N.S., “Resistance of Microsilica Concrete to Steel Corrosion, Erosion, and Chemical Attack,” ACI, SP – 114, 1989, pp. 861 – 886.
49) ACI 211.4R.93. “Guide for Selecting Proportions for High –Strength Concrete with Portland Cement and Fly Ash,” ACI Manual of Concrete Practice. Part 1. American Concrete Institute, Detroit, 1994.
50) The New Hampshire Department of Transportation, The University of New Hampshire, and The Federal Highway Administration, “SHRP High Performance Concrete Showcase”, September 22-23, 1997
51) Transportation Inspector Reference Package, Publication CP – 31 52) Yamato, T., Sugita, H., “Shrinkage and Creep of Mass Concrete Containing Fly
Ash,” ACI, SP-79, 1983, pp. 87 – 102. 53) Berke, N.S., “Resistance of Microsilica Concrete to Steel Corrosion, Erosion, and
114
54) Helmuth, R.A., “ Water-Reducing Properties of Fly Ash in Cement Pastes, Mortars, and Concretes: Causes and Test Methods,” ACI, SP-91, 1986, pp. 723 – 740.
55) Wiegrink, K., Marikunte, S., and Shah, S.P., “Shrinkage Cracking of High Strength Concrete,” ACI Materials Journal, V93, No. 5, Sep-Oct 1996.
56) Igarashi, S., Bentur, A., Kovler, K., “Autogenous shrinkage and induced restraining stresses in high strength concretes,” Cement and Concrete Research. v 30 n 11 Nov 2000, pp. 1701-1707.
57) Kohno, K., Okamoto, T., Isikawa, Y., Sibata, T., Mori, H., “Effects of artificial lightweight aggregate on autogenous shrinkage of concrete,” Cement and Concrete Research. v 29 n 4 1999, pp. 611-614.
58) Lura, P. Van Breugel, K. Maruyama, I., “Effect of curing temperature and type of cement on early age shrinkage of High Performance Concrete”, Cement and Concrete Research. v 31 n 12 December 2001.p 1867-1872.
59) Sakata, K. and Ayano, T., “The Effect of Ambient Temperature on Creep and Shrinkage of Concrete,” Presented at the 1997 Fall Convention, ACI, Atlanta, Georgia, USA, Nov. 9-14, 1997.
60) ACI Committee 209, “Prediction of Creep, Shrinkage, and Temperature Effects in Concrete Structures”, Report No. ACI 209R-82, ACI, SP-76, 1982, pp. 193-300.
61) Branson, D.E., and Christiason, M.L., “Time-Dependent Concrete Properties related to Design-Strength and Elastic Properties, Creep, and Shrinkage,” Design for Effects of Creep, Shrinkage, and Temperature in Concrete Structures, ACI Publication SP-76, pp. 257-277.
62) CEB-Bulletin d’Inforamtion No. 203/204/205: CEB-FIP Model Code 1990, Final Draft 1991. Commite Euro-International du Beton (CEB), Lausanne, 1991.
63) Muller, H.S. and Hillsdorf, H.K., “CEB Bulletin d’ information, No. 199, Evaluation of the Time Dependent Behavior of Concrete, Summary Report on the work of general Task Group 9,” Sept. 1990, pp.290.
64) Muller, H.S., “New Prediction Model for Creep and Shrinkage of Concrete,” ACI Publication SP-135, pp. 1-18.
65) Bazant, Z.P., and Baweja, S. “Creep and Shrinkage Prediction Model for Analysis and Design of Concrete Structures – Model B3,” Materials and Structures, 1995, Vol. 28, pp. 357-365, 415-430, 488-495.
66) Gardner, N.J., and Marty Lockman, “Design Provisions for Drying Shrinkage and Creep of Normal – Strength Concrete,” ACI Materials Journal, Mar-Apr 2001 Vol. 98, pp. 159-167.
67) Miyazawa, S. and Tazawa, E., “Prediction model for shrinkage of concrete including Autogenous shrinkage,” Proc. of the 6th International Conference CONCREEP6@MIT- Creep, Shrinkage and Durability mechanics of concrete and other quasi-brittle materials, 2001, pp. 735-740.