fho partners midyear 2009 market report
DESCRIPTION
FHO Partners Mid Year 2009 Market Report provides an overview of the office, laboratory and R&D markets in Greater Boston, how they have performed year-to-date and what you can expect for the rest of 2009.TRANSCRIPT

Commercial Real Estate Value-Addvisors
A DTZ AFFIL IATE
Market Watch BOSTON | MID YEAR 2009

EXECUTIVE OVERVIEW
Mid-way through 2009, the national and local economic climate continues to negatively impact the commercial real estate market conditions in greater Boston. As a result of the ongoing recession, the greater Boston offi ce market softened further as indicated by lack-luster demand, little new development, increasing levels of available space and decreasing rents. On a more positive note, the rapid pace of the increase in available space slowed considerably from the fi rst quarter to the second.
For much of the global economy, 2009 has been a year to ride out the storm that has im-pacted the fi nancial system on all levels; the far reaching repercussions continue to affect everything from consumer confi dence and employment to the credit markets and the stock market. While the economy has begun to stabilize somewhat, it is unclear if the worst of the economic crisis is behind us. The stock market continues to improve, regaining some of the value lost in the last ten months and home sales have increased over last year as a result of low mortgage rates . The consequences of the meltdown continue to be felt at every level of the local, national and global economies.
There are precious few areas of the economy experiencing any expansion, whether on a local or national level. So far this year, the biotechnology, healthcare and education sec-tors have not lost jobs at the same rate as other industries, including fi nancial services, though expansion experienced in recent years seems like a distant memory. Early stage companies found it a diffi cult market in which to raise venture capital, and more mature companies continue to have diffi culty in the IPO market. The lone bright spot continued to be the large pharmaceutical and institutional users like Novartis, Vertex Pharmaceuticals, The Broad Institute, and The Forsyth Institute. These lab users continue to actively seek new space, for the most part in new buildings in Cambridge, Boston’s Longwood Medical Area and Central Route 128.
One of the most problematic results of this economic slowdown has been the astounding number of job losses at the national level and in Massachusetts. The national unemploy-ment rate is the highest since 1983. While job losses have slowed in recent months, there is no end in sight to the workforce reductions across sectors, leading to predictions of a jobless recovery. From 2003 to 2007, the most recent fi ve-year consecutive period of job growth, the average number of jobs created was 1.75 million per year. With almost 6.5 million jobs lost in the United States in 2008 and 2009, at that rate it would take more than three and a half years to regenerate these lost jobs. Given that businesses and individu-als have reacted to the uncertainty in the economy by pulling back on spending, investing in low-risk vehicles and cutting costs wherever possible, the prospects for signifi cant job creation are not likely to be realized until well into 2010 and beyond. This negative employ-ment trend is severely hindering the demand for offi ce space and is likely to be the biggest hurdle in realizing a full commercial real estate market recovery.
OUTLOOKAs a result of the softening offi ce market, there is more offi ce space available to lease and fewer tenants interested in leasing it, creating downward pressure on rental rates. Any signs that a recovery is imminent are premature at best; when the recovery does get underway, it is likely to be a protracted process. Until the distress being felt by businesses dissipates, demand for offi ce, laboratory and R&D space in greater Boston will not increase in a meaningful way.
Asking Rent Vacancy Absorption
Boston
Cambridge
Suburbs
OVERALL MARKET STATISTICS MID YEAR 2009 SUMMARY
Mid Year 2008 Mid Year 2009
DJIA 11,350.11 8,447.00
US Unemployment 5.7% 9.5%
MA Unemployment 5.2% 8.6%
US Employment Payroll (Jan-June) (796,000) (3,382,000)
MA Employment Payroll (Jan-June) (10,533) (49,600)
Sources: Yahoo Finance, Bureau of Labor & Statistics
THE STATE OF THE ECONOMY BY THE NUMBERS
4%
6%
8%
10%
June 2009
May 2009
April 2009
March 2009
Feb. 2009
Jan. 2009
Dec. 2008
Nov. 2008
Oct. 2003
Sept. 2008
Aug. 2008
July 2008
June 2008
May 2008
April 2008
United StatesMassachusetts
Overall Availability 19.5%
Rent $32.20
Absorption (5,060,920)
GREATER BOSTON MARKET SNAPSHOT
UNEMPLOYMENT RATE
www.FHOpartners.com
“Though the path has not been smooth, our economic system has worked extraordinarily well over time. It has unleashed human potential as no other system has, and it will continue to do so. America’s best days lie ahead.”
- Warren Buffet, Chairman, Berkshire HathawayFebruary 2009
MARKET WATCH | MID YEAR 2009

2 | FHO Partners
MARKET WATCH | MID YEAR 2009
BOSTON OVERVIEW
The downtown Boston offi ce market is feeling the impact of the global economic strife in a very acute way in 2009. Demand for offi ce space in downtown Boston waned to end 2008, and shows no signs of increasing thus far in 2009. It is unclear from where new demand for the increased levels of available offi ce space will originate. With many companies right sizing and few companies expanding or adding new jobs, most fi rms are delaying decisions and new commitments for as long as possible. Much of the current deal velocity is being driven by the 3.2 million square feet of lease expirations set to occur between now and 2011. In 2009 the deals that have been done to date are mainly small to mid-size renewals.
The percentage of available space has increased from 13.3% to 16.7% since the be-ginning of 2009. The increase in the amount of available space is due in large part to the addition of large blocks of space at 200 Clarendon Street and 100 Federal Street. On a positive note, in the second quarter there was nearly 80,000 square feet of offi ce space leased at 177 Huntington Avenue in the Back Bay.
There was 404,971 square feet of negative absorption in downtown Boston in the sec-ond quarter, far less than the 1,573,278 square feet of negative absorption observed in the fi rst quarter of 2009. However, demand in 2009 is signifi cantly lower than the 89,455 square feet of net absorption observed at this time last year.
The rate at which sublease space came onto the market slowed in the second quarter; 78,098 square feet was added to the market this quarter as opposed to 500,000 square feet in the fi rst quarter of 2009.
Despite the recent increase in sublease space, it is unclear whether the nearly 2.5 mil-lion square feet of sublease space marketed during the economic downturn of 2000 to 2002 will be matched in 2009.
Average asking rental rates in downtown Boston have decreased nearly 15% this year. Rents declined from $49.87 per square foot in January 2009 to the current rate of $42.85 per square foot.
Several construction projects have stalled as a result of the economic slowdown and the likelihood of any further development is remote in the short term.
Foreclosure activity increased as indicated by the Hancock Tower foreclosure and sale.
MARKET MAKERSSmartBargains leased 43,385 square feet at 10 & 20 Channel Center in the South Boston Waterfront submarket.
CSN Stores, Inc. leased 47,730 square feet from The First Church of Christ, Scientist at 177 Huntington Avenue in the Back Bay.
HISTORICAL PERSPECTIVEAs recently as 2006 there was 1.65 million square feet of sublease space being marketed in downtown Boston, more than the current amount of 1.54 million square feet; in 2007 that number dropped to 631,257 square feet, the low point in that market recovery.
Inventory 58,300,409 SF
Availability Rate 16.7%
Net Absorption YTD 2009 (1,978,249) SF
Average Asking Rent $17.00-$70.00/SF
MARKET HIGHLIGHTS
One Marina Park Drive - Fan Pier 504,000 SF
Russia Wharf 550,000 SF
DEVELOPMENT PROJECTS
-2,500,000
-2,000,000
-1,500,000
-1,000,000
-500,000
0
500,000
1,000,000
1,500,000
2,000,000
YTD2009
20082007200620052004200320022001200019990%
2%
4%
6%
8%
10%
12%
14%
16%
18%
Square Feet % Vacancy
Net AbsorptionVacancy Rate
ABSORPTION / VACANCY 1999-YTD 2009
$0
$25
$50
$75
$100
YTD 200920082007200620052004
RENTAL RATES
CAMBRIDGE OVERVIEW
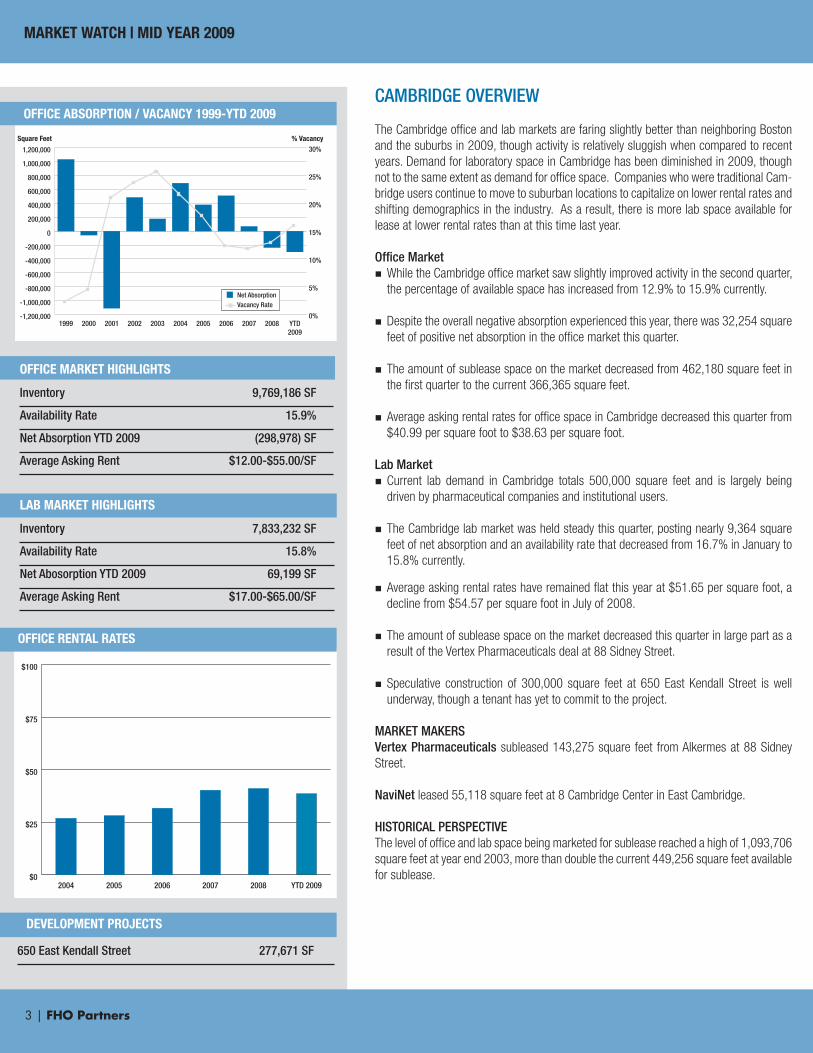
The Cambridge offi ce and lab markets are faring slightly better than neighboring Boston and the suburbs in 2009, though activity is relatively sluggish when compared to recent years. Demand for laboratory space in Cambridge has been diminished in 2009, though not to the same extent as demand for offi ce space. Companies who were traditional Cam-bridge users continue to move to suburban locations to capitalize on lower rental rates and shifting demographics in the industry. As a result, there is more lab space available for lease at lower rental rates than at this time last year.
Offi ce Market While the Cambridge offi ce market saw slightly improved activity in the second quarter,
the percentage of available space has increased from 12.9% to 15.9% currently.
Despite the overall negative absorption experienced this year, there was 32,254 square feet of positive net absorption in the offi ce market this quarter.
The amount of sublease space on the market decreased from 462,180 square feet in the fi rst quarter to the current 366,365 square feet.
Average asking rental rates for offi ce space in Cambridge decreased this quarter from $40.99 per square foot to $38.63 per square foot.
Lab Market Current lab demand in Cambridge totals 500,000 square feet and is largely being
driven by pharmaceutical companies and institutional users.
The Cambridge lab market was held steady this quarter, posting nearly 9,364 square feet of net absorption and an availability rate that decreased from 16.7% in January to 15.8% currently.
Average asking rental rates have remained fl at this year at $51.65 per square foot, a decline from $54.57 per square foot in July of 2008.
The amount of sublease space on the market decreased this quarter in large part as a result of the Vertex Pharmaceuticals deal at 88 Sidney Street.
Speculative construction of 300,000 square feet at 650 East Kendall Street is well underway, though a tenant has yet to commit to the project.
MARKET MAKERSVertex Pharmaceuticals subleased 143,275 square feet from Alkermes at 88 Sidney Street. NaviNet leased 55,118 square feet at 8 Cambridge Center in East Cambridge.
HISTORICAL PERSPECTIVEThe level of offi ce and lab space being marketed for sublease reached a high of 1,093,706 square feet at year end 2003, more than double the current 449,256 square feet available for sublease. $0
$25
$50
$75
$100
YTD 200920082007200620052004
Inventory 9,769,186 SF
Availability Rate 15.9%
Net Absorption YTD 2009 (298,978) SF
Average Asking Rent $12.00-$55.00/SF
OFFICE MARKET HIGHLIGHTS
650 East Kendall Street 277,671 SF
-1,200,000
-1,000,000
-800,000
-600,000
-400,000
-200,000
0
200,000
400,000
600,000
800,000
1,000,000
1,200,000
YTD2009
2008200720062005200420032002200120001999
Square Feet % Vacancy
Net AbsorptionVacancy Rate
0%
5%
10%
15%
20%
25%
30%
OFFICE ABSORPTION / VACANCY 1999-YTD 2009
OFFICE RENTAL RATES
Inventory 7,833,232 SF
Availability Rate 15.8%
Net Abosorption YTD 2009 69,199 SF
Average Asking Rent $17.00-$65.00/SF
LAB MARKET HIGHLIGHTS
3 | FHO Partners
MARKET WATCH | MID YEAR 2009MARKET WATCH | MID YEAR 2009
DEVELOPMENT PROJECTS
4 | FHO Partners
MARKET WATCH | MID YEAR 2009
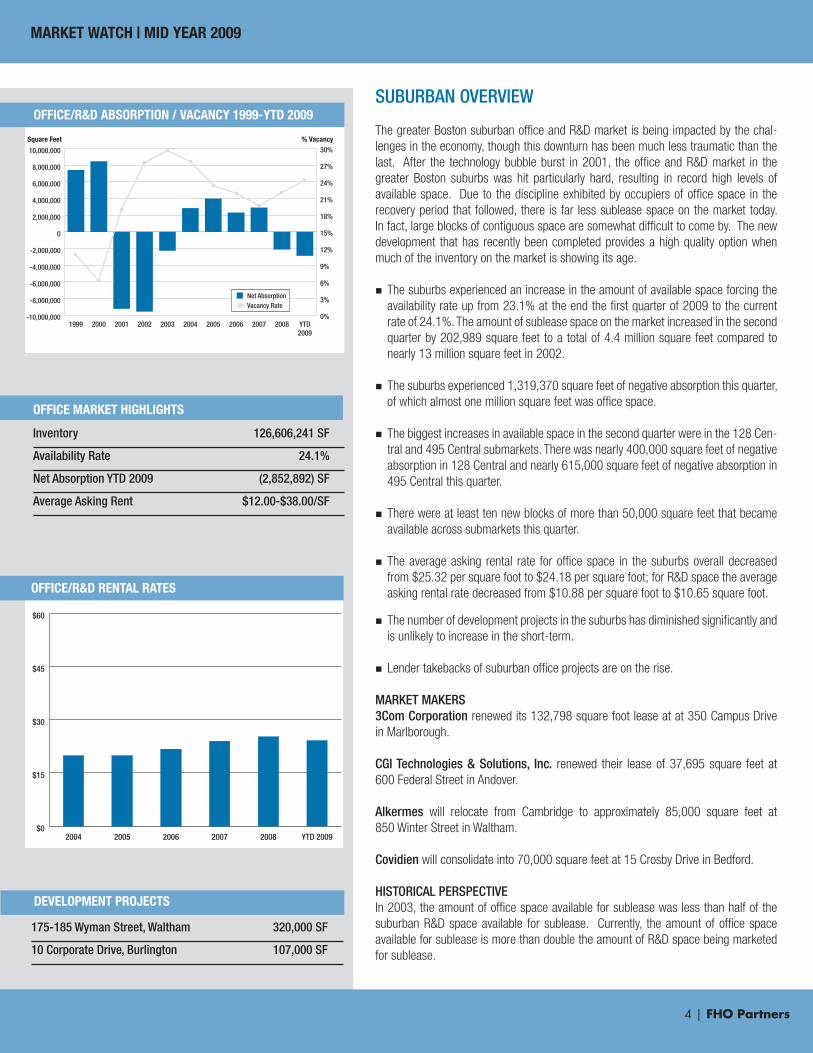
Inventory 126,606,241 SF
Availability Rate 24.1%
Net Absorption YTD 2009 (2,852,892) SF
Average Asking Rent $12.00-$38.00/SF
OFFICE MARKET HIGHLIGHTS
175-185 Wyman Street, Waltham 320,000 SF
10 Corporate Drive, Burlington 107,000 SF
DEVELOPMENT PROJECTS
-10,000,000
-8,000,000
-6,000,000
-4,000,000
-2,000,000
0
2,000,000
4,000,000
6,000,000
8,000,000
10,000,000
YTD2009
2008200720062005200420032002200120001999
Square Feet % Vacancy
Net AbsorptionVacancy Rate
0%
3%
6%
9%
12%
15%
18%
21%
24%
27%
30%
OFFICE/R&D ABSORPTION / VACANCY 1999-YTD 2009
$0
$15
$30
$45
$60
YTD 200920082007200620052004
OFFICE/R&D RENTAL RATES
SUBURBAN OVERVIEW
The greater Boston suburban offi ce and R&D market is being impacted by the chal-lenges in the economy, though this downturn has been much less traumatic than the last. After the technology bubble burst in 2001, the offi ce and R&D market in the greater Boston suburbs was hit particularly hard, resulting in record high levels of available space. Due to the discipline exhibited by occupiers of offi ce space in the recovery period that followed, there is far less sublease space on the market today. In fact, large blocks of contiguous space are somewhat diffi cult to come by. The new development that has recently been completed provides a high quality option when much of the inventory on the market is showing its age.
The suburbs experienced an increase in the amount of available space forcing the availability rate up from 23.1% at the end the fi rst quarter of 2009 to the current rate of 24.1%. The amount of sublease space on the market increased in the second quarter by 202,989 square feet to a total of 4.4 million square feet compared to nearly 13 million square feet in 2002.
The suburbs experienced 1,319,370 square feet of negative absorption this quarter, of which almost one million square feet was offi ce space.
The biggest increases in available space in the second quarter were in the 128 Cen-tral and 495 Central submarkets. There was nearly 400,000 square feet of negative absorption in 128 Central and nearly 615,000 square feet of negative absorption in 495 Central this quarter.
There were at least ten new blocks of more than 50,000 square feet that became available across submarkets this quarter.
The average asking rental rate for offi ce space in the suburbs overall decreased from $25.32 per square foot to $24.18 per square foot; for R&D space the average asking rental rate decreased from $10.88 per square foot to $10.65 square foot.
The number of development projects in the suburbs has diminished signifi cantly and is unlikely to increase in the short-term.
Lender takebacks of suburban offi ce projects are on the rise.
MARKET MAKERS3Com Corporation renewed its 132,798 square foot lease at at 350 Campus Drive in Marlborough.
CGI Technologies & Solutions, Inc. renewed their lease of 37,695 square feet at 600 Federal Street in Andover.
Alkermes will relocate from Cambridge to approximately 85,000 square feet at 850 Winter Street in Waltham.
Covidien will consolidate into 70,000 square feet at 15 Crosby Drive in Bedford. HISTORICAL PERSPECTIVEIn 2003, the amount of offi ce space available for sublease was less than half of the suburban R&D space available for sublease. Currently, the amount of offi ce space available for sublease is more than double the amount of R&D space being marketed for sublease.
MARKET WATCH | MID YEAR 2009

5 | FHO Partners
MARKET TOTAL TOTAL AVAILABILITY TOTAL VACANCY YTD 2009 NET DIRECT WEIGHTED INVENTORY AVAILABLE RATE VACANT RATE ABSORPTION AVG. RENT
BOSTON OFFICE 58,300,409 9,719,560 16.7% 5,678,767 9.7% (1,978,249) $42.85
Back Bay 12,182,324 2,005,951 16.5% 1,121,258 9.2% (424,418) $45.72
Charlestown 1,745,328 234,591 13.4% 188,782 10.8% (3,663) $27.81
Fenway 1,911,890 56,380 2.9% 41,830 2.2% 1,059 $26.24
Financial District 27,925,181 5,313,054 19.0% 2,996,274 10.7% (1,086,767) $45.94
Government Center 1,878,278 345,920 18.4% 119,183 6.3% (231,695) $35.39
Midtown 1,872,209 220,285 11.8% 145,273 7.8% (52,756) $28.44
North Station 1,630,744 219,910 13.5% 165,517 10.1% (10,416) $36.01
South Boston Waterfront 5,275,761 1,095,858 20.8% 760,034 14.4% (232,918) $31.26
South Station 3,878,694 237,589 6.1% 154,478 4.0% 63,325 $36.39
CAMBRIDGE OFFICE 9,769,186 1,549,241 15.9% 939,546 9.6% (298,978) $38.63
Alewife/West Cambridge 1,714,404 333,431 19.4% 235,875 13.8% (24,243) $36.01
East Cambridge 6,160,198 1,046,805 17.0% 608,275 9.9% (190,888) $39.94
Mass Avenue Corridor 1,894,584 169,005 8.9% 95,396 5.0% (83,847) $34.91
CAMBRIDGE LAB 7,833,232 1,238,631 15.8% 1,106,783 14.1% 69,199 $51.65
Alewife/West Cambridge 677,311 212,012 31.3% 208,212 30.7% (2,750) $32.91
East Cambridge 4,534,266 703,709 15.5% 636,930 14.0% 13,119 $55.23
Mass Avenue Corridor 2,621,655 322,910 12.3% 1,127,515 14.4% 58,830 $56.74
SUBURBS OFFICE/R&D 126,606,241 30,561,376 24.1% 21,552,418 17.0% (2,852,892) $24.18
128 Central 40,673,196 9,208,584 22.6% 5,602,610 13.8% (896,116) $27.51
128 North 9,332,139 2,446,370 26.2% 1,992,019 21.3% (9,579) $19.72
128 South 14,481,036 3,339,266 23.1% 2,555,774 17.6% (464,682) $22.07
3/24 South 1,922,813 392,316 20.4% 363,335 18.9% (42,638) $22.34
495 Central 17,746,164 4,693,526 26.4% 3,038,417 17.1% (493,902) $22.12
495 North 31,691,923 9,014,460 28.4% 6,910,313 21.8% (712,400) $18.09
495 South 4,285,045 843,001 19.7% 618,133 14.4% (19,868) $20.25
Inner Suburbs 6,473,925 623,853 9.6% 471,817 7.3% (213,707) $25.09
TOTAL 202,509,068 43,068,808 21.3% 29,277,514 14.5% (5,060,920) $32.39
MARKET SUMMARY
MARKET WATCH | MID YEAR 2009
GLOSSARY OF TERMS
METHODOLOGYThe information included in this report is the result of a compilation of information on Class A, B and C offi ce, R&D and investment properties located in the Boston area. The information was obtained by FHO Partners from representatives of each property.
All of the information gathered is stored in a FHO Partners database which is updated quarterly. From this database, total inventory, vacancy rate, rental rate and absorption fi gures may be calculated and presented.
Total inventory may change from year to year as a result of newly constructed or newly renovated buildings, recently remeasured properties, or signifi cant change or deletion of a particular building status. The database is thoroughly checked and balanced from year to year. The appropriate adjustments are made in order to bal-ance the fi gures and calculate the most accurate vacancy and absorption fi gures.
DEFINITIONSInventory:Includes all existing competitive offi ce and R&D buildings over 20,000 sq. ft. as well as signifi cant buildings less than that size. Under construction, government, medi-cal, educational and 100% owner-occupied buildings are not included.
Direct Space:Space available directly from the building owner. Includes space available for oc-cupancy within the next 24 months. Does not include space in under construction buildings.
Sublease Space:Space available through a lessee to a third party for the remainder of the original lease term and/or beyond. Includes space being actively marketed.
Vacancy Rate:Space, available both directly and by sublease, that is currently vacant and being marketed for immediate occupancy. Does not include space under construction.
Availability Rate:Available space is generally defi ned as space that is being actively marketed and/or available for occupancy within the next 24 months.
Construction Completions:Buildings which have received their certifi cate of occupancy in the stated time period.
Under Constructio n:Buildings which have had excavation work commence, but have not yet received their certifi cate of occupancy.
Offi ce:Space designed for general offi ce use. Buildings are generally two or more stories and offer tenants a higher-level of fi nish than R&D space.
R&D:Space designed for high technology, offi ce or light industrial use. Buildings are generally one or two stories. Net Absorption:The net change in occupied space over a given period of time. Calculations are based on available space.
Rental Rates:Gross: Rents which include tax and operating expenses, but generally not electricity.
Triple Net: Rents where the tenant is directly responsible for all tax, operating and utility expenses.
Weighted Average Rent:An average rental rate that is weighted by the amount of square footage available at each respective rental rate.
MARKET WATCH | MID YEAR 2009
6 | FHO Partners
For more information contact:
Elizabeth SchoetzResearch AssociateFHO PartnersOne International PlaceBoston, Massachusetts 02110
Direct Tel: +1 (617) 279 4580Email: [email protected]
©2009 FHO Partners. All rights reserved. All information contained herein is from sources deemed reliable; however, no representation or warranty is made to the accuracy thereof. Information contained herein should not, in whole or part, be published, reproduced or referred to without prior approval. Any such reproduction should be credited to FHO Partners.
Commercial Real Estate Value-Addvisors
A DTZ AFFIL IATE