fgb investor presentation - personal banking · fgb investor presentation march 2016. 2/46...
TRANSCRIPT

1/46
FGB Investor Presentation
March 2016

2/46
DisclaimerThis presentation provides information in summary form only and is not intended to be complete. It is not intended to be relied upon as
advice to investors or potential investors and does not take into account the investment objectives, financial situation or needs of any
particular investor.
No presentation ,express or implied, is made as to the fairness accuracy, completeness or correctness of information contained in this
presentation, including the accuracy, likelihood of achievement or reasonableness of any forecasts, prospects, synergies, returns,
benefits or statements in relation to future matters contained in the presentation.
The forward-looking statements are by their nature subject to significant uncertainties and contingencies and are based on numbers or
estimates or assumptions that are subject to change (and in many cases are outside the control of FGB and its directors) which may
cause the actual results or performance of FGB to be materially different from any future results or performance expressed or implied
by such forward looking statements.
To the maximum extent permitted by law, FGB disclaims any responsibility for the accuracy or completeness of any information
contained in this presentation including any forward-looking statements and disclaims any responsibility to update or revise any
information or forward-looking statement to reflect any change in FGB’s financial condition, status or affairs or any change in the
events, conditions or circumstances on which a statement is based.
To the maximum extent permitted by law, neither FGB nor its related bodies corporate, directors, employees or agents, nor any other
person, accepts any liability, including, without limitation, any liability arising from fault or negligence, for any direct, indirect or
consequential loss arising from the use of this presentation or its contents or otherwise arising in connection with it.
This presentation should be read in conjunction with other publicly available material. Rounding differences may appear in some tables
and charts.
Further information including historical results and a description of the activities of FGB is available on our website, www.fgb.ae
3/46
Contents
Operating Environment………………………………………………………………….....………………………………………………………………….....4/46
FGB Profile……………………………………………………………………………………………………………………………………………………………..…….8/46
Capital…………………………………………………...……………………………………………………………………………………………………………………15/46
Liquidity & Funding……………………………………………………....…………………………………………………………………………………………17/46
Asset Mix & Asset Quality………………………………………………………………………………………………………………………………………20/46
Appendix……………………………………………………………………………………………………………………………………………………………………22/46
4/46
Agriculture1%
Mining &Quarrying
35%
Manufacturing9%
Electricity, Gas,Water
2%Construction
9%
Trade,Restaurant &
Hotels14%
Transport9%
Real Estate &BusinessServices
10%
Finance8%
GovernmentServices
1%
Other2%
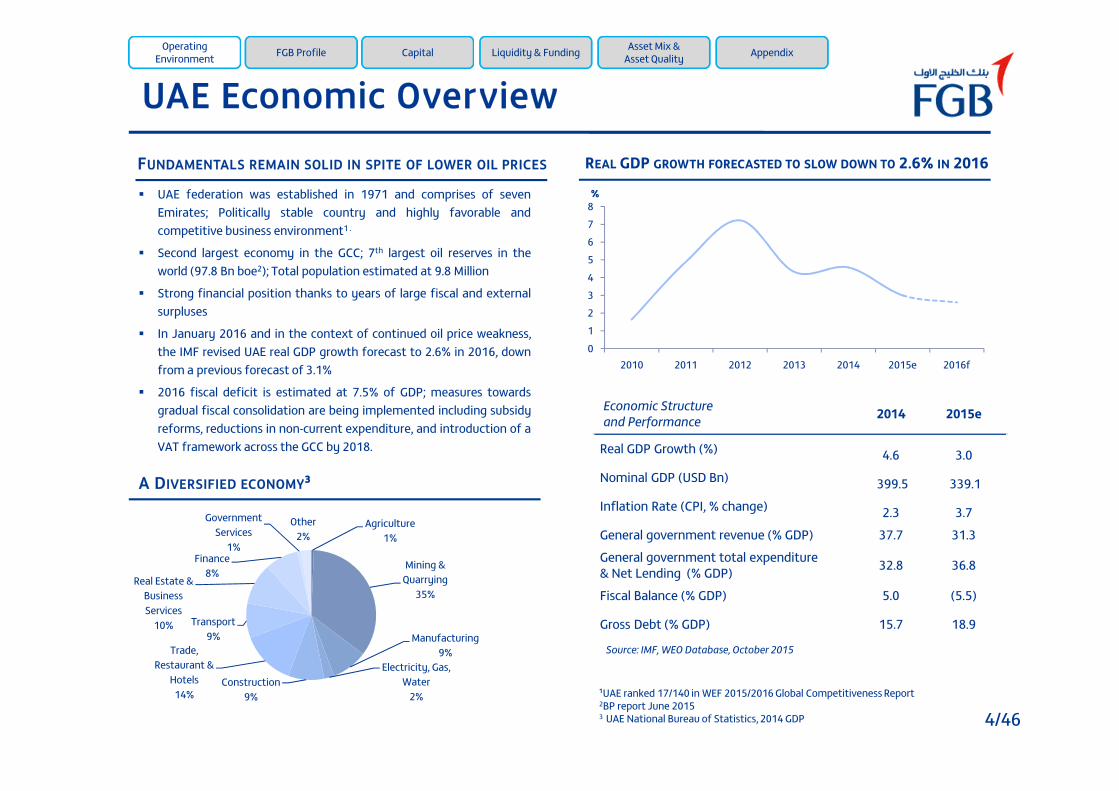
UAE Economic OverviewREAL GDP GROWTH FORECASTED TO SLOW DOWN TO 2.6% IN 2016FUNDAMENTALS REMAIN SOLID IN SPITE OF LOWER OIL PRICES
A DIVERSIFIED ECONOMY³
Source: IMF, WEO Database, October 2015
¹UAE ranked 17/140 in WEF 2015/2016 Global Competitiveness Report2BP report June 20153 UAE National Bureau of Statistics, 2014 GDP
012345678
2010 2011 2012 2013 2014 2015e 2016f
% UAE federation was established in 1971 and comprises of sevenEmirates; Politically stable country and highly favorable andcompetitive business environment1 .
Second largest economy in the GCC; 7th largest oil reserves in theworld (97.8 Bn boe2); Total population estimated at 9.8 Million
Strong financial position thanks to years of large fiscal and externalsurpluses
In January 2016 and in the context of continued oil price weakness,the IMF revised UAE real GDP growth forecast to 2.6% in 2016, downfrom a previous forecast of 3.1%
2016 fiscal deficit is estimated at 7.5% of GDP; measures towardsgradual fiscal consolidation are being implemented including subsidyreforms, reductions in non-current expenditure, and introduction of aVAT framework across the GCC by 2018.
Economic Structureand Performance 2014 2015e
Real GDP Growth (%) 4.6 3.0
Nominal GDP (USD Bn) 399.5 339.1
Inflation Rate (CPI, % change) 2.3 3.7
General government revenue (% GDP) 37.7 31.3
General government total expenditure& Net Lending (% GDP) 32.8 36.8
Fiscal Balance (% GDP) 5.0 (5.5)
Gross Debt (% GDP) 15.7 18.9
OperatingEnvironment FGB Profile Capital Liquidity & Funding Asset Mix &
Asset Quality Appendix

5/46
Abu Dhabi Economic Overview
Sharjah
ABU DHABI
Dubai Ajman
Umm al-Quwayn
Ras al-Khaymah
Fujairah
ABU DHABI AT A GLANCE
1 S&P, February 20162 Statistics Center Abu Dhabi (SCAD) 2015, preliminary estimates
Economic Structureand Performance 2014 2015e 2016f
Nominal GDP (USD Bn) 259 206 185
Real GDP growth (%) 4.7 4.2 2.0
Inflation Rate (CPI, % change) 3.2 5.0 3.5
Revenue/ GDP 39.7 35.8 34.3
Expenditures/ GDP 39.6 38.2 42.5
Balance/ GDP 0.1 (2.5) (8.2)
Liquid Assets/ GDP (%) 230.5 300.8 343.7
ABU DHABI – KEY STATISTICS¹ GDP BREAKDOWN BY SECTOR 2014²
Mining andQuarrying
51%
Construction10%
Financial andInsurance
7% Real estate5%
Publicadministration
and defense6%
ManufacturingIndustries
5%
Transport andStorage
4%Wholesale Retail
Trade andRepairing Services
4%
Others8%
Largest Emirate in the UAE accounting for more than 80% of thecountry’s total land area; Population estimated at 2.8 Million1.
Abu Dhabi Nominal GDP estimated at USD 185Bn in FY16f1, that’s 52% ofUAE overall nominal GDP.
51% of 2014² GDP generated from the hydrocarbon sector; major non-oilGDP contributors include: construction, financial services, publicadministration and defense, and manufacturing.
Transition underway towards a more diversified economy with aparticular focus on the infrastructure and services sectors inline with AbuDhabi Plan 2030.
Strong net asset position providing a robust buffer to mitigate impact oflower oil prices.
OperatingEnvironment FGB Profile Capital Liquidity & Funding Asset Mix &
Asset Quality Appendix

6/46
0
0.2
0.4
0.6
0.8
1
1.2
0
0.2
0.4
0.6
0.8
1
1.2
Jan-15 Feb-15 Mar-15 Apr-15 May-15 Jun-15 Jul-15 Aug-15 Sep-15 Oct-15 Nov-15 Dec-15 Jan-16
LIBOR 3M EIBOR 3M E-L Spread (RHS)
The UAE in the context of lower oil prices
USD 22BN NET DEPOSIT SURPLUS AS OF JAN’16
UAE ENJOYS STRONG FISCAL BUFFER TO COUNTERACTIMPACT OF LOWER OIL PRICES UAE PMI1 REMAINS IN EXPANSIONARY TERRITORY
EIBOR RISING BUT SPREAD OVER LIBOR IS STABLE
1UAE Purchasing Manager Index is a composite indicator designed to provide an overall view of activity in the UAE’s non-oil private sector economy.The indicator is derived from individual diffusion indices which measure changes in output, new orders, employment, suppliers’ delivery and stocks of goods purchased.
Source: Markit Economics
OperatingEnvironment FGB Profile Capital Liquidity & Funding Asset Mix &
Asset Quality Appendix
0
5
10
15
20
25
30
0
50
100
150
200
UAE Qatar Kuwait Saudi Arabia Oman Bahrain
Breakeven Oil Prices (USD/barrel) - LHS Fiscal Buffer (Years) - RHS
Source: IMF, Oct. 2015
2 1 4
-5
0
-19-10
5
0
1927
37
23 22
97% 98%96%
103%100%
108%104%
98% 100%
94% 92% 90%94% 95%
50%
60%
70%
80%
90%
100%
110%
-40
-20
0
20
40
60
80
100
Dec'03 Dec'04 Dec'05 Dec'06 Dec'07 Dec'08 Dec'09 Dec'10 Dec'11 Dec'12 Dec'13 Dec'14 Dec'15 Jan'16
USD
Bn
Net Deposit Surplus/ Deficit USD Bn L/D ratio
53.1
40
45
50
55
60
65
Feb-15 Apr-15 Jun-15 Aug-15 Oct-15 Dec-15 Feb-16

7/46
0%
5%
10%
15%
20%
2009 2010 2011 2012 2013 2014 2015
Deposit Growth YoY Loan Growth YoY
Figures in USD Bn Jan’16 Dec’15 MoM % YoY %
Total Assets, net 648 647 0.2% 7.7%
Loans and Advances, net 379 377 0.4% 7.6%
Customer Deposits 401 401 - 4.2%
LDR 95% 94% +100bps +300bpsLending to Stable ResourcesRatio* 86.9% 86.9% - +90bps
CAR** 18.3%
Tier 1 capital** 16.6%
A sound and highly capitalised banking system
UAE banking sector comprises 49 banks (23 local, 26 foreign); top 5 localbanks hold more than 60% of system loans and deposits.
Strong track record of systemic support as evident through thepreventive measures taken at the onset of the global financial crisis
Strengthened macroprudential policies through the implementation of:maximum LTVs on mortgages, 50% Debt Burden Ratio, minimumGeneral Provisions at 1.5% of CRWA.
UAE Central Bank introduced in May 2015 a glide path on LiquidityCoverage Ratio (LCR) in the context of gradual migration to Basel IIIregulatory framework. The minimum for the current year is 70%, upfrom 60% in 2015.
As of Jan’16, system loan book grew by 7.6% YoY (+USD 27Bn) whilecustomer deposits added 4.2% YoY (+USD 16Bn). According to estimates,system loan growth in 2016 should slow down to mid single-digit.
UAE Banking System is highly capitalized with Dec-end 2015 total CARand tier 1 capital at 18.3% and 16.6% respectively
KEY HIGHLIGHTS UAE BANKING SECTOR KEY INDICATORS1
1 Source: UAE Central Bank
OperatingEnvironment FGB Profile Capital Liquidity & Funding Asset Mix &
Asset Quality Appendix
*Total advances (net lending + net financial guarantees & stand-by LC+ Interbank placements morethan 3 months)/ sum of (net free capital funds + total other stable resources)**Basel 2
ENBD19% FGB
11%
NBAD15%
ADCB11%
DIB7%
Other UAEBanks37%
ENBD19% FGB
10%
NBAD16%
ADCB10%
DIB7%
OtherUAE
Banks38%
CUSTOMER DEPOSITS
CREDIT GROWTH EXPECTED TO SLOW DOWN IN 2016
DEC’15 LOAN AND DEPOSIT MARKET SHARES
LOANS & ADVANCES

8/46
FGB Summary Profile
Leading UAE franchise; #1 UAE Bank by market capitalisation, #2 by net profitand #4 by total assets; 11% and 10% market shares in loans and depositsrespectively
Superior fundamentals in terms of cost efficiency, asset quality and profitability
Strong Credit Ratings: A+ by Fitch, A2 by Moody's, and A by S&P; Stable outlook
Comfortable liquidity position and access to multiple funding channels
Strong risk management culture and stable management team
Business model re-aligned to drive sustainable value creation
Robust capital position: Basel II total CAR at 17.5% and Tier 1 capital ratio at16.3% as of Dec’15
OperatingEnvironment FGB Profile Capital Liquidity & Funding Asset Mix &
Asset Quality Appendix

9/46
Aseel Finance to provide innovativeIslamic products to a broad base ofcustomers and businesses
Dubai First to provide specialistcredit card propositions to theexpanding UAE customer base
Enhance fee income throughcomprehensive propertymanagement of residential andcommercial real estate assetsacross the UAE
Geographic diversification throughexpansion of existing operationsand penetration in key markets
Focus on trade and financial flowsthrough the UAE into targetinternational locations
Sourcing and distribution of tradeand financing opportunities acrossthe FGB network
Build deeper client relationships,providing solutions and highquality service
Continue to target largecreditworthy UAE-based customers
Develop and strengthen acustomer-centric approachemphasizing on bespoke servicequality and product range
Three-Pillar Strategy
ORGANIC GROWTH OFCORE BANKING ACTIVITIES
SELECTIVE REGIONAL ANDINTERNATIONAL EXPANSION
SYNERGIES WITHSUBSIDIARIES AND ASSOCIATES
1 2 3
Our Mission:To Be the “First Choice” for customers
Our Vision:To Be Recognised as a World-Class Organization Maximizing Value For All Stakeholders
OperatingEnvironment FGB Profile Capital Liquidity & Funding Asset Mix &
Asset Quality Appendix
10/46
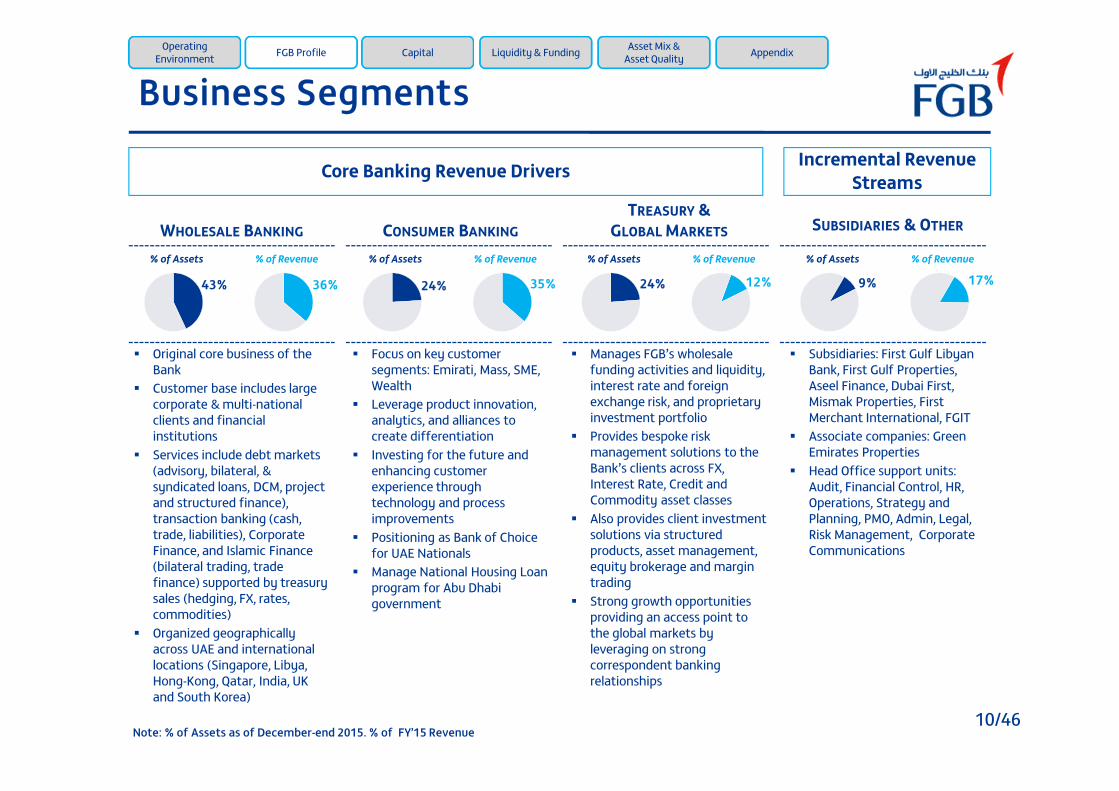
Business Segments
Original core business of theBank
Customer base includes largecorporate & multi-nationalclients and financialinstitutions
Services include debt markets(advisory, bilateral, &syndicated loans, DCM, projectand structured finance),transaction banking (cash,trade, liabilities), CorporateFinance, and Islamic Finance(bilateral trading, tradefinance) supported by treasurysales (hedging, FX, rates,commodities)
Organized geographicallyacross UAE and internationallocations (Singapore, Libya,Hong-Kong, Qatar, India, UKand South Korea)
Core Banking Revenue Drivers
Focus on key customersegments: Emirati, Mass, SME,Wealth
Leverage product innovation,analytics, and alliances tocreate differentiation
Investing for the future andenhancing customerexperience throughtechnology and processimprovements
Positioning as Bank of Choicefor UAE Nationals
Manage National Housing Loanprogram for Abu Dhabigovernment
Manages FGB’s wholesalefunding activities and liquidity,interest rate and foreignexchange risk, and proprietaryinvestment portfolio
Provides bespoke riskmanagement solutions to theBank’s clients across FX,Interest Rate, Credit andCommodity asset classes
Also provides client investmentsolutions via structuredproducts, asset management,equity brokerage and margintrading
Strong growth opportunitiesproviding an access point tothe global markets byleveraging on strongcorrespondent bankingrelationships
Subsidiaries: First Gulf LibyanBank, First Gulf Properties,Aseel Finance, Dubai First,Mismak Properties, FirstMerchant International, FGIT
Associate companies: GreenEmirates Properties
Head Office support units:Audit, Financial Control, HR,Operations, Strategy andPlanning, PMO, Admin, Legal,Risk Management, CorporateCommunications
WHOLESALE BANKING CONSUMER BANKINGTREASURY &
GLOBAL MARKETS SUBSIDIARIES & OTHER
Incremental RevenueStreams
Note: % of Assets as of December-end 2015. % of FY’15 Revenue
43% 36%
% of Assets % of Revenue
24% 35%
% of Assets % of Revenue
24% 12%
% of Assets % of Revenue
9% 17%% of Assets % of Revenue
OperatingEnvironment FGB Profile Capital Liquidity & Funding Asset Mix &
Asset Quality Appendix
11/46
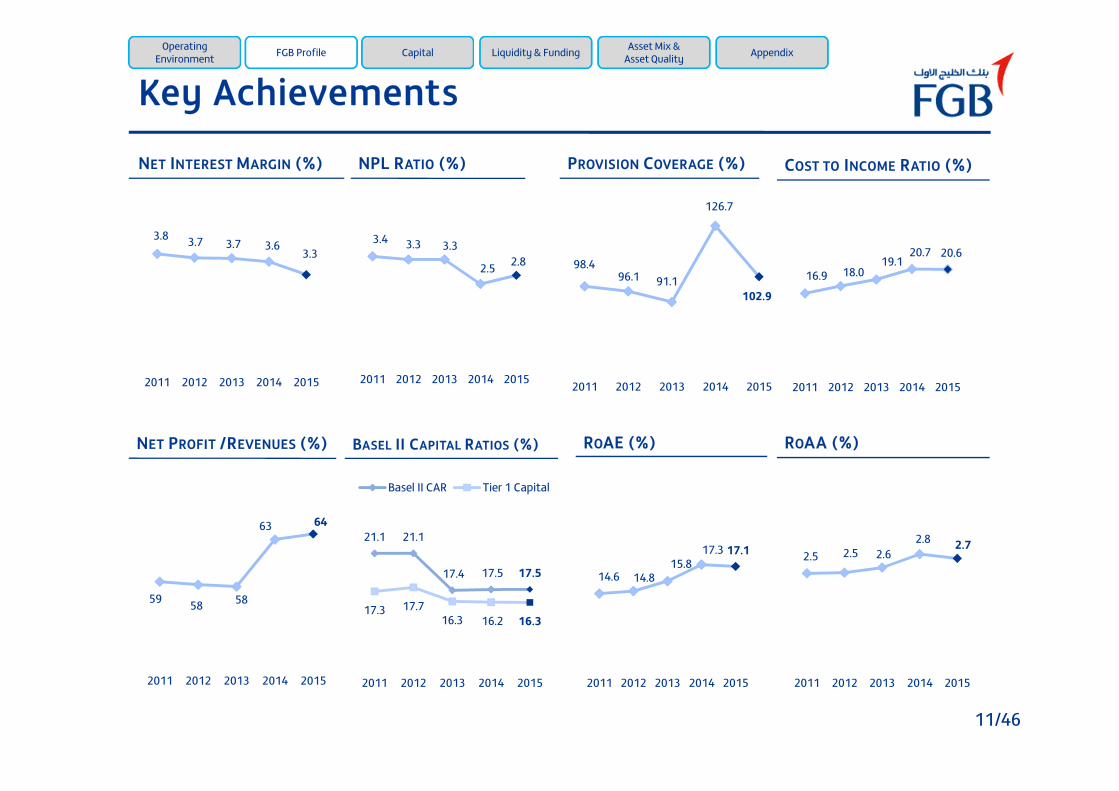
Key Achievements
NET INTEREST MARGIN (%) NPL RATIO (%) PROVISION COVERAGE (%) COST TO INCOME RATIO (%)
ROAE (%) ROAA (%)
3.8 3.7 3.7 3.63.3
2011 2012 2013 2014 2015
3.4 3.3 3.3
2.5 2.8
2011 2012 2013 2014 2015
16.9 18.019.1
20.7 20.6
2011 2012 2013 2014 2015
14.6 14.815.8
17.3 17.1
2011 2012 2013 2014 2015
2.5 2.5 2.62.8 2.7
2011 2012 2013 2014 2015
98.496.1 91.1
126.7
102.9
2011 2012 2013 2014 2015
NET PROFIT /REVENUES (%)
59 58 58
63 64
2011 2012 2013 2014 2015
BASEL II CAPITAL RATIOS (%)
21.1 21.1
17.4 17.5 17.5
17.3 17.716.3 16.2 16.3
2011 2012 2013 2014 2015
Basel II CAR Tier 1 Capital
OperatingEnvironment FGB Profile Capital Liquidity & Funding Asset Mix &
Asset Quality Appendix
12/46
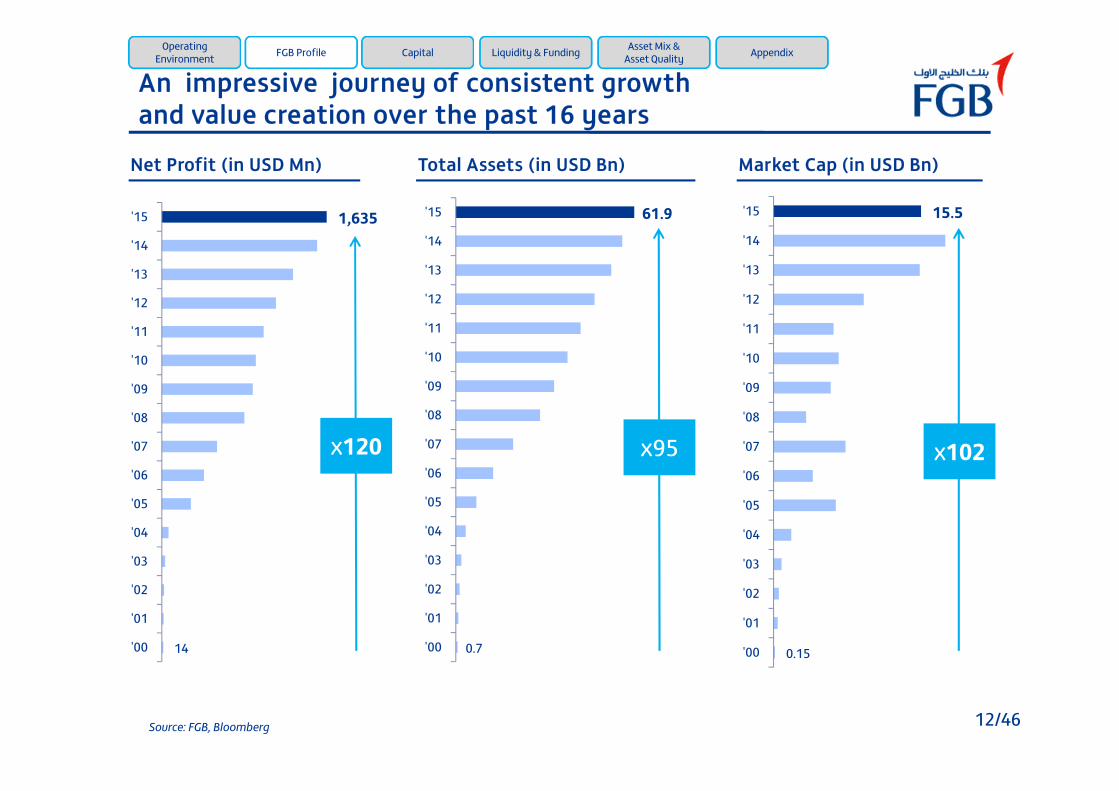
14
1,635
'00
'01
'02
'03
'04
'05
'06
'07
'08
'09
'10
'11
'12
'13
'14
'15
0.7
61.9
'00
'01
'02
'03
'04
'05
'06
'07
'08
'09
'10
'11
'12
'13
'14
'15
0.15
15.5
'00
'01
'02
'03
'04
'05
'06
'07
'08
'09
'10
'11
'12
'13
'14
'15
An impressive journey of consistent growthand value creation over the past 16 years
Total Assets (in USD Bn) Market Cap (in USD Bn)Net Profit (in USD Mn)
x120 x95 x102
Source: FGB, Bloomberg
OperatingEnvironment FGB Profile Capital Liquidity & Funding Asset Mix &
Asset Quality Appendix

13/46
Ranking
Profitability& Efficiency
Return on Average Equity % 17.1 12.9 14.6 17.9 #2
Return on Average Assets % 2.7 1.3 1.9 2.3 #1
Cost to Income % 20.6 38.7 30.7 34.2 #1
Net Interest Margin % 3.3 2.0 2.9 3.3 #1
Earnings Per Share USD 0.4 0.3 0.3 0.2 #1
Asset QualityNPL ratio % 2.8 2.8 7.1 3.0 #2
Provision Coverage % 102.9 105.0 111.5 128.5 #4
Liquidity
Net Loans to Total Assets % 65.8 50.6 66.6 67.3 #3
Loans to Deposits % 105.1 88.1 94.2 107.1 #3
Liquid Asset Ratio % 15.2 24.7 23.3 17.3 #4
SolvencyTier 1 Capital % 16.3 15.7 18.0 16.3 #2
Capital Adequacy % 17.5 16.7 20.7 19.8 #3
FGB vs. large domestic peers – FY’15Operating
Environment FGB Profile Capital Liquidity & Funding Asset Mix &Asset Quality Appendix

14/46
FY15 GUIDANCE ACTUAL RESULTS FY16 GUIDANCE
LOAN BOOK GROWTH 10-12% 7% Low single-digit
REVENUE GROWTH Low-single digit 5% Flat to low single-digit
NIMS 25bps – 35bps decrease 31bps decrease 3.0% - 3.2%
EXPENSES C/I Ratio: 23%-24% 20.6%* C/I Ratio<23%
ASSET QUALITY CoR: 80-90bps 91bpsNPL ratio < 3.5%
Cost of risk < 100bps
NET PROFIT GROWTH Mid-single digit 6% Flat to low single-digit
Financial Guidance
*23.1% before reclassification of retail-related expenses
OperatingEnvironment FGB Profile Capital Liquidity & Funding Asset Mix &
Asset Quality Appendix

15/46
Capital Strength (Basel II)CAPITAL ADEQUACY RATIO* (%)
• Basel II total CAR and Tier 1 capital ratios after dividend
distribution remained robust at 17.5% and 16.3%
respectively as of Dec’15
• RWA grew at a CAGR of 7% over 2011-2015 and by 3%
YoY in 2015
• FGB’s medium term Tier 1 capital floor under Basel II
remains at 14%
RISK WEIGHED ASSETS (USD BN)CAPITAL BASE (USD BN)
HIGHLIGHTS
OperatingEnvironment FGB Profile Capital Liquidity & Funding Asset Mix &
Asset Quality Appendix
21.1 21.1
17.4 17.5 17.5
17.3 17.716.3 16.2 16.3
Dec'11 Dec'12 Dec'13 Dec'14 Dec'15
Basel II CAR Tier 1 Capital
*In March 2013, FGB was the first UAE bank to fully repay the federal government loan of USD 1.2Bn which was eligible as Tier 2 capital
8.3 8.78.2
8.7 9.1
6.87.3 7.7 8.1 8.4
Dec'11 Dec'12 Dec'13 Dec'14 Dec'15
Total Capital Tier 1 capital
39.6 41.446.9
50.0 51.7
Dec'11 Dec'12 Dec'13 Dec'14 Dec'15
+3%

16/46
Regulatory Environment
OTHER REGULATION FGB
GENERALPROVISIONS
GP at 1.5% of CRWA • GP at 1.56% of CRWA
CREDITBUREAU
Al Etihad Credit Bureau (AECB) is now operational
• FGB implemented AECB in 2015• Consumer Banking loan growth is expected to be impacted
accordingly
OperatingEnvironment FGB Profile Capital Liquidity & Funding Asset Mix &
Asset Quality Appendix
BASEL III GUIDELINES FGB
LIQUIDITYShort-term resilience of the liquidity risk profile -sufficient HQLA to survive a significant stressscenario lasting 30 calendar days (LCR)
• FGB Group LCR as of December-end 2015 stood at 97.3%,above the minimum requirement of 60% for year 2015. Asper CB glide path, LCR minimum requirement stands at 70%from Jan 1st, 2016
FUNDING
Structural ratio aiming to ensure banks havesufficient long term funding to meet funding oflong term assets & a portion of contingent liabilitydrawdowns during market wide stress (NSFR) i.e.Available Stable Funding to be > Required StableFunding (w.e.f. 2018)
• Currently managed through internal strategy of funding35% of term assets with term liabilities of the respectivetenor; major initiatives underway for moving towards NSFRprior to the Basel implementation date of 2018
CAPITALUAE CB expected to release Basel III guidelines inthe course of 2016
• Basel II Total CAR and Tier 1 ratio of 17.5% and 16.3%respectively as of December-end 2015
• FGB’s ability to comply with Basel III requirements does notraise any concerns given its comfortable liquidity andcapital positions
LEVERAGE RATIO Minimum Basel III Leverage Ratio of 3% • FGB Leverage Ratio stands above the Basel III minimum asof Dec’15

17/46
Asset / Liability Mix
Dec’15 Balance Sheet size of USD 61.9Bn
DEC’15 ASSET MIX DEC’15 FUNDING MIX
OperatingEnvironment FGB Profile Capital Liquidity & Funding Asset Mix &
Asset Quality Appendix
Liquid Assets15%
Loans &Advances
66%
Investments10%
Inv.Properties
4%
Other5%
Customerdeposits
63%
Due to Banks8%
EuroCommercial
Paper1%
MTBorrowing,
EMTN, Sukuk9%
Other3% Equity
16%

18/46
+1%28.2
32.537.6 38.5 38.8
Dec'11 Dec'12 Dec'13 Dec'14 Dec'15
LiquidityCUSTOMER DEPOSITS TREND (USD BN)
DEPOSITS BY SECTORREGULATORY ADVANCES-TO-DEPOSITS RATIO (%)
HIGHLIGHTS
• Customer deposits grew at a CAGR of 8% over 2011-2015. During 2015, the
deposit base remained fairly stable YoY at USD 38.8Bn
• By sector, corporate deposits are the main contributor with 39% of total
deposits followed by government & public sector deposits (31%), the deposit
related to the National Housing Loan (NHL) program (14%), retail deposits
(12%), and international deposits (4%). CASA deposits represent 21% of total
customer deposits as of Dec’15
• Liquidity position is comfortable with Regulatory Advances-to-Deposits ratio
at 87.2% as of Dec-end 2015, well below the regulatory ceiling of 100%
• As of Dec’15, FGB displays a Group LCR of 97.3% which is comfortably above
the Basel III glide path of 60% for the year 2015
Government &Public Sector
31%
NHL Deposit14%
Corporate39%
Retail12%
InternationalDivision
4%
OperatingEnvironment FGB Profile Capital Liquidity & Funding Asset Mix &
Asset Quality Appendix
84.5
76.280.6 83.5
87.2
Dec'11 Dec'12 Dec'13 Dec'14 Dec'15

19/46
Banks39%
FundManagers
23%Insurance
12%
PrivateBanks14%
CentralBanks/Govt
6%
HedgeFunds
5%Other
1%
-300
200
700
1,200
2016 2017 2018 2019 2020 2022 2023 2025
PP Public Swiss LoansPublic US$ Sukuk Public US$ Conv. Public A$Tokyo Pro-Bond Formosa Club Loan
USD Mn
Recent Notable Public Trades
Wholesale Funding Maturity Profile (USD 5.5Bn)
Funding Diversification
Middle East32%
Europe32%
UK10%
Asia16%
Japan6%
Australia4%
In 2015, FGB has raised USD 2.2Bn of term funding against an annual target of USD1.6Bn.FGB successfully established a USD 3Bn ECP programme in June.
5yr A$250MnKangaroo
5yr ¥10BnPro-Bond
5yr US$750MnReg S
3yr CNH400MnFormosa
Mar’14
Jun’14
Feb’15
Jan’15 Apr’15
May’15
Sep’15
7yr CHF200MnSwiss
3yr US$1BnSyndicated loan
US$900Mnloan repayment
OperatingEnvironment FGB Profile Capital Liquidity & Funding Asset Mix &
Asset Quality Appendix
Bond investor base by geography*
Bond investor base by type*
*Since November 2013

20/46
+7%
28.530.5
34.638.0
40.8
Dec'11 Dec'12 Dec'13 Dec'14 Dec'15
Liquid Assets15%
Loans &Advances
66%
Investments10%
Inv.Properties
4%
Other5%
Asset Mix and Lending ActivityLOAN BOOK TREND (USD BN)
DEC’14 DEC’15
LOAN BOOK BREAKDOWN BY SECTORASSET MIX
HIGHLIGHTS
• Loans & advances grew at a CAGR of 10% over 2011-2015.
• In 2015, loans and advances grew by 7% YoY vs. our initial guidance of 10-12%. This is due to loan payments which offset new underwritings duringQ4’15.
• FGB’s loan portfolio remains well diversified across economic sectors witha mix of 61% wholesale / 39% consumer
• Liquid assets (cash and balances with CB, and due from Banks andFinancial Institutions) represent 15% of total assets as of Dec’15, against17% last year. This reflects the growth momentum over the period, inparallel with FGB’s compliance with LCR requirements.
Agriculture1%
Construction4%
Energy2%
FinancialServices
7%Government
1%Manufacturing
5%Personal-others
2%
Public Sector9%
Real Estate8%
Retail Loans &Cards23%
RetailMortgages
2%
Retail NHLMortgages
12%
Securities/Sharefinancing
0%
Services17%
Trading6%
Transportation1%
LiquidAssets
17%
Loans &Advances
66%
Investments8%
Inv.Properties
4%
Other5%
OperatingEnvironment FGB Profile Capital Liquidity & Funding Asset Mix &
Asset Quality Appendix

21/46
Asset QualityNPL RATIO AND PROVISION COVERAGE (%)
NPLS AND PROVISIONS (USD MN)COST OF RISK (BPS)
HIGHLIGHTS
• NPL ratio stood at 2.8% as of Dec-end 2015. During Q4’15,the settlement of a large corporate account was offset bythe downgrade of a large international exposure.
• At 102.9%, provision coverage is healthy and withinmanagement target range of ~100%
• General provisions represent 1.56% of total CRWA against aregulatory ratio of 1.5%
• 2015 cost of risk improved to a 7-year low of 91bps
Dec’15 Dec’14 YoY % Sep’15 QoQ %
NPLs 1,169 962 22% 1,185 -1%
Provisions 1,206 1,219 -1% 1,298 -7%
Specific 470 538 -13% 561 -16%
General 733 681 8% 737 -1%
OperatingEnvironment FGB Profile Capital Liquidity & Funding Asset Mix &
Asset Quality Appendix
143 140 134
95 91
2011 2012 2013 2014 2015
3.4 3.3 3.32.5 2.8
98.0 96.0 91.0
126.7
102.9
-
1.0
2.0
3.0
4.0
5.0
6.0
7.0
8.0
-
20.0
40.0
60.0
80.0
100.0
120.0
140.0
Dec'11 Dec'12 Dec'13 Dec'14 Dec'15
NPL ratio Provision coverage

22/46
Appendix

23/46
Appendix Content• Q4/FY’15 Summary Financials
• Revenue Mix & Cost Efficiency
• Business Segment Contributions
• Dividend History
• FGB Overview
• History & Key Milestones
• Key Achievements
• Board of Directors
• Corporate Governance
• ERM Framework
• Abu Dhabi Plan 2030
• UAE Real Estate Overview
• FGB 2015 Awards

24/46
Q4/FY’15 Summary Financials
Note: Rounding differences may appear in the above table
Income Statement (USD Mn) FY'15 FY'14 YoY Q4'15 Q3'15 QoQ Q4'14 YoYNet Interest and Islamic Financing Income 1,750 1,762 -1% 451 429 5% 443 2%Fees & Commission Income, Net* 463 445 4% 107 124 -13% 114 -6%Other Operating Income 355 235 51% 185 45 308% 72 158%Operating Income 2,568 2,441 5% 744 598 24% 629 18%G&A expenses (530) (505) 5% (136) (126) 8% (147) -7%Provisions/ Impairments (396) (374) 6% (138) (86) 60% (48) 186%Taxes (4) (9) -61% (1) 0 NA (4) -71%Minority Interest (4) (13) -73% (1) (1) 100% (8) -86%Net Income 1,635 1,540 6% 468 386 21% 422 11%Earnings Per Share (USD) 0.36 0.33 8% 0.10 0.08 23% 0.09 13%*Net of related expenses, previously classified under G&A expenses
Balance Sheet (USD Bn) Dec'15 Dec'14 YoY Sep'15 QoQLoans & Advances 40.8 38.0 7% 42.0 -3%Customer Deposits 38.8 38.5 1% 38.5 1%Total Assets 61.9 57.8 7% 62.2 0%Shareholders’ Equity 9.8 9.3 5% 9.3 5%
Key Ratios (%) FY'15 FY'14 YoY (bps)Net Interest Margin 3.3 3.6 (30)Cost-to-Income 20.6 20.7 (10)Non-Performing Loan (NPL) 2.8 2.5 30Provision Coverage 102.9 126.7 (2,380)Regulatory Advances-to-Deposits Ratio 87.2 83.5 370Return on Average Equity 17.1 17.3 (20)Return on Average Assets 2.7 2.8 (10)Capital Adequacy 17.5 17.5 -

25/46
70% 72% 72% 61%
18% 20% 21% 14%12% 8% 9%
25%
Q1'15 Q2'15 Q3'15 Q4'15
Other Income (inc. share of profit from assoc.)
Net Fees and commissions
Net Interest and Islamic Financing Income
611615 598
744
72% 68%
18% 18%
10% 14%
FY'14 FY'15
2,4412,568
2,441
2,56818 20
+109
-11 -8
FY'14 Net Interestand Islamic Fin.
Income
InvestmentIncome
Fees &CommissionIncome, Net
FX&Derivatives Other income FY'15
Key Revenue Movements and NIMsKEY MOVEMENTS IN OPERATING INCOME* (USD MN)HIGHLIGHTS
NET INTEREST MARGIN (%) - YTD REVENUE BREAKDOWN (USD MN)
+5%
• Resilient FY’15 operating performance despite increased market volatility,with revenues adding 5% YoY (+USD 127Mn) as a result of :o +USD 109Mn increase in Other Income supported by property
gainso +USD 20Mn increase in FX & Derivatives incomeo +USD 18Mn addition in net fees and commission income driven
by higher revenues related to wealth management, syndicationsand retail lending activities
o -USD 8Mn decline in investment income due to volatile globalmarket conditions
o -USD 11Mn reduction in net interest and Islamic Financing incomeprimarily due to 31bps NIM contraction YoY, within managementguidance
• Non-interest revenues increased their contribution in total operatingincome to 32% in FY’15 up from 28% in FY’14, reflecting the Bank’ssuccessful revenue diversification strategy.
3.583.44 3.39 3.30 3.27
Dec'14 Mar'15 Jun'15 Sep'15 Dec'15
*2015 revenues include fees and commissions presented net of related expenses previouslyclassified under G&A expenses (USD 81Mn)

26/46
In USD Mn FY’15 FY’14 YoY %
Commission income 135 156 -14%Fee income 230 204 13%
Fees and commissions on credit cards 177 156 14%Brokerage and fund management fee income 2 4 -42%
Fees & commission income 544 520 +5%Fees & commission expenses (81) (75) +9%
Fees & commission income, Net 463 445 +4%Investment income 38 46 -18%FX & Derivatives 73 53 +37%Property and other income* 244 136 +80%Total 818 680 +20%
Non-Interest Revenues and Cost Efficiency
• Non-interest revenues grew by 20% YoY in spite of deterioratingoperating conditions and increased markets volatility
• Fee income and fees and commissions on credit cards showed a positivetrend thanks to higher wealth management, credit card and corporate& syndication fees, offsetting the decline in trade finance-relatedincome
• Fees & commission expenses of USD 81Mn include credit card expenses(USD 45Mn), insurance on retail products (USD 11Mn), collectioncommissions (USD 11Mn), and draw and other expenses(USD 15Mn)
• During Q4, property income was supported by MTM gains andcompensation fees on project completion delays for a total amount ofUSD 145Mn (more details on slide 32/46)
• G&A expenses increased by 5% YoY reflecting higher business volumesand continued investments in key strategic projects. FY’15 C/I ratiolanded at 20.6% (or 23.1% before retail expenses reclassification), wellbelow management medium term target of 25%
FY’15 NON-INTEREST REVENUES
COST EFFICIENCY
HIGHLIGHTS
FY’15 NON-INTEREST REVENUE BREAKDOWN*Including share of profit from associates
Fees andcommissionincome, net
56%
Investmentincome
5%
FX &Derivatives
9%
Property andother Income
30%
291 350 427 505 53016.9 18.0 19.120.7 20.6
18.9 19.621
23.1 23.1
2011 2012 2013 2014 2015
Operating expenses (USD Mn)C/I ratio (%)C/I ratio before retail direct expenses adjustments (%)

27/46
Business Segment ContributionsASSETS BREAKDOWN
• Continued focus on enhancing core capabilities and onmaximizing synergies between the three corebusinesses: Wholesale & International Banking Group(WBG), Consumer Banking Group (CBG), and Treasury &Global Markets Group (T&GM)
• These three pillars represent 91% of Group total assetsas of Dec’15
• WBG generated 36% of FY’15 Group revenues, followedby CBG (35%) and T&GM (12%).
SEGMENTAL REVENUE BREAKDOWN AND CONTRIBUTIONS TO GROUP REVENUE* (USD MN)
HIGHLIGHTS
931
2,568
909311
228189
WBG CBG T&GM Real Estate Otheroperations
FGB Group
*“Effective 1st January, 2015, the Bank has changed its Funds Transfer Pricing Methodology (“FTP”). As a result of the change inthe FTP, comparative figures relating to net interest income and income from Islamic financing as well as profit attributable toequity holders of the Bank for 2014 have been adjusted for consistency purposes.”
*Other Operations include subsidiaries and associates (other than real estate), and the Head Office
WBG Total43%
CBG24% T&GM
24%
Real Estateactivities
4%Other
operations5%
WBG Total36%
ConsumerBanking
35%
T&GM12%
Real Estateactivities
9%
Other8%

28/46
24.9
26.4
Dec'14 Dec'15
86% 86%
14% 14%
FY'14 FY'15
UAE Operations International Operations
931962
603 698
50
FY'14 FY'15
683653-15
Wholesale Banking Group - WBGOPERATING INCOME (USD MN)
WHOLESALE GROSS LOAN PORTFOLIO (DEC’15)TOTAL ASSETS (USD BN)
HIGHLIGHTS NET PROFITS (USD MN)
-3% +5%
+6%
• Healthy commercial momentumsupported 6% YoY assets growth
• Successful diversification strategysupported solid fee income growth,partially offsetting impact ofcontracting NIMs on interest revenues.
• Net profit grew by 5% to USD 683Mn(USD +30Mn) thanks to diligent riskmanagement and expense control
Government &Public Sector
7%
Abu DhabiPrivate Sector
35%
Dubai PrivateSector
20%
Other UAEPrivate Sector
4%
Non UAE-basedCorporates
34%

29/46
13.615.0
Dec'14 Dec'15
512473
FY'14 FY'15
858 909
FY'14 FY'15
Consumer Banking Group - CBGOPERATING INCOME¹ (USD MN)
CONSUMER GROSS LOAN PORTFOLIO (DEC’15)TOTAL ASSETS (USD BN)
HIGHLIGHTS NET PROFITS (USD MN)
*Auto loans and overdrafts
+10%
+6% -8%
• Continued focus on product innovation
and enhanced customer experience
• CBG revenues grew 6% YoY to
USD 909Mn while Net Profit shows a 8%
YoY decrease due to higher impairments
• Wealth Management , SME loans and
credit cards remain key growth drivers
representing 24% of Dec’15 gross loan
portfolio
Personal Loans36%
Abu DhabiGovernment
NationalHousing Loans
35%
Credit Cards9%
Other MortgageLoans
4%
IslamicFinancing
1%
Loans to SMEs5%Wealth
Management10%
Others*0%
¹Net of retail direct expenses
30/46
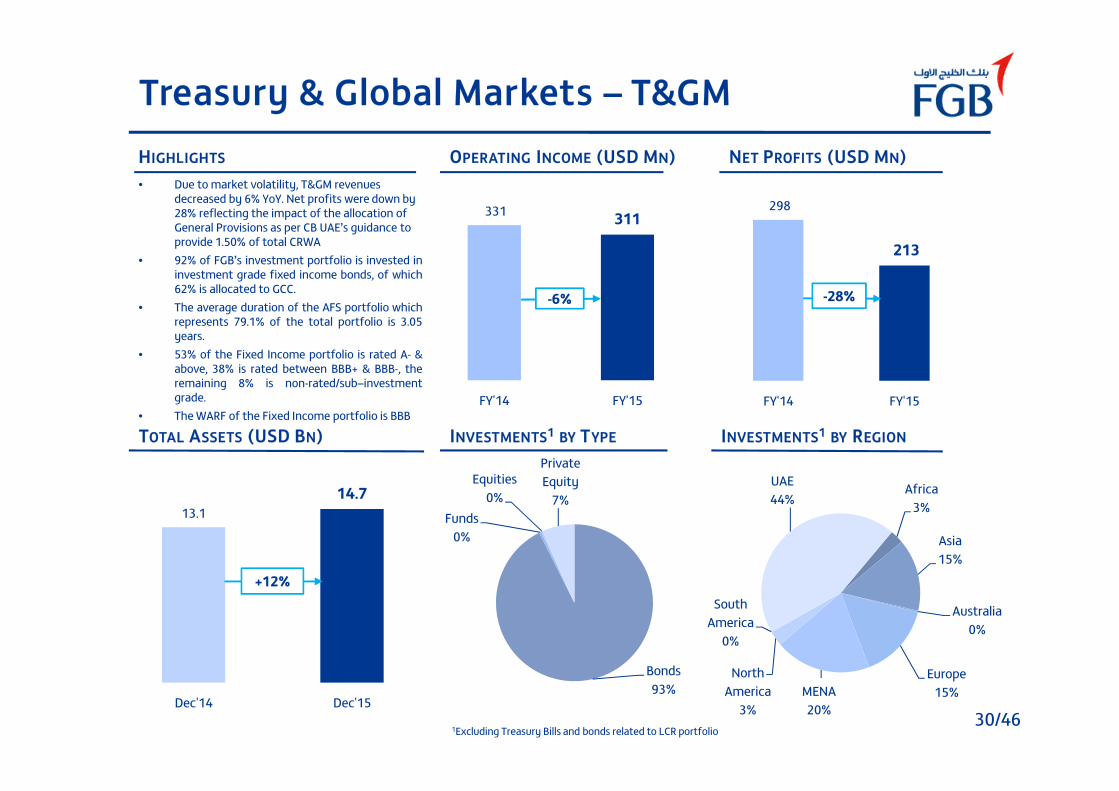
13.114.7
Dec'14 Dec'15
298
213
FY'14 FY'15
331 311
FY'14 FY'15
Treasury & Global Markets – T&GMOPERATING INCOME (USD MN)
TOTAL ASSETS (USD BN)
HIGHLIGHTS NET PROFITS (USD MN)
+12%
-6% -28%
INVESTMENTS1 BY TYPE INVESTMENTS1 BY REGION
1Excluding Treasury Bills and bonds related to LCR portfolio
• Due to market volatility, T&GM revenuesdecreased by 6% YoY. Net profits were down by28% reflecting the impact of the allocation ofGeneral Provisions as per CB UAE’s guidance toprovide 1.50% of total CRWA
• 92% of FGB’s investment portfolio is invested ininvestment grade fixed income bonds, of which62% is allocated to GCC.
• The average duration of the AFS portfolio whichrepresents 79.1% of the total portfolio is 3.05years.
• 53% of the Fixed Income portfolio is rated A- &above, 38% is rated between BBB+ & BBB-, theremaining 8% is non-rated/sub–investmentgrade.
• The WARF of the Fixed Income portfolio is BBB
Africa3%
Asia15%
Australia0%
Europe15%MENA
20%
NorthAmerica
3%
SouthAmerica
0%
UAE44%
Bonds93%
Funds0%
Equities0%
PrivateEquity
7%

31/46
245350
618 373
Dec'14 Dec'15
Dubai First Aseel
3856
258
FY'14 FY'15
81113
44
54
FY'14 FY'15Dubai First Aseel
125
260 365
667 406
Dec'14 Dec'15
Dubai First Aseel
Consumer Finance SubsidiariesDubai First and Aseel Islamic Finance
OPERATING INCOME¹ (USD MN)• Dubai First and Aseel are FGB’s consumer
finance subsidiaries specialised in credit cardsand SME islamic financing respectively
• Both companies generated combinedrevenues of USD 167Mn, up 34% YoY,contributing 6% to FY’15 Group revenue
• Dubai First continued to perform stronglyrecording a 48% YoY increase in net profits
• Aseel continued its transition to an islamicbusiness finance company during 2015. As aresult, net profits were limited to USD 8Mnagainst USD 25Mn in FY’14.
TOTAL LOANS (USD MN)TOTAL ASSETS (USD MN)
HIGHLIGHTS NET PROFITS (USD MN)
-17%
+34% +2% 6463
927771
863723-16%
167
¹Net of retail direct expenses
32/46
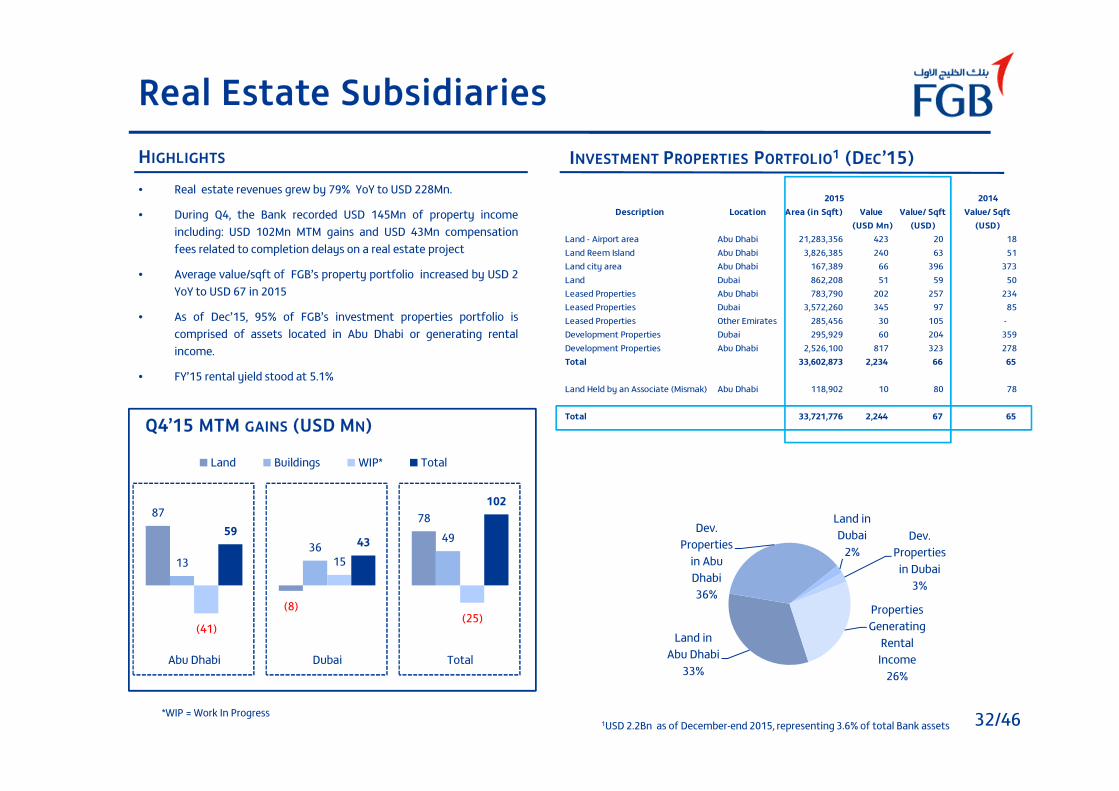
2014Description Location Area (in Sqft) Value
(USD Mn)Value/ Sqft
(USD)Value/ Sqft
(USD)Land - Airport area Abu Dhabi 21,283,356 423 20 18Land Reem Island Abu Dhabi 3,826,385 240 63 51Land city area Abu Dhabi 167,389 66 396 373Land Dubai 862,208 51 59 50Leased Properties Abu Dhabi 783,790 202 257 234Leased Properties Dubai 3,572,260 345 97 85Leased Properties Other Emirates 285,456 30 105 -Development Properties Dubai 295,929 60 204 359Development Properties Abu Dhabi 2,526,100 817 323 278Total 33,602,873 2,234 66 65
Land Held by an Associate (Mismak) Abu Dhabi 118,902 10 80 78
Total 33,721,776 2,244 67 65
2015
Real Estate Subsidiaries
• Real estate revenues grew by 79% YoY to USD 228Mn.
• During Q4, the Bank recorded USD 145Mn of property incomeincluding: USD 102Mn MTM gains and USD 43Mn compensationfees related to completion delays on a real estate project
• Average value/sqft of FGB’s property portfolio increased by USD 2YoY to USD 67 in 2015
• As of Dec’15, 95% of FGB’s investment properties portfolio iscomprised of assets located in Abu Dhabi or generating rentalincome.
• FY’15 rental yield stood at 5.1%
INVESTMENT PROPERTIES PORTFOLIO1 (DEC’15)HIGHLIGHTS
Q4’15 MTM GAINS (USD MN)
1USD 2.2Bn as of December-end 2015, representing 3.6% of total Bank assets*WIP = Work In Progress
87
(8)
78
1336
49
(41)
15
(25)
5943
102
Abu Dhabi Dubai Total
Land Buildings WIP* Total
Land inAbu Dhabi
33%
Dev.Properties
in AbuDhabi36%
Land inDubai
2%Dev.
Propertiesin Dubai
3%
PropertiesGenerating
RentalIncome
26%

33/46
Dividend History
2015 2014 2013 2012 2011
NET PROFIT (USD MN) 1,635 1,540 1,300 1,131 1,009
CASH DIVIDEND (USD MN) 1,225 1,062 817 681 408
CASH DIVIDEND (% OF CAPITAL) 100% 100% 100% 83% 100%
BONUS SHARES (% OF CAPITAL) - 15.38% 30% - 100%
DIVIDEND PAYOUT RATIO(% OF NET PROFIT) 75% 69% 63% 60% 40%
BASEL II CAPITAL ADEQUACYAFTER DIVIDEND DISTRIBUTION1 17.5% 17.5% 17.4% 18.7% 18.0%
1 CAR adjusted from Tier 2 MoF Loan of USD 1.2Bn repaid in 2013

34/46
FGB Overview
GLOBAL FOOTPRINT
1 Subsidiary4 Rep Offices
21 branches in the UAEand 2 branches overseas
Doha
Singapore
Mumbai
Hong KongFGB-Libya
Tripoli
UAE
Incorporated in 1979 and headquartered in Abu Dhabi
Wide range of financial products and services offeredthrough a network of 21 branches in the UAE. In addition,FGB is present through branches in Doha and Singapore,and rep offices in Mumbai, Hong Kong, Seoul and London.The Bank also has a JV in Libya.
1,436 employees
Listed in 2002; Market cap of USD 15.5Bn as of December31st, 2015
A LEADING UAE FRANCHISE OWNERSHIP STRUCTURE* (AS OF DEC’15)
Seoul
London
* FGB’s Foreign Ownership Limit (FOL) is at 25%
UAE companiesand individuals
87.2%Foreign
Investors10.8%
GCC (ex-UAE)2.0%
RATINGS
RATING OUTLOOK
A+(Since 2007) Stable
A2(Since 2007)
Stable
A(Since Feb’16) Stable

35/46
1996-1999
History & Key Milestones
1979 FGB is incorporated in Ajman with an initial focus on Corporate Banking
Abu Dhabi ruling family acquires 45% stake and designates new management team
2001 New vision, brand identity and introduction of new business segments: Retail and Treasury & Investments
2002 Listing on Abu Dhabi Exchange
2005 Net profit crosses the USD 272 Mn mark
2006 Introduction of Islamic banking servicesRated A by Fitch (followed by A+ in 2007) and A2 by Moody’s
2007 First overseas office in Singapore
2011 Net profit crossed the USD 1Bn mark
2013 Acquisition of Aseel and Dubai FirstFGB becomes the #1 UAE Bank in termsof net profit with USD 1.3Bn
2009 New offices in Qatar and India
2012 New office in Hong Kong
New rep offices in London and SeoulMaintained position of #1 UAE Bank by
Net Profit at USD 1.54Bn2014
2015 Net profit crosses USD 1.6Bn

36/46
1,0091,131
1,300
1,5401,635
2011 2012 2013 2014 2015
1,7231,941
2,2382,441
2,568
2011 2012 2013 2014 2015
7.38.0
8.59.3
9.8
2011 2012 2013 2014 2015
28.232.5
37.6 38.5 38.8
2011 2012 2013 2014 2015
28.5 30.534.6
38.040.8
2011 2012 2013 2014 2015
42.948.2
53.162.2
61.9
2011 2012 2013 2014 2015
Key Achievements
TOTAL ASSETS (USD BN) LOANS & ADVANCES (USD BN) CUSTOMER DEPOSITS (USD BN)
SHAREHOLDERS’ EQUITY (USD BN) OPERATING INCOME (USD MN) NET PROFIT (USD MN)

37/46
Board of Directors
FGB Board Members are prominent stakeholders of the Abu Dhabi Business Community
H.H. SHEIKH TAHNOON BIN ZAYED AL NAHYAN – CHAIRMAN
CHAIRMAN OF AMIRI FLIGHT
CHAIRMAN OF ROYAL GROUP
AHMED ALIAL SAYEGH
VICE CHAIRMAN
CHAIRMAN OF ABU DHABIGLOBAL MARKET
MANAGING DIRECTOR OFDOLPHIN ENERGY
Board Member of:Etihad Airways
Abu Dhabi NationalInsurance Company
ABDULHAMIDMOHAMMED SAEED
BOARD MEMBER
FGB MANAGING DIRECTOR
Board Member of:Emirates Investment
AuthorityMubadala Development
Company
MOHAMMED SAIFAL SUWAIDI
BOARD MEMBER
DIRECTOR GENERAL OF ABUDHABI FUND FORDEVELOPMENT
Vice Chairman of the boardof Al Masraf (ARBIFT)
Chairman of Al Ain Farmsfor Livestock production
Board member of thecenter of food security
of Abu Dhabi

38/46
Corporate Governance
Board of Directors
ManagementCommittees
Wholesale Banking CreditCommittee
ComplianceCommittee
First Gulf Consumer CreditCommittee
HR SteeringCommittee
Asset Liability Committee
Real EstateCommittee
Investment Committee
IT SteeringCommittee
BoardCommittees
Executive Committee Risk & Compliance Management Committee
Remuneration & Nomination Committee Audit Committee
Enterprise RiskManagement
GroupHead of Risk Management & Compliance
Group CRO
Credit Risk Market Risk ALM Risk OperationalRisk
ComplianceRisk Basel / IFRSERM
Strong & Independent Governance framework covering all material risks across the Group
Executive Management Committee
Operational RiskCommittee

39/46
Key metrics for 76
banks (rated AA-
and above) across
36 countries
Metrics used by
rating agencies
for annual rating
reviews
FGB’s GCC peer
benchmarks
CBUAE regulatory
requirements
Metrics across Key Risk Categories
monitored on a monthly basis COMPREHENSIVE 3 TIERED STRUCTURE
Metrics @
FGB Group
Metrics @ BusinessGroup and Group Entity
level
Metrics for specific portfolios
within all businesses
Tier 1(Implemented)
Tier 2(Implemented)
Tier 2.5(To be launched)
Implemented comprehensive Risk Appetite Framework covering all businesses within FGBGroup facilitating business into acceptable Risk / Reward framework
ERM ComponentsRisk Appetite Framework

40/46
Impact
Current
Compliance
Lifecycle
FGBs Culture & Values
Support FGBs Growth Strategy
International Capabilities
Proactive Capabilities
Product Specialists
Compliance CultureChange
Scan
Target
Compliance
Lifecycle
CURRENT STATE LIFECYCLE TARGET STATE LIFECYCLESTRATEGIC ALIGNMENT
RegulatoryCompliance AML & Sanctions
ExtraterritorialRegulations
Current Compliance Framework
OtherRegulatory
Aspects
Current Compliance framework isin line with regional practices ®ulatory requirements.
Enhancements being undertakento align with global business andregulatory environment
Financial Crimes RegulatoryCompliance
Global Markets &Int’l Regulations
New Compliance Framework
ConductCompliance
ERM ComponentsCompliance Framework
Carried out benchmarking of Group Compliance Framework - Enhancement Underway

41/46
Strategic Alignment with Business
HRSC
EMCO
WBCC
CBCC
ALCOIMCO
ORC
TSC
REC
CC
Mgmt
Committees
STRONGGOVERNANCE
Board of DirectorsBoD
CommitteesEC RCMC ACREMCO
Risk scorecards
Holistic Risk
Appetite
Compliance
guidance
Enhanced ALM
management
Advanced measures
for risk reward
analysis
Product
review
Comprehensive ERM
Policy framework
Strong IT /
IS controls
ERMPARTNERSHIP
KEY
CHALLENGES
Margin pressures
Large exposurerestrictions
Strong SMEcompetition
Compliance Issues
Real estatevolatility
New portfoliorisksLiquidity
regulations
Geopoliticalrisks
Emerging Marketconcerns
Trading controls Business modelalignment
Subsidiaries
WBG CBG
TGM
CUSTOMER
Robust limit
structure
42/46
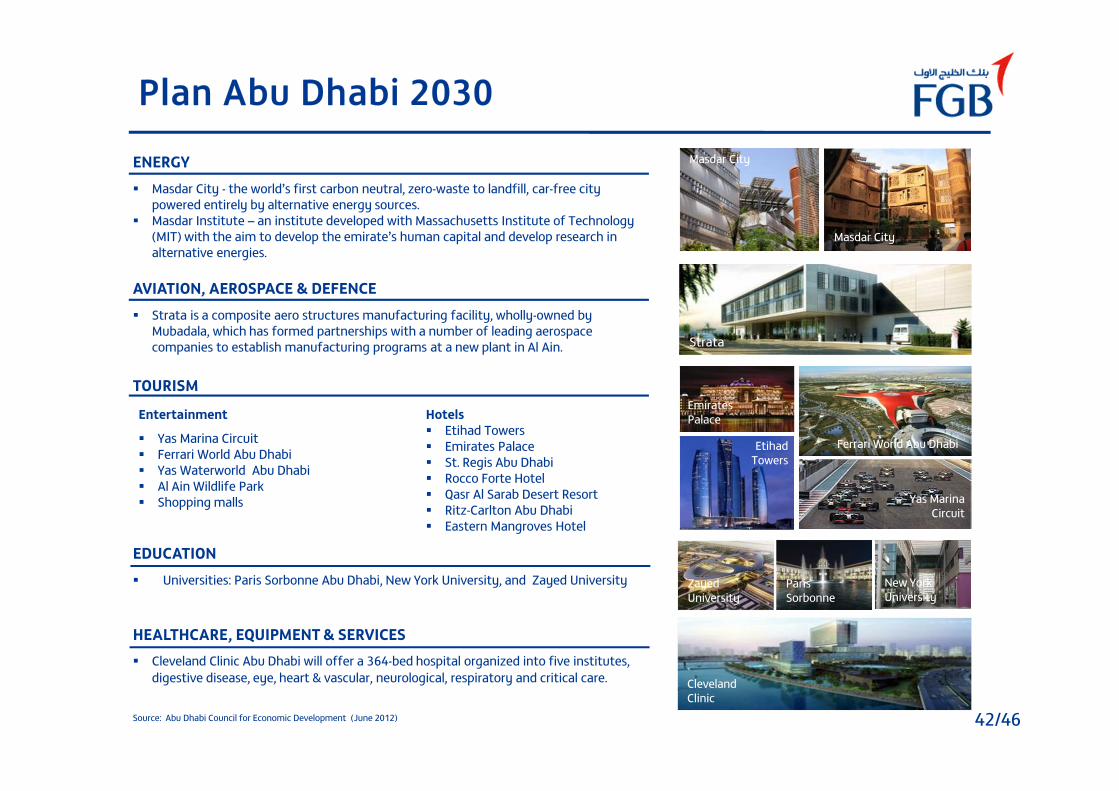
Plan Abu Dhabi 2030
Strata
ClevelandClinic
ParisSorbonne
ZayedUniversity
New YorkUniversity
Masdar City
Masdar City
Ferrari World Abu Dhabi
EmiratesPalace
EtihadTowers
Yas MarinaCircuit
ENERGY Masdar City - the world’s first carbon neutral, zero-waste to landfill, car-free city
powered entirely by alternative energy sources. Masdar Institute – an institute developed with Massachusetts Institute of Technology
(MIT) with the aim to develop the emirate’s human capital and develop research inalternative energies.
TOURISM
Hotels Etihad Towers Emirates Palace St. Regis Abu Dhabi Rocco Forte Hotel Qasr Al Sarab Desert Resort Ritz-Carlton Abu Dhabi Eastern Mangroves Hotel
Entertainment
Yas Marina Circuit Ferrari World Abu Dhabi Yas Waterworld Abu Dhabi Al Ain Wildlife Park Shopping malls
EDUCATION Universities: Paris Sorbonne Abu Dhabi, New York University, and Zayed University
AVIATION, AEROSPACE & DEFENCE Strata is a composite aero structures manufacturing facility, wholly-owned by
Mubadala, which has formed partnerships with a number of leading aerospacecompanies to establish manufacturing programs at a new plant in Al Ain.
HEALTHCARE, EQUIPMENT & SERVICES Cleveland Clinic Abu Dhabi will offer a 364-bed hospital organized into five institutes,
digestive disease, eye, heart & vascular, neurological, respiratory and critical care.
Source: Abu Dhabi Council for Economic Development (June 2012)

43/46
GDP Per Capita(3)Oil Production(2)LT Ratings (1)
(Moody’s, S&P, Fitch)
Abu Dhabi in the GCC context
Kuwait
Qatar
Saudi Arabia
Abu Dhabi
Bahrain
Oman
Aa2, AA, AA
Aa2, AA, AA
Aa3, A-, AA(-)
Aa2 , AA, AA
Baa3-(-), BB, BBB-
A1(-), BBB-, A
3.1mn bpd
2.0mn bpd
11.5mn bpd
0.4mn bpd
0.9mn bpd
USD 29,983
USD 78,829
USD 20,139
USD 23,899
USD 15,672
USD 74,927
1 Source: Bloomberg2 Source: BP Statistical Review of World Energy (June 2015), except Abu Dhabi (Opec statistical year book 2015)3 2015 forecasts - Source: October 2015 IMF data for all, except Abu Dhabi (Moody’s, Jan’15 report)Note: Unless otherwise indicated, all outlooks are stable; (-) Negative outlook
2.8mn bpd

44/46
Real Estate Trends – Q4‘15 Rental Clocks
ABU DHABI PRIME RENTAL CLOCK
DUBAI PRIME RENTAL CLOCK
Source: JLL The UAE Real Estate Market A Year In Review 2015* Hotel clock reflects the movement of RevPAR

45/46
Seven Banker Middle East UAE Product Awards: ‘Best Call Centre’, ‘Best Credit Card’, ‘Best PersonalLoan’, ‘Best Wealth Management Service/Proposition’, ‘Best Offshore Wealth Proposition’, ‘BestDeposit Account Product’ and ‘Best Bancassurance Product’
‘Most Innovative Service Provider’ - 2015 MENA IR Insurance Awards
The Banker 2015 Islamic Banker of the Year Awards – ‘Shariah-Compliant Window’
2015 Trade Finance Awards for Excellence: ‘Best Islamic Trade Finance Bank EMEA’
Asian Banker 2015 Middle East and Africa Country Awards: ‘Best Wealth Management in the MiddleEast Award’ and ‘Best Mortgage and Home Loan Product in the Middle East Award’
2015 Global Capital Bond Market Awards: ‘Most Impressive Middle East Borrower Award’
2015 Smart Card and Payments Middle East Awards: ‘Best Commercial Card Across Middle East’
Chartered Institute of Purchasing & Supply: ‘Best Procurement Start-up Function in the Middle East’
Interactive Media Awards: ‘Best in Class’ for FGB’s My FGB Card website; ‘Outstanding Achievement’for the FGB Wealth website
UAE Excellence Awards: ‘Golden Award for www.FGBWealth.com’
The Banker Middle East: “Best Bank in the UAE” and “Best Bank in the Middle East”
FGB 2015 Awards
45/46
46/46
Thank you!
For more Information:
Contact FGB Investor Relations Department: [email protected]
Visit our corporate website www.fgb.ae
Follow FGB on social media:
Or download FGB’s Investor Relations app: https://www.myirapp.com/fgb/