ffy 2016 part c state performance plan (spp)/annual ... coordinated schedule of training activities...
TRANSCRIPT

INPart C
FFY2016State Performance Plan /
Annual Performance Report
FFY 2016 Part C State Performance Plan (SPP)/Annual Performance Report (APR)
4/18/2018 Page 1 of 48

Introduction to the State Performance Plan (SPP)/Annual Performance Report (APR)
Attachments
Executive Summary:
File Name Uploaded By Uploaded Date Remove
icc chair signature ffy16.pdf Janet Ballard
General Supervision System:
The systems that are in place to ensure that IDEA Part C requirements are met, e.g., monitoring systems, dispute resolution systems.
The Indiana Part C, First Steps, APR for FFY2016 was developed by the Bureau of Child Development Services, Division of Disability andRehabilitative Services, Family and Social Services Administration (the lead agency for Part C) utilizing direction and input from a broadgroup of stakeholders.
Data for the indicators in the APR were provided from numerous sources. These included:
• the state centralized database (Social Services Data Warehouse)• claims data from the Central Reimbursement Office (CRO)• Quality Review-Focused Monitoring data, compiled from annual on-site Cluster reviews• SPOE self-reviews and Cluster Performance Plan Progress Reports/Quality Improvement Plans• Early Childhood Outcomes (ECO) Family Survey (parent exit interviews)• Child outcome data collected and analyzed by the Indiana Institute for Disability and Community (IIDC) at Indiana University
Indiana has a comprehensive general supervision system that includes the statewide data system, a statewide quality review-focusedmonitoring system, local quality review committees and an ongoing research initiative on program outcomes performed by the IndianaInstitute on Disability and Community (IIDC) at Indiana University. A description of each component is provided below.
1. Statewide Data System:
A data file is created for every child referred to the First Steps system. Data includes child/family/provider information (date of birth, referral, intake, evaluation, IFSP, termination with reason; child demographic data; andprovider information). Data for each cluster System Point of Entry (SPOE) can be reviewed at any time by state and/or the local cluster. This data is used by the state as a source for ongoing desk audits of the system.
2. The Data Warehouse:
The Data Warehouse (a state contracted entity that uses state provided data to develop 618 data and state profile reports) provides thestate with county, cluster and statewide data reports. These reports are used by the state and clusters to monitor trends over time. Theprofiles of the state and clusters are posted on the state website for public access. They can be viewed at http://www.in.gov/fssa/ddrs/2812.htm.
3. A Statewide Quality Review-focused Monitoring System:
The state First Steps System contracts with an entity to provide quality review coordination, on-site reviews and local technicalassistance. Indiana has nine cluster System Points of Entry (SPOEs) that serve as the local entity for referrals to Part C. Each of the ninecluster SPOEs receives technical assistance visits as needed and an annual verification visit. These visits are led by a Quality Reviewteam member responsible for the cluster. Additional team members include state staff, peers from other clusters, and providers. TheQuality Review plan was enhanced to review not only compliance measures, but several quality measures within local programs toassess possible program training needs and for local program improvement strategic planning purposes.
4. Local Quality Improvement Plans:
In addition to the annual verification visits, the SPOEs provide quarterly quality review reports and progress updates. SPOEs mustsubmit progress data to demonstrate compliance. The Quality Improvement Plan (QIP) serves as the cluster’s quality monitoring planand includes strategies to correct any findings issued by the State, as soon as possible, but no later than one year. The improvementplans incorporate an ongoing, collaborative program improvement approach which balances compliance monitoring with a targetedresults focus. Once the cluster SPOE has demonstrated compliance for a reporting period and the data are verified by the state, thefinding is verified as 'corrected' and the state issues a letter of compliance. As part of this process, SPOE quarterly data is shared withthe Local Planning and Coordinating Council and stakeholder input is gathered.
5. Ongoing Research Initiative on Program Outcomes:
FFY 2016 Part C State Performance Plan (SPP)/Annual Performance Report (APR)
4/18/2018 Page 2 of 48
Attachments
Attachments
Attachments
Indiana University is contracted for collecting child and family outcome data. In July 2014 a new, uniform collection tool/form wasimplemented for families' service providers to complete.
Quality Review-Focused Monitoring (QRFM) visits for FFY2016 were conducted in the months of October through December 2016, withfindings issued by the state to the SPOE in December of 2016, within 90 days of the completion of all visits. Each cluster SPOE receiveda findings table which listed all Federal and State indicators including noncompliance indicators requiring correction. The cluster SPOEswere directed to demonstrate 100% compliance for indicators 1, 7, and 8, along with other state identified areas of noncompliance(annual IFSPs completed prior to expiration, timely six month reviews, ten day written prior notice, income and insurance documentation)as soon as possible, but no later than one year from the date of the finding. For identified noncompliance that was not attributed to asystemic root cause, SPOEs continued monitoring and reporting efforts to report progress toward compliance. SPOEs were required toprovide periodic progress data and narrative updates to demonstrate compliance with the indicators at six months, nine months andeleven months from the date of the finding.
File Name Uploaded By Uploaded Date
No APR attachments found.
Technical Assistance System:
The mechanisms that the State has in place to ensure the timely delivery of high quality, evidenced based technical assistance and support to early intervention service (EIS)programs.
The State has contracted with the Early Childhood Center at Indiana University to implement a system to provide technical assistance tothe nine regional Cluster SPOEs. Indiana University has implemented an individualized, technical assistance approach designed tosupport the timely delivery of high quality early intervention services to eligible children and families in Indiana. Depending on regionalneeds, technical assistance can be provided on-site or through technology. Technical assistance is provided by trained staff, andfocuses on assisting SPOEs in the development of their Quality Improvement Plans (QIPs).
Technical assistance was given to service providers regarding the content and quality of home visiting documentation. Additionaltechnical assistance in the form of data analysis was provided throughout the year in response to requests from State staff, and astrends and patterns emerged.
File Name Uploaded By Uploaded Date
No APR attachments found.
Professional Development System:
The mechanisms the State has in place to ensure that service providers are effectively providing services that improve results for infants and toddlers with disabilities and theirfamilies.
Professional development opportunities established by the State First Steps Early Intervention System provided the following:
The statewide coordination of targeted training activities related to infants and toddlers and Indiana’s SSIP goalsGreater access to learning opportunities for service providersA coordinated schedule of training activities that balances regional face to face trainings, train the trainer activities, online modulesand webinarsSpecialized training opportunities bringing together professionals from different fields, including other home visiting programs, earlyeducation and child care service providers
File Name Uploaded By Uploaded Date
No APR attachments found.
Stakeholder Involvement: apply this to all Part C results indicators
The mechanism for soliciting broad stakeholder input on targets in the SPP, including revisions to targets.
Indiana used a broad group of stakeholders to assist in setting targets for the SPP.
These stakeholders included:
FFY 2016 Part C State Performance Plan (SPP)/Annual Performance Report (APR)
4/18/2018 Page 3 of 48

Attachments
Attachments
Indiana Interagency Coordinating Council (ICC) members, such as parents and representatives from Indiana state agencies, including:
Department of EducationOffice of Special EducationDepartment of HealthDivision of Family and ChildrenHead StartOffice of Medicaid Policy and Planning, etc.
Cluster Local Planning and Coordinating Councils (LPCCs) and Cluster System Points of Entry (SPOE)Service ProvidersCentral Reimbursement Office (CRO)Quality Review-Focused Monitoring Teams and state contractors for quality review, training and evaluation (Indiana Institute for Disability andCommunity at Indiana University)State staff from Family and Social Services Administration (FSSA), Bureau of Child Development Services (BCDS)
These groups provide a variety of feedback on state and SPOE data and procedures, as needed. These groups also assist the state inreviewing the data, identifying areas of concern and generating potential strategies for improvement.
ICC Stakeholder meetings were held quarterly in 2016 and 2017 to discuss the State Performance Plan (SPP) and Indiana’s progressin meeting the SPP targets. Data for the FFY2016 APR were presented to the ICC at its quarterly meeting in January 2018. On January10, 2018, the ICC completed its final review of the FFY2016 APR.
File Name Uploaded By Uploaded Date
No APR attachments found.
Reporting to the Public:
How and where the State reported to the public on the FFY 2015 performance of each EIS Program or Provider located in the State on the targets in the SPP/APR as soon aspracticable, but no later than 120 days following the State’s submission of its FFY 2015 APR, as required by 34 CFR §303.702(b)(1)(i)(A); and a description of where, on its Website, a complete copy of the State’s SPP, including any revision if the State has revised the SPP that it submitted with its FFY 2015 APR in 2017, is available.
Indiana has posted the State Performance Plan (SPP) for previous years FFY2005-2015. The Annual Performance Report (APR) for FFY2005-2015 along with OSEP letters of response to the State's December 2005 SPP and the FFY2005-2015 APRs are on the First Stepsweb site located at http://www.firststeps.in.gov under 'Program Policies & Updates' and then 'Program Evaluation Reports'. The IndianaAPR for FFY16 will be posted following the APR submission on February 1, 2018.
File Name Uploaded By Uploaded Date
No APR attachments found.
Actions required in FFY 2015 response
FFY 2016 Part C State Performance Plan (SPP)/Annual Performance Report (APR)
4/18/2018 Page 4 of 48

Indicator 1: Timely provision of services
Baseline Data: 2005
Monitoring Priority: Early Intervention Services In Natural Environments
Compliance indicator: Percent of infants and toddlers with Individual Family Service Plans (IFSPs) who receive the early intervention services on their IFSPs in a timely manner.
(20 U.S.C. 1416(a)(3)(A) and 1442)
Historical Data
FFY 2004 2005 2006 2007 2008 2009 2010 2011 2012 2013 2014
Target 100% 100% 100% 100% 100% 100% 100% 100% 100%
Data 91.00% 98.00% 98.00% 98.00% 98.50% 98.00% 99.00% 99.20% 98.30% 98.15%
FFY 2015
Target 100%
Data 97.87%
Key: Gray – Data Prior to Baseline Yellow – Baseline
FFY 2016 - FFY 2018 Targets
FFY 2016 2017 2018
Target 100% 100% 100%
FFY 2016 SPP/APR Data
Number of infants and toddlers with IFSPs whoreceive the early intervention services on their IFSPs in
a timely mannerTotal number of infants and toddlers with IFSPs
FFY 2015Data*
FFY 2016Target*
FFY 2016Data
1828 1968 97.87% 100% 95.68%
Reasons for Slippage
Throughout the state, provider availability was noted as to why child/family needs were not able to be met within the 30 day timeline.Specifically, Clusters F and I continue to have issues with enough providers to serve the families in their region. Both regions have manyrural counties they serve. Many times, it is difficult to get providers to serve those areas of the state.
Many times there is a breakdown of communication between the service coordinator and the provider agency/provider in receiving thereferral and having enough time to schedule with the family.
During this past year, Indiana began to see an increased number of referred children going on to IFSP development that has not beenseen in a few years.
Referrals are up 7% in first quarter of FFY16 compared to same quarter in FFY15IFSPs up 8% in first quarter of FFY16 compared to same quarter in FFY15FFY16 has seen an over 6% increase of children with IFSPs compared to FFY15Children being referred to Part C due to substance exposure has doubled in the past calendar yearProvider pool in state has remained fairly constant
During this year, the state office has reached out to Indiana's colleges and universities to discuss how graduates can enroll in theprogram to provide services to children/families in Indiana. They have also talked to state therapy associations about opportunities forlicensed therapists to enroll as a Part C provider.
As reasons for slippage present the state is engaging in continuous quality improvement to identify appropriate strategies to improve thesystem.
Number of documented delays attributable to exceptional family circumstancesThis number will be added to the "Number of infants and toddlers with IFSPs who receive their early intervention services on their IFSPs in a timely manner" field above tocalculate the numerator for this indicator.
55
Include your State’s criteria for “timely” receipt of early intervention services (i.e., the time period from parent consent to when IFSP services are actually initiated).
FFY 2016 Part C State Performance Plan (SPP)/Annual Performance Report (APR)
4/18/2018 Page 5 of 48
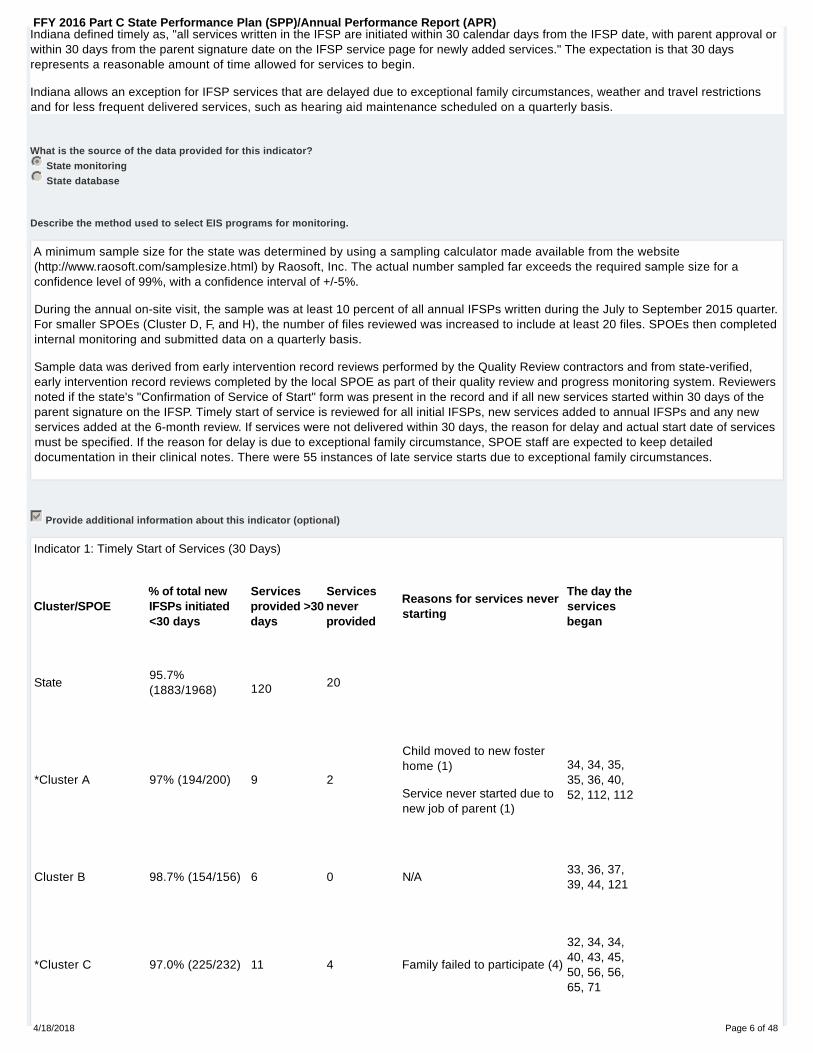
Indiana defined timely as, "all services written in the IFSP are initiated within 30 calendar days from the IFSP date, with parent approval orwithin 30 days from the parent signature date on the IFSP service page for newly added services." The expectation is that 30 daysrepresents a reasonable amount of time allowed for services to begin.
Indiana allows an exception for IFSP services that are delayed due to exceptional family circumstances, weather and travel restrictionsand for less frequent delivered services, such as hearing aid maintenance scheduled on a quarterly basis.
What is the source of the data provided for this indicator?
State monitoring
State database
Describe the method used to select EIS programs for monitoring.
A minimum sample size for the state was determined by using a sampling calculator made available from the website(http://www.raosoft.com/samplesize.html) by Raosoft, Inc. The actual number sampled far exceeds the required sample size for aconfidence level of 99%, with a confidence interval of +/-5%.
During the annual on-site visit, the sample was at least 10 percent of all annual IFSPs written during the July to September 2015 quarter.For smaller SPOEs (Cluster D, F, and H), the number of files reviewed was increased to include at least 20 files. SPOEs then completedinternal monitoring and submitted data on a quarterly basis.
Sample data was derived from early intervention record reviews performed by the Quality Review contractors and from state-verified,early intervention record reviews completed by the local SPOE as part of their quality review and progress monitoring system. Reviewersnoted if the state's "Confirmation of Service of Start" form was present in the record and if all new services started within 30 days of theparent signature on the IFSP. Timely start of service is reviewed for all initial IFSPs, new services added to annual IFSPs and any newservices added at the 6-month review. If services were not delivered within 30 days, the reason for delay and actual start date of servicesmust be specified. If the reason for delay is due to exceptional family circumstance, SPOE staff are expected to keep detaileddocumentation in their clinical notes. There were 55 instances of late service starts due to exceptional family circumstances.
Provide additional information about this indicator (optional)
Indicator 1: Timely Start of Services (30 Days)
Cluster/SPOE% of total newIFSPs initiated<30 days
Servicesprovided >30days
Servicesneverprovided
Reasons for services neverstarting
The day theservicesbegan
State95.7%(1883/1968) 120 20
*Cluster A 97% (194/200) 9 2
Child moved to new fosterhome (1)
Service never started due tonew job of parent (1)
34, 34, 35,35, 36, 40,52, 112, 112
Cluster B 98.7% (154/156) 6 0 N/A33, 36, 37,39, 44, 121
*Cluster C 97.0% (225/232) 11 4 Family failed to participate (4)
32, 34, 34,40, 43, 45,50, 56, 56,65, 71
FFY 2016 Part C State Performance Plan (SPP)/Annual Performance Report (APR)
4/18/2018 Page 6 of 48

*Cluster D 99.1% (220/222) 10 1 Family moved out of state (1)
31, 34, 35,35, 36, 37,42, 42, 56,60
*Cluster F 82.9% (87/105) 19 2 Provider availability (2)
35, 35, 36,36, 36, 36,36, 38, 39,43, 44, 44,44, 54, 58,77, 78, 79,107
*Cluster G 95.2% (415/436) 25 4
Family failed to participate (2)
Family changed mind beforeservice could start (2)
31, 31, 31,31, 32, 32,32, 32, 33,33, 34, 35,35, 36, 36,36, 37, 37,41, 42, 44,48, 56, 58,110
*Cluster H 97.2% (206/212) 10 2
SC clerical error (1)
Family conflict withscheduling/decided to notstart service (1)
31, 36, 37,38, 41, 41,41, 42, 53,58
*Cluster I 86.0% (135/157) 26 5
Family moved (1)
Family conflict withscheduling/ family changedmind and decide not to startservice (3)
Family failed to participate (1)
31, 31, 31,31, 31, 32,32, 33, 34,34, 34, 35,35, 36, 38,39, 41, 41,42, 43, 45,45, 57, 65,69, 103
Cluster J 99.6% (247/248) 4 0 N/A34, 36, 41,48
EFC are included in the numerator of the % of the total new IFSP services initiated within 30 days.
During FFY16, seven of the nine clusters (*) were issued a findings of non-compliance.
FFY 2016 Part C State Performance Plan (SPP)/Annual Performance Report (APR)
4/18/2018 Page 7 of 48
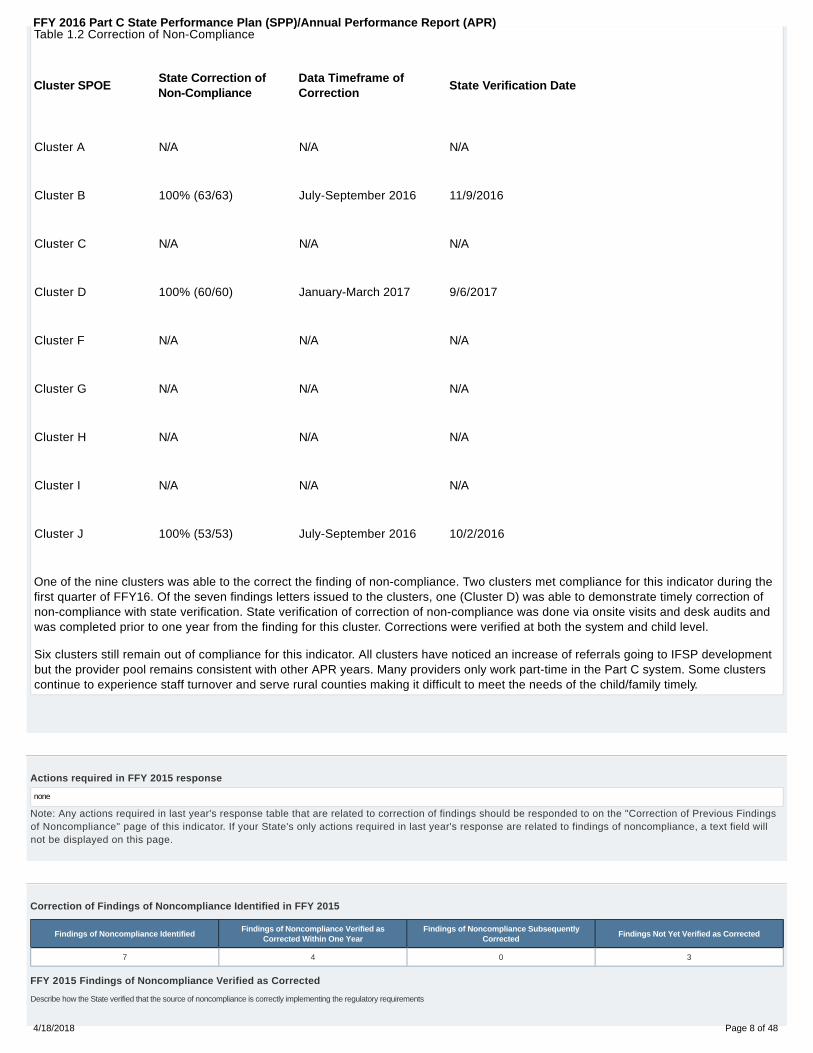
Table 1.2 Correction of Non-Compliance
Cluster SPOEState Correction ofNon-Compliance
Data Timeframe ofCorrection
State Verification Date
Cluster A N/A N/A N/A
Cluster B 100% (63/63) July-September 2016 11/9/2016
Cluster C N/A N/A N/A
Cluster D 100% (60/60) January-March 2017 9/6/2017
Cluster F N/A N/A N/A
Cluster G N/A N/A N/A
Cluster H N/A N/A N/A
Cluster I N/A N/A N/A
Cluster J 100% (53/53) July-September 2016 10/2/2016
One of the nine clusters was able to the correct the finding of non-compliance. Two clusters met compliance for this indicator during thefirst quarter of FFY16. Of the seven findings letters issued to the clusters, one (Cluster D) was able to demonstrate timely correction ofnon-compliance with state verification. State verification of correction of non-compliance was done via onsite visits and desk audits andwas completed prior to one year from the finding for this cluster. Corrections were verified at both the system and child level.
Six clusters still remain out of compliance for this indicator. All clusters have noticed an increase of referrals going to IFSP developmentbut the provider pool remains consistent with other APR years. Many providers only work part-time in the Part C system. Some clusterscontinue to experience staff turnover and serve rural counties making it difficult to meet the needs of the child/family timely.
Actions required in FFY 2015 response
none
Note: Any actions required in last year's response table that are related to correction of findings should be responded to on the "Correction of Previous Findingsof Noncompliance" page of this indicator. If your State's only actions required in last year's response are related to findings of noncompliance, a text field willnot be displayed on this page.
Correction of Findings of Noncompliance Identified in FFY 2015
Findings of Noncompliance IdentifiedFindings of Noncompliance Verified as
Corrected Within One YearFindings of Noncompliance Subsequently
CorrectedFindings Not Yet Verified as Corrected
7 4 0 3
FFY 2015 Findings of Noncompliance Verified as Corrected
Describe how the State verified that the source of noncompliance is correctly implementing the regulatory requirements
FFY 2016 Part C State Performance Plan (SPP)/Annual Performance Report (APR)
4/18/2018 Page 8 of 48

Seven clusters received a finding of non-compliance and four clusters was able to correct non-compliance within the one year timelineafter identification. Cluster A, C, and G still remain out of compliance for this indicator.
Cluster/SPOE
Analysis of Subsequent data
State Correction ofNon-Compliance Data
Data Timeframe State Verification Date
Cluster A N/A N/A N/A
Cluster B 100% (37/37) October-December 2015 6/14/2016
Cluster C N/A N/A N/A
Cluster G N/A N/A N/A
Cluster H 100% (40/40) October-December 2015 6/27/2016
Cluster I 100% (38/38) January-March 2016 6/29/2016
Cluster J 100% (42/42) October-December 2015 6/24/2016
In accordance with the OSEP Memorandum 09-02, the state issued 7 findings for Indicator 1. Indiana was able to demonstrate timelycorrection of non-compliance with state verification for Clusters B, D, F, H, I, and J.
The correction of non-compliance was verified by the collection and analysis of subsequent data during additional onsite visits, whichinclude onsite file audits and data reviews. We looked at subsequent data to ensure that all findings of noncompliance were corrected.Corrections were verified at both the system and the child level. Reasons for non-compliance were reviewed by each SPOE lead agency.While the lead agency did not find any systemic errors, it was noted that in most individual instances the delays were attributed to eithera lack of communication on the Service Coordinator's part, lack of communication between the provider and family, or schedulingdifficulty between the family and provider.
Describe how the State verified that each individual case of noncompliance was corrected
In accordance with the OSEP Memorandum 09-02 the level of compliance (actual target data) the State reported in FFY15 for indicator 1was 97.9% (3218/3288). As reported in the FFY15 APR, seven clusters (A, B, C, G, H, I, and J) were found to be out of compliance forTimely Start of Services. Indiana was able to demonstrate timely correction of noncompliance with state verification for four clusters.
Verification of correction of non-compliance was completed prior to one year from the finding. The lead agency reviewed each individual case to ensure services wereimplemented via an onsite monitoring.
The FFY2015 APR reported that in the 70 individual child instances where services were not provided timely, 70 children did receive theservices, albeit not within 30 days. In the FFY2015 APR, it was reported that 23 children never received services. In some cases, thefamily failed to participate, the child was withdrawn by the family, or the family moved out of state. The SPOE mailed a letter to thefamilies giving 10-day notice of the file closure.
FFY 2015 Findings Not Yet Verified as Corrected
Actions taken if noncompliance not corrected
The state takes specific actions to assist clusters when they do not reach compliance. Depending on regional clusters' needs, technicalassistance can be provided on-site or electronically. Technical assistance is provided by trained staff and focuses on assisting regionalclusters in the development of Quality Improvement Plans (QIPs) by facilitating stakeholder involvement through attendance at local andstate meetings, providing training and detailed examples of high quality, evidence-based plans, and providing detailed feedback on draftplans. Technical assistance is also provided to service providers regarding the content and quality of home visit documentation.Additional technical assistance in the form of data analysis is provided throughout the year in response to requests from State staff astrends and patterns emerge. State staff also provides direct technical assistance to local programs through ongoing contract monitoringactivities and periodic data reviews.
Cluster A, C, and G still remain out of compliance for this indicator. Cluster A and C serve some rural as well as highly populated areas of the state. Retaining providers in these areas has been challenging. Cluster G servesabout 30-33 percent of the state's early intervention population which can make it challenging to meet the needs of all the families. High cluster staff turnover rates have also contributed to the challenges of meeting familyneeds timely. Cluster A, C, and G, in collaboration with state staff and the QR team continue to explore ways to address these issues.
FFY 2016 Part C State Performance Plan (SPP)/Annual Performance Report (APR)
4/18/2018 Page 9 of 48
Indicator 2: Services in Natural Environments
Baseline Data: 2005
Monitoring Priority: Early Intervention Services In Natural Environments
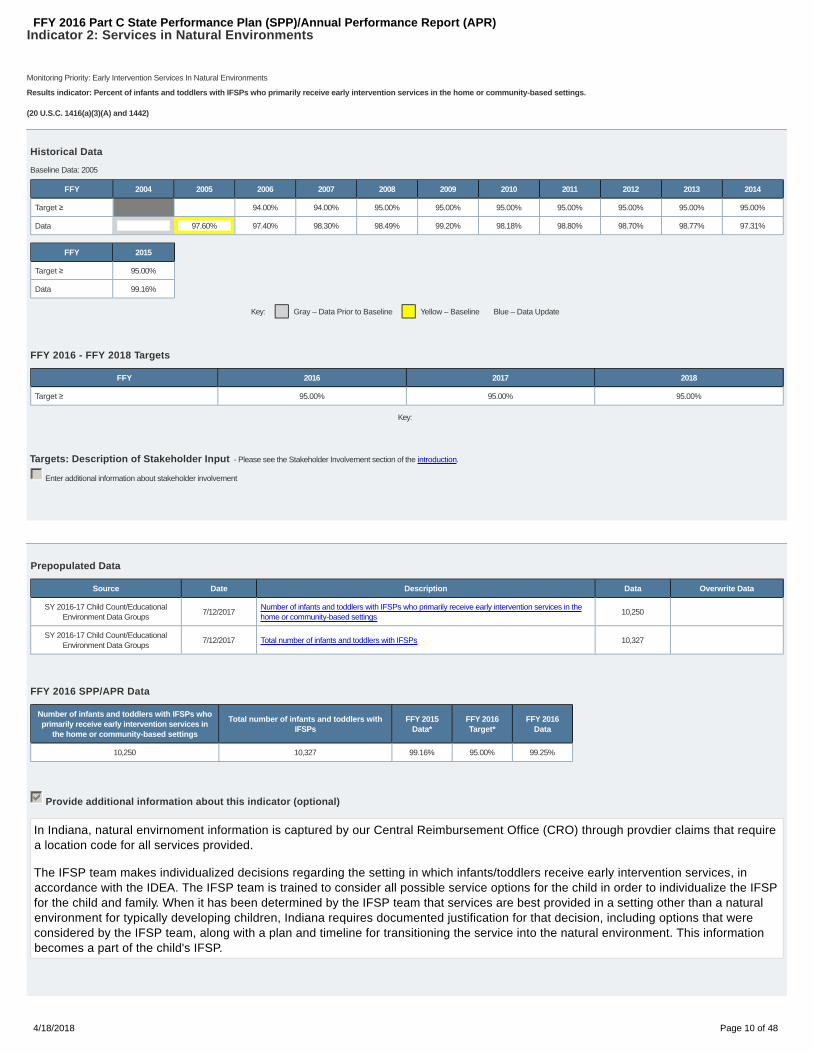
Results indicator: Percent of infants and toddlers with IFSPs who primarily receive early intervention services in the home or community-based settings.
(20 U.S.C. 1416(a)(3)(A) and 1442)
Historical Data
FFY 2004 2005 2006 2007 2008 2009 2010 2011 2012 2013 2014
Target ≥ 94.00% 94.00% 95.00% 95.00% 95.00% 95.00% 95.00% 95.00% 95.00%
Data 97.60% 97.40% 98.30% 98.49% 99.20% 98.18% 98.80% 98.70% 98.77% 97.31%
FFY 2015
Target ≥ 95.00%
Data 99.16%
Key: Gray – Data Prior to Baseline Yellow – Baseline Blue – Data Update
FFY 2016 - FFY 2018 Targets
FFY 2016 2017 2018
Target ≥ 95.00% 95.00% 95.00%
Key:
Targets: Description of Stakeholder Input - Please see the Stakeholder Involvement section of the introduction.
Enter additional information about stakeholder involvement
Prepopulated Data
Source Date Description Data Overwrite Data
SY 2016-17 Child Count/EducationalEnvironment Data Groups
7/12/2017Number of infants and toddlers with IFSPs who primarily receive early intervention services in thehome or community-based settings
10,250
SY 2016-17 Child Count/EducationalEnvironment Data Groups
7/12/2017 Total number of infants and toddlers with IFSPs 10,327
FFY 2016 SPP/APR Data
Number of infants and toddlers with IFSPs whoprimarily receive early intervention services in
the home or community-based settings
Total number of infants and toddlers withIFSPs
FFY 2015Data*
FFY 2016Target*
FFY 2016Data
10,250 10,327 99.16% 95.00% 99.25%
Provide additional information about this indicator (optional)
In Indiana, natural envirnoment information is captured by our Central Reimbursement Office (CRO) through provdier claims that requirea location code for all services provided.
The IFSP team makes individualized decisions regarding the setting in which infants/toddlers receive early intervention services, inaccordance with the IDEA. The IFSP team is trained to consider all possible service options for the child in order to individualize the IFSPfor the child and family. When it has been determined by the IFSP team that services are best provided in a setting other than a naturalenvironment for typically developing children, Indiana requires documented justification for that decision, including options that wereconsidered by the IFSP team, along with a plan and timeline for transitioning the service into the natural environment. This informationbecomes a part of the child's IFSP.
FFY 2016 Part C State Performance Plan (SPP)/Annual Performance Report (APR)
4/18/2018 Page 10 of 48

Actions required in FFY 2015 response
none
FFY 2016 Part C State Performance Plan (SPP)/Annual Performance Report (APR)
4/18/2018 Page 11 of 48

Indicator 3: Early Childhood Outcomes
Monitoring Priority: Early Intervention Services In Natural Environments
Results indicator: Percent of infants and toddlers with IFSPs who demonstrate improved:
Positive social-emotional skills (including social relationships);A.Acquisition and use of knowledge and skills (including early language/ communication); andB.Use of appropriate behaviors to meet their needs.C.
(20 U.S.C. 1416(a)(3)(A) and 1442)
Does your State's Part C eligibility criteria include infants and toddlers who are at risk of having substantial developmental delays (or “at-risk infants and toddlers”) under IDEA section 632(5)(B)(i)? No
Historical Data
Baseline
YearFFY 2004 2005 2006 2007 2008 2009 2010 2011 2012 2013 2014
A1 2008Target ≥ 52.00% 53.00% 53.00% 53.00% 55.00% 55.00%
Data 51.70% 51.00% 49.00% 50.00% 52.00% 53.91% 53.88%
A2 2008Target ≥ 50.00% 51.00% 51.00% 51.00% 57.00% 57.00%
Data 49.90% 49.00% 47.00% 49.00% 54.00% 56.42% 61.08%
B1 2008Target ≥ 57.00% 58.00% 58.00% 58.00% 55.00% 55.00%
Data 56.30% 59.00% 59.00% 56.00% 55.00% 51.64% 51.37%
B2 2008Target ≥ 69.00% 70.00% 70.00% 70.00% 72.00% 72.00%
Data 68.50% 68.00% 68.00% 69.00% 72.00% 71.91% 73.54%
C1 2008Target ≥ 54.00% 55.00% 55.00% 55.00% 55.00% 55.00%
Data 53.80% 54.00% 52.00% 53.00% 50.00% 50.25% 49.56%
C2 2008Target ≥ 62.00% 63.00% 63.00% 63.00% 67.00% 67.00%
Data 61.70% 59.00% 58.00% 63.00% 66.00% 66.55% 67.71%
FFY 2015
A1Target ≥ 55.00%
Data 55.88%
A2Target ≥ 57.00%
Data 62.67%
B1Target ≥ 56.00%
Data 58.10%
B2Target ≥ 72.00%
Data 76.20%
C1Target ≥ 55.00%
Data 49.94%
C2Target ≥ 67.00%
Data 68.16%
Key: Gray – Data Prior to Baseline Yellow – Baseline Blue – Data Update
FFY 2016 - FFY 2018 Targets
FFY 2016 2017 2018
Target A1 ≥ 55.00% 55.00% 55.00%
Target A2 ≥ 57.00% 57.00% 57.00%
Target B1 ≥ 56.00% 56.00% 57.00%
Target B2 ≥ 72.00% 72.00% 72.00%
Target C1 ≥ 55.00% 55.00% 55.00%
Target C2 ≥ 67.00% 67.00% 67.00%
Key:
Targets: Description of Stakeholder Input - Please see the Stakeholder Involvement section of the introduction.
Enter additional information about stakeholder involvement
FFY 2016 Part C State Performance Plan (SPP)/Annual Performance Report (APR)
4/18/2018 Page 12 of 48

FFY 2016 SPP/APR Data
Number of infants and toddlers with IFSPs assessed 7140.00
Outcome A: Positive social-emotional skills (including social relationships)
Number ofChildren
Percentage ofChildren
a. Infants and toddlers who did not improve functioning 61.00 0.85%
b. Infants and toddlers who improved functioning but not sufficient to move nearer to functioning comparable to same-aged peers 2438.00 34.15%
c. Infants and toddlers who improved functioning to a level nearer to same-aged peers but did not reach it 279.00 3.91%
d. Infants and toddlers who improved functioning to reach a level comparable to same-aged peers 2603.00 36.46%
e. Infants and toddlers who maintained functioning at a level comparable to same-aged peers 1759.00 24.64%
Numerator DenominatorFFY 2015
Data*FFY 2016Target*
FFY 2016Data
A1. Of those children who entered or exited the program below ageexpectations in Outcome A, the percent who substantially increased
their rate of growth by the time they turned 3 years of age or exited theprogram (c+d)/(a+b+c+d).
2882.00 5381.00 55.88% 55.00% 53.56%
A2. The percent of infants and toddlers who were functioning withinage expectations in Outcome A by the time they turned 3 years of age
or exited the program (d+e)/(a+b+c+d+e).4362.00 7140.00 62.67% 57.00% 61.09%
Reasons for A1 Slippage
In evaluating the slippage that occurred for Outcome A.1 , it was noted that the measurement and associated procedures did not changefrom FFY15, however it was necessary for ongoing providers to become more actively engaged in additional training and technicalassistance. A more formal training was developed but was not made available state wide until the second quarter of FFY17. We hope tosee an increase in our percent of infants and toddlers exiting the Part C program who substantially increased their rate of growth by thetime they turn 3 years of age or exited the program next APR.
Outcome B. Acquisition and use of knowledge and skills (including early language/ communication)
Number ofChildren
Percentage ofChildren
a. Infants and toddlers who did not improve functioning 44.00 0.62%
b. Infants and toddlers who improved functioning but not sufficient to move nearer to functioning comparable to same-aged peers 1431.00 20.04%
c. Infants and toddlers who improved functioning to a level nearer to same-aged peers but did not reach it 346.00 4.85%
d. Infants and toddlers who improved functioning to reach a level comparable to same-aged peers 1465.00 20.52%
e. Infants and toddlers who maintained functioning at a level comparable to same-aged peers 3854.00 53.98%
Numerator DenominatorFFY 2015
Data*FFY 2016Target*
FFY 2016Data
B1. Of those children who entered or exited the program below ageexpectations in Outcome B, the percent who substantially increased
their rate of growth by the time they turned 3 years of age or exited theprogram (c+d)/(a+b+c+d).
1811.00 3286.00 58.10% 56.00% 55.11%
B2. The percent of infants and toddlers who were functioning withinage expectations in Outcome B by the time they turned 3 years of age
or exited the program (d+e)/(a+b+c+d+e).5319.00 7140.00 76.20% 72.00% 74.50%
Reasons for B1 Slippage
In evaluating the slippage that occurred for Outcome B.1 , it was noted that the measurement and associated procedures did not changefrom FFY15, however it was necessary for ongoing providers to become more actively engaged in additional training and technicalassistance. A more formal training was developed but was not made state wide until the second quarter of FFY17. We hope to see anincrease in our percent of infants and toddlers exiting the Part C program who substantially increased their rate of growth by the timethey turn 3 years pf age or exited the program. We hope to see an increase in the percentage of children making substantial progressduring the next APR.
Outcome C: Use of appropriate behaviors to meet their needs
Number ofChildren
Percentage ofChildren
FFY 2016 Part C State Performance Plan (SPP)/Annual Performance Report (APR)
4/18/2018 Page 13 of 48

Number ofChildren
Percentage ofChildren
a. Infants and toddlers who did not improve functioning 59.00 0.83%
b. Infants and toddlers who improved functioning but not sufficient to move nearer to functioning comparable to same-aged peers 2070.00 28.99%
c. Infants and toddlers who improved functioning to a level nearer to same-aged peers but did not reach it 258.00 3.61%
d. Infants and toddlers who improved functioning to reach a level comparable to same-aged peers 1880.00 26.33%
e. Infants and toddlers who maintained functioning at a level comparable to same-aged peers 2874.00 40.25%
Numerator DenominatorFFY 2015
Data*FFY 2016Target*
FFY 2016Data
C1. Of those children who entered or exited the program below ageexpectations in Outcome C, the percent who substantially increased
their rate of growth by the time they turned 3 years of age or exited theprogram (c+d)/(a+b+c+d).
2138.00 4267.00 49.94% 55.00% 50.11%
C2. The percent of infants and toddlers who were functioning withinage expectations in Outcome C by the time they turned 3 years of age
or exited the program (d+e)/(a+b+c+d+e).4754.00 7141.00 68.16% 67.00% 66.57%
Reasons for C2 Slippage
In evaluating the slippage that occurred for Outcome C.2, it was noted that the measurement and associated procedures did not changefrom FFY15, however it was necessary for ongoing providers to become more actively engage in additional training and technicalassistance. A more formal training was developed but was not made state wide until the second quarter of FFY17. We hope to see anincrease in our percent of infants and toddlers who were functioning within age expectations in this outcome by the time they turn 3 yearspf age or exited the program. We hope to see an increase in the percentage of children making substantial progress during the nextAPR.
The number of infants and toddlers who did not receive early intervention services for at least six months before exiting the Part C program
The number of infants and toddlers who exited the Part C program during the reporting period, as reported in the State’s part C exiting 618 data
The number of those infants and toddlers who did not receive early intervention services for at least six months before exiting the Part C program. 2600
Please note that this data about the number of infants and toddlers who did not receive early intervention services for at least six months before exiting the Part C program is optional in this FFY16 submission. It will be requiredin the FFY17 submission.
Was sampling used? No
Did you use the Early Childhood Outcomes Center (ECO) Child Outcomes Summary (COS) process? No
Provide the criteria for defining “comparable to same-aged peers.
Indiana's Part C program employs the Assessment, Evaluation, and Program System for Infants and Children (AEPS) to determine children's eligibility and developmental status in relation to 'same-aged peers.' At exit, thechild's ongoing service providers compile progress data on AEPS skills using a checklist and provide this data to an Assessment Team member for final scoring on the AEPS. The Assessment Team uses the checklist todetermine scoring of the AEPS. Only Assessment Team members with extensive training on the AEPS may compute final scores in the form of standard deviations below the mean (0, -1.-, -1.5, and -2.0). If a child shows nodevelopmental delays on the AEPS (zero or no standard deviations), then the child's status is defined as 'comparable to same-aged peers.'
List the instruments and procedures used to gather data for this indicator.
Indiana's Part C program employs the Assessment, Evaluation, and Program System for Infants and Children (AEPS) to determinechildren's eligibility and developmental status in relation to 'same-aged peers.' The AEPS is administered by a multidisciplinaryAssessment Team at entrance into Part C to determine eligibility and initial developmental status; at exit, the child's ongoing serviceproviders compile progress data on AEPS skills and provide this data to an Assessment Team member for final scoring on the AEPS. InFFY2014, a new instrument and procedure was used to increase the quality and accuracy of exit assessments. The state developed astandard data collection tool for recording children's progress upon exit. All ongoing service providers are asked to complete this ExitSkills Checklist within the child's final month of service. The Assessment Team uses this checklist to determine scoring of the AEPS.Only Assessment Team members with extensive training on the AEPS may compute final scores in the form of standard deviationsbelow the mean (0, -1.-, -1.5, and -2.0). If a child shows no developmental delays on the AEPS (zero or no standard deviations), then thechild's status is defined as 'comparable to same-aged peers.' This instrument and procedures are still in place for FFY16. Threedomains of the AEPS are associated with each of the three federal outcomes:
Outcome 1 - Social/Emotional domain
Outcome 2- Cognitive domain
Outcome 3- Adaptive domain
Provide additional information about this indicator (optional)
Indiana has uploaded two attachments that show the state data disaggregated by race, gender, income and by state region. Please see
FFY 2016 Part C State Performance Plan (SPP)/Annual Performance Report (APR)
4/18/2018 Page 14 of 48

attachements.
Actions required in FFY 2015 response
none
FFY 2016 Part C State Performance Plan (SPP)/Annual Performance Report (APR)
4/18/2018 Page 15 of 48

Indicator 4: Family Involvement
Monitoring Priority: Early Intervention Services In Natural Environments
Results indicator: Percent of families participating in Part C who report that early intervention services have helped the family:
Know their rights;A.Effectively communicate their children's needs; andB.Help their children develop and learn.C.
(20 U.S.C. 1416(a)(3)(A) and 1442)
Historical Data
Baseline
YearFFY 2004 2005 2006 2007 2008 2009 2010 2011 2012 2013 2014
A 2004Target ≥ 99.00% 99.00% 99.00% 99.00% 100% 99.00% 99.00% 99.00% 97.00% 97.00%
Data 99.90% 96.50% 94.00% 95.60% 96.30% 96.10% 95.10% 96.88% 96.44% 96.54%
B 2004Target ≥ 99.00% 99.00% 99.00% 99.00% 100% 99.00% 99.00% 99.00% 97.00% 97.00%
Data 99.90% 98.70% 98.40% 98.70% 98.90% 98.90% 95.30% 96.17% 96.22% 96.29%
C 2004Target ≥ 99.00% 99.00% 99.00% 99.00% 100% 97.00% 97.00% 97.00% 95.00% 95.00%
Data 95.50% 94.00% 93.80% 94.80% 95.30% 95.80% 93.80% 95.28% 94.22% 94.75%
FFY 2015
ATarget ≥ 97.00%
Data 96.62%
BTarget ≥ 97.00%
Data 95.96%
CTarget ≥ 96.00%
Data 94.57%
Key: Gray – Data Prior to Baseline Yellow – Baseline Blue – Data Update
FFY 2016 - FFY 2018 Targets
FFY 2016 2017 2018
Target A ≥ 98.00% 99.00% 100%
Target B ≥ 98.00% 99.00% 100%
Target C ≥ 96.00% 96.00% 96.00%
Key:
Targets: Description of Stakeholder Input - Please see the Stakeholder Involvement section of the introduction.
Enter additional information about stakeholder involvement
FFY 2016 SPP/APR Data
Number of families to whom surveys were distributed 7258.00
Number of respondent families participating in Part C 72.00% 5226.00
A1. Number of respondent families participating in Part C who report that early intervention services have helped the family know their rights 5061.00
A2. Number of responses to the question of whether early intervention services have helped the family know their rights 5226.00
B1. Number of respondent families participating in Part C who report that early intervention services have helped the family effectively communicate their children's needs 5055.00
B2. Number of responses to the question of whether early intervention services have helped the family effectively communicate their children's needs 5226.00
C1. Number of respondent families participating in Part C who report that early intervention services have helped the family help their children develop and learn 4954.00
C2. Number of responses to the question of whether early intervention services have helped the family help their children develop and learn 5226.00
FFY 2015Data*
FFY 2016Target*
FFY 2016Data
A. Percent of families participating in Part C who report that early intervention services have helped the family know their 96.62% 98.00% 96.84%
FFY 2016 Part C State Performance Plan (SPP)/Annual Performance Report (APR)
4/18/2018 Page 16 of 48

FFY 2015Data*
FFY 2016Target*
FFY 2016 Data
rights
B. Percent of families participating in Part C who report that early intervention services have helped the family effectivelycommunicate their children's needs
95.96% 98.00% 96.73%
C. Percent of families participating in Part C who report that early intervention services have helped the family help theirchildren develop and learn
94.57% 96.00% 94.80%
Was sampling used? No
Was a collection tool used? Yes
Is it a new or revised collection tool? No
Include the State’s analysis of the extent to which the demographics of the families responding are representative of the demographics of infants,toddlers, and families enrolled in the Part C program.
Service Coordinators throughout the state are expected to request all families exiting the First Steps system to complete an exit surveythat is based on the questions/form provided by the ECO Center. These requests to complete the paper/pencil survey are made up to 3months prior to the child and family’s exit from First Steps. For FFY2016, 5,226 families completed the entire survey. This represents72% of all families (N=7258) who exited First Steps and were in the program for a minimum of 6 months.
All service coordinators receive training on how to present the family survey and the associated collection methods and requiredreporting components.
Indiana has continued to carry out additional efforts designed to increase the percentage of families completing the exit survey. Individualregional offices continue to identify improvement efforts to increase the percentage of families completing the exit survey. Each regionaloffice is responsible for providing quarterly data and noting ongoing efforts to ensure completion and accuracy of the family survey data.The state will continue to evaluate ways to capture accurate family data when a family is leaving the system. The state will continue toreview and monitor the results and coordinate with each of the regional offices to monitor their individual performance.
Demographics of the state were accurately reflected in the family exit interview for the full reporting period.
The demographics of the families responding are representative of the demographics of infants, toddlers, and families enrolled in the Part C program.Yes
Provide additional information about this indicator (optional)
See the attached files for dis-aggregated data and family sample for Family Outcomes.
Actions required in FFY 2015 response
none
FFY 2016 Part C State Performance Plan (SPP)/Annual Performance Report (APR)
4/18/2018 Page 17 of 48

Indicator 5: Child Find (Birth to One)
Monitoring Priority: Effective General Supervision Part C / Child Find
Results indicator: Percent of infants and toddlers birth to 1 with IFSPs compared to national data.
(20 U.S.C. 1416(a)(3)(B) and 1442)
FFY 2016 Part C State Performance Plan (SPP)/Annual Performance Report (APR)
4/18/2018 Page 18 of 48

Baseline Data: 2005
Historical Data
FFY 2004 2005 2006 2007 2008 2009 2010 2011 2012 2013 2014
Target ≥ 1.40% 1.40% 1.40% 1.40% 1.40% 1.40% 1.40% 1.56% 1.56%
Data 1.40% 1.39% 1.25% 1.25% 1.30% 1.38% 1.26% 1.40% 1.22% 1.27%
FFY 2015
Target ≥ 1.56%
Data 1.36%
Key: Gray – Data Prior to Baseline Yellow – Baseline Blue – Data Update
FFY 2016 - FFY 2018 Targets
FFY 2016 2017 2018
Target ≥ 1.57% 1.57% 1.57%
Key:
Targets: Description of Stakeholder Input
Indiana uses a broad group of stakeholders that look at services to infants under the age of one. They include:
Cluster Local Planning and Coordinating Councils (LPCCs) including associated child find subcommittees, local NICU,hospital and physician representatives
Cluster System Points of Entry (SPOE)
Service Providers
Assessment Team Providers
Community partners in local communities
Quality Review-Focused Monitoring Teams and state contractors for quality review, training and evaluation (Indiana Institutefor Disability and Community at Indiana University)
State staff from Family and Social Services Administration (FSSA), Bureau of Child Development Services (BCDS)
These groups provide a variety of feedback on state and cluster data and procedures as needed. This group assists the statein reviewing the data, identifying areas of concern and generating potential strategies for improvement. Specifically, each Cluster LPCCcontinues to meet at least quarterly within their regions, and are contractually required to review their local 0-1 child count data anddevelop specific child-find activities for this young population. Indiana generates quarterly profile reporting which highlights state,cluster, and county-level data specifically highlighting the child counts for children 0-1 year of age for stakeholder review and input. Theprofiles are available on Indiana's Part C page - Program Evaluation Information / Data Reports: http://www.in.gov/fssa/ddrs/2812.htm
Minutes from state and local meetings are posted on various state and cluster websites so those stakeholders that cannot attend ameeting have the information available to them to make additional comments. The target data set for this indicator were determinedby several discussions with the ICC and audience members composed of parents, System Points of Entry staff, and Service Providersover three consecutive ICC meetings (August 2014, November 2014, and January 2015).
The APR indicator for Birth to One continues to be a standing agenda item for ICC meetings in FFY15 as well as local LPCC meetings atthe cluster level. Issues and concerns are addressed as needed using the most current quarterly data available.
Prepopulated Data
Source Date Description Data Overwrite Data
FFY 2016 Part C State Performance Plan (SPP)/Annual Performance Report (APR)
4/18/2018 Page 19 of 48

Source Date Description Data Overwrite Data
SY 2016-17 Child Count/EducationalEnvironment Data Groups
7/12/2017 Number of infants and toddlers birth to 1 with IFSPs 1,172 null
U.S. Census Annual State ResidentPopulation Estimates April 1, 2010 to July
1, 20166/22/2017 Population of infants and toddlers birth to 1 83,679 null
TBD null
FFY 2016 SPP/APR Data
Number of infants and toddlers birth to 1 with IFSPsPopulation of infants and toddlers birth
to 1FFY 2015 Data* FFY 2016 Target* FFY 2016 Data
1,172 88,079 1.36% 1.57% 1.33%
Compare your results to the national data
Indiana did not meet the target or 1.57% for this indicator. Indiana is above the national average of 1.24% according to the 2017 Part CSPP/APR Indicator Analysis Booklet.
Indiana continues to struggle with getting children into the Part C program under the age of 12 months in certain parts of the state. This is especially true for rural areas of the state. SPOEs continue to work with NICUsaround the state however, many families want to take time to bond with their newborn child, and get to know them and their needs before proceeding with any kind of referral to the early intervention system. Indiana has manyphysicians that take the "wait and see" philosophy with young infants which has also been a target of the SPOEs to help educate these offices on the importance of early intervention and what the program can offer young infantsthat are eligible for services.
Indiana will continue to target young infants and their families through current and new referral sources throughout the state to getinfants that are eligible for Part C services into the program before they are 12 months old.
Actions required in FFY 2015 response
none
FFY 2016 Part C State Performance Plan (SPP)/Annual Performance Report (APR)
4/18/2018 Page 20 of 48

Indicator 6: Child Find (Birth to Three)
Baseline Data: 2005
Monitoring Priority: Effective General Supervision Part C / Child Find
Results indicator: Percent of infants and toddlers birth to 3 with IFSPs compared to national data.
(20 U.S.C. 1416(a)(3)(B) and 1442)
Historical Data
FFY 2004 2005 2006 2007 2008 2009 2010 2011 2012 2013 2014
Target ≥ 3.30% 3.25% 3.25% 3.15% 3.00% 3.00% 3.00% 3.83% 3.83%
Data 3.83% 3.66% 3.44% 3.64% 3.74% 3.92% 3.54% 3.65% 3.64% 3.79%
FFY 2015
Target ≥ 3.83%
Data 3.89%
Key: Gray – Data Prior to Baseline Yellow – Baseline Blue – Data Update
FFY 2016 - FFY 2018 Targets
FFY 2016 2017 2018
Target ≥ 3.84% 3.84% 3.84%
Key:
Targets: Description of Stakeholder Input - Please see the Stakeholder Involvement section of the introduction.
Enter additional information about stakeholder involvement
Prepopulated Data
Source Date Description Data Overwrite Data
SY 2016-17 Child Count/EducationalEnvironment Data Groups
7/12/2017 Number of infants and toddlers birth to 3 with IFSPs 10,327
U.S. Census Annual State ResidentPopulation Estimates April 1, 2010 to July
1, 20166/22/2017 Population of infants and toddlers birth to 3 252,544
TBD null
FFY 2016 SPP/APR DataNumber of infants and toddlers birth to 3 with
IFSPsPopulation of infants and toddlers birth to 3
FFY 2015Data*
FFY 2016Target*
FFY 2016Data
10,327 252,544 3.89% 3.84% 4.09%
Compare your results to the national data
Indiana met the target of 3.84% for this indicator. Indiana is above the national average of 3.12% according to the 2017 Part C SPP/APRIndicator Analysis Booklet.
Indiana continues to meet the needs of young children over the age of three. We will continue to pursue new referral sources and encourage current referral sources to refer children to the Part C program to ensure allchildren under three, who are eligible for Part C get the services they need.
FFY 2016 Part C State Performance Plan (SPP)/Annual Performance Report (APR)
4/18/2018 Page 21 of 48

Actions required in FFY 2015 response
none
FFY 2016 Part C State Performance Plan (SPP)/Annual Performance Report (APR)
4/18/2018 Page 22 of 48

Indicator 7: 45-day timeline
Baseline Data: 2005
Monitoring Priority: Effective General Supervision Part C / Child Find
Compliance indicator: Percent of eligible infants and toddlers with IFSPs for whom an initial evaluation and initial assessment and an initial IFSP meeting were conducted within Part C’s 45-day timeline.
(20 U.S.C. 1416(a)(3)(B) and 1442)
Historical Data
FFY 2004 2005 2006 2007 2008 2009 2010 2011 2012 2013 2014
Target 100% 100% 100% 100% 100% 100% 100% 100% 100%
Data 99.62% 99.53% 99.60% 99.80% 99.90% 99.80% 99.50% 99.10% 97.60% 97.01%
FFY 2015
Target 100%
Data 96.64%
Key: Gray – Data Prior to Baseline Yellow – Baseline
FFY 2016 - FFY 2018 Targets
FFY 2016 2017 2018
Target 100% 100% 100%
FFY 2016 SPP/APR Data
Number of eligible infants and toddlers with IFSPs forwhom an initial evaluation and assessment and aninitial IFSP meeting was conducted within Part C’s
45-day timeline
Number of eligible infants and toddlers evaluated andassessed for whom an initial IFSP meeting was
required to be conducted
FFY 2015Data*
FFY 2016Target*
FFY 2016Data
2,744 2,795 96.64% 100% 99.07%
Number of documented delays attributable to exceptional family circumstancesThis number will be added to the "Number of eligible infants and toddlers with IFSPs for whom an initial evaluation and assessment and an initial IFSP meeting was conductedwithin Part C's 45-day timeline" field above to calculate the numerator for this indicator.
25
What is the source of the data provided for this indicator?
State monitoring
State database
Describe the method used to select EIS programs for monitoring.
In Indiana, every child proceeding to evaluation/assessment receives a comprehensive developmental assessment by an AssessmentTeam (AT), a multidisciplinary team representing at least two professional disciplines. In addition to information received from themedical home, family interview and the multidisciplinary team, every child is assessed using the Assessment, Evaluation andProgramming System (AEPS®). Additional observations and tests are performed as needed and appropriate. Once the AT initialevaluation and assessment is completed, the information is sent to the Service Coordinator who contacts the family. Based onevaluation/assessment results and recommendations of the AT, the family makes a choice to proceed to an eligibility meeting or todecline to proceed. If the family chooses to proceed, the eligibility meeting is scheduled.
Once the IFSP team determines that the child is eligible, the IFSP can be developed.
Each cluster SPOE must submit a "Delay of IFSP" form for every IFSP that exceeds the 45-day timeline. This form provides informationabout why the initial 45-day timeline was not met. The parent signs this form indicating that they have been informed of their rights andprocedural safeguards and understand that the IFSP exceeded the 45-day timeline and they are in agreement with the delay of IFSPreason stated on the form. The "Delay of IFSP" form and the clinical documentation become part of the early intervention record.
In order to monitor that the IFSP timelines are met, a Quality Review process has been developed to examine every instance when theIFSP exceeds the 45-day timeline. The determination of whether the delay was the result of an exceptional family circumstance (e.g.,family scheduling conflicts, family medical emergency, parent/child illness, family relocation or custody change) or the result of asystemic issue is made by State staff. Because State staff review every late 45-day instance, there is no separate verification process
FFY 2016 Part C State Performance Plan (SPP)/Annual Performance Report (APR)
4/18/2018 Page 23 of 48

(as there is with other indicators).
When the development of the IFSP exceeds 45 days, the actual date of the IFSP is recorded to ensure that the child/family didsubsequently have an IFSP developed. While Indiana monitors timelines for all IFSPs, findings of non-compliance are only identifiedand issued during the annual quality review visit.
Provide additional information about this indicator (optional)
Table 7.1 Indicator 7: 45-Day Timeline FFY16
Cluster /SPOE Total # IFSPs% < 45 Days includingEFC
# > 45 DaysRange of days untilIFSP was developed
State 10743
99.1% (10651/10743*)
*Five children in the totalare not able to be linkedwith the cluster ofresidence due to dataentry errors but received atimely IFSP.
92
*Cluster A 1217 99.8% (1214/1217) 3 46-75
Cluster B 1090 99.3% (1082/1090) 8 46-55
*Cluster C 958 99.6% (954/958) 4 46-60
*Cluster D 781 99.9% (780/781) 1 46-51
Cluster F 483 94.4% (456/483) 27 46-57
Cluster G 3291 99.1% (3263/3291) 28 46-50
*Cluster H 651 98.9% (644/651) 7 46-94
Cluster I 1152 98.8% (1138/1152) 14 46-112
*Cluster J 1115 100% (1115/1115) 0 N/A
EFC are included in the numerator for the % of the total number of children whose 45-day timeline was met.
FFY 2016 Part C State Performance Plan (SPP)/Annual Performance Report (APR)
4/18/2018 Page 24 of 48

*During FFY16, four of nine SPOEs were issued a finding of non-compliance based on the July-September 2016 data. Cluster A, C, D, H,and J were in compliance at baseline and did not receive a finding for this indicator.
Table 7.2 Indicator 7: Initial IFSP written within the 45-Day Timeline
Cluster/SPOEState Correction ofNon-Compliance Data
Data TimeframeState VerificationDate
Cluster B 100% (261/261) January-March 2017 6/30/2017
Cluster F N/A N/A N/A
Cluster G N/A N/A N/A
Cluster I N/A N/A N/A
Of the four findings letters issued to the SPOEs, one (Cluster B) was able to demonstrate timely correction of non-compliance with stateverification. State verification of correction of non-compliance was done via onsite visits and desk audits and was completed prior to oneyear from the finding for this cluster. Corrections were verified at both the system and child level.
Three clusters (Cluster F, G, and I) continue to be out of compliance for this indicator. The three non-compliance clusters experiencedthe following challenges:
Cluster F: (27) Cluster F has struggled with availability of the Assessment Team that serves the cluster. Cluster F covers many ruralcounties in Indiana and many Assessment Team members choose not to drive to those remote areas unless the SPOE can fill their daywith multiple evaluations, which is many times somewhat of a challenge.
Cluster G: (28) Of the IFSP’s that went over 45 days due to system issues, 79% (22) were due to scheduling issues resulting from eitherthe ED team schedule (eval scheduled past 45 days because the schedule was full; could not accommodate a re-schedule within the45 days-39% (11)) or SC schedules (SC caseloads prevented timely scheduling, or we had no capacity to cover for SC illness, etc.-39%(11)). Both of those reasons are tied to the increase in referrals and our inability to increase staff accordingly. The others were due to lackof timely follow up by SC (7% (2); also resulting from caseloads in the 80’s) and errors with the 45 day date (admin. provided an incorrectdue date-11% (3)).
Cluster I: (14) This cluster continues to experience significant staff turnover which has contributed to the issue of not meeting the 45-daytimeline. Assessment team availability in scheduling and especially rescheduling the assessment has also contributed to missed45-day timeline for some families. The cluster is continuing to target this area by continuing training of their staff around the importanceof meeting this timeline.
Actions required in FFY 2015 response
none
Note: Any actions required in last year's response table that are related to correction of findings should be responded to on the "Correction of Previous Findingsof Noncompliance" page of this indicator. If your State's only actions required in last year's response are related to findings of noncompliance, a text field willnot be displayed on this page.
Correction of Findings of Noncompliance Identified in FFY 2015
Findings of Noncompliance IdentifiedFindings of Noncompliance Verified as
Corrected Within One YearFindings of Noncompliance Subsequently
CorrectedFindings Not Yet Verified as Corrected
7 4 0 3
FFY 2015 Findings of Noncompliance Verified as Corrected
Describe how the State verified that the source of noncompliance is correctly implementing the regulatory requirements
FFY 2016 Part C State Performance Plan (SPP)/Annual Performance Report (APR)
4/18/2018 Page 25 of 48

Cluster/SPOE
Analysis of SubsequentData
State correction ofNon-Compliance Data
Data Timeframe State Verification Date
Cluster A 100% (322/322) October–December 2015 3/1/2016
Cluster B 100% (299/299) April-June 2016 9/1/2016
Cluster D 100% (209/209) October-December 2015 3/1/2016
Cluster F N/A N/A N/A
Cluster G N/A N/A N/A
Cluster H 100% (143/143) October-December 2015 3/1/2016
Cluster I N/A N/A N/A
In accordance with the OSEP Memorandum 09-02, the state issued seven findings for indicator 7 (A, B, D, F, G, H, and I). Indiana wasable to demonstrate timely correction of noncompliance with state verification for Clusters A, B, D, and H. Verification of correction ofnoncompliance was completed prior to one year from the finding. Corrections were verified at both the system and the child level. The correction of non-compliance findings wereverified by the collection and analysis of subsequent data during additional onsite visits, which include onsite file audits and data reviews. We looked at subsequent data to ensure that all findings of noncompliance werecorrected.
Describe how the State verified that each individual case of noncompliance was corrected
In accordance with the OSEP Memorandum 09-02, the state issued seven findings for indicator 7 (A, B, D, F, G, H, and I). Indiana wasable to demonstrate timely correction of noncompliance with state verification for Clusters A, B, D, and H.
Three clusters (F, G and I) continue to be out of compliance for this indicator. The three clusters that remain non-compliant experiencedthe following challenges:
Cluster F: One hundred and sixty-nine children received IFSPs after the 45 day timeline. All of these instances were due to assessmentteam member shortages and scheduling issues. Many of the counties that are served by Cluster F are rural and current assessmentteam members limit their travel to those counties to one day a week.
Cluster G: Thirty-six children received IFSPs after the 45 day timeline. Two were due to service coordinator error, two were due toscheduling conflicts, and the rest (32) were a result of assessment team scheduling conflicts that caused the delay in meeting thetimeline of 45 days.
Cluster I: One hundred and twenty-eight children received IFSPs after the 45 day timeline. A review of a sample of these children
FFY 2016 Part C State Performance Plan (SPP)/Annual Performance Report (APR)
4/18/2018 Page 26 of 48

indicated that SPOE staff turnover, assessment team shortage, and consequent scheduling issues were the root of the problem. Everychild who received a late IFSP in FFY15 did receive an evaluation, assessment and IFSP, albeit beyond the 45 day timeline. The state willcontinue to provide technical assistance as needed, and monitor these clusters' performance to ensure compliance with this indicator.
FFY 2015 Findings Not Yet Verified as Corrected
Actions taken if noncompliance not corrected
The state takes specific actions to assist clusters when they do not reach compliance. Depending on regional clusters' needs, technicalassistance can be provided on-site or electronically. Technical assistance is provided by trained staff and focuses on assisting regionalclusters in the development of Quality Improvement Plans (QIPs) by facilitating stakeholder involvement through attendance at local andstate meetings, providing training and detailed examples of high quality, evidence-based plans, and providing detailed feedback on draftplans. Technical assistance is also provided to service providers regarding the content and quality of home visit documentation.Additional technical assistance in the form of data analysis is provided throughout the year in response to requests from State staff astrends and patterns emerge. State staff also provides direct technical assistance to local programs through ongoing contract monitoringactivities and periodic data reviews.
The state will continue to provide the above mentioned technical assistance to support ongoing quality and compliance improvementsfor Clusters F, G and I.
FFY 2014 Findings Not Yet Verified as Corrected
Actions taken if noncompliance not corrected
During FFY14, 7 Clusters received a findings letter for this indicator. Four clusters were able to correct the finding within the one-yeartimeline.
SPOEAnalysis of Subsequent Data
State Verified Correction of NoncomplianceData Timeframe State Verification Date
Cluster A 100% (266/266) October-December 2014 7/9/2015
Cluster C 100% (219/219) July-September 2015 12/15/201515
Cluster D 100% (217/217) April-June 2015 11/11/2015
Cluster J 100% (304/304) April-June2015 11/1/2015
In accordance with the OSEP Memorandum 09-02, the state issued seven findings for indicator 7 (A, B, D, F, G, and J). Indiana was ableto demonstrate timely correction of noncompliance with state verification for Clusters A, C, D, and J. Verification of correction ofnoncompliance was completed prior to one year from the finding. Corrections were verified at both the system and the child level. Thecorrection of non-compliance findings were verified by the collection and analysis of subsequent data during additional onsite visits,which include onsite file audits and data reviews. We looked at subsequent data to ensure that all findings of noncompliance werecorrected.
Cluster B was able to correct the finding of noncompliance the third quarter of FFY15 albeit after the one year timeline.
Cluster F has not reached full compliance of 100%; however, in FFY2014 Cluster F demonstrated a high level of performance (90.4%).Cluster F was required to create and submit quarterly Quality Improvement Plans, providing a hypothesis to explain the noncompliancedata, identify strategies for improvement, and provide an explanation of stakeholder collaboration to correct the noncompliance. In reviewof this information the following root causes were identified:
Understaffing of Assessment Team personnel resulting in scheduling issues were the root of the problem.
Cluster G has not reached full compliance of 100%; however, in FFY2014 the cluster demonstrated a high level of performance (95.8%).Cluster G was required to create and submit quarterly Quality Improvement Plans, providing a hypothesis to explain the noncompliancedata, identify strategies for improvement, and provide an explanation of stakeholder collaboration to correct the noncompliance. In reviewof this information the following root causes were identified:
Understaffing of Assessment Team Personnel resulted in 76 children receiving late IFSPs. Twenty were due to family circumstances that
FFY 2016 Part C State Performance Plan (SPP)/Annual Performance Report (APR)
4/18/2018 Page 27 of 48
were not adequately documented and therefore counted as system errors. Eighteen were service coordinator scheduling issues. Fivewere due to cost participation issues,and 12 were due to other system errors.
The state takes specific actions to assist clusters when they do not reach compliance. Depending on regional clusters' needs, technicalassistance can be provided on-site or electronically. Technical assistance is provided by trained staff and focuses on assisting regionalclusters in the development of Quality Improvement Plans (QIPs) by facilitating stakeholder involvement through attendance at local andstate meetings, providing training and detailed examples of high quality, evidence-based plans, and providing detailed feedback on draftplans. Technical assistance is also provided to service providers regarding the content and quality of home visit documentation.Additional technical assistance in the form of data analysis is provided throughout the year in response to requests from State staff astrends and patterns emerge. State staff also provides direct technical assistance to local programs through ongoing contract monitoringactivities and periodic data reviews.
The state will continue to provide the above mentioned technical assistance to support ongoing quality and compliance improvementsfor Clusters F and G. However, due to continued noncompliance with this indicator, FFY 2014 performance based funds were withheldfrom Clusters F and G.
We will continue gather subsequent data.
FFY 2013 Findings Not Yet Verified as Corrected
Actions taken if noncompliance not corrected
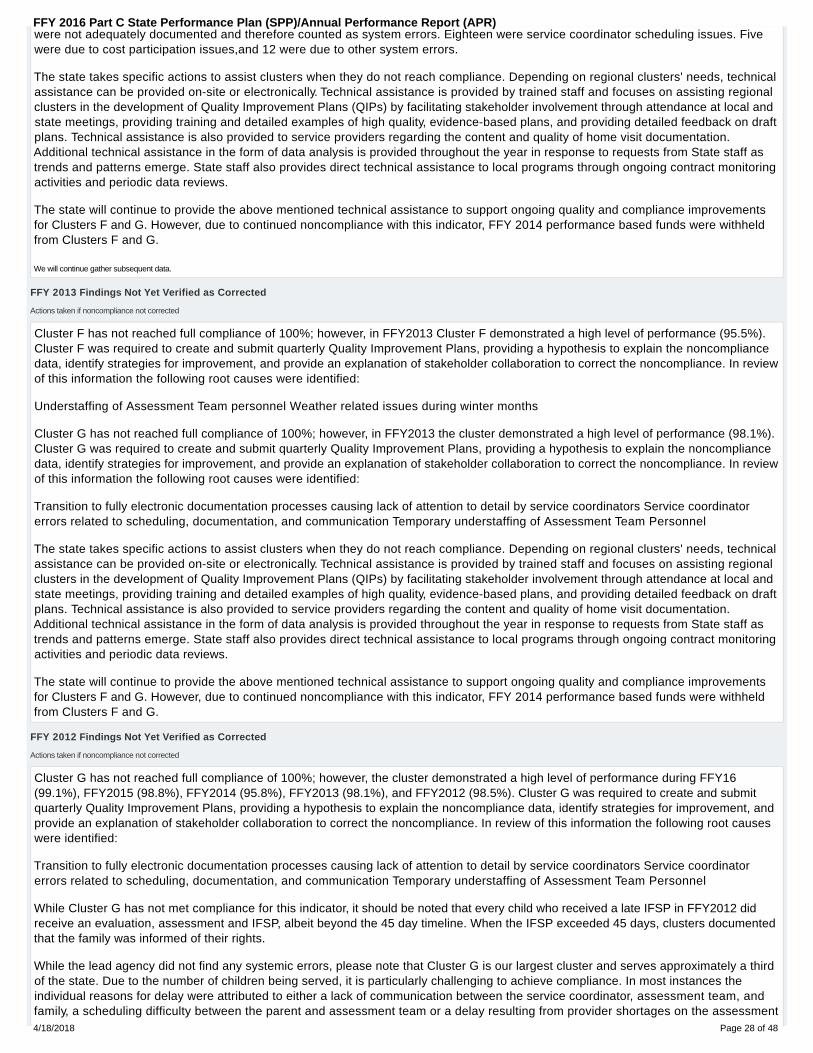
Cluster F has not reached full compliance of 100%; however, in FFY2013 Cluster F demonstrated a high level of performance (95.5%).Cluster F was required to create and submit quarterly Quality Improvement Plans, providing a hypothesis to explain the noncompliancedata, identify strategies for improvement, and provide an explanation of stakeholder collaboration to correct the noncompliance. In reviewof this information the following root causes were identified:
Understaffing of Assessment Team personnel Weather related issues during winter months
Cluster G has not reached full compliance of 100%; however, in FFY2013 the cluster demonstrated a high level of performance (98.1%).Cluster G was required to create and submit quarterly Quality Improvement Plans, providing a hypothesis to explain the noncompliancedata, identify strategies for improvement, and provide an explanation of stakeholder collaboration to correct the noncompliance. In reviewof this information the following root causes were identified:
Transition to fully electronic documentation processes causing lack of attention to detail by service coordinators Service coordinatorerrors related to scheduling, documentation, and communication Temporary understaffing of Assessment Team Personnel
The state takes specific actions to assist clusters when they do not reach compliance. Depending on regional clusters' needs, technicalassistance can be provided on-site or electronically. Technical assistance is provided by trained staff and focuses on assisting regionalclusters in the development of Quality Improvement Plans (QIPs) by facilitating stakeholder involvement through attendance at local andstate meetings, providing training and detailed examples of high quality, evidence-based plans, and providing detailed feedback on draftplans. Technical assistance is also provided to service providers regarding the content and quality of home visit documentation.Additional technical assistance in the form of data analysis is provided throughout the year in response to requests from State staff astrends and patterns emerge. State staff also provides direct technical assistance to local programs through ongoing contract monitoringactivities and periodic data reviews.
The state will continue to provide the above mentioned technical assistance to support ongoing quality and compliance improvementsfor Clusters F and G. However, due to continued noncompliance with this indicator, FFY 2014 performance based funds were withheldfrom Clusters F and G.
FFY 2012 Findings Not Yet Verified as Corrected
Actions taken if noncompliance not corrected
Cluster G has not reached full compliance of 100%; however, the cluster demonstrated a high level of performance during FFY16(99.1%), FFY2015 (98.8%), FFY2014 (95.8%), FFY2013 (98.1%), and FFY2012 (98.5%). Cluster G was required to create and submitquarterly Quality Improvement Plans, providing a hypothesis to explain the noncompliance data, identify strategies for improvement, andprovide an explanation of stakeholder collaboration to correct the noncompliance. In review of this information the following root causeswere identified:
Transition to fully electronic documentation processes causing lack of attention to detail by service coordinators Service coordinatorerrors related to scheduling, documentation, and communication Temporary understaffing of Assessment Team Personnel
While Cluster G has not met compliance for this indicator, it should be noted that every child who received a late IFSP in FFY2012 didreceive an evaluation, assessment and IFSP, albeit beyond the 45 day timeline. When the IFSP exceeded 45 days, clusters documentedthat the family was informed of their rights.
While the lead agency did not find any systemic errors, please note that Cluster G is our largest cluster and serves approximately a thirdof the state. Due to the number of children being served, it is particularly challenging to achieve compliance. In most instances theindividual reasons for delay were attributed to either a lack of communication between the service coordinator, assessment team, andfamily, a scheduling difficulty between the parent and assessment team or a delay resulting from provider shortages on the assessment
FFY 2016 Part C State Performance Plan (SPP)/Annual Performance Report (APR)
4/18/2018 Page 28 of 48

team.
The state takes specific actions to assist clusters when they do not reach compliance. Depending on regional clusters’ needs, technicalassistance can be provided on-site or electronically. Technical assistance is provided by trained staff and focuses on assisting regionalclusters in the development of Quality Improvement Plans (QIPs) by facilitating stakeholder involvement through attendance at local andstate meetings, providing training and detailed examples of high quality, evidence-based plans, and providing detailed feedback on draftplans. Technical assistance is also provided to service providers regarding the content and quality of home visit documentation.Additional technical assistance in the form of data analysis is provided throughout the year in response to requests from State staff astrends and patterns emerge. State staff also provides direct technical assistance to local programs through ongoing contract monitoringactivities and periodic data reviews. The State will continue to provide technical assistance as needed and monitor Cluster G's performance.
FFY 2016 Part C State Performance Plan (SPP)/Annual Performance Report (APR)
4/18/2018 Page 29 of 48

Indicator 8A: Early Childhood Transition
Baseline Data: 2005
Monitoring Priority: Effective General Supervision Part C / Effective Transition
Compliance indicator: The percentage of toddlers with disabilities exiting Part C with timely transition planning for whom the Lead Agency has:
Developed an IFSP with transition steps and services at least 90 days, and at the discretion of all parties, not more than nine months, prior to the toddler’s third birthday;A.Notified (consistent with any opt-out policy adopted by the State) the State educational agency (SEA) and the local educational agency (LEA) where the toddler resides at least 90 days prior to thetoddler’s third birthday for toddlers potentially eligible for Part B preschool services; and
B.
Conducted the transition conference held with the approval of the family at least 90 days, and at the discretion of all parties, not more than nine months, prior to the toddler’s third birthday fortoddlers potentially eligible for Part B preschool services.
C.
(20 U.S.C. 1416(a)(3)(B) and 1442)
Historical Data
FFY 2004 2005 2006 2007 2008 2009 2010 2011 2012 2013 2014
Target 100% 100% 100% 100% 100% 100% 100% 100% 100%
Data 100% 100% 99.50% 99.70% 100% 99.90% 99.90% 100% 99.38% 99.92%
FFY 2015
Target 100%
Data 99.22%
Key: Gray – Data Prior to Baseline Yellow – Baseline
FFY 2016 - FFY 2018 Targets
FFY 2016 2017 2018
Target 100% 100% 100%
FFY 2016 SPP/APR Data
Explanation of Alternate Data
Indiana does not review the records of all children exiting the Part C system.
This number represents a sample of the annual IFSPs for eligible infants and toddlers. The sample is composed of files that werereviewed by the Quality Review Team during the annual on-site visits with each of the clusters and data gathered by clusters duringquarterly internal reviews. The data collection strategy involved samples from each of the nine regional clusters to ensure adequaterepresentation of all children receiving First Steps services in Indiana.
For FFY2016, Indiana reviewed a sample of annual IFSPs written between July 1, 2016 and June 30, 2017 to determine if the IFSP hadtransition steps and services written in the plan. Data include only those toddlers with disabilities exiting Part C with timely transitionplanning for whom the Lead Agency has developed an IFSP with transition steps and services at least 90 days, and at the discretion ofall parties, and not more than nine months, prior to the toddler's third birthday.
During the annual onsite visit, the sample was at least 10 percent of all annual IFSPs written during the July to September 2016 quarter.For smaller clusters, the number of files reviewed was increased to include at least 20 files. Clusters then completed internalmonitoring and submitted data on a quarterly basis.
A minimum sample size for the state was determined by using a sampling calculator made available from the website(http://www.raosoft.com/samplesize.html) by Raosoft, Inc. The actual number sampled far exceeds the required sample size for aconfidence level of 99%, with a confidence interval of +/-5%.
Data include only those toddlers with disabilities exiting Part C with timely transition planning for whom the Lead Agency has developed an IFSP withtransition steps and services at least 90 days, and at the discretion of all parties, not more than nine months, prior to the toddler’s third birthday.
Yes
No
Number of children exiting Part C who have an IFSPwith transition steps and services Number of toddlers with disabilities exiting Part C
FFY 2015Data*
FFY 2016Target*
FFY 2016Data
FFY 2016 Part C State Performance Plan (SPP)/Annual Performance Report (APR)
4/18/2018 Page 30 of 48

Number of children exiting Part C who have an IFSPwith transition steps and services Number of toddlers with disabilities exiting Part C
FFY 2015Data*
FFY 2016Target* FFY 2016 Data
1,589 1,604 99.22% 100% 99.06%
Number of documented delays attributable to exceptional family circumstancesThis number will be added to the "Number of children exiting Part C who have an IFSP with transition steps and services" field to calculate the numerator for this indicator. null
What is the source of the data provided for this indicator?
State monitoring
State database
Describe the method used to select EIS programs for monitoring.
Indiana does not review the records of all children exiting the Part C system.
This number represents a sample of the annual IFSPs for eligible infants and toddlers. The sample is composed of files that werereviewed by the Quality Review Team during the annual on-site visits with each of the clusters and data gathered by clusters duringquarterly internal reviews. The data collection strategy involved samples from each of the nine regional clusters to ensure adequaterepresentation of all children receiving First Steps services in Indiana.
For FFY2016, Indiana reviewed a sample of annual IFSPs written between July 1, 2016 and June 30, 2017 to determine if the IFSP hadtransition steps and services written in the plan. Data include only those toddlers with disabilities exiting Part C with timely transitionplanning for whom the Lead Agency has developed an IFSP with transition steps and services at least 90 days, and at the discretion ofall parties, and not more than nine months, prior to the toddler's third birthday.
During the annual onsite visit, the sample was at least 10 percent of all annual IFSPs written during the July to September 2016 quarter.For smaller clusters, the number of files reviewed was increased to include at least 20 files. Clusters then completed internalmonitoring and submitted data on a quarterly basis.
A minimum sample size for the state was determined by using a sampling calculator made available from the website(http://www.raosoft.com/samplesize.html) by Raosoft, Inc. The actual number sampled far exceeds the required sample size for aconfidence level of 99%, with a confidence interval of +/-5%.
Provide additional information about this indicator (optional)
Table 8.1 Indicator 8A: IFSPs with Transition Steps and Services FFY16
Cluster/SPOE# of IFSPsReviewed
% of IFSPs Reviewedwith DocumentedTransition Steps andServices
State 1604 99.1% (1589/1604)
Cluster A 205 100% (205/205)
Cluster B 145 100% (145/145)
Cluster C 94 100% (94/94)
Cluster D 105 100% (105/105)
Cluster F 100 97% (97/100)
*Cluster G 363 98.3% (357/363)
Cluster H 180 100% (180/180)
Cluster I 172 96.5% (166/172)
Cluster J 240 100% (240/240)
* One of the nine clusters received a findings letter for this indicator. All other clusters met compliance at baseline.
Table 8.2 Indicator 8A: documentation of Compliance for Indicator:
FFY 2016 Part C State Performance Plan (SPP)/Annual Performance Report (APR)
4/18/2018 Page 31 of 48
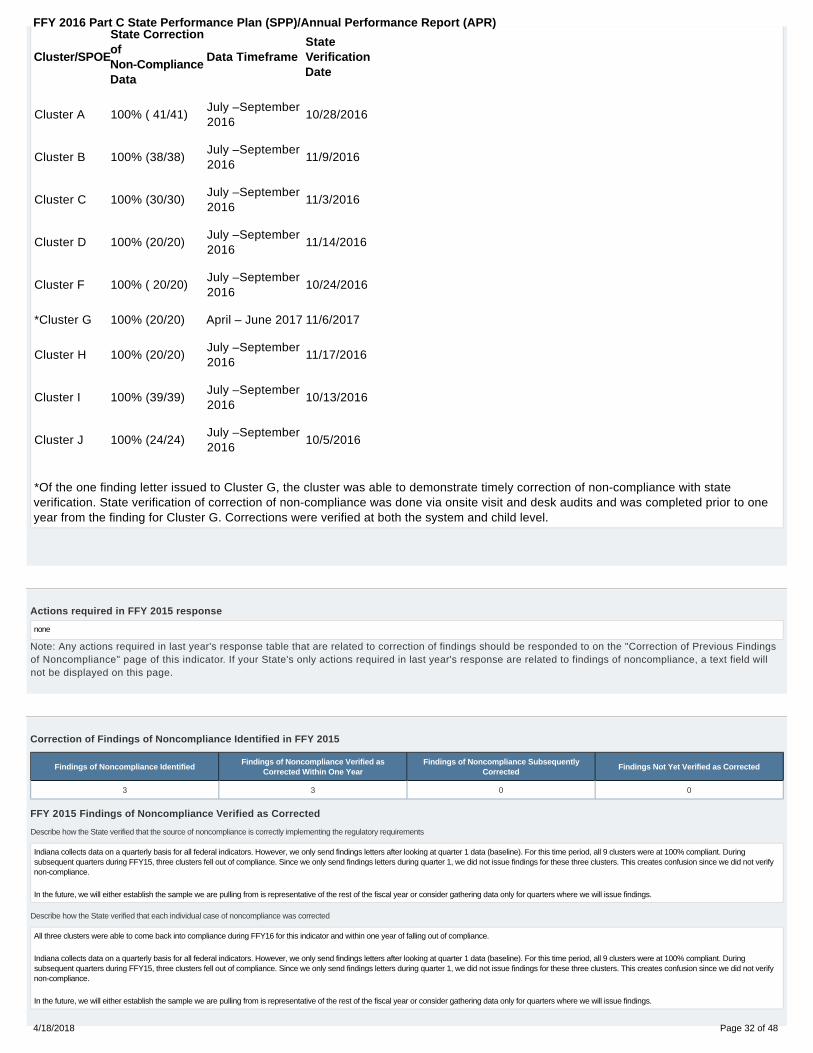
Cluster/SPOE
State CorrectionofNon-ComplianceData
Data TimeframeStateVerificationDate
Cluster A 100% ( 41/41)July –September2016
10/28/2016
Cluster B 100% (38/38)July –September2016
11/9/2016
Cluster C 100% (30/30)July –September2016
11/3/2016
Cluster D 100% (20/20)July –September2016
11/14/2016
Cluster F 100% ( 20/20)July –September2016
10/24/2016
*Cluster G 100% (20/20) April – June 2017 11/6/2017
Cluster H 100% (20/20)July –September2016
11/17/2016
Cluster I 100% (39/39)July –September2016
10/13/2016
Cluster J 100% (24/24)July –September2016
10/5/2016
*Of the one finding letter issued to Cluster G, the cluster was able to demonstrate timely correction of non-compliance with stateverification. State verification of correction of non-compliance was done via onsite visit and desk audits and was completed prior to oneyear from the finding for Cluster G. Corrections were verified at both the system and child level.
Actions required in FFY 2015 response
none
Note: Any actions required in last year's response table that are related to correction of findings should be responded to on the "Correction of Previous Findingsof Noncompliance" page of this indicator. If your State's only actions required in last year's response are related to findings of noncompliance, a text field willnot be displayed on this page.
Correction of Findings of Noncompliance Identified in FFY 2015
Findings of Noncompliance IdentifiedFindings of Noncompliance Verified as
Corrected Within One YearFindings of Noncompliance Subsequently
CorrectedFindings Not Yet Verified as Corrected
3 3 0 0
FFY 2015 Findings of Noncompliance Verified as Corrected
Describe how the State verified that the source of noncompliance is correctly implementing the regulatory requirements
Indiana collects data on a quarterly basis for all federal indicators. However, we only send findings letters after looking at quarter 1 data (baseline). For this time period, all 9 clusters were at 100% compliant. Duringsubsequent quarters during FFY15, three clusters fell out of compliance. Since we only send findings letters during quarter 1, we did not issue findings for these three clusters. This creates confusion since we did not verifynon-compliance.
In the future, we will either establish the sample we are pulling from is representative of the rest of the fiscal year or consider gathering data only for quarters where we will issue findings.
Describe how the State verified that each individual case of noncompliance was corrected
All three clusters were able to come back into compliance during FFY16 for this indicator and within one year of falling out of compliance.
Indiana collects data on a quarterly basis for all federal indicators. However, we only send findings letters after looking at quarter 1 data (baseline). For this time period, all 9 clusters were at 100% compliant. Duringsubsequent quarters during FFY15, three clusters fell out of compliance. Since we only send findings letters during quarter 1, we did not issue findings for these three clusters. This creates confusion since we did not verifynon-compliance.
In the future, we will either establish the sample we are pulling from is representative of the rest of the fiscal year or consider gathering data only for quarters where we will issue findings.
FFY 2016 Part C State Performance Plan (SPP)/Annual Performance Report (APR)
4/18/2018 Page 32 of 48

FFY 2016 Part C State Performance Plan (SPP)/Annual Performance Report (APR)
4/18/2018 Page 33 of 48

Indicator 8B: Early Childhood Transition
Baseline Data: 2005
Monitoring Priority: Effective General Supervision Part C / Effective Transition
Compliance indicator: The percentage of toddlers with disabilities exiting Part C with timely transition planning for whom the Lead Agency has:
Developed an IFSP with transition steps and services at least 90 days, and at the discretion of all parties, not more than nine months, prior to the toddler’s third birthday;A.Notified (consistent with any opt-out policy adopted by the State) the State educational agency (SEA) and the local educational agency (LEA) where the toddler resides at least 90 days prior to thetoddler’s third birthday for toddlers potentially eligible for Part B preschool services; and
B.
Conducted the transition conference held with the approval of the family at least 90 days, and at the discretion of all parties, not more than nine months, prior to the toddler’s third birthday fortoddlers potentially eligible for Part B preschool services.
C.
(20 U.S.C. 1416(a)(3)(B) and 1442)
Historical Data
FFY 2004 2005 2006 2007 2008 2009 2010 2011 2012 2013 2014
Target 100% 100% 100% 100% 100% 100% 100% 100% 100%
Data 100% 100% 100% 100% 100% 100% 100% 100% 100% 100%
FFY 2015
Target 100%
Data 100%
Key: Gray – Data Prior to Baseline Yellow – Baseline
FFY 2016 - FFY 2018 Targets
FFY 2016 2017 2018
Target 100% 100% 100%
FFY 2016 SPP/APR Data
Data include notification to both the SEA and LEA
Yes
No
Number of toddlers with disabilities exiting Part Cwhere notification to the SEA and LEA occurred at
least 90 days prior to their third birthday for toddlerspotentially eligible for Part B preschool services
Number of toddlers with disabilities exiting Part C whowere potentially eligible for Part B
FFY 2015Data*
FFY 2016Target*
FFY 2016Data
7,206 7,206 100% 100% 100%
Number of parents who opted outThis number will be subtracted from the "Number of toddlers with disabilities exiting Part C who were potentially eligible for Part B" field to calculate the denominator for thisindicator.
null
Describe the method used to collect these data
Each month all children turning 30 months of age in the previous month are identified. This list of children is sent to the SEA and LEAand to the clusters electronically. In addition to the children turning 30 months, late referrals are also identified (children who werereferred and an IFSP written after 30 months of age) and are included in the list sent to the SEA and the LEA. The data was transmittedduring the whole reporting period of July 1, 2016 to June 30, 2017.
Indiana provides child name, date of birth, and parent contact information to the appropriate school district (SEA and LEA) based on theaddress of the child’s residence. This procedure has enabled Indiana to provide accurate notification the SEA and LEA of childrenpotentially eligible for Part B services. Additionally, service coordinators (with parental consent) invite the LEA and other communitypartners (Head Start and local preschool representatives) to the transition meeting. These efforts are increasing LEA and othercommunity partner attendance at the Part C Transition meetings.
FFY 2016 Part C State Performance Plan (SPP)/Annual Performance Report (APR)
4/18/2018 Page 34 of 48

Do you have a written opt-out policy? No
What is the source of the data provided for this indicator?
State monitoring
State database
Provide the time period in which the data were collected (e.g., September through December, fourth quarter, selection from the full reporting period).
The data was transmitted each month during the whole reporting period of July 1, 2016 to June 30, 2017.
Describe how the data accurately reflect data for infants and toddlers with IFSPs for the full reporting period.
Indiana provides child name, date of birth, and parent contact information to the appropriate school district (SEA and LEA) based on theaddress of the child's residence. This has enabled Indiana to provide accurate, on-going notification to the SEA and LEA of childrenpotentially eligible for Part B services each month during the reporting period for FFY16.
Actions required in FFY 2015 response
none
Note: Any actions required in last year's response table that are related to correction of findings should be responded to on the "Correction of Previous Findingsof Noncompliance" page of this indicator. If your State's only actions required in last year's response are related to findings of noncompliance, a text field willnot be displayed on this page.
Correction of Findings of Noncompliance Identified in FFY 2015
Findings of Noncompliance IdentifiedFindings of Noncompliance Verified as
Corrected Within One YearFindings of Noncompliance Subsequently
CorrectedFindings Not Yet Verified as Corrected
null null null 0
FFY 2016 Part C State Performance Plan (SPP)/Annual Performance Report (APR)
4/18/2018 Page 35 of 48

Indicator 8C: Early Childhood Transition
Baseline Data: 2005
Monitoring Priority: Effective General Supervision Part C / Effective Transition
Compliance indicator: The percentage of toddlers with disabilities exiting Part C with timely transition planning for whom the Lead Agency has:
Developed an IFSP with transition steps and services at least 90 days, and at the discretion of all parties, not more than nine months, prior to the toddler’s third birthday;A.Notified (consistent with any opt-out policy adopted by the State) the State educational agency (SEA) and the local educational agency (LEA) where the toddler resides at least 90 days prior to thetoddler’s third birthday for toddlers potentially eligible for Part B preschool services; and
B.
Conducted the transition conference held with the approval of the family at least 90 days, and at the discretion of all parties, not more than nine months, prior to the toddler’s third birthday fortoddlers potentially eligible for Part B preschool services.
C.
(20 U.S.C. 1416(a)(3)(B) and 1442)
Historical Data
FFY 2004 2005 2006 2007 2008 2009 2010 2011 2012 2013 2014
Target 100% 100% 100% 100% 100% 100% 100% 100% 100%
Data 96.00% 99.00% 99.76% 99.50% 99.90% 99.40% 99.60% 99.60% 98.62% 99.08%
FFY 2015
Target 100%
Data 99.00%
Key: Gray – Data Prior to Baseline Yellow – Baseline
FFY 2016 - FFY 2018 Targets
FFY 2016 2017 2018
Target 100% 100% 100%
FFY 2016 SPP/APR Data
Explanation of Alternate Data
Indiana does not review the records of all children exiting the Part C system. Instead, the data source for this indicator was the review ofa sample of early intervention records of children who exited Part C in FFY2016. The annual review was conducted by the Quality Review-Focused Monitoring Team.
A list of randomly selected early intervention records was compiled for each of the nine SPOE clusters. Indiana monitors each EISprogram (cluster) annually. For FFY2016, Indiana reviewed a sample of files of toddlers with disabilities exiting Part C where thetransition conference occurred at least 90 days, and at the discretion of all parties, not more than nine months, prior to the toddler's thirdbirthday for toddlers potentially eligible for Part B preschool services. The sample was 10 percent of all children due to receive atransition meeting 90 days to 9 months before their third birthday. For smaller clusters, the number of files reviewed was increased toinclude at least 20 files.
A minimum sample size was determined by using a sampling calculator made available from the website (http://www.raosoft.com/samplesize.html) by Raosoft, Inc. The actual number sampled far exceeds the required sample size for a confidence level of 99%, witha confidence interval of +/- 5%.
Additionally, quarterly progress data was provided by the clusters which was verified by the State when they report compliance.
Data reflect only those toddlers for whom the Lead Agency has conducted the transition conference held with the approval of the family at least 90 days,and at the discretion of all parties, not more than nine months, prior to the toddler’s third birthday for toddlers potentially eligible for Part B preschoolservices
Yes
No
Number of toddlers with disabilities exiting Part Cwhere the transition conference occurred at least 90days, and at the discretion of all parties at least nine
months prior to the toddler’s third birthday fortoddlers potentially eligible for Part B
Number of toddlers with disabilities exiting Part C whowere potentially eligible for Part B
FFY 2015Data*
FFY 2016Target*
FFY 2016Data
976 985 99.00% 100% 99.09%
FFY 2016 Part C State Performance Plan (SPP)/Annual Performance Report (APR)
4/18/2018 Page 36 of 48
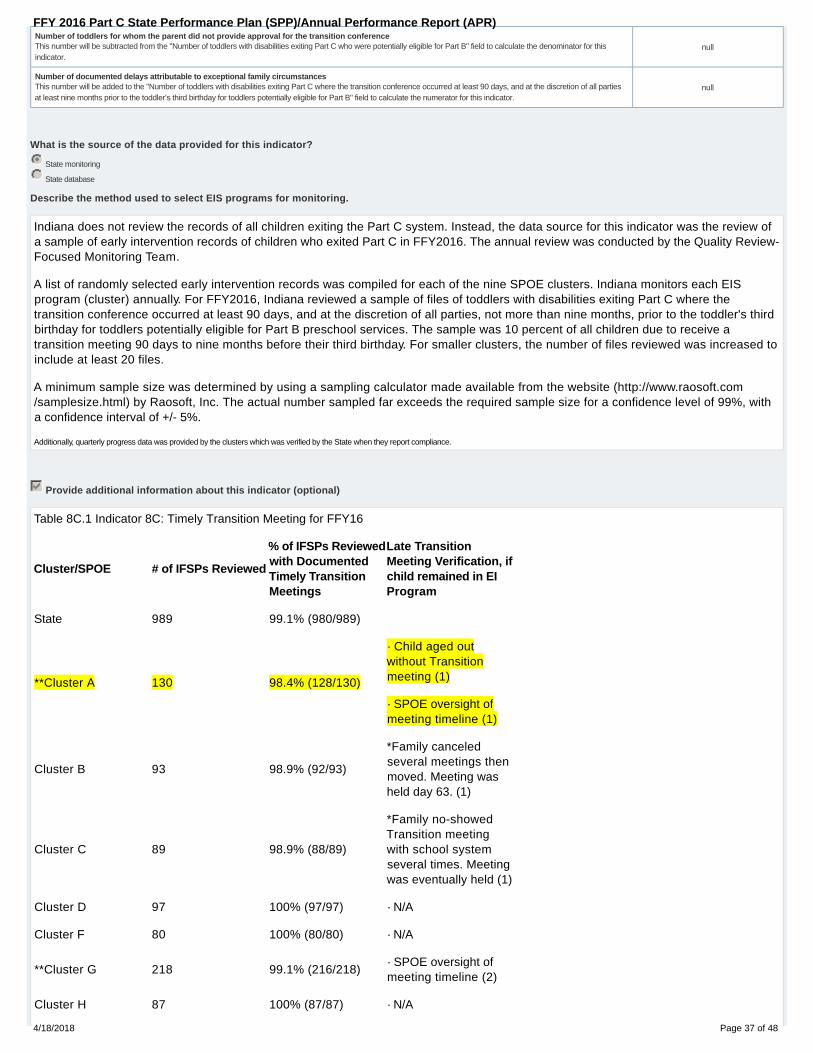
Number of toddlers for whom the parent did not provide approval for the transition conferenceThis number will be subtracted from the "Number of toddlers with disabilities exiting Part C who were potentially eligible for Part B" field to calculate the denominator for thisindicator.
null
Number of documented delays attributable to exceptional family circumstancesThis number will be added to the "Number of toddlers with disabilities exiting Part C where the transition conference occurred at least 90 days, and at the discretion of all partiesat least nine months prior to the toddler’s third birthday for toddlers potentially eligible for Part B" field to calculate the numerator for this indicator.
null
What is the source of the data provided for this indicator?
State monitoring
State database
Describe the method used to select EIS programs for monitoring.
Indiana does not review the records of all children exiting the Part C system. Instead, the data source for this indicator was the review ofa sample of early intervention records of children who exited Part C in FFY2016. The annual review was conducted by the Quality Review-Focused Monitoring Team.
A list of randomly selected early intervention records was compiled for each of the nine SPOE clusters. Indiana monitors each EISprogram (cluster) annually. For FFY2016, Indiana reviewed a sample of files of toddlers with disabilities exiting Part C where thetransition conference occurred at least 90 days, and at the discretion of all parties, not more than nine months, prior to the toddler's thirdbirthday for toddlers potentially eligible for Part B preschool services. The sample was 10 percent of all children due to receive atransition meeting 90 days to nine months before their third birthday. For smaller clusters, the number of files reviewed was increased toinclude at least 20 files.
A minimum sample size was determined by using a sampling calculator made available from the website (http://www.raosoft.com/samplesize.html) by Raosoft, Inc. The actual number sampled far exceeds the required sample size for a confidence level of 99%, witha confidence interval of +/- 5%.
Additionally, quarterly progress data was provided by the clusters which was verified by the State when they report compliance.
Provide additional information about this indicator (optional)
Table 8C.1 Indicator 8C: Timely Transition Meeting for FFY16
Cluster/SPOE # of IFSPs Reviewed
% of IFSPs Reviewedwith DocumentedTimely TransitionMeetings
Late TransitionMeeting Verification, ifchild remained in EIProgram
State 989 99.1% (980/989)
**Cluster A 130 98.4% (128/130)
· Child aged outwithout Transitionmeeting (1)
· SPOE oversight ofmeeting timeline (1)
Cluster B 93 98.9% (92/93)
*Family canceledseveral meetings thenmoved. Meeting washeld day 63. (1)
Cluster C 89 98.9% (88/89)
*Family no-showedTransition meetingwith school systemseveral times. Meetingwas eventually held (1)
Cluster D 97 100% (97/97) · N/A
Cluster F 80 100% (80/80) · N/A
**Cluster G 218 99.1% (216/218)· SPOE oversight ofmeeting timeline (2)
Cluster H 87 100% (87/87) · N/A
FFY 2016 Part C State Performance Plan (SPP)/Annual Performance Report (APR)
4/18/2018 Page 37 of 48
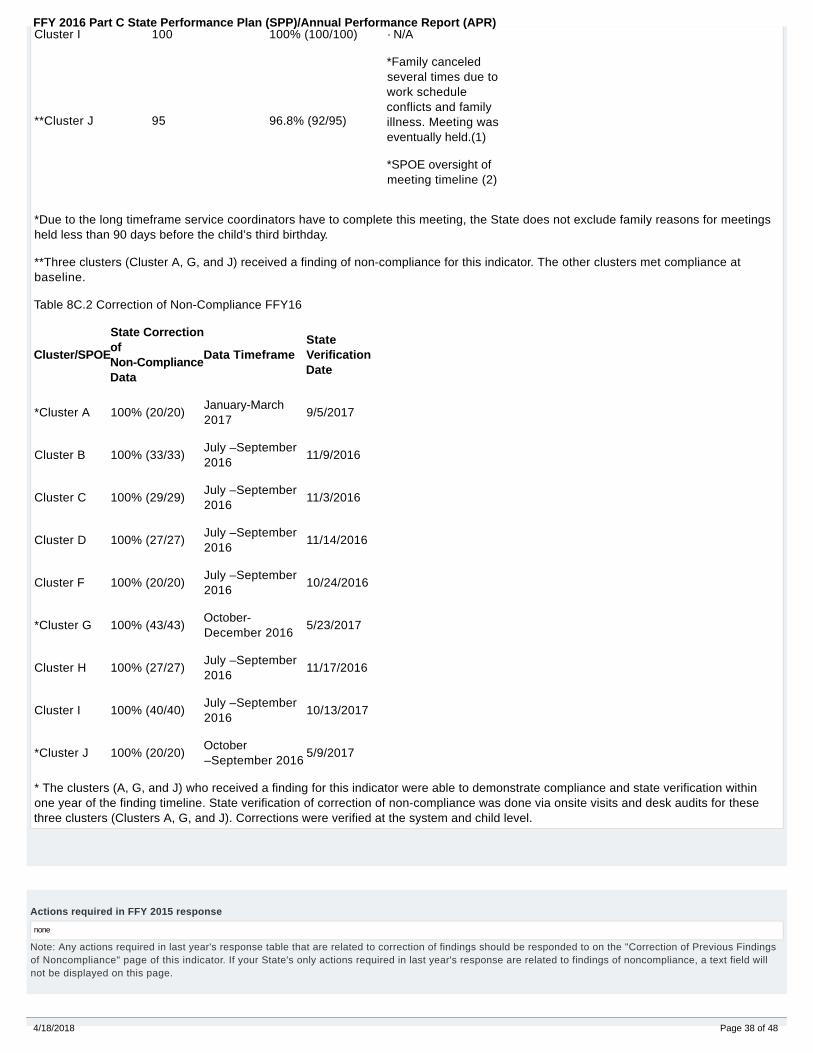
Cluster I 100 100% (100/100) · N/A
**Cluster J 95 96.8% (92/95)
*Family canceledseveral times due towork scheduleconflicts and familyillness. Meeting waseventually held.(1)
*SPOE oversight ofmeeting timeline (2)
*Due to the long timeframe service coordinators have to complete this meeting, the State does not exclude family reasons for meetingsheld less than 90 days before the child’s third birthday.
**Three clusters (Cluster A, G, and J) received a finding of non-compliance for this indicator. The other clusters met compliance atbaseline.
Table 8C.2 Correction of Non-Compliance FFY16
Cluster/SPOE
State CorrectionofNon-ComplianceData
Data TimeframeStateVerificationDate
*Cluster A 100% (20/20)January-March2017
9/5/2017
Cluster B 100% (33/33)July –September2016
11/9/2016
Cluster C 100% (29/29)July –September2016
11/3/2016
Cluster D 100% (27/27)July –September2016
11/14/2016
Cluster F 100% (20/20)July –September2016
10/24/2016
*Cluster G 100% (43/43)October-December 2016
5/23/2017
Cluster H 100% (27/27)July –September2016
11/17/2016
Cluster I 100% (40/40)July –September2016
10/13/2017
*Cluster J 100% (20/20)October–September 2016
5/9/2017
* The clusters (A, G, and J) who received a finding for this indicator were able to demonstrate compliance and state verification withinone year of the finding timeline. State verification of correction of non-compliance was done via onsite visits and desk audits for thesethree clusters (Clusters A, G, and J). Corrections were verified at the system and child level.
Actions required in FFY 2015 response
none
Note: Any actions required in last year's response table that are related to correction of findings should be responded to on the "Correction of Previous Findingsof Noncompliance" page of this indicator. If your State's only actions required in last year's response are related to findings of noncompliance, a text field willnot be displayed on this page.
FFY 2016 Part C State Performance Plan (SPP)/Annual Performance Report (APR)
4/18/2018 Page 38 of 48
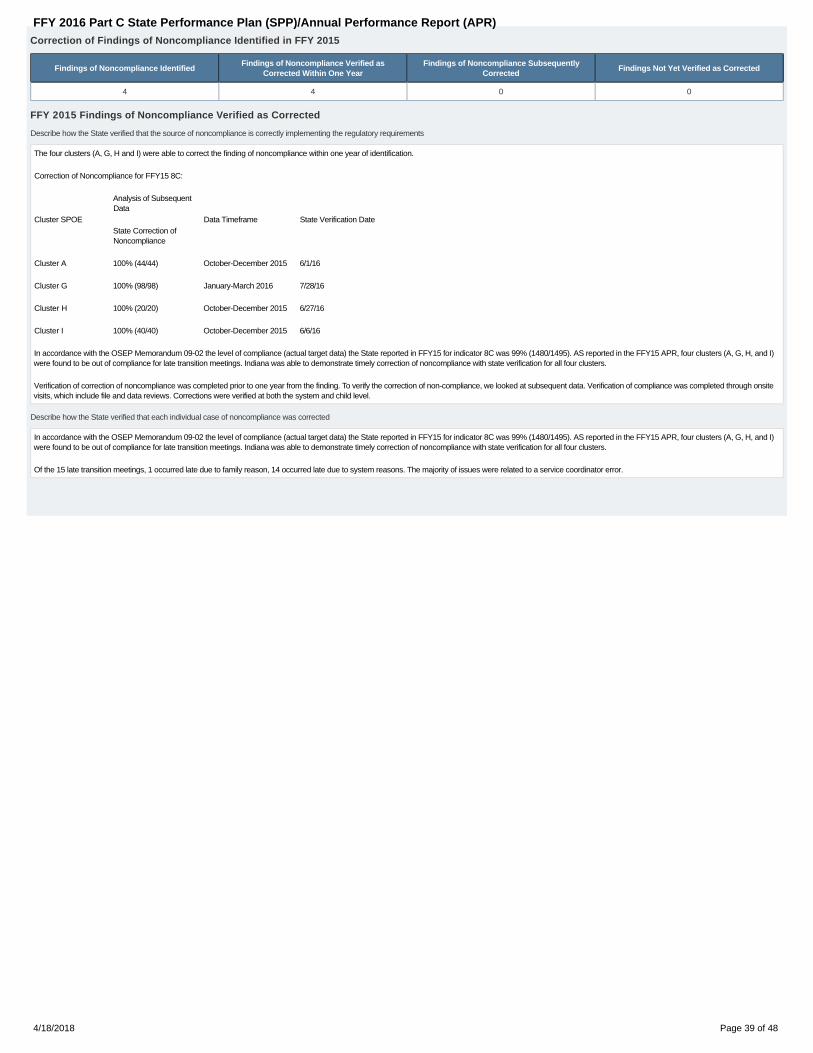
Correction of Findings of Noncompliance Identified in FFY 2015
Findings of Noncompliance IdentifiedFindings of Noncompliance Verified as
Corrected Within One YearFindings of Noncompliance Subsequently
CorrectedFindings Not Yet Verified as Corrected
4 4 0 0
FFY 2015 Findings of Noncompliance Verified as Corrected
Describe how the State verified that the source of noncompliance is correctly implementing the regulatory requirements
The four clusters (A, G, H and I) were able to correct the finding of noncompliance within one year of identification.
Correction of Noncompliance for FFY15 8C:
Cluster SPOE
Analysis of SubsequentData
State Correction ofNoncompliance
Data Timeframe State Verification Date
Cluster A 100% (44/44) October-December 2015 6/1/16
Cluster G 100% (98/98) January-March 2016 7/28/16
Cluster H 100% (20/20) October-December 2015 6/27/16
Cluster I 100% (40/40) October-December 2015 6/6/16
In accordance with the OSEP Memorandum 09-02 the level of compliance (actual target data) the State reported in FFY15 for indicator 8C was 99% (1480/1495). AS reported in the FFY15 APR, four clusters (A, G, H, and I)were found to be out of compliance for late transition meetings. Indiana was able to demonstrate timely correction of noncompliance with state verification for all four clusters.
Verification of correction of noncompliance was completed prior to one year from the finding. To verify the correction of non-compliance, we looked at subsequent data. Verification of compliance was completed through onsitevisits, which include file and data reviews. Corrections were verified at both the system and child level.
Describe how the State verified that each individual case of noncompliance was corrected
In accordance with the OSEP Memorandum 09-02 the level of compliance (actual target data) the State reported in FFY15 for indicator 8C was 99% (1480/1495). AS reported in the FFY15 APR, four clusters (A, G, H, and I)were found to be out of compliance for late transition meetings. Indiana was able to demonstrate timely correction of noncompliance with state verification for all four clusters.
Of the 15 late transition meetings, 1 occurred late due to family reason, 14 occurred late due to system reasons. The majority of issues were related to a service coordinator error.
FFY 2016 Part C State Performance Plan (SPP)/Annual Performance Report (APR)
4/18/2018 Page 39 of 48

Indicator 9: Resolution Sessions
Baseline Data:
Monitoring Priority: Effective General Supervision Part C / General Supervision
Results indicator: Percent of hearing requests that went to resolution sessions that were resolved through resolution session settlement agreements (applicable if Part B due process procedures undersection 615 of the IDEA are adopted).
(20 U.S.C. 1416(a)(3)(B) and 1442)
Historical Data
FFY 2004 2005 2006 2007 2008 2009 2010 2011 2012 2013 2014
Target ≥
Data
FFY 2015
Target ≥
Data
Key: Gray – Data Prior to Baseline Yellow – Baseline Blue – Data Update
FFY 2016 - FFY 2018 Targets
FFY 2016 2017 2018
Target ≥
Key:
Targets: Description of Stakeholder Input - Please see the Stakeholder Involvement section of the introduction.
Enter additional information about stakeholder involvement
Prepopulated Data
Source Date Description Data Overwrite Data
SY 2016-17 EMAPS IDEA Part C DisputeResolution Survey; Section C: Due
Process Complaints11/1/2017 3.1(a) Number resolution sessions resolved through settlement agreements n null
SY 2016-17 EMAPS IDEA Part C DisputeResolution Survey; Section C: Due
Process Complaints11/1/2017 3.1 Number of resolution sessions n null
FFY 2016 SPP/APR Data3.1(a) Number resolution sessions resolved
through settlement agreements3.1 Number of resolution sessions
FFY 2015Data*
FFY 2016 Target*FFY 2016
Data
0 0 0%
Provide additional information about this indicator (optional)
This indicator is not applicable, as Indiana has not adopted Part B due process hearing procedures.
Indiana has not set targets for this indicator, as the state has not adopted the Part B due process hearing procedures under 34 CFR § 303.420.
Actions required in FFY 2015 response
none
FFY 2016 Part C State Performance Plan (SPP)/Annual Performance Report (APR)
4/18/2018 Page 40 of 48

Indicator 10: Mediation
Baseline Data: 2005
Monitoring Priority: Effective General Supervision Part C / General Supervision
Results indicator: Percent of mediations held that resulted in mediation agreements.
(20 U.S.C. 1416(a)(3)(B) and 1442)
Historical Data
FFY 2004 2005 2006 2007 2008 2009 2010 2011 2012 2013 2014
Target ≥
Data
FFY 2015
Target ≥
Data 0%
Key: Gray – Data Prior to Baseline Yellow – Baseline Blue – Data Update
FFY 2016 - FFY 2018 Targets
FFY 2016 2017 2018
Target ≥
Key:
Targets: Description of Stakeholder Input - Please see the Stakeholder Involvement section of the introduction.
Enter additional information about stakeholder involvement
Prepopulated Data
Source Date Description Data Overwrite Data
SY 2016-17 EMAPS IDEA Part C DisputeResolution Survey; Section B: Mediation
Requests11/1/2017 2.1.a.i Mediations agreements related to due process complaints n null
SY 2016-17 EMAPS IDEA Part C DisputeResolution Survey; Section B: Mediation
Requests11/1/2017 2.1.b.i Mediations agreements not related to due process complaints n null
SY 2016-17 EMAPS IDEA Part C DisputeResolution Survey; Section B: Mediation
Requests11/1/2017 2.1 Mediations held n null
FFY 2016 SPP/APR Data2.1.a.i Mediations agreements
related to due process complaints2.1.b.i Mediations agreements notrelated to due process complaints
2.1 Mediations heldFFY 2015
Data*FFY 2016 Target*
FFY 2016Data
0 0 0 0%
Provide additional information about this indicator (optional)
Indiana has not set targets for this indicator, as it has not met the minimum threshold of 10 mediation requests.
Indiana Part C assigns a state staff member (complaint investigator) from the Bureau of Child Development Services to monitor andresolve complaint and hearing requests. A complaint and hearing log is maintained at the State level. Indiana, through the Division ofDisability and Rehabilitative Services- Bureau of Child Development Services, also maintains a contract with a special educationattorney. This attorney provides the Part C staff with assistance in the development and implementation of policies and proceduresregarding due process, complaints, meditations and hearings.
FFY 2016 Part C State Performance Plan (SPP)/Annual Performance Report (APR)
4/18/2018 Page 41 of 48

Actions required in FFY 2015 response
none
FFY 2016 Part C State Performance Plan (SPP)/Annual Performance Report (APR)
4/18/2018 Page 42 of 48

Indicator 11: State Systemic Improvement Plan
Monitoring Priority: General Supervision
Results indicator: The State’s SPP/APR includes a State Systemic Improvement Plan (SSIP) that meets the requirements set forth for this indicator.
FFY 2016 Part C State Performance Plan (SPP)/Annual Performance Report (APR)
4/18/2018 Page 43 of 48

Baseline Data: 2013
Reported Data
FFY 2013 2014 2015 2016
Target 52.00% 52.00% 53.00%
Data 52.00% 53.88%
Key: Gray – Data Prior to Baseline Yellow – Baseline
Blue – Data Update
FFY 2017 - FFY 2018 Targets
FFY 2017 2018
Target 54.00% 55.00%
Key:
Description of Measure
Outcome:
A. Positive social-emotional skills (including social relationships);
1. Percent of infants and toddlers who did not improve functioning ={(# of infants and toddlers who did not improve functioning) dividedby (# of infants and toddlers with IFSPs assessed)] times 100.
2. Percent of infants and toddlers who improved functioning but not sufficient to move nearer to functioning comparable to same-agedpeers =[(# of infants and toddlers who improved functioning but not sufficient to move nearer to functioning comparable to same agedpeers) divided by (# of infants and toddlers with IFSPs assessed)] times 100.
3. Percent of infants and toddlers who improved functioning to a level nearer to same-aged peers but did not reach it = [(#of infants andtoddlers who improved functioning to a level nearer to same-aged peers but did not reach it) divided by (# of infants and toddlers withIFSPs assessed)] times 100.
4. Percent of infants and toddlers who improved functioning to reach a level comparable to same-aged peers =[(# of infants and toddlerswho improved functioning to reach a level comparable to same-aged peers) divided by (# of infants and toddlers with IFSPs assessed)]times 100.
5. Percent of infants and toddlers who maintained functioning at a level comparable to same-aged peers =[(# of infants and toddlerswho maintained functioning at a level comparable to same-aged peers) divided by (# of infants and toddlers with IFSPs assessed)]times 100.
Summary Statements for Outcome A:
Summary Statement 1: Of those infants and toddlers who entered or exited early intervention below age expectations in each Outcome,the percent who substantially increased their rate of growth by the time they turned 3 years of age or exited the program.
Measurement for Summary Statement 1:
Percent= # of infants and toddlers reported in progress category (c) plus # of infants and toddlers reported in category (d) divided by [# ofinfants and toddlers reported in progress category (a) plus # of infants and toddlers reported in progress category (b) plus # of infantsand toddlers reported in progress category (c) plus # of infants and toddlers reported in progress category (d)] times 100.
Targets: Description of Stakeholder Input - Please see the Stakeholder Involvement section of the introduction.
Enter additional information about stakeholder involvement
Overview
Indiana's SSIP is in the attachment below.
Data Analysis
FFY 2016 Part C State Performance Plan (SPP)/Annual Performance Report (APR)
4/18/2018 Page 44 of 48

A description of how the State identified and analyzed key data, including data from SPP/APR indicators, 618 data collections, and other available data as applicable, to: (1) select the State-identified Measurable Result(s) forInfants and Toddlers with Disabilities and their Families, and (2) identify root causes contributing to low performance. The description must include information about how the data were disaggregated by multiple variables (e.g.,EIS program and/or EIS provider, geographic region, race/ethnicity, socioeconomic status, gender, etc.) As part of its data analysis, the State should also consider compliance data and whether those data present potentialbarriers to improvement. In addition, if the State identifies any concerns about the quality of the data, the description must include how the State will address these concerns. Finally, if additional data are needed, the descriptionshould include the methods and timelines to collect and analyze the additional data.
SSIP Phase I is located on the state profile page. No changes have been made to Phase I.
Analysis of State Infrastructure to Support Improvement and Build Capacity
A description of how the State analyzed the capacity of its current infrastructure to support improvement and build capacity in EIS programs and/or EIS providers to implement, scale up, and sustain the use of evidence-basedpractices to improve results for infants and toddlers with disabilities and their families. State systems that make up its infrastructure include, at a minimum: governance, fiscal, quality standards, professional development, data,technical assistance, and accountability/monitoring. The description must include current strengths of the systems, the extent the systems are coordinated, and areas for improvement of functioning within and across the systems.The State must also identify current State-level improvement plans and other early learning initiatives, such as Race to the Top-Early Learning Challenge and the Home Visiting program and describe the extent that these newinitiatives are aligned, and how they are, or could be, integrated with, the SSIP. Finally, the State should identify representatives (e.g., offices, agencies, positions, individuals, and other stakeholders) that were involved indeveloping Phase I of the SSIP and that will be involved in developing and implementing Phase II of the SSIP.
SSIP Phase I is located on the state profile page. No changes have been made to Phase I.
State-identified Measurable Result(s) for Infants and Toddlers with Disabilities and Their FamiliesA statement of the result(s) the State intends to achieve through the implementation of the SSIP. The State-identified Measurable Result(s) for Infants and Toddlers with Disabilities and their Families must be aligned to anSPP/APR indicator or a component of an SPP/APR indicator. The State-identified Measurable Result(s) for Infants and Toddlers with Disabilities and their Families must be clearly based on the Data and State InfrastructureAnalyses and must be a child- or family-level outcome in contrast to a process outcome. The State may select a single result (e.g., increase the rate of growth in infants and toddlers demonstrating positive social-emotionalskills) or a cluster of related results (e.g., increase the percentage reported under child outcome B under Indicator 3 of the SPP/APR (knowledge and skills) and increase the percentage trend reported for families underIndicator 4 (helping their child develop and learn)).
Statement
SSIP Phase I is located on the state profile page. No changes have been made to Phase I.
Description
Selection of Coherent Improvement Strategies
An explanation of how the improvement strategies were selected, and why they are sound, logical and aligned, and will lead to a measurable improvement in the State-identified Measurable Result(s) for Infants and Toddlers withDisabilities and their Families. The improvement strategies should include the strategies, identified through the Data and State Infrastructure Analyses, that are needed to improve the State infrastructure and to support EISprogram and/or EIS provider implementation of evidence-based practices to improve the State-identified result(s) for infants and toddlers with disabilities and their families. The State must describe how implementation of theimprovement strategies will address identified root causes for low performance and ultimately build EIS program and/or EIS provider capacity to achieve the State-identified Measurable Result(s) for Infants and Toddlers withDisabilities and their Families.
Please see attachment.
Theory of Action
A graphic illustration that shows the rationale of how implementing the coherent set of improvement strategies selected will increase the State’s capacity to lead meaningful change in EIS programs and/or EIS providers, andachieve improvement in the State-identified Measurable Result(s) for Infants and Toddlers with Disabilities and their Families.
Submitted Theory of Action: No Theory of Action Submitted
Provide a description of the provided graphic illustration (optional)
Infrastructure Development
(a) Specify improvements that will be made to the State infrastructure to better support EIS programs and providers to implement and scale up EBPs to improve results for infants and toddlers with disabilities and their families.(b) Identify the steps the State will take to further align and leverage current improvement plans and other early learning initiatives and programs in the State, including Race to the Top-Early Learning Challenge, Home VisitingProgram, Early Head Start and others which impact infants and toddlers with disabilities and their families.(c) Identify who will be in charge of implementing the changes to infrastructure, resources needed, expected outcomes, and timelines for completing improvement efforts.(d) Specify how the State will involve multiple offices within the State Lead Agency, as well as other State agencies and stakeholders in the improvement of its infrastructure.
FFY 2016 Part C State Performance Plan (SPP)/Annual Performance Report (APR)
4/18/2018 Page 45 of 48

Support for EIS programs and providers Implementation of Evidence-Based Practices
(a) Specify how the State will support EIS providers in implementing the evidence-based practices that will result in changes in Lead Agency, EIS program, and EIS provider practices to achieve the SIMR(s) for infants andtoddlers with disabilities and their families.(b) Identify steps and specific activities needed to implement the coherent improvement strategies, including communication strategies and stakeholder involvement; how identified barriers will be addressed; who will be in chargeof implementing; how the activities will be implemented with fidelity; the resources that will be used to implement them; and timelines for completion.(c) Specify how the State will involve multiple offices within the Lead Agency (and other State agencies such as the SEA) to support EIS providers in scaling up and sustaining the implementation of the evidence-based practicesonce they have been implemented with fidelity.
Evaluation
(a) Specify how the evaluation is aligned to the theory of action and other components of the SSIP and the extent to which it includes short-term and long-term objectives to measure implementation of the SSIP and its impact onachieving measurable improvement in SIMR(s) for infants and toddlers with disabilities and their families.(b) Specify how the evaluation includes stakeholders and how information from the evaluation will be disseminated to stakeholders.(c) Specify the methods that the State will use to collect and analyze data to evaluate implementation and outcomes of the SSIP and the progress toward achieving intended improvements in the SIMR(s).(d) Specify how the State will use the evaluation data to examine the effectiveness of the implementation; assess the State’s progress toward achieving intended improvements; and to make modifications to the SSIP as necessary.
Technical Assistance and Support
Describe the support the State needs to develop and implement an effective SSIP. Areas to consider include: Infrastructure development; Support for EIS programs and providers implementation of EBP; Evaluation; andStakeholder involvement in Phase II.
Phase III submissions should include:
• Data-based justifications for any changes in implementation activities.• Data to support that the State is on the right path, if no adjustments are being proposed.• Descriptions of how stakeholders have been involved, including in decision-making.
A. Summary of Phase 3
1. Theory of action or logic model for the SSIP, including the SiMR.2. The coherent improvement strategies or principle activities employed during the year, including infrastructure improvement strategies.3. The specific evidence-based practices that have been implemented to date.4. Brief overview of the year’s evaluation activities, measures, and outcomes.5. Highlights of changes to implementation and improvement strategies.
Please see attached.
B. Progress in Implementing the SSIP
1. Description of the State’s SSIP implementation progress: (a) Description of extent to which the State has carried out its planned activities with fidelity—what has been accomplished, what milestones have been met, andwhether the intended timeline has been followed and (b) Intended outputs that have been accomplished as a result of the implementation activities.2. Stakeholder involvement in SSIP implementation: (a) How stakeholders have been informed of the ongoing implementation of the SSIP and (b) How stakeholders have had a voice and been involved in decision-makingregarding the ongoing implementation of the SSIP.
Please see attached.
C. Data on Implementation and Outcomes
1. How the State monitored and measured outputs to assess the effectiveness of the implementation plan: (a) How evaluation measures align with the theory of action, (b) Data sources for each key measure, (c) Description ofbaseline data for key measures, (d) Data collection procedures and associated timelines, (e) [If applicable] Sampling procedures, (f) [If appropriate] Planned data comparisons, and (g) How data management and data analysisprocedures allow for assessment of progress toward achieving intended improvements2. How the State has demonstrated progress and made modifications to the SSIP as necessary: (a) How the State has reviewed key data that provide evidence regarding progress toward achieving intended improvements toinfrastructure and the SiMR, (b) Evidence of change to baseline data for key measures, (c) How data support changes that have been made to implementation and improvement strategies, (d) How data are informing next stepsin the SSIP implementation, and (e) How data support planned modifications to intended outcomes (including the SIMR)—rationale or justification for the changes or how data support that the SSIP is on the right path3. Stakeholder involvement in the SSIP evaluation: (a) How stakeholders have been informed of the ongoing evaluation of the SSIP and (b) How stakeholders have had a voice and been involved in decision-making regarding theongoing evaluation of the SSIP
Please see attached.
D. Data Quality Issues: Data limitations that affected reports of progress in implementing the SSIP and achieving the SIMR
1. Concern or limitations related to the quality or quantity of the data used to report progress or results2. Implications for assessing progress or results3. Plans for improving data quality
Please see attached.
FFY 2016 Part C State Performance Plan (SPP)/Annual Performance Report (APR)
4/18/2018 Page 46 of 48

E. Progress Toward Achieving Intended Improvements
1. Infrastructure changes that support SSIP initiatives, including how system changes support achievement of the SiMR, sustainability, and scale-up2. Evidence that SSIP’s evidence-based practices are being carried out with fidelity and having the desired effects3. Outcomes regarding progress toward short-term and long-term objectives that are necessary steps toward achieving the SIMR4. Measurable improvements in the SIMR in relation to targets
Please see attached.
F. Plans for Next Year
1. Additional activities to be implemented next year, with timeline2. Planned evaluation activities including data collection, measures, and expected outcomes3. Anticipated barriers and steps to address those barriers4. The State describes any needs for additional support and/or technical assistance
Please see attached.
FFY 2016 Part C State Performance Plan (SPP)/Annual Performance Report (APR)
4/18/2018 Page 47 of 48
Certify and Submit your SPP/APR
Name: Christina Commons
Title: Part C Director
Email: [email protected]
Phone: 317-234-1142
I certify that I am the Director of the State's Lead Agency under Part C of the IDEA, or his or her designee, and that the State's submission of its IDEA Part C State PerformancePlan/Annual Performance Report is accurate.
Selected: Lead Agency Director
Name and title of the individual certifying the accuracy of the State's submission of its IDEA Part C State Performance Plan/Annual Performance Report.
IntroductionIndicator 1Indicator 2Indicator 3Indicator 4Indicator 5Indicator 6Indicator 7Indicator 8Indicator 8AIndicator 8BIndicator 8CIndicator 9Indicator 10Indicator 11
FFY 2016 Part C State Performance Plan (SPP)/Annual Performance Report (APR)
4/18/2018 Page 48 of 48