カチオン性脂質とdnaからなる遺伝子導入剤の構造...
TRANSCRIPT

カチオン性脂質とDNAからなる遺伝子導入剤の構造と機能の相関カチオン性脂質とDNAからなる遺伝子導入剤の構造と機能の相関
北九州市立大学 櫻井和朗

Background & AimsBackground & Aims
• Millions of biologically functional molecules have been synthesized or discovered from nature. Most of them turns out useless as drugs in practical sense, because of high toxicity.
• Necessary for a good vehicle to transport the molecules to their target, which is called Drug Delivery System (DDS) .
• In-situ structural characterization of DDS particles is a challenging p g gissue, owing to ultra-dilution and small amount.– Generally, 0.1-10 mg/mL (0.01-1 %)
Conventional SAXS set up:• Conventional SAXS set-up: – Need of high concentration Dens Packing effect– Low concentrationLow S/NLow concentration Low S/N
• We go to Synchrotron SAXS witha newly designed vacuum chamber.
e)2 0.8
1.0 Dens packing effect for thehard core potential.
(q)/N
(V s
pher
e
0.4
0.6 <n>=2 vol%5%
8%I(
qR1 2 3 4
0.2
00
8%
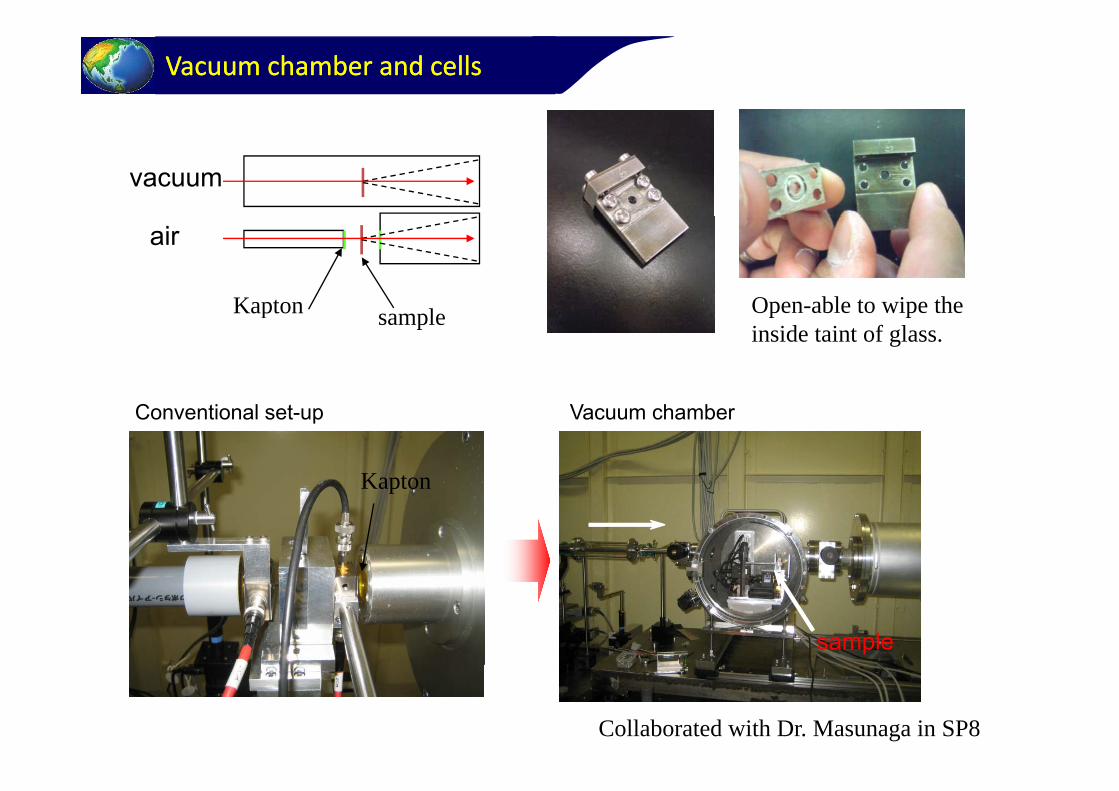
Vacuum chamber and cells Vacuum chamber and cells
vacuum
air
Kapton Open able to wipe theKapton sample Open-able to wipe the inside taint of glass.
Conventional set-up Vacuum chamber
KaptonKapton
sample
Collaborated with Dr. Masunaga in SP8

Performance of the new setPerformance of the new set‐‐upup
Empty cell-S/N 10-100 times.-Low BG at high q.N k f th k t i d-No peaks from the kapton window
-Low noise around beam stopper
10Au particle10 nm
104
8
6
TRX+DLPC+pDNA
vacuum
10 nm
102
u.) .) 6
4
vacuum
100I(q) (
a.u
I(q) (
a.u
C×2
2air
Kaptonair
10-2
vacuum
airKapton
04.03.02.01.0
q -1 / nm5.00.01 0.1 1
q / nm -1
10 2

Materials: DDS vehiclesMaterials: DDS vehicles
Polymeric micelle DDSfor hydrophobic drug delivery
Lipoplex DDS for gene therapy
Amphipathic blockcopolymer Cationic lipids + amphisbaena lipidsAmphipathic blockcopolymer
+Hydrophobic Drug
Cationic lipids amphisbaena lipids
+pDNA
Hydrophobic Drug
-100-500 nm
Drug
Drug
DNA
DNA-templated highly ordered structure Core-shell10-100 nm

PEGPEG‐‐Poly(Asp,Bzl) MicellePoly(Asp,Bzl) MicelleCollaborating with Prof. YokoyamaKIST
CH3 O CH2CH2O CH2 NH COCHNH COCH2CHNH H117 3 0 25 0 75 24
Di‐Block Copolymer KIST
CH2COOR COOR117 3 0.25 0.75 24
PEG-P(Asp Bzl)
Drug
R = H (27.4 %) or CH2 (82.6 %)
LE540Drug
N
COOHLE540
NH3C
Neuroblastoma: Pre-incubation of SH-SY5Y human neuroblastoma cells with either RAR-pan-antagonist p gLE540 or MAP kinase kinase 1 (MEK-1) inhibitor PD98059.Breast Neoplasms (Breast Cancer) In ZR-75-1 human breast cancer cells, cotreatment of LE135 and LE540 with all-trans-RA inhibited all-trans-RA-induced apoptosis.

SAXS from LE540 loaded PEGSAXS from LE540 loaded PEG‐‐bb‐‐P(Asp,Bzl)P(Asp,Bzl)SPring-8, 40 B2
1000LE540 (wt% per Polymer)
30Low q region Middle&high q region
100
01.43.05.88 3
25 From P-Asp helix
10
8.3
20 Loading0 wt%
(a.u
.)
LE540LE540
1
15
10
1.4 wt%
3 0 wt%
I(q)
0.1
10
5
3.0 wt%
5.8 wt%
LE540Stacking(?)
0.017 8 90.1
2 3 4 5 6 7 8 91
2 3 0654321
8.3 wt%
q / nm-140B2, 6.25 mg/mL (0.625 wt%)Exposure 10 min, camera length: 1.5m
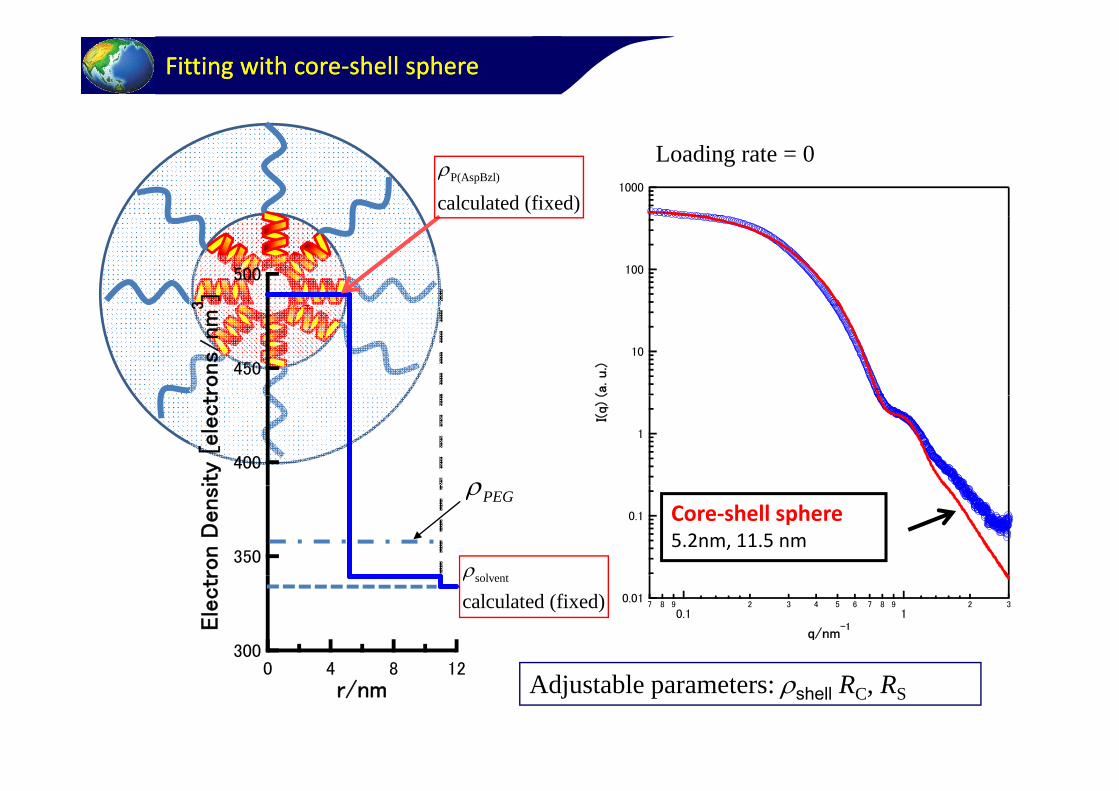
Fitting with coreFitting with core‐‐shell sphereshell sphere
1000P(AspBzl)
calculated (fixed)
Loading rate = 0
100500
3]
10
(a. u.)450
rons/
nm
3
1
I(q)
(
400
ity
[ele
ct
0.1 Core‐shell sphere
5.2nm, 11.5 nm350
ron D
ensi
l t
PEG
0.017 8 9
0.12 3 4 5 6 7 8 9
12 3
q/nm-1
300
Ele
ctr
12840
solvent
calculated (fixed)
12840r/nm Adjustable parameters: shell RC, RS
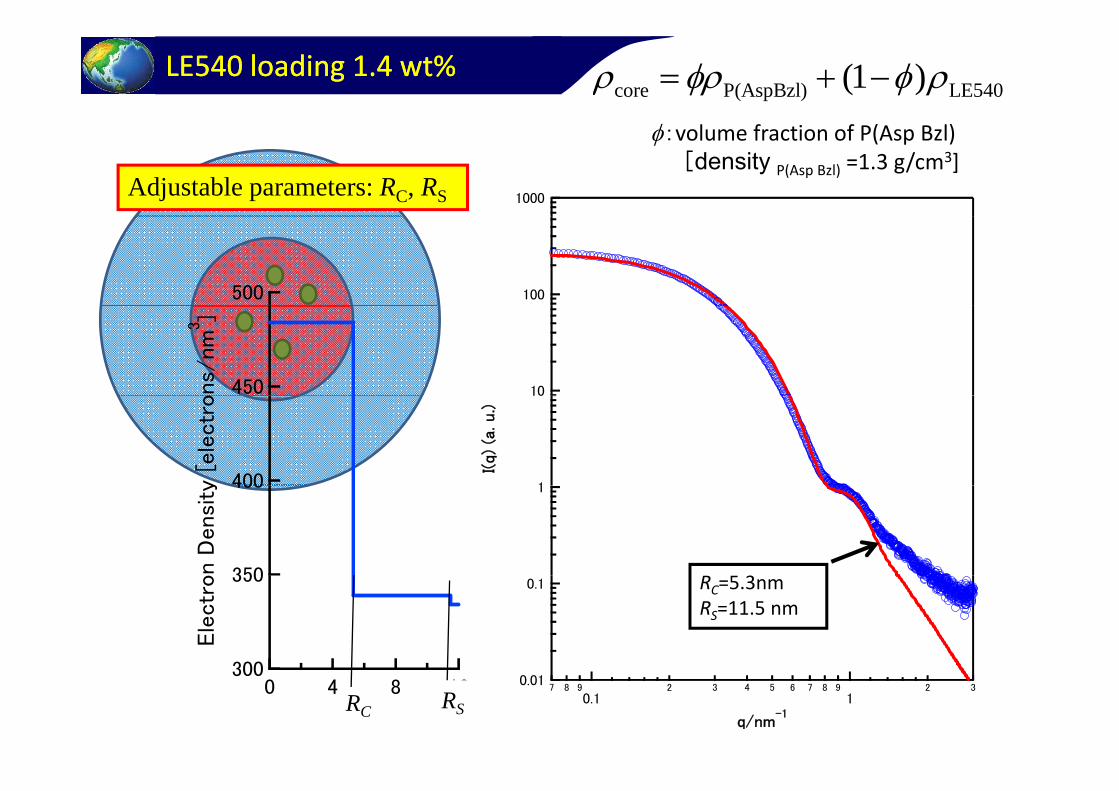
LE540 loading 1.4 wt%LE540 loading 1.4 wt%core P(AspBzl) LE540(1 )
l f i f P(A B l)
1000
:volume fraction of P(Asp Bzl)[density P(Asp Bzl) =1.3 g/cm3]
Adjustable parameters: RC, RS
100500
10450
ons/
nm
3]
1
10
I(q)
(a. u.)
400y [e
lectr
o
1400
350n D
ensi
ty
0.1350
300
Ele
ctr
o RC=5.3nmRS=11.5 nm
0.017 8 9
0.12 3 4 5 6 7 8 9
12 3
q/nm-1
30012840
r/nmRC RS
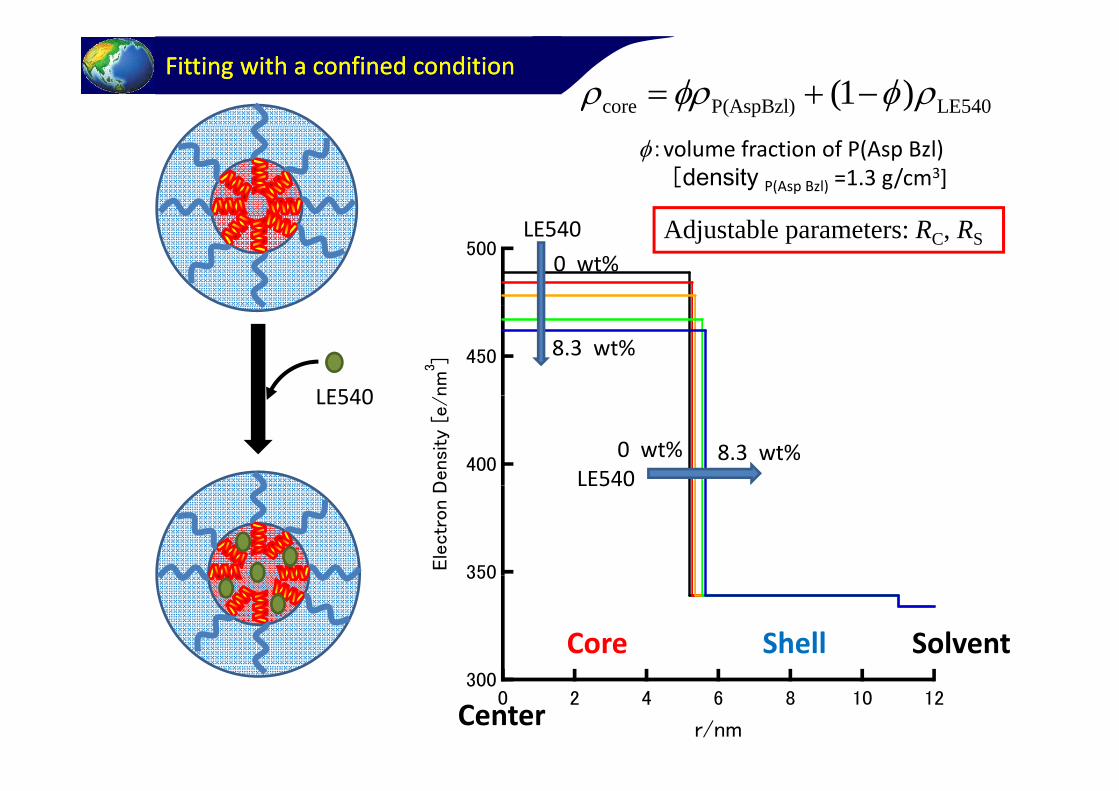
core P(AspBzl) LE540(1 ) Fitting with a confined conditionFitting with a confined condition
:volume fraction of P(Asp Bzl)[density P(Asp Bzl) =1.3 g/cm3]
500LE540
0 wt%Adjustable parameters: RC, RS
450
nm
3] 8.3 wt%
LE540
400D
ensi
ty [
e/
0 wt% 8.3 wt%LE540
LE540
350Ele
ctr
on D
LE540
350
Core Shell Solvent300
121086420
r/nmCenter
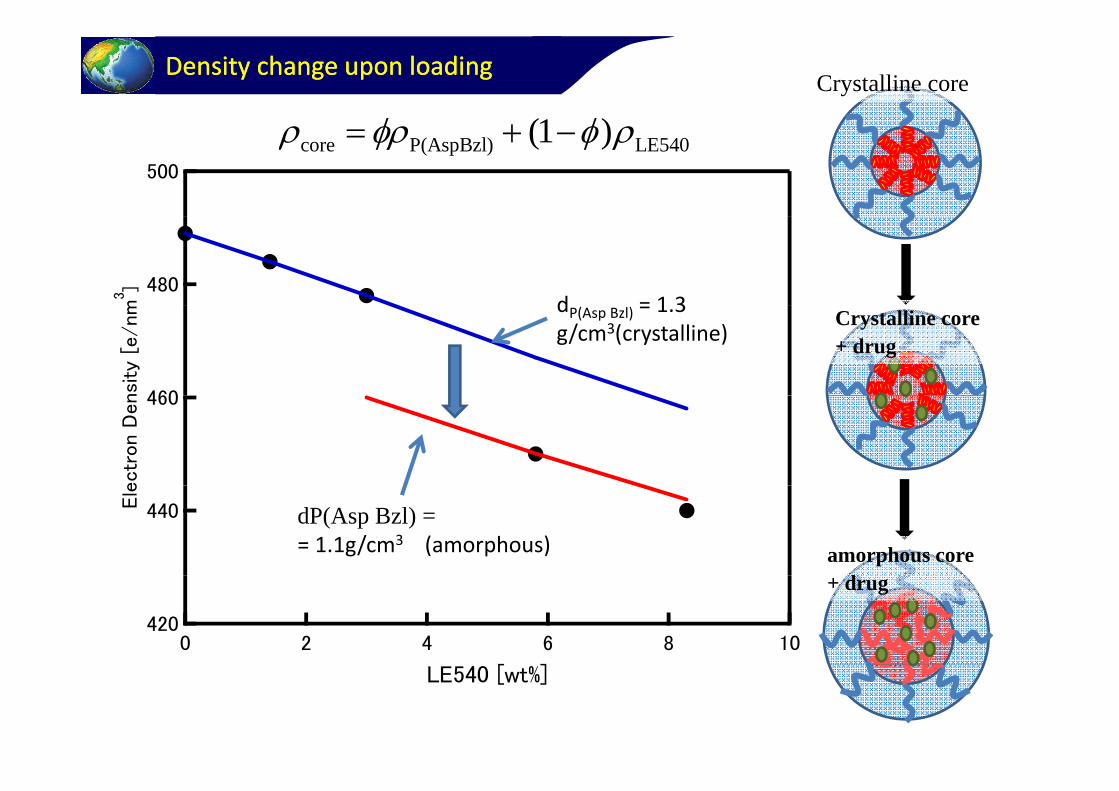
Density change upon loadingDensity change upon loading
(1 ) Crystalline core
500
core P(AspBzl) LE540(1 )
480
m3]
d = 1 3
460nsi
ty [
e/nm dP(Asp Bzl) = 1.3
g/cm3(crystalline)Crystalline core+ drug
460
ectr
on D
en
440Ele
dP(Asp Bzl) = = 1.1g/cm3 (amorphous) amorphous core
4201086420
[ ]
+ drug
LE540 [wt%]

Gene Carrier: pDNA/cationic lipid complexGene Carrier: pDNA/cationic lipid complex
O
OO
O
N
H+
DOTAP
OO
O
H
O
P
O
-O
ON
+
DOPC O
Safin a Science 2000 288 2035 2039Safinya, Science 2000 288, 2035-2039
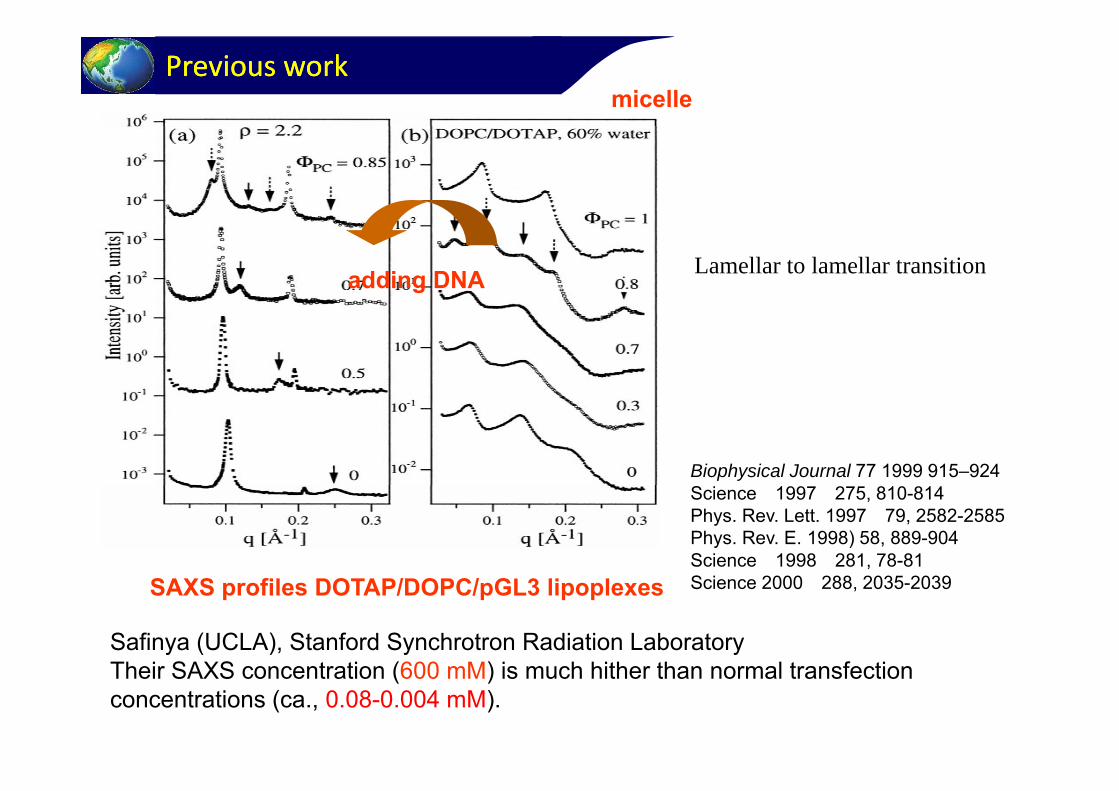
micelleLipoplexPrevious workPrevious work
adding DNA Lamellar to lamellar transition
Biophysical Journal 77 1999 915–924Science 1997 275, 810-814 Phys. Rev. Lett. 1997 79, 2582-2585 Phys. Rev. E. 1998) 58, 889-904 Science 1998 281, 78-81Science 2000 288, 2035-2039SAXS profiles DOTAP/DOPC/pGL3 lipoplexes
Safinya (UCLA), Stanford Synchrotron Radiation LaboratoryTh i SAXS t ti (600 M) i h hith th l t f tiTheir SAXS concentration (600 mM) is much hither than normal transfection concentrations (ca., 0.08-0.004 mM).

Concentration and structureConcentration and structure
In order to measure SAXS from ultra-dilute solutions (less than 1 wt%, hopefully 0.1 wt%), we need a strong synchrotron source and a cell & set-up with low BG and high S/N.with low BG and high S/N.
Transfection SAXS
SAXS:15‐30 mMTransfection:1-10×10-3 mM
(m
M)
α
t Con
c. (
β
Sal
t
Typical phase diagram for lipids. γ
δ
ε
Lipid Conc. (mM)

【micelle】q1 10 mM (0 5 wt%)
ReRe‐‐examination with the vacuum chamberexamination with the vacuum chamber
4
core-shell sphere【micelle】
0.9
1 8
q2q3 q4
10 mM (0.5 wt%)
102
103
104
2.95nm1.65nm
1.8
1.0N/P=2.7 3.6
100
101
10
/(a.u
)
core
shell2.21.2
10-2
10-1
10
I(q)/
【Lipoplex】
core-shell sphere
116.63.3
10-4
10-3
p p
lamellar structure with D = 7.0 nm micelle
core shell sphere model
5 6 7 8 91
2 3 4 5 6
q/nm-1
SAXS profiles of DOTAP/DOPC micelle and DOTAP/DOPC/pGL3 (5300 spherical micelleSAXS profiles of DOTAP/DOPC micelle and DOTAP/DOPC/pGL3 (5300 bp) lipoplex (10mM) as a function of N/P ratio. BL40B2, wavelength = 1Å, sample to detector = 0.7m, 3000 × 3000 IP, N/P ratio = nitrogen of DOTAP/ phosphate of DNA
spherical micelle↓
lamellar structure lipoplex
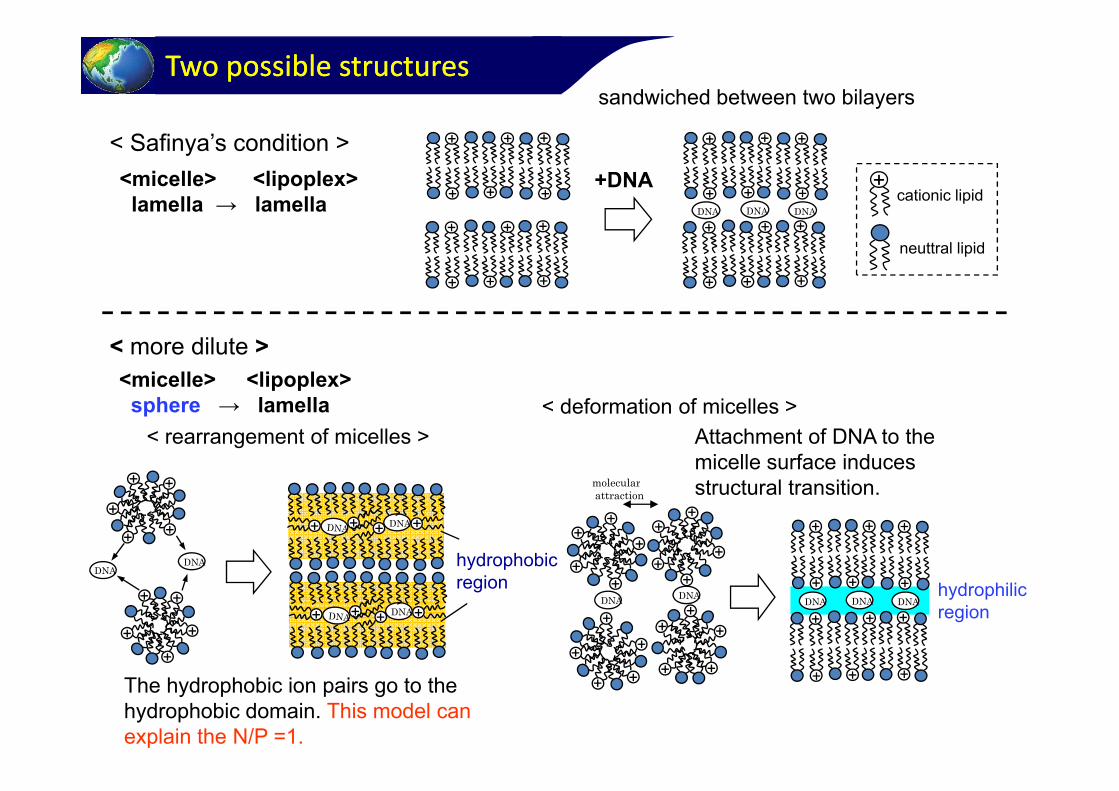
sandwiched between two bilayersTwo possible structuresTwo possible structures
<micelle> <lipoplex>lamella → lamella
+DNA< Safinya’s condition >
+cationic lipid
DNA DNA DNA
neuttral lipid
< more dilute ><micelle> <lipoplex>
< rearrangement of micelles >< deformation of micelles >
molecular
sphere → lamellaAttachment of DNA to the micelle surface induces structural transition
DNADNA
DNA
molecularattraction
hydrophobic
structural transition.
DNADNA DNA DNA DNA DNA
region hydrophilicregion
The hydrophobic ion pairs go to the hydrophobic domain. This model can explain the N/P =1.
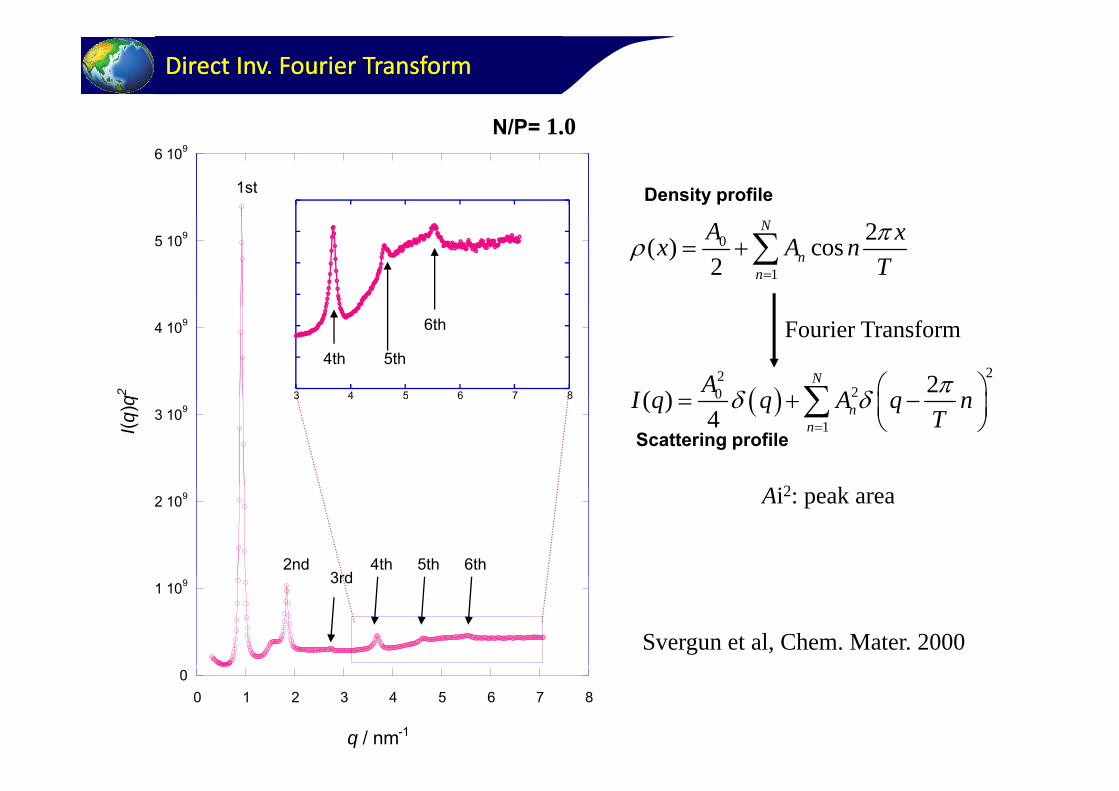
Direct Inv. Fourier TransformDirect Inv. Fourier Transform
N/P= 1 06 109
1st Density profile
N/P= 1.0
5 109 0
1
2( ) cos2
N
nn
A xx A nT
4 109
q2 3 4 5 6 7 8
4th 5th
6th
22
20 2( )NAI A
Fourier Transform
3 109
I(q)q
3 4 5 6 7 8 20
1
( )4 n
n
I q q A q nT
Scattering profile
22 109
2nd3rd
4th 5th 6th
Ai2: peak area
1 109 3rd
Svergun et al, Chem. Mater. 20000
0 1 2 3 4 5 6 7 8
q / nm-1
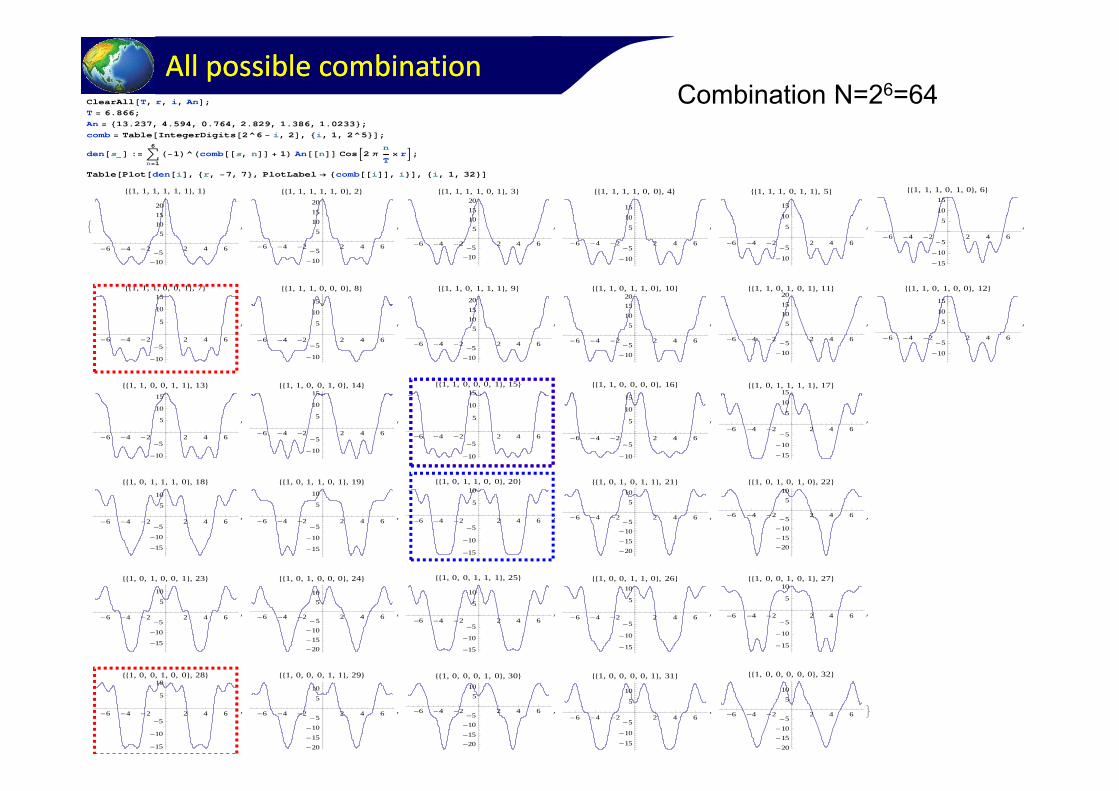
All possible combinationAll possible combinationClearAllT, r, i, An;T 6.866;An 13.237, 4.594, 0.764, 2.829, 1.386, 1.0233;
Combination N=26=64 3. 3 , .59 , 0. 6 , .8 9, .386, .0 33;
comb TableIntegerDigits2^6 i, 2, i, 1, 2^5;
dens : n1
61^combs, n 1AnnCos2
n
T r;
TablePlotdeni, r, 7, 7, PlotLabel combi, i, i, 1, 32
1520
1, 1, 1, 1, 1, 1, 1
1520
1, 1, 1, 1, 1, 0, 2
1520
1, 1, 1, 1, 0, 1, 3
1015
1, 1, 1, 1, 0, 0, 4
10
15
1, 1, 1, 0, 1, 1, 5
10
151, 1, 1, 0, 1, 0, 6
-6 -4 -2 2 4 6
-10-5
51015
,
-6 -4 -2 2 4 6
-10-5
510
,
-6 -4 -2 2 4 6
-10-5
510
,
-6 -4 -2 2 4 6
-10
-5
510
,
-6 -4 -2 2 4 6
-10
-5
5
10,
-6 -4 -2 2 4 6
-15
-10
-5
5,
151, 1, 1, 0, 0, 1, 7
15
1, 1, 1, 0, 0, 0, 820
1, 1, 0, 1, 1, 1, 9
1520
1, 1, 0, 1, 1, 0, 10
1520
1, 1, 0, 1, 0, 1, 1115
1, 1, 0, 1, 0, 0, 12
-6 -4 -2 2 4 6
-10
-5
5
10
,
-6 -4 -2 2 4 6
-10
-5
5
10
,
-6 -4 -2 2 4 6
-10-5
51015
,
-6 -4 -2 2 4 6
-10-5
51015
,
-6 -4 -2 2 4 6
-10-5
51015
,
-6 -4 -2 2 4 6
-10
-5
510
,
15
1, 1, 0, 0, 1, 1, 1315
1, 1, 0, 0, 1, 0, 1415
1, 1, 0, 0, 0, 1, 1515
1, 1, 0, 0, 0, 0, 1615
1, 0, 1, 1, 1, 1, 17
-6 -4 -2 2 4 6
-10
-5
5
10
15
,
-6 -4 -2 2 4 6
-10
-5
5
10
,
-6 -4 -2 2 4 6
-10
-5
5
10
,
-6 -4 -2 2 4 6
-10
-5
5
10
15
,-6 -4 -2 2 4 6
-15-10
-5
5
10
,
1, 0, 1, 1, 1, 0, 18 1, 0, 1, 1, 0, 1, 19 1, 0, 1, 1, 0, 0, 20 1, 0, 1, 0, 1, 1, 21 1, 0, 1, 0, 1, 0, 22
-6 -4 -2 2 4 6
-15
-10-5
5
10
, , , , , ,
,-6 -4 -2 2 4 6
-15
-10
-5
5
10
, , , , , ,
,-6 -4 -2 2 4 6
-15
-10
-5
5
10
, -6 -4 -2 2 4 6
-20-15-10-5
510
, , , , , ,
, -6 -4 -2 2 4 6
-20-15-10-5
510
, , , , , ,
,
1 0 0 1 1 1 25
-6 -4 -2 2 4 6
-15
-10-5
510
1, 0, 1, 0, 0, 1, 23
, -6 -4 -2 2 4 6
-20-15-10-5
510
1, 0, 1, 0, 0, 0, 24
,-6 -4 -2 2 4 6
-15
-10
-5
5
10
1, 0, 0, 1, 1, 1, 25
,-6 -4 -2 2 4 6
-15
-10
-5
5
101, 0, 0, 1, 1, 0, 26
, -6 -4 -2 2 4 6
-15
-10
-5
5
101, 0, 0, 1, 0, 1, 27
,
-6 -4 -2 2 4 6
-15
-10
-5
5
101, 0, 0, 1, 0, 0, 28
, -6 -4 -2 2 4 6
-20-15-10-5
510
1, 0, 0, 0, 1, 1, 29
, -6 -4 -2 2 4 6
-20-15-10-5
510
1, 0, 0, 0, 1, 0, 30
,-6 -4 -2 2 4 6
-15-10
-5
5
10
1, 0, 0, 0, 0, 1, 31
, -6 -4 -2 2 4 6
-20-15-10-5
510
1, 0, 0, 0, 0, 0, 32

The most possible structureThe most possible structure
DNA
2 nm
DNA
Cationic lipid Neutral lipid
+++
5
101.5 nm
r / nm-4 -2 2 4
5
-10
-5
DNA
++
+
+ + + + + +
-15DNA
DNA
DNA+ + + +++
+ +
6.86 nm
4.8 nm
+ ++
6 86
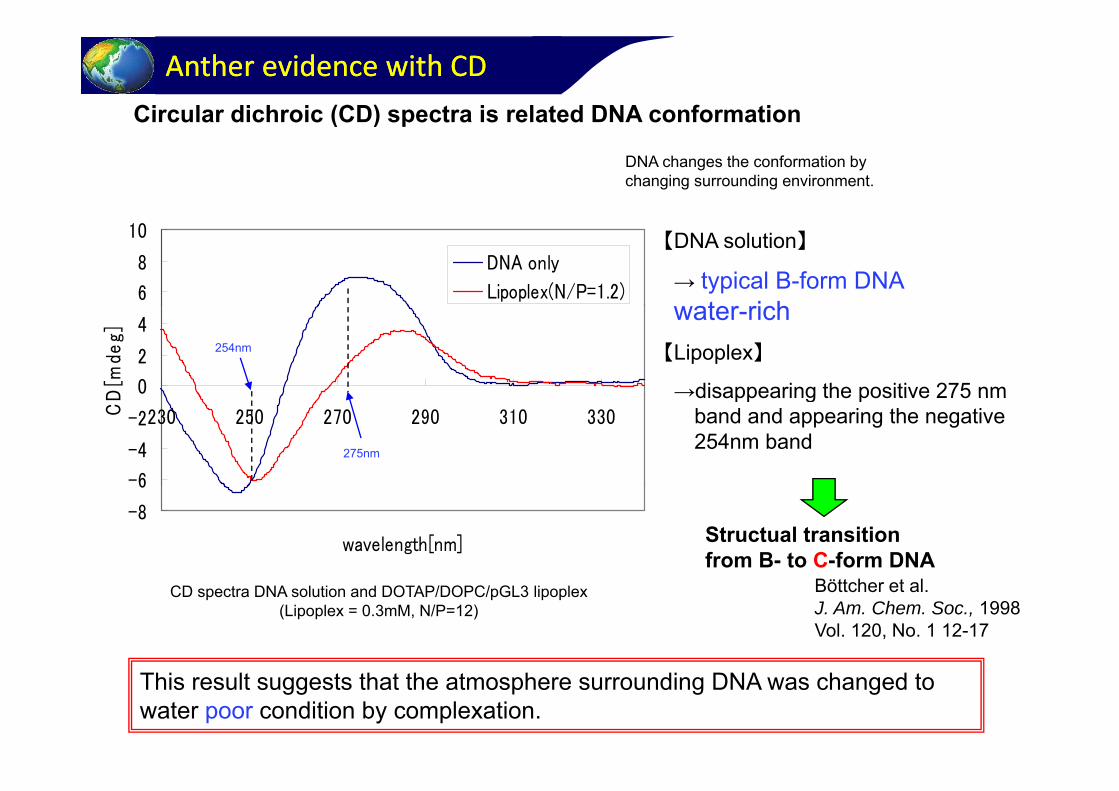
Circular dichroic (CD) spectra is related DNA conformation
Anther evidence with CD Anther evidence with CD
( ) p
DNA changes the conformation by changing surrounding environment.
6
8
10
DNA only
Lipoplex(N/P=1.2)
【DNA solution】
→ typical B-form DNAater rich
0
2
4
D[m
deg]
water-rich【Lipoplex】
→disappearing the positive 275 nm
254nm
-6
-4
-2230 250 270 290 310 330CD →disappearing the positive 275 nm
band and appearing the negative 254nm band
275nm
-8
6
wavelength[nm] Structual transition from B- to C-form DNA
CD spectra DNA solution and DOTAP/DOPC/pGL3 lipoplex(Lipoplex = 0.3mM, N/P=12)
Böttcher et al.J. Am. Chem. Soc., 1998Vol. 120, No. 1 12-17
This result suggests that the atmosphere surrounding DNA was changed to water poor condition by complexation.
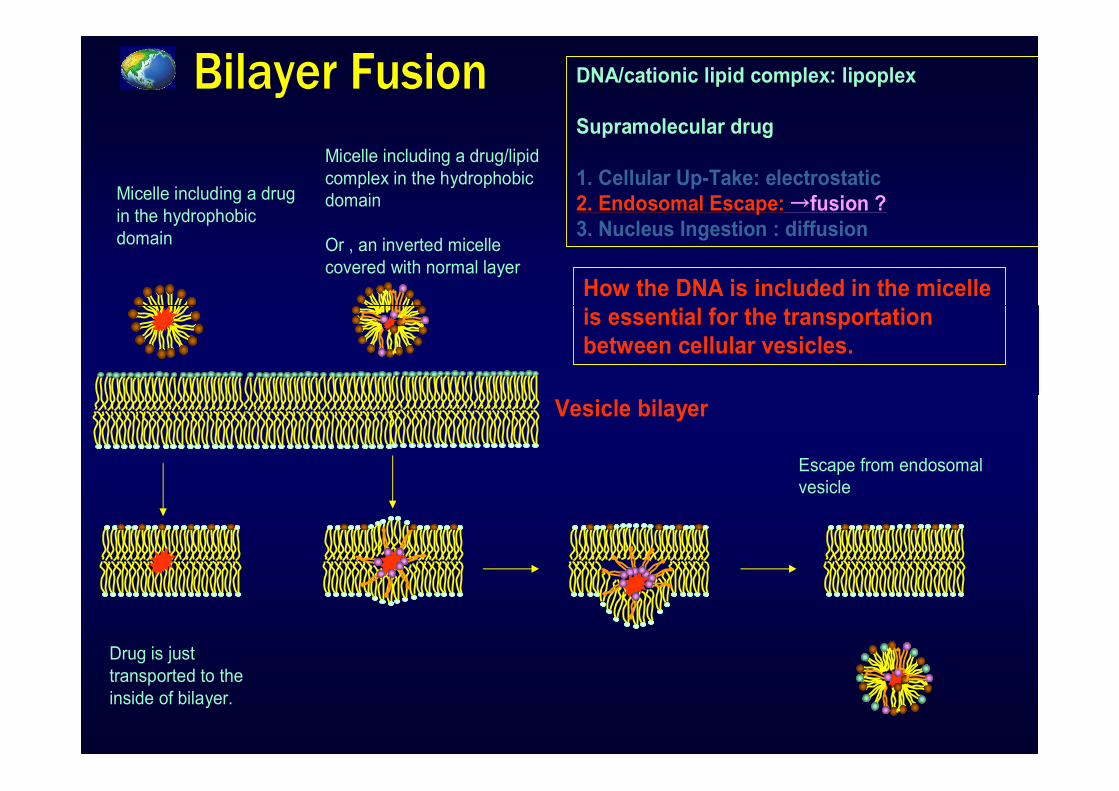
Bilayer FusionBilayer Fusion DNA/cationic lipid complex: lipoplex
Supramolecular drug
Bilayer Fusion DNA/cationic lipid complex: lipoplex
Supramolecular drugSupramolecular drug
1. Cellular Up-Take: electrostatic2. Endosomal Escape: →fusion ?Micelle including a
drug in the
Micelle including a drug/lipid complex in the hydrophobic domain
Supramolecular drug
1. Cellular Up-Take: electrostatic2. Endosomal Escape: →fusion ?Micelle including a drug
in the hydrophobic
Micelle including a drug/lipid complex in the hydrophobic domain
3. Nucleus Ingestion : diffusiondrug in the hydrophobic domain Or , an inverted micelle
covered with normal layer How the DNA is included in the
3. Nucleus Ingestion : diffusionin the hydrophobic domain Or , an inverted micelle
covered with normal layer How the DNA is included in the micelle micelle is essential for the transportation between cellular vesicles.
is essential for the transportation between cellular vesicles.
Escape from endosomal vesicle
Vesicle bilayer
Escape from endosomal vesicle
Vesicle bilayer
endosomal vesicle vesicle
Drug is just Drug is just transported to the inside of bilayer.transported to the inside of bilayer.

A new cationic lipidOur new cationic lipidOur new cationic lipid
O
H2NO
Benzyl amine (BA)
JPA2006 287855JPA2006-287855
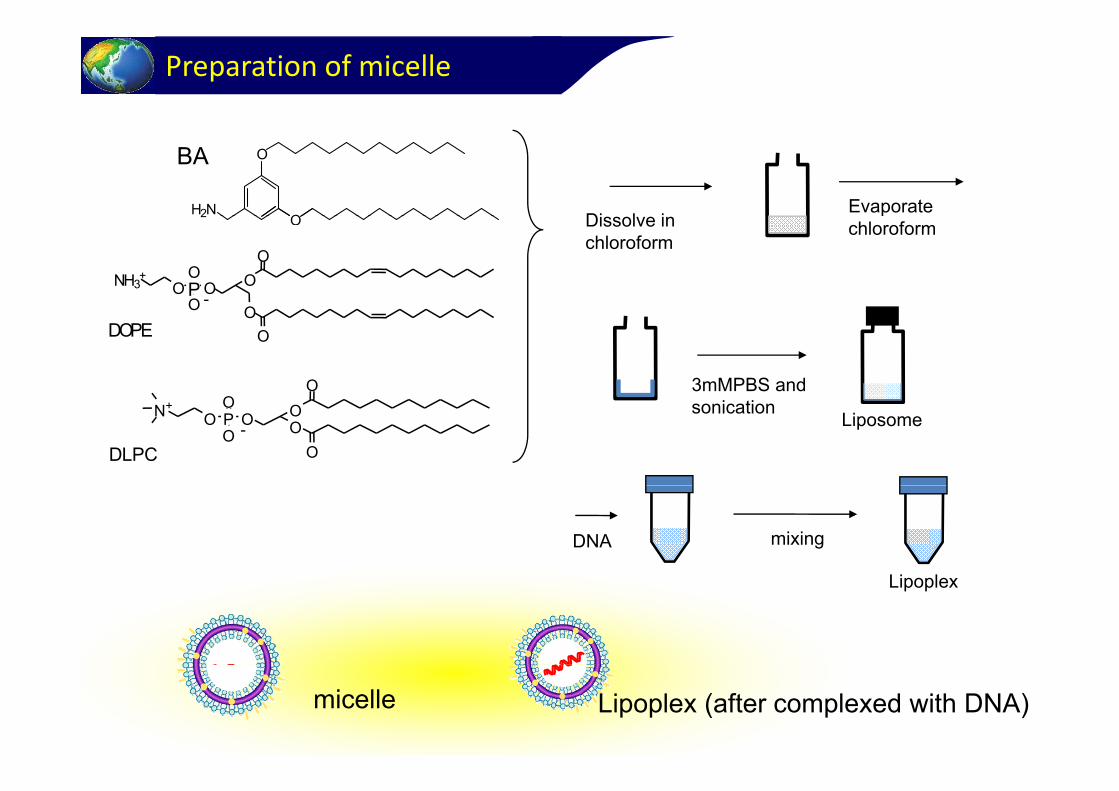
Preparation of micelle
Di l iEvaporate H2N
O
O
BA
OPOO
ONH3+ O
O
-
Dissolve in chloroform
pchloroform
2 O
O OODOPE
O 3mMPBS and
O OPOO
ON+ O
ODLPC-
sonicationLiposome
DNA
Li l
mixing
Lipoplex
micelle Lipoplex (after complexed with DNA)

How to evaluate DNA transfectionHow to evaluate DNA transfection
Cell cultivating LipoplexDNA
Liposome or micelle
24h
DNAFITC coding
Add
48h Endosomalescape
Exchange medium Endosome
FITC24h
Measure the amount of ProteinMeasure the amount of protein by fluoresces mRNA
Protein

BA遺伝子導入効率 Primary amineNot dispersed well
Gene Transfection and composition Gene Transfection and composition
A各組成でのlipoplexを肝癌細胞株(HepG2 Cells)に投与し、発現された蛍光タンパク質を発光量により定量した
Clear
AB
2 52 5××101055B
oduc
ed
2.52.5××101055
Clear solution
質発現
量
2.52.5××1010DLPCDOPE
BAprot
ein
pro
DLPCDOPE
Li l
Commercially available conventional
タン
パク質
BA
Lipofectamine
BA
amou
nt o
f
Lipofectamine
Lipoplex
DNA
transfection regent
Lipofectamine
0.860.86××101055The
a 0.40.4××101055
HepG2
DOPE DLPCFig 1 Lusiferase assay
DOPE DLPC0.2 0.4 0.6 0.8
The efficiency strongly depends on theFig.1 Lusiferase assay
発現の最も大きかったB-lipoplexと発現がほとんど見られなかったA-lipoplexの構
造を検討
The efficiency strongly depends on the composition

BASAXS from A (poor transfection)
Lamella A
105N/P
1.1
Lamella + cylinder
DLPCDOPE
104
1.1
2.64
3 3
cylinder
DLPCDOPE
102
103 3.3
4 4(q) /
a.u
.
Sphere -> Cylinder -> Lamella
101
10 4.4
6.6
I(
Sphere+cylinder
1
100 8.8
26.4
sphere10-1
3 4 5 6 7 81
2 3 4 5 6
1
Fig.2 SAXS of A-lipoplex
1q / nm-1

Fitting the data
( ) ( )sI q P qLipid micelle:
( ) ( ) ( ) ( )I q P q S q conP q
from factor of core-shell sphere
Mixture of lipid ( ) ( ) ( ) ( )C h sI q P q S q conP q pmicelle and hexagonally packed
li d structural factor forcylinder structural factor for hexagonal packing with the second kind imperfection.
from factor of three layer cylinder

FittingFitting
104
105N/P
1.1
2.64 678
1000(a)
(b)
103
10
3.3
a.u. 3
4
56
rc=1.3
rc=1.4/ a.u
.
101
1024.4I(q
) / a
100
2
rc=1.5
I(q) /
100
10 6.6
8.8
26 45678
100
10-1
3 4 5 6 7 81
2 3 4 5 6
26.43
4
3 4 5 6 7 8 91
2 3
/ -1
Figure 3. SAXS profile of A-lipoplex
1q / nm-1 q / nm 1

Before After0.2BA 1 h l
Model for formation of the complexModel for formation of the complex
10.32
0.18BANeutral lipid 1 The complex SAXS can
be fitted by a three layer cylinder that
t i hi h l t DNA
1 contains a high electron density domain at the core. The core may be DNADNA.
0.6nm 1.6nm 1.4nm1.4nm0.5nm
DNADNA
Cl-
Core-shell sphere6.65nm 6.4nm
Core-shell sphere
Double layer inverted cylinder Lamella including DNA in the hydrophobic domain
BA
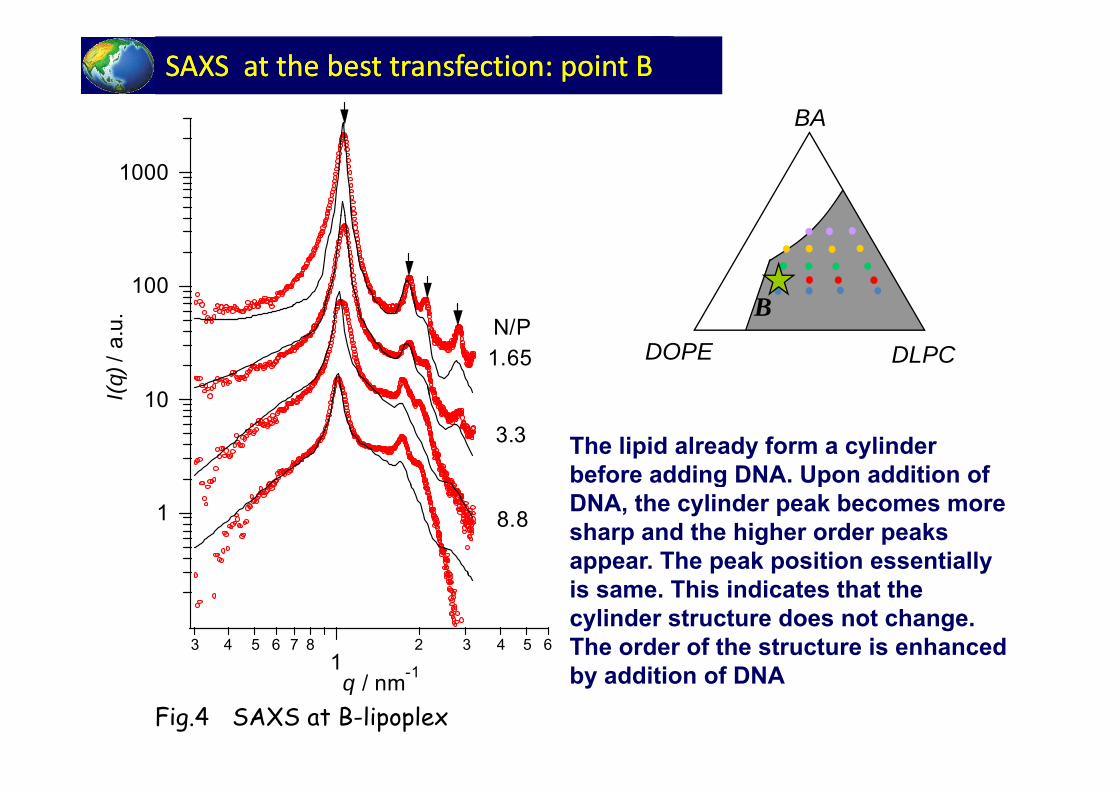
SAXS at the best transfection: point BSAXS at the best transfection: point B
1000
B100
DLPCDOPE
B
10
N/P1.65
I(q) /
a.u
.
103.3
I
The lipid already form a cylinder before adding DNA. Upon addition of
1 8.8
g pDNA, the cylinder peak becomes more sharp and the higher order peaks appear. The peak position essentially
3 4 5 6 7 81
2 3 4 5 6
is same. This indicates that the cylinder structure does not change. The order of the structure is enhanced
Fig.4 SAXS at B-lipoplex
1q / nm-1 by addition of DNA

10.545 10.42Before Afte
r(N/P=1 65)
Model for the formation of complexModel for the formation of complex
1. 1. (N/P=1.65)
0 6 1 6 0 7 1 60.6nm 1.6nm 0.7nm 1.6nm
DNACl- DNA
7 186.85nm
7.18nm