fertilizers in aquaculture
TRANSCRIPT

University of Nebraska - Lincoln University of Nebraska - Lincoln
DigitalCommons@University of Nebraska - Lincoln DigitalCommons@University of Nebraska - Lincoln
Publications from USDA-ARS / UNL Faculty U.S. Department of Agriculture: Agricultural Research Service, Lincoln, Nebraska
2015
Fertilizers in aquaculture Fertilizers in aquaculture
Bartholomew Green [email protected]
Follow this and additional works at: https://digitalcommons.unl.edu/usdaarsfacpub
Part of the Agriculture Commons, and the Aquaculture and Fisheries Commons
Green, Bartholomew, "Fertilizers in aquaculture" (2015). Publications from USDA-ARS / UNL Faculty. 2422. https://digitalcommons.unl.edu/usdaarsfacpub/2422
This Article is brought to you for free and open access by the U.S. Department of Agriculture: Agricultural Research Service, Lincoln, Nebraska at DigitalCommons@University of Nebraska - Lincoln. It has been accepted for inclusion in Publications from USDA-ARS / UNL Faculty by an authorized administrator of DigitalCommons@University of Nebraska - Lincoln.

Fertilizers in aquaculture 2B.W. GreenUnited States Department of Agriculture, Stuttgart, AR, USA
2.1 Introduction
Pond fertilization is an important component of semi-intensive to intensive aquaculturepond management that supports successful production of the culture organism. Semi-intensive and intensive aquaculture pond management fall along the extensive tohyperintensive management continuum and are characterized by high stocking rateof the culture animal, limited use of fertilizers, use of compound or complete feeds,and water quality monitoring and management, including use of mechanical aeration(Hickling, 1971; Bardach et al., 1972; Avault, 1996). Slightly lower stocking rates,relatively greater use of fertilizer and compound feed, and lower rates of mechanicalaeration distinguish semi-intensive from intensive pond management strategies.
Fertilization contributes to establishing and maintaining a pond environment thatallows the culture organism to efficiently utilize the compound or complete feeds(see other chapters in this volume) offered. Fertilizer sources are chemical fertilizersand organic (matter) fertilizers, which include agricultural by-products and animalmanures. Chemical fertilizer typically is composed of nitrogen, phosphorus, and potas-sium compounds that dissolve readily to provide nutrients to phytoplankton. Organicfertilizer includes agricultural by-products, for example, rice bran, cottonseed meal,and animal manures, for example, poultry litter, cow manure, which first must undergodecomposition to release nutrients for phytoplankton growth. Among the benefits ofpond fertilization are the production of natural food organisms that contribute toculture organism nutrition, the development of phytoplankton blooms that providedissolved oxygen, utilize excreted feed nitrogen, shade out benthic vegetation, andprovide contrast for fish to locate and consume floating, extruded feed, and the controlof clay turbidity.
This chapter presents information on pond food webs, sources and form in water ofmacronutrients required by phytoplankton, chemical and organic fertilizers, fertilizersolubility, fertilization frequency, and examples of pond fertilization regimes.
2.2 Pond natural food web
Pond fertilization supplies exogenous sources of key nutrients to stimulate primary andsecondary productivity that form the base of the aquaculture pond food web. In thecontext of aquaculture ponds, primary producers refers to microscopic algae and otherphotosynthetic organisms, collectively termed phytoplankton. Primary production in
Feed and Feeding Practices in Aquaculture. http://dx.doi.org/10.1016/B978-0-08-100506-4.00002-7Copyright © 2015 Elsevier Ltd. All rights reserved.
chemically fertilized fish ponds was 4e5 times greater than in unfertilized ponds(Hepher, 1962). Secondary production refers to all the heterotrophic organisms thatconvert the chemical energy of their food into biomass, and are comprised of grazersand decomposers such as zooplankton, protozoa, nematodes, oligochaetes, insects,mollusks, and bacteria.
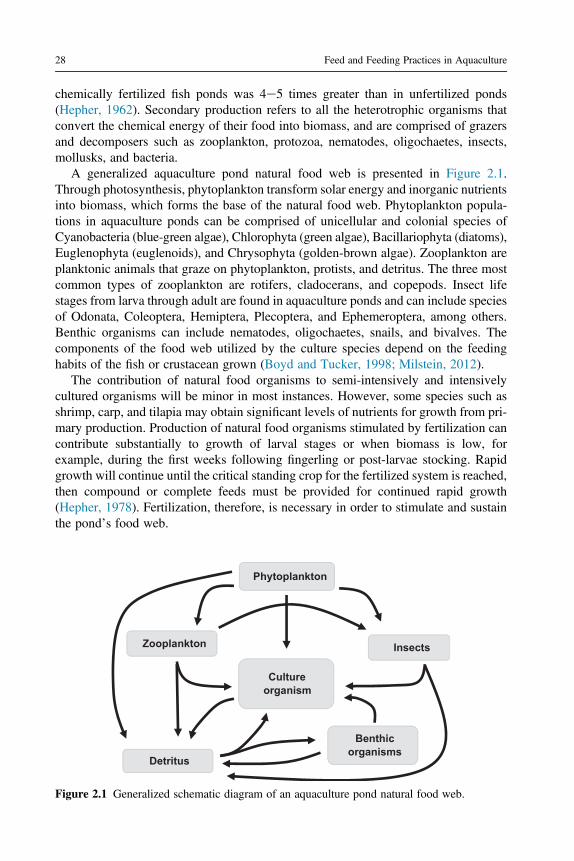
A generalized aquaculture pond natural food web is presented in Figure 2.1.Through photosynthesis, phytoplankton transform solar energy and inorganic nutrientsinto biomass, which forms the base of the natural food web. Phytoplankton popula-tions in aquaculture ponds can be comprised of unicellular and colonial species ofCyanobacteria (blue-green algae), Chlorophyta (green algae), Bacillariophyta (diatoms),Euglenophyta (euglenoids), and Chrysophyta (golden-brown algae). Zooplankton areplanktonic animals that graze on phytoplankton, protists, and detritus. The three mostcommon types of zooplankton are rotifers, cladocerans, and copepods. Insect lifestages from larva through adult are found in aquaculture ponds and can include speciesof Odonata, Coleoptera, Hemiptera, Plecoptera, and Ephemeroptera, among others.Benthic organisms can include nematodes, oligochaetes, snails, and bivalves. Thecomponents of the food web utilized by the culture species depend on the feedinghabits of the fish or crustacean grown (Boyd and Tucker, 1998; Milstein, 2012).
The contribution of natural food organisms to semi-intensively and intensivelycultured organisms will be minor in most instances. However, some species such asshrimp, carp, and tilapia may obtain significant levels of nutrients for growth from pri-mary production. Production of natural food organisms stimulated by fertilization cancontribute substantially to growth of larval stages or when biomass is low, forexample, during the first weeks following fingerling or post-larvae stocking. Rapidgrowth will continue until the critical standing crop for the fertilized system is reached,then compound or complete feeds must be provided for continued rapid growth(Hepher, 1978). Fertilization, therefore, is necessary in order to stimulate and sustainthe pond’s food web.
Phytoplankton
Zooplankton Insects
Detritus
Culture organism
Benthic organisms
Figure 2.1 Generalized schematic diagram of an aquaculture pond natural food web.
28 Feed and Feeding Practices in Aquaculture

2.3 Nutrients and forms in water
Phytoplankton require many elements, classified either as macronutrients (C, N, P, K,H, O, Ca, Mg, Na, S, Cl) or micronutrients (B, Cu, Co, Fe, Mn, Mo, Si, V, Zn), forgrowth (Reynolds, 1984; Lin et al., 1997; Boyd and Tucker, 1998). Silica is a macro-nutrient for the Chrysophyta, especially diatoms (Reynolds, 1984). Concentrations ofthese elements in surface water will vary geographically and will depend upon thelocal geology and climate. Ground water concentrations of these elements are morevariable than in surface waters, even at the same geographic location. The carbon di-oxide concentration, geology of the formations through which the water infiltrates andof the destination aquifer, and retention time in the aquifer are factors that affect con-centrations. For example, in a study of aquifers in four contiguous counties in westAlabama, Boyd et al. (2009) found great variability in ground water chloride concen-tration both within and among the different geologic formations in which the aquiferswere located.
Of the many macro- and micronutrients required for growth by phytoplankton,phosphorus, nitrogen, and carbon are most likely to limit primary productivity. Allthree occur in various forms in pond water that are described in the followingparagraphs.
Dissolved phosphorus is present in water in organic and inorganic forms. Organicforms generally are of biogenic origin, for example, enzymes, nucleic acids, andadenosine triphosphate, whereas orthophosphate ions (H2PO4
�, HPO4�2) derived
from weathering of phosphate-containing minerals are the predominant inorganicforms. Orthophosphate ions are ionization products of orthophosphoric acid:
H3PO4 ¼ H2PO4� þ Hþ ¼ HPO4
�2 þ Hþ ¼ PO4�3 þ Hþ (2.1)
The ionic form varies with pH and H2PO4� and HPO4
�2 are the forms present ataquaculture pond pH values. Dissolved orthophosphate is the main source of phos-phorus for phytoplankton.
Nitrogen, too, is present in water in dissolved inorganic and organic forms. Enzymes,free amino acids, and peptides are among the forms of organic nitrogen and are productsof biological activity. Ammonia-ammonium, nitrite, and nitrate ions are common formsof inorganic nitrogen. Dissolved ammonia is in equilibrium with ammonium and theproportions of each are affected mainly by pH and temperature:
NH3 þ Hþ ¼ NH4þ (2.2)
Bacterial decomposition of organic matter and excretion by animals are the mainsources of ammonia. Through nitrification, which occurs under aerobic conditions,bacteria oxidize ammonia first to nitrite and subsequently to nitrate. Although phyto-plankton can assimilate ammonium, nitrite, and nitrate, ammonium is the most favor-able energetically because nitrite and nitrate must be reduced prior to assimilation.
Organic and inorganic forms of carbon are found dissolved in water. Dissolvedorganic carbon compounds are numerous and varied and include, among others,
Fertilizers in aquaculture 29

enzymes, nucleic acids, peptides, proteins, and carbohydrates. Carbon dioxide and bi-carbonate and carbonate ions are the main forms of dissolved inorganic carbon. Car-bon dioxide diffuses into water from the atmosphere and is produced by respiration.Because it comprises only 0.03% of the atmosphere, equilibrium concentration of car-bon dioxide in water is low. And, only a small quantity (z0.2%) of dissolved carbondioxide reacts with water to form carbonic acid, which dissociates to form bicarbonate:
CO2 þ H2O ¼ H2CO3 ¼ HCO3� þ Hþ ¼ CO3
�2 þ Hþ (2.3)
As pH increases, bicarbonate dissociates into carbonate. Bicarbonate is releasedwhen limestone is dissolved by carbon dioxide and is the largest source of this ionin water. Phytoplankton uptake carbon dioxide and bicarbonate ion as carbon sources.
The nutrient present in the smallest concentration relative to its requirement willlimit phytoplankton growth. Deficiencies in more than one nutrient concentrationcan limit phytoplankton growth, and supplying the deficient nutrients in needed con-centrations will allow rapid growth. Because phytoplankton growth in aquacultureponds is limited most commonly by carbon, nitrogen, and phosphorus, liming andfertilization strategies focus on providing these nutrients. Although liming technicallyis not fertilization, it does ensure that a fertilization program is successful by ensuringphosphorus availability and providing adequate dissolved inorganic carbonconcentrations.
2.4 Liming
Sometimes a fertilizer application does not produce the desired response by phyto-plankton. One possible cause may be acidic pond muds and low total alkalinity. Totalalkalinity is a measure of the titratable bases in natural waters, of which bicarbonate,carbonate, and hydroxide are taken as predominant. Other than dissolved carbon diox-ide, bicarbonate and carbonate comprise the largest pool of dissolved inorganic carbonin aquaculture ponds. Calcite (CaCO3) and dolomite (CaMg(CO3)2) are the two pri-mary limestone sources of bicarbonate, and alkalinity, in aquaculture ponds.
Gross primary productivity and phytoplankton abundance in fertilized ponds withvery low (2e10 mg/L as CaCO3) total alkalinity were significantly lower than in pondswith moderate (33 mg/L as CaCO3) total alkalinity (Murad and Boyd, 1991). Algalproductivity did not appear to be limited by phosphorus concentration, which wassimilar among all treatment ponds, but rather by carbon dioxide. Available carbon di-oxide concentration at dawn was significantly higher in the moderate total alkalinitytreatment compared to the low alkalinity treatments in which total alkalinity wassimilar.
Limestone is added to aquaculture ponds to increase the pH of pond soils and totalalkalinity of pond water (Arce and Boyd, 1975; Boyd, 1997; Boyd and Tucker, 1998).Low pH of pond soils usually is caused by exchangeable aluminum (Boyd, 1995;Boyd and Tucker, 1998). Under these conditions, phosphorus reacts with aluminum
30 Feed and Feeding Practices in Aquaculture

to form insoluble aluminum phosphate. Pond soils can adsorb fertilizer phosphorusquickly, especially when granular fertilizer broadcast over the pond surface sinks tothe bottom, and phosphorus adsorption is similar across a variety of soil types(Boyd and Musig, 1981). When limestone is added to mitigate pond soil acidity,hydrogen ions that result from the hydrolysis of aluminum are neutralized by reac-tion with calcium carbonate, and the resulting calcium ion replaces the exchange-able aluminum on the soil. The soil pH increases as exchangeable aluminum isreplaced by calcium. Pond soils are limed to achieve a final pH of 6.5e7. The anal-ysis of pond soil samples to determine the lime requirement exceeds the scope ofthis chapter, but is described fully by Boyd and Tucker (1998) and Silapajarnet al. (2005).
The purity, ability to neutralize acidity, and the rate at which limestone reacts toneutralize acidity are important quality factors. Liming material purity is given bycalcium carbonate equivalent (CCE), with pure calcium carbonate equal to 100%.The neutralizing value, also called total neutralizing value, is expressed as CCE andis the percentage of the liming material capable of neutralizing acidity because allliming materials contain impurities. For example, 1 kg of limestone with a neutralizingvalue (CCE) of 87% will neutralize as much acidity as 0.87 kg of pure calcium carbon-ate. Fineness determines how quickly the liming material will react with acid and isgiven by the percentage of the material that passes through or is retained by standardtesting sieves. Silapajarn et al. (2004) reevaluated fineness of limestone for aqua-cultural use and developed new efficiency values. They found that soil pH in asoilewater microcosm increased from 5.0 to 6.9e7.1 in 1 week for soil treated withlimestone particles smaller than 0.106 mm (passing a No. 140 US standard sieve),whereas soil treated with particles smaller than 0.25 mm (passing a No. 60 sieve)needed 10 weeks to attain pH 6.5. Limestone particles smaller than 0.106 mm wereassigned an efficiency of 100% because they increased total alkalinity in a soilewatermicrocosm to 54.74 mg/L as CaCO3, almost the equilibrium concentration inwater with solid calcium carbonate and normal carbon dioxide concentration. Lowerefficiency values were assigned to larger limestone particle sizes. The particle sizeanalysis and efficiency values can be used to calculate an effective neutralizing valueor fineness value for a liming material (Table 2.1). The lime requirement determinedanalytically for a pond is divided by the neutralizing value (CCE) and fineness value ofthe liming material to be used, in order to arrive at the final lime application.
Limestone is added to ponds along with dissolved carbon dioxide to increase totalalkalinity and total hardness:
CaCO3 þ CO2 þ H2O ¼ Caþ2 þ 2HCO3� (2.4)
CaCO3$MgCO3 þ 2CO2 þ 2H2O ¼ Caþ2 þMgþ2 þ 4HCO3� (2.5)
Water in equilibrium with pure calcium carbonate and atmospheric carbon dioxidewill have a pH of 8.3. Early morning pH and pH during intensive summer photo-synthesis was greater than 8.4, which indicated that bicarbonate was the dissolvedinorganic carbon source for photosynthesis (Arce and Boyd, 1975). Carbon dioxide
Fertilizers in aquaculture 31

Table 2.1 Example of particle size distribution and efficiency factor for a sample of agricultural limestone
Size range (mm)
US Standard sieve number Limestone sample
Efficiency factor (%) Weighted efficiency (%)Passed Retained on Mass (g) % of total
>0.85 20 2.00 0.032 7.3 0.23
0.85e0.42 20 40 4.50 0.072 22.4 1.61
0.42e0.25 40 60 6.00 0.096 49.0 4.70
0.25e0.106 60 140 17.75 0.284 86.7 24.62
<0.106 140 32.20 0.516 100.0 51.60
Effective neutralizing or fineness value (%):P ¼ 82.76
Adapted from Silapajarn et al. (2004).
32Feed
andFeeding
Practices
inAquaculture

generated by bacterial decomposition of organic matter added to ponds can speed thedissolution limestone. Sufficient quantities of organic matter should be added so thatbacterially generated carbon dioxide prevents pH from increasing to harmful levels. Inponds that are drained often, meet the lime requirement based upon initial soil analysisand subsequently apply lime annually at 25% of the initial lime requirement (Boyd andTucker, 1998). Boyd (1997) cautions against overapplication of lime, especially burnt(CaO) or hydrated (Ca(OH)2) lime, because at the resulting high pH values ammoniatoxicity becomes a problem. Boyd and Tucker (1998) provide a thorough discussion ofliming aquaculture ponds.
2.5 Chemical fertilizers
Nutrients added by use of commercially formulated chemical fertilizers generally arelimited to the primary macronutrients nitrogen, phosphorus, and potassium. Commer-cial fertilizer labels specify the guaranteed minimum percentage, in order, of nitrogen(N), phosphorus (as phosphate, P2O5), and potassium (potash, K2O). By convention,fertilizer phosphorus and potassium content are quantified as percent phosphate andpercent potash, respectively. For example, a fertilizer with the formula 12-24-12 con-tains 12% nitrogen, 24% phosphate, and 12% potash. Formulations of commonly usedcommercial fertilizers are shown in Table 2.2.
Secondary macronutrients are calcium, magnesium, and sulfur (Table 2.2). Gypsumcontains both calcium and sulfur, as does superphosphate. Agricultural limestone is asource of calcium and often serves as filler in blended granular fertilizers. Dolomiticlimestone provides both calcium and magnesium.
2.5.1 Nitrogen
Industrial production of nitrogen fertilizer begins with the synthesis of ammonia byreacting under pressure atmospheric nitrogen and a source of hydrogen, usuallyfrom natural gas, using the HabereBosch process. Ammonia is then reacted with addi-tional compounds to manufacture nitrogen-based fertilizers (Figure 2.2). Ammoniumnitrate is a white, granular fertilizer whose use is being supplanted by the less expen-sive, easier to handle urea; the US Department of Homeland Security regulates the saleof ammonium nitrate because it can be used in explosives. Urea and ammonium sulfateare white, granular fertilizers. Monoammonium phosphate (MAP) and diammoniumphosphate (DAP) are greyish, granular fertilizers. Ammonium polyphosphate is aliquid in its 10-34-0 form and has a density of 1.37 kg/L but is granular in its11-57-0 form.
2.5.2 Phosphorus
Phosphorus fertilizers are manufactured from rock phosphate (Figure 2.2), but rockphosphate itself seldom is used directly as a fertilizer because of its low availabilityof phosphorus and transport cost. Instead, finely ground rock phosphate is treated
Fertilizers in aquaculture 33

Table 2.2 Percent composition of primary macronutrients as percent nitrogen, phosphorus (as P2O5), andpotassium (as K2O) and equivalent elemental concentration of commonly available commercial fertilizers,and elemental concentrations of secondary macronutrients (calcium, magnesium, and sulfur) of commonlyavailable commercial fertilizers and common nutrient sources
Nutrient source
Labeled % composition Elemental % composition
N P2O5 K2O P K Ca Mg S
Ammonium nitrate 34 0 0 0 0 0 0 0
Ammonium polyphosphate 10e11 34e57 0 15e25 0 0 0 0
Ammonium sulfate 21 0 0 0 0 0 0 24
Urea 46 0 0 0 0 0 0 0
Monoammonium phosphate 11 50 0 22 0 0 0 0
Diammonium phosphate 18 46 0 20 0 0 0 0
Superphosphate 0 20 0 9 0 18e21 0 11e12
Triple superphosphate 0 46 0 20 0 15 0 0
Potassium chloride 0 0 60 0 50 0 0 0
Potassium nitrate 13 0 44 0 37 0 0 0
Potassium sulfate 0 0 50 0 42 0 0 17e18
Potassium magnesium sulfate 0 0 22 0 18 0 11 22
34Feed
andFeeding
Practices
inAquaculture

with sulfuric acid to yield monocalcium phosphate monohydrate and is known assuperphosphate. About 85e90% of phosphate in superphosphate is water soluble.In another process, finely ground rock phosphate is reacted with sulfuric acid to pro-duce phosphoric acid (54% P2O5), also called green acid, and gypsum, which isremoved as a by-product. Phosphoric acid usually is not used directly as a fertilizerbecause it is corrosive, but is used to manufacture other fertilizers. The reaction ofphosphoric acid with finely ground rock phosphate yields triple superphosphate(TSP). MAP and DAP are the products of reactions between phosphoric acid andammonia. Phosphoric acid can be heated to drive off water to produce superphosphoricacid (68e70% P2O5), which when reacted with ammonia yields ammoniumpolyphosphate.
Phosphorus fertilization rates often are given in terms of P, not P2O5. The propor-tion of P in P2O5 is used to calculate the equivalent quantity of P in a fertilizer: 2 P/P2O5 ¼ (2 � 31 g/mol)/142 g/mol ¼ 0.437. Thus, the percentage of P in a 12-24-12fertilizer is: 24% P2O5 � 0.437 ¼ 10.5% P.
2.5.3 Potassium
Potassium chloride is the most common potassium source for fertilizers, is known asmuriate of potash, and is highly water soluble. It is manufactured primarily from the
Ammonium polyphosphate
Monoammonium phosphate Diammonium phosphate
Ammonia
Nitric acid Ammonium nitrate + Ammonia
+ O
xyge
n + Sulfuric acid
Ammonium sulfate
Urea + Carbon dioxide
Phosphoric acid Δ
Superphosphoric acid
Triple superphosphate + Rock phosphate
Superphosphate
Rock phosphate + Sulfuric
acid
Figure 2.2 Fertilizers manufactured from ammonia and rock phosphate.
Fertilizers in aquaculture 35

mineral sylvite, which is mined in New Mexico, Michigan, and Utah in the UnitedStates and Saskatchewan, Canada. Potassium chloride color ranges from white topink to red—the pink and red colors caused by inclusions of hematite, which do notaffect potassium availability. Three other potassium fertilizers are potassium sulfate,potassium nitrate, and potassium magnesium sulfate.
As with phosphorus, fertilization rates can be given in terms of K rather than K2O.The proportion of K in K2O is used to calculate the equivalent quantity of K in a fer-tilizer: 2 K/K2O ¼ (2 � 39.1 g/mol)/(94.2 g/mol) ¼ 0.830. Using the 12-24-12 fertil-izer grade, the percentage of K is: 12% K2O � 0.830 ¼ 9.96% K.
2.6 Organic fertilizers
Organic fertilizers comprise a variety of plant-derived materials that range from freshor dried plant material to animal manures and litters to agricultural by-products(Wohlfarth and Schroeder, 1979; Das and Jana, 2003; Kumar et al., 2004). Thenutrient content of organic fertilizers varies greatly among source materials, andreadily biodegradable materials make better nutrient sources. Nitrogen and phosphoruscontent is lower, often substantially lower, in organic fertilizers compared to chemicalfertilizers. Moisture content is another factor that reduces or dilutes the nitrogen andphosphorus concentrations of organic fertilizers. Thus, it can be cost ineffective totransport high-moisture organic fertilizer long distances. However, use of locally avail-able sources is perfectly reasonable if its use is consistent with the production strategy.Nutrient value of animal manures is more variable than that of agriculturalby-products. The animal’s diet, the use and type of bedding material, manure age,and how it was stored are factors that affect manure nutrient value; these factors canvary seasonally on and among farms, and regionally or on a larger geographic scale.In contrast, nutrient content of agricultural by-products is less variable but can beaffected by the industrial process used to produce the by-product. However, it alwaysis advisable to analytically determine the nutrient content of the organic fertilizer.
The organic carbon content of organic fertilizer can be of equal or greater impor-tance than its nitrogen and phosphorus contents. Application of organic fertilizer pro-motes increases in heterotrophic bacterial biomass, which stimulates other secondaryproductivity and mineralizes nutrients to stimulate primary productivity (Schroeder,1978; Anderson, 1987; Colman and Edwards, 1987; Qin et al., 1995; Barkoh et al.,2005). Furthermore, through respiration the increased bacterial population generatescarbon dioxide, which increases dissolved inorganic carbon available to phyto-plankton, dissolves limestone to increase pond total alkalinity, and can moderate in-creases in pH during periods of intense photosynthesis. Also through respiration,the bacterial population consumes oxygen and heavy applications of organic mattercan result in low predawn pond dissolved oxygen concentration (Qin et al., 1995).However, organic matter decomposition and nutrient mineralization occurs overdays in contrast to immediate nutrient availability from chemical fertilizer.
Application of organic fertilizers to ponds depends on the fertilizer form andmoisture content. The recommended application method for fresh animal manure,
36 Feed and Feeding Practices in Aquaculture

for example, cattle, swine, is to make a manureewater slurry that is splashed over thepond surface. Poultry litter can be applied by broadcasting over the ponds surface.Poultry litter bedding material such as wood chips/shaving or rice hulls, as opposedto sawdust, can decompose and accumulate on the pond bottom, which is undesirable.Agricultural by-products, for example, alfalfa meal, rice bran, can be broadcast overthe pond surface along the windward bank or mixed with water to make a slurrythat is splashed over the pond surface (Table 2.3).
2.7 Solubility of chemical fertilizer
Chemical fertilizer is available in granular, water soluble, and liquid forms. Granularfertilizer can be applied to ponds by broadcasting the granules over the water surface,allowing them to dissolve as they sink through the water column. Fertilizer granulesvary in size, which affects their solubility as they sink through the water column.Particle size, as determined by sieve analysis, ranged from <0.25 mm to >2.00 mm,and nitrogen and phosphorus dissolution from DAP granules sinking through a 2-mfreshwater column were 4.8 and 2.8 times greater, respectively, for granules0.85 mm and smaller compared to larger granules (Boyd, 1981). However, particles0.85 mm and smaller comprise only 3.1% of DAP granules and, on average, 4.3%of granules in 10 other fertilizers evaluated (Boyd, 1981). Nutrient dissolution ofcommon fertilizers sinking through a 2-m column of freshwater is shown in Table 2.4.
Table 2.3 Nutrient composition (on an as is basis) and dry mattercontent of select animal manures and agricultural by-products thatcan be used as organic fertilizer
Material
Composition (%, as is)Dry matter(%)N P K
Manure
Beef cattle 0.57 0.14 0.41 8
Dairy cow 0.52 0.12 0.36 13
Poultry—broilersa 3.08 1.28 1.82 74
Poultry—layers 1.68 1.06 1.20 42
Swine—grow-finish 0.93 0.31 0.48 11
By-productsAlfalfa meal 2.77 0.25 2.46 90
Cottonseed meal 7.38 1.16 1.65 92
Rice bran 2.30 1.73 1.89 91
aIncludes litter.Rasnake et al. (2000), Sawyer (2009), ASABE (2010), Kirsten (2013), and Gadberry (No Date).
Fertilizers in aquaculture 37

Salinity also can affect solubility of fertilizer granules as they sink through the watercolumn. Solubility of nitrogen from urea and MAP granules sinking through a 1-mwater column averaged 89.7% and 12.4%, respectively, in freshwater, but decreasedby 18% and 17%, respectively, in 30 ppt salinity water (Teichert-Coddington et al.,1997). Only a 2% decrease in nitrogen solubility was reported for DAP as salinityincreased from 0 to 30 ppt. Phosphorus solubility averaged 4.6%, 11.7%, and 5.0%for TSP, MAP, and DAP, respectively, and decreased 7%, 22%, and 6%, respectively,in 30 ppt water compared to freshwater.
Most nitrogen in nitrogen-only fertilizer dissolves as the granules sink through thewater column. However, only a small percentage of nitrogen and phosphorus fromMAP and DAP and phosphorus from superphosphate and TSP dissolve as granulessink to the pond bottom. Once on the bottom, nutrients continue to dissolve, and after24 h, 80% of nitrogen and 81% of P2O5 have dissolved (Boyd, 1981). However, sincephosphates react with aluminium, calcium, and iron ions in pond muds, phosphorussolubilized from fertilizer granules that sink to the pond bottom will react to forminsoluble phosphate compounds and become unavailable to phytoplankton (Boydand Musig, 1981; Boyd and Tucker, 1998).
Dissolving granular fertilizer in pond water and splashing the solution on the pondsurface along the upwind pond bank rather than broadcasting it over the pond surfacewill increase availability of fertilizer nutrients to phytoplankton. Lawrence (1954)observed that wind currents would be sufficient to distribute fertilizer nutrientsthroughout the pond if the fertilizer were placed on a platform 30 cm below thepond surface. It is unlikely that a fertilizer platform is required today; the conceptremains valid where granular fertilizers are applied. Nitrogen from nitrogen-onlyfertilizer dissolves readily and fertilizer solution can be applied directly to the pond
Table 2.4 Percent of fertilizer nutrient that dissolved while sinkingthrough a 2-m column of freshwater at 29 �C and percent offertilizer granules larger than 0.85 mm
Fertilizer
Solubility (%)Composition(%)
N P2O5 K2O >0.85 mm
Ammonium nitrate 98.8 e e 97.9
Ammonium sulfate 85.9 e e 83.4
Monoammonium phosphate 5.1 7.1 e 99.9
Diammonium phosphate 11.7 16.8 e 96.9
Superphosphate e 4.6 e 97.1
Triple superphosphate e 5.1 e 99.6
Potassium chloride e e 87.0 91.5
Adapted from Boyd (1981).
38 Feed and Feeding Practices in Aquaculture

surface. Since MAP, DAP, superphosphate, and TSP do not dissolve as readily, theresidual undissolved fertilizer can be placed in a burlap sack or woven plastic fertilizersack and suspended in the top 30 cm of the water column, where it will dissolvecompletely. Water currents from a mechanical aerator or a water inlet structure canassist with dissolution and dispersal of these residual fertilizer nutrients.
Liquid fertilizers are commonly used in agriculture and increasingly in aquaculture.Ammonium polyphosphate (Table 2.2), a common liquid fertilizer, and other standardand custom liquid fertilizer blends are available from agricultural nutrient suppliers.The benefit of liquid fertilizer is especially pronounced for phosphorus because ofits increased solubility (Metzger and Boyd, 1980; Musig and Boyd, 1980; Boyd andHollerman, 1981). Application of the liquid fertilizer, ammonium polyphosphate,resulted in higher concentrations of soluble reactive phosphorus, total phosphorus,and chlorophyll a than broadcast applications of granular TSP plus ammonium nitrateor DAP (Boyd et al., 1981). The density of liquid fertilizer (1.3e1.4 kg/L) is heavierthan water, which means it will sink to the bottom with minimal mixing with pond wa-ter if poured directly into a pond (Metzger and Boyd, 1980). Liquid fertilizer should bemixed with pond water (1:5e10 ratio) and this solution splashed along windward pondbank, drained into the outboard motor propeller wash as the boat moves about thepond, or sprayed over the pond surface using a power sprayer mounted on a boat ortractor (Boyd and Hollerman, 1981; Boyd and Tucker, 1998).
2.8 Fertilization frequency
Fertilizer can be applied on a fixed schedule or in response to some water quality var-iable or measure of phytoplankton productivity. Application frequency also can varybetween chemical and organic fertilizers because nutrients from chemical fertilizersare available sooner for phytoplankton growth, whereas organic fertilizers first mustundergo bacterial decomposition before nitrogen and phosphorus concentrationsincrease.
Net primary productivity was not affected by fertilization frequency (daily tobiweekly) in tropical fish ponds that received the same total nitrogen and phosphorusinputs as chemical fertilizer (Knud-Hansen and Batterson, 1994). Availability of inor-ganic carbon (as measured by total alkalinity) and clay turbidity (as measured by totalfixed solids) accounted for 60% of the variability in net primary production in theseponds. There was a similar inverse relationship between primary productivity andclay turbidity in organically fertilized ponds (Teichert-Coddington et al., 1992). Fertil-ization frequency becomes important when primary production is limited by nitrogenand phosphorus rather than by carbon limitation or clay turbidity (Knud-Hansen andBatterson, 1994). Consequently, fertilization frequency based upon sustaining highprimary productivity rather than a set schedule or a fixed rate should result in moreefficient nutrient utilization. Fixed-rate fertilization programs can lead to nutrientaccumulation and primary production being limited light availability because ofself-shading (Hepher, 1962; Knud-Hansen and Batterson, 1994; Mischke, 2012).
Fertilizers in aquaculture 39

In organically fertilized ponds that each received the same quantity of fertilizer, netfish yield was significantly greater with applications made daily compared to onceevery 5e7 days (Zhu et al., 1990). Biochemical oxygen demand (BOD) and totalammonia nitrogen (TAN) concentration were significantly higher in ponds fertilizeddaily, but chlorophyll a and zooplankton concentration were unaffected by fertilizationfrequency. The substantial increase in fish yield gained by daily fertilization must bebalanced against the increased BOD and TAN concentration, which could becomegrowth limiting or toxic.
The rate of fertilizer application can affect primary productivity and production ofthe culture organism. It seems logical that the desired result of fertilization in newlyfilled ponds is a rapid increase in natural productivity. As the culture cycle progresses,nutrient concentrations can increase because of repeated fertilization and feeding. Inorder to evaluate how an organic fertilization rate affects primary productivity andtilapia production, Teichert-Coddington et al. (1990) applied liquid swine manure toculture units at a constant, increasing, or decreasing rate. All culture units receivedthe same total quantity (2842 kg/ha total solids basis) of organic fertilizer over14 weeks. Fertilizer was applied (on a total solids basis) 5 days/week at 29 kg/ha/day for the constant rate, and initially at 7.3 kg/ha/day or 51 kg/ha/day for theincreasing and decreasing rates, respectively, and rates were adjusted biweekly by6.2 kg/ha/day. Net primary productivity at the beginning of the culture period differedsignificantly among all treatments and was highest in the decreasing rate treatment, in-termediate in the constant rate treatment, and lowest in the increasing rate treatment.Net primary production equalized among treatments over time, initially between thedecreasing and constant rate treatments, and then among all treatments. Tilapia netyield was significantly higher in the constant and decreasing rate treatment comparedto the increasing rate treatment. Thus, higher initial fertilizer application can increaseprimary productivity more quickly, but these higher rates require increased attention todissolved oxygen concentration.
A pond-specific approach to determine the need for fertilization with nitrogen,phosphorus, or carbon, individually or in any combination, was adapted by Knud-Hansen(1998) from the algal bioassay methodology used by limnologists. In this approach,called the algal bioassay fertilization strategy (ABFS), eight 200e500 mL clear plasticbottles with screw caps are filled with pond water, a nutrient spike is introduced, andthe loosely capped bottles are incubated for 2e3 days. Nutrients are added in excesssuch that phytoplankton growth will not be limited by that nutrient during incubation.One bottle serves as a control (no nutrient added) to the applied nutrient spikes (N, P,C, N þ P, N þ C, P þ C, and N þ P þ C). After incubation, phytoplankton responsein the spiked samples are compared to control and N þ P þ C to determine which, ifany, nutrient limited productivity. Pond water samples should be analyzed weeklyusing the ABFS to determine need for fertilization.
The Secchi disk is another tool that can be used to determine the need (frequency)for fertilization. A Secchi disk is a 20-cm diameter disk with alternating black andwhite quadrants that can be affixed to the end of a 2-m-long pole marked in 1-cmincrements. The black and white quadrants of the disk face the pole. Secchi diskvisibility was highly correlated with chlorophyll a or particulate organic matter
40 Feed and Feeding Practices in Aquaculture

concentrations in fertilized and unfertilized ponds and ponds in which fish were fed(Almazan and Boyd, 1978). Secchi disk visibility only is a valid index of planktonabundance in ponds that do not have clay turbidity. There was little variability(CV ¼ 1.8%) among repetitive Secchi disk readings made by the same observer andsomewhat greater variability (CV ¼ 4.4%) among 10 observers taking readings inthe same pond (Almazan and Boyd, 1978).
A consistent protocol for measuring Secchi disk visibility is required in order toobtain the best results. Measurements should be made at the same time of day sinceobserved Secchi disk visibility varies with the time of day it is measured (Almazanand Boyd, 1978). Measurements taken between 11 a.m. and 1 p.m. are preferredbecause the sun is directly overhead. The observer should be in the same position rela-tive to the sun, ensure that the measurement is taken outside of the observer’s shadow,and use the same clothing accessories, that is, hat, sunglasses. Submerge the Secchidisk slowly in the pond until it just disappears, and record the depth. Submerge thedisk about another 20 cm, and then slowly lift the disk toward the surface until thedisk just reappears, and record the depth. The Secchi disk visibility is the mean ofthe two recorded depths. Secchi disk visibility can be measured weekly in pondswith established phytoplankton blooms and more often if bloom conditions warrant,for example, excessively sparse or dense blooms. A 20e40-cm Secchi disk visibilityis an appropriate range for semi-intensive to intensive ponds, and the decision tofertilize can be based upon deviation from a specific visibility.
Several approaches to determining fertilization frequency are available. Fixed rateapplication strategies in which a defined rate of fertilizer usually is applied on a weeklybasis derive from experimental station research and often are recommended regionally.However, broad application of recommendations may be inappropriate because ofvariation in soils, water, and climate (Mischke, 2012). Another strategy bases fertiliza-tion frequency on algal nutrient concentrations in water and requires weekly orbiweekly analysis of pond water samples (Knud-Hansen, 1998; Qin, 2012). TheABFS, described above, is yet another strategy. The difficulty is to decide which strat-egy is most appropriate for a given situation. Knud-Hansen et al. (2003) comparedthese three strategies in a 120-day tilapia production study. In the fixed rate treatment,weekly applications of 30 kg N/ha and 15 kg P/ha as chemical fertilizer were made.Algal nutrient concentrations were measured biweekly and the PONDCLASS© com-puter program was used to determine fertilization rate. The ABFS was used weekly todetermine nutrient requirements and application rates. Net fish yields did not differsignificantly among treatments; the fixed rate treatment had the highest, but most var-iable net yield. The fixed rate strategy used about 20% more nitrogen than the othertwo strategies, which resulted in higher algal and fish productivity. The algal nutrientand ABFS strategies resulted in greater efficiency of phosphorus utilization but did notmaximize fish production.
The decision as to which strategy to use can be viewed as falling along the contin-uum from extensive to intensive aquaculture systems (Mischke, 2012). In this context,the algal nutrient and ABFS strategies may be more appropriate for extensive aquacul-ture systems where there are a small number of ponds, the culture organism reliescompletely on natural food, fertilizer is applied throughout the culture cycle and is a
Fertilizers in aquaculture 41

major cost of production, and labor is inexpensive. At the semi-intensive to intensiveaquaculture systems end of the continuum where there are a large number of ponds,formulated rations provide the bulk of nutrients for growth and represent a majorcost, fertilizer is applied on a limited basis, and labor is expensive, then the fixedrate strategy may be more appropriate. Use of the Secchi disk would be a valuablemanagement tool in these circumstances.
2.9 Fertilization regimes
2.9.1 Pond preparation
Just as a farmer prepares land for planting a crop by liming the soil and eliminatingweeds, so too must ponds be prepared in order for a fertilization program, and ulti-mately the production of the culture organism, to be successful. Liming of ponds isone important preparatory activity that was discussed earlier. Ponds are fertilized tostimulate primary and secondary production. Primary production in aquaculture refersto phytoplankton, not benthic and emergent macrophytes, which, if present, will outcompete phytoplankton for fertilizer nutrients. Once established in ponds, macrophytepopulations will flourish in response to nutrients from fertilizers and feeds, and requireconsiderable effort to control. Dense macrophyte populations can impede the cultureorganism from accessing formulated feed, pond seining for sampling and harvest,and pond mechanical aeration. Thus, it is best to identify and control pond macrophytepopulations early. Identification and control of aquaculture pond macrophytes isbeyond the scope of this chapter, and the reader is referred to Avery (2012).
Light availability in the pond water column is another important requirement foralgal photosynthesis. At times, ponds can become muddy because sediments fromwithin the pond or the pond watershed enter and remain suspended in the water column(Boyd, 1995). These suspended sediments, referred to as clay turbidity, restrict sun-light penetration into the water column, which reduces primary productivity and theentire pond natural food web. Clay turbidity may impact the ability of certain fish tolocate and consume floating feed. Most aquaculture ponds are levee ponds that havesmall watersheds. Clay turbidity that originates from levee runoff can be controlledby establishing a cover crop, such as grass, or by covering pond levees with straw(Yi et al., 2003). Clay turbidity may be controlled in ponds with low total hardness(often coincidental with low total alkalinity) by liming, which increases calcium ionconcentration, which, in turn, can attract the negatively charged colloidal clay particlesand promote flocculation (Boyd, 1995). However, lime takes time to dissolve, andwind action or mechanical aeration may diminish or deter any effect from liming.Application of organic fertilizer, for example, chicken litter, rice bran, at 500 kg/hadry matter can reduce or eliminate clay turbidity (Teichert-Coddington et al., 1992;Lin et al., 1997). Several applications of organic matter at 5e7-day intervals maybe necessary, and addition of nitrogen fertilizer (20 kg N/ha) may speed developmentof an algal bloom. Intractable clay turbidity can be treated with gypsum (calcium sul-fate) or alum (aluminium sulfate) (Boyd, 1979; Wu and Boyd, 1990; Boyd and Tucker,
42 Feed and Feeding Practices in Aquaculture

1998). Treatment with 250e500 mg gypsum/L or 10e30 mg alum/L was used toreduce clay turbidity. Note that 0.5 mg/L of total alkalinity is destroyed per 1 mg/Lalum added to the pond, so the pond may require additional liming.
2.9.2 Pond fertilization examples for young-of-year culture
Chemical and organic fertilizers are applied to increase natural productivity for young-of-year culture organisms as a means to promote rapid growth and improve survivalbefore and during feed training. In addition to stimulating algal productivity, pondfertilization aims to increase zooplankton populations, since these often are preferredfirst foods. There exists a vast body of literature on pond fertilization, a review ofwhich far exceeds the scope of this chapter. Some additional suggested readingsthat may be of interest to the reader are listed at the end of this chapter. A targeted liter-ature search may be beneficial to readers seeking additional information.
Rice bran, cottonseed meal, distiller’s dried grain, or a trout starter meal were eval-uated as organic fertilizers and applied in combination with chemical fertilizer (10-34-0)to promote zooplankton for young-of-year paddlefish (Polyodon spathula) (Mimset al., 1991, 1995). Total nitrogen application over the 40-day nursery period was43 kg/ha as organic fertilizer and 11 kg/ha as chemical fertilizer. Fertilizer was appliedat 2e3-day intervals. Significantly greater biomass of large cladoceran zooplankters,which are preferred by paddlefish, were observed with rice bran or trout starter meal.Fish growth, survival, and yield were higher in these ponds. Combined applicationof organic and chemical fertilizer appears to increase zooplankton productivity, butthe importance of each fertilizer type in stimulating zooplankton production cannotbe determined without testing organic and chemical fertilization individually as wellas in combination.
Channel catfish (Ictalurus punctatus) fry are stocked at high rates into recently filledand fertilized nursery ponds (Mischke, 2009). Although fry are offered a formulatedfeed immediately following stocking, natural productivity, especially zooplankton,comprise an important part of their diet during the first 3e4 weeks, after which formu-lated feed becomes the primary nutrient source for fish growth. Copepods (>650 mmtotal length, TL), cladocerans (450e700 mm TL), and ostracods (>450 mm TL) arepreferred by channel catfish fry (Mischke et al., 2003). In order to determine whetherorganic fertilization would stimulate production of preferred zooplankton, Mischkeand Zimba (2004) tested four fertilization regimes (no fertilizer, organic fertilizeronly, chemical fertilizer only, and organic plus chemical fertilizer) in newly con-structed ponds and ponds that had been in use for 16 years. Organically fertilizedponds received an initial application of 140 kg/ha cottonseed meal followed by28 kg/ha applied twice weekly. Chemical fertilizer ponds received an initial applica-tion of 20.2 kg N/ha and 2.0 kg P/ha followed by 10.3 kg N/ha and 0.8 kg P/ha appliedtwice weekly. The organic-chemical fertilizer treatment combined the component ap-plications. More nitrogen and phosphorus were available in ponds that received chem-ical fertilizer, either alone or with organic fertilizer, compared to organic fertilizer, andin old ponds compared to new ponds. Chlorophyll a and preferred zooplankton alsowere higher in ponds that received chemical fertilizer as well as in old ponds. Overall,
Fertilizers in aquaculture 43

there appeared to be little benefit to organic fertilization, and although the authorsadmit that the rates they used were low, they and Mischke (2009) argue that increasedrates of organic fertilization potentially increase risk and cost because emergency aera-tion may be needed in response to low dissolved oxygen. The use of organic fertiliza-tion in fry ponds merits further research. More importantly, though, this studydemonstrated a much greater need for nitrogen fertilization and that a much higherrate of chemical fertilization than is recommended traditionally is required for fryponds. The new recommendation calls for an initial application of 20 kg N/ha and2 kg P/ha, followed by subsequent applications of 10 kg N/ha and 1 kg P/ha. Addition-ally, newly constructed ponds may need even higher fertilizer application rates giventhe differential response to fertilization between old and new ponds.
Nursery ponds for hybrid striped bass (Morone chrysops � Morone saxatilis) fryare filled and fertilized, and fry are stocked at high numbers several days later (Ludwiget al., 1998; Ludwig, 2002, 2004). Zooplankton, beginning with rotifers and transition-ing over time to large cladocerans, are an important component of their diet. Formu-lated feed also is offered to fish. Organic and chemical fertilizers are applied together atrecommended rates to stimulate pond productivity (Ludwig et al., 1998; Ludwig,2004). Ludwig (2002) evaluated whether fry production could be increased byincreasing (2X, 3X, and 4X) the recommend fertilization rates. Total nitrogen appliedas organic fertilizer (rice bran) or chemical fertilizer ranged from 9.6 to 38.3 or19.9e79.6 kg N/ha, respectively, for the 1Xe4X treatments. Corresponding applica-tions of phosphorus were 7.2e28.7 or 58.2e232.6 kg P/ha, respectively. Zooplanktonabundance increased with increased fertilization rate, but fry survival and yielddecreased with increasing stocking rate. However, fish survival and yield were highand did not differ statistically when the fertilization rate was doubled. Further increasesin fertilization rate resulted in lower fish production. Poor fish production was attrib-uted to increasingly poorer water quality as fertilization rate increased. Thus, there arelimits to increasing production by increasing fertilization.
2.9.3 Fertilizerefeed combinations
Feeding a formulated feed often begins as soon as juvenile culture organisms arestocked into ponds for growth to stocker size or market size. However, juvenilesmay not require formulated feed until growth of the culture organism slows becauseit no longer can consume the natural food organisms efficiently or the biomass of nat-ural food organisms no longer can support rapid growth. Culture organism food habitsalso will determine how well it is able to utilize natural pond productivity for growth.In a polyculture experiment, common carp (Cyprinus carpio), silver carp (Hypophthal-micthys molitrix), and tilapia (Oreochromis aureus) were stocked into ponds that werefertilized daily with liquid cow manure (114.5 kg/ha dry matter) or where fish were fedhigh-quality formulated ration daily (Moav et al., 1977). Species-specific stocking rateand initial size were similar for the two treatments. Examination of growth curves forcommon carp showed no difference in growth during the first month, but that growthin the fertilizer treatment had slowed substantially by week 6, and at harvest fish wereless than half as large as those in the fed treatment. Growth curves for the silver carp
44 Feed and Feeding Practices in Aquaculture

and tilapia did not diverge visibly between treatments. Final individual weight by treat-ment differed by 3% for silver carp and by 15% for tilapia. Natural food no longercould sustain rapid growth of common carp after the first month, and feeding a formu-lated ration was required to maintain rapid growth. Silver carp were able to maintainrapid growth consuming natural food and did not benefit from the formulated ration.Tilapia did appear to benefit somewhat from being fed. Thus, organic fertilizationcould substitute for feeding during the first month with no loss of productivity.
Nile tilapia (Oreochromis niloticus, monosex males, average weight ¼ 15 g/fish)stocked at 2e3 fish/m2 and grown in monoculture do not need to be fed a formulatedration for up to 80 days when ponds are fertilized intensively. Additionally, fertiliza-tion in combination with reduced feeding rate can be as productive as feeding alone.Nile tilapia in ponds fertilized weekly with chicken litter (1000 kg/ha dry matter) weresignificantly smaller after 60 days than fish fed a formulated ration 6 days/week at 3%of biomass (Green, 1992). Despite significantly higher primary productivity in fertil-ized ponds, tilapia growth was food limited. Rapid growth was reestablished with sus-pension of fertilization and provision of formulated ration. A reduced fertilization(500 kg/ha/week chicken litter) plus feed (1.5% of biomass) treatment also was tested.At harvest 151 days after stocking, individual weight and net yield did not differsignificantly among treatments, although results for the reduced fertilization-feed treat-ment were about 12% less than the mean of the other two treatments.
Growth of tilapia fed at 50% or 75% of satiation in ponds that were fertilizedweekly with urea (28 kg N/ha) and TSP (7 kg P/ha) did not differ from fish fed dailyin ponds without fertilization (Diana et al., 1994). Final individual weight and netyield did not differ among these treatments in this 155-day study, although resultsfor the 50% satiation treatment were about 10% less than the mean of the othertwo treatments. Delaying initiation of feeding until Nile tilapia attain specific targetweights was evaluated in ponds fertilized weekly with chemical fertilizer (28 kg Nand 7 kg P/ha) throughout the study (Diana et al., 1996). Fish growth was similaramong treatments during the first 38 days of culture, at which time fish averaged50 g/fish, the first target weight. Growth of the fed (50% of apparent satiation) fishdiverged from that of unfed fish, and was significantly greater after 80 days, at whichtime fish in fertilized ponds averaged 100 g, the second target weight. Growth of fishin the second target group increased in response to feeding, similar to the responseseen for the first target group as well as in Green (1992). Fish in the first and secondtarget weight groups reached harvest size at the same time and had similar yields, but22% more feed was fed to fish in the first target weight group. Growth of fish wherefeeding was delayed until fish averaged 150 g or 200 g increased as in the other treat-ments once feeding was initiated, but grow out duration increased about 13% and26%, respectively. Thus, fertilization can substitute totally for feed during the earlypart of tilapia grow out, or partially substitute for feed throughout grow out.However, the production cycle will be increased if initiation of feeding is delayedtoo long.
Similar fertilizationefeeding strategies have been evaluated for freshwater andmarine shrimp. Juvenile freshwater prawns (Macrobrachium rosenbergii; averageweight ¼ 4.4 g) were stocked in ponds at 6/m2 in which prawns were offered only a
Fertilizers in aquaculture 45

formulated ration based upon prawn biomass, a formulated ration at 50% of the feed-only rate plus organic and chemical fertilizer, and a formulated ration (none during thefirst month, and 25% and 50% of the feed-only rate during months 2 and 3, respec-tively) plus organic and chemical fertilizer (Correia et al., 2003). Specific growthrate and net yield of prawns did not differ significantly in the feed-only and 50% rationtreatments, which indicated that natural productivity could substitute for half of theformulated feed ration. Feed conversion ratio was significantly lower in the 50% rationtreatment compared to the feed-only treatment, which indicates that prawns in thefeed-only treatment were overfed. However, natural productivity alone was unableto substitute completely for formulated ration during the first month, and lost growthnever was recovered once feeding at a reduced rate was initiated; final individualweight and net yield were less than half those in the other treatments, and althoughthe FCR was significantly lower, the prawns were not of marketable size. In anotherstudy, M. rosenbergii juveniles (0.05 g/prawn) were stocked at 10/m2 in ponds thatreceived formulated feed only, chicken manure only, or combinations of formulatedfeed plus manure (Maclean et al., 1989, 1994). Prawn growth in the formulatedfeed plus manure treatments was significantly faster than in the feed-only ormanure-only treatments. Survival among the feed-plus-manure and manure-only treat-ments did not differ, but was significantly lower than in the feed-only treatment, whichlikely was affected by the significantly greater survival in the feed-only treatment. As aresult, individual weight at harvest was significantly greater in the feed-plus-manuretreatments than in the feed-only or manure-only treatments, which did not differfrom one another. No treatment differences were detected for any water quality vari-able. While it appears that natural pond productivity enhanced by fertilization can sub-stitute partially for formulated ration in prawn production, additional research isneeded to confirm the results of these studies.
The effect of substituting organic fertilization for formulated feed during the first4e9 weeks of penaeid shrimp grow out was investigated by Teichert-Coddingtonet al. (1991). Juvenile shrimp (average weight ¼ 0.8 g/shrimp; 89% Litopenaeus van-namei, 11% Litopenaeus stylirostris) were stocked into ponds at 5/m2. The standardprotocol (60 kg/ha/week chicken litter during the first 8 weeks plus formulated ration)was compared to a feed-only treatment and treatments of weekly applications of onlychicken litter (60 kg/ha) for the first 4 or 8 weeks, followed by feed only. Survivalaveraged 65% among treatments. After 99 days, final individual weight and yield inthe standard and feed-only treatments were significantly greater than in the substitutiontreatments. Thus, the low rate of organic fertilization was insufficient to substitute forformulated ration during the first 4e8 weeks of grow out, and the inclusion of a lowweekly dose of organic fertilizer did not appear to improve production compared tofeed only. In a follow-on study, juvenile shrimp (average weight ¼ 0.8e1.2 g/shrimp;93% L. vannamei, 7% L. stylirostris) were stocked into ponds at 5.8/m2 (Teichert-Coddington et al., 1991). A revised standard protocol (100 kg/ha/week chicken litterduring the first 4e6 weeks plus formulated ration) was compared to weekly applica-tions of chicken litter only (220 kg/ha) during the first 8e9 week of culture followedby feed only. Survival in the standard protocol (69%) was significantly less than thefertilizer then feed (79%) treatment. However, no significant treatment differences
46 Feed and Feeding Practices in Aquaculture

were detected at harvest for mean individual weight and yield. Thus, organic fertiliza-tion was able to substitute for formulated feed during the initial 8e9 week of grow out.
Pacific white shrimp (L. vannamei) juveniles (0.5e1.0 g/shrimp) were stocked at15, 25, or 35 shrimp/m2 in culture units to evaluate the effect of a full and a restricted(50%) daily ration (Carvajal-Valdes et al., 2012). Culture units were fertilized twiceper week with urea (16 kg N/ha) and TSP (2.4 kg P/ha); the high fertilization rateapparently was to compensate for 5e15% daily water exchange. Shrimp survivalexceeded 90% in all culture units. Mean weight gain and yield did not differ signifi-cantly between the full and restricted daily ration but did decrease significantly asstocking rate increased. However, FCR (averaged across stocking rate) for shrimpfed the full ration (2.99) was nearly twice that for the shrimp fed the restricted ration(1.55) and demonstrates shrimp were overfed. These results indicate that the feed dailyration can be reduced by 50% when culture units are fertilized intensively.
Overall, these studies indicate that fertilization can substitute for feed for a definedperiod at the beginning of the culture cycle or partially substitute for feed throughoutthe culture cycle in semi-intensive production of fish or crustaceans as long as theculture organism is able to utilize the natural food organisms stimulated by fertiliza-tion. Natural productivity in ponds initially is driven by fertilizer nutrients, but thecontribution from feed nutrients increases as the culture organism biomass increasesand feed becomes the sole nutrient source once fertilization is suspended. Even inponds where fertilization substitutes partially for feed throughout the culture cycle,feed becomes the predominant nutrient source and driver of natural productivity.However, the benefits of increased primary productivity, for example, increasednatural food and utilization of excreted feed nitrogen, can be offset by increased phyto-plankton respiration or feed nitrogen excretion that exceeds phytoplankton utilization.Thus, feed nutrient (N and P) retention (see other chapters in this volume) must bemaximized so that pond water quality can be managed to ensure rapid growth of theculture organism.
2.10 Future trends
Fertilization recommendations for aquaculture ponds generally are derived fromresearch conducted at aquacultural experiment stations. While such recommendationsapply broadly to ponds with similar soil and water types, they often are generalized toan entire region or larger area. Consequently, fertilizer recommendations may not beoptimal because of insufficient or excessive provision of key nutrients. Fertilizer veri-fication trials, where fertilization recommendations are tested and compared on farm toexisting practices, are needed. Through such trials, not only can data be collected onthe effectiveness of the fertilizer recommendation, but also on pond history, and localpond soil and water quality. Collectively, these data will allow for refinement offertilizer recommendations with the goal of optimizing fertilizer nutrient utilization.
Pond fertilization strategies that target production of desirable populations ofphytoplankton and zooplankton for the culture organism’s life stages of interestneed further development and refinement. There is a need for a better understanding
Fertilizers in aquaculture 47
of fertilizer nutrient dynamics in the water column and in interactions with pond muds,of successional dynamics of desirable natural food organisms, of the role of pondhistory, and of frequency of fertilization. There is a need to reevaluate the role ofnitrogen fertilization as recent research has demonstrated that it may be required inmuch higher quantities than recommended previously. Similarly, it may be possibleto reduce phosphorus application rates, particularly in concert with higher nitrogenapplication rates. Fertilizer application at cool and cold water temperatures alsorequires additional research. Micronutrients typically are not included in chemicalfertilizers, and while there is some indication that their inclusion may be beneficialfor pond fertilization, additional research is needed. Both chemical and organicfertilizers should be considered as pond fertilization strategies are developed andrefined in order to optimize nutrient utilization in the most economically efficientmanner possible.
2.11 Sources of further information
Boyd, C.E., 1995. Bottom Soils, Sediment, and Pond Aquaculture. Chapman and Hall, NewYork.
Boyd, C.E., Tucker, C.S., 1998. Pond Aquaculture Water Quality Management. Kluwer Aca-demic Publishers, Boston.
Egna, H.S., Boyd, C.E., 1997. Dynamics of Pond Aquaculture. CRC Press, LLC, BocaRaton.
Knud-Hansen, C.F., 1998. Pond Fertilization: Ecological Approach and Practical Applications.Pond Dynamics/Aquaculture CRSP, Oregon State University, Corvallis. Available at: http://pdacrsp.oregonstate.edu/pubs/fertguide_PDF/PondFertilization-Knud-Hansen.pdf.
Mischke, C.C., 2012. Aquaculture Pond Fertilization: Impacts of Nutrient Input on Production.Wiley-Blackwell, Oxford.
Moriarty, D.J.W, Pullin, R.S.V., 1987. Detritus and Microbial Ecology in Aquaculture.ICLARM Conference Proceedings 14, International Center for Living Aquatic ResourcesManagement, Manila.
Reynolds, C.S., 1984. The Ecology of Freshwater Phytoplankton. Cambridge University Press,Cambridge.
References
Almazan, G., Boyd, C.E., 1978. An evaluation of Secchi disk visibility for estimating planktondensity in fish ponds. Hydrobiologia 61, 205e208.
Anderson, J.M., 1987. Production and decomposition in aquatic ecosystems and implications foraquaculture. In: Moriart, D.J.W., Pullin, R.S.V. (Eds.), Detritus and Microbial Ecology inAquaculture, Manila, ICLARM Conference Proceedings 14, International Center forLiving Aquatic Resources Management, pp. 123e147.
Arce, R.G., Boyd, C.E., 1975. Effects of agricultural limestone on water chemistry, phyto-plankton productivity, and fish production in soft water ponds. Trans. Am. Fish Soc. 104,308e314.
48 Feed and Feeding Practices in Aquaculture
ASABE (American Society of Agricultural and Biological Engineers), 2010. Manure Productionand Characteristics. St. Joseph, ASABE Standard D384.2. American Society of Agri-cultural and Biological Engineers. Available from: http://elibrary.asabe.org/azdez.asp?search¼1&JID¼2&AID¼32018&CID¼s2000&T¼2&urlRedirect¼ (accessed 26.09.14.).
Avault, J.W., 1996. Fundamentals of Aquaculture: A Step-by-Step Guide to CommercialAquaculture. AVA Publishing Company, Baton Rouge.
Avery, J.L., 2012. Controlling plant pests before fertilization. In: Mischke, C.C. (Ed.), Aqua-culture Pond Fertilization: Impacts of Nutrient Input on Production. Wiley-Blackwell,Oxford, pp. 73e91.
Bardach, J.E., Ryther, J.H., McLarney, W.O., 1972. Aquaculture: The Farming and Husbandryof Freshwater and Marine Organisms. Wiley-Interscience, New York.
Barkoh, A., Schlechte, J.W., Hamby, S., Kurten, G., 2005. Effects of rice bran, cottonseed meal,and alfalfa meal on pH and zooplankton. N. Am. J. Aquacult. 67, 237e243.
Boyd, C.E., 1979. Aluminum sulfate (alum) for precipitating clay turbidity from fish ponds.Trans. Am. Fish Soc. 108, 307e313.
Boyd, C.E., 1981. Solubility of granular inorganic fertilizers for fish ponds. Trans. Am. FishSoc. 110, 451e454.
Boyd, C.E., 1995. Bottom Soils, Sediment, and Pond Aquaculture. Chapman and Hall,New York.
Boyd, C.E., 1997. Practical aspects of chemistry in pond aquaculture. Prog. Fish-Cult. 59,85e93.
Boyd, C.E., Hollerman, W.D., 1981. Methods of applying liquid fertilizers to fish ponds. Proc.Ann. Conf. Southeast Assoc. Fish Wildl. Agencies 35, 525e530.
Boyd, C.E., Tucker, C.S., 1998. Pond Aquaculture Water Quality Management. KluwerAcademic Publishers, Boston.
Boyd, C.E., Musig, Y., 1981. Orthophosphate uptake by phytoplankton and sediment. Aqua-culture 22, 165e173.
Boyd, C.E., Musig, Y., Tucker, L., 1981. Effects of three phosphorus fertilizers on phosphorusconcentrations and phytoplankton production. Aquaculture 22, 175e180.
Boyd, C.A., Chaney, P.L., Boyd, C.E., Rouse, D.B., 2009. Distribution of ground water suitablefor use in saline-water aquaculture in central and west-central Alabama. J. Appl. Aquacult.21, 228e240.
Carvajal-Valdes, R., Arjona, E., Bueno, G., 2012. Feeding rate and stocking density in semi-intensive Litopenaeus vannamei culture with moderate periodic fertilization. J. Agricult.Biol. Sci. 7, 899e904.
Colman, J.A., Edwards, P., 1987. Feeding pathways and environmental constraints in waste-fedaquaculture: balance and optimization. In: Moriarty, D.J.W., Pullin, R.S.V. (Eds.), Detritusand Microbial Ecology in Aquaculture. ICLARM Conference Proceedings 14, Inter-national Center for Living Aquatic Resources Management, Manila, pp. 240e281.
Correia, E.S., Pereira, J.A., Silva, A.P., Horowitz, A., Horowitz, S., 2003. Growout of fresh-water prawn Macrobrachium rosenbergii in fertilized ponds with reduced levels offormulated feed. J. World Aquacult. Soc. 34, 184e191.
Das, S.K., Jana, B.B., 2003. Pond fertilization regimen: state-of-the-art. J. Appl. Aquacult. 13,35e66.
Diana, J.S., Lin, C.K., Jaiyen, K., 1994. Supplemental feeding of tilapia in fertilized ponds.J. World Aquacult. Soc. 25, 497e506.
Diana, J.S., Lin, C.K., Yi, Y., 1996. Timing of supplemental feeding for tilapia production.J. World Aquacult. Soc. 27, 410e419.
Fertilizers in aquaculture 49

Gadberry S., No Date. Composition of Some Livestock Feeds, Little Rock, PublicationFSA3043, Division of Agriculture, University of Arkansas. Available from: http://www.uaex.edu/publications/pdf/fsa-3043.pdf (accessed 26.09.14.).
Green, B.W., 1992. Substitution of organic manure for pelleted feed in tilapia production.Aquaculture 101, 213e222.
Hepher, B., 1962. Primary production in fish ponds and its application to fertilization experi-ments. Limnol. Oceanogr. 7, 131e136.
Hepher, B., 1978. Ecological aspects of warm-water fish pond management. In: Gerking, S.D.(Ed.), Ecology of Freshwater Fish Production. Blackwell Scientific Publications, Oxford,pp. 447e468.
Hickling, C.F., 1971. Fish Culture. Faber and Faber, London.Kirsten, A., 2013. The Agronomy Guide 2013-2014. Publication AGRS-026, College of
Agricultural Sciences, The Pennsylvania State University, University Park. Available at:http://pubs.cas.psu.edu/FreePubs/PDFs/agrs026.pdf (accessed 26.09.14.).
Knud-Hansen, C.F., 1998. Pond Fertilization: Ecological Approach and Practical Applications.Oregon State University, Corvallis, Pond Dynamics/Aquaculture CRSP.
Knud-Hansen, C.F., Batterson, T.R., 1994. Effect of fertilization frequency on the production ofNile tilapia (Oreochromis niloticus). Aquaculture 123, 271e280.
Knud-Hansen, C.F., Hopkins, K.D., Guttman, H., 2003. A comparative analysis of the fixed-input, computer modelling, and algal bioassay approaches for identifying pond fertiliza-tion requirements for semi-intensive aquaculture. Aquaculture 228, 189e214.
Kumar, M.S., Burgess, S.N., Luu, L.T., 2004. Review of nutrient management in freshwaterpolyculture. J. Appl. Aquacult. 16, 17e44.
Lawrence, J.M., 1954. A new method of applying inorganic fertilizer to farm fishponds. Prog.Fish-Cult. 16, 176e178.
Lin, C.K., Teichert-Coddington, D.R., Green, B.W., Veverica, K.L., 1997. Fertilization regimes.In: Egna, H.S., Boyd, C.E. (Eds.), Dynamics of Pond Aquaculture. CRC Press, LLC, BocaRaton, pp. 73e107.
Ludwig, G.M., 2002. The effects of increasing organic and inorganic fertilizer on water quality,primary production, zooplankton, and Sunshine bass, Morone chrysops � M. saxatilis,fingerling production. J. Appl. Aquacult. 12, 1e29.
Ludwig, G.M., 2004. Hybrid Striped Bass: Fingerling Production in Ponds, Stoneville. SRACPublication No. 302. Southern Regional Aquaculture Center. Available at: https://srac.tamu.edu/index.cfm/getFactSheet/whichfactsheet/56/ (accessed 29.09.14.).
Ludwig, G.M., Stone, N.M., Collins, C., 1998. Fertilization of Fish Fry Ponds, Stoneville.SRAC Publication No. 469. Southern Regional Aquaculture Center. Available at: https://srac.tamu.edu/index.cfm/getFactSheet/whichfactsheet/116/ (accessed 29.09.14.).
Maclean, M.H., Ang, K.J., Brown, J.H., Jauncey, K., 1989. The effect of organic fertilizer andformulated feed in pond culture of freshwater prawn, Macrobrachium rosenbergii[de Man]: prawn production. Aquacult. Fish Mngt. 20, 399e406.
Maclean, M.H., Brown, J.H., Ang, K.J., Jauncey, K., 1994. Effect of organic fertilizer andformulated feed in pond culture of the freshwater prawn, Macrobrachium rosenbergii(de Man): pond productivity. Aquacult. Fish Mngt. 25, 729e740.
Metzger, R.J., Boyd, C.E., 1980. Liquid ammonium polyphosphate as a fish pond fertilizer.Trans. Am. Fish Soc. 109, 563e570.
Milstein, A., 2012. Pond ecology. In: Mischke, C.C. (Ed.), Aquaculture Pond Fertilization:Impacts of Nutrient Input on Production. Wiley-Blackwell, Oxford, pp. 23e32.
Mims, S.D., Clark, J.A., Tidwell, J.H., 1991. Evaluation of three organic fertilizers for pad-dlefish, Polyodon spathula, production in nursery ponds. Aquaculture 99, 69e82.
50 Feed and Feeding Practices in Aquaculture
Mims, S.D., Clark, J.A., Williams, J.C., Bayne, D.R., 1995. Factors influencing zooplanktonproduction in organically fertilized ponds for culture of paddlefish, Polyodon spathula.J. Appl. Aquacult. 5, 29e44.
Mischke, C.C., 2009. The case against using organic fertilizer in channel catfish, Ictaluruspunctatus, nursery ponds. J. World Aquacult. Soc. 40, 832e836.
Mischke, C.C., 2012. Management strategy 3: fixed-rate fertilizer applications. In:Mischke, C.C. (Ed.), Aquaculture Pond Fertilization: Impacts of Nutrient Input on Pro-duction. Wiley-Blackwell, Oxford, pp. 129e134.
Mischke, C.C., Zimba, P.V., 2004. Plankton community responses in earthen channel catfishnursery ponds under various fertilization regimes. Aquaculture 233, 219e235.
Mischke, C.C., Wise, D.J., Lane, R.L., 2003. Zooplankton size and taxonomic selectivity ofchannel catfish fry. N. Am. J. Aquacult. 65, 141e146.
Moav, R., Wohlfarth, G., Schroeder, G.L., Hulata, G., Barash, H., 1977. Intensive polyculture offish in freshwater ponds. I. Substitution of expensive feeds by liquid cow manure. Aqua-culture 10, 25e43.
Murad, H., Boyd, C.E., 1991. Production of sunfish (Lepomis spp.) and channel catfish(Ictalurus punctatus) in acidified ponds. Aquaculture 94, 381e388.
Musig, Y., Boyd, C.E., 1980. Comparison of polyphosphate and orthophosphate as fertilizers forfish ponds. Aquaculture 20, 135e138.
Qin, J.G., 2012. Management strategy 1: manipulation of pond nutrient ratios. In: Mischke, C.C.(Ed.), Aquaculture Pond Fertilization: Impacts of Nutrient Input on Production. Wiley-Blackwell, Oxford, pp. 95e109.
Qin, J., Culver, D.A., Yu, N., 1995. Effect of organic fertilizer on heterotrophs and autotrophs:implications for water quality management. Aquacult. Res. 26, 911e920.
Rasnake, M., Thom, B., Sikora, F., 2000. Using Animal Manures as Nutrient Sources.Bulletin AGR-146, Cooperative Extension Service, College of Agriculture, University ofKentucky, Lexington. Available at: http://www2.ca.uky.edu/agc/pubs/agr/agr146/agr146.pdf(accessed 26.09.14.).
Reynolds, C.S., 1984. The Ecology of Freshwater Phytoplankton. Cambridge University Press,Cambridge.
Sawyer, J., 2009. What Are Average Manure Nutrient Analysis Values? Ames, Soil Fertility:Current Topic. Agronomy Extension, Iowa State University. Available at: http://www.agronext.iastate.edu/soilfertility/currenttopics/WhatAreAverageManureNutrientAnalysisVal.es_1-24-09.pdf (accessed 26.09.14.).
Schroeder, G.L., 1978. Autotrophic and heterotrophic production of micororganisms inintensely-manured fish ponds and related fish yields. Aquaculture 14, 303e325.
Silapajarn, K., Boyd, C.E., Silapajarn, O., 2004. An improved method for determiningthe fineness value of agricultural limestone for aquaculture. N. Am. J. Aquacult. 66,113e118.
Silapajarn, K., Silapajarn, O., Boyd, C.E., 2005. Evaluation of lime requirement procedures andliming materials for aquaculture ponds in Thailand. J. Appl. Aquacult. 17, 77e88.
Teichert-Coddington, D.R., Behrends, L.L., Smitherman, R.O., 1990. Effects of manuringregime and stocking rate on primary production and yield of tilapia using liquid swinemanure. Aquaculture 88, 61e68.
Teichert-Coddington, D.R., Green, B.W., Parkman, R.P., 1991. Substitution of chicken litter forfeed in production of penaeid shrimp in Honduras, Central America. Prog. Fish-Cult. 53,150e156.
Teichert-Coddington, D.R., Green, B.W., Phelps, R.P., 1992. Influence of site and season onwater quality and tilapia production in Panama and Honduras. Aquaculture 105, 297e314.
Fertilizers in aquaculture 51

Teichert-Coddington, D.R., Boyd, C., Martinez de Pinel, D., 1997. Solubility of selectedinorganic fertilizers in brackish water. J. World Aquacult. Soc. 28, 205e210.
Wohlfarth, G.W., Schroeder, G.L., 1979. Use of manure in fish farming e a review. Agricult.Wastes 1, 279e299.
Wu, R., Boyd, C.E., 1990. Evaluation of calcium sulfate for use in aquaculture ponds. Prog.Fish-Cult. 52, 26e31.
Yi, Y., Lin, C.K., Diana, J.S., 2003. Techniques to mitigate clay turbidity problems in fertilizedearthen ponds. Aquacult. Eng. 27, 39e51.
Zhu, Y., Yang, Y., Wan, J., Hua, D., Mathias, J.A., 1990. The effect of manure applicationrate and frequency upon fish yield in integrated fish farm ponds. Aquaculture 91,233e251.
52 Feed and Feeding Practices in Aquaculture