fertilizer deep placement technology
TRANSCRIPT

Like us on Facebook facebook.com/agrilinks
Participate during the seminar:
Follow us on Twitter twitter.com/agrilinks
#AgEvents
Fertilizer Deep Placement Technology A Useful Tool in Food Security Improvement
Speakers Samba Kawa, USAID/BFS
Upendra Singh, IFDC John H. Allgood, IFDC
Facilitator
Zachary Baquet, USAID Bureau for Food Security
Date April 24, 2013

Upcoming Events
Upcoming Agrilinks Events: • InnovATE e-Consultation | May 7-8
• Ag Sector Council | May 29 | Horticulture

Learning Lab

Samba Kawa Bio
Samba Kawa USAID/BFS
Samba Kawa is an Agriculture Development Officer with USAID/BFS. Samba currently manages two USAID-funded programs being implemented by IFDC and SANREM. Prior to USAID Kawa had over 7 years of experience in seed multiplication, farmer training and agricultural extension and research while working with the Seed Multiplication Project. Samba was also a New York City Teaching Fellow and taught middle school science. Samba holds a Ph.D. in Soil Science from NC State University, Raleigh, an MS in Soil Science from China, an MA in Education from NYC and a B.Sc. from the University of Sierra Leone.

Upendra Singh Bio
Upendra Singh IFDC
Dr. Singh has extensive research experience in many aspects of soil fertility improvement. Dr Singh is leading the IFDC research activity to assess the environmental consequence of FDP technology vis-à-vis conventional surface application of urea on flooded rice. Over the last 20 years he has been responsible for the development of the lowland nitrogen model, phosphorus model, crop growth models and the Phosphate Rock Decision Support System. Dr Singh also coordinated the IFDC/IRRI Collaborative Program in Los Banos, Philippines from 1992-97, where his research was on appropriate nutrient management for rice-based cropping systems.

John H. Allgood Bio
John H. Allgood IFDC
John H. Allgood has more than 35 years of experience in fertilizer marketing including marketing system design and development, human capacity building, institutional development, market information systems development, credit system development, and policy analyses. One of the many projects he manages is the Accelerating Agriculture Productivity Improvement (AAPI) Project in Bangladesh. The AAPI project is achieving rapid diffusion of FDP technology through a business model that incorporates interventions that build both supply and demand and that support sustainability through strong public and private sector linkages.
IFDC
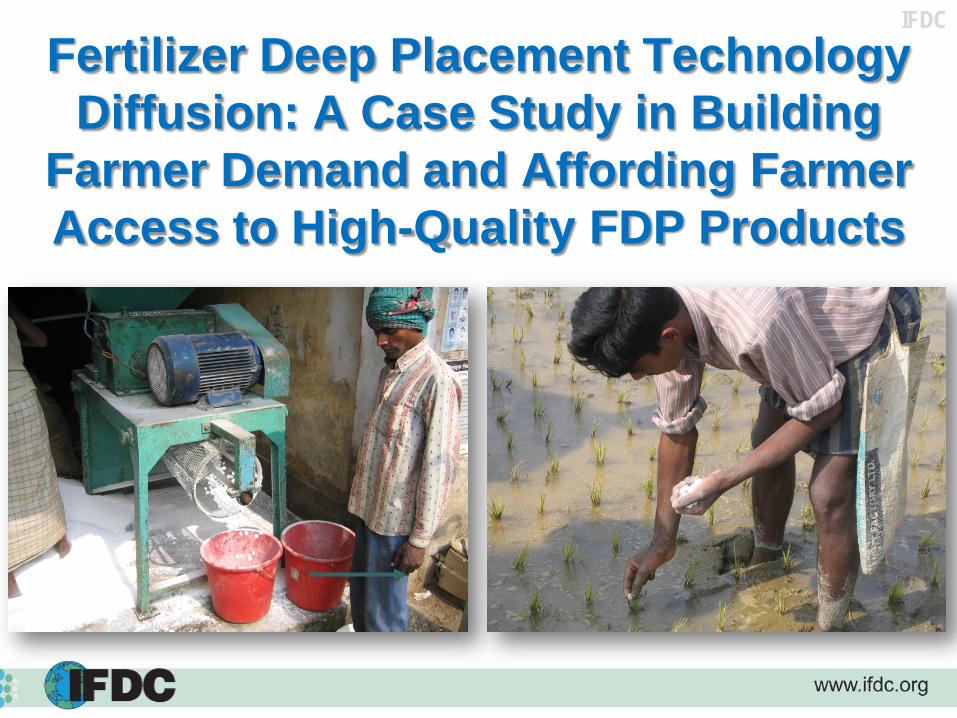
Fertilizer Deep Placement Technology Diffusion: A Case Study in Building
Farmer Demand and Affording Farmer Access to High-Quality FDP Products

IFDC Accelerating Agriculture Productivity Improvement (AAPI) in Bangladesh
Goal – Improve food security and accelerate income growth in rural areas by sustainably increasing agriculture productivity
Objectives – Improve agriculture productivity through increased efficiencies Improve farmer awareness and
knowledge Improve farmer access to
technologies Strengthen support systems needed
for sustainability

IFDC
Strategic Approach: Employ Market-Oriented Concepts:
– Supply system development – Create awareness and demand for FDP products
Achieve Stakeholder Participation at All Levels – Research and technology validation – Farmer education – Policy constraint alleviation
Design and Implement M&E System and Information Dissemination
– Measuring progress and impact – Lessons learned

IFDC FDP Technology Dissemination: Cross-Cutting Issues
Capacity Building – Public Sector: NARS/MOA/DAE – Private: BFA/Other
Gender Dimensions Environmental

IFDC
Prilled Urea
Briquette Machine for USG
USG
How to Prepare USG
USG is produced from prilled or granular urea by pressing with rollers in a briquette machine
to produce granules 1.8 and 2.7 grams

IFDC
Prilled Urea Urea Briquettes
Urea
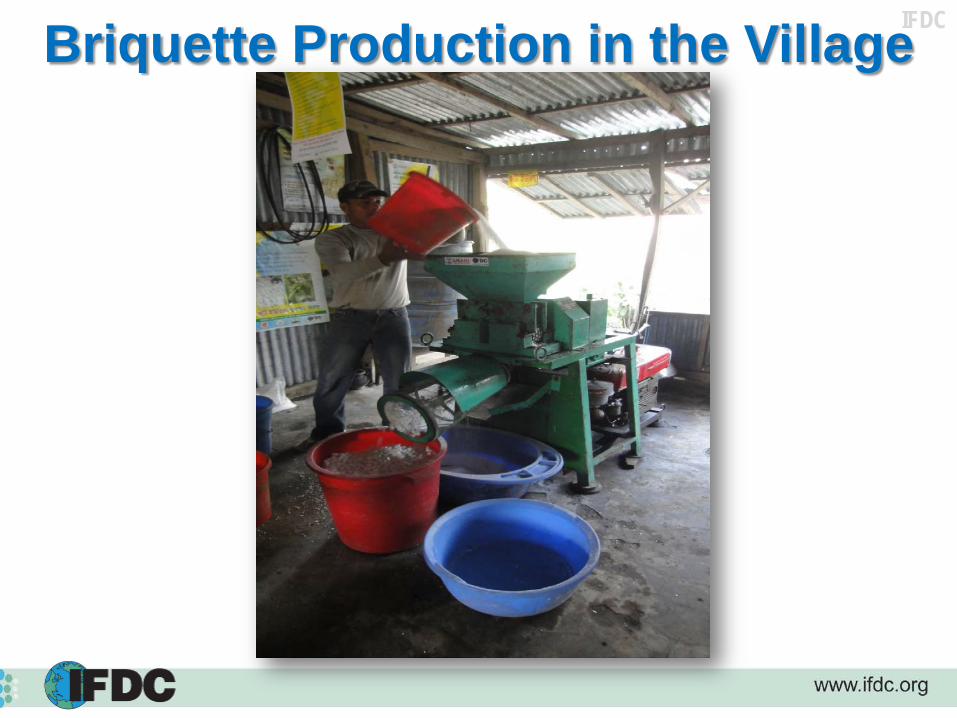
IFDC Briquette Production in the Village

IFDC
Indicator Units Target Rice area under FDP technology Million ha 1.8
Farmers using FDP technologies Million 3.5
Micro-enterprises producing USG and/or NPK briquettes No. 1,800
Farmers using an applicator Million 1
GOB savings from decreased application of urea Million $ 84.50
Increase in rice production Million mt 3.32
Value of increase in rice production Million $ 1,100
Increased income per farm per annum USD 262
AAPI End-of-Project Result Indicators

IFDC Boro 2013 AAPI Activities
Activities Units Accomplished Farmer Training Batches
(40/Batch) 2,828
Technology Demonstrations Number 482 Stakeholders Workshop
Number 40
Bill Board (Established different period)
Number 12
Field Days (Planned) Number 67
Crop Cuts (Planned) • Demo plots (435) • Trial plots (31) • Farmers plots (1,000)
Number 1,466

IFDC
Guti Urea Applied Plot
Broadcasted Urea Applied
Plot Yield
Increment Rice Yield (kg/ha) 4,624 4,005 619
Boro 2012 (Dry Season Rice)
Guti Urea Applied Plot
Broadcasted Urea Applied Plot
Urea Saving
Urea Application (kg/ha) 167 269 102
Guti Urea Applied Plot
Broadcasted Urea Applied Plot
Value of Urea
Saving Cost of Urea ($/ha) 3,674 5,380 $21

IFDC
0
200
400
600
800
1000
1200
1400
0
500
1,000
1,500
2,000
2,500
3,000
3,500
4,000
4,500
2010 2011 2012
UD
P A
rea
(‘000
’ ha
)
Gut
i Ure
a U
sers
(‘00
0’)
Demand Growth of Guti Urea under AAPI – cumulative –
UDP Area Guti Urea Users

IFDC
0 100 200 300 400 500 600 700 800 900 1000
0
50
100
150
200
250
300
2010 2011 2012
No.
of M
achi
nes
‘000
’ M
T Supply Growth of Guti Urea under AAPI
Guti Urea Machine Guti Urea Use

IFDC
IFDC

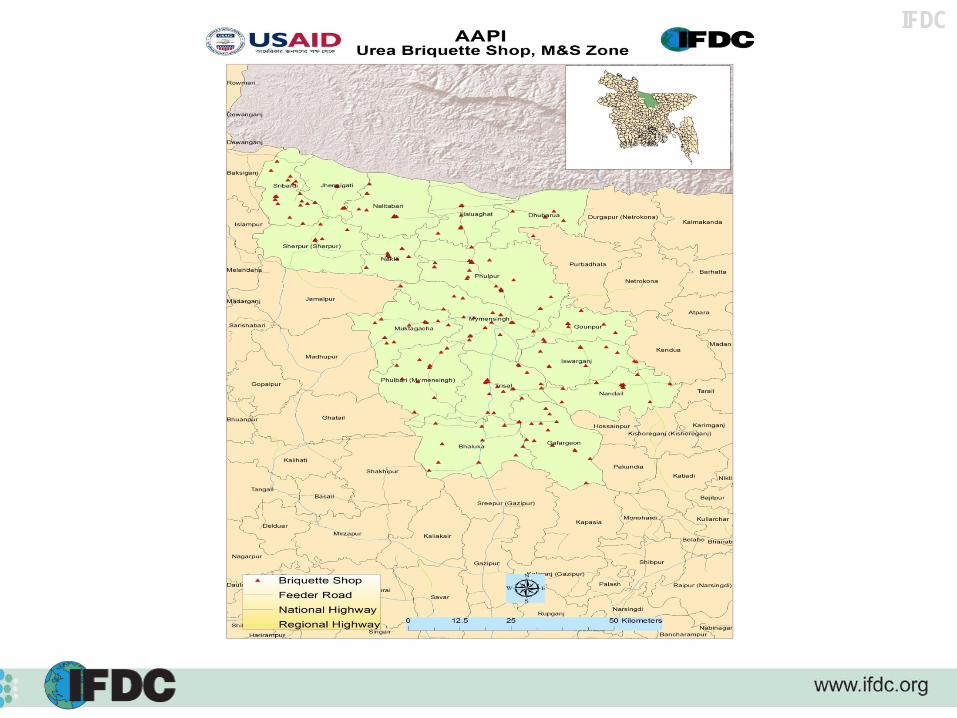
IFDC Urea Briquette Shop

IFDC
Item Amount Total variable cost per mt (US $) 262 Selling price per mt (US $) 275 Contribution (to fixed cost) (US $) 13 Payback sales volume (mt) 179 Payback period (months) 18-24
Source: Urea Briquette Producers Survey, January 2013.
Payback Period: Urea Briquette Producer Investment
NOTE: Total cost is US $2,320 and planned useful life is 7.5 years.

IFDC
Result Indicators Units Target Actual
% of Achievement
Guti Urea Manufactured/Sold
Metric Ton - 252,817 -
Guti Urea Dealers/Machines Installed
Number 730 897 123%
Farmers Applied Guti Urea in last three rice seasons
Number 2,516,732 4,125,860 164%
Rice Area under Guti Urea in last three rice seasons
Hectare 1,258,366 1,317,652 105%
AAPI Results Achieved through December 2012

IFDC
Result Indicators Units Target Actual
% of Achievement
Incremental Rice Production
Metric Ton
983,287 863,432 88%
Increased Value of Rice
Million US $
314.65 299.88 95%
Urea Saved Metric Ton
120,114 120,237 100%
Value of Urea Saved
Million US $
40.83 67.43 165%
GOB Savings on Urea Subsidy
Million US $
22.89 42.47 186%
AAPI Results Achieved through December 2012

IFDC Sustainability of Progress
(Opportunities and Challenges) Farmer Education Ease of Application Technology Promotion Economic Returns Product Enhancement (NPK) and
Performance Extension to Other crops GOB Policy Profitability Quality Control Business Linkage Development Dealer Capacity (Knowledge) Building
*Demand-Side
*Supply-Side

IFDC Injector-Type Self-Loaded Applicator

IFDC Applicator in Field Operation

IFDC Single Row Applicator

IFDC
Single Row Applicator Field Operation

IFDC Deep Placement Technology: Sub-Surface Application of Urea
Global food security is challenged by many issues, including weather and climate variability, degraded soils and persistent poverty.
Objective – Improve agriculture productivity through increased efficiencies of resources
Goal of APPI– Improve food security and accelerate income growth in rural areas by sustainably increasing agriculture productivity

IFDC How Deep Placement Works?
CO2

IFDC N Balance for UDP and Split Applied Urea
in Wetland Rice. IRRI-IFDC
In Grain42%
In Straw23%
In Soil31%
Unaccounted4%
In Grain23%
In Straw9%
In Soil33%
Unaccounted35%
Deep Placed Urea Briquette Split
Application

IFDC Productivity Gains with Deep Placement
Urea Briquette
NPK Briquette

IFDC A. Dry (Boro) season, 28 trials
Nitrogen Applied (kg N ha-1)
0 20 40 60 80 100
Gra
in Y
ield
(kg
ha-1
)2500
3000
3500
4000
4500
5000
5500
Broadcast prilled ureaDeep placed urea briquette
B. Wet season, 31 T. Aman trials
Nitrogen Applied (kg N ha-1)
0 20 40 60 80 100
Gra
in Y
ield
(kg
ha-1
)
2600
2800
3000
3200
3400
3600
3800
4000
4200
4400
Broadcast prilled ureaDeep placed urea briquette
Grain Yield Increases:
(Source: Annual reports, Bhuiyan et al., 1998)
Research Trials on UDP Conducted by
Bangladesh Research Institutions
(BRRI, BARI, and BINA)

IFDC
Comparison of Rice Grain Yield with Urea Briquette Deep Placement andBroadcast Split Urea Application from 2009-2010 Demonstration Plots
Grain Yield with Broadcast Urea (t ha-1)
2 3 4 5 6 7 8 9 10 11
Gra
in Y
ield
with
Dee
p Pl
acem
ent (
t ha-1
)
2
3
4
5
6
7
8
9
10
11
Aus 2009T. Aman 2009Boro 2010Boro 2009
1:1 Line
Y = 0.975 + 1.04 x (r2 = 0.83, N = 315)
Consistent Yield Increase – Across Seasons

IFDC
Rice
Gra
in Y
ield
(t h
a-1)
0
2
4
6
8
10
UDP Urea Yield difference
NigerNigeria Mali
SenegalBurkina
MEAN
Madagascar
RwandaTogo
Gains in Sub-Saharan Africa

IFDC Rice Grain Yield, Nangarhar, Afghanistan
Tillage Practice
Conventional Tillage Zero Tillage
Ric
e G
rain
Yie
ld (t
ha-1
)
0
1
2
3
4
5
6
7
8
9
10
11
12 Urea LCC with var. Kunduz-1UDP with var. Kunduz-1Urea LCC with var, Basmati-385UDP with var. Basmati-385LSD (.05) = 0.67

IFDC Less Weeds (Labor, Herbicide)
Weed Control
Labor Cost Index (US Dollars * Ton-1 of Paddy)
0 5 10 15 20 25 30 35 40
Cu
mu
lativ
e F
requ
en
cy (
%)
0
10
20
30
40
50
60
70
80
90
100
Urea BroadcastedUrea Deep Placed
KSa = 11.26 **
[Ȳ BRD=11.5] > [Ȳ UDP=6.94]**

IFDC Improved N Efficiency – Partial Factor Productivity
Comparison of Partial Factor Productivity (Grain Yield with Soil N and Fertilizer N per kg Applied N)
for 2009-2010 Demonstration Plots
Grain Yield (kg) per kg N Applied using Prilled Urea
20 30 40 50 60 70 80 90 100 110 120 130 140
Gra
in Y
ield
(kg)
per
kg
N a
pplie
d us
ing
UD
P
20
30
40
50
60
70
80
90
100
110
120
130
140
Aus 2009T. Aman 2009Boro 2010Boro 2009
Y = 49.1 + 0.925 x (r2 = 0.38, N = 315)
1:1 Line

IFDC
53-14-2578-14-25
78-28-25120-28-25 -1
Appa
rent
N R
ecov
ery
(%)
30
35
40
45
50
55
60
65
70
75
80
85
90
BroadcastDeep-Placed
LSD = 14.6Improved N Efficiency
Technology Country Farmer Practice-Urea Urea Deep Placement
AEN VCR AEN VCR
Niger 36 3.5 59 5.9 Nigeria 49 4.8 70 7.0 Madagascar 44 5.5 63 8.0 Mali 41 3.3 64 6.7 Senegal 50 3.5 69 7.3 Burkina 31 3.1 44 4.3 Rwanda 35 3.5 46 4.6 Togo 28 2.7 33 3.2 Mean 39 3.7 56 6.0
Urea Briquette
NPK Briquette

IFDC Environmental Gains with Deep Placement
• Point Placement = high ammoniacal N concentration (NH4-N > 3,000 ppm) inhibition of nitrification
• Less N Loss = N Fertilizer Savings
• Deep Placement = reduced zone soil placement
Air (80% Nitrogen) Ammonia Urea
Energy and Feedstock (Natural Gas)
Energy (Natural Gas) and Carbon Dioxide
980 kg CO2 Equivalent GHG Emission
4-Barrels Energy 1 ton Urea

IFDC
Reduced N Loss
Days After Fertilizer Application
0 2 4 6 8 10 12
Floo
dwat
er N
Con
tent
(g m
-2)
0.00
0.02
0.04
0.06
0.08
0.10
0.12
0.14 Zero N78(:14:25) Prilled Urea 78(:14:25) Urea Briquette 78:14:25 NPK Briq.
LSD = 0.015

IFDC
Cumulative Ammonia Volatilization Loss from Guthrie Soil
Days
0 2 4 6 8 10 12 14 16 18
NH3-N
Los
s (%
N A
pplie
d)
0
5
10
15
20
25
30
35
40
45
Urea AgrotainUDP
Environmental Gains with Deep Placement
IFDC
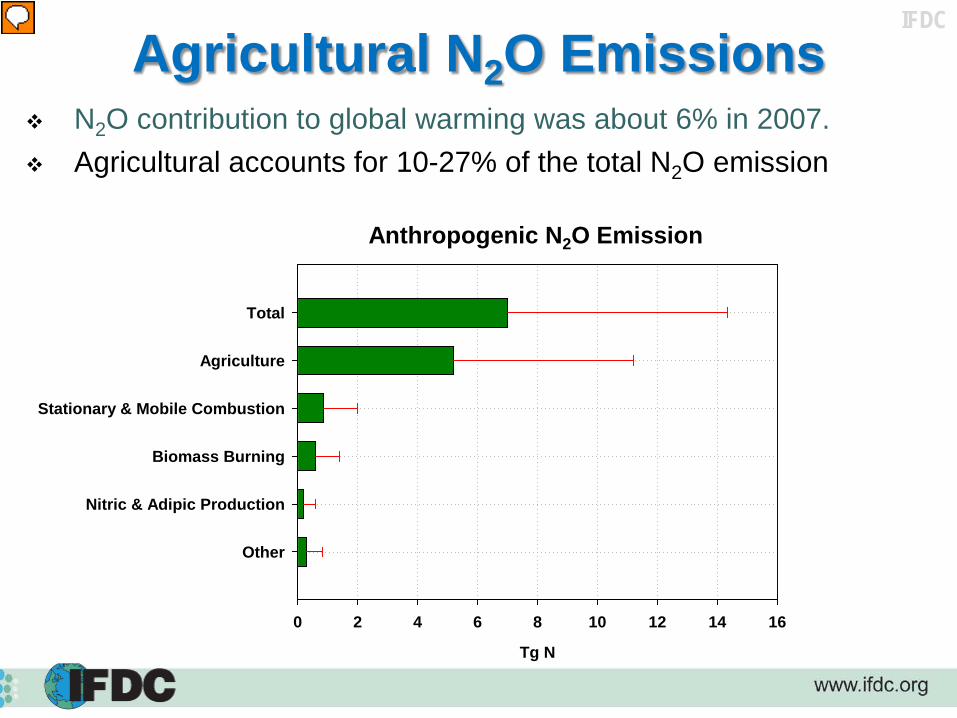
Agricultural N2O Emissions N2O contribution to global warming was about 6% in 2007. Agricultural accounts for 10-27% of the total N2O emission
Tg N
0 2 4 6 8 10 12 14 16
Other
Nitric & Adipic Production
Biomass Burning
Stationary & Mobile Combustion
Agriculture
Total
Anthropogenic N2O Emission

IFDC
Importance of Quantifying N2O Emission
Ravishankara et al. (2009)
N2O Largest Remaining Ozone ThreatO
DP-
Wei
ghte
d Em
issi
on (k
ilo to
ns/y
r)
0
100
200
300
400
500
19872008
N2O CFC-11 CFC-12 CFC-113 H1211 H1301 CCI4 CH3CCI3 CH3Br

IFDC Methodology
Continuous measurement using Gas Filter Correlation N2O analyzer (Model 320EU, Teledyne API) and Chemiluminescence NO-NOx Analyzer (Model 200E, Teledyne API)
Data recorded using CR3000 (Campbell Scientific) Each chamber (57.1 liter) is sampled 8 times a day (3 hour interval) Chamber remains closed only for 40 minutes during each sampling
time

IFDC
Day in 2012
100 150 200 250 300 350
N2O
Em
issi
on (n
g/m
2 -sec
)
0
50
100
150
200
250
300
Preplant StageUDPUrea splitZero N
Urea Topdress
Non-flooded
Harvest
Transplanting
Nitrous Oxide (N2O) Emission
N2O emission prior to flooding, during lowland rice crop, and during post-harvest drying.

IFDC NO Emission During Cropping Cycle
NO Emission During Preplant (43 days) and Flooded Rice (224 days)
Pre-plant
NO
(kg
N h
a-1)
0.00
0.05
0.10
0.15
0.20
0.25
Zero N
Urea split
UDP
NO emission during preplant stage is higher than during rice cropping. Urea application had higher emissions than zero N and UDP treatments.

IFDC N2O Emission During Cropping Cycle
N2O emission during preplant stage is higher than during rice cropping. Urea application had higher emissions than zero N and UDP treatments.
N2O Emission During Preplant (43 days) and Flooded Rice (224 days)
Pre-plant
N2O
(kg
N h
a-1)
0.0
0.2
0.4
0.6
0.8
1.0
Zero N
Urea split
UDP

IFDC Long-Term Effect of Urea Deep
Placement on Soil Health
Urea Deep Placement Urea
Broadcast Incorporation

IFDC Long-Term Effect – C Sequestration
Comparison of Organic Matter Content with UDP and Urea
Organic Matter Content (%)
0.5 1.0 1.5 2.0 2.5 3.0 3.5
Soil
Dep
th (c
m)
-70
-60
-50
-40
-30
-20
-10
0
Urea UDP
1% increase in C for 10 cm soil depth = 10 t ha-1 C

IFDC
Long-Term Effect – Total Soil N Content
Comparison of Soil Total Nitrogen with UDP and Urea
Total N Content (%)
0.06 0.08 0.10 0.12 0.14 0.16 0.18 0.20 0.22 0.24So
il D
epth
(cm
)
-70
-60
-50
-40
-30
-20
-10
0
Urea UDP

IFDC Summarizing - Deep Placement Resulted In: Reduced N loss (up to 50%) Improved rice grain yield (15-35%); also for upland crops Less N fertilizer use (25-40%) Up to 50 kg additional rice grain per kg N Significantly higher P recovery Increased C sequestration (roots, algae) Much of N2O and NO emission occurred during the preplant
stage when soil was saturated/flooded prior to rice transplanting
Both N2O and NO emissions were significantly lower with UDP compared to urea
Less weeding with UDP
Implications for CDM: N fertilizer, N2O-NOx, CO2 fixed

IFDC
Future Research
Continuous field level quantification of N2O-NOx emission in rice-based cropping. USAID supported project at two sites in Bangladesh by May 2013.
Quantify CO2 capture from deep-placed urea briquette.
Quantify residual effect/revise recommendations.
Increased applicator options.
Urea application100 kg CO2 Equiv GHG per ton rice

IFDC
Thank You

Thank you for joining us!
Upcoming Events Share Feedback Stay In Touch
Agrilinks and the Agriculture Sector Council Seminar Series are products of the USAID Bureau for Food Security under the Knowledge-Driven Microenterprise Development (KDMD) project.
End Slide
Please take our 3 minute survey: http://bit.ly/AprilASC You can also visit the event page to post comments & questions.
Contact Us: [email protected] OR Zachary Baquet, USAID/BFS [email protected]
InnovATE e-Consultation | May 7-8 Ag Sector Council May 29 | Horticulture