fertility (within and across cohorts) what is available over time? longitudinal perspectives ...
Post on 21-Dec-2015
214 views
TRANSCRIPT

Fertility(within and across cohorts)
What is available over time?
Longitudinal perspectives
Complimentary analytical inputs and outputs
How to approach using the data
Causes and Caveats
Men and women
Methodological comparative strengths

Focus: Male FertilityWhat is available over time?
Longitudinal perspectives
Caveats/Constraints
Methodological comparative strengths

The Fertility Questions:Variations in wording and depth across cohorts.More recent data is more comprehensive!When possible use “created variables”– save yourself lots of work!For the 1979 cohort – created longitudinal fertility and relationship rosters linking individuals over time for men and womenFor the 1997 cohort—more depth: for the Young Adults, more history
cohorts compliment each other.

Selected Unique Features
(e.g. 1979 cohort and children)Interviewed – again and again and again and again…and againSiblings (and cousins!)Enhancement through pooling (but with care!)Cross-Generational possibilitiesLarge minority samples (Black & Hispanic 79 & 97) Linking actual and expectations For YA – increasing representation over time!

1979 Male Cohort1) a) Some early gaps because cohort is 14-21 at beginning (born 1958-1964)
b) Live birth history from 1979 on
c) Data cleanup suggests that quality is “reasonable” – more for numbers born than dates of birth.
d) Can be linked closely with full range of family employment, other related transitions, and activities.
e) As of 2004, youngest respondent is now almost 40, and virtually all of their lifetime fertility up to that point is within survey years!
f) Large sample, including Hispanic and African-American oversamples!
g) Created variables
2) Cohort bound!
3) Siblings
1979 Young-Adult Male Cohort
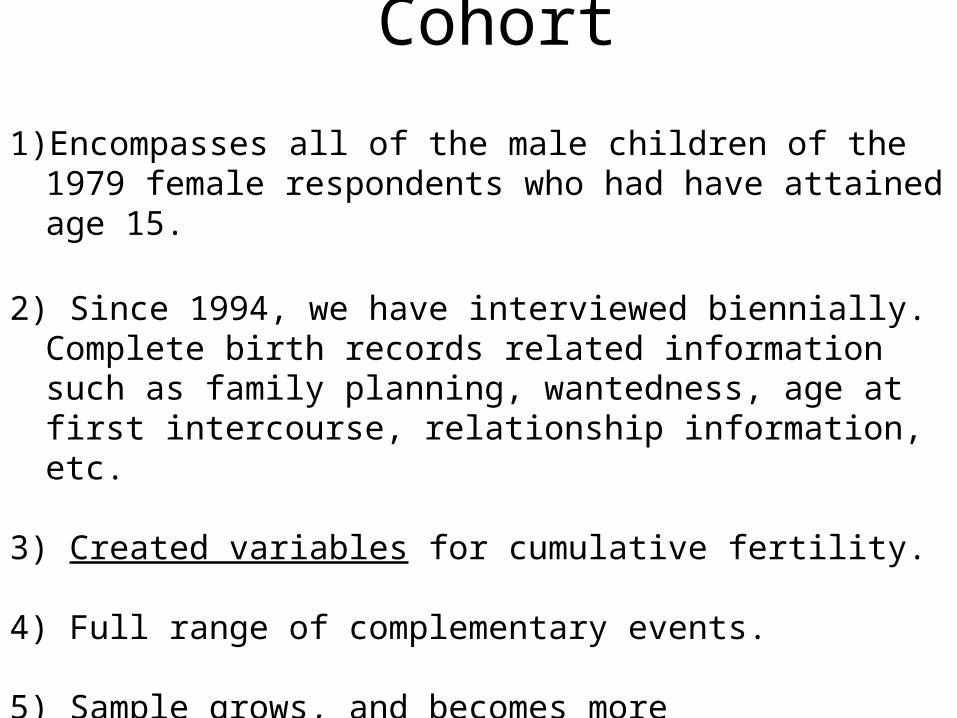
1)Encompasses all of the male children of the 1979 female respondents who had have attained age 15.
2) Since 1994, we have interviewed biennially. Complete birth records related information such as family planning, wantedness, age at first intercourse, relationship information, etc.
3) Created variables for cumulative fertility.
4) Full range of complementary events.
5) Sample grows, and becomes more representative, with every survey round!
1979 Young-Adult Male Cohort
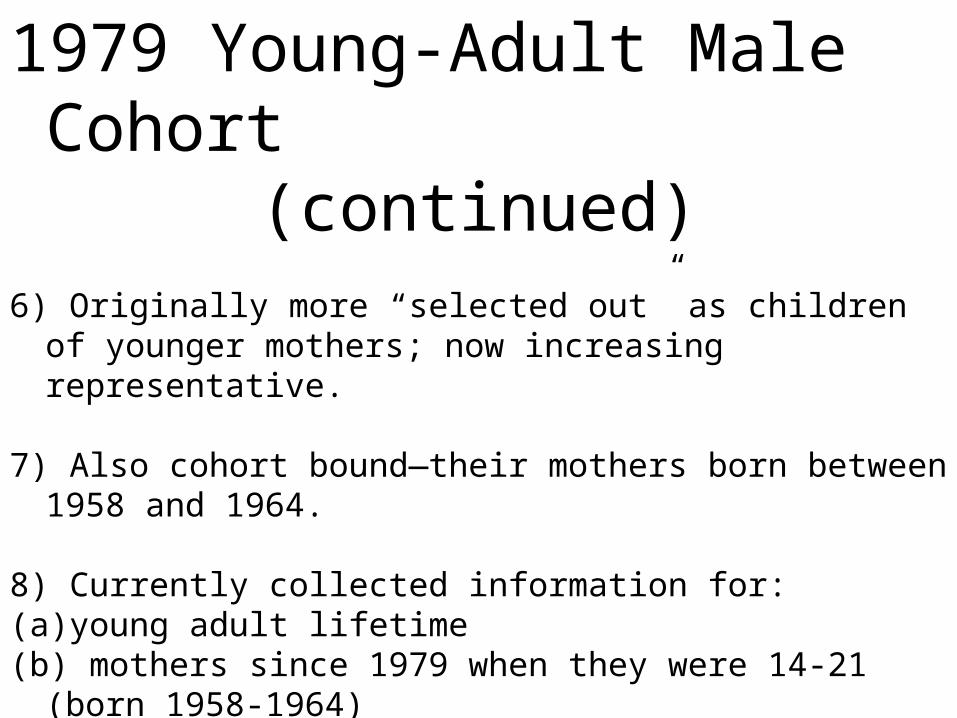
(continued)6) Originally more “selected out” as children of younger mothers;
now increasing representative.
7) Also cohort bound—their mothers born between 1958 and 1964.
8) Currently collected information for: (a)young adult lifetime (b) mothers since 1979 when they were 14-21 (born 1958-1964)
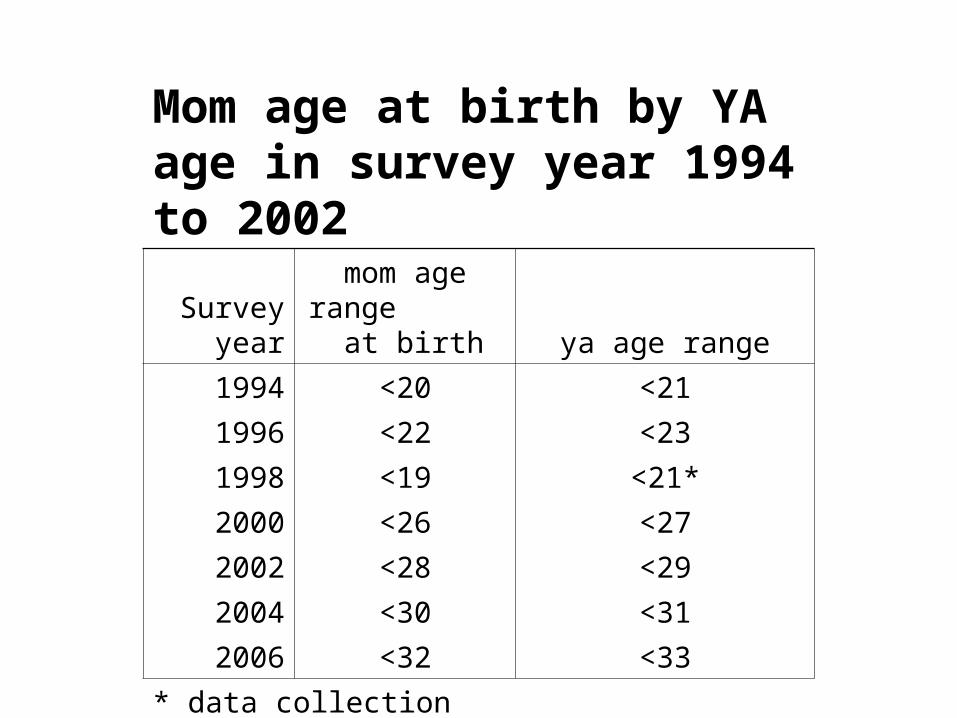
Mom age at birth by YA age in survey year 1994 to 2002
Survey year
mom age range at
birth ya age range
1994 <20 <21
1996 <22 <23
1998 <19 <21*
2000 <26 <27
2002 <28 <29
2004 <30 <31
2006 <32 <33
* data collection truncated
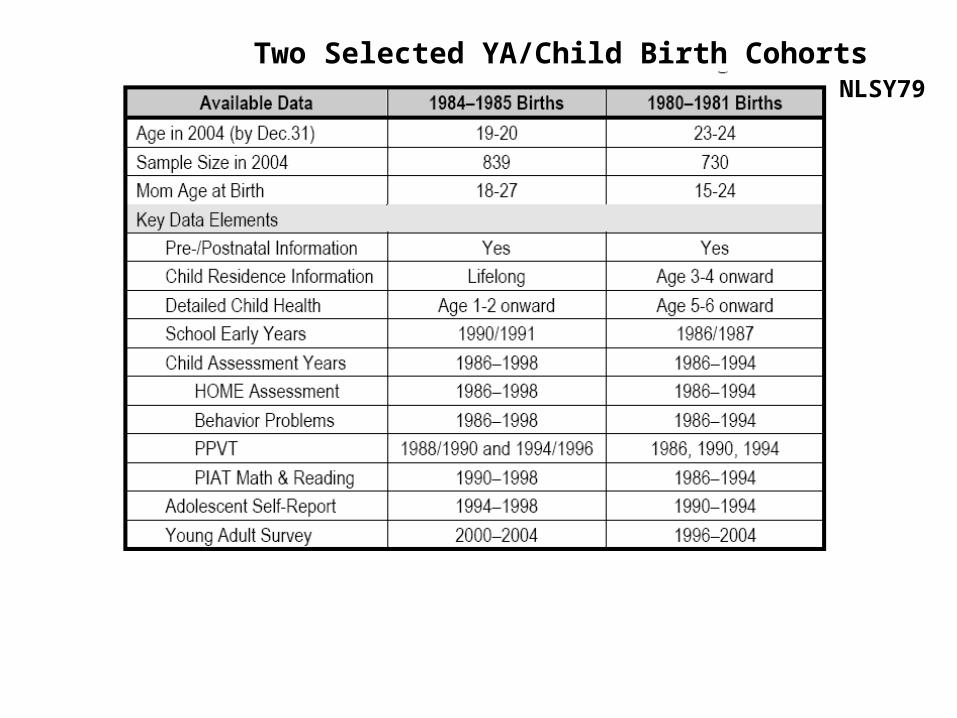
in NLSY79 Two Selected YA/Child Birth Cohorts
Male half of 1997 cohort
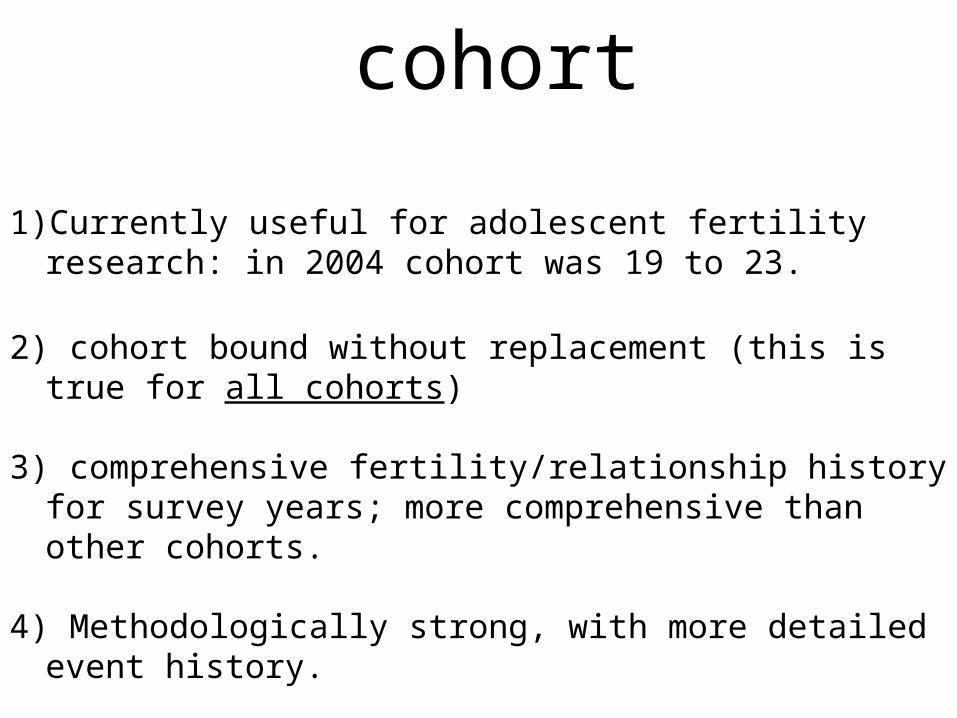
1)Currently useful for adolescent fertility research: in 2004 cohort was 19 to 23.
2) cohort bound without replacement (this is true for all cohorts)
3) comprehensive fertility/relationship history for survey years; more comprehensive than other cohorts.
4) Methodologically strong, with more detailed event history.
Quality of Male Fertility
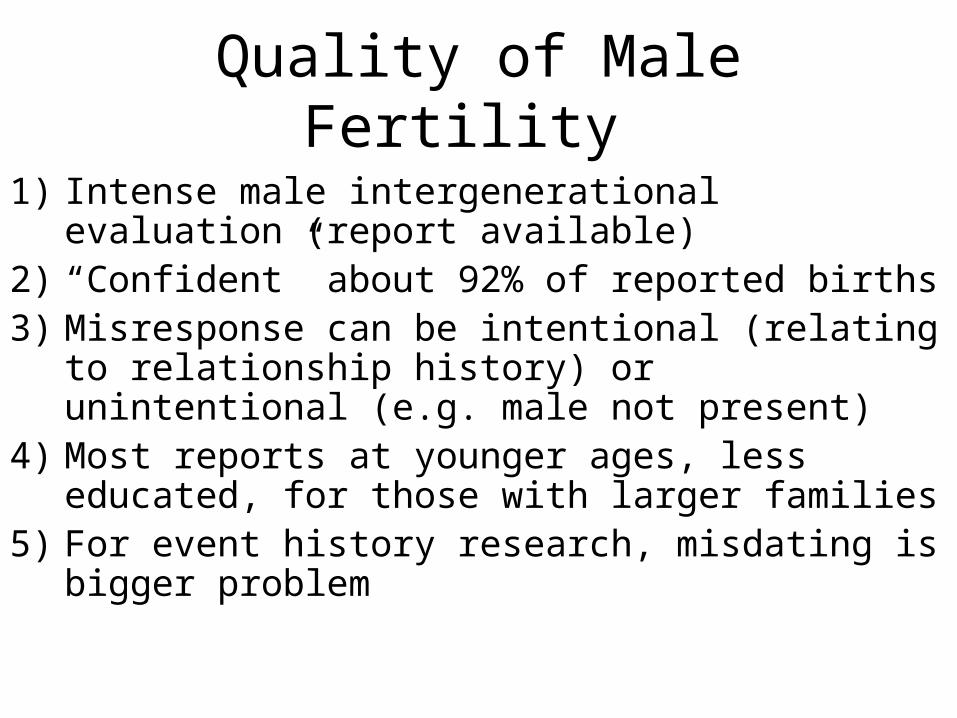
1) Intense male intergenerational evaluation (report available)
2) “Confident” about 92% of reported births3) Misresponse can be intentional (relating
to relationship history) or unintentional (e.g. male not present)
4) Most reports at younger ages, less educated, for those with larger families
5) For event history research, misdating is bigger problem

Table 1. Distribution of Confidence Level for Selected Relationship Patterns, 1979 to 1998 (Unweighted, NLSY79)
PaternityLikely
(Code 1 or 2)
PaternityUnclear(Code 3)
PaternityNot Likely
(Code 4 or 5)N
Dad present at birth (1979-1998) 97.3 0.7 2.0 6819
Child always present 96.0 0.8 3.2 5282
Child has one entry or one exit 90.1 2.9 7.0 1792
Child has multiple entries and exits 89.0 2.3 8.7 345
Child never present in home 82.1 15.0 3.0 1216
Child has one entry and one exit 82.0 5.1 12.9 606
Dad not present at birth 81.4 9.9 8.7 1742
Child appears belatedly on fertility roster
51.7 26.8 21.6 486

Figure 1: Mean No. of Children, by Confidence Level, Men Interviewed All Years 1979-1998, Weighted
0.00
0.20
0.40
0.60
0.80
1.00
1.20
1.40
1.60
1.801
97
9
19
80
19
81
19
82
19
83
19
84
19
85
19
86
19
87
19
88
19
89
19
90
19
91
19
92
19
93
19
94
19
96
19
98
Mea
n N
o. o
f C
hild
ren
1-5 confidence
1-2 (high) confidence
3-5 (low) confidence

Following Youth Through Later Adolescence/Early
Adulthood
Young Women
14-17 (1968)
24-27 (1978) 10 years
NLSY79 (M&F)
14-17 (1979)
24-27 (1989) 10 years
NLSY-YA (M&F)
14-17 (1994 onward)
24-27 (2004) 10 years
NLSY97 (M&F)
14-17 (1997)
21-24 (2004) 7 years

For women
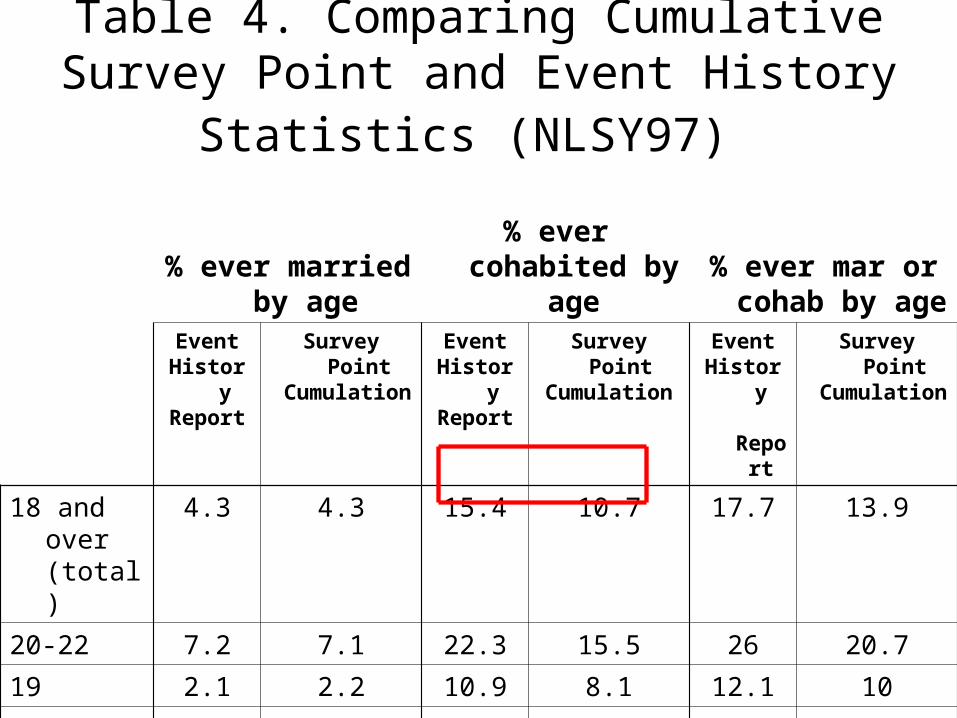
Table 4. Comparing Cumulative Survey Point and Event History Statistics (NLSY97)
% ever married by age
% ever cohabited by
age
% ever mar or cohab by
ageEvent
HistoryReport
Survey Point
Cumulation
EventHistor
yReport
Survey Point
Cumulation
EventHistory
Report
Survey Point
Cumulation
18 and over (total)
4.3 4.3 15.4 10.7 17.7 13.9
20-22 7.2 7.1 22.3 15.5 26 20.7
19 2.1 2.2 10.9 8.1 12.1 10
18 0.4 0.4 5.7 2.9 6.1 3.4


Note: Includes selected variables drawn from multivariate analysis
Reference groups= college attendance

Table 5. Fertility Summary for NLSY Men Age 14-17 in 1979 (and 33-36 in 1998) (NLSY79 weighted estimates)
% Ever Father
% with 2+
Children
Mean No. of
Children1985
1990
1998
1985
1990
1998
1985
1990
1998
Total 15.8
42.3
68.9
3.520.0
48.0
0.20
0.69
1.42
White12.6
38.6
67.0
2.517.3
47.1
0.16
0.60
1.35
African American
28.9
57.9
75.4
7.229.1
49.2
0.38
1.02
1.64
Hispanic26.5
56.9
79.4
7.334.4
57.1
0.36
1.07
1.82

With 1979, Longer term employment, relationships/family/income can be followed through 2004!