fertility research update
TRANSCRIPT

Strawberry nutrient management
Thanks to:
California Strawberry Commission
Community Foundation for Monterey County
Cooperating growers

2009-11 strawberry nutrient management projects :
Survey of > 50 ‘Albion’ fields in the Watsonville-Salinas and Santa
Maria areas to reset leaf and petiole nutrient diagnostic levels
Monitoring of irrigation and fertility practices in 26 fields in the
Watsonville-Salinas area
Measurement of nutrient uptake in 10 fields of day-neutral berries

Tissue analysis : Leaf and petiole samples collected 5 times from early spring
through early fall; macro- and micronutrient
concentrations measured
Nutrient ‘optimum ranges’ determined through DRIS analysis
(a system that mathematically compares high yield and
low yield fields)

peak
harvest
early
flowering DRIS leaf ‘optimum ranges’ : }
High yield, nutritionally balanced fields

peak
harvest
early
flowering DRIS leaf ‘optimum ranges’ : Mid-season leaf N lower than existing
UC recommendations
= Existing UC ‘critical level’
}
High yield, nutritionally balanced fields

peak
harvest
early
flowering DRIS leaf ‘optimum ranges’ : Mid-season leaf N lower than existing
UC recommendations
P and K much higher, indicates that current
fertilizer rates are probably much
higher than necessary
= Existing UC ‘critical level’
}
High yield, nutritionally balanced fields

DRIS petiole ‘optimum ranges’ : More highly variable than leaf values,
especially NO3-N
P and K currently maintained at high levels
= Existing UC ‘critical level’
High yield, nutritionally balanced fields

DRIS micronutrient ‘optimum ranges’ : Agree with prior UC recommendations, except for zinc
DRIS optimum
range
Prior UC
recommendation
% Ca 1.0 - 2.2 0.4 - 2.7
% Mg 0.28 - 0.42 0.3 - 0.7
% S 0.15 - 0.21 > 0.10
PPM B 40 - 70 35 - 200
PPM Zn 11 - 20 20 - 50
PPM Mn 65 - 320 30 - 700
PPM Fe 85 - 200 50 - 3,000
PPM Cu 2.6 - 4.9 3 - 30

Determination of nutrient uptake by strawberry :
Monthly whole plant samples collected from day-neutral cultivars
- 7 fields in Watsonville-Salinas, 3 in Santa Maria
nutrient uptake in fruit estimated from commercial yield and fruit
nutrient concentration

strawberries have limited N uptake until fruiting starts; by first harvest,
cumulative crop N uptake typically about 30 lb / acre
from that point forward, N uptake averages about 1 lb / acre / day
over the season, total crop N uptake approximately 180-240 lb / acre
(including runners, roots and cull fruit)
Nitrogen uptake by a strawberry crop :

Crop uptake (pounds/acre)
N P K
Plant 110 20 90
Fruit 90 20 140
Total 200 40 230
Approximate N / P / K uptake for a 30 ton/acre crop :
Each ton of fruit contains approximately:
- 2.5 lb N
- 4.0 lb K
- 0.6 lb P

Fertilization practices :
40 commercial fields in Watsonville-Salinas and Santa Maria
Ave Min Max
Preplant 106 24 234
Fertigated 93 3 304
Total 200 118 424

How about P and K ?
Soil tests are not guiding
fertilization decisions

Preplant fertilization :
how to handle controlled release fertilizer (CRF) ?
- what release characteristic best fits the plant uptake ?
- how much preplant vs. in-season fertigation ?

Manufacturers’ CRN release ratings are pretty good estimates of field behavior
Soil temperature affects release rate (Sept - Oct release higher than Jan - Feb)
There is an unavoidable mismatch in CRF N release and strawberry N uptake

Example:
An 6-8 month release product applied at 150 lb N / acre in mid-September
will likely have released at least half the N by mid January
Crop uptake by mid January likely to be no more than 30-40 lb N/acre
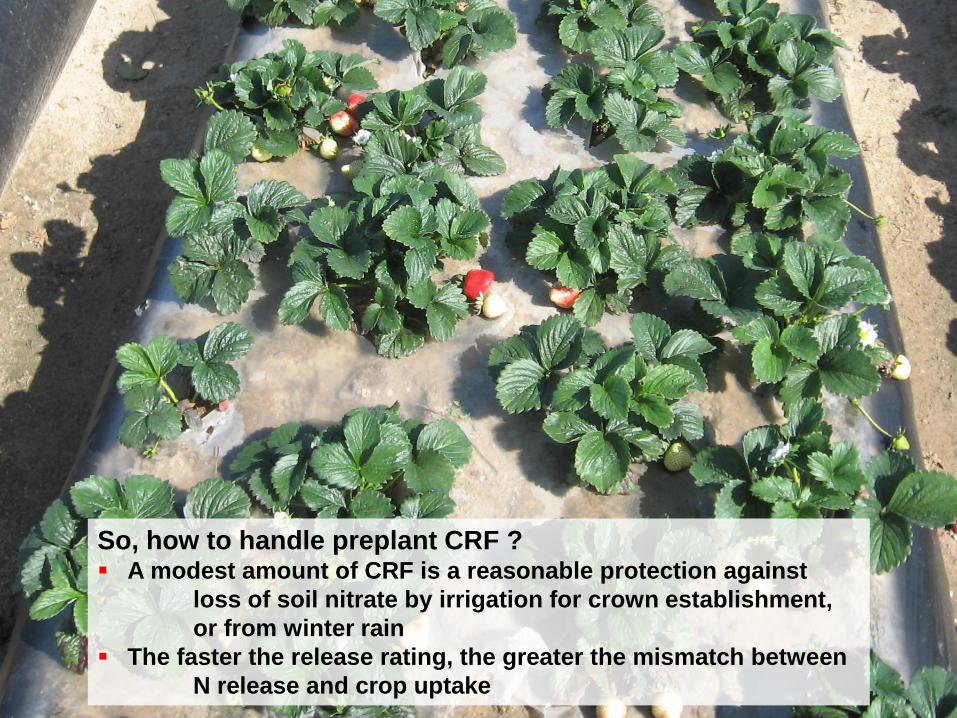
So, how to handle preplant CRF ? A modest amount of CRF is a reasonable protection against
loss of soil nitrate by irrigation for crown establishment,
or from winter rain
The faster the release rating, the greater the mismatch between
N release and crop uptake

How to handle fertigation ? Once fruit harvest begins, crop N uptake is quite consistent, so fertigation
should be as well
Because berry N uptake is slow, a large soil nitrate reserve is not needed
- the majority of monitored berry fields were maintained at < 10 PPM soil
NO3-N during the harvest season

updated strawberry tissue nutrient diagnostic levels are now available
strawberry nutrient uptake pattern is clear and dependable
Potential for NO3-N leaching loss is greatest during the winter
In summary :