fertility history and physical and mental health changes
TRANSCRIPT

Fertility History and Physical and Mental HealthChanges in European Older Adults
Katherine Keenan1 • Emily Grundy2
Received: 4 April 2017 / Accepted: 4 April 2018
� The Author(s) 2018
Abstract Previous studies have shown that aspects of reproductive history, such as
earlier parenthood and high parity, are associated with poorer health in mid and later
life. However, it is unclear which dimensions of health are most affected by
reproductive history, and whether the pattern of associations varies for measures of
physical, psychological and cognitive health. Such variation might provide more
insight into possible underlying mechanisms. We use longitudinal data for men and
women aged 50–79 years in ten European countries from the Survey of Health,
Ageing and Retirement in Europe to analyse associations between completed fer-
tility history and self-reported and observed health indicators measured 2–3 years
apart (functional limitations, chronic diseases, grip strength, depression and cog-
nition), adjusting for socio-demographic, and health factors at baseline. Using
multiple imputation and pattern mixture modelling, we tested the robustness of
estimates to missing data mechanisms. The results are partly consistent with pre-
vious studies and show that women who became mothers before age 20 had worse
functional health at baseline and were more likely to suffer functional health
declines. Parents of 4 or more children had worse physical, psychological and
cognitive health at baseline and were more likely to develop circulatory disease over
the follow-up period. Men who delayed fatherhood until age 35 or later had better
health at baseline but did not experience significantly different health declines. This
Electronic supplementary material The online version of this article (https://doi.org/10.1007/s10680-
018-9489-x) contains supplementary material, which is available to authorized users.
& Katherine Keenan
1 Department of Geography and Sustainable Development, University of St. Andrews, Irvine
Building, North Street, St. Andrews KY16 9AL, UK
2 Institute for Social and Economic Research, University of Essex, Wivenoe Park,
Colchester CO4 3SQ, UK
123
Eur J Population
https://doi.org/10.1007/s10680-018-9489-x

study improves our understanding of linkages between fertility histories and later
life health and possible implications of changes in fertility patterns for population
health. However, research ideally using prospective life course data is needed to
further elucidate possible mechanisms, considering interactions with partnership
histories, health behaviour patterns and socio-economic trajectories.
Keywords Older adults � Fertility history � Health changes � Survey
of Health, Ageing and Retirement in Europe
1 Introduction
Studies investigating the life course determinants of health in older age have found
that aspects of reproductive history, such as timing of entry to parenthood and
completed family size, are associated with post-reproductive morbidity and
mortality (Doblhammer 2000; Einio et al. 2015, 2016; Grundy and Kravdal 2010;
Grundy and Tomassini 2005; Hank 2010). Specifically, having no or in some
contexts many children (four or five or more) and, among parents, earlier age at first
birth, is associated with poorer later life physical (Barban 2013; Grundy and Read
2015; Grundy and Tomassini 2005; Hank 2010; Henretta 2007) and in some studies
mental health (Kalil and Kunz 2002; Kravdal et al. 2017; Mirowsky and Ross 2002;
Read et al. 2011). The mechanisms that underlie these associations may be
complex; involving a combination of social and biological selection processes and
biosocial and socio-economic life course influences on health (Grundy and Read
2015), which in some cases may be offsetting. For example, parenthood may
motivate positive lifestyle changes and children, as well as providing a source of
social control on unhealthy behaviours, are also a potential source of social support
which may be especially valuable at older ages; these factors would suggest benefits
of having more children. However, the physiological stress of repeated pregnancy
and parturition also present challenges for women and both women and men may
suffer health damaging consequences from the cumulated stress and financial strain
associated with large family size. Generalised biosocial effects of balances between
costs and benefits of childbearing and rearing might be expected to influence all
indicators of health. However, there may also be pathways specific to certain types
of conditions. For example, it is well established that childlessness and delayed
motherhood increase women’s risks of breast and reproductive system cancers
(Kvale et al. 1994). It has also been suggested that high parity may be associated
with higher risks of musculoskeletal, metabolic and cardiovascular disease among
women because the physiological challenges posed by repeated pregnancy,
parturition and lactation may affect bone density (Christensen and Vaupel 1996;
Pirkle et al. 2014), glucose metabolism and obesity which is a known risk factor for
cardiovascular disease (Sowers 2003). Examining a range of outcomes and
comparing results for women and men, as we do in this study, may help to
distinguish specific from general effects of fertility trajectories on later life health.
There is also likely to be a complex dynamic relationship between fertility and
K. Keenan, E. Grundy
123

partnership history over the life course which exerts differential effects on later life
health (Kravdal et al. 2012; Steele et al. 2005).
The overall aim of this study is to investigate associations between fertility
history and changes in a range of physical and mental health indicators (both
observed and self-reported) measured over a 2–3 year period among European
adults aged 50–79 years. This extends previous research in four ways. First,
although studies have used a variety of different self-reported indicators of poor
health (including functional limitations, disability, self-reported health and mental
health) (Barban 2013; Grundy and Tomassini 2005; Henretta et al. 2008) few have
compared multiple physical and mental health indicators (Hank 2010; Mirowsky
2005). Second, few have assessed the association using objective measures of
morbidity (Grundy and Read 2015; Guralnik et al. 2009; Lawlor et al. 2003;
McMunn et al. 2016) and in this study we include an objectively measured indicator
of physical health strongly predictive of future disability, grip strength (Rantanen
et al. 1999). Third, whereas most previous studies have been cross-sectional (with
some exceptions, (Grundy and Read 2015; Read et al. 2011), we conduct a
prospective analysis of changes in health, allowing us to assess whether particular
fertility patterns precipitate larger declines in health among the over 50s. Fourth, we
exploit the cross-national aspect of our data to investigate the hypothesis that the
fertility–health nexus might vary contextually (Grundy 2009; Grundy and Fover-
skov 2016).
2 Background
2.1 First Birth Timing and Later Life Health
Previous studies have shown a strong association between early motherhood
(usually defined as a teenage birth) and higher mortality (Barclay et al. 2016;
Doblhammer 2000; Grundy 2009; Grundy and Kravdal 2010; Grundy and
Tomassini 2005; Henretta 2007; Mirowsky 2005) and higher risk of disability,
long-term illness and poorer self-reported general health in mid and later life
(Grundy and Read 2015; Grundy and Foverskov 2016; Grundy and Tomassini 2005;
Henretta 2007; Read et al. 2011; Waldron et al. 1998). Some studies have also found
later life mental health disadvantages for teenage mothers in some contexts (Grundy
and Foverskov 2016; Spence 2008; Umberson et al. 2010), but others suggest these
may reflect antecedent poorer mental health among women who become teenage
mothers, and overall the evidence on early motherhood and depression is so far
inconclusive. Physical health disadvantages for younger first-time fathers have also
been reported (Einio et al. 2015, 2016; Grundy and Kravdal 2010; Grundy and Read
2015; Read et al. 2011).
Potential explanations include social selection factors, possible direct influences
(mainly for women), and possible indirect influences of fertility on subsequent life
circumstances, which in turn affect later life health. First, those who become parents
at young ages are more likely to come from deprived backgrounds, disrupted
families, and have lower pre-parenthood education (Imamura et al. 2007; Kiernan
Fertility History and Physical and Mental Health Changes…
123

1997), factors associated with poorer later life health (Ploubidis et al. 2014).
However, it is unlikely that social selection is a complete explanation, because the
early parenthood-poor health association has also been observed in several studies
which adjust for early life factors (Grundy and Kravdal 2007; Grundy and
Foverskov 2016; Henretta 2007), or which use sibling designs to minimise
confounding by family of origin (Barclay et al. 2016; Einio et al. 2015, 2016). Early
life poor health, which is strongly associated with childhood socio-economic status,
may also be an important selection factor, as unhealthy individuals have poorer
socio-economic trajectories and may marry others with similar poor health (Monden
2007). Assortative mating on health status and other social factors may, in turn,
strengthen and amplify individual disadvantage.
Secondly, it is likely that the physiological processes of childbearing directly
influence women’s risk of disease. Early or repeat experience of pregnancy,
childbirth and breastfeeding are protective against breast, uterine and ovarian cancer
(Grundy and Kravdal 2010; Merritt et al. 2015) due to reduced exposure to the
hormones oestrogen and progesterone (Merrill et al. 2005). However, these
advantages may be outweighed by social disadvantages, including poorer health
related behaviours, associated with younger parenthood. Earlier first-time parents
have higher mortality from smoking and alcohol-related causes, than those who
became parents at a later age (Barclay et al. 2016; Grundy and Kravdal 2010), and a
UK study found that associations between early parenthood and long-term illness
were partially mediated by smoking and exercise (Grundy and Read 2015). Younger
mothers may also have differential healthcare-seeking behaviour including poorer
or delayed antenatal care (Downe et al. 2009). A further explanation is that early
parenthood indirectly affects health through employment, wealth and education.
Studies in the USA and UK show that earlier parenthood is associated with
unstable employment trajectories (Dariotis et al. 2011; Sigle-Rushton 2005), less
resource accumulation prior to childbearing (Powell et al. 2006) and lower
educational attainment [although there is some debate over the direction of
association with education (Kane et al. 2013)], which may lead to long-term health
disadvantages (Dariotis et al. 2011; Lacey et al. 2017). Here, societal/welfare factors
may play a role in moderating the negative health effects of early parenthood. A
recent study found that early parenthood in Eastern Europe was not associated with
poorer later life health compared with Western Europe, which may be explained by
different normative effects and institutional supports for young parents (Grundy and
Foverskov 2016).
2.2 Parity and Later Life Health
Studies of developed countries typically find a J- or U-shaped association between
parity and all-cause mortality, with childless, low or high parity (4, 5 or more
children) having higher mortality than parents of 2 or 3 children (Barclay et al.
2016; Dior et al. 2013; Doblhammer 2000; Grundy 2009; Grundy and Tomassini
2005). Lifetime childlessness is associated with long-term illness (Grundy and
Tomassini 2005), poorer midlife physical function for men (Guralnik et al. 2009),
and poorer cognition (Read and Grundy 2017) in later life. Nulliparity is also
K. Keenan, E. Grundy
123

associated with higher mortality from cancer, respiratory diseases and cardiovas-
cular disease (Barclay et al. 2016; Einio et al. 2016), suggesting that health
behaviours such as smoking play a role, and that those who become parents either
already had more healthy habits, or modified their health behaviours as parenthood
provides greater social control and incentives to live healthily (Umberson et al.
2010). The evidence on associations between childlessness and depression is rather
mixed (see for example, Buber and Engelhardt 2008; Hank 2010; Kravdal et al.
2017).
Perspectives from evolutionary biology such as ‘disposable soma theory’(Wes-
tendorp and Kirkwood 1998) and the theory of ‘maternal depletion’(Winkvist et al.
1992) suggest a trade-off between parity and longevity in women, with high parity
associated with health disadvantage. Although not all studies find a parity-mortality
penalty (Chereji et al. 2013; Grundy and Kravdal 2007; Hank 2010; Spence 2008),
higher parity has been found to be associated with metabolic syndrome, obesity,
diabetes and coronary heart disease (Gunderson et al. 2009; Hinkula et al. 2006;
Lawlor et al. 2003), poorer self-rated health, health limitations (Read et al. 2011),
and higher allostatic load and long-term illness (Grundy and Read 2015).
Associations with metabolic risk factors persist after adjustment for lifestyle factors
and socio-economic background (Umberson et al. 2011). It is thought that repeat
pregnancy could lead to long-term lipid and glucose metabolism deficiencies
(Skilton et al. 2009). On the other hand, higher parity is protective against uterine,
breast and ovarian cancer (Barclay et al. 2016; Grundy and Kravdal 2010).
The role of broader biosocial influences, including long-term health behaviours
(Grundy and Kravdal 2010), is indicated by the fact that similar, albeit smaller,
associations between parenting history and health have been observed in men. For
example, fatherhood is associated with permanent weight gain (Umberson et al.
2011), and in Norway both mothers and fathers of 4 or more children have lower
mortality from alcohol-related causes (Grundy and Kravdal 2010). There are also
multiple biosocial effects of large family size, for example, the accumulated stress
of repeat childrearing, substantial economic costs and role overload could lead
greater physical wear and tear, as indicated by high parity men and women having
higher levels of allostatic load in later life (Grundy and Read 2015).
2.3 Study Aims and Contribution
The aim of this study is to investigate associations between fertility history and
changes in a range of health indicators measured over a 2–3 year period among
adults 50–79 years: functional limitations, grip strength, depression, cognition,
circulatory diseases, musculoskeletal diseases and cancer. Previous studies on this
topic using Survey of Health, Ageing and Retirement in Europe (SHARE) have
found somewhat mixed results for parenthood and depression: one found that
parents of 2 children had reduced depression, compared with the childless (Hank
and Wagner 2013); the other found no differences in depression by number of
children (Gibney et al. 2017). However, the analyses were confined to one health
outcome. Our health indicators include one well-established biomarker (grip
strength), and validated scales for depression and cognitive function, which provide
Fertility History and Physical and Mental Health Changes…
123

greater robustness than studies based on a few outcomes or relying on self-reported
health alone. We also analyse prospective changes in health, and longitudinal
studies on the topic (with the exception of mortality) are relatively sparse (Grundy
and Read 2015; Read et al. 2011). In addition, we conduct analyses of interactions
between fertility history and societal/welfare context (Grundy 2009; Grundy and
Foverskov 2016), and fertility and marital status on later life health (Kravdal et al.
2012).
Based on previous research we expect to see that younger first-time parents
(especially mothers) have worse outcomes on all indicators, including depression.
As discussed above this is likely due to a combination of adverse selection factors,
and possible ‘causal’ effects of early parenthood on life course outcomes, including
health. We would also expect to see poorer health among the childless and those of
high parity, but in different domains. Childless individuals, we hypothesise, will be
more likely to have chronic diseases, especially those related to health behaviours,
such as cancer and cardiovascular diseases, because they have not been subject to
the social control influences of parenthood and are less likely to have been
continuously partnered. In women, reproductive system cancer prevalence/inci-
dence is likely to be higher in childless and lower parity individuals due to increased
hormonal exposures. Higher parity mothers are more likely to have higher incidence
of metabolic system diseases (related perhaps to weight gain), and to experience
functional limitations and declines in muscular strength, reflecting the greater stress
of repeated childbearing.
Based on previous research, we anticipate that fertility patterns may exert
stronger effects on health in areas with weak welfare provision (in our study,
Southern Europe), because in such societies the stresses and costs of childrearing
fall to a greater extent on individuals and families. The effect of parity on health is
likely conditioned by marital status—previous work suggests that the combination
of parenthood with never being married carries a higher risk than other groups
(Kravdal et al. 2012).
3 Methods
3.1 Data
We used individual-level data from waves 1–2 of SHARE (Borsch-Supan et al.
2013), a longitudinal cross-national survey representative of the non-institution-
alised population aged 50 years and over. Wave 1 took place in 2004–2005, and
wave 2 was conducted in 2006–2007. We used data from ten countries—Austria,
Belgium, Denmark, France, Greece, Italy, the Netherlands, Spain, Sweden and
Switzerland, excluding one country (Germany) because the individual follow-up
rate from waves 1–2 was less than 60%. We excluded those aged 80? because most
SHARE surveys did not sample from institutions, and in some countries the
proportion of over 80s in institutions reaches 20%; entry to which is associated with
family size (Tomassini et al. 2004). After excluding participants who dropped out
by wave 2 (either through loss to follow-up or death), and/or had no weights, our
K. Keenan, E. Grundy
123

sample consisted of 6874 men and 8053 women. In further analysis we included
individuals with missing data at follow-up which increased the sample size to
10,022 men and 11,555 women (details below).
3.2 Measures
3.2.1 Health Outcomes
We use seven self-reported and objectively measured indicators of health collected
at baseline (wave 1) and follow-up (wave 2). Functional limitations were measured
using the 10-item Nagi scale and treated as an additive index. We created binary
indicators for reporting having any doctor-diagnosed circulatory or metabolic
disease (from a list including heart attack, stroke, hypertension, high blood
cholesterol and diabetes), any doctor-diagnosed musculoskeletal disease (arthritis,
including osteoarthritis or rheumatism, osteoporosis and hip or femoral fracture),
and doctor-diagnosed cancer (excluding minor skin cancers). For women we
separated reproductive cancers (uterine, ovarian and breast) and non-reproductive
cancers, given that the literature suggests opposing effects. Dummy indicators were
positive if the disease onset occurred after the respondent’s last child, to eliminate
the possibility of chronic illness affecting fertility. Physical health was objectively
assessed using grip strength, which is a strong prospective predictor of later life
morbidity (Rantanen et al. 2000; Rantanen et al. 1999). Grip strength was measured
using a handheld dynamometer and respondents provided multiple measurements
with alternating hands (the highest value was used). Measurements of 0 or 100 kg or
more, or those that differed by more than 20 kg were considered invalid and set to
missing. Number of depressive symptoms was measured using the Euro-Depression
(Euro-D) scale (0–12), validated for use in the European population (Castro-Costa
et al. 2008). Cognition was assessed by a cognition index (combined scores of
verbal fluency, immediate recall, delayed recall, orientation and numeracy). We also
created an additive index of health problems (0–7), which comprised being in the
bottom (within-gender) quintile of grip strength, bottom quintile of cognition,
having[ 6 depressive symptoms, at least one functional limitation and any of the
chronic diseases.
3.2.2 Exposure: Fertility History (Reported at Wave 1)
Our parity indicator was based on reports of living biological children (0, 1, 2, 3 and
4 or more children). Considering only living, rather than ever-born children is
problematic because of misclassifying those with deceased children. However, data
on deceased children are only available in SHARELIFE (or wave 3 of the SHARE
survey) which had a relatively high non-response rate. As a robustness check we
repeated the analysis using a subset of respondents who took part in SHARELIFE
and including an indicator of having a deceased child. Following other studies
(Barclay et al. 2016; Grundy and Kravdal 2010) we used a categorical indicator of
age at first birth which for women was grouped into\ 20, 20–29 and 30 years or
older, and for men was grouped\ 23, 24–34 and 35 years or older.
Fertility History and Physical and Mental Health Changes…
123

3.2.3 Other Variables
We included several variables from wave 1 likely to be related to both fertility
history and later life health. To control for socio-economic selection we included
respondent’s father’s last occupation, standardised using the International Standard
Classification of Occupations (ISCO) 1988 version. We dichotomised the variable
into blue collar versus white collar where blue collar included codes from 6 upwards
(skilled agricultural and fishery workers, craft and related tradesmen, plant/machine
operators, elementary occupations and unemployed/not working). Respondent’s
own education was standardised using the International Standard Classification of
Education (ISCED) levels 1–6, and we used a three-category variable distinguishing
those with low (levels 1–2), medium (3–4) and higher education (5–6). We used a
measure of household wealth which summed the value of all owned assets, minus
any debt, constructed within-country quintiles and used a binary variable of the
bottom quintile versus the rest. Marital status was classified into never married,
married or cohabiting, divorced and widowed. We included variables for age in
years and age squared to account for the nonlinear decline in health with age. We
also included (in sequential models) self-reported measures of current health
behaviours at wave 1, because they are likely related to both fertility history and
health. These were smoking (never/ex/current), and frequency of moderate/vigorous
physical activity (more than once per week/once per week, 1 or 2 times per month,
rarely or never). We created a variable for societal/welfare context by classifying
countries into three groups: Nordic (Sweden, Denmark and the Netherlands),
Continental (Belgium, France, Austria, Switzerland) and Mediterranean (Greece,
Italy and Spain). We chose these groups based on broadly similar fertility trends
over time (Frejka et al. 2008) and similar welfare policies (Arts and Gelissen 2002)
over the decades when our cohorts were engaged in childrearing.
3.3 Analytical Methods
To investigate change in health across two waves we used ‘conditional change score
models’ where the outcome at follow-up Y2 is regressed on the earlier measure Y1
and a set of covariates X. This is mathematically equivalent to the ‘change score
method’, where each individual has an individual score (Y2 - Y1) with the
additional advantage that regression to the mean is less likely (Allison 1990). To
adjust for differences in follow-up time, we included a variable indicating the
number of months between surveys waves 1 and 2. Models included country fixed-
effects to adjust for within-country homogeneity, and we computed robust standard
errors adjusting for within-country clustering. We also calculated weighted
estimates, using the calibrated cross-sectional and longitudinal weights provided
with the SHARE data, which take account of study design, and weight to the known
proportions of age and sex in each country at the start of the survey. The
longitudinal weights additionally account for mortality by weighting to the
population who survive to the end of the observation period. To model chronic
diseases we used logistic regression. Number of functional limitations and
depressive symptoms were modelled using negative binomial regression because
K. Keenan, E. Grundy
123

of the large number of zeros in the distribution. Ordinal logistic regression was used
for the index of poor health conditions. Grip strength and cognition score were
approximately normally distributed so were modelled using ordinary least squares
regression. Given that the hypothesised effects may operate differently by gender,
we analysed men and women separately. We tested for significant interactions
between fertility history and societal context, and fertility history and marital status
using nested models and likelihood ratio tests. Any interactions significant at the 5%
level were shown graphically using predicted probabilities.
It is well known that survey attrition in observational studies, if ignored, can lead
to biased estimates of the relationships of interest. In our analysis, this is a particular
problem since attrition between SHARE waves 1–2 ranged from 20% in Greece to
36% in France, and this is likely to be higher in those with worse health status. To
assess whether our findings were affected by bias caused by missing data, we
imputed missing covariates and responses using the multiple imputation by chained
equations (MICE) approach in STATA 14.0. This assumes that the selection
mechanism is ignorable under the missing at random (MAR) assumption (Rubin
1976), which states that the probability of missingness is entirely explained by the
variables observed and included in the analysis model. The chained equation
process continued for 20 cycles, which created 200 imputed datasets. The results of
analyses were then combined using Rubin’s rules (Rubin and Little 1987). In the
main text we present the MI results; the results using the complete case sample are
available in the appendix. We also conducted sensitivity analysis using pattern
mixture models (Daniels et al. 2011) to assess whether arbitrary assumptions about
the missing data mechanism affected the results. We reran the analyses assuming
that among those lost to follow-up the proportion in poor health was increased by 20
and 33%. All analyses were performed in STATA 14.0 (StataCorp 2015).
4 Results
4.1 Descriptive Statistics
Table 1 shows descriptive statistics for all variables for all respondents, and for
parents, present at waves 1 and 2. Eleven per cent of men and 10% of women were
childless, and 11% of men and 15% of women had their first child at an early age.
Women generally reported more health problems than men: they had more
functional limitations, depressive symptoms and a higher prevalence of muscu-
loskeletal diseases. There were less pronounced gender differences for circulatory
diseases, cognition scores and cancer. Women were also more likely to have a lower
level of education than men. Approximately one-third of the sample had a father
with a ‘white-collar’ occupation. Women reported better health behaviours than
men, with two-thirds reporting being never smokers, compared to approximately
one-third of men. There were few gender differences in levels of reported physical
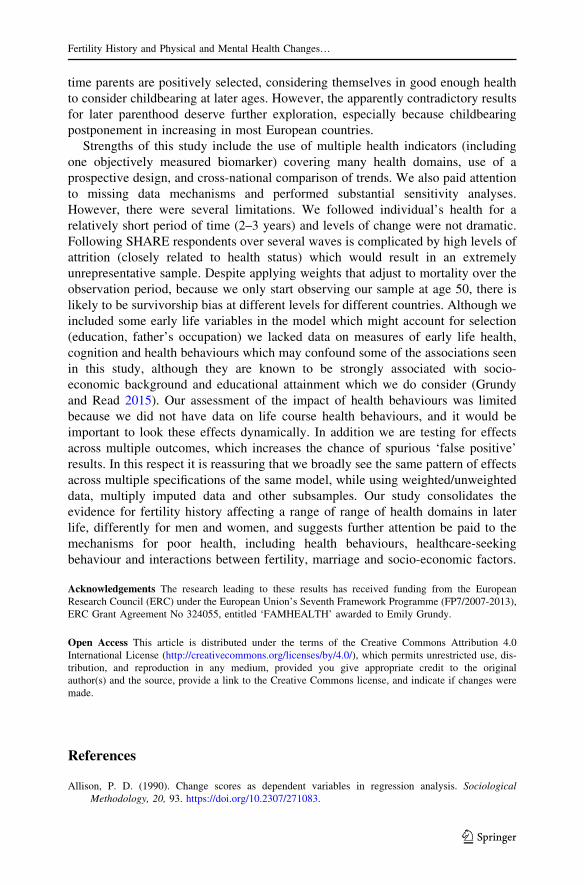
activity. Figures 1 and 2 show the distribution of the health outcomes according to
age, gender and fertility history. Health declined with age for all outcomes except
depression. Women have higher depression, functional limitations, musculoskeletal
Fertility History and Physical and Mental Health Changes…
123
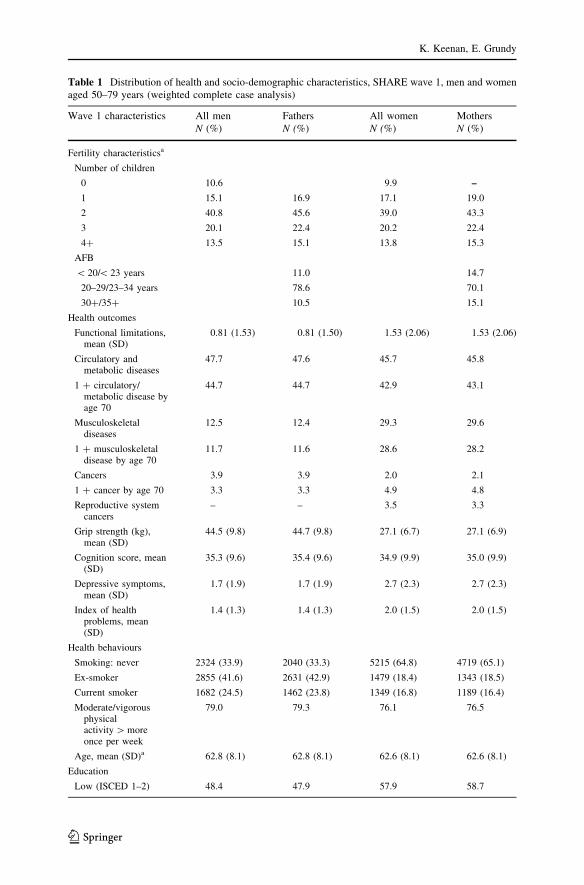
Table 1 Distribution of health and socio-demographic characteristics, SHARE wave 1, men and women
aged 50–79 years (weighted complete case analysis)
Wave 1 characteristics All men Fathers All women Mothers
N (%) N (%) N (%) N (%)
Fertility characteristicsa
Number of children
0 10.6 9.9 –
1 15.1 16.9 17.1 19.0
2 40.8 45.6 39.0 43.3
3 20.1 22.4 20.2 22.4
4? 13.5 15.1 13.8 15.3
AFB
\ 20/\ 23 years 11.0 14.7
20–29/23–34 years 78.6 70.1
30?/35? 10.5 15.1
Health outcomes
Functional limitations,mean (SD)
0.81 (1.53) 0.81 (1.50) 1.53 (2.06) 1.53 (2.06)
Circulatory andmetabolic diseases
47.7 47.6 45.7 45.8
1 ? circulatory/metabolic disease byage 70
44.7 44.7 42.9 43.1
Musculoskeletaldiseases
12.5 12.4 29.3 29.6
1 ? musculoskeletaldisease by age 70
11.7 11.6 28.6 28.2
Cancers 3.9 3.9 2.0 2.1
1 ? cancer by age 70 3.3 3.3 4.9 4.8
Reproductive systemcancers
– – 3.5 3.3
Grip strength (kg),mean (SD)
44.5 (9.8) 44.7 (9.8) 27.1 (6.7) 27.1 (6.9)
Cognition score, mean(SD)
35.3 (9.6) 35.4 (9.6) 34.9 (9.9) 35.0 (9.9)
Depressive symptoms,mean (SD)
1.7 (1.9) 1.7 (1.9) 2.7 (2.3) 2.7 (2.3)
Index of healthproblems, mean(SD)
1.4 (1.3) 1.4 (1.3) 2.0 (1.5) 2.0 (1.5)
Health behaviours
Smoking: never 2324 (33.9) 2040 (33.3) 5215 (64.8) 4719 (65.1)
Ex-smoker 2855 (41.6) 2631 (42.9) 1479 (18.4) 1343 (18.5)
Current smoker 1682 (24.5) 1462 (23.8) 1349 (16.8) 1189 (16.4)
Moderate/vigorousphysicalactivity[moreonce per week
79.0 79.3 76.1 76.5
Age, mean (SD)a 62.8 (8.1) 62.8 (8.1) 62.6 (8.1) 62.6 (8.1)
Education
Low (ISCED 1–2) 48.4 47.9 57.9 58.7
K. Keenan, E. Grundy
123

diseases and lower grip strength over all ages. For many outcomes, younger mothers
have a noticeable health disadvantage at age 50 (Fig. 2). Childless men had
noticeably lower grip strength and cognition scores than other groups in the younger
age bands (Fig. 1).
4.2 Cross-Sectional Results
Tables 2, 3 and Figs. 3 and 4 show the cross-sectional associations between fertility
history and health indicators at baseline (wave 1), with Table 2 showing the models
for functional limitations with the full covariates. Table 2 shows that men and
women who had 4 or more children (compared with two) had at least 20% higher
odds of functional limitations. Teenage mothers had more functional limitations,
compared with the reference group who had had their first child at age 20–29 years.
The covariate coefficients show the expected socio-demographic associations with
health: higher prevalence of health problems among older people, and those with
lower education and household wealth. Being an ex-smoker or doing less physical
activity was associated with more functional limitations. There were significant
differences in functional limitations by country, with Greece, Spain and Austria
having the highest odds (compared with Belgium) and Switzerland the lowest.
Turning to the cross-sectional results shown in Table 3 and Figs. 3 and 4 for
specific dimensions of health and chronic diseases, later first-time fathers had poorer
cognitive function and lower grip strength, but reduced odds of metabolic and
musculoskeletal diseases. Fathers of 4 or more children had more depressive
symptoms, worse overall health and lower cognition. Men who became fathers
before the age of 23, and childless men had increased likelihood of having
Table 1 continued
Wave 1 characteristics All men Fathers All women Mothers
N (%) N (%) N (%) N (%)
Medium (ISCED 3–4) 29.7 30.2 25.5 25.4
High (ISCED 5–6) 21.9 21.9 16.7 16.0
Father’s occupation:white collar
33.0 33.2 33.1 32.6
Blue collar/notworking
67.0 66.8 66.9 67.4
Marital status
Never married 5.8 1.4 5.3 1.4
Married/partnered 83.9 72.2 68.7 72.3
Divorced 5.7 7.7 7.7 7.7
Widowed 4.6 18.7 18.2 18.6
Welfare state group
Continental 38.4 38.5 38.2 38.1
Nordic 30.7 29.4 31.1 29.9
Mediterranean 30.9 32.1 30.8 32.0
Total N 6874 6144 8053 7258
aFertility characteristics and age values were taken from wave 2 responses if wave 1 were missing
Fertility History and Physical and Mental Health Changes…
123

20
25
30
35
40
45
50
55
50 55 60 65 70 75
Grip strength (kg)
25272931333537394143
50 55 60 65 70 75
Cogni�on score
1
1.5
2
2.5
3
3.5
4
50 55 60 65 70 75
Depression score (EURO-D)
0
0.5
1
1.5
2
2.5
3
3.5
50 55 60 65 70 75
Func�onal limita�ons
0.1
0.2
0.3
0.4
0.5
0.6
0.7
0.8
50 55 60 65 70 75
Propor�on with circulatory/metabolic diseases
0
0.1
0.2
0.3
0.4
0.5
0.6
50 55 60 65 70 75
Propor�on with musculoskeletal diseases
0
0.02
0.04
0.06
0.08
0.1
0.12
0.14
50 55 60 65 70 75
Age
Ever had cancer (all types)
Women 0
Men 0
Women 1
Men 1
Women 2
Men 2
Women 3
Men 3
Women 4+
Men 4+
Fig. 1 Study outcomes by age, gender and number of children, SHARE wave 1 [data smoothed usingLOWESS (locally weighted scatterplot smoothing)]
K. Keenan, E. Grundy
123

152025303540455055
50 55 60 65 70 75
Age
Grip strength (kg)
25
30
35
40
45
50 55 60 65 70 75
Age
Cogni�on score
1
1.5
2
2.5
3
3.5
4
50 55 60 65 70 75
Age
Depression score (EURO-D)
0
1
2
3
4
50 55 60 65 70 75
Age
Functonal limita�ons
0
0.2
0.4
0.6
0.8
50 55 60 65 70 75
Age
Propor�on with metabolic/circulatory disease
00.10.20.30.40.50.6
50 55 60 65 70 75
Age
Propor�on with musculo-skeletal diseases
00.020.040.060.08
0.10.120.14
50 55 60 65 70 75
Age
Ever had cancer (all types)
Men <23
Women <20 Women 20-29 Women 30+
Men 35+Men 23-34
Fig. 2 Study outcomes by age, gender and fertility timing, SHARE wave 1, parents only [data smoothedusing LOWESS (locally weighted scatterplot smoothing)]
Fertility History and Physical and Mental Health Changes…
123

Tab
le2
Ad
just
edcr
oss
-sec
tio
nal
asso
ciat
ion
sb
etw
een
ind
exo
ffu
nct
ion
alli
mit
atio
ns
and
fert
ilit
yh
isto
ry,
sho
win
gfu
llco
var
iate
s,S
HA
RE
wav
e1
,m
enan
dw
om
en
aged
50
–7
9y
ears
(mu
ltip
leim
pu
tati
on
,w
eig
hte
dd
ata)
Ind
exo
ffu
nct
ional
lim
itat
ion
sA
llm
en
IRR
(95
%C
I)
Fat
her
s
IRR
(95
%C
I)
All
wo
men
IRR
(95
%C
I)
Mo
ther
s
IRR
(95
%C
I)
Fer
tili
tych
arac
teri
stic
s
Nu
mb
ero
fch
ild
ren
(ref
:2
)
01
.07
(0.9
6–
1.1
9)
0.9
6(0
.89
–1
.03)
10
.97
(0.8
5–
1.1
1)
0.9
6(0
.83
–1
.11)
1.08(1.01–1.16)
1.09(1.01–1.17)
31
.04
(0.9
8–
1.1
0)
1.0
3(0
.97
–1
.09)
1.07(1.02–1.12)
1.06(1.01–1.11)
4?
1.24(1.13–1.36)
1.22(1.10–1.36)
1.29(1.23–1.35)
1.25(1.19–1.32)
AF
B(r
ef:
20
–29
/23
–34
yea
rs)
\2
0/\
23
yea
rs1
.08
(0.8
3–
1.4
1)
1.14(1.05–1.23)
30?
/35?
1.0
6(0
.98
–1
.14)
0.9
5(0
.89
–1
.01)
Oth
erco
var
iate
s
Ag
e(c
on
tin
uou
s)1.04(1.04–1.05)
1.04(1.03–1.05)
1.04(1.03–1.04)
1.04(1.03–1.04)
Ag
esq
uar
ed1
.00
(0.9
9–
1.0
0)
1.0
0(0
.99
–1
.00)
0.9
9(0
.99
–0
.99)
1.0
0(0
.99
–1
.00)
Ed
uca
tio
n:
(ref
:lo
wIS
CE
D1
–2
)
Med
ium
(IS
CE
D3
–4
)0.71(0.63–0.81)
0.74(0.68–0.81)
0.82(0.73–0.92)
0.81(0.71–0.93)
Hig
h(I
SC
ED
5–
6)
0.54(0.46–0.63)
0.59(0.51–0.68)
0.65(0.53–0.79)
0.66(0.55–0.80)
Fat
her
’so
ccu
pat
ion:
blu
eco
llar
/no
tw
ork
ing
1.0
2(0
.92
–1
.14)
1.0
4(0
.93
–1
.17)
1.0
2(0
.92
–1
.12)
1.0
4(0
.96
–1
.13)
Low
house
hold
wea
lth
1.34(1.14–1.57)
1.46(1.33–1.60)
0.9
4(0
.88
–1
.01)
1.37(1.27–1.47)
Sm
okin
g:
(ref
:n
ever
)
Ex
-sm
ok
er1.44(1.33–1.57)
1.33(1.16–1.51)
1.10(1.04–1.18)
1.09(1.03–1.15)
Curr
ent
smo
ker
1.24(1.14–1.36)
1.19(1.04–1.36)
1.0
2(0
.94
–1
.10)
1.0
2(0
.94
–1
.11)
Fre
quen
cyof
moder
ate/
vig
oro
us
physi
cal
acti
vit
y,
ord
inal
([o
nce
per
wee
kto
har
dly
ever
)
1.49(1.42–1.57)
1.57(1.48–1.67)
1.33(1.28–1.38)
1.31(1.26–1.37)
Mar
ital
stat
us
(ref
:m
arri
ed/p
artn
ered
)
K. Keenan, E. Grundy
123

Tab
le2
con
tin
ued
Ind
exo
ffu
nct
ional
lim
itat
ion
sA
llm
en
IRR
(95
%C
I)
Fat
her
s
IRR
(95
%C
I)
All
wo
men
IRR
(95
%C
I)
Mo
ther
s
IRR
(95
%C
I)
Nev
erm
arri
ed1
.06
(0.8
6–
1.3
0)
1.2
7(0
.97
–1
.66)
0.9
0(0
.79
–1
.03)
1.0
8(0
.97
–1
.21)
Div
orc
ed1
.20
(0.9
6–
1.5
0)
1.0
3(0
.87
–1
.23)
1.0
7(0
.94
–1
.21)
1.0
9(0
.90
–1
.32)
Wid
ow
ed1
.03
(0.9
6–
1.1
1)
1.0
4(0
.88
–1
.23)
0.9
3(0
.81
–1
.08)
0.9
1(0
.80
–1
.05)
Co
un
try
(ref
:B
elg
ium
)
Au
stri
a1.32(1.19–1.46)
1.23(1.12–1.35)
1.23(1.12–1.35)
1.0
5(0
.98
–1
.11)
Den
mar
k0.87(0.78–0.97)
0.9
1(0
.82
–1
.01)
0.9
1(0
.82
–1
.01)
0.9
7(0
.91
–1
.03)
Fra
nce
0.90(0.86–0.94)
0.94(0.91–0.97)
0.94(0.91–0.97)
0.95(0.92–0.97)
Gre
ece
0.9
5(0
.82
–1
.10)
0.9
5(0
.87
–1
.05)
0.9
5(0
.87
–1
.05)
1.19(1.09–1.31)
Ital
y0.77(0.67–0.89)
0.78(0.70–0.86)
0.78(0.70–0.86)
0.9
9(0
.90
–1
.10)
Net
her
lan
ds
0.79(0.68–0.91)
0.80(0.71–0.89)
0.80(0.71–0.89)
0.88(0.82–0.96)
Sp
ain
1.0
2(0
.89
–1
.16)
1.16(1.04–1.29)
1.16(1.04–1.29)
1.27(1.13–1.42)
Sw
eden
0.69(0.62–0.78)
0.72(0.66–0.80)
0.72(0.66–0.80)
0.95(0.89–1.00)
Sw
itze
rlan
d0.59(0.51–0.67)
0.58(0.50–0.66)
0.66(0.59–0.73)
0.67(0.62–0.73)
To
talN
98
05
89
02
11
,43
91
0,3
74
Bold
indic
ates
stat
isti
call
ysi
gnifi
cant
atth
e5%
level
Fertility History and Physical and Mental Health Changes…
123

circulatory/metabolic diseases. Among women, high parity (4?) was associated
with lower cognition, more health problems, but lower risk of reproductive cancers
compared to mothers of 2 children. Becoming a mother at age 30 or over was
associated with a lower risk of musculoskeletal diseases. Childless women had
lower risks of non-reproductive cancers but lower cognition scores. Associations
with depression were slight.
Table 3 Adjusted cross-sectional associations between fertility history and health outcomes at baseline
among men and women aged 50–79 years, SHARE wave 1
Grip strength
b (95% CI)
Depression
IRR (95% CI)
Cognition
b (95% CI)
Index of health
conditions
OR (95% CI)
All men (N = 9805)
No. children (ref: 2)
0 - 1.07 (- 2.50–0.35) 0.92 (0.77–1.09) - 0.74 (- 1.52–0.04) 0.97 (0.77–1.22)
1 - 0.25 (- 0.72–0.22) 0.98 (0.88–1.09) - 0.04 (- 0.80–0.72) 0.98 (0.84–1.13)
3 - 0.54 (- 1.69–0.61) 1.05 (1.00–1.10) - 0.12 (- 0.52–0.28) 0.89 (0.77–1.04)
4? - 0.65 (- 2.33–1.03) 1.12 (1.02–1.24) - 1.36 (- 2.71–0.01) 1.20 (1.05–1.37)
Fathers (N = 8902)
No. children (ref: 2)
1 0.07 (- 0.43–0.57) 0.96 (0.85–1.09) - 0.01 (- 0.81–0.78) 0.97 (0.81–1.17)
3 - 0.59 (- 1.79–0.62) 1.05 (1.00–1.10) - 0.18 (- 0.59–0.23) 1.04 (0.94–1.15)
4? - 0.75 (- 2.48–0.97) 1.12 (1.02–1.23) - 1.45 (- 2.842- 0.06) 1.28 (1.06–1.54)
AFB (ref: 23–34 years)
\ 23 years - 0.4 (- 1.57–0.77) 1.06 (0.96–1.17) - 0.01 (- 1.57–1.55) 1.18 (0.91–1.54)
35? - 1.47 (- 2.47–0.48) 1.06 (0.90–1.26) - 0.58 (- 1.062- 0.10) 0.89 (0.77–1.04)
All women (N = 11,439)
No. children (ref: 2)
0 0.16 (- 1.05–1.38) 0.95 (0.89–1.02) - 0.79 (- 1.53–- 0.05) 0.90 (0.77–1.06)
1 - 0.43 (- 1.07–0.21) 1.07 (1.00–1.14) - 0.56 (- 1.12–0.01) 1.04 (0.91–1.19)
3 0.03 (- 0.46–0.51) 1.00 (0.95–1.06) - 0.35 (- 0.80–0.09) 1.00 (0.90–1.10)
4? - 0.15 (- 0.90–0.59) 1.05 (0.99–1.10) - 0.92 (- 1.64–- 0.21) 1.25 (1.06–1.48)
Mothers (N = 10,374)
No. children (ref: 2)
1 - 0.49 (- 1.06–0.07) 1.06 (1.00–1.13) - 0.54 (- 1.15–0.07) 1.07 (0.97–1.18)
3 0.12 (- 0.35–0.58) 1.01 (0.95–1.06) - 0.31 (- 0.82–0.19) 1.01 (0.92–1.11)
4? - 0.07 (- 0.81–0.68) 1.05 (1.00–1.09) - 0.88 (- 1.66–- 0.10) 1.22 (1.11–1.34)
AFB (ref: 20–29 years)
\ 20 years - 0.19 (- 0.59–0.22) 1.00 (0.96–1.05) - 0.15 (- 0.87–0.57) 1.03 (0.81–1.31)
30? 0.30 (- 0.23–0.84) 1.01 (0.97–1.05) 0.09 (- 0.65–0.83) 0.91 (0.82–1.01)
Adjusted for age (continuous), age squared, educational level, father’s occupation, wealth quintile,
smoking, reported physical activity, marital status and country fixed-effects
Bold indicates statistically significant at the 5% level
K. Keenan, E. Grundy
123

4.3 Longitudinal Associations Between Fertility History and Health
Table 4 and Figs. 5 and 6 show changes in health between waves 1 and 2 according
to fertility history. Parents of 4 or more children had a higher risk of circulatory/
metabolic disease onset. Overall, women who had been teenage mothers had a
higher risk of increasing health problems and functional limitations. Parents of 4 or
more children had higher odds of developing metabolic diseases (Fig. 5a, b). We
Fig. 3 a, b Adjusted cross-sectional associations between fertility history and chronic diseases atbaseline among men and women aged 50–79 years, SHARE wave 1. *P\ 0.05 **P\ 0.01***P\ 0.001
Fig. 4 a, b Adjusted cross-sectional associations between fertility history and chronic diseases atbaseline among parents aged 50–79 years, SHARE wave 1. *P\ 0.05 **P\ 0.01 ***P\ 0.001
Fertility History and Physical and Mental Health Changes…
123

Table
4A
dju
sted
lon
git
udin
alas
soci
atio
ns
bet
wee
nfe
rtil
ity
his
tory
and
hea
lth
ou
tco
mes
atfo
llo
w-u
p(w
ave
2)
amon
gm
enag
ed5
0–
79
yea
rs,
SH
AR
Ew
aves
1–
2
Gri
pst
ren
gth
b(9
5%
CI)
Funct
ional
lim
itat
ions
IRR
(95
%C
I)
Dep
ress
ion
IRR
(95
%C
I)
Co
gn
itio
n
b(9
5%
CI)
Ind
exo
fh
ealt
h
con
dit
ion
s
OR
(95
%C
I)
All
men
(N=
98
05)
No
.ch
ild
ren
(ref
:2
)
0-
0.3
5(-
2.0
1–
1.3
1)
1.1
0(0
.85
–1
.42)
1.1
3(0
.95
–1
.35
)0
.07
(-1
.40–
1.5
4)
1.0
6(0
.84
–1
.34
)
1-
0.0
6(-
0.9
1–
0.7
8)
1.0
5(0
.89
–1
.25)
1.0
9(0
.95
–1
.25
)0
.09
(-0
.88–
1.0
7)
1.1
5(0
.83
–1
.59
)
3-
0.4
8(-
1.3
4–
0.3
9)
1.0
7(0
.96
–1
.19)
1.07(1.00–1.15)
-0
.04
(-1
.25–
1.1
7)
1.1
6(0
.95
–1
.41
)
4?
-0
.61
(-1
.67
–0
.45
)1
.07
(0.9
4–1
.21)
1.0
6(0
.99
–1
.14
)-
0.2
1(-
1.2
5–
0.8
3)
1.1
6(0
.96
–1
.40
)
Fat
her
s(N
=8
90
2)
No
.ch
ild
ren
(ref
:2
)
1-
0.1
4(-
0.9
6–
0.6
8)
1.0
4(0
.85
–1
.28)
1.1
1(0
.98
–1
.25
)-
0.0
7(-
1.4
6–
1.3
2)
1.1
5(0
.84
–1
.56
)
3-
0.4
2(-
1.3
5–
0.5
0)
1.0
4(0
.95
–1
.15)
1.0
7(0
.97
–1
.19
)-
0.0
8(-
1.2
6–
1.1
1)
1.1
3(0
.93
–1
.38
)
4?
-0
.68
(-1
.68
–0
.32
)1
.02
(0.9
2–1
.13)
1.0
6(0
.94
–1
.18
)-
0.3
3(-
1.3
6–
0.7
0)
1.1
4(0
.98
–1
.33
)
AF
B(r
ef:
23
–34
yrs
)
\2
3y
ears
-0
.45
(-1
.39
–0
.48
)1
.16
(0.9
2–1
.46)
1.0
4(0
.92
–1
.17
)-
0.3
1(-
1.4
5–
0.8
3)
1.1
3(0
.92
–1
.39
)
35?
0.1
4(-
1.1
1–
1.3
9)
0.9
4(0
.78
–1
.14)
0.9
4(0
.86
–1
.02
)-
0.1
9( -
1.1
8–
0.7
9)
0.9
8(0
.80
–1
.20
)
All
wo
men
(N=
11
,43
9)
No
.ch
ild
ren
(ref
:2)
00
.02
(-1
.00
–1
.04
)0
.97
(0.8
7–1
.08)
1.0
3(0
.95
–1
.12
)0
.22
(-0
.96–
1.3
9)
0.8
9(0
.73
–1
.09
)
10
.12
(-0
.58
–0
.82
)1
.01
(0.9
4–1
.09)
1.0
2(0
.94
–1
.12
)–
0.1
(-0
.93–
0.7
4)
1.0
0(0
.86
–1
.16
)
3-
0.1
8(-
0.6
9–
0.3
3)
0.9
4(0
.87
–1
.01)
1.0
0(0
.93
–1
.08
)–
0.4
(-1
.05–
0.2
5)
1.0
3(0
.89
–1
.20
)
4?
-0
.25
(-1
.12
–0
.62
)1
.03
(0.9
3–1
.15)
1.0
4(0
.98
–1
.1)
-0
.63
(-1
.63–
0.3
7)
1.17(1.05–1.30)
K. Keenan, E. Grundy
123

Table
4co
nti
nu
ed
Gri
pst
ren
gth
b(9
5%
CI)
Funct
ional
lim
itat
ions
IRR
(95
%C
I)
Dep
ress
ion
IRR
(95
%C
I)
Co
gn
itio
n
b(9
5%
CI)
Ind
exo
fh
ealt
h
con
dit
ion
s
OR
(95
%C
I)
Mo
ther
s(N
=1
0,3
74
)
No
.ch
ild
ren
(ref
:2)
10
.27
(-0
.41
–0
.94
)1
.04
(0.9
7–1
.12)
1.0
3(0
.96
–1
.11
)-
0.0
9(-
0.7
0–
0.5
2)
1.0
4(0
.89
–1
.22
)
3-
0.0
6(-
0.7
5–
0.6
2)
0.9
4(0
.87
–1
.02)
1.0
1(0
.94
–1
.08
)-
0.3
9(-
1.1
0–
0.3
1)
1.0
1(0
.86
–1
.19
)
4?
-0
.04
(-0
.90
–0
.83
)1
.02
(0.9
3–1
.13)
1.05(1.00–1.09)
-0
.61
(-1
.38–
0.1
6)
1.15(0.99–1.33)
AF
B(r
ef:
20
–29
yrs
)
\2
0y
ears
0.1
3(-
0.8
9–
1.1
5)
1.12(1.03–1.22)
1.0
5(0
.98
–1
.13
)0
.01
(-0
.74–
0.7
7)
1.23(1.04–1.45)
30?
-0
.03
(-0
.82
–0
.76
)1
.00
(0.9
0–1
.11)
0.9
9(0
.93
–1
.06
)0
.06
(-0
.89–
1.0
1)
0.9
5(0
.79
–1
.15
)
Ad
just
edfo
r:h
ealt
hat
bas
elin
e,m
on
ths
bet
wee
nw
ave
1an
dw
ave
2,
age
(co
nti
nuo
us)
,ag
esq
uar
ed,
cou
ntr
yfi
xed
-eff
ects
,fa
ther
’so
ccu
pat
ion
,ed
uca
tion,
mar
ital
stat
us,
par
ity
(par
ent’
sm
odel
s),
smokin
gbeh
avio
ur,
physi
cal
acti
vit
y,
house
hold
wea
lth.
Dep
ress
ion
addit
ional
lyad
just
edfo
rphysi
cal
hea
lth
(funct
ional
lim
itat
ions)
Bo
ldin
dic
ates
stat
isti
call
ysi
gn
ifica
nt
atth
e5
%le
vel
Fertility History and Physical and Mental Health Changes…
123

undertook additional regressions, sequentially adding physical activity and smoking
behaviour at baseline, but this hardly altered the results.
4.4 Robustness and Sensitivity Analysis
The supplementary Tables S1–S3 and Figures S1–S4 show the same models with a
weighted complete case analysis. There were more statistically significant
associations in the complete case analyses, but the same pattern of effects was
seen. Adjustment for deceased children (Table S4, cross-sectional models and
Fig. 5 a, b Adjusted longitudinal associations between fertility history and chronic diseases in men andwomen aged 50–79 years, SHARE waves 1–2. *P\ 0.05 **P\ 0.01 ***P\ 0.001
Fig. 6 a, b Adjusted longitudinal associations between fertility history and chronic diseases in parentsaged 50–79 years, SHARE waves 1–2. *P\ 0.05 **P\ 0.01 ***P\ 0.001
K. Keenan, E. Grundy
123

Table S5, longitudinal models) did not substantially alter the results. Appendix
Tables S6 and S7 show the results of pattern mixture models which assess the
difference in the longitudinal results when the dropouts are assumed to be in worse
health at baseline than those who remained. In the majority of cases the same pattern
of associations held, the main exception was that the association with cancer in high
parity women disappeared: the OR for women with 4? children decreased from
2.31 to 1.09. This means that in general, our assumption that the data were missing
at random using the MI results was appropriate, and that the results from the MI
models are relatively robust.
4.5 Interactions with Societal/Welfare Context and Marital Status
We found evidence that the effects of parity on overall health at baseline varied by
context for both men and women (LLT P value for men P = 0.028, and for women
P = 0.014). Men in Nordic countries with 4? children fared better than parity
4? men in other contexts. Women with 2 or more children in Mediterranean
countries fared worse than women in the other countries, and the Mediterranean
disadvantage increased with parity. We show the predicted probabilities in
supplementary Figures S5a and S5b. We also saw that women’s grip strength
declined with increasing parity in the Mediterranean countries but not in the other
regions. We did observe some weakly significant interactions for fertility timing, but
most of these showed no clear trend. We found some evidence that men with a high
parity (3 or more) had worse overall health at baseline if they were also never
married, compared to other marital status groups (LLT P value = 0.047). There was
also the same significant interaction effect in the longitudinal models (Supplemen-
tary Figures S6a and S6b). We also found some evidence of parenthood timing was
moderated by marital status, but there was no clear pattern to these differences.
5 Discussion
In this longitudinal study following European respondents over a 2–3-year period,
we found fertility patterns predicted greater increases in some health problems for
older people, and differently for men and women. Our results confirm previous
studies in finding that higher parity (4 or more children) and early parenthood is
associated with poorer health and faster health declines. By investigating specific
health indicators across a range of diseases and conditions using the same sample,
we have gained a better understanding of underlying biosocial pathways. The
negative effect of early parenthood was most evident through more baseline
functional limitations and faster acquisition of limitations during the follow-up
period, corroborating associations between early parenthood and poorer physical
function seen in other studies (Barban 2013; Berkman et al. 2015; Grundy and
Tomassini 2005; Hank 2010; Henretta et al. 2008; Pirkle et al. 2014). This pattern
could be explained by health or social selection, or that early parenthood is part of a
process of ‘weathering’, a chain of disadvantage through adolescence and adulthood
which creates stress and cumulates in worse health (Foster et al. 2008; Geronimus
Fertility History and Physical and Mental Health Changes…
123

1996). Parents of 4 or more children had worse health at baseline on a range of
measures: depression, cognition and circulatory disease. High parity parents were
also more likely to develop circulatory disease during follow-up (in line with other
studies (Lawlor et al. 2003), suggesting a potential biological influence of repeat
childbearing (women) through metabolic and lipid profiles, or through lifestyle
factors (both men and women). Later first-time fathers (age 35?) had lower grip
strength and cognition at baseline, but also fewer chronic diseases, and did not
experience significantly worse health declines. Although childless individuals had
worse baseline health on some measures, they also did not experience greater health
declines.
While the study largely confirms patterns seen previously, we did find some
unexpected results and extended our understanding of the fertility–health nexus in
different contexts. Adjustment for current health behaviours did not alter the results,
suggesting they do not play a major explanatory role. This was surprising for
smoking, because this also took into account former smoking. However, health
behaviours through the life course could still be an important explanation, and
future studies could address this. To fully elucidate this influence in future research
it would be necessary to use prospective data covering the whole life course. A
previous study has noted the absence of a parity penalty in Norway relative to other
contexts (Grundy 2009), while a Swedish analysis found elevated mortality risks for
parity 4? men, but not for women, after controlling for fertility timing (Barclay
et al. 2016). Our study found no high parity penalty in Nordic welfare regimes
relative to others. This could be explained by greater institutional supports in Nordic
regimes for women’s labour force participation, the availability of childcare and
generous family benefits, which may offset potential stresses and costs of
childrearing. We found some moderation of fertility patterns by current marital
status, mainly that the combination of being never married and having 3 or more
children was associated with worse health for men, than other partnership/fertility
patterns. However, this analysis was limited by a lack of data on partnership history
in the waves 1 and 2 SHARE data. Further research could start to investigate how
fertility affects health conditional on life course partnership history, to unpick the
complex pathways to poor health in later life. This could include accounting for
partner’s characteristics and how these can influence later life health.
The later life health effects of childbearing postponement on parents are still not
fully understood (Schmidt et al. 2012), partly because there is a lag between fertility
and later life outcomes. Another complicating factor is that the social profile of
those who give birth at advanced ages has changed over the century, altering
associations with health: a recent UK study showed that across cohorts older
mothers have become progressively more advantaged (Goisis et al. 2017). In this
study, later first-time fathers (age 35?, born in the years 1961–1990) had
significantly worse health on some measures, and significantly better on others. This
could be explained by prior health conditions delaying entry to partnership and
childbearing (Nilsen et al. 2013).On the other hand, later first-time fathers could
also be actively parenting into middle age which could provide some social control
of health related behaviours and more social participation, lowering the risk of
developing lifestyle related diseases. An additional explanation is that later first-
K. Keenan, E. Grundy
123
time parents are positively selected, considering themselves in good enough health
to consider childbearing at later ages. However, the apparently contradictory results
for later parenthood deserve further exploration, especially because childbearing
postponement in increasing in most European countries.
Strengths of this study include the use of multiple health indicators (including
one objectively measured biomarker) covering many health domains, use of a
prospective design, and cross-national comparison of trends. We also paid attention
to missing data mechanisms and performed substantial sensitivity analyses.
However, there were several limitations. We followed individual’s health for a
relatively short period of time (2–3 years) and levels of change were not dramatic.
Following SHARE respondents over several waves is complicated by high levels of
attrition (closely related to health status) which would result in an extremely
unrepresentative sample. Despite applying weights that adjust to mortality over the
observation period, because we only start observing our sample at age 50, there is
likely to be survivorship bias at different levels for different countries. Although we
included some early life variables in the model which might account for selection
(education, father’s occupation) we lacked data on measures of early life health,
cognition and health behaviours which may confound some of the associations seen
in this study, although they are known to be strongly associated with socio-
economic background and educational attainment which we do consider (Grundy
and Read 2015). Our assessment of the impact of health behaviours was limited
because we did not have data on life course health behaviours, and it would be
important to look these effects dynamically. In addition we are testing for effects
across multiple outcomes, which increases the chance of spurious ‘false positive’
results. In this respect it is reassuring that we broadly see the same pattern of effects
across multiple specifications of the same model, while using weighted/unweighted
data, multiply imputed data and other subsamples. Our study consolidates the
evidence for fertility history affecting a range of range of health domains in later
life, differently for men and women, and suggests further attention be paid to the
mechanisms for poor health, including health behaviours, healthcare-seeking
behaviour and interactions between fertility, marriage and socio-economic factors.
Acknowledgements The research leading to these results has received funding from the European
Research Council (ERC) under the European Union’s Seventh Framework Programme (FP7/2007-2013),
ERC Grant Agreement No 324055, entitled ‘FAMHEALTH’ awarded to Emily Grundy.
Open Access This article is distributed under the terms of the Creative Commons Attribution 4.0
International License (http://creativecommons.org/licenses/by/4.0/), which permits unrestricted use, dis-
tribution, and reproduction in any medium, provided you give appropriate credit to the original
author(s) and the source, provide a link to the Creative Commons license, and indicate if changes were
made.
References
Allison, P. D. (1990). Change scores as dependent variables in regression analysis. Sociological
Methodology, 20, 93. https://doi.org/10.2307/271083.
Fertility History and Physical and Mental Health Changes…
123

Arts, W., & Gelissen, J. (2002). Three worlds of welfare capitalism or more? A state-of-the-art report. Journal of
European Social Policy, 12(122), 958–9287. https://doi.org/10.1177/0952872002012002114.
Barban, N. (2013). Family trajectories and health: A life course perspective. European Journal of
Population/Revue europeenne de Demographie, 29(4), 357–385. https://doi.org/10.1007/s10680-
013-9296-3.
Barclay, K., Keenan, K., Grundy, E., Kolk, M., & Myrskyla, M. (2016). Reproductive history and post-
reproductive mortality: A sibling comparison analysis using Swedish register data. Social Science &
Medicine, 155, 82–92. https://doi.org/10.1016/j.socscimed.2016.02.043.
Berkman, L. F., Zheng, Y., Glymour, M. M., Avendano, M., Borsch-Supan, A., & Sabbath, E. L. (2015).
Mothering alone: Cross-national comparisons of later-life disability and health among women who
were single mothers. Journal of Epidemiology and Community Health, 69(9), 865–872. https://doi.
org/10.1136/jech-2014-205149.
Borsch-Supan, A., Brandt, M., Hunkler, C., Kneip, T., Korbmacher, J., Malter, F., et al. (2013). Data
resource profile: The Survey of Health, Ageing and Retirement in Europe (SHARE). International
Journal of Epidemiology, 42(4), 992–1001. https://doi.org/10.1093/ije/dyt088.
Buber, I., & Engelhardt, H. (2008). Children’s impact on the mental health of their older mothers and
fathers: Findings from the Survey of Health, Ageing and Retirement in Europe. European Journal of
Ageing, 5(1), 31–45. https://doi.org/10.1007/s10433-008-0074-8.
Castro-Costa, E., Dewey, M., Stewart, R., Banerjee, S., Huppert, F., & Mendonca-Lima, C. (2008).
Ascertaining late-life depressive symptoms in Europe: An evaluation of the survey version of the
EURO-D scale in 10 nations. The SHARE project. International Journal of Methods in Psychiatric
Research, 17(1), 12–29. https://doi.org/10.1002/mpr.236.
Chereji, E., Gatz, M., Pedersen, N. L., & Prescott, C. A. (2013). Reexamining the association between
fertility and longevity: Testing the disposable soma theory in a modern human sample of twins. The
Journals of Gerontology Series A: Biological Sciences and Medical Sciences, 68(5), 499–509.
https://doi.org/10.1093/gerona/gls218.
Christensen, K., & Vaupel, J. W. (1996). Determinants of longevity: Genetic, environmental and medical
factors. Journal of Internal Medicine, 240(6), 333–341. https://doi.org/10.1046/j.1365-2796.1996.
d01-2853.x.
Daniels, M. J., Hogan, J. W., & Raton, B. (2011). Missing data in longitudinal studies: Strategies for
Bayesian modeling and sensitivity analysis (Vol. 30). London: Chapman & Hall. https://doi.org/10.
1002/sim.4162.
Dariotis, J. K., Pleck, J. H., Astone, N. M., & Sonenstein, F. L. (2011). Pathways of early fatherhood,
marriage, and employment: A latent class growth analysis. Demography, 48(2), 593–623. https://
doi.org/10.1007/s13524-011-0022-7.
Dior, U. P., Hochner, H., Friedlander, Y., Calderon-Margalit, R., Jaffe, D., Burger, A., et al. (2013).
Association between number of children and mortality of mothers: Results of a 37-year follow-up
study. Annals of Epidemiology, 23(1), 13–18. https://doi.org/10.1016/j.annepidem.2012.10.005.
Doblhammer, G. (2000). Reproductive history and mortality later in life: A comparative study of England
and Wales and Austria. Population Studies, 54(2), 169–176. https://doi.org/10.1080/713779087.
Downe, S., Finlayson, K., Walsh, D., & Lavender, T. (2009). ‘‘Weighing up and balancing out’’: A meta-
synthesis of barriers to antenatal care for marginalised women in high-income countries. BJOG: An
International Journal of Obstetrics & Gynaecology, 116(4), 518–529. https://doi.org/10.1111/j.
1471-0528.2008.02067.x.
Einio, E., Nisen, J., & Martikainen, P. (2015). Is young fatherhood causally related to midlife mortality?
A sibling fixed-effect study in Finland. Journal of Epidemiology and Community Health, 69(11),
1077–1082. https://doi.org/10.1136/jech-2015-205627.
Einio, E., Nisen, J., & Martikainen, P. (2016). Number of children and later-life mortality among Finns born
1938–1950. Population Studies, 70(2), 217–238. https://doi.org/10.1080/00324728.2016.1195506.
Foster, H., Hagan, J., & Brooks-Gunn, J. (2008). Growing up fast: Stress exposure and subjective
‘‘weathering’’ in emerging adulthood. Journal of Health and Social Behavior, 49(2), 162–177.
https://doi.org/10.1177/002214650804900204.
Frejka, T., Hoem, J. M., & Sobotka, T. (2008). Childbearing trends and policies in Europe (Vol. 13).
Rostock: Max Planck Institute for Demographic Research.
Geronimus, A. T. (1996). What teen mothers know. Human Nature, 7(4), 323–352. https://doi.org/10.
1007/BF02732898.
K. Keenan, E. Grundy
123
Gibney, S., Delaney, L., Codd, M., & Fahey, T. (2017). Lifetime childlessness, depressive mood and
quality of life among older Europeans. Social Indicators Research, 130(1), 305–323. https://doi.org/
10.1007/s11205-015-1177-1.
Goisis, A., Schneider, D. C., & Myrskyla, M. (2017). The reversing association between advanced
maternal age and child cognitive ability: Evidence from three UK birth cohorts. International
Journal of Epidemiology, 46(3), 850–859. https://doi.org/10.1093/ije/dyw354.
Grundy, E. (2009). Women’s fertility and mortality in late mid life: A comparison of three contemporary
populations. American Journal of Human Biology, 21(4), 541–547. https://doi.org/10.1002/ajhb.
20953.
Grundy, E., & Foverskov, E. (2016). Age at first birth and later life health in Western and Eastern Europe.
Population and Development Review, 42(2), 245–269. https://doi.org/10.1111/j.1728-4457.2016.
00128.x.
Grundy, E., & Kravdal, O. (2007). Reproductive history and mortality in late middle age among
Norwegian men and women. American Journal of Epidemiology, 167(3), 271–279. https://doi.org/
10.1093/aje/kwm295.
Grundy, E., & Kravdal, Ø. (2010). Fertility history and cause-specific mortality: A register-based analysis
of complete cohorts of Norwegian women and men. Social Science & Medicine, 70(11), 1847–1857.
https://doi.org/10.1016/j.socscimed.2010.02.004.
Grundy, E., & Read, S. (2015). Pathways from fertility history to later life health: Results from analyses
of the English longitudinal study of ageing. Demographic Research, 32(1), 107–146. https://doi.org/
10.4054/DemRes.2015.32.4.
Grundy, E., & Tomassini, C. (2005). Fertility history and health in later life: A record linkage study in
England and Wales. Social Science & Medicine, 61(1), 217–228. https://doi.org/10.1016/j.
socscimed.2004.11.046.
Gunderson, E. P., Jacobs, D. R., Chiang, V., Lewis, C. E., Tsai, A., Quesenberry, C. P., et al. (2009).
Childbearing is associated with higher incidence of the metabolic syndrome among women of
reproductive age controlling for measurements before pregnancy: The CARDIA study. American
Journal of Obstetrics and Gynecology, 201(2), 177.e1–177.e9. https://doi.org/10.1016/j.ajog.2009.
03.031.
Guralnik, J. M., Butterworth, S., Patel, K., Mishra, G., & Kuh, D. (2009). Reduced midlife physical
functioning among never married and childless men: evidence from the 1946 British Birth Cohort
Study. Aging Clinical and Experimental Research, 21(2), 174–181. https://doi.org/10.1007/
BF03325226.
Hank, K. (2010). Childbearing history, later-life health, and mortality in Germany. Population Studies,
64(3), 275–291. https://doi.org/10.1080/00324728.2010.506243.
Hank, K., & Wagner, M. (2013). Parenthood, marital status, and well-being in later life: Evidence from
SHARE. Social Indicators Research, 114(2), 639–653. https://doi.org/10.1007/s11205-012-0166-x.
Henretta, J. C. (2007). Early childbearing, marital status, and women’s health and mortality after age 50.
Journal of Health and Social Behavior, 48(3), 254–266. https://doi.org/10.1177/
002214650704800304.
Henretta, J. C., Grundy, E. M. D., Okell, L. C., & Wadsworth, M. E. J. (2008). Early motherhood and
mental health in midlife: A study of British and American cohorts. Aging & Mental Health, 12(5),
605–614. https://doi.org/10.1080/13607860802343084.
Hinkula, M., Kauppila, A., Nayha, S., & Pukkala, E. (2006). Cause-specific mortality of grand
multiparous women in Finland. American Journal of Epidemiology, 163(4), 367–373. https://doi.
org/10.1093/aje/kwj048.
Imamura, M., Tucker, J., Hannaford, P., da Silva, M. O., Astin, M., Wyness, L., et al. (2007). Factors
associated with teenage pregnancy in the European Union countries: A systematic review. The
European Journal of Public Health, 17(6), 630–636. https://doi.org/10.1093/eurpub/ckm014.
Kalil, A., & Kunz, J. (2002). Teenage childbearing, marital status, and depressive symptoms in later life.
Child Development, 73(6), 1748–1760. https://doi.org/10.1111/1467-8624.00503.
Kane, J. B., Morgan, S. P., Harris, K. M., & Guilkey, D. K. (2013). The educational consequences of teen
childbearing. Demography, 50(6), 2129–2150. https://doi.org/10.1007/s13524-013-0238-9.
Kiernan, K. E. (1997). Becoming a young parent: A longitudinal study of associated factors. The British
Journal of Sociology, 48(3), 406. https://doi.org/10.2307/591138.
Kravdal, Ø., Grundy, E., Lyngstad, T. H., & Wiik, K. A. (2012). Family life history and late mid-life
mortality in Norway. Population and Development Review, 38(2), 237–257. https://doi.org/10.1111/
j.1728-4457.2012.00491.x.
Fertility History and Physical and Mental Health Changes…
123

Kravdal, Ø., Grundy, E., & Skirbekk, V. (2017). Fertility history and use of antidepressant medication in
late mid-life: A register-based analysis of Norwegian women and men. Aging & Mental Health,
21(5), 477–486. https://doi.org/10.1080/13607863.2015.1118010.
Kvale, G., Heuch, I., & Nilssen, S. (1994). Parity in relation to mortality and cancer incidence: A
prospective study of Norwegian women. International Journal of Epidemiology, 23(4), 691–699.
https://doi.org/10.1093/ije/23.4.691.
Lacey, R. E., Sacker, A., Bell, S., Kumari, M., Worts, D., McDonough, P., et al. (2017). Work-family life
courses and BMI trajectories in three British birth cohorts. International Journal of Obesity, 41(2),
332–339. https://doi.org/10.1038/ijo.2016.197.
Lawlor, D. A., Emberson, J. R., Ebrahim, S., Whincup, P. H., Wannamethee, S. G., Walker, M., et al.
(2003). Is the association between parity and coronary heart disease due to biological effects of
pregnancy or adverse lifestyle risk factors associated with child-rearing?: Findings from the British
women’s heart and health study and the British regional heart study. Circulation: Journal of the
American Heart Association, 107(9), 1260–1264. https://doi.org/10.1161/01.cir.0000053441.43495.
1a.
McMunn, A., Lacey, R. E., Kumari, M., Worts, D., McDonough, P., & Sacker, A. (2016). Work-family
life courses and metabolic markers in mid-life: Evidence from the British national child
development study. Journal of Epidemiology and Community Health, 70(5), 481–487. https://doi.
org/10.1136/jech-2015-206036.
Merrill, R. M., Fugal, S., Novilla, L. B., & Raphael, M. C. (2005). Cancer risk associated with early and
late maternal age at first birth. Gynecologic Oncology. https://doi.org/10.1016/j.ygyno.2004.11.038.
Merritt, M. A., Riboli, E., Murphy, N., Kadi, M., Tjønneland, A., Olsen, A., et al. (2015). Reproductive
factors and risk of mortality in the European prospective investigation into cancer and nutrition: A
cohort study. BMC Medicine, 13(1), 252. https://doi.org/10.1186/s12916-015-0484-3.
Mirowsky, J. (2005). Age at first birth, health, and mortality. Journal of Health and Social Behavior,
46(1), 32–50. https://doi.org/10.1177/002214650504600104.
Mirowsky, J., & Ross, C. E. (2002). Depression, parenthood, and age at first birth. Social Science and
Medicine, 54(8), 1281–1298. https://doi.org/10.1016/S0277-9536(01)00096-X.
Monden, C. (2007). Partners in health? Exploring resemblance in health between partners in married and
cohabiting couples. Sociology of Health & Illness, 29(3), 391–411. https://doi.org/10.1111/j.1467-
9566.2007.01003.x.
Nilsen, A. B. V., Waldenstrom, U., Rasmussen, S., Hjelmstedt, A., & Schytt, E. (2013). Characteristics of
first-time fathers of advanced age: A Norwegian population-based study. BMC Pregnancy and
Childbirth, 13(1), 29. https://doi.org/10.1186/1471-2393-13-29.
Pirkle, C. M., de Albuquerque Sousa, A. C. P., Alvarado, B., & Zunzunegui, M.-V. (2014). Early
maternal age at first birth is associated with chronic diseases and poor physical performance in older
age: Cross-sectional analysis from the International Mobility in Aging study. BMC Public Health,
14(1), 293. https://doi.org/10.1186/1471-2458-14-293.
Ploubidis, G. B., Benova, L., Grundy, E., Laydon, D., & DeStavola, B. (2014). Lifelong socio economic
position and biomarkers of later life health: Testing the contribution of competing hypotheses.
Social Science & Medicine, 119, 258–265. https://doi.org/10.1016/j.socscimed.2014.02.018.
Powell, B., Steelman, L. C., & Carini, R. M. (2006). Advancing age, advantaged youth: Parental age and
the transmission of resources to children. Social Forces, 84(3), 1359–1390. https://doi.org/10.1353/
sof.2006.0064.
Rantanen, T., Guralnik, J. M., Foley, D., Masaki, K., Leveille, S., Curb, J. D., et al. (1999). Midlife hand
grip strength as a predictor of old age disability. JAMA, 281(6), 558. https://doi.org/10.1001/jama.
281.6.558.
Rantanen, T., Harris, T., Leveille, S. G., Visser, M., Foley, D., Masaki, K., et al. (2000). Muscle strength
and body mass index as long-term predictors of mortality in initially healthy men. The Journals of
Gerontology Series A: Biological Sciences and Medical Sciences, 55(3), M168–M173. https://doi.
org/10.1093/gerona/55.3.M168.
Read, S., & Grundy, E. (2017). Fertility history and cognition in later life. Journals of Gerontology Series
- B Psychological Sciences and Social Sciences. https://doi.org/10.1093/geronb/gbw013.
Read, S., Grundy, E., & Wolf, D. (2011). Fertility history, health, and health changes in later life: A panel
study of British women and men born 1923–1949. Population Studies, 65(2), 201–215. https://doi.
org/10.1080/00324728.2011.572654.
Rubin, D. B. (1976). Inference and missing data. Biometrika, 63(3), 581. https://doi.org/10.2307/
2335739.
K. Keenan, E. Grundy
123

Rubin, D. B., & Little, R. J. A. (1987). Statistical analysis with missing data (2nd ed.). Hoboken, New
Jersey: Wiley.
Schmidt, L., Sobotka, T., Bentzen, J. G., & Nyboe Andersen, A. (2012). Demographic and medical
consequences of the postponement of parenthood. Human Reproduction Update, 18(1), 29–43.
https://doi.org/10.1093/humupd/dmr040.
Sigle-Rushton, W. (2005). Young fatherhood and subsequent disadvantage in the United Kingdom. Journal of
Marriage and Family, 67(3), 735–753. https://doi.org/10.1111/j.1741-3737.2005.00166.x.
Skilton, M. R., Serusclat, A., Begg, L. M., Moulin, P., & Bonnet, F. (2009). Parity and carotid
atherosclerosis in men and women: Insights into the roles of childbearing and child-rearing. Stroke,
40(4), 1152–1157. https://doi.org/10.1161/STROKEAHA.108.535807.
Sowers, J. R. (2003). Obesity as a cardiovascular risk factor. American Journal of Medicine, 115, 37–41.
https://doi.org/10.1016/j.amjmed.2003.08.012.
Spence, N. J. (2008). The long-term consequences of childbearing. Research on Aging, 30(6), 722–751.
https://doi.org/10.1177/0164027508322575.
StataCorp. (2015). Stata statistical software: Release 14. College Station, TX: StataCorp LP.
Steele, F., Kallis, C., Goldstein, H., & Joshi, H. (2005). The relationship between childbearing and
transitions from marriage and cohabitation in Britain. Demography, 42(4), 647–673. https://doi.org/
10.1353/dem.2005.0038.
Tomassini, C., Glaser, K., Wolf, D., van Groenou, M. B., & Grundy, E. (2004). Living arrangements
among older people: An overview of trends in Europe and the USA. Population Trends, 115, 24–35.
Umberson, D., Pudrovska, T., & Reczek, C. (2010). Parenthood, childlessness, and well-being: A life
course perspective. Journal of Marriage and the Family, 72(3), 612–629. https://doi.org/10.1111/j.
1741-3737.2010.00721.x.
Umberson, D., Liu, H., Mirowsky, J., & Reczek, C. (2011). Parenthood and trajectories of change in body
weight over the life course. Social Science & Medicine, 73(9), 1323–1331. https://doi.org/10.1016/j.
socscimed.2011.08.014.
Waldron, I., Weiss, C. C., & Hughes, M. E. (1998). Interacting effects of multiple roles on women’s
health. Journal of Health and Social Behavior, 39(3), 216. https://doi.org/10.2307/2676314.
Westendorp, R. G. J., & Kirkwood, T. B. L. (1998). Human longevity at the cost of reproductive success.
Nature, 396(6713), 743–746. https://doi.org/10.1038/25519.
Winkvist, A., Rasmussen, K. M., & Habicht, J. P. (1992). A new definition of maternal depletion
syndrome. American Journal of Public Health, 82(5), 691–694. https://doi.org/10.2105/AJPH.82.5.
691.
Fertility History and Physical and Mental Health Changes…
123