ferrochrome slag characterization -...
TRANSCRIPT

FERROCHROME SLAG CHARACTERIZATION
Characterization of Ferrochrome Slag was taken up for the study of chromium
leaching and immobilization considerations. This chapter discusses the following
characterization studies of Ferrochrome Slag.
Physical properties of ferrochrome slag.
Chemical characterization of FeCr slag to find out the major and trace elements.
FeCr Slag Mineralogy to study chromium bearing mineral phases and other mineral
phases.
Microscopic studies to evaluate the chemical composition and structural aspects of
different phases present in slag matrix.
3.1 Collection of Ferrochrome Slag
Ferrochrome Slag samples were collected from the Ferrochrome manufacturing
industries located in Kalinga Nagar Industrial area in Odisha, Eastern part of India.
Granulated slag samples were collected when the industry adopted water cooled slag
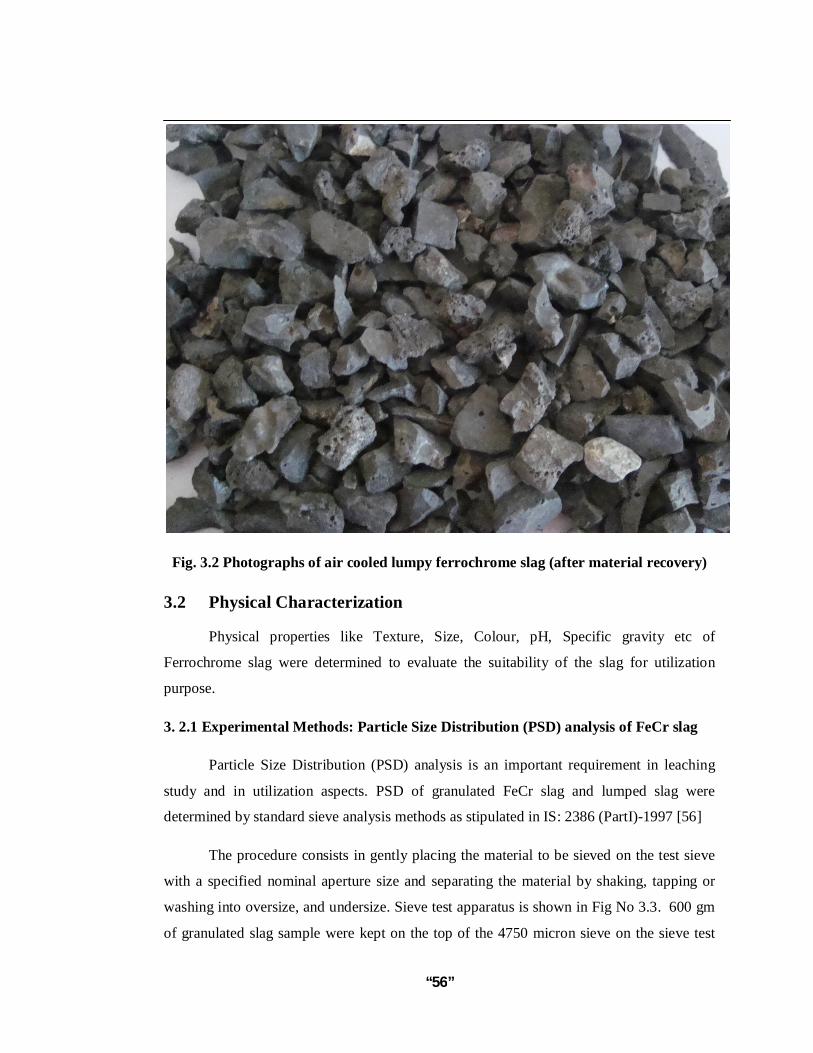
granulation process. Lumped slag samples were collected from the air cooled slag after
material recovery. Pictures of the slag samples are shown in Fig.3.1. and 3.2.
Fig. 3.1 Photographs of water cooled granulated ferrochrome slag
Chapter 3
“56”
Fig. 3.2 Photographs of air cooled lumpy ferrochrome slag (after material recovery)
3.2 Physical Characterization
Physical properties like Texture, Size, Colour, pH, Specific gravity etc of
Ferrochrome slag were determined to evaluate the suitability of the slag for utilization
purpose.
3. 2.1 Experimental Methods: Particle Size Distribution (PSD) analysis of FeCr slag
Particle Size Distribution (PSD) analysis is an important requirement in leaching
study and in utilization aspects. PSD of granulated FeCr slag and lumped slag were
determined by standard sieve analysis methods as stipulated in IS: 2386 (PartI)-1997 [56]
The procedure consists in gently placing the material to be sieved on the test sieve
with a specified nominal aperture size and separating the material by shaking, tapping or
washing into oversize, and undersize. Sieve test apparatus is shown in Fig No 3.3. 600 gm
of granulated slag sample were kept on the top of the 4750 micron sieve on the sieve test

“57”
apparatus. The standard sieve sizes chosen were 4750, 2360, 1180, 600, 300, 150, 75
micron for the purpose. Mass retained on each sieve was collected and weighed accurately.
Cumulative mass passed and cumulative mass passed percentage through each sieve were
estimated. The results are shown in Table No 3.1 and is illustrated in Fig No 3.4
Fig .3.3 Sieve Test apparatus
Table 3.1: Particle Size Distribution (PSD) of granulated FeCr slag
Sieve size micron
Mass retained in gm
Cum Mass Passed in gm
Cum mass Passed %
4750 0 600 100
2360 12 588 98
1180 120 468 78
600 271 197 32.8
300 112 85 14.2
150 48 37 6.2
75 29 8 1.3
<75 8 0 0
“58”
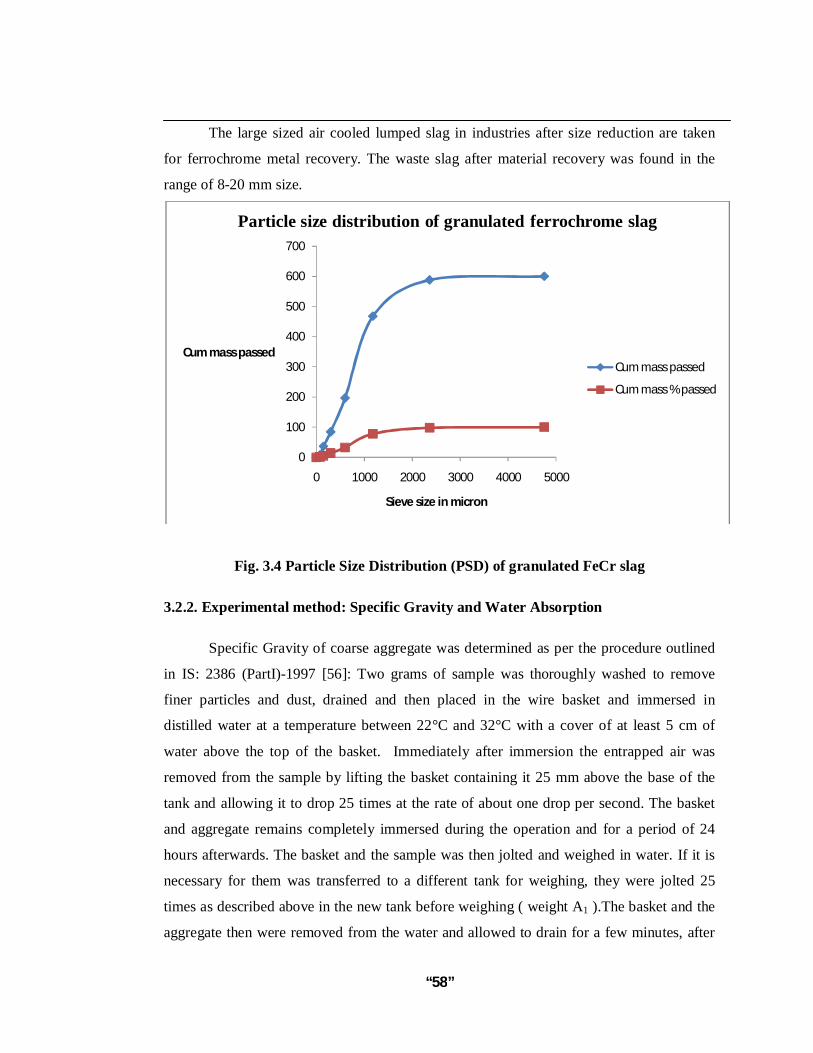
The large sized air cooled lumped slag in industries after size reduction are taken
for ferrochrome metal recovery. The waste slag after material recovery was found in the
range of 8-20 mm size.
Fig. 3.4 Particle Size Distribution (PSD) of granulated FeCr slag
3.2.2. Experimental method: Specific Gravity and Water Absorption
Specific Gravity of coarse aggregate was determined as per the procedure outlined
in IS: 2386 (PartI)-1997 [56]: Two grams of sample was thoroughly washed to remove
finer particles and dust, drained and then placed in the wire basket and immersed in
distilled water at a temperature between 22°C and 32°C with a cover of at least 5 cm of
water above the top of the basket. Immediately after immersion the entrapped air was
removed from the sample by lifting the basket containing it 25 mm above the base of the
tank and allowing it to drop 25 times at the rate of about one drop per second. The basket
and aggregate remains completely immersed during the operation and for a period of 24
hours afterwards. The basket and the sample was then jolted and weighed in water. If it is
necessary for them was transferred to a different tank for weighing, they were jolted 25
times as described above in the new tank before weighing ( weight A1 ).The basket and the
aggregate then were removed from the water and allowed to drain for a few minutes, after
0
100
200
300
400
500
600
700
0 1000 2000 3000 4000 5000
Cum mass passed
Sieve size in micron
Particle size distribution of granulated ferrochrome slag
Cum mass passed
Cum mass % passed

“59”
which the, aggregate was gently emptied from the basket on to one of the dry clothes, and
the empty basket was returned to the water, jolted 25 times and weighed in water ( weight
A2).The aggregate placed on the dry cloth is gently surface dried with the cloth,
transferring it to the second dry cloth when the first removed no further moisture. The
aggregate was then placed in the oven in the shallow tray, at a temperature of I00 to 110°C
and maintained at this temperature for 24 hours. It was then removed from the oven, cooled
in the airtight container and weighed (weight C).
Specific gravity=ି
Where A=A1-A2 Water absorption (percent of dry weight) =ଵ(ି)
3.2.2.1 Specific Gravity of Granulated FeCr slag
A representative sample of 500 gm of the above saturated surface dry material was
obtained. The sample was kept immersed in distilled water for 24 hours. Then the sample
was dried. This weight of saturated and surface dry material was recorded as A. Then the
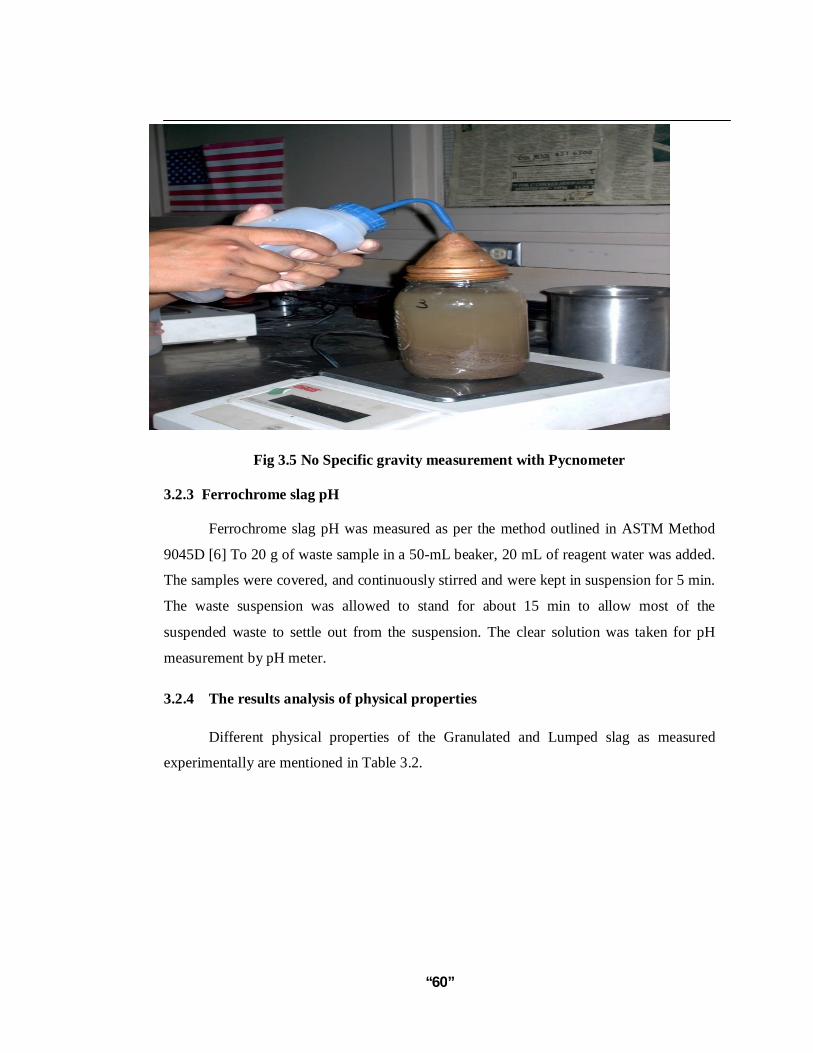
slag sample was placed in a Pycnometer (shown in Fig.3.5) and was filled with distilled
water to remove any froth from the surface. The Pycnometer with sample was weighed as
B. The pycnometer was then emptied and was filled with distilled water to the same level
as before. The Pycnometer with water was weighed as C. The sample was then oven dried
at temperature of 100-110 deg C and weighed accurately as D. Specific gravity on saturated
surface dry basis = ି(ି)
Water Absorption (% dry weight) = ଵ (ି)
A = Weight of saturated dry sample
B= Weight of Pycnometer with sample and water
C = Weight of Pycnometer with water
D = Weight of Oven dried sample.
“60”
Fig 3.5 No Specific gravity measurement with Pycnometer 3.2.3 Ferrochrome slag pH
Ferrochrome slag pH was measured as per the method outlined in ASTM Method
9045D [6] To 20 g of waste sample in a 50-mL beaker, 20 mL of reagent water was added.
The samples were covered, and continuously stirred and were kept in suspension for 5 min.
The waste suspension was allowed to stand for about 15 min to allow most of the
suspended waste to settle out from the suspension. The clear solution was taken for pH
measurement by pH meter.
3.2.4 The results analysis of physical properties
Different physical properties of the Granulated and Lumped slag as measured
experimentally are mentioned in Table 3.2.

“61”
Table 3.2: Results of Physical Characterization of FeCr slag
Physical parameter Test method/protocol results
Water cooled granulated slag
pH US EPA- 9045D 7.78
Colour Visual Dark
Texture Visual Granulated & Crystalline
Size IS 2386(I),1997 <4.75 mm
Specific gravity IS 2386(III),1997 2.72
Water absorption IS 2386(III),1997 1.15 %
Air cooled lumpy slag
pH US EPA- 9045D 7.34
Colour Visual Grey
Texture Visual Lump
Size IS 2386(I),1997 8-20 mm
Specific gravity IS 2386(III),1997 2.84
Water absorption IS 2386(III),1997 0.42 %
Air cooled lumpy slag as available was found to have the desirable size range of 8
to 20 mm. Details of the other physical and engineering properties of the slag were
examined and discussed in section 6.2 in chapter 6, to evaluate their suitability as concrete
aggregate material.
3.3 Chemical Characterization of Ferrochrome Slag
The Chemical Characterization of Ferrochrome Slag was carried out to determine
the various chemical compounds present in the slag. Realising the importance of Redox
chemistry of chromium in this study, this study was carried out to determine the chromium
speciation in the slag.
3.3.1 Major Element Analysis
The experimental determinations of major chemical constituents in the slag by
different methods are described below.
“62”
3.3.1.1 Experimental methods: Wet chemical analysis methods
Around 5 kg of representative samples of ferrochrome slag was collected. Lumpy
samples were subjected to size reduction by a roll crusher. Around 500 g sample from each
batch was drawn by coning and quartering. The samples were oven-dried at 1050 C for 3
hrs. The dried samples were powdered in a pulveriser. Four different methods were
followed to complete the chemical analyses for all major elements. Silica was determined
by gravimetric method. About 1.0 g powdered sample was accurately weighed and taken in
a platinum crucible. It was fused with Na2CO3 at about 9000 C. The mass was dissolved in
dil. HCl. The solution was evaporated over hot plate and baked for an hour at 1100 C. It
was redissolved in dil. HCl and filtered through Whatman No. 40 filter paper. The residue
was ignited in a platinum crucible and weighed. It was hydrofluorised and weight was
taken again. SiO2% was calculated from the loss of weight in hydrofluorisation.CaO,
MgO,Al2O3, FeO etc were determined volumetrically. Also Cr2O3 was determined
volumetrically. All the aforesaid analysis methods followed the procedures outlined in
Standard methods of the examination of water and wastewater, APHA [112].
3.3.1.2 Experimental methods: Volumetric analysis of Cr2O3
The earlier sample was fused with sodium peroxide in a nickel crucible. The
sodium chromate formed was leached out with water and the acidified solution was reacted
with known excess of ferrous ammonium sulphate. The excess of ferrous ammonium
sulphate was estimated by titrating with standard potassium dichromate solution using
barium diphenylamine sulphonate as indicator. A blank was taken and Cr2O3 was
determined from the amount of ferrous ammonium sulphate used up.
3.3.1.3 Experimental methods: XRF Analysis
Alternatively the quantitative analysis of major elements samples wire carried out
by X- ray Fluorescence spectroscopy (XRF). For this purpose samples in the form of
pressed powdered pellets were exposed to a Phillips PW- 1400 X- ray spectrometer with
scandium tube.
“63”
3.3.2 Experimental methods-Trace Element Analysis
In order to carry out of ferrochrome slag, the determination of trace elements
particularly toxic heavy metals in FeCr slag was carried out for the detailed study of
environmental assessment. Among the trace elements Analysis of Cr (VI) is of prime
importance because of its leachability and toxic nature.
3.3.2.1 Experimental methods: Method for analysis of Cr (VI)
About 1.0 g powered sample was digested with 30 ml of 1: 1 H2SO4. The solution
was filtered through Whatman No. 40 filter paper. Diphenylcarbazide solution was
prepared taking 25 mg of salt in 50 ml of acetone. A suitable aliquot was taken in a 50 ml
volumetric flask. To the solution, 2ml H3PO4 and 2 ml Diphenylcarbazide solution were
added. The volume was made 50 ml with 0.2% H2SO4. After 10 minutes, the absorbance
and concentration of Cr (VI) was measured at 541.4 nm by a visible spectrophotometer
ELICO model SL-164.Experimental specification for spectrophotometer is shown in Table
3.3 The solution results are reported in mg/l and considering the amount of slag dissolved
in the solution the results are expressed in mg/kg.
Table 3.3: UV/Visible Spectrophotometers: Experimental specification.
Parameters Value/Range of values
Optics Double beam
Spectral range 190-1100 nm
Spectral band width 2 nm
Light source Deuterium for UV & Tungsten for visible spectrum
Maximum absorption peak
wavelength for Cr(VI)
541.4 nm
3.3.2.2 Experimental methods: analysis of other trace elements by AAS
About 1.0 g powered sample was accurately weighed and was taken in a 100 ml
Teflon beaker. 15 ml of conc. Hydro Fluoric Acid was added to the beaker and it was
boiled over a hot plate with occasional swirling till it was dried off. Similarly 15 ml HCl
and 5 ml HNO3 were added in succession and dried off. Finally 50 ml of 1:1 HCl was
“64”
added and it was boiled to obtain almost clear solution. The solution was transferred to a
250 ml volumetric flask and the volume was made to 250 ml with Milli-Q water. The
solution was kept aside overnight to settle the particulate matter if any. The supernatant
liquid in original or with required dilution was taken for analysis of trace elements in
ferrochrome slag by Graphite Furnace Atomic Absorption Spectrophotometer (SIMADZU,
AA-6300) with a sensitivity up to 1 µg/l. Hg, As and Se were determined with Hydride
Generator attachment of AAS. Experimental Specification for AAS is shown in Table 3.4
All the aforesaid analysis methods followed the procedures outlined in APHA[112] and are
reported in mg/kg or parts per million (ppm).
Table 3.4: Atomic Absorption Spectrophotometer (AAS): Experimental specification.
Element Wavelength nm
Lamp current mA
Slit Width nm
Flame type Gas flow l/min
Burner height mm
As 193.7 12 1 Nitrous Oxide-Acetylene flame 3.7 15
Cr 357.9 10 0.5 Air- Acetylene flame (reducing) 2.8 9
Cu 324.8 6 0.5 Air- Acetylene flame 1.8 7
Cd 228.8 3 0.5 Air- Acetylene flame (oxidising) 1.8 7
Zn 213.9 3 0.5 Air- Acetylene flame (oxidising) 1.8 7
Mn 285,2 8 0.5 Air- Acetylene flame 1.8 7
Pb 217.0 12 0.5 Nitrous Oxide-Acetylene flame 2 7
Ni 232.0 10 0.5 Air- Acetylene flame (reducing) 1.8 7
Hg 253.7 4 1 Hydride generator - -
Se 196.0 4 1 Hydride generator - -
3.3.3 The result analysis of Chemical Characterization of Ferrochrome Slag
As evident from the representative chemical analysis report, the FeCr slag contains the
major chemical constituents like Alumina, Silica and Magnesia. Besides it contains appreciable
quantities environmentally harmful chromium compounds. The results of major chemical analysis
of Ferrochrome Slag are shown in Table 3.5 and Table 3.6.
“65”
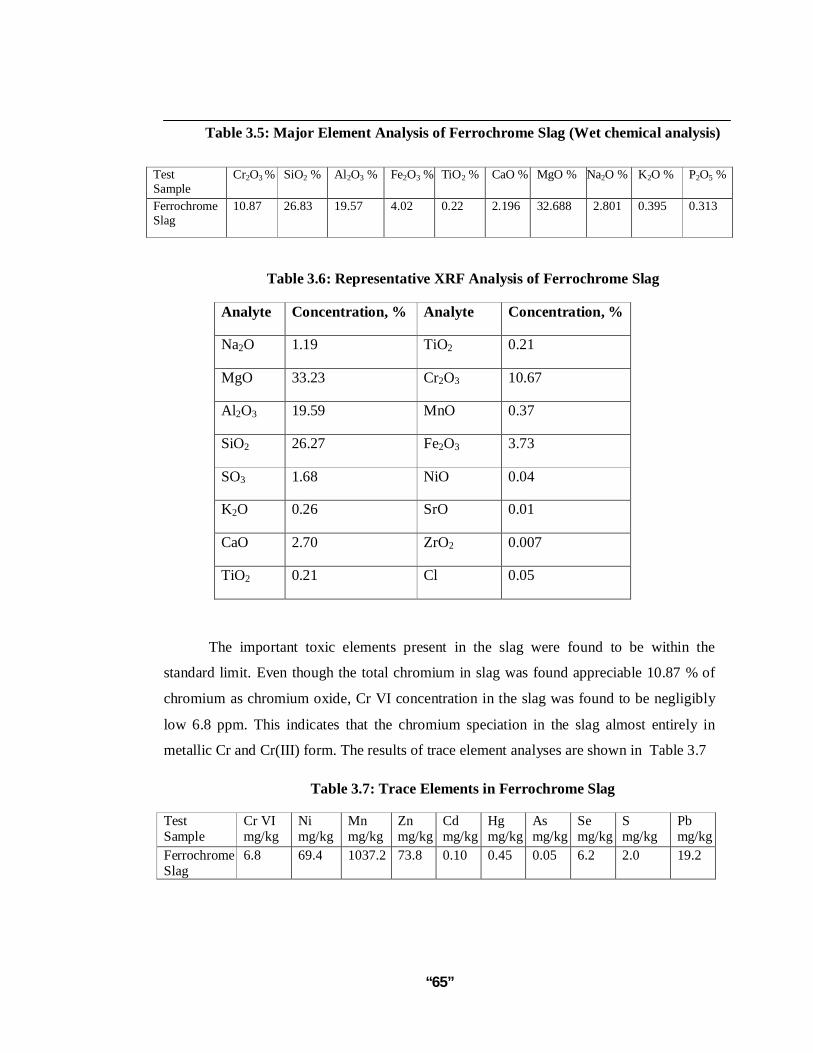
Table 3.5: Major Element Analysis of Ferrochrome Slag (Wet chemical analysis)
Table 3.6: Representative XRF Analysis of Ferrochrome Slag
Analyte Concentration, % Analyte Concentration, %
Na2O 1.19 TiO2 0.21
MgO 33.23 Cr2O3 10.67
Al2O3 19.59 MnO 0.37
SiO2 26.27 Fe2O3 3.73
SO3 1.68 NiO 0.04
K2O 0.26 SrO 0.01
CaO 2.70 ZrO2 0.007
TiO2 0.21 Cl 0.05
The important toxic elements present in the slag were found to be within the
standard limit. Even though the total chromium in slag was found appreciable 10.87 % of
chromium as chromium oxide, Cr VI concentration in the slag was found to be negligibly
low 6.8 ppm. This indicates that the chromium speciation in the slag almost entirely in
metallic Cr and Cr(III) form. The results of trace element analyses are shown in Table 3.7
Table 3.7: Trace Elements in Ferrochrome Slag
Test Sample
Cr VI mg/kg
Ni mg/kg
Mn mg/kg
Zn mg/kg
Cd mg/kg
Hg mg/kg
As mg/kg
Se mg/kg
S mg/kg
Pb mg/kg
Ferrochrome Slag
6.8 69.4 1037.2 73.8 0.10 0.45 0.05 6.2 2.0 19.2
Test Sample
Cr2O3 % SiO2 %
Al2O3 % Fe2O3 % TiO2 % CaO % MgO % Na2O % K2O % P2O5 %
Ferrochrome Slag
10.87 26.83 19.57 4.02 0.22 2.196 32.688 2.801 0.395 0.313
“66”
3.4 Mineralogical Characterization: X-ray Diffraction study
The mineralogical Characterization by X-ray Diffraction study of ferrochrome slag
was carried out with a view to finding out the major mineralogical phase present in the
slag.
3.4.1 Experimental Method
XRD patterns were drawn for samples of ferrochrome slag using a Cu target of X-
ray diffractometer, make- Pan Analytical, model- Expert Pro. Mineral phases were
identified by comparing the d- spacings with those given in ASTM data cards.
3.4.2 Result Analysis
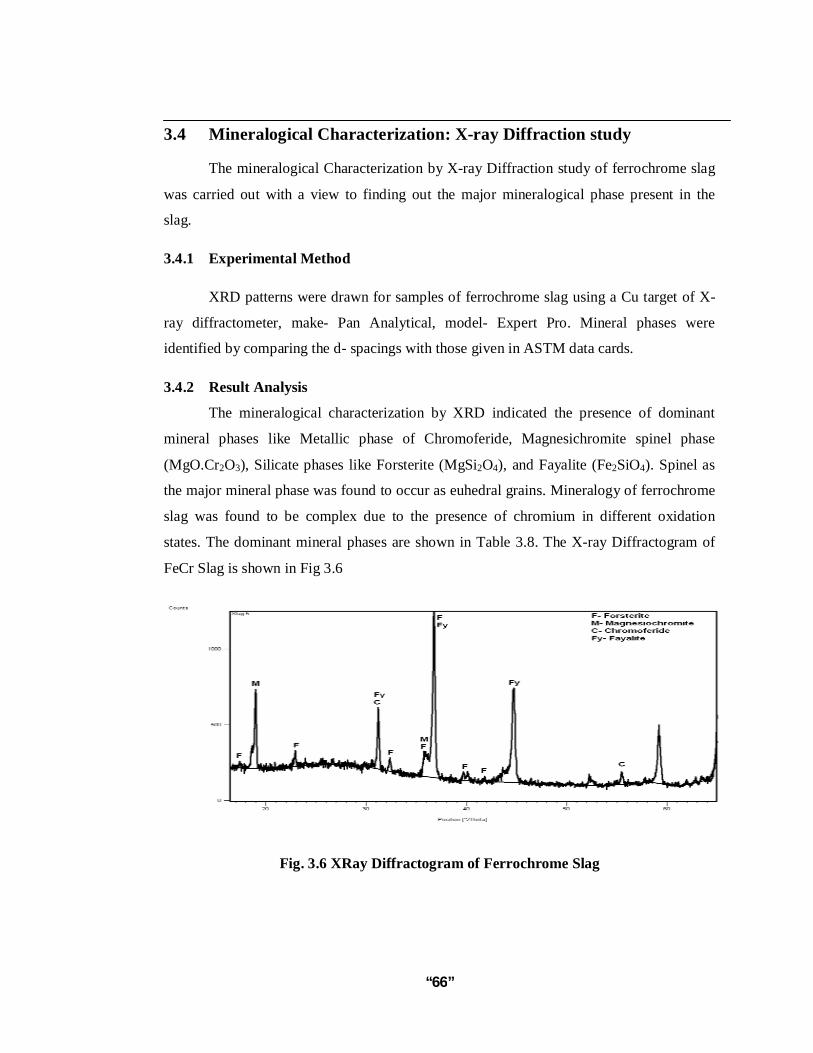
The mineralogical characterization by XRD indicated the presence of dominant
mineral phases like Metallic phase of Chromoferide, Magnesichromite spinel phase
(MgO.Cr2O3), Silicate phases like Forsterite (MgSi2O4), and Fayalite (Fe2SiO4). Spinel as
the major mineral phase was found to occur as euhedral grains. Mineralogy of ferrochrome
slag was found to be complex due to the presence of chromium in different oxidation
states. The dominant mineral phases are shown in Table 3.8. The X-ray Diffractogram of
FeCr Slag is shown in Fig 3.6
Fig. 3.6 XRay Diffractogram of Ferrochrome Slag
“67”
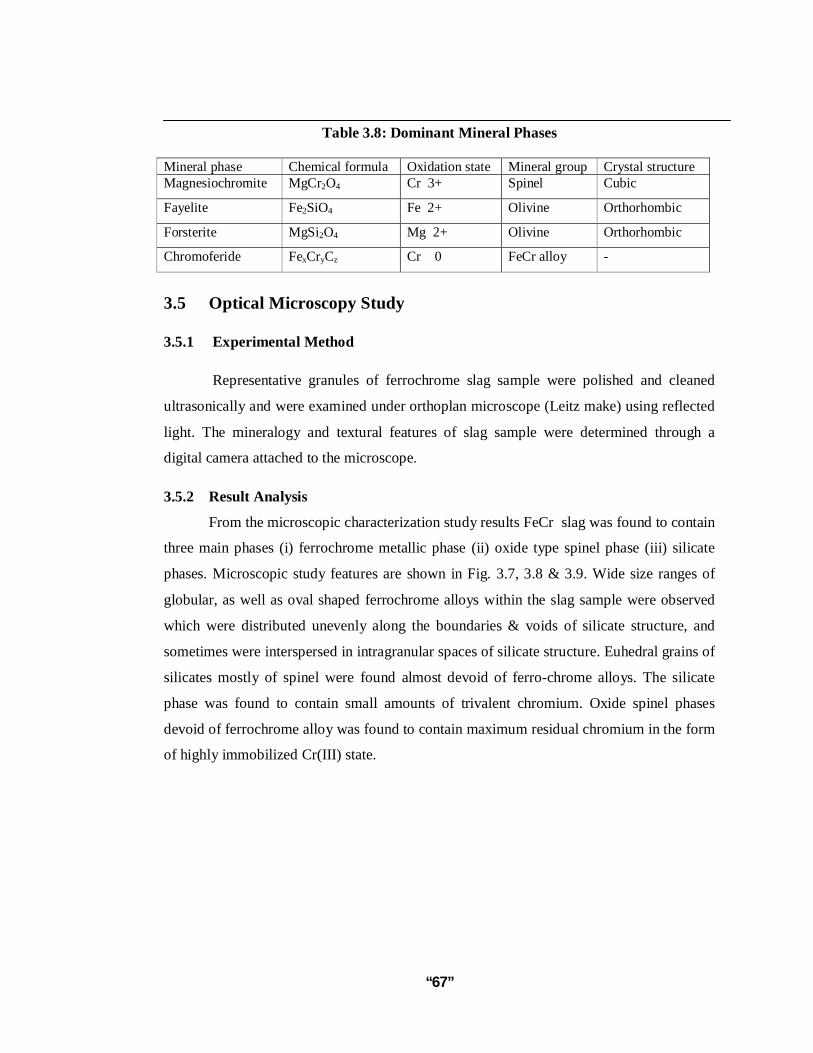
Table 3.8: Dominant Mineral Phases Mineral phase Chemical formula Oxidation state Mineral group Crystal structure Magnesiochromite MgCr2O4 Cr 3+ Spinel Cubic
Fayelite Fe2SiO4 Fe 2+ Olivine Orthorhombic
Forsterite MgSi2O4 Mg 2+ Olivine Orthorhombic
Chromoferide FexCryCz Cr 0 FeCr alloy -
3.5 Optical Microscopy Study 3.5.1 Experimental Method
Representative granules of ferrochrome slag sample were polished and cleaned
ultrasonically and were examined under orthoplan microscope (Leitz make) using reflected
light. The mineralogy and textural features of slag sample were determined through a
digital camera attached to the microscope.
3.5.2 Result Analysis
From the microscopic characterization study results FeCr slag was found to contain
three main phases (i) ferrochrome metallic phase (ii) oxide type spinel phase (iii) silicate
phases. Microscopic study features are shown in Fig. 3.7, 3.8 & 3.9. Wide size ranges of
globular, as well as oval shaped ferrochrome alloys within the slag sample were observed
which were distributed unevenly along the boundaries & voids of silicate structure, and
sometimes were interspersed in intragranular spaces of silicate structure. Euhedral grains of
silicates mostly of spinel were found almost devoid of ferro-chrome alloys. The silicate
phase was found to contain small amounts of trivalent chromium. Oxide spinel phases
devoid of ferrochrome alloy was found to contain maximum residual chromium in the form
of highly immobilized Cr(III) state.

“68”
.
Fig.3.7 (a) Globular and lath shaped ferro-chrome metal along the intergranular spaces of
silicates (b) Various shapes and sizes of ferro-chrome alloy along with silicates. (c) Various
shapes and sizes of ferro-chrome metal with the silicates (d) Solid solution inclusions of other
metal compositions with the ferro-chrome metal.
a b
c d

“69”
Fig.3.8 (a) Globular ferro-chrome metal along the voids of silicates and the ferro-
chrome metal also contains silicates within it (b) Ferro-chrome metal along peripheral
boundaries of silicates. (c) Ferro-chrome metal enclosing the silicates (d) ferro-chrome
metal contains inclusions of silicates.
a b
c d
“70”
.
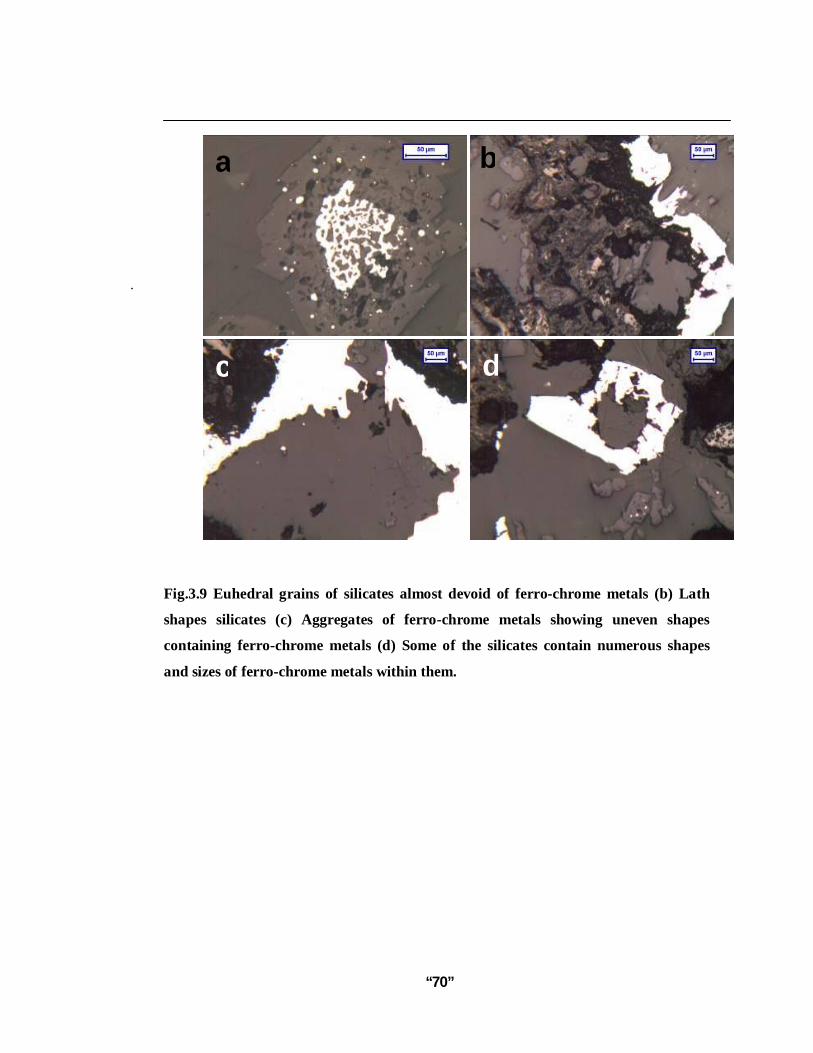
Fig.3.9 Euhedral grains of silicates almost devoid of ferro-chrome metals (b) Lath
shapes silicates (c) Aggregates of ferro-chrome metals showing uneven shapes
containing ferro-chrome metals (d) Some of the silicates contain numerous shapes
and sizes of ferro-chrome metals within them.
a b
c d
“71”
3.6 Scanning Electron Microscopy Study of Ferrochrome slag
Scanning Electron Microscopy (SEM) Studies were carried out to determine the
chemical composition of different phases and microstructure in FeCr slag
3.6.1 Experimental Method
SEM analysis was carried out on the slag samples with the SEM instrument model
no. JSM 5800, make- JEOL (Japan) fitted with Oxford EDS Detector. The microscope has
tungsten hairpin filament with a maximum acceleration voltage of 30 kV. The SEM and
EDS images of different phases in FeCr slag are analysed here under.
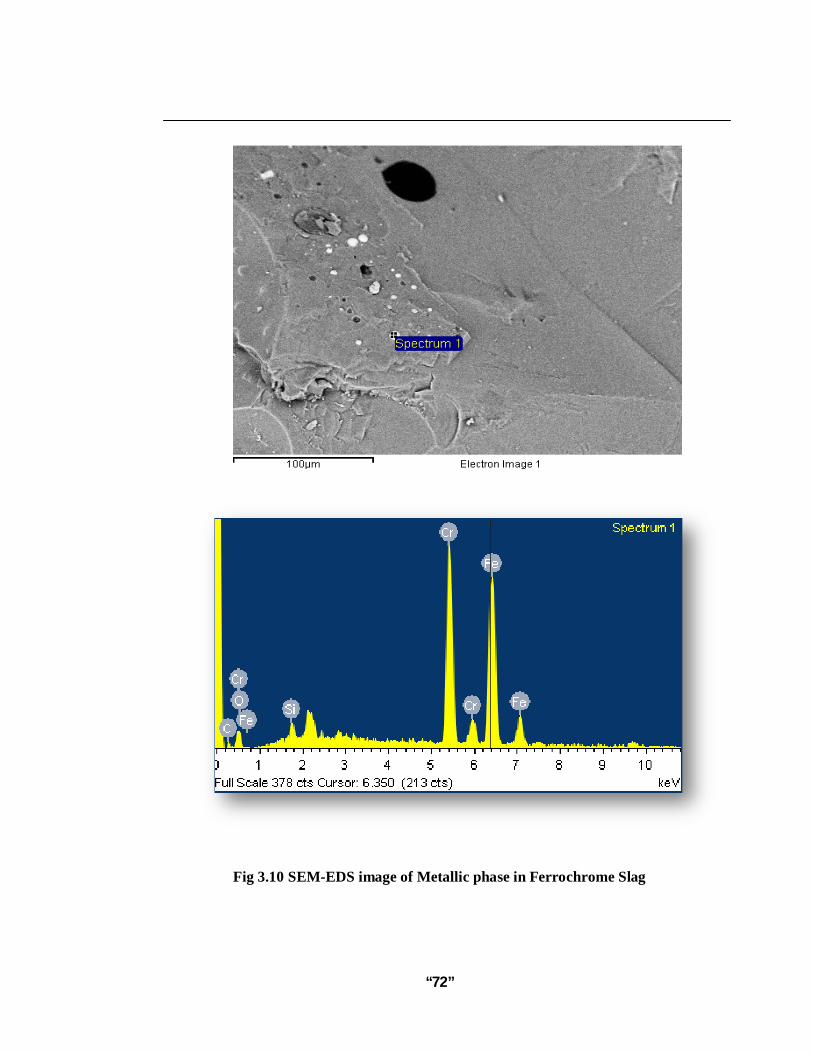
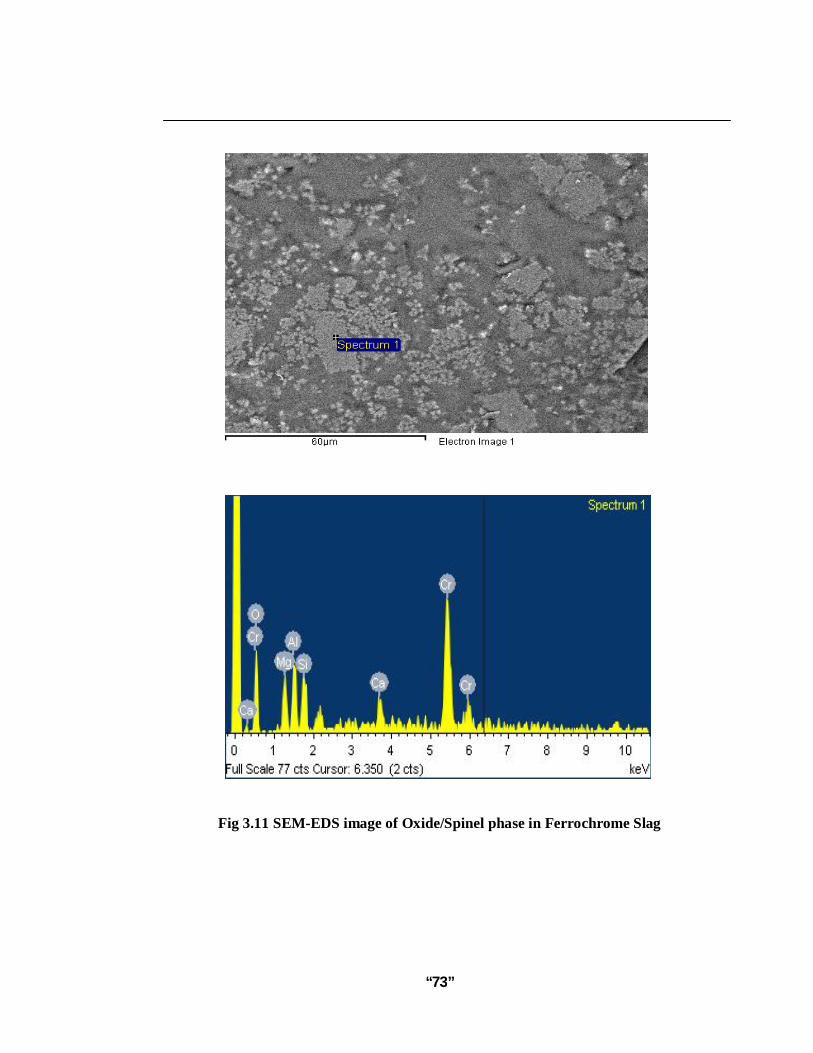
3.6.2 Result Analysis
From the SEM-EDS study results, the FeCr slag was found to have a partly
crystalline and porphyritic structure with hypidiomorphic spinel ((Mg,Fe)(Fe,Al,Cr)2O4)
crystals totally enclosed in a condensed and homogenous silicate glass matrix. Typical
grain size of the spinel crystals is found about 30-40μm. On the structural and chemical
basis the Mg-Cr-Al type mixed spinel was found in equilibrium with the glass (liquid)
phase. The primary spinel phase is the almost pure Mg- Al spinel (MgAl2O4). The
secondarily spinel in the form of Mg-Al-Cr Mixed spinel (Mg,Al,Cr)2O4) was found in
FeCr slag. It was found to contain the typical metal droplet inclusions with Mg-Cr-Al
spinel rims. SEM EDS images of a typical Ferrochrome slag sample are shown in Fig
3.10, 3.11 and 3.12. Ferrochrome slag is a highly heterogeneous material with different
mineral phases and structures differing drastically from one grain sample to the other.
Therefore it is very difficult to get a single uniform result of quantitative element
distribution in the slag. Therefore after carrying out SEM-EDS studies on a number of
Ferrochrome slag grain samples, the following important observations are noted and
presented in Table 3.9
“72”
Fig 3.10 SEM-EDS image of Metallic phase in Ferrochrome Slag
“73”
Fig 3.11 SEM-EDS image of Oxide/Spinel phase in Ferrochrome Slag

“74”
Fig. 3.12 SEM-EDS image of Silicate phase in Ferrochrome Slag

“75”
Table 3.9 SEM-EDS Summarised quantitative analysis in different phases. in mass %
Element Metallic phase FeCr alloy
Spinel/Oxide phase Pure spinel Partially Altered Chromite Mixed Spinel
Silicate phase Forsterite Mixed Silicate
Cr 18-40 6-48 3-12 Fe 50-80 - - Mg - 8-20 7-28 Al - 12-42 4-23 Si - - 3-25 Ca - - 2-4
3.6.3 Result Analysis of SEM-EDS studies
The following important observations are noted from the SEM-EDS Characterization
studies.
SEM-EDS studies on a number of Ferrochrome slag grain samples revealed that,
the slag was found to contain three basic mineral/chemical phases.
Metallic phase comprising of Ferrochrome Alloys was found to contain iron
(ranging from 50 to 80 %) and chromium (ranging from 18 to 40 %) and with 3 to
6% carbon and rarely silicon magnesium and aluminium
Oxide phases were found to contain varying amounts of mixed spinel phases of type
(a) Partially Altered Chromite (Fe Cr)2O4 (b) secondary spinel formed during the
slag generation in the form of Magnesiochromite (Mg Cr)2O4 and mixed spinel (Ca
Mg Al Cr) oxide (c) pure spinel (Mg Al)2O4. Maximum amount of chromium were
found to be entrapped in the stable mixed spinel phases.
Silicate phases included (a) Forsterite (MgSiO3) and Mixed silicate (Ca, Mg, Al2,
Cr2) O3. Both of these silicate phases were found to contain significant amount of
chromium.