ferrocene-pna recognition layers : probe design ... · probe design, interfacial and electron...
TRANSCRIPT

Ferrocene-PNA Recognition Layers –
Probe Design, Interfacial and Electron Transfer Studies
and DNA Detection Strategies
Dissertation
submitted to the Faculty of Chemistry and Biochemistry
of the Ruhr-University Bochum, Germany
for the Degree of
Doctor of Natural Sciences
presented by
Dipl.-Chem. Nina Hüsken
from Bonn, Germany
Bochum, November 2010


This work was prepared between July 2006 and May 2010 at the Faculty of Chemistry
and Biochemistry at the Departments of Inorganic Chemistry (Bioinorganic Chemistry)
and Analytical Chemistry (Electroanalytics and Sensors) at the Ruhr-University Bochum
(Germany) as well as at the Faculty of Chemistry (Functional Biomaterials and Sensors)
at the University of Western Ontario (London, Ontario, Canada).
Oral Examination: 20. December 2010
1st Referee: Prof. Dr. Nils Metzler-Nolte
2nd Referee: Prof. Dr. Wolfgang Schuhmann


for my parents


Acknowledgements
I am very grateful to the following people, who supported me personally and scientifically
throughout the time of my doctoral studies:
Prof. Dr. Nils Metzler-Nolte for giving me the opportunity to work on this interesting subject
in his group, for the freedom in pursuing my research ideas as well as for the chance to
participate in various national and international conferences.
Prof. Dr. Wolfgang Schuhmann for being my second supervisor and referee and even more
for many discsussions about my work and for sparking my interest for bioelectrochemistry.
Prof. Dr. Bernie Kraatz for rendering a research stay in his lab in London, ON, Canada
possible to me, which was personally and scientifically a great experience.
Andrea Ewald and Mr. Breuckmann for measuring various ESI and MALDI-ToF mass spectra,
Rolf von Chelmowski for performing the RAIRS measurement, Surface Science Western (The
University of Western Ontario, London, ON, Canada) for the ToF-SIMS measurement and Dr.
Bauke Albada for the molecular modelling.
My special thanks go to Dr. Magdalena Gębala for a great collaboration, many discussions
and for always finding some time for my issues throughout the whole time of my doctoral
studies.
Dr. Maya Penkova, David Köster, Nicola Alzakhem, Dr. Annika Groß, Andrea Ewald, Dr. Matt
Kuchta, Dr. Harmel Peindy N’Dongo, Dr. Merja Neukamm, Dr. Jessica Lemke, Dr. Gilles
Gasser, Malay Patra, Nat Yamamoto, Wanning Hu, Caroline Bischof, Anna Sosniak, Lukasz
Raszeja, Miya Ma, Johannes Zagermann and all other colleagues from the AC1 for turning
the last four years into a great time.
The ELAN-group and especially Dr. Magdalena Gębala, Lutz Stratman, Dr. Leonard Stoica and
Dr. Fabio LaMantia for great support and help with various electrochemical questions.
My nice colleagues from Canada for making this research stay scientifically fruitful and a
great personal experience. Especially I thank to Dr. Piotr Diakowski, Marc Milne, Armando
Marenco, Dr. Haifeng Song, Dr. Chantelle Davidson and Dr. Xiaomin Bin.
I sincerely thank David Köster, Dr. Annika Groß, Anna Sosniak and especially Dr. Sebastian
Neugebauer for reading parts of this manuscript.

My roommates and friends Christian, Moritz, Steffi, Franzi, Stefan, Björn, Ina, René, Timo,
Vera and Martin for making me stop thinking about science and enjoy the rest of this life.
And I thank my parents, my sisters and my grandparents for their support, patience and
love.

Abstract
The present thesis describes the in-depth analysis of the electron transfer processes of
N-terminally ferrocenylated (Fc) and C-terminally gold-surface grafted peptide nucleic acid
(PNA) strands embedded in different interfacial designs for an employment as reagentless
electrochemical DNA biosensor.
In order to facilitate a target oriented design of Fc-PNA capture probes, a new click
chemistry based synthetic strategy was developed for the N-terminal solid-phase labeling of
PNA sequences with different Fc moieties. By this strategy, the synthesis of a small library of
four PNA conjugates with different N-terminal Fc-triazole (Tz) labels succeeded. These four
Fc-Tz-PNA conjugates revealed to be electrochemically clearly distinguishable by their formal
potentials, hence presenting the electrochemical analog of the classical 4-color detection.
The solid-phase synthesis, HPLC purification and mass spectrometric characterization of
different Fc(-Tz)-PNA conjugates with biologically relevant PNA sequences presented the
basis for construction of gold surface-confined Fc(-Tz)-PNA recognition layers. Voltammetric
studies of various Fc-PNA interfacial designs facilitated the optimization of the Fc-PNA
surface architecture and revealed the significance of different voltammetric primary
parameters for a reliable analysis of the sensor response. The fast-scan cyclic voltammetry
analysis of the electron transfer kinetics at Fc-PNA(•DNA)-modified surfaces exhibited in
detail, how different strand properties like the mechanical bending elasticity as well as the
electric nature dictate the redox process of the strand tethered Fc moiety. This forms in
reverse the molecular precondition as well as the theoretical foundation for an analysis of
DNA sequences with Fc-PNA sensing surfaces.
Exploiting the results from the interfacial as well as electron transfer kinetic studies,
three different strategies for a DNA detection with Fc-PNA based biosensors were
developed. The specific signal-off effect upon DNA hybridization at Fc-ssPNA monolayers
was determined to be in principle sensitive towards the presence of single mismatches. An
optimized dual-potential interface design of two different, electrochemically distinguishable
Fc-Tz-PNA capture probes converts this effect into an easy-to-interpret sensor response
about the hybridization with fully-complementary as well as single-mismatched sequences.
A third sensor concept exploits the slow electron transfer process at densely packed Fc-PNA
layers for a DNA analysis at sensitive, chip-embedded microelectrodes. Therein, different
monolayer-permeabilities form the basis for a voltammetric differentiation of different Fc-
PNA(•DNA) monolayers.


Zusammenfassung
Die vorliegende Arbeit beschreibt die detaillierte Analyse von
Elektronentransferprozessen N-terminal ferrocenylierter und C-terminal an Gold-
Oberflächen gebundener Peptidnukleinsäure Stränge (peptide nucleic acids, PNA),
eingebunden in unterschiedliche Grenzflächen-Designs, für eine Verwendung als
reagenzloser elektrochemischer DNA Biosensor.
Um ein zielorientiertes Design von Fc-PNA Erfassungssonden zu ermöglichen, wurde
eine neue, Click Chemie basierte Synthesestrategie für das N-terminale, Fest-Phasenlabeling
von PNA Sequenzen mit unterschiedlichen Fc Molekülen entwickelt. Mit Hilfe dieser
Strategie gelang die Synthese einer kleinen Bibliothek bestehend aus vier PNA Konjugaten
mit unterschiedlichen N-terminalen Fc-Triazole(Tz) Labels. Diese vier Fc-Tz-PNA Konjugate
sind elektrochemisch durch ihre Formalpotentiale eindeutig unterscheidbar und stellen
somit das elektrochemische Analogon der klassischen 4-Farben Detektion dar. Die
Festphasensynthese, HPLC-Aufreinigung und massenspektrometrische Charakterisierung
unterschiedlicher Fc(-Tz)-PNA Konjugate mit biologisch relevanten PNA Sequenzen
präsentiert die Basis für den Aufbau von Goldoberflächen-fixierten Fc(-Tz)-PNA
Erkennungsschichten. Voltammetrische Studien verschiedener Fc-PNA Grenzflächendesigns
ermöglichten die Optimierung der Fc-PNA Oberflächenarchitektur und zeigten die Signifikanz
verschiedener voltammetrischer Primärparameter für eine verlässliche Analyse der
Sensorantwort auf. Die Analyse der Elektronentransferkinetiken an Fc-PNA(•DNA)-
modifizierten Oberflächen mit Hilfe von fast-scan cyclic voltammetry zeigte detailliert auf,
wie unterschiedliche Strangeigenschaften wie die mechanische Biegeelastizität sowie die
elektrische Natur den Redoxprozess des Strang gebundenen Ferrocens bestimmen. Dies
bildet im Umkehrschluss die molekulare Voraussetzung wie auch das theoretische
Fundament für eine Analyse von DNA Sequenzen mit Fc-PNA Sensoroberflächen.
Basierend auf den Ergebnissen der Grenzflächen- sowie Elektronentransferkinetik-
Studien wurden drei unterschiedliche Strategien für eine DNA Detektion mit Fc-PNA
basierten Biosensoren entwickelt. Die Analyse des spezifischen Signal-off Effekts, der durch
die DNA-Hybridisierung an Fc-ssPNA Monolagen induziert wird, ergab, dass dieser Effekt im
Prinzip sensitiv gegenüber dem Vorhandensein von einzelnen Basenfehlstellen ist. Ein
optimiertes, dual-Potential Grenzflächendesign, bestehend aus zwei unterschiedlichen,
elektrochemisch unterscheidbaren Fc-Tz-PNA Erfassungssonden, konvertiert diesen Effekt in
eine einfach zu interpretierende Sensorantwort über die Hybridisierung mit voll-
komplementären Sequenzen sowie Sequenzen mit einzelnen Basenfehlstellen. Ein drittes
Sensorkonzept nutzt den langsamen Elektronentransferprozess an dicht-beladenen Fc-PNA
Schichten für eine DNA Analyse an sensitiven, chip-lokalisierten Mikroelektroden. Dabei
bilden unterschiedliche Monolagen-Permeabilitäten die Basis für eine voltammetrische
Differenzierung unterschiedlicher Fc-PNA(•DNA) Monolagen.


Table of Contents
1. Introduction..................................................................................................................................... 1
1.1 DNA Biosensing ....................................................................................................................... 1
1.1.1 Functional Principle of (DNA-) Biosensors ...................................................................... 1
1.1.2 Immobilization on Transducer Surfaces .......................................................................... 3
1.1.3 Electrochemical DNA Biosensors..................................................................................... 6
1.1.4 Electron Transfer Processes at End-Terminally Redox-Labeled Capture Probes ............ 8
1.2 Peptide Nucleic Acids – PNA ................................................................................................. 11
1.2.1 Structure, Properties and Applications of PNA ............................................................. 11
1.2.2 Elasticity of Nucleic Acids – the Worm-Like Chain Model ............................................. 13
1.2.3 Covalent Labeling of PNA Oligomers with Metal-Organic Complexes .......................... 15
1.2.4 Labeling of Biomolecules via Click Chemistry ............................................................... 18
1.2.5 PNA Biosensors for the Detection of DNA .................................................................... 21
2. Objective and Outline.................................................................................................................... 24
3. Strategies for the Ferrocene-Labeling of PNA ............................................................................... 26
3.1 Objective ............................................................................................................................... 26
3.2 Ferrocene Building Blocks ..................................................................................................... 28
3.3 Ferrocene Conjugation via Sonogashira Coupling ................................................................ 30
3.3.1 A 5-Iodouracil PNA Monomer Building Block ................................................................ 30
3.3.2 SPPS with the 5-Iodouracil PNA Monomer Building Block ............................................ 33
3.3.3 Ferrocene Conjugation via Sonogashira Coupling ........................................................ 34
3.4 Ferrocene Conjugation via [2+3]-Alkyne/Azide Cycloaddition ............................................. 36
3.4.1 N-Terminal Functionalization of PNA ............................................................................ 36
3.4.2 Ferrocene Conjugation via [2+3]-Alkyne/Azide Cycloaddition ..................................... 38
3.5 Reflection about the Stability of different Fc-Labels ............................................................. 44
3.6 Conclusion ............................................................................................................................. 49
4. Synthesis of Ferrocene-Conjugated PNA Oligomers ..................................................................... 51
4.1 Objective and Choice of Target Sequences ........................................................................... 51
4.2 Solid-Phase PNA Synthesis .................................................................................................... 53
4.3 Synthesis of Fc-PNA Bioconjugates ....................................................................................... 57
4.3.1 Set 1 – Fc-PNA Bioconjugates with Bacterial Target Sequences ................................... 58
4.3.2 Set 2 – Ac-PNA Oligomers with Bacterial Target Sequences ......................................... 60
4.3.3 Set 3 – Fc-PNA Bioconjugates with Varying PNA Sequence Lengths ............................ 61

4.4 Synthesis of Fc-Tz-PNA Bioconjugates ................................................................................... 62
4.4.1 Set 4 – Azide- and Alkyne Functionalized PNA Precursors of Set 5 ............................... 63
4.4.2 Set 5 – Fc-Tz-PNA Bioconjugates with Bacterial Target Sequences .............................. 64
4.5 Conclusion ............................................................................................................................. 66
5. UV Melting Studies ........................................................................................................................ 68
5.1 Objective ................................................................................................................................ 68
5.2 UV Melting Curve Analysis .................................................................................................... 68
5.3 Studies on the Temperature Profile ...................................................................................... 72
5.3.1 Duplexes 1 – Bacterial Target Sequences ...................................................................... 72
5.3.2 Duplexes 2 – Variation of the Sequence Length ............................................................ 74
5.3.3 Duplexes 3 – Variation of a Single Mismatch Position .................................................. 75
5.3.4 PNA Self-Melting ........................................................................................................... 77
5.4 Impact of the Fc-Label ........................................................................................................... 78
5.5 Conclusion ............................................................................................................................. 81
6. Electrochemical Studies................................................................................................................. 83
6.1 Objective ................................................................................................................................ 83
6.2 Voltammetric Techniques ..................................................................................................... 84
6.2.1 Cyclic Voltammetry ........................................................................................................ 84
6.2.2 Square Wave and Differential Pulse Voltammetry........................................................ 87
6.2.3 Theory of Electron Transfer Kinetics ............................................................................. 89
6.3 Structural Characteristics of Fc-PNA and Fc-PNA•DNA Strands............................................ 92
6.4 Electrochemical Studies of Dissolved Fc(-Tz)-PNA Conjugates ............................................. 95
6.4.1 Electrochemical Setup ................................................................................................... 95
6.4.2 Fc-PNA Conjugates with Amide-Bound Fc Moieties (Set 1,3) ....................................... 96
6.4.3 Fc-Tz-PNA Conjugates with Triazole-Linked Fc Moieties (Set 5) ................................... 98
6.4.4 Conclusion ................................................................................................................... 103
6.5 Interfacial Studies of Fc(-Tz)-PNA Modified Gold Surfaces ................................................. 104
6.5.1 General Setup .............................................................................................................. 104
6.5.2 Fc-ssPNA/Au Interface ................................................................................................. 106
6.5.3 Fc-PNA•DNA/Au Interface ........................................................................................... 112
6.5.4 Electron Transfer Mechanism and Implication of the Surface Coverage .................... 116
6.5.5 Binary Fc-PNA/Thiol Interfaces .................................................................................... 119
6.5.6 The Signal-Off Effect .................................................................................................... 124
6.5.7 Fc-Tz-PNA Interfaces.................................................................................................... 128
6.5.8 RAIR Spectroscopic and ToF-SI Mass Spectrometric Surface Characterization .......... 130

6.5.9 Conclusion ................................................................................................................... 133
6.6 Studies on the Mechanical Strand Bending Induced ET Mechanism .................................. 134
6.6.1 ET Kinetics of Fc-PNA(•DNA)/Au Interfaces................................................................. 134
6.6.2 ET Kinetics of Binary Fc-PNA(•DNA)/MCH Interfaces .................................................. 149
6.6.3 Kinetic Analysis with SWV at Varying Pulse Frequencies ............................................ 153
6.6.4 Conclusion ................................................................................................................... 158
6.7 DNA Sensor Concepts .......................................................................................................... 159
6.7.1 Interfaces of Immobilized Fc-PNA•DNA Duplexes with a Single Mismatch ................ 159
6.7.2 A Dual-Potential Fc-Tz-PNA Biosensor ........................................................................ 168
6.7.3 A Chip-Based Analysis of DNA Sequences ................................................................... 179
6.7.4 Conclusion ................................................................................................................... 186
7. Conclusion and Outlook .............................................................................................................. 188
8. Experimental Section .................................................................................................................. 193
8.1 General Procedures ............................................................................................................. 193
8.1.1 Chemicals and Solvents ............................................................................................... 193
8.1.2 Instrumentation and Methods .................................................................................... 193
8.1.3 Electrochemical Equipment ........................................................................................ 196
8.2 Synthesis of Ferrocene Derivatives and 5-Iodouracil PNA Monomer ................................. 197
8.2.1 5-Iodouracil PNA Monomer ........................................................................................ 197
8.2.2 Ferrocene Building Blocks ........................................................................................... 203
8.3 Solid-Phase Synthesis of PNA Oligomers and Conjugates ................................................... 207
8.3.1 General Procedure ...................................................................................................... 207
8.3.2 N-Terminally Acetylated or Non-Modified PNA Oligomers ........................................ 211
8.3.3 N-Terminally Azide-Functionalized PNA Oligomers .................................................... 213
8.3.4 N-Terminally Alkyne-Functionalized PNA Oligomers .................................................. 215
8.3.5 Internally Iodo-Functionalized PNA Oligomer ............................................................. 217
8.3.6 N-Terminally Fc-Labeled PNA Conjugates ................................................................... 218
8.3.7 N-Terminally Fc-Tz-Labeled PNA Conjugates .............................................................. 221
8.3.8 N-terminally Triazole-Modified PNA Conjugates ........................................................ 228
8.3.9 Overview of all Synthesized PNA Conjugates/Oligomers ............................................ 229
8.4 UV Melting Experiments ..................................................................................................... 230
8.4.1 General Procedures ..................................................................................................... 230
8.4.2 Determination of the Molar Extinction Coefficients ε at 260 nm ............................... 231
8.4.3 Determination of the PNA or DNA Concentration ...................................................... 231
8.4.4 UV Melting Curves ....................................................................................................... 232

8.4.5 DNA Oligomers ............................................................................................................ 233
8.4.6 Analysis of (Fc-)PNA•DNA Melting Curves ................................................................... 234
8.5 Electrochemical Measurements and Surface Modifications ............................................... 236
8.5.1 Electrochemical Setup and Measurement Conditions ................................................ 236
8.5.2 Fabrication and Preparation of Electrodes and the Salt Bridge .................................. 237
8.5.3 Modification of Gold Surfaces ..................................................................................... 239
8.5.4 Anayltical Data of a P24•D1-Modified Gold Surface ................................................... 242
9. References ................................................................................................................................... 244

List of Abbreviations
A/a adenine
Ac acetyl
ACN acetonitrile
AFM atomic force microscopy
Ahx ε-aminohexanoic acid
ATR attenuated total reflection
B nucleobase
Bhoc benzhydryloxycarbonyl
Boc tert-butyloxycarbonyl
b. s. background subtracted
C/c cytosine
CE counter electrode
conc. concentrated
Cp cyclopentadienyl
CV cyclic voltammetry
Cys cysteine
DCM dichloromethane
dest. distilled
DFT density functional theory
DIPEA N,N-diisopropylethylamine
DME 1,2-dimethoxyethane
DMF N,N-dimethylformamide
DMSO dimethylsulfoxide
ds double-stranded
E. coli Escherichia coli
EDC N-(3-dimethylaminopropyl)-N’-ethylcarbodiimide
eq. equation
equiv. equivalents
ESI electro-spray interface
EtOAc ethylacetate
Et ethyl
FAB fast atom bombardement
Fc ferrocenyl (CpFeC5H4)
FcH ferrocene (FeCp2)

Fmoc fluorenyl-9-methoxycarbonyl
Fmoc-ONSu Fmoc-succinimide
G/g guanine
h hour
HATU 2-(1H-7-azabenzotriazole-1-yl)-1,1,3,3-tetramethyl-
uronium hexafluorophosphate
HOBt 1-hydroxy-1H-benzotriazole
HOMO highest occupied molecular orbital
HPLC high performance liquid chromatography
Hz hertz
IR infrared
J coupling constant /Hz
KPFM Kelvin probe force microscopy
LUMO lowest unoccupied molecular orbital
Lys lysine
MALDI-ToF matrix-assisted laser desorption/ionization – time of
flight
MCH 6-mercaptohexan-1-ol
MS mass spectrometry
m/z mass per charge ratio
Nb nucleobases: G, A, C or T
NHE normal hydrogen electrode
NMR nuclear magnetic resonance
n. d. not determined
Nt nucleotide
P. putida/aeruginosa Pseudomonas putida/aeruginosa
PNA peptide nucleic acids
PBS phosphate buffer system
ppm parts per million
RE reference electrode
Rf retardation factor /r.u.
r. u. relative units
S Svedberg (1 S = 10-13 s; unit of sedimentation
coefficient)
S. enterica Salmonella enterica
sat. saturated

SNP single-nucleotide polymorphism
SPPS solid-phase peptide/PNA synthesis
SPR surface plasmon resonance
ss single-stranded
SWV square wave voltammetry
T/t thymine
TBTU 2-(1H-benzotriazole-1-yl)-1,1,3,3-tetramethyluronium
tetrafluoroborate
TFA trifluoroacetic acid
TIS triisopropylsilane
TIRF total internal reflection fluorescence
TLC thin layer chromatography
ToF-SIMS time-of-flight secondary ion mass spectrometry
Trt trityl
Tz triazole
UV ultra violet
Vis visible
v/v volume divided by volume
WE working electrode
w/v weight divided by volume
Symbols and Units
Areal microscopic surface area
Aideal geometric surface area
α a) electron transfer coefficient (section 6)
b) fraction of single stranded nucleic acids (section 5)
c molar concentration / M L-1
C * bulk concentration / M
Cd double-layer capacitance
E potential of an electrode vs. a reference / V
ΔE difference between two potentials E / V
ΔEp CV peak-to-peak separation ΔEp = Epa – Epc / V
ε a) molar extinction coefficient / cm2 µmol-1 (section 5)
b) dielectric constant (section 6)

F Faraday constant (F = 96485.34 C mol-1)
Γ surface concentration / mol cm-2
I ionic strength / M
k Boltzmann constant (k = 1,38065 x 10⁻²³ J/K)
KL Langmuir adsorption coefficient
κ-1 Debye length / nm
lc contour length / nm
le electrostatic persistence length / nm
lnt PNA sequence length / nt
lp persistence length / nm
lB Bjerrum length / nm
λ a) wavelength / nm (section 5)
b) reorganization energy (section 6)
N0 total number of adsorbed redox species / mol
NA Avogadro constant (NA = 6.02214 x 10²³ mol-1)
n number of electrons
q elementary charge
Q charge passed in electrolysis / C
R2 corrected R2 determined by Origin®
Ru uncompensated resistance
ρ roughness factor
t time / min
tR retention time / min
T temperature / °C
TM melting temperature / °C
θ a) surface coverage / %
b) tilt angle between strand and surface normal / °
σj excess charge density on phase j / C cm-2
v linear potential scan rate / Vs-1
V volume

General Remarks
Nucleobases are denoted by their usual abbreviations in DNA (A: adenine; T: thymine; G:
guanine; C: cytosine), small letters however indicate PNA monomers. The common three-
letter code for amino acids is used throughout this work. PNA oligomers/conjugates are
written according to the IUPAC nomenclature for peptides, specifying those atoms at the
two terminals of the oligomer, which are being substituted by neighboring monomers upon
strand prolongation.1 Side chain protecting groups are written as an index or in brackets. The
notation PX for a compound refers to the cleaved and unprotected compound, whereas the
notification in inverted commas ‘PX’ refers the analogous resin-bound and side-chain
protected compound.
Electrochemical potentials are generally reported versus the reference electrode
Ag/AgCl (3 M KCl), if no reference electrode is specified. The few deviations thereof are
indicated in each case. As long as no specific measuring parameters are given to cyclic
voltammetry (CV) or square wave voltammetry (SWV) measurements and data, the
presented data always refer to potential scans between E = 0 – 0.8 V, CV at v = 0.1 V/s and
SWV at f = 50 Hz, A = 25 mV, ∆Es = 5 mV. Only deviations from these measuring parameters
are denoted in the text. Analytical data retrieved from CV, SWV or DPV measurements (peak
potential Ep, peak current ip, charge Q) were generally analyzed from the background
subtracted voltammetric scans.
In section 6 it is referred to different data plots, which are described and interpreted but
not shown in order to avoid a redundant accumulation of data. The curve progression is
instead comprehensively described by the indicated goodness of fit R2 (determined by
Origin®) with a specified theoretical function.


1. Introduction
1
1. Introduction
1.1 DNA Biosensing
The elucidation and recognition of DNA sequences is of high relevance in various fields
of clinical diagnostics2, 3 and medical therapeutics, forensic or genealogical analysis, food
industry4 and environmental analytics,5 measures against bioterrorism,6 toxicology as well as
pharmaceutics and is a central feature of biotechnology.7 DNA encodes the entire
information on the biomolecular constitution and the phenotypic characteristics of any living
organism. This renders the so-called DNA fingerprint a distinctive mark of the individual
organism as well as failures in the base pair alignments and chromosomal aberrations the
reason for various phenotypic anomalies and dysfunctions in the metabolism. The gain of
sequence-specific information requires to be fast, simple, cost efficient, sensitive and of high
specificity up to the reliable detection of single nucleotide polymorphism (SNP), as the
supreme discipline in DNA recognition. Concerning these features, modern DNA
hybridization-based biosensors possess great potential to optimize the traditional
hybridization assays.
1.1.1 Functional Principle of (DNA-) Biosensors
Biosensors are bioanalytical devices, which exploit a selective biological recognition
event between analyte molecules and a biorecognition element, which is coupled to a
physical transducer, to provide qualitative and quantitative information about the analyte
target molecules. Various classes of biosensors are reported in literature, which are based
on enzyme-substrate interactions (enzyme biosensors: e. g. glucose biosensor), antigen-
antibody binding (immunosensors), interactions between aptamers and amino acids or
proteins (aptamer biosensors)8, protein-protein interactions (e. g. whole cell biosensors)9 and
other receptor interactions as the recognition processes, to enable the detection of various
types of biomolecules like e. g. sugars, proteins, vitamins, antibodies as well as small
molecules like urea, hypoxanthine or arsenic. Biosensors distinguish by quality
characteristics like a continuous and reversible response to the analyte molecules, combined
with a high selectivity that facilitates the analysis from a sample mixture, as well as a high
sensitivity for the analysis of midget amounts of analyte.10 Whereas the selectivity of the
sensor is mainly determined by the recognition process, a large contribution to the final
sensor sensitivity arises from the retrieved physical signal and the related detection method.

1. Introduction
2
Tab. 1-1 summarizes various types of detection methods with the focus on non-
electrochemical DNA biosensors.
Tab. 1-1. Examples for classes of biosensors with the focus on non-electrochemical DNA detection.
Type Detection Transducer Sensor Principle Lit.
Optical Fluorescence
(TIRF) Optical fiber
Fluorescence intensity from Cy5 labeled target DNA is collected from the fiber waveguide.
Piunno et al.11
Piezo-electric Quartz Crystal Microbalance
Quartz crystal
DNA hybridization changes frequency of quartz crystal oscillation by mass accumulation.
Willner et al.12
Mascini et al.13
Radecka et al.14
Surface Analysis
SPR Gold substrate DNA hybridization induces changes in the refraction index.
Corn et al.15
Mascini et al.16
KPFM with AFM conducting nanoprobe
Gold substrate
Changes in the isoelectric point upon DNA hybridization correlates to measurable changes in surface potentials.
Belcher et al.17
Calorimetric Electrical Thermistor
Temperature changes upon exothermic enzyme-substrate bonding alter the thermistor resistance.
Danielsson et al.18, 19
Magnetic Electrochemical Magnetic beads/
nanoparticles
The magnetically controlled DNA isolation and hybridization is electro-chemically detected.
Pingarrón et al.20
Li et al.21
Biosensors for the detection of DNA sequences use the specific Watson-Crick base
pairing between the single-stranded DNA probe molecules and complementary single-
stranded DNA analytes as the recognition process, which thermodynamically discriminates
sequences which are fully complementary against those which obtain deficient base pairs
according to the Watson-Crick base pairing rules (canonical base pairs: adenine–thymine
(A•T) and guanine–cytosine (G•C)). Thereby, information about the sequence of DNA analyte
molecules are provided. Fig. 1-1 demonstrates the general principle of a reagentless
biosensor using the example of a DNA biosensor. The biological recognition element
comprised of single-stranded DNA probe molecules is immobilized to a transducer surface
that transfers the hybridization event into a physical signal. A signal processing unit finally
provides the analyte-correlated read-out. The expansion of the sensor design from single
transducer surfaces to DNA microarrays of up 106 different DNA probes, each localized at
individually addressable micrometer scaled substrate spots, facilitates the parallel
itemization of various analyte sequences for a time and cost optimized industrial

1. Introduction
3
application.22 Commercially sold DNA microarrays are e. g. the genechip® produced by the
company Affymetrix or different types of microarrays produced by the company Agilent.23, 24
Fig. 1-1. Upper part: General principle of a biosensor using the example of a DNA biosensor.
Lower part: DNA Biosensor embedded into a chip-based DNA microarray.
Although large progress had been reported in DNA biosensing in the past years with
respect to miniaturization, the detection of single-nucleotide polymorphism (SNP) and the
simultaneous analysis of large sample amounts, this research area still holds important
challenges especially in the tissue or cell specific analysis of biological material, the
delivering of results in real time as well as the development of portable lab-on-a-chip devices
for an application in a point-of-care medical screening or on-the-field analysis.22, 25, 26
1.1.2 Immobilization on Transducer Surfaces
The immobilization of the biological recognition unit to a transducer surface is a key
procedure in the preparation of a biosensor, since it provides the connection, which couples
a recognition event to a physical measuring response. Benefits from this sensor assembly
arise from the fact that it evokes a separation of the analyte molecules from a sample
mixture due to the selective analyte binding to the immobilized capture probes and prevents
a sample contamination. Quality characteristics of the immobilization process are the
reproducible formation of a defined biorecognition layer with a strong bond to the
transducer surface, which avoids alterations in the sensing layer upon a repeatedly
analyte
electricalsignal
signalprocessing
unit
molecular recognition
analyte recognition
biological receptor
immobilization to transducer surface
recognition layer
transducer surface
DNA microarray
analyte
analyte detection

1. Introduction
4
performed analyte detection. Various types of transducer surfaces like electrodes, chips,
piezoelectric crystals, optical fibers but also nanoparticles or nanotubes are employed as
substrate for the recognition layer. Thereby different surface materials like noble metals
(gold, silver, platinum), glassy carbon surfaces or substrates covered with ITO (indium tin
oxide on glass or plastic) or SiO2 (on silicon wafers) are used.
The immobilization of the recognition layer to the transducer surface can be generally
performed by physical entrapment or chemical attachment, whereby the choice of the
immobilization technique mainly depends upon the nature of the sensing layer. Physical
entrapment can be performed by encapsulation of the biorecognition element in a polymer
matrix, polyacrylamide gels, ceramic sol-gel films or a dialysis membrane, which still enables
the diffusion of the analyte through the matrix material and is often applied to biomolecules
like e. g. cell organelles, whole cells or enzymes.10, 27 The direct adsorption of a biomolecule
can be performed either by physical adsorption, like e. g. exploited in the formation of
electrostatically bound Langmuir-Blodgett films,28 or by chemical adsorption, wherein the
probe molecule is grafted via a covalent bonding to the transducer surface and which bears
significant advantages over a physisorption due to the stable surface linkage. The
biomolecule is therefore either directly bound to the transducer surface by the formation of
a self-assembled monolayer (SAM), indirectly bound to a transducer surface, which is pre-
modified with a terminally functionalized SAM (e. g. attachment via the peptide coupling
between a carboxylate terminated SAM and amino functional groups of the biomolecule)29
or immobilized via the cross-linking of the biomolecules with the help of cross-linking agents
like e. g. glutaraldehyde or amide.10, 27
Fig. 1-2. Examples for common immobilization techniques. Upper part: Surface grafting of thiolated DNA probe molecules (left) and chemical attachment of prefunctionalized DNA probes to functional head groups of a surface confined SAM (right). Lower part: Matrix encapsulation (left) and cross-linking (right) of enzymes.

1. Introduction
5
Self-assembly describes the phenomenon that organic molecules with appropriate
functional headgroups spontaneously form well-organized, monomolecular layers on
different substrates.28 Various functional groups provide the tendency for self-assembly on
specific substrates. The self-assembly of alkylsilanes or amines is described on ITO
surfaces,30, 31 platinum substrates facilitate the SAM formation of isonitriles32 and
alkylsilanes and alcohols self-assemble on SiO2 surfaces.33 However, most frequently
exploited for self assembly is the high affinity between gold and sulfur, which provides a
strong and stable Au–S linkage (Au–S bonding energy: ~1.6 eV for alkanethiols on Au(111))34,
35 for the self-assembly of thiols, thioethers or e. g. disulfides on polycrystalline or Au(111)
surfaces.36-38 Lateral van-der-Waals interactions between adsorbed molecules dictate the
degree of order of the self-assembled monolayer as well as the process of self-assembly.
Henderson-Kisliuk developed an adsorption isotherm for the formation of self-assembled
monolayers based on electrochemical impedance studies of the formation of
mercaptopropynoic acid SAMs on gold substrates.39 Therein, the SAM formation is treated
as a two-phase process, comprised of the primary adsorption of ‘lying down’ species
(governed by Langmuir adsorption isotherm) and their subsequent straightening up with an
increasing surface coverage to form a well-ordered SAM of ‘standing up’ species (governed
by a modified Kisliuk adsorption isotherm). The resulting properties of SAM-coated surfaces
are determined by their monolayer density but mainly by the functional head groups of the
adsorbed molecules, which form the surface of the adsorbed self-assembled monolayer and
facilitate a further functionalization of the SAM (see Fig. 1-2, upper part).28
For the fabrication of DNA microarrays, a large number of individual DNA probe
sequences has to be immobilized unerringly to designated array spots. For this purpose,
spotting micro robots can be employed, which modify the bare substrates with pre-
synthesized DNA primers by spotting the DNA-containing solutions at the array spots with an
accuracy on the sub-micrometer scale. DNA probes are alternatively synthesized in-situ at
the array spots with a defined sequence-spot allocation. The companies Affymetrix as well as
Agilent apply a photolithographic process for the in-situ probe synthesis, wherein the DNA
probes are successively built up from their monomer building blocks, which carry photo-
labile temporary protecting groups. The simultaneous synthesis of different sequences at
different designated array spots is facilitated by a spot-selective illumination. Thereupon, the
light-induced deprotection of end-terminal protecting group facilitates a sequence
prolongation exclusively at sequences localized at light-exposed spots, whereas a
prolongation is impeded at the end-terminal protected sequences at spots that were not
exposed to light.40

1. Introduction
6
Fig. 1-3. Photolithographic fabrication of the genechip® of Affimetrix.40
1.1.3 Electrochemical DNA Biosensors
The electrochemical detection of DNA hybridization events exhibits various benefits
over other measuring techniques (e. g. optical, piezoelectric). Electrochemistry provides high
sensitivity combined with a rapid response, simple and relatively cost-effective machinery
and an excellent cost per measurement ratio.22, 25, 41, 42 For an assembly of the DNA
recognition layer at a (biased) transducer surface, the chip technology provides inexpensive
miniaturized chip devices with electrochemically accessible multi-electrode arrays, to
facilitate the simultaneous electrochemical detection of various DNA hybridization events
(see Fig. 1-1, lower part).
In electrochemical DNA biosensors, a hybridization-induced current response is
measured e. g. by voltammetric methods like cyclic voltammetry (CV) or square wave
voltammetry (SWV) or chronoamperometry. An electrochemical detection of DNA is
generally feasible due to the (non-reversible) redox processes of the four DNA
nucleobases,43-45 although largely redoxactive marker molecules with electrochemically
reversible faradaic processes are used, which provide an electrochemical access to DNA due
to their temporary or permanent interactions with the DNA probe/analyte strands. Label-
free approaches most frequently exploit the temporary attractive or repulsive electrostatic
interaction between the negatively charged DNA strand and free-diffusing, positively or
negatively charged redox mediators like [Fe(CN)6]3-/4- or [Ru(NH3)6]3+/2+. Redox-active
intercalators (e. g. Nile Blue (NB) or Methylene Blue (MB)) or groove binders provide a non-
covalent but permanent and sequence dependent introduction of redox centers, which
promotes a charge transfer through the DNA strand (compare to section 1.1.4).46, 47
Covalently bound redox labels provide a permanent and defined labeling but require
appropriately modified nucleic acid probes, which will be addressed in section 1.1.4.48-53 The
electrochemical response can furthermore be electrocatalytically provided or enhanced by
chemical catalysts like Os(bpy)2Cl54 or redox enzymes like e. g. glucose oxidase55 or
otherwise amplified by enzyme catalysis.56 Fig. 1-4 summarizes common approaches for the
OH
OH
OH
OH
OH
OH

1. Introduction
7
introduction of redoxactive probes, whereby various electrochemical DNA biosensors apply
combinations thereof. Barton et al. e. g. reported that the coupling of the MB redox process
to that of the free-diffusing [Fe(CN)6]3- in an electrocatalytic cycle improved the sensitivity of
the mismatch detection.57, 58
Fig. 1-4. Introduction of redox markers in electrochemical DNA biosensors.
Besides voltammetric and amperometric methods, electrochemical impedance
spectroscopy (EIS) is applied for an electrochemical DNA detection. Thereby changes of the
charge transfer resistance RCT, the double-layer capacitance CDL or the electrochemical
impedance of the electrolyte/electrode interface were determined upon analyte
hybridization. Using the free-diffusing anionic redox couple [Fe(CN)6]3-/4-, the hybridization
with complementary DNA analyte molecules was detected to cause an increase of RCT, which
was explained by the accumulation of negative charge upon hybridization and the related
increase of the repulsion between nucleic acid strands and the redox mediator.59 The
intercalation of the intercalators actinomycin D and proflavine into the DNA double helix
resulted in a decrease of RCT, which was mainly ascribed to induced conformational
changes.60 The interfacial properties of the DNA monolayer could furthermore be modulated
by the metalation of the DNA helix with divalent metal ions like e. g. Zn2+, Ni2+ or Co2+, which
was found to enhance the electron transfer through DNA and decrease the interfacial Rx as
well as the charge transfer resistance RCT.61-63 Thereby, an improved mismatch
discrimination was observed in the presence of Zn2+.
Scanning electrochemical microscopy (SECM) is furthermore reported to provide
information about DNA hybridization events based on changes in the amperometric
feedback current between the transducer surface and the SECM tip, which facilitates the
imaging of DNA spots.47, 64, 65 Using the free-diffusing [Fe(CN)6]3-/4- redox marker in the
presence of Zn2+ ions, a single point mutation was detected based on SECM measurements.
An increase of the heterogeneous electron transfer kinetics compared to the fully-
complementary analog was measured, which was ascribed to a mismatch-induced increase
Free-diffusingredox mediator
Intercalatorsand
groove binders
Enzymaticredox catalysis
Covalentredox labels

1. Introduction
8
of the monolayer permeability and was furthermore sensitive towards the position of the
single point mutation.66
1.1.4 Electron Transfer Processes at End-Terminally Redox-Labeled Capture Probes
Nucleic acid probes, which are grafted to a transducer surface with one strand terminal
and are covalently labeled with a redox marker at the antipodal end, are unique tools for
electrochemical DNA biosensing, since structural and conformational strand characteristics
directly reflect in the electrochemical response of the tethered redox label. Different
mechanisms are discussed for the electron transport from the redox label to the electrode
surface, as demonstrated in Fig. 1-5.
Fig. 1-5. Possible electron transport mechanisms at end-terminal labeled and surface confined nucleic acid
probes (scheme reproduced according to Anne et al.67). A) Charge transfer through the strand.
B) Electron transfer induced by the elastic bending of the strand.
As the first mechanism, the charge transfer (CT) through the nucleic acid strand is
discussed (nanowire concept, Fig. 1-5, A). This mechanism obtains large medicinal relevance
with respect to oxidative DNA damage provoked by free radicals, since a primary oxidation
of guanine can be followed by the migration of the positive charge through the strand,
causing the damage remote from its point of origin.68, 69 Determined by the distance
between charge donor and charge acceptor, CT through DNA is considered to occur via a
short-range superexchange mechanism or the long-range hopping mechanism.70-73 The
former is an electron tunneling process as addressed in Marcus theory, which reveals an
exponential decay of its transfer rate with an increasing distance between charge donor and
charge acceptor and typically large β-decay constants, referring to eq. (6.13) (section 6.2.3).
The CT over long distances of up to 300 Å in guanine rich DNA duplexes is in contrast
described as an incoherent hopping mechanism, which involves intermediate redox
processes at the nucleobases and is comprised of charge trapping and migration over the
total range from charge donor to charge acceptor.68 The kinetics of CT via the hopping
e-
e-
e- e- e- e-
e-
e-
B

1. Introduction
9
mechanism appear largely independent from the total donor–acceptor distance with varying
values of β (in eq. (6.13)). It is rather governed by the ratio of charge migration rate and
charge trapping rate, whereas the relatively larger the migration rate, the longer the total
distance over which CT is observed.68 Large evidence was found that the pathway for long-
range DNA CT is achieved via the π-stacked nucleobases and not the sugar-phosphate
backbone, and is hence significantly more efficient in DNA duplexes than DNA single
strands.74-79 Thereby, perturbations in the base stacking, like the presence of single
mismatches in DNA duplexes, were found to cause a significant depletion of the CT
effectiveness.57, 80-82 CT according to the hopping mechanism thereby appears to be
dependent on the nucleobase sequence, whereby the low oxidation potential favors guanine
as intermediate charge carrier. Adenine act as charge carrier in sequences which are poor of
guanine.83 Achim et al. investigated the CT through surface confined Fc-PNA single and
double strands and determined a superexchange mediated CT for short PNA single and
double strands (nt < 7) with an exponential decay of the ET rate, which was predicted to
switch to a hopping mechanism in longer strands (nt > 7).84, 85 Furthermore the sequence
dependency of the CT was studied and revealed a correlation between the CT rate constant
and the oxidation potentials of the nucleobases, which supports a superexchange
mechanism for ssPNA with nt = 7.86
In the second mechanism (Fig. 1-5, B), the electron transfer is not proceeding through
the DNA strand but is instead facilitated by the mechanical bending of the nucleic acid
strands, which renders an electron transfer by a direct electron tunneling or an indirect
electron hopping possible. This electron transfer process was elucidated by Anne et al. at
gold surfaces, which were loosely packed with 3’-terminally ferrocenylated DNA strands by
the surface grafting of their 5’-terminus.87, 88 Fast-scan cyclic voltammetry (FSCV) studies of
the ET and an in-depth theoretical model related the electrochemical response to the
strand’s inherent elastic bending properties. Thereby, the attached ferrocene moiety
exhibited electrochemical characteristics between the two extreme cases of a diffusionless,
surface confined regime, when the Fc moiety was bound to the flexible DNA single strand
(‘Fc-on-rope’), and a diffusion-limited system when Fc was attached to the rather rigid
duplex (‘Fc-on-rod’). The developed in-plane elastic bending model addressed the lateral
diffusion characteristic of the Fc head with the end-rotational diffusion coefficient ��� and
predicted the following scan rate dependencies of the anodic peak current ip for the two
described extreme cases with � = ��/���:

1. Introduction
10
Extreme 1: β ֏ 0
In this case, the scan rate v is slow compared to the strand’s bending dynamics ��� and an ip-
dependency of v is predicted that is comparable to a diffusionless system (see eq. (6.4)).
� = �������
��� [��������� ]
(#$���%��������� &)� (1.1)
Extreme 2: β ֏ ∞
In this case, the scan rate v is large compared to the strand’s bending dynamics ��� and an
ip-dependency on √� is predicted, comparable to diffusion limited systems (see eq. (6.1)).
�) = 0.284�/01�����/ ��� [�23�/4]5(2) (1.2)
Aberrations from a mechanical bending determined CT were observed with an
increasing length of the flexible alkyl linkers, which was found to induce a free-rotational
motion to the DNA duplex tethered Fc head groups.67 Inouye et al. exploited the concept of
Anne et al. for the detection of DNA sequences with Fc labeled DNA recognition layers,
whereby he determined a behavior for SNP DNA duplexes, which was intermediate between
that of DNA single and complementary double strands.53 Heeger et al. exploited the increase
in strand stiffness upon duplex formation in an advanced Fc-DNA sensor design, where the
flexibility of the single strands was fixed in a stem loop structure and the duplex formation
resulted in a detectable increase in the Fc-electrode distance.49, 89 An in-depth study of this
mechanism in PNA strands (see follow section) has not been reported so far, however
evidence for an analogous mechanical bending induced ET is given by a Fc-PNA biosensor,
which was reported by Aoki et al.90
Fig. 1-6. Fc-DNA biosensor, scheme reproduced according to Heeger et al.49
S
e-
Se-
denaturation
Fe
Fe

1. Introduction
11
The challenge in the investigation and application of end-terminally labeled and surface
grafted strands for DNA biosensing lies in the general possibility for a parallel progression of
the two ET mechanisms shown in Fig. 1-5. This complicates a clear interpretation of the
sensor response, since the mechanisms exhibit significant differences in their redox process,
like e. g. significantly different ET kinetics,85, 88 related to different strand properties that
determine the both ET mechanisms.
1.2 Peptide Nucleic Acids – PNA
1.2.1 Structure, Properties and Applications of PNA
Peptide nucleic acids (PNA) are non-natural analogs of the (deoxy)ribonucleic acids DNA
and RNA, with regard to structure and properties.91 The molecular structure of PNA is
derived from those of the natural nucleic acids by replacing the negatively charged
(deoxy)ribose phosphodiester backbone of DNA/RNA by a homomorphous, neutral and
achiral pseudopeptide backbone of repeating, amide-linked N-(2-aminoethyl)glycine units,
to which the nucleobases adenine A/a, thymine T/t, guanine G/g and cytosine C/c are
attached via a methylene carbonyl linkage.91-93 The polymer character and the peptidic
structure of its backbone render PNA accessible by the general principles of Merrifield’s
solid-phase peptide synthesis (SPPS), which will be described in section 4.2.94 In the PNA
nomenclature, the PNA end-terminals are denominated according to peptides as N and C –
terminus (wherein the PNA C-terminus corresponds to the DNA/RNA 3’ end) and the
nucleobases are denoted by their common abbreviations in DNA, however small letters
indicate PNA monomers.
Fig. 1-7. Molecular structures of PNA (top) and DNA (bottom) (nucleobase Nb = A, T, G or C).
H2NN
Nb
O
NH
O
N
ONb
O
NH
N
ONb
O
OH
HO O
Nb
PO
O
Nb
OPO
O
Nb
OPO
OH
O O O
O O O
N C
5' 3'
n
n

1. Introduction
12
The DNA homomorphous structure of PNA facilitates the formation of stable duplexes
with DNA, RNA or PNA according to the Watson-Crick base pairing rules.95, 96 In its three-
dimensional double helical structures, the PNA strand (compare section 6.3) tends to adapt
to the structure preferred by the DNA/RNA binding partner in its homo-molecular
structures, to form right-handed helices with an A-form conformation in PNA•RNA duplexes
and a B-like conformation in PNA•DNA duplexes.97-99 However, in pure PNA•PNA duplexes, a
so-named P-form is adopted, which exhibits a very wide helix with a diameter of 28 Å and
pitch of 58 Å (18 bp), which is relatively large compared to a pitch of 42 Å (13 bp), as realized
in the B-like conformation of PNA•DNA duplexes.100-102 Thereby, a right- and a left-handed P-
form were analyzed, which are related by crystallographic symmetry. Fig. 1-8 demonstrates
the structures of 10-mer DNA•DNA, PNA•DNA and PNA•PNA duplexes, with the arrows
connecting the respective strand ends.
Fig. 1-8. Right-handed structures of DNA•DNA, PNA•DNA and PNA•PNA duplexes according to Nielsen et al.
(upper row: side view, bottom row: top view).103
The loss of the backbone-backbone repulsion upon hybridization with the electrically
neutral PNA backbone evokes a thermodynamically and kinetically improved hybridization
characteristic compared to DNA/RNA, whereby the high binding affinity of PNA is even
sufficiently large, to facilitate the invasion of PNA into a intact DNA•DNA double helix.104-106

1. Introduction
13
PNA2•DNA triplexes between two homo-pyrimidine PNA strands and the complementary
homo-purine DNA strand revealed an even larger stability.101, 107, 108 Besides the binding
affinity, furthermore the sequence specificity of PNA is enhanced compared to DNA/RNA,
which evokes an increased thermodynamical discrimination of single-nucleotide
polymorphism (SNP).109, 110 Other characteristics arising from the electrically neutral
backbone are a hydrophobic character with a decreased solubility in aqueous media, the
tendency for self-aggregation as well as the independency of the duplex stability on the salt
concentration.95, 106, 111 A benefit for all applications involving the contact with biological
material, is furthermore the biological stability of PNA towards nucleases and proteases,
which increases the life-time in a cellular environment and is due to the non-natural
backbone structure, albeit a cellular uptake is restricted by the hydrophobic character of
PNA, which can be overcome with e. g. a coupling to cell-penetrating peptides.112 The
entirety of these favorable characteristics renders PNA an excellent mimic of DNA and RNA
and constitutes the great attractiveness of PNA as DNA/RNA substitute in various
applications. Successful medicinal and therapeutic applications of PNA are e. g. in the
antigene/antisense therapy,108, 113-115 where amongst others the high DNA binding affinity of
already short PNA strands is exploited to downregulate target gene expression. Targeting of
mRNA is applied to inhibit the translation in the antisense strategy, whereas a specific DNA
sequence is targeted to inhibit the transcription in the antigene strategy.115, 116 Analytical
applications, like the use of PNA probes for the molecular recognition of nucleic acids in
biosensor technology mainly benefit from the excellent mismatch sensitivity, as will be
discussed in detail in the following section.117, 118 In PCR clamping, the binding affinity and
specificity of PNA is exploited for a sequence specific PCR inhibition, to evoke the selective
amplification of target DNA.119, 120
1.2.2 Elasticity of Nucleic Acids – the Worm-Like Chain Model
The mechanical properties of nucleic acid strands can be treated with the worm-like-
chain (WLC) model, which generally addresses the statistical mechanics of polymer chains.
According to this model, polymer chains are considered as flexible rods, which undergo
distortions upon thermal fluctuations (Brownian motion).121 Polymer chains are
characterized by their contour length lc, which is defined as the end-to-end distance of a
linear polymer at maximal physical extension (to the all-trans conformation).122 The bending
elasticity or stiffness of a polymer chain is addressed in the WLC model by the persistence

1. Introduction
14
length lpi, which describes the maximal length, over which the polymer persists to thermal
fluctuations in a particular direction. A large persistence length thereby corresponds to a
rigid, rod-like polymer chain, whereas a small persistence length corresponds to a flexible,
rope-like polymer chain. Single-stranded DNA has a persistence length of lp = 0.75 nm
(≙ 2 bp)123 whereas double-stranded DNA has a much larger persistence length of lp = 50 nm
(≙ 150 bp), indicating the higher rigidity of the duplex state.124 Considering the helical, base-
stacked structures of single- and double-stranded nucleic acids, the lower flexibility in the
double-stranded state can be reduced to the fact that the nucleobases, which are fixed in
the direction of the complementary strands, leave less dynamical freedom to the polymer.
The ratio between contour length lc and persistence length lp of a nucleic acid oligomer
determines the flexibility/bending elasticity of a certain nucleic acid oligomer. For lc being
significantly larger than the persistence length (lc / lp ≫ 1), the oligomer appears flexible and
rope-like, whereas for ratios lc / lp ≪ 1 the oligomer appears rigid and rod-like. For ratios
close to lc / lp = 1, the Brownian strand motions are predicted to be governed by the
competition between the thermal energy kT and the strand’s bending elasticity.125
The elasticity of PNA single and double strands is barely investigated and solely
discussed based on MD simulation of Nilsson et al.126, 127 and Beratan et al.128 and the crystal
structure of a PNA complex129. All studies ascribe a high adaptability to the PNA backbone
due to its methylene-carbonyl base-backbone linkage, which exhibits a significantly higher
flexibility than the rather rigid pentose linkage of DNA (l0 (ssPNA) < l0 (ssDNA)). As a result,
PNA backbone rearrangements lead to a higher sustainability of the base stacking upon
Brownian strand motions. In contrast, the strong, pentose-mediated base-backbone
coupling in DNA evokes that the backbone can rearrange less flexible than the PNA
backbone, causing breaks of local base-stacking during Brownian strand motions. A second
impact onto the elasticity of a PNA oligomer is ascribed to the electrically neutral backbone,
which eliminates an additional impact of electrostatic repulsion onto the persistence length.
Nucleic acid duplex with an implemented single mismatch are in the majority of cases
still sufficiently stable to sustain a double helical structure, which is however altered
compared to the ideal Watson-Crick double helix due to the lack of hydrogen bonding
between the SNP base pair. Thermodynamically less destabilizing terminal mismatches can
evoke a terminal split of the duplex structure into ‘frayed’ ends of non-connected single-
stranded segments, corresponding to a shortening of the double helical structure.130, 131
i IUPAC definition of the persistence length lp of a polymer chain: lp equals the average projection of the end-to-end vector on the tangent to the chain contour at a chain end in the limit of infinite chain length.122.

1. Introduction
15
Besides a single mismatch located at the very last position of a duplex structure, furthermore
mismatches located at the penultimate as well as antepenultimate position from a strand
terminus cause the described end-fraying.132 Thereby it is reported that coordination of the
Mg2+ metal ions inhibits the end-fraying.132, 133 In contrast, a SNP located at internal positions
(≙ positions ≥ 4 from any strand terminus) is reported to cause a punctual unwind segment,
described as a nick in the duplex structure, but to have little effect upon the overall
conformation of the duplex structure, such that dsDNA duplexes with a central mismatch
reveal double helical structures which resemble the B-form (compare Fig. 1-8).134, 135 Besides
the location of a single point mutation, the extent of structural deviation from the wilde type
form is moreover determined by the respective base pair and the neighboring bases
analogous to the correlated effect of thermodynamical destabilization.131
Fig. 1-9. Structural aberrations of SNP duplexes from the ideal Watson-Crick double helix. Scheme reproduced according to SantaLucia et al.
131
Concerning the mechanical properties of SNP duplexes it is reported that the incorporation
of an SNP evokes an enlargement of the contour length lc and an enhancement of the strand
elasticity compared to the respective fully-complementary duplex,136 which corresponds to a
decrease of the persistence length lp and a resulting increase of the ic/ip ratio.
1.2.3 Covalent Labeling of PNA Oligomers with Metal-Organic Complexes
One of the core disciplines of bioorganometallic chemistry is the labeling of
biomolecules with organometallic moieties. In the past years, different examples of metal-
complex labeled amino acids,137 peptides,138, 139 proteins,140 nucleic acids and their
monomers141, 142 or carbohydrates143 were reported. Frequently used organometallic
moieties were e. g. complexes of platinum,142 ruthenium, cobalt144 or iron and in the
majority of cases the sandwich complex ferrocene (Cp2Fe(II), C10H10Fe(II)). The introduction
of metal-complexes into biomolecules modulates properties of the biomolecule, which
renders the biomolecule accessible to different analytical techniques like electrochemical
methods, metalloimmunoassays,145-147 atomic adsorption spectroscopy (AAS) as well as
IR,148, 149 fluorescence or optical spectroscopy150, 151. Various (bio)analytical, biochemical,
internal SNPterminal SNP

1. Introduction
16
medicinal or pharmaceutical applications arise from this correlation of biological
functionality with the unique properties of metal complexes.152
The metal-complex labeling of PNA promises an attractive combination of the favorable
DNA/RNA hybridization properties of PNA and the accessibility to the listed metal complex
specific analytical techniques. Metzler-Nolte et al. reported a facile conjugation of metal-
organic complexes to the PNA N-terminus, which was applicable to PNA monomers but was
also adoptable to the solid phase synthesis of PNA oligomers. As key reaction, the peptide
coupling between the unprotected primary amino group of a PNA monomer and a carboxylic
acid modified metal-organic complex is exploited.153, 154 Performed at the last PNA monomer
of a growing PNA sequence at the solid phase, the labeling with the metal-organic complex
terminates the oligomer synthesis.
Fig. 1-10. Conjugation of carboxylic acid derivatives of metal complexes to the
PNA N-terminus via peptide coupling.
The covalent labeling of PNA with metal-organic complexes faces special challenges due
to general sensitivity of various metal-organic complexes, whereby especially the acid lability
impedes the incorporation of the metal complex labeling step into the PNA solid phase
synthesis, combined with the high functionality of PNA, which impedes a labeling in solution.
For a solid phase PNA labeling, the key reaction requires a good conversion at the solid
phase as well as metal-organic complexes which tolerate all SPPS conditions (> 85 % of TFA,
DMF). In contrast, the alternative post-synthetic labeling, performed at the unprotected PNA
oligomer obtained subsequent to the cleavage from the solid support, requires a highly
selective key reaction.
In this work, the focus will be exclusively on the use of ferrocene-PNA conjugates.
Besides the chemical stability of ferrocene, the FcH0/+ redox couple exhibits the advantages
of a Nernstian reversible redox process with a one-electron transition and a half-wave
NH
O
NH2N
O
Nb
n
(Bhoc)
N
O
Nb
O
(Bhoc)
NH
O
NNH
O
Nb
n
(Bhoc)
N
O
Nb
O
(Bhoc)
O
LxM
OH
O
LxM
MLx = , ,Fe Co+Ru
NN
N
NNN
2+

1. Introduction
17
potential of E1/2 = 270 mV vs. Ag/AgCl for FcH0/+ of the free ferrocene and of E1/2 = 480 mV
vs. Ag/AgCl for Fc0/+ of the amide-bound ferrocene derivatives obtained according to
Fig. 1-10. Thereby, the potential window holds benefits, since no signal overlap with the
reduction of water (2H2O + 2e- � H2 + 2OH-; E1/2 = -1.04 V vs. Ag/AgCl) or oxygen (O2 +
4H3O+ + 4e- � 6H2O; E1/2 = 1.03 V vs. Ag/AgCl) is expected. Also the potential differences to
the oxidation and reduction potentials of the irreversible redox processes of the nucleobases
(Epa/pc(A) = 1.76/-2.83 V, Epa/pc(T) = 1.91/-2.39 V, Epa/pc(G) = 1.29/<-2.97 V, Epa/pc(C) =
1.94/-2.56 V vs. Ag/AgCl)44 as well as the oxidation of the gold electrode material (Epa(Au) =
0.74 V vs. Ag/AgCl)155 are sufficiently large. These favorable electrochemical characteristics
are of significance for the electrochemical DNA biosensing studies, as the main focus of this
work (section 6). A further advantage of ferrocene is the well known chemistry and the
commercial availability of different ferrocene derivatives, which facilitates the synthetic
access to appropriately modified analogs (see section 3).
Besides the facile solid-phase conjugation of ferrocene to the N-terminus of PNA
oligomers, as shown in Fig. 1-10, different examples for the PNA conjugation of ferrocene
are reported in literature.156, 157 Gasser et al. described the five-step synthesis of a ferrocenyl
uracil PNA monomer as PNA building block for the possible introduction of ferrocene at
variable strand positions of a PNA oligomer.158, 159 A remarkable labeling of PNA monomers
with three identical Fc moieties was presented by Maiorana et al.160 The labeling succeeded
by introducing a versatile Tris-Fc moiety to N-terminal or internal positions of the PNA
monomer via peptide coupling.
Fig. 1-11. Labeling of a tyrosine modified PNA monomer with a Tris-Fc moiety.
The incorporation of different metal complexes besides ferrocene into PNA monomers
and oligomers was mainly investigated by Maiorana et al. Thereby, the labeling of PNA
monomers with different metal-organic complexes like Fischer-type carbene complexes of
NH2O
O
O
Fe
Fe
Fe
CO2MeN
O
NH
Cbz
T
O
NH
HN
O
O
OO
FcFc
Fc
CO2MeN
O
NH
Cbz
T
O
NH3+
CF3CO2-
Et3N, DMF, RT

1. Introduction
18
chromium and tungsten via a cross coupling as the key reaction or with arene chromium
tricarbonyl complexes, for which the Ugi reaction was exploited as key reaction, were
reported.161-164 A Fisher-type carbene complex could moreover be attached in solution to
the N-terminus of a 8-mer PNA sequence.163
Fig. 1-12. A) Cross coupling and B) Ugi reaction for the insertion of an
organometallic complex to PNA monomers.
Furthermore, the N-terminal labeling of 16-mer PNA oligomers at the solid phase with the
radioactive technetium complex fac-[99mTc(CO)3]+, as well as with its rhenium analog fac-
[Re(CO)3]+ was achieved via the peptide coupling of the respective carboxylic acid
derivatives.165
1.2.4 Labeling of Biomolecules via Click Chemistry
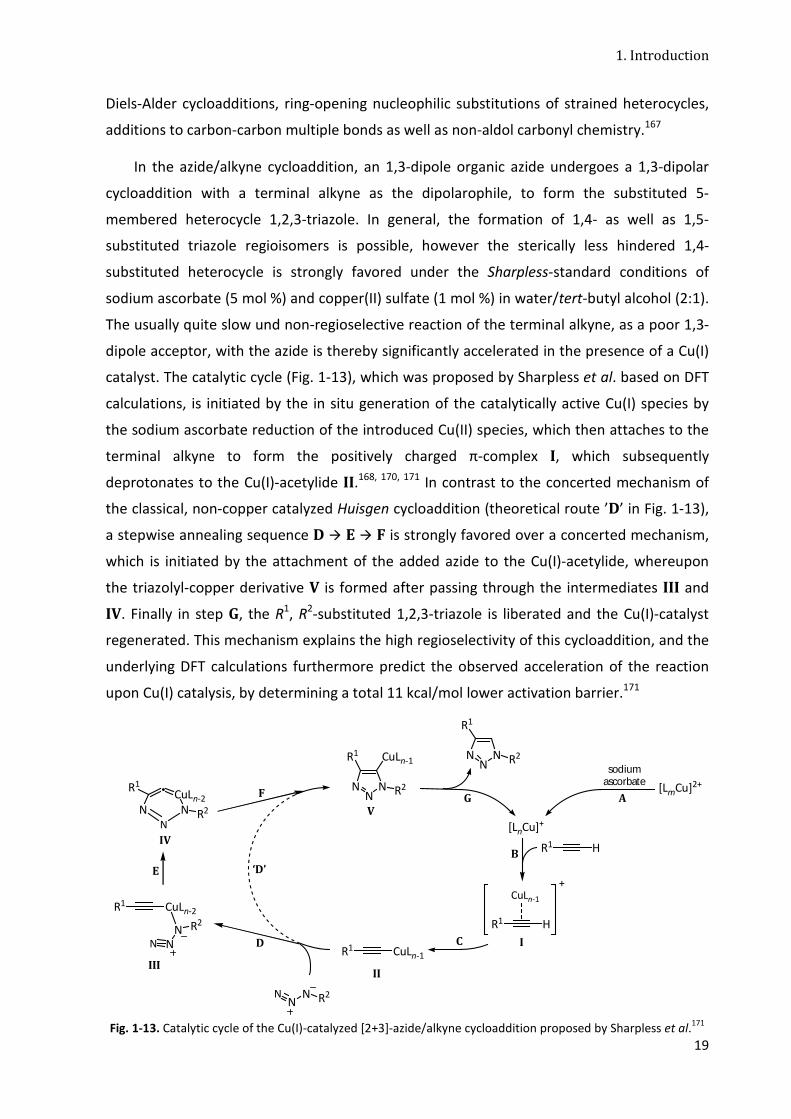
The Cu(I)-catalyzed [2+3]-azide/alkyne cycloaddition was developed by Huisgen et al. in
1961166 and was investigated by Sharpless et al. in 2001, to be the most useful and reliable
reaction type among a group of reactions summarized as ‘click chemistry’.167-169 Click
chemistry describes a synthetic concept, wherein small units are selectively joined together
by the formation of a heteroatom linkage, which presents a mimic of the synthetic strategy,
nature applies for the formation of complex molecules. Reaction types, which facilitate this
strategy, are characterized among other things by being modular, stereospecific, high
yielding, wide in scope, generating inoffensive byproducts, and proceeding under simple and
mild conditions.167 Other reaction types, which fulfill the click chemistry criteria, are e. g.
Cr
N
O
NH
Fmoc
N
NH
O
O
O
OSi(CH3)3
(OC)4CrN
N
O
8+
GrubbsCatalyst
N
O
NH
Fmoc
N
NH
O
O
O
OSi(CH3)3
NN
Cr(CO)4
O8
N
O
NH
Cbz
N
NH
O
O
NH
O
NO2
OCH3
COC CO
O
CbzHN
N
CrC
OC CO
OCO2H
N
NH
O
O
NO2
NC
OCH3
+ +MeOH
A
B
1. Introduction
19
Diels-Alder cycloadditions, ring-opening nucleophilic substitutions of strained heterocycles,
additions to carbon-carbon multiple bonds as well as non-aldol carbonyl chemistry.167
In the azide/alkyne cycloaddition, an 1,3-dipole organic azide undergoes a 1,3-dipolar
cycloaddition with a terminal alkyne as the dipolarophile, to form the substituted 5-
membered heterocycle 1,2,3-triazole. In general, the formation of 1,4- as well as 1,5-
substituted triazole regioisomers is possible, however the sterically less hindered 1,4-
substituted heterocycle is strongly favored under the Sharpless-standard conditions of
sodium ascorbate (5 mol %) and copper(II) sulfate (1 mol %) in water/tert-butyl alcohol (2:1).
The usually quite slow und non-regioselective reaction of the terminal alkyne, as a poor 1,3-
dipole acceptor, with the azide is thereby significantly accelerated in the presence of a Cu(I)
catalyst. The catalytic cycle (Fig. 1-13), which was proposed by Sharpless et al. based on DFT
calculations, is initiated by the in situ generation of the catalytically active Cu(I) species by
the sodium ascorbate reduction of the introduced Cu(II) species, which then attaches to the
terminal alkyne to form the positively charged π-complex I, which subsequently
deprotonates to the Cu(I)-acetylide II.168, 170, 171 In contrast to the concerted mechanism of
the classical, non-copper catalyzed Huisgen cycloaddition (theoretical route ’D’ in Fig. 1-13),
a stepwise annealing sequence D � E � F is strongly favored over a concerted mechanism,
which is initiated by the attachment of the added azide to the Cu(I)-acetylide, whereupon
the triazolyl-copper derivative V is formed after passing through the intermediates III and
IV. Finally in step G, the R1, R
2-substituted 1,2,3-triazole is liberated and the Cu(I)-catalyst
regenerated. This mechanism explains the high regioselectivity of this cycloaddition, and the
underlying DFT calculations furthermore predict the observed acceleration of the reaction
upon Cu(I) catalysis, by determining a total 11 kcal/mol lower activation barrier.171
Fig. 1-13. Catalytic cycle of the Cu(I)-catalyzed [2+3]-azide/alkyne cycloaddition proposed by Sharpless et al.171
NN
R1 H
CuLn-1
+
I
NN
N
CuLn-1R1
R2
R1 CuLn-1
II
N R2
R1 CuLn-2
N NN R2
CuLn-2N N
N
R1
R2
[LmCu]2+
NN
N
R1
R2
R1 H
[LnCu]+
III
IV
V
sodiumascorbate
•A
B
CD
E
F
‘D’
G

1. Introduction
20
An non-catalytic enhance of the reaction rate is achieved, when appropriate
substituents facilitate an approximation of the relative orbital energies of the respectively
participating HOMO and LUMOs of the azide and the terminal alkyne. Electron withdrawing
substituents at the dipolarophile lower its limiting orbitals, so that the electron transfer
between the LUMO of the dipolarophile and the HOMO of the 1,3-dipole is facilitated. The
inverse transfer between the LUMO of the azide and the HOMO of the terminal alkyne is
facilitated, when electron donating substituents are present at the dipolarophile.172 A
copper-free variant of the azide/alkyne cycloaddition is generally attractive, since larger
amounts of copper are potentially toxic for a living organism or might cause degradation of
viruses.169, 173 Approaches to this challenge involve the application of appropriate
substitution patterns at the reactants, whereof electron-withdrawing fluoro substituents
bear advantages due to their relative inertness in biological systems, as well as e. g. the use
of strained cycloalkynes, which enhance the reaction rate by the reduction of ring strain.174-
177 Typical side reactions of the Cu(I)-catalyzed azide/alkyne cycloaddition are e. g.
intermolecular coupling reactions between two terminal alkynes like e. g. the Glaser
coupling under formation of diacetylenes, which is promoted by molecular oxygen, or the
Straus coupling, which yields linear enynes at increased temperatures also at inert
conditions, and furthermore the Cu(I) promoted formation of •OH and related radicals in
aqueous media, which can e. g. evoke the oxidation of nucleobases.178-181
The azide/alkyne cycloaddition presents with its high selectivity combined with the
proceeding under mild conditions optimal features for the conversions of biomolecules.
Various examples of successful, click chemistry based conversions are reported in literature,
like e. g. the imaging of glycans in developing zebrafish or the (multi-)modification of
DNA.182-185 For the latter, the click reaction was performed with a mixture of a Cu(I) salt and
the Cu(I) stabilizing ligand tris(benzyltriazolylmethyl)-amine, which protects the biomolecule
from aqueous Cu(I) mediated side reactions.186-188
Fig. 1-14. Modification of DNA via click chemistry applying the CuBr/ligand method.185
HN
O
O N
O
O
DNA
OPO
O
DNAO OHO
N3
HN
O
O N
O
O
DNA
OPO
O
DNA NNN
OO
OH
CuBr/ligand = 1:1
water/DMSO/tBuOH = 4:3:1,15°C, 1 h

1. Introduction
21
Schibli et al. exploited the 1,4-disubstituted 1,2,3-triazole structural element of the
cycloaddition products for the chelating of fac-“Tc/Re(CO)3” in a ‘click-to-chelate’ approach,
for the metal labeling of monomers of biomolecules like peptides, nucleotides,
carbohydrates and phospholipids.189, 190 A click chemistry based on-resin cyclization of
peptides was presented by Lokey et al.191
Fig. 1-15. Macrocyclization of peptides via click chemistry according to Lokey et al.191
1.2.5 PNA Biosensors for the Detection of DNA
The first PNA biosensor was reported by Wang, Paleček and Nielsen et al. in 1996. It
comprised PNA probes immobilized on carbon paste electrodes. The hybridization with
complementary DNA was electrochemically detected by chronopotentiometry, which was
facilitated by the use of the minor-groove binder Co(Phen)33+ as redox indicator.117 Ever
since, various PNA biosensors had been developed for the detection of DNA, which apply
electrochemical techniques like voltammetry, electrochemical impedance spectroscopy (EIS)
or scanning electrochemical microscopy (SECM) for the detection of the hybridization event,
but furthermore surface sensitive detection methods like reflection absorption infrared
spectroscopy (RAIRS), X-ray photoelectron spectroscopy (XPS) or fluorescence-based
methods.
Various examples for the detection of DNA with surface confined PNA SAMs are
reported in literature, which did not require the addition of or a PNA labeling with any
spectroscopic or electrochemical marker molecules. Martín-Gago et al. presented the
spectroscopic detection of the DNA hybridization at gold surface confined PNA SAMs using
XPS and RAIRS.192, 193 A mass sensitive detection of single nucleotide polymorphism (SNP) in
the DNA hybridization at PNA monolayers confined to a quartz crystal microbalance (QCM)
was achieved by Wang et al.194 Maiorana et al. recently presented an approach for a
magnetic detection of DNA with PNA strands immobilized to superparamagnetic iron oxide
nanoparticles.195 Optical and calorimetric DNA detection was described for different types of
PNA modified gold or silver nano objects (nanotubes, nanoparticles).196-198
O
OHN
NH
O
O
N3
n
CuBr, Na ascorbate,DIPEA, 2,6-lutidine
DMF, a.t., 6 h
O
O
NH
HN
O
O
N N
N
n
n = 2-5

1. Introduction
22
The introduction of different electrochemical or fluorescent marker molecules to PNA
sensing surfaces are generally comparable to those used at DNA recognition layers (Fig. 1-4).
Significant differences between PNA and DNA sensing surfaces arise from the electrical
switch from an electrically neutral PNA monolayer to a negatively charged film, which occurs
upon hybridization with the DNA analyte molecules. Due to this electric switch, the ssPNA
surface is electrostatically distinguishable from the dsPNA•DNA surface resulting upon DNA
binding, which is frequently exploited in PNA biosensors. The application of free-diffusion
redox mediators like [Fe(CN)6]3-/4- or [Ru(NH3)6]3+/2+ (label-free approach) benefits from this
electric switch, since attractive or repulsive interactions between mediator and the
monolayer are only present at the dsPNA•DNA monolayer. Based on voltammetric
measurements, the DNA hybridization was found to evoke an impediment of the electron
transfer using the negatively charged mediator [Fe(CN)6]3-/4-, while an increase in the ET rate
was detected using the cationic [Ru(NH3)6]3+/2+ mediator (ion-channel sensor).199-202 Therein
Aoki and Umezawa reported an improve of the detection limit of their ion-channel sensor
from 0.5 nM using 10 nt long PNA probes down to the femtomolar range by using long PNA
probes with 13 nt.
Fig. 1-16. Ion-channel PNA biosensor: ssPNA/MCH interfaces using the anionic [Fe(CN)6]3-/4- (orange, upper scheme) or cationic [Ru(NH3)6]3+/2+ (blue, lower scheme) free-diffusing redox mediator.
Scheme reproduced according to Aoki et al.200
By means of EIS an increase of the charge transfer resistance RCT could be detected upon
DNA hybridization, which was related to the repulsion between the [Fe(CN)6]3-/4- redox
SSS S
OH
S
OH
S
OH
S
OH
S
OH
S
OH
S
OH
S
OH
S
OH
S
OH
S
OH
S
OH
S
OH
S
OH
S
OH
S
OH
SSS S
OH
S
OH
S
OH
S
OH
S
OH
S
OH
S
OH
S
OH
S
OH
S
OH
S
OH
S
OH
S
OH
S
OH
S
OH
SS
OH
SSS S
NH3
S
NH3
S
NH3
S
NH3
S
NH3
S
NH3
S
NH3
S
NH 3
S
NH3
S
NH3
S
NH 3
S
NH3
S
NH3
S
NH3
S
NH 3
S
NH3
SSS S
NH3
S
NH3
S
NH3
S
NH3
S
NH3
S
NH3
S
NH3
S
NH3
S
NH3
S
NH 3
S
NH3
S
NH3
S
NH3
S
NH3
S
NH3
SS
NH3

1. Introduction
23
indicator and the anionic DNA backbone. With this method detection limits of 1 nM with
15 nt long PNA probes were achieved.203-205 Kwak et al. reported a significant discrimination
of single mismatch against fully-complementary DNA at analyte concentrations larger than
200 nM. A good discrimination of single mismatches was furthermore described by Kraatz et
al. by applying the EIS/[Fe(CN)6]3-/4- detection method in the presence of divalent metal ions
(Zn2+, Ni2+, Co2+, Mg2+).206, 207
Furthermore, biosensors with PNA capture probes, which carry an end-terminally
covalent label like a ferrocene moiety or an osmium complex were reported. These sensors
voltammetrically detect the hybridization event based on the impediment of the ET reaction,
which is related to the hybridization-induced change in the strand’s persistence length and is
comparable to the Fc-DNA biosensor of Heeger et al. (Fig. 1-6).90, 208, 209 Hsing et al. reported
the detection of DNA with Fc-PNA probes, which did not require the immobilization to a
transducer surface.210 The sensing strategy exploits the electrostatic interaction between a
negatively charged, bare ITO electrode surface and the free-diffusing Fc-PNA(•DNA)
probe/analyte molecules, which is altered upon hybridization with negatively charged DNA
analytes and hence affects the electrochemical response of the tethered Fc moiety.210 The
simultaneous use of surface confined Fc-labeled PNA capture probes and the free-diffusing
[Fe(CN)6]3-/4- redox mediator was found to amplify the electrochemical response due to the
ferro/ferricyanide promoted redox catalytic regeneration of the strand tethered Fc0
species.211 Moreover, the use of the redoxactive intercalators MB and HOECHST 33258 was
described for a DNA detection with PNA monolayers based on voltammetric methods.29, 117,
212-214 Applying this method, the detection of diagnostically relevant gene regions was
achieved, like the detection of the cancer gene c-Ki-ras/61 (single point mutated compared
to the wild type) as well as short sequences of the Hepatitis C 3a virus with short 14/15-mer
PNA probes.213, 214
PNA biosensors were furthermore reported, which exploit the electrostatic attraction
between soluble cationic polymers and the negatively charged backbone of the DNA analyte
after hybridization to surface confined PNA monolayers. Redoxactive polymers (Fc-labeled
polythiophene) facilitate a detection with voltammetric methods,215 whereas fluorescent
polythiophenes enable a fluorometric detection using unlabeled PNA probes,216 or
furthermore a detection with fluorescence resonance energy transfer (FRET) analysis, using
PNA probes labeled with an optical reporter group.217, 218

2. Objective and Outline
24
2. Objective and Outline
This thesis deals with the design and in-depth analysis of Fc-PNA based sensing surfaces,
which is guided by the aim to employ the electron transfer process at the N-terminally
ferrocenylated (Fc) and C-terminally gold-surface grafted peptide nucleic acids for the
specific detection of DNA. Such a sensor concept faces current challenges in the field of DNA
biosensing by promising a highly specific and sensitive DNA recognition, a compatibility with
biological material and a fast read-out of the sensor response with a low cost-per-
measurement ratio, as a result from the combination of the favorable properties of metal-
conjugated PNA probes with the benefits arising from an electrochemical analysis. The thesis
divides into four main parts, which will be outlined in the following.
The first part deals with the synthesis and probe design of Fc-PNA conjugates (sections 3
and 4). Section 3 deals with the development of a new synthetic strategy for the (end-)
terminal ferrocene labeling of PNA, which employs the [2+3]-alkyne/azide cycloaddition
(click chemistry) as the key reaction to facilitate a modulation of the electrochemical
properties of ferrocene labels. Section 4 deals with the solid-phase synthesis, HPCL analysis
and mass spectrometric characterization of different 12-mer Fc-PNA conjugates as capture
probes for the electrochemical studies presented in section 6. As PNA sequences, unique
target sequences from different bacteria stems were chosen, in order to constitute the basis
for a later differentiation of those bacteria with the developed Fc-PNA-based biosensor.
Preliminary to their immobilization to gold surfaces, the Fc-PNA capture probes were
comprehensively characterized in solution with respect to their hybridization with chosen
DNA analytes, as the biological recognition event, as well as their electrochemical response
(sections 5 and 6.4). Section 5 deals with the analysis of the thermodynamic stability of fully-
complementary as well as selected mismatch Fc-PNA•DNA duplexes by means of UV melting
curve experiments, to furthermore reveal the impact of the new ferrocene labels onto the
duplex stability. The electrochemical studies in solution focus on the analysis of formal
potentials as well as the stability of the different Fc labels.
The third part of the thesis deals with the construction, characterization and
electrochemical response of Fc-PNA/Au interfaces (section 6.5 and 6.6). Electrochemical
studies of different Fc-PNA/Au interface designs in combination with RAIRS and ToF-SIMS
surface characterization were performed, in order to establish a clear correlation between
electrochemical response and surface modification event (section 6.5). Section 6.6 deals
with the analysis of an elastic bending-based electron transfer mechanism, which is

2. Objective and Outline
25
suggested to be predominantly responsible for the electrochemical response at Fc-PNA
surfaces.
In the final part (section 6.7), the elucidated electron transfer process at different well-
characterized interfaces will be employed to follow three different concepts for DNA analysis
with the focus on the detection of single nucleobase mismatches. Besides two simple
approaches of loosely packed, individual Fc-PNA sensing surfaces as well as chip confined,
densely packed Fc-PNA layers, furthermore a dual-potential sensor strategy will be studied.
Fig. 2-1. Outline of this thesis.
DNA
DNA
Fc-PNA Conjugate
AAPNA
SH
Fe
PNA
DNA
Fe
SH
Fc-PNA•DNA Duplex
SurfaceModificationSurface Characterization
InterfacialStudies
Probe DesignNew Labeling Strategies
SPPS, HPLC, MSElectrochemical Characterization
S
OH
S
OH
S
OH
S
OH
S
OH
S
OH
S
OH
S
OH
S
OH
S
OH
S
OH
S S
OH
e-
PNA
Fe
Fc-PNA/(MCH)/ Au Fc-PNA•DNA/(MCH)/ Au
S
OH
S
OH
S
OH
S
OH
S
OH
S
OH
S
OH
S
OH
S
OH
S
OH
S
OH
S S
OH
e-
PNA
DNA
Fe
UVMeltingStudiesElectrochemical Characterization
Electrontransfer StudiesDNADetection Strategies
SNPDetection

3. Strategies for the Ferrocene-Labeling of PNA
26
3. Strategies for the Ferrocene-Labeling of PNA
3.1 Objective
As demonstrated in section 1.2.3, few key reaction types were reported so far for the
metal complex labeling of PNA. Of these, exclusively the N-terminal labeling with carboxylic
acid functionalized metal complexes (Fig. 1-10) appears appropriate for the solid-phase
labeling of PNA oligomers. This key reaction proceeds under conditions, which are
comparable to those used for the standard coupling in solid-phase PNA synthesis (SPPS,
section 4.2) and hence offer the possibility for automation. Although this peptide chemistry
based coupling method is efficient, it is restricted to the N-terminal labeling with single
carboxylic acid derivatives of metal complexes. An advanced labeling of PNA oligomers
embraces a labeling at variable strand positions, the introduction of diverse organometallic
starting materials as well as a selective multi-insertion of organometallic complexes, to
facilitate a target-oriented tuning of the conjugate’s properties. With the described labeling
with carboxylic acid functionalized metal complexes (Fig. 1-10), therefore either the
application of a complex protecting group strategy is required or an advanced labeling
generally fails due to the limited flexibility of this key reaction. In order to face the
challenges of an advanced metal complex labeling of PNA at the solid-phase, two further
reaction types will be studied in this section as possible new key reactions. Such a last-step
on-resin labeling is generally favored over the introduction of a metal-containing building
block during SPPS, which is mainly due to fact that the organometallic label then requires to
stand all steps of the solid phase synthesis of the PNA oligomer.
As new key reactions, the Pd-catalyzed Sonogashira coupling between terminal alkynes
and e. g. aryl halides, which was already reported by our group as key reaction for the (off-
resin) ferrocene labeling of amino acids and peptides,219, 220 as well as the Cu(I)-catalyzed
[2+3]-azide/alkyne cycloaddition between terminal alkynes and azides will be studied. The
general synthetic strategy comprises, besides the labeling with the organometallic moiety,
the previous introduction of a key functional group into the PNA oligomer, which presents
an additional synthetic step that is not present in the classical labeling route. This functional
group is supposed to serve as a bioorthogonal chemical reporter group, to chemoselectively
react with the ferrocene derivative, while being inert apart from that and compatible with all
reaction conditions.221 Thereby, azides and terminal alkynes are the best known
bioorthogonal chemical reporter groups. The [2+3]-azide/alkyne cycloaddition will be
investigated for an N-terminal ferrocene labeling, to be in direct competition to the classical

3. Strategies for the Ferrocene-Labeling of PNA
27
route (Fig. 1-10). With this, the N-terminal introduction of the chemical reporter group
(namely the azide or terminal alkyne functional group) requires to be as facile as possible, to
render this synthetic strategy competitive. In contrast, the Sonogashira reaction will be
investigated for the ferrocene labeling of internal PNA strand positions. Therefore, the
synthesis of a PNA building block is required, which carries the chemical reporter group (aryl
halide or terminal alkyne functional group) and facilitates a labeling of various strand
position. All studies will be exemplary and exclusively performed with appropriately
functionalized ferrocene moieties as the organometallic complexes, since ferrocene offers
chemical stability combined with an electrochemical reversibility, which is required for the
subsequent biosensor investigations (section 6).
Fig. 3-1. Fc-PNA labeling strategies (Red/green: non peptide chemistry based functional groups).
PNAFunctionalization
FerroceneConjugation
Cleavage
Fe
Fe
FeFe
Fe
Fe
Fe
Fe
Classical N-terminal Conjugationof ferrocenecarboxylic acid
N-terminal Conjugationvia azide/alkyne cycloaddition
Internal Conjugationvia Sonogashira reaction
FerroceneConjugation
Cleavage
Fe

3. Strategies for the Ferrocene-Labeling of PNA
28
3.2 Ferrocene Building Blocks
During the studies on new key reactions for the ferrocene – PNA conjugation, the
following ferrocene derivatives had been used as ferrocene building blocks.
Fig. 3-2. Ferrocene building blocks.
The ferrocene derivatives ethynylferrocene and ferrocenealdehyde were purchased,
whereas the derivatives ferrocenecarboxylic acid P7, azidomethylferrocene P9,
azidoferrocene, carboxazidoferrocene P10, and N-(3-ethylpent-1-yn-3-yl)ferrocene carbox-
amide (DEPA-ferrocene) had to be synthesized from commercially available ferrocene
starting materials.
Ferrocenecarboxylic acid P7 (CAS: [1271-42-7]) is commercially available, but was
synthesized due to cost reasons and larger amounts were required, since P7 also served as
starting material for the synthesis of P9 and P10. P7 was synthesized in two steps from
ferrocene according to Reeves et al. (Fig. 3-3).222 In the first step, ferrocene is
monofunctionalized in a Friedel-Crafts acylation to yield (2-Chlorobenzoyl)-ferrocene P6,
which is subsequently saponified to yield the free ferrocenecarboxylic acid P7 after
acidification with a yield of 84.8 %.
Ferrocenecarboxylic acidP7
Ferrocenealdehyde
AzidomethylferroceneP9
Azidoferrocene CarboxazidoferroceneP10
Ethynylferrocene DEPA-Ferrocene
Fe
O
OH
Fe
O
H
Fe
N3
Fe
N3
Fe
N3
O
Fe Fe
O
NH

3. Strategies for the Ferrocene-Labeling of PNA
29
Fig. 3-3. Synthetic scheme for the synthesis of ferrocenecarboxylic acid P7.
As starting materials for the [2+3] azide/alkyne cycloaddition and the Sonogashira key
reaction, alkyne functionalized ferrocene derivatives are required. Ethynylferrocene (CAS:
[1271-47-2) was purchased, whereas DEPA ferrocene was provided by U. Hoffmanns.223 For
the [2+3] azide/alkyne cycloaddition, azide functionalized derivatives are required as
ferrocene starting materials, of which azidoferrocene was synthesized by D. Köster224
according to Zheltova et al.225 The azido ferrocene derivatives azidomethylferrocene P9 as
well as carboxazidoferrocene P10 were synthesized from P7 according to the following
synthetic scheme.
Fig. 3-4. Synthetic scheme for the synthesis of azidomethylferrocene P9 and carboxazidoferrocene P10.
Azidomethylferrocene P9 was synthesized in two steps from P7. In the first step, the
carboxylic acid functional group of P7 is reduced with lithium aluminium hydride, to yield the
corresponding alcohol ferrocenemethanol P8. Subsequently, P8 is subjected to a
nucleophilic substitution with sodium azide,226 to yield azidomethylferrocene P9 as a highly
viscous dark red oil with a yield of 65 % over two steps from P7. NMR proves a high purity
and corresponds well to the analytical data reported of P9 in literature.226 In ESI-MS, the
[M+H]+ as well as [M]+ peak is detected and IR clearly shows two vibrations at ṽ = 2095 cm-1
and 2069 cm-1 (Fig. 3-5). Both bands are ascribed to the vas(N3) vibration of P9, indicating the
presence of two conformations in the solid state, since furthermore the sodium azide
starting material exhibits a vibration at larger absorptions ṽ = 2095 cm-1.227
Fe
O Cl
Fe Fe
O
OHO Cl
Cl AlCl3
DCM0°C, 1 h; a.t., 2.5 h
+H2O, t-BuOK
DME60°C, 1h, N2
P6 P7
Fe
O
OH
Fe
OH
Fe
N3
Fe
O
N3
LiAlH4
Et2O50°C, 18 h
72.7 %
NaN3
AcOH50°C, 3 h88.5 %
P7
P9
P10
P8
water/acetone0°C, 1 h72.8 %
NaN3

3. Strategies for the Ferrocene-Labeling of PNA
30
Carboxazidoferrocene P10 was directly synthesized from P7 according to Heinze et al.,228 to
yield 72.8 % of a red solid in a nucleophilic acyl substitution with sodium azide, subsequent
to an activation of the carboxylic acid functional group with ethyl chloroformate under the
intermediate formation of the respective mixed anhydride. NMR of P10 corresponds well to
the reported data and IR shows besides the vN3 vibration furthermore vCO vibrations
(Fig. 3-5).
Fig. 3-5. IR overlay of azidomethylferrocene P9 and carboxazidoferrocene P10.
3.3 Ferrocene Conjugation via Sonogashira Coupling
The Sonogashira reaction describes the Pd0 catalyzed C–C cross coupling between a
terminal alkyne and an aryl- or vinyl halide, where at first a Cu-alkyne is formed with a Cu(I)
co-catalyst under basic conditions, which is subsequently inserted into the Pd0 catalytic cycle
to finally form the C–C cross coupling product.229, 230 Due to its compatibility with various
functional groups as well as with aqueous media, it presents a promising key reaction for the
Fc labeling of biomolecules.219, 220 In our studies, the Sonogashira reaction will be
investigated as the key reaction for the ferrocene labeling of internal positions of a PNA
oligomer. Therefore, exemplary the Sonogashira reaction between an alkyne functionalized
ferrocene derivative, ethynylferrocene or DEPA ferrocene, and an iodo functionalized PNA
oligomer will be studied.
3.3.1 A 5-Iodouracil PNA Monomer Building Block
The modified PNA monomer 5-iodouracil PNA monomer P5 was synthesized, in order to
provide a PNA building block with an iodo functional group, which makes PNA accessible to a
Sonogashira reaction with an alkyne ferrocene derivative at variable strand positions. A
more facile approach to this challenge would be the use of commercially available iodo
~v / cm-1
1000150020002500300035004000
Tran
smitt
ance
/ %
0.1 %
P10P9
v(N3)
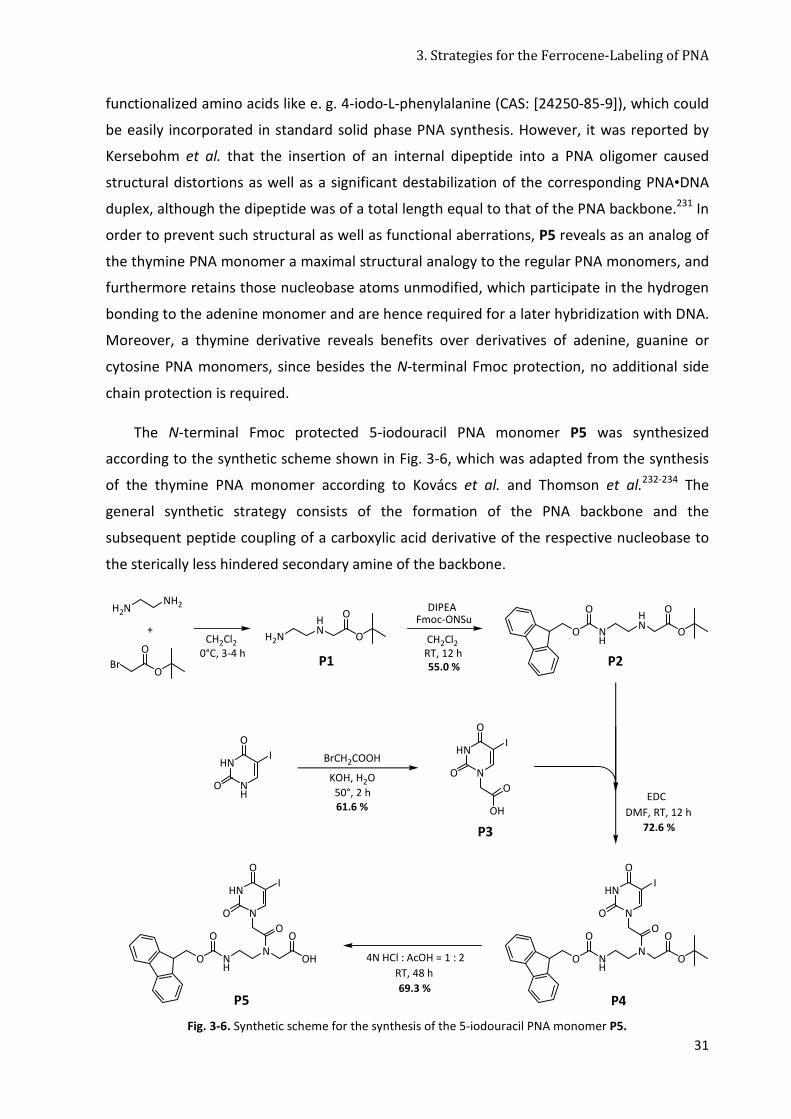
3. Strategies for the Ferrocene-Labeling of PNA
31
functionalized amino acids like e. g. 4-iodo-L-phenylalanine (CAS: [24250-85-9]), which could
be easily incorporated in standard solid phase PNA synthesis. However, it was reported by
Kersebohm et al. that the insertion of an internal dipeptide into a PNA oligomer caused
structural distortions as well as a significant destabilization of the corresponding PNA•DNA
duplex, although the dipeptide was of a total length equal to that of the PNA backbone.231 In
order to prevent such structural as well as functional aberrations, P5 reveals as an analog of
the thymine PNA monomer a maximal structural analogy to the regular PNA monomers, and
furthermore retains those nucleobase atoms unmodified, which participate in the hydrogen
bonding to the adenine monomer and are hence required for a later hybridization with DNA.
Moreover, a thymine derivative reveals benefits over derivatives of adenine, guanine or
cytosine PNA monomers, since besides the N-terminal Fmoc protection, no additional side
chain protection is required.
The N-terminal Fmoc protected 5-iodouracil PNA monomer P5 was synthesized
according to the synthetic scheme shown in Fig. 3-6, which was adapted from the synthesis
of the thymine PNA monomer according to Kovács et al. and Thomson et al.232-234 The
general synthetic strategy consists of the formation of the PNA backbone and the
subsequent peptide coupling of a carboxylic acid derivative of the respective nucleobase to
the sterically less hindered secondary amine of the backbone.
Fig. 3-6. Synthetic scheme for the synthesis of the 5-iodouracil PNA monomer P5.
+CH2Cl2
Fmoc-ONSu
CH2Cl2
BrCH2COOH
KOH, H2O
P1
DMF, RT, 12 h
P2
4N HCl : AcOH = 1 : 2
0°C, 3-4 h
DIPEA
RT, 12 h
50°, 2 h EDC
RT, 48 h
H2NNH2
BrO
OH2N
HN
O
O NH
HN
O
OO
O
HN
NH
O
O
I HN
N
O
O
I
OH
O
NH
N
O
OO
OO
N
HNI
O
O
NH
N
O
OHO
OO
N
HNI
O
O
P3
P5 P469.3 %
72.6 %
61.6 %
55.0 %

3. Strategies for the Ferrocene-Labeling of PNA
32
The C-terminal tert-butyl protected PNA backbone P1 was synthesized via a nucleophilic
substitution with ethylenediamine and tert-butyl bromoacetate, to yield after Fmoc
protection of the primary amino functional group the N-terminal Fmoc and C-terminal tert-
butyl protected PNA backbone P2 as its hydrochloride salt. NMR and ESI-MS characterization
of P2 corresponded well to the data reported in literature.233
The 5-iodouracil PNA monomer P5 was then synthesized in three steps from the
commercially available 5-iodouracil and the synthesized PNA backbone P2. Initially, the
acetic acid linker was introduced to 5-iodouracil in a nucleophilic substitution with 2-
bromoacetic acid, to form 1-carboxymethyl-5-iodouracil P3. ESI-MS of P3 mainly revealed
peaks corresponding to the molecular fragments [M-H]- as well as [2M-H]-. NMR
spectroscopy revealed that all shifts in 1H- and 13C-NMR are in good agreement with those
reported for the analogous carboxylic acid modified thymine nucleobase (Δδ1H < 0.46 ppm,
Δδ13C < 0.84 ppm),234 except the shift of C5 and the shifts of H- or C-atoms α-positioned to
the C-I group. In 13C-NMR, C5 reveals a significant upfield shift of ~ 40 ppm compared to C5 of
the thymine analog, which is unexpected, since due to inductive effects of the respective C5
substituents (–CH3 or –I) the inverse shifting direction is predicted. Thereby, the strong –I
effect of iodine is expected to cause a significantly stronger deshielding effect and correlated
downfield shift in 13C-NMR, compared to the +I – effect of the analogous methyl group. The
observed inverse effect is ascribed to the heavy atom effect of iodine, which is predicted to
counteract the –I effect of the iodine, to cause the detected upfield shift.235, 236 Furthermore
a good purity is revealed by 1H-NMR.
Subsequently, P3 was converted in a peptide coupling with the previously deprotonated
PNA backbone P2 via formation of an amide bond between the carboxylic acid function of
P3 and the sterically less hindered secondary amino group of P2, to yield the C-terminal tert-
butyl protected 5-iodouracil PNA monomer P4. After deprotection of the C-terminal tert-
butyl protecting group with a mixture of hydrochloric acid and acetic acid (1 : 2) and the
subsequent purification by column chromatography (at silica) of the obtained crude product,
the 5-iodouracil PNA monomer P5 was obtained as a yellowish powder. Likewise to P3, P5
exhibited in ESI-MS exclusively peaks corresponding to the molecular fragments [M-H]- as
well as [2M-H]-. 1H- and 13C-NMR reveal signals, which compose of the independently
measured signals of P2 and P3 in a 1:1 ratio, however slight signal shifts compared to the
two free compounds are detected and as expected, the signals due to the tert-butyl group
are not detected any longer at P5 compared to P4. 1H-NMR of P5 reveals a mixture of two
isomers in a ratio of major : minor = 2.2 : 1, which is attributed to the amide rotamers and is
likewise reported for the standard PNA monomers.93, 237

3. Strategies for the Ferrocene-Labeling of PNA
33
Fig. 3-7. Overlay of 1H-NMR spectra of compounds P2, P3 and P5.
3.3.2 SPPS with the 5-Iodouracil PNA Monomer Building Block
The compatibility of the synthesized 5-iodouracil PNA monomer P5 with the conditions
of standard solid phase PNA synthesis was examined, by synthesizing the trimer PNA model
sequence Ac–t uI t–Lys CysOH (P22), which exhibits P5 incorporated at an internal strand
position, according to the synthetic scheme in Fig. 3-8. Standard solid-phase PNA synthesis
will be described in detail in section 4.2.
Fig. 3-8. Synthetic scheme for the synthesis of iodo modified PNA oligomer P22.
The peptide coupling between P5 and the N-terminally deprotected, resin-bound
sequence H–t–LysBoc CysTrt succeeded under conditions, analogous to those required for the
coupling of the standard thymine PNA monomer Fmoc–t–OH. P5 was activated with HATU in
DMF (2 min, adding DIPEA and 2,6-lutidine) and the coupling was completed at ambient
temperature with 5 equiv. of P5 within 1.15 h and at T = 50 °C with 3 equiv. of P5 within only
15 min. The subsequent deprotection of the resin-bound PNA sequence Fmoc–uI t–LysBoc
CysTrt and the following N-terminal coupling of a second Fmoc–t–OH worked equally well like
those reactions performed at a standard, non-modified PNA sequence (section 4.2). The
success of both coupling reactions and the Fmoc-deprotection were indicated by the Kaiser
test and confirmed by mass spectrometry of the crude product, which was cleaved from the
resin under standard conditions (TFA/TIS/phenol = 85:5:10). MALDI-ToF MS of the crude
012345678910111213
P5
P2
δ / ppm
P3
H t Fmoc t O
NNH
O
P22
t LysBoc CysTrt
HATU, DMF2,6-lutidine, DIPEA
a. t., 1.15 h (50°C, 15 min)
Fmoc-uI-OH
P5uI t LysBoc CysTrt
a) Deprotectionb) Couplingc) Cleavage
2. acetic anhydride
1. Fmoc-t-OH N
HN
O
I
O
t Lys CysOHtAc

3. Strategies for the Ferrocene-Labeling of PNA
34
iodo modified PNA trimer sequence H–t uI t–Lys CysOH (P22) exhibited exclusively the
respective [M+H]+ peak (Fig. 3-9), and HPLC of the crude P22 revealed a purity comparable
to that of crude PNA oligomers, which are solely assembled of the standard, unmodified PNA
monomers.
Fig. 3-9. MALDI-ToF MS of the iodo modified PNA trimer sequence P22.
3.3.3 Ferrocene Conjugation via Sonogashira Coupling
In order to examine the suitability of the Pd0 catalyzed Sonogashira C–C cross coupling
as the key reaction for the ferrocene labeling of PNA at the solid phase, the ‘P22’ preloaded
resin was reacted with the alkyne Fc derivatives ethynylferrocene as well as DEPA ferrocene.
The Sonogashira reaction was carried out with DEPA ferrocene or ethynylferrocene (3 equiv.,
respectively) according to the following synthetic scheme under inert conditions. The Pd0
species tetrakis (triphenylphosphine)palladium(0) (0.1 equiv.) was used as the catalyst,
which is more oxygen sensitive than the alternative Pd(II) salt palladium(II)bis
(triphenylphosphine) dichloride, but bears advantages due to a decrease in the development
of Glaser by-product, and a sometimes observed improvement of yield and decrease of
reaction time.238 Furthermore, copper(I)iodide is used as the co-catalyst (0.3 equiv.) and
triethylamine (2 equiv.) in DMF as the basic solvent, as adapted from reported standard
protocols.239 The shrunk ‘P22’ preloaded resin was first swollen in dry DMF and after
draining off the solvent, the resin was incubated with the reaction mixture (all steps under
argon) for 20 h at ambient temperature.
600 800 1000 1200 1400 1600 1800 20000
100
200
300
400
500
600In
tens
.
m / z
[M+H]+
1202.8
P22

3. Strategies for the Ferrocene-Labeling of PNA
35
Fig. 3-10. Solid-phase conversion of ‘P22‘ in a Sonogashira coupling with
ethynyl- (n = 0) and DEPA (n = 1) ferrocene.
PNA cleavage according to the standard conditions of TFA/TIS/phenol (85:5:10) yielded
an orange/brown solid after the conversion with DEPA ferrocene and a yellowish solid after
the conversion with ethynylferrocene. MALDI-ToF MS of both crude compounds revealed
that the expected Sonogashira cross coupling products had only formed partially with
[M+H]+ being 17.6 % of the respective base peak for n = 0 (M = 1284.1 g/mol) and 29.9 % of
the respective base peak for n = 1 (M = 1397.3 g/mol), whereby the product mixture of the
latter conversion furthermore exhibited one mass fragment, which could be related to the
loss of FeCp ([M-FeCp+H]+, 1278.6 g/mol; 33.8 %) and indicates the instability of the Fc label
towards the TFA cleavage conditions (degradation according to mechanism B.II, section 3.5,
Fig. 3-22). As the main component of the crude product mixture of both reactions, the PNA
precursor P22 was identified. This could be correlated to the respective base peaks and
indicates a low extent of conversion under the described reaction conditions. Besides the
[MP22+H]+ peak, an additional degradation product of P22 was identified, which correlated to
a loss of one thymine nucleobase ([MP22-thymine+H]+, 1077.4 g/mol). Further studies on this
reaction as well as an optimization of the reaction conditions were discontinued, since the
detection of degradation of the Fc label as well as the PNA oligomer do not present
promising results for the Sonogashira reaction as a key reaction for the Fc labeling of PNA
oligomers. However, Hudson et al. reported a successful Sonogashira cross coupling for the
Fc labeling of PNA monomers in solution as well as the solid-phase conversion of a PNA 7-
mer with a non-metal organic alkyne derivative under analogous conditions as examined in
this work.239
ON
NH
O
'P22'
N
HN
O
I
O
t LysBoc CysTrttAc
NH
O
Fe
n
a) Sonogashira cross-coupling: Pd(PPh3)4, NEt3, CuI DMF, 20 h, a.t., Arb) Cleavage
ON
NH
O
N
HN
O
O
t Lys CysOHtAc
NH
O
Fe
n
n = 0, 1

3. Strategies for the Ferrocene-Labeling of PNA
36
3.4 Ferrocene Conjugation via [2+3]-Alkyne/Azide Cycloaddition
The [2+3]-alkyne/azide cycloaddition will be investigated as the key reaction for the
ferrocene labeling of the N-terminus of a PNA oligomer. Therefore, the cycloaddition
between azide functionalized ferrocene derivatives and N-terminal alkyne functionalized
PNA oligomers will be studied, as well as the reaction of the respective starting materials
with the inverse azide/alkyne functionalities. All studies will be performed at the trimer PNA
model sequence H-t t t LysBoc (t3), which is bound to a TentaGel® R RAM resin and was
synthesized according to the general strategies of standard Fmoc solid-phase PNA synthesis,
as will be described in section 4. A new key reaction for the ferrocene labeling of the PNA N-
terminus is in direct competition to the N-terminal ferrocene conjugation via the peptide
coupling of ferrocenecarboxylic acid, as the classical ferrocene labeling strategy presented in
Fig. 1-10. In order to render the [2+3]-azide/alkyne cycloaddition competitive with the
classical synthetic route, it requires to proceed quantitatively at the solid phase without the
formation of PNA/resin-bound by-products (including PNA decomposition), as well as to
yield products, which are chemically stable upon the harsh TFA cleavage conditions.
3.4.1 N-Terminal Functionalization of PNA
In order to make the PNA accessible to a conversion in a [2+3]-azide/alkyne
cycloaddition, the PNA oligomer is required to be modified with either an azide or an alkyne
functional group. This PNA functionalization presents an additional reaction step compared
to the classical ferrocene conjugation route of (Fig. 1-10). Hence, this step needs to be
sufficiently facile, high yielding as well as solid-phase compatible, to render the click
chemistry based Fc conjugation route competitive and improved compared to the classical
conjugation strategy. A facile approach for the introduction of an azide or alkyne functional
group is the peptide coupling between a carboxylic acid functionalized azide or alkyne
derivative and the unprotected PNA N-terminus, since it is based on peptide chemistry to be
basically adaptable to solid-phase synthesis.
As a suitable azido carboxylic acid derivative, azidoacetic acid was chosen, which was
synthesized by J. Lemke according to a reported strategy.240 As suitable alkynyl carboxylic
acid derivatives, the commercially available derivatives propynoic acid or 4-pentynoic acid
were chosen.

3. Strategies for the Ferrocene-Labeling of PNA
37
Fig. 3-11. Synthetic scheme for the solid-phase azide or alkyne functionalization of PNA.
The synthetic scheme shown in Fig. 3-11 describes the solid-phase synthesis of the N-
terminally azide functionalized, t3 trimer PNA model compound P16 and the N-terminally
alkyne functionalized t3-PNA compounds P19 and P21. The azide/alkyne functional group is
thereby introduced via the peptide coupling with the respective alkyne or azide
functionalized carboxylic acid, which was performed at a TentaGel® R RAM resin being
preloaded with the previously synthesized (according to standard SPPS, all synthetic details
in section 4, Fig. 4-4), N-terminally Fmoc-deprotected t3-PNA sequence H–t t t–LysBoc. The
coupling of 2-azidoacetic acid for the synthesis of P16, as well as the coupling of 4-pentynoic
acid for the synthesis of P21, succeeded under conditions analogous to those used for the
standard coupling of α-amino acids (coupling agents: TBTU, HOBt). An exception forms the
coupling reaction with propynoic acid for the synthesis of P19, which did not succeed under
these standard conditions. A complete conversion however could be achieved after a three-
fold repetition of the coupling reaction, using the more efficient coupling reagent HATU at
an increased reaction temperature of T = 50 °C. A monitoring of the reaction by the Kaiser
test241 only succeeded during the synthesis of P21. During the synthesis of P19, the Kaiser
test exhibited a false-positive color change, whereas during the synthesis of P16 the
therefore required heating up to T = 110 °C should be avoided to exclude decomposition of
the azido functionalized product. In these cases, the reaction was monitored by performing
test cleavages of small quantities of the resin. The cleavage from the resin with
TFA/TIS/phenol (85:5:10 (v/v/v)) yielded the crude products P16, P19 and P21 with a yield of
> 82 %, which were analyzed by ESI-MS and HPLC. ESI-MS of all of the crude products
(Fig. 3-12) exclusively revealed the respective [M+H]+ and [M+2H]2+ peaks of the azide or
alkyne functionalized t3-PNA and did not exhibit any peaks corresponding to the PNA
precursor sequence H–t t t–LysNH2, truncated sequence fragments, by-products or starting
materials. HPLC analysis of the crude products P16, P19 and P21 revealed already a good
t t t LysBoc
O
H- t t t LysBoc
OH
OOH
O
N3
t t t LysBoc
Ot t t LysBoc
O
N3
OH
O
t t t LysNH2
Ot t t LysNH2
O
N3
CleavageTfa/TIS/Phenol85 / 5 / 10
CouplingDIPEA,LutidineDMF
P21 P19 P16
HATU30 min, 50°C(3 x)
TBTU, HOBt30 min, 50°C
TBTU, HOBt1 h, a.t.
t t t LysNH2
O

3. Strategies for the Ferrocene-Labeling of PNA
38
purity of the crude compounds (see HPLC of crude P21 in Fig. 3-18), and in combination with
ESI-MS, a quantitative conversion is considered for all three coupling reactions. IR of P16
furthermore reveals a vibrational band at ṽ = 2110 cm-1, which is characteristic for the
asymmetric stretching vibration vas(N3) of azides (see IR overlay in Fig. 3-15).227, 242
Fig. 3-12. ESI-MS of the azido-PNA oligomer P16 and the alkynyl-PNA oligomer P21.
Concluding, it could be demonstrated that all peptide coupling key reactions had
proceeded with quantitative conversion and that all the three azide and alkyne
functionalized PNA oligomers P16, P19 and P21 are furthermore totally stable to the harsh
cleavage conditions.
3.4.2 Ferrocene Conjugation via [2+3]-Alkyne/Azide Cycloaddition
The resins, which are preloaded with the azido functionalized PNA trimer ‘P16’ or the
alkynyl functionalized PNA trimer ‘P19’ and ‘P21’, were converted in a [2+3]-alkyne/azide
cycloaddition with alkyne or azide functionalized ferrocene derivatives, in order to study and
optimize this key reaction concerning its compatibility with solid phase PNA synthesis. The
chosen general reaction conditions were deduced from the conditions, which Lokey et al.
applied for a solid-phase peptide cyclization via click chemistry.191 DFM was chosen as the
solvent, which is reported to give full conversion and high yields in click reactions at solid-
support bound peptides 243 and furthermore ensures compatibility with the here used
TentaGel® resins. The respective azido or alkynyl ferrocene derivative was added with a 5-
fold excess as a 1 % solution in DMF, whereby unexceptionally all used ferrocene derivatives
revealed an excellent solubility in DMF. As the copper catalyst, the Cu(I) species
copper(I)bromide was chosen instead of a Cu(II) species, in order to avoid the use of the
reducing agent sodium ascorbate, which revealed a bad solubility in the used solvent
mixture (DMF/ACN). Copper(I)bromide was added as a solution in acetonitrile, due to its
excellent solubility therein (resulting solvent mixture: ~15 % (v/v) ACN/DMF), which
400 600 800 1000 1200 14000
2
4
6
8
10
12
14
16
m / zIn
tent
s. / 1
06
[M+2H]2+
512.7
[M+H]+
1024.4
P21
400 600 800 1000 1200 14000
5
10
15
20
m / z
Inte
nts.
/ 106
[M+H]+
1027.3
[M+2H]2+
514.2
P16

3. Strategies for the Ferrocene-Labeling of PNA
39
furthermore required one equivalent of a nitrogen base.168 Therefore, 2,6-lutidine was used,
which minimizes the proceeding of the typical side reactions (section 3.1), which frequently
occurred under these non-standard conditions.168, 243 The mentioned side reactions were
furthermore suppressed by generally working under the exclusion of oxygen and by avoiding
higher temperatures. A possible decomposition of the azide functionalized starting materials
was avoided by the exclusion of light, however organic azides in general and furthermore
the here used (metal)organic azide starting materials reveal a significant larger stability than
the largely shock sensitive and explosive metal azides.167
In the first approach, the Cu(I)-catalyzed azide/alkyne cycloaddition will be studied with
the regular arrangement, where the azide is located at the resin, and an excess of the
terminal alkyne in solution. According to the mechanism in Fig. 1-13, a free diffusing Cu(I)-
acetylide is formed in solution, to react with the resin-bound azide. Due to the excess of
terminal alkyne, the probability for a proceeding of the described intermolecular side
reactions is enhanced in this arrangement. TentaGel® R RAM resins, which were preloaded
with the N-terminally azido functionalized trimer PNA sequence ‘P16’, were converted
according to the described conditions with the alkynyl ferrocene derivates ethynylferrocene
as well as DEPA ferrocene, as shown in the synthetic scheme in Fig. 3-13.
Fig. 3-13. Synthetic scheme for all click reactions performed at the azido functionalized PNA precursor ‘P16’.
Upon incubation of the ‘P16’ preloaded resin with the respective reaction mixture, the
expected product P31, resulting from the conversion with ethynylferrocene, as well as the
expected triazole derivative P33, resulting from the conversion with DEPA ferrocene, had
formed within 24 h, which was proven by ESI-MS. ESI-MS of P31 and P33 exclusively
revealed the respective [M+H]+ and [M+2H]2+ peaks, and no peaks corresponding to
Fe
t t t LysBoc
O
N3
NN N
Fe
t t t LysBoc
O
NN N
Fe
t t t LysNH2
O
NN N
t t t LysBoc
O
NH
O
Fe
NN N
t t t LysNH2
O
NH
O
Fe
NH
O
Fe
'P16'
P31 P33
CleavageTfa/TIS/Phenol
Click ReactionCuBr in ACNDIPEA,Lutidine, DMF2 d, a.t.
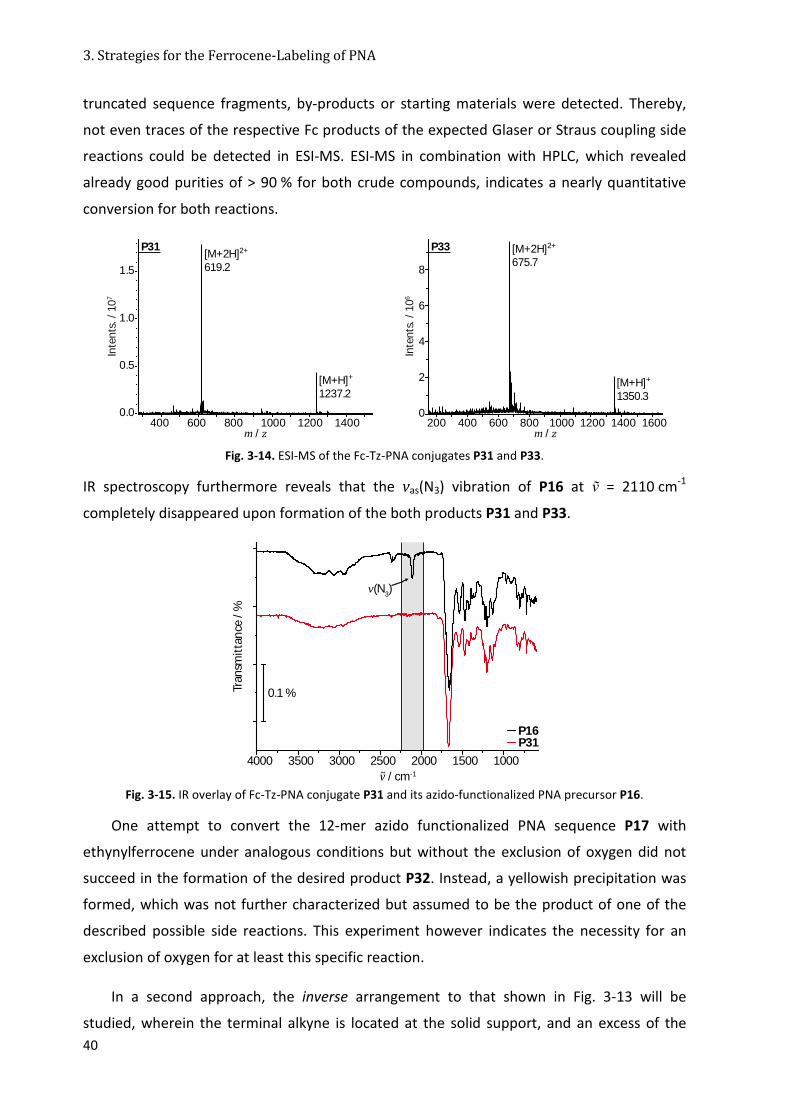
3. Strategies for the Ferrocene-Labeling of PNA
40
truncated sequence fragments, by-products or starting materials were detected. Thereby,
not even traces of the respective Fc products of the expected Glaser or Straus coupling side
reactions could be detected in ESI-MS. ESI-MS in combination with HPLC, which revealed
already good purities of > 90 % for both crude compounds, indicates a nearly quantitative
conversion for both reactions.
Fig. 3-14. ESI-MS of the Fc-Tz-PNA conjugates P31 and P33.
IR spectroscopy furthermore reveals that the vas(N3) vibration of P16 at ṽ = 2110 cm-1
completely disappeared upon formation of the both products P31 and P33.
Fig. 3-15. IR overlay of Fc-Tz-PNA conjugate P31 and its azido-functionalized PNA precursor P16.
One attempt to convert the 12-mer azido functionalized PNA sequence P17 with
ethynylferrocene under analogous conditions but without the exclusion of oxygen did not
succeed in the formation of the desired product P32. Instead, a yellowish precipitation was
formed, which was not further characterized but assumed to be the product of one of the
described possible side reactions. This experiment however indicates the necessity for an
exclusion of oxygen for at least this specific reaction.
In a second approach, the inverse arrangement to that shown in Fig. 3-13 will be
studied, wherein the terminal alkyne is located at the solid support, and an excess of the
0.0
0.5
1.0
1.5
400 600 800 1000 1200 1400
[M+H]+
1237.2
[M+2H]2+
619.2
P31
0
2
4
6
8
200 400 600 800 1000 1200 1400 1600
[M+H]+
1350.3
[M+2H]2+
675.7P33
m / z m / z
Inte
nts.
/ 10
7
Inte
nts.
/ 10
6
~v / cm-1
1000150020002500300035004000
Tran
smit
tanc
e / %
0.1 %
v(N3)
P31P16

3. Strategies for the Ferrocene-Labeling of PNA
41
azide is located in solution. According to the mechanism in Fig. 1-13, the free diffusing azide
thereby reacts with the resin-bound Cu(I)-acetylide. This inverse arrangement is in general
superior to the first described, regular arrangement, since the deficient amount of the
terminal alkyne disfavors the proceeding of the described side reactions and a high degree
solvation is facilitated for the respective Cu(I)-intermediates.243 TentaGel® R RAM resins,
which were preloaded with the N-terminally alkyne functionalized trimer PNA sequence
‘P19’ or ‘P21’, were converted according to the described conditions with the azido
functionalized ferrocene derivatives azidoferrocene, azidomethylferrocene P9 or
carboxazidoferrocene P10, as shown in the synthetic scheme in Fig. 3-16.
Fig. 3-16. Synthetic scheme for all click reactions performed at the propynoic functionalized PNA precursor P19
(n = 0) and the 4-pentynoic functionalized PNA precursor P21 (n = 2).
The cleavage from the resin with TFA/TIS/phenol (85:5:10 (v/v/v)) yielded the crude
products P36 and P40 as yellowish solids with a yield of 77.8 % and 84.0 %, respectively. ESI-
MS revealed, analogous to ESI-MS of the Fc-Tz-PNA conjugates of Fig. 3-13, exclusively the
respective [M+H]+ and [M+2H]2+ peaks and no peaks corresponding to undesired mass
fragments were detected.
t t t LysBoc
O
n
N3
Fe Fe
N3
NN N
Fet t t LysBoc
O
n
NN N
Fet t t LysNH2
O
n
t t t LysBoc
O
nNN N
Fe
t t t LysNH2
O
nNN N
Fe
t t t LysNH2
O
nHN
N N
Fe
N3
On = 0: 'P19'n = 2: 'P21'
n = 0:P36n = 2:P40
n = 0:P38n = 2:P39
n = 0:P41n = 2:P42
P42
CleavageTfa/TIS/Phenol
Click ReactionCuBr in ACNDIPEA,Lutidine, DMF2 d, a.t.P9
P10
NN N
Fe
O
t t t LysBoc
O
NN N
Fe
O
t t t LysNH2
O
NN N
t t t LysNH2
O
H

3. Strategies for the Ferrocene-Labeling of PNA
42
Fig. 3-17. ESI-MS of the Fc-Tz-PNA conjugates P36 and P40.
Fig. 3-18 shows an overlay of the HPLC chromatograms of crude Fc-Tz-PNA conjugate
P40 and its N-terminally pentynoic acid functionalized PNA precursor P21. Comparable and
good purities of > 90 % are revealed for both crude compounds, which in combination with
ESI-MS indicates nearly quantitative conversions for the alkyne functionalization as well as
the azide/alkyne cycloaddition of azidoferrocene.
Fig. 3-18. HPLC overlay of the crude Fc-Tz-PNA conjugate P40 and its crude precursor P21.
In contrast, ESI-MS of the TFA-cleaved, crude product mixtures obtained from all
conversions of ‘P19’ or ‘P21’ with azidomethylferrocene P9 or carboxazidoferrocene P10
revealed as the main product the respective PNA oligomer with an N-terminally attached
triazole ring, which was characterized as P41 or P42, respectively, and corresponds to the
expected product minus a FcCH2 (conversions with P9) or FcCO (conversions with P10)
molecular fragment. The triazole formation however indicates the proceeding of the
azide/alkyne cycloaddition, which was found to be nearly quantitative for all conversions,
since not even traces of mass fragments correlating to the respective alkyne functionalized
PNA precursors could detected, except for the conversion of ‘P21’ with P10 (fraction of
starting material: 4.9 %). In section 3.5, a potential decomposition mechanism will be
discussed, which indicates the product decomposition upon the TFA cleavage from the resin
400 600 800 1000 1200 14000
2
4
6
8
10
12
400 600 800 1000 1200 14000
2
4
6
8
[M+H]+
1223.2
[M+2H]2+
612.2
[M+H]+
1251.3
[M+2H]2+
626.2
P36 P40
m / z m / z
Inte
nts.
/ 10
6
Inte
nts.
/ 10
6
0 5 10 15 20 25 30
0.0
0.2
0.4
0.6
0.8
1.0 tR = 13.2 min
norm
. ab
s.
t / min
P21 P40
tR = 10.0 min

3. Strategies for the Ferrocene-Labeling of PNA
43
resulting in the loss of the Fc moiety, which explains the formation of P41 or P42 instead of
the expected Fc-Tz-PNA conjugates.
In order to circumvent the TFA cleavage, the click reactions with P9 and P10 were
carried out in a post-synthetic approach, whereby the alkynyl functionalized PNA precursors
P19 and P21 were transformed in solution with the azido ferrocene derivatives, subsequent
to their cleavage from the resin according to the synthetic scheme in Fig. 3-19.
Fig. 3-19. Post-synthetic approach for the conjugation of azidomethylferrocene P9 and carboxazidoferrocene
P10 to the alkynyl functionalized trimer PNA precursors P19 (n = 0) and P21 (n = 2).
MALDI-ToF mass spectrometry revealed that both conversions of P19 and P21 with
azidomethylferrocene P9 yielded to 100 % the expected products P38 and P39, respectively,
whereas the expected Fc-Tz-PNA conjugates of both reactions with carboxazidoferrocene
P10 were only detected fractionally in a product mixture of different degradation products.
MALDI-ToF MS of the crude products P38 and P39 revealed mainly peaks corresponding to
the respective product, whereby MALDI-ToF MS of P38 exhibited the [M+H+ACN]+ peak as
the base peak and MALDI-ToF MS of P39 revealed the [M+Na]+ peak as the base peak
(Fig. 3-20). The fact that this post-synthetic approach resulted in a selective product
formation is evidence for the high selectivity of the azido/alkyne cycloaddition and is clearly
facilitated by avoiding a peptide chemistry labeling strategy, which would not have been
compatible with an unprotected amino group of the lysine residue.
Click ReactionCuBr in ACNDIPEA,Lutidine, DMF2 d, a.t.
t t t LysBoc
O
n
t t t LysNH2
O
n
t t t LysNH2
O
nNN N
Fe
Ot t t LysNH2
O
nNN N
Fe
Fe
N3
Fe
N3
O
n = 0:P38n = 2:P39
n = 0:P19n = 2:P21
P9 P10
CleavageTfa/TIS/Phenol
n = 0: 'P19'n = 2: 'P21'

3. Strategies for the Ferrocene-Labeling of PNA
44
Fig. 3-20. MALDI-ToF MS of the Fc-Tz-PNA conjugates P38 and P39.
An attempt to determine the actual 1,4- or 1,5-regioselectivity of the triazole products,
exploiting the NOE effect of the 1,4-substituted product failed, since the existence of 23 = 8
isomers impeded a clear correlation of the 1H-NMR signals.244 However, since the 1,4-
substituted product is already strongly favored for small substituents under the applied
reaction conditions (Cu(I) catalysis, ambient temperature),168 a decline of the 1,4- vs. 1,5
regioisomer ratio with a preference of the sterically less favored, 1,5-substitued product is
very unlikely with the bulky PNA substituent.
3.5 Reflection about the Stability of different Fc-Labels
The new ferrocene triazolyl labels as well as the classical amide-bound Fc label revealed
significantly different chemical stabilities during synthesis, cleavage, purification and mass
spectrometric analysis. A reflection about the stability is of great importance for any
application of the labeled conjugates and the knowledge about the decomposition
mechanism furthermore facilitates an optimization of the synthetic strategy as well as an
appropriate handling of the respective compounds. The considerations about the label
stabilities is furthermore relevant for the respective electrochemical stability, which will be
analyzed in section 6.
As an indicator for the stability of the respective Fc label, ESI-MS of all studied Fc(-Tz)-
PNA crude products, obtained after cleavage from the resin with TFA/TIS/phenol, was
employed, since HPLC stability of the products cannot be ensured. However, a different
ionization/flight behavior of the compounds as well as the compound stability upon ESI
(molecule fragmentation) has to be considered to contribute to the detected peaks and the
given percentaged values determined from ESI-MS do not correlate with molar ratios.
Furthermore MALDI-ToF MS is used for analysis, which provides with the milder ionization
600 800 1000 1200 1400 1600 1800 20000
2
4
6
8
10
12
14
16
18
600 800 1000 1200 1400 1600 1800 20000
50
100
150
200In
tens
.
Inte
ns.
[M+H+ACN]+
1279.0
P38 P39 [M+Na]+
1288.2
[M+H+ACN]+
1307.2
[M+Na+ACN]+
1329.2
m / z m / z

3. Strategies for the Ferrocene-Labeling of PNA
45
conditions an analysis without molecule fragmentation. The summary in Tab. 3-1 reveals
that besides the expected Fc(-Tz)-PNA conjugates frequently species are detected, which
prove to the complete loss of the Fc moiety as well as Cp-PNA conjugates, which indicate the
loss of FeCp. In the following, two mechanisms are proposed for the respective
decomposition reactions.
Mechanism A. It is well know that the ferrocenium cation [FeIIICp2]+ (Fc+), as a 17-
electron species, is significantly less stable than ferrocene [FeIICp2] (Fc0), as its reduced, 18-
electron form. The electron deficiency of Fc+ can be compensated by the reduction back to
Fc0 (electrochemical reversibility) but furthermore by electron donating species such as
nucleophiles or solvent molecules, which can cause a decomposition of ferrocenium.245, 246
The thereby generated Cp- anions can subsequently reduce FeIII species, due to their high
reducing power, whereby the resulting Cp radicals can combine to Cp2 or abstract protons
from solvent molecules. Concluding, the decomposition of Fc-PNA conjugates according to
the mechanism A is promoted by oxidative and nucleophilic conditions.
Fig. 3-21. Proposed Fc-PNA decomposition mechanism A, formulated according to Kortbeek et al.
245
The Cp-PNA conjugates as the products of decomposition mechanism A were actually mass-
spectrometrically detected after HPLC purification of Fc-PNA conjugates of the general
structure shown in Fig. 4-5 with an amide-bound Fc moiety, which is described in section
4.3.1. Furthermore, a decomposition according to this mechanism has to be considered to
potentially proceed during electrochemical measurements in aqueous buffer electrolyte,
when the electrochemically generated Fc+ species are exposed to the nucleophilic
environment of the electrolyte.
Mechanism B. With regard to the structural characteristics of the Fc-PNA species, two
decomposition mechanisms can be assumed for a degradation, which goes along with the
loss of the Fc moiety. A decomposition according to a SN1-type nucleophilic substitution at Cα
(mechanism B.I) has to be considered for all species, which facilitate the formation of a
ferrocenyl-methyl cation. This cation exhibits a remarkable stability due to the stabilization
of the α-positioned positive charge by conjugation with the π-electrons of the Cp ring.
Structural requirements are a methylene group in α-position and a nucleophilic, protonable
β-position. For derivatives with a carbonyl group in α-position to the ferrocene, a
nucleophilic substitution at Cα of the acyl group according to mechanism B.II has to be
FeII- e- FeIII
PNA+ Lx
PNA
+
PNA
- Cp-, FeLn3+
- H+
PNA
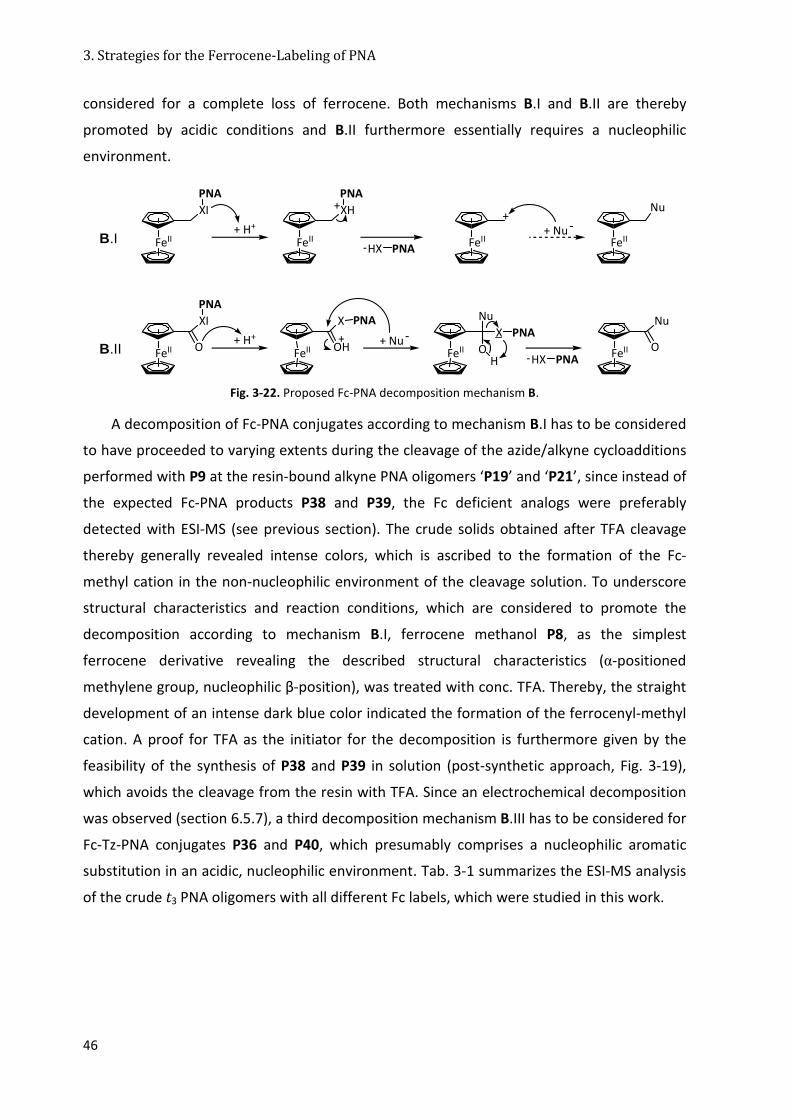
3. Strategies for the Ferrocene-Labeling of PNA
46
considered for a complete loss of ferrocene. Both mechanisms B.I and B.II are thereby
promoted by acidic conditions and B.II furthermore essentially requires a nucleophilic
environment.
Fig. 3-22. Proposed Fc-PNA decomposition mechanism B.
A decomposition of Fc-PNA conjugates according to mechanism B.I has to be considered
to have proceeded to varying extents during the cleavage of the azide/alkyne cycloadditions
performed with P9 at the resin-bound alkyne PNA oligomers ‘P19’ and ‘P21’, since instead of
the expected Fc-PNA products P38 and P39, the Fc deficient analogs were preferably
detected with ESI-MS (see previous section). The crude solids obtained after TFA cleavage
thereby generally revealed intense colors, which is ascribed to the formation of the Fc-
methyl cation in the non-nucleophilic environment of the cleavage solution. To underscore
structural characteristics and reaction conditions, which are considered to promote the
decomposition according to mechanism B.I, ferrocene methanol P8, as the simplest
ferrocene derivative revealing the described structural characteristics (α-positioned
methylene group, nucleophilic β-position), was treated with conc. TFA. Thereby, the straight
development of an intense dark blue color indicated the formation of the ferrocenyl-methyl
cation. A proof for TFA as the initiator for the decomposition is furthermore given by the
feasibility of the synthesis of P38 and P39 in solution (post-synthetic approach, Fig. 3-19),
which avoids the cleavage from the resin with TFA. Since an electrochemical decomposition
was observed (section 6.5.7), a third decomposition mechanism B.III has to be considered for
Fc-Tz-PNA conjugates P36 and P40, which presumably comprises a nucleophilic aromatic
substitution in an acidic, nucleophilic environment. Tab. 3-1 summarizes the ESI-MS analysis
of the crude t3 PNA oligomers with all different Fc labels, which were studied in this work.
FeII+ H+
XI
PNA
FeII
XH
PNA+
FeII
+
B.I
B.II FeII+ H+
XI
PNA
FeII
X PNA
+O OH + Nu -
FeII O
Nu
X PNA_
HFeII
Nu
O
+ Nu -FeII
Nu
HX PNA-
HX PNA-
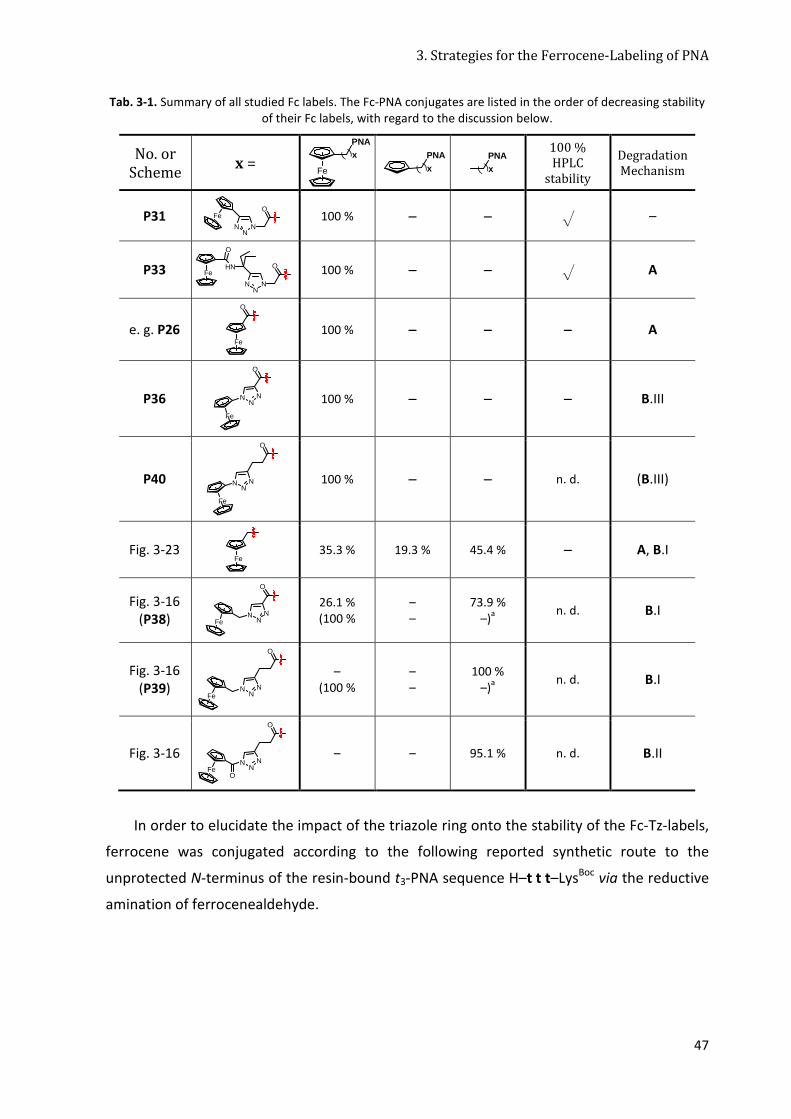
3. Strategies for the Ferrocene-Labeling of PNA
47
Tab. 3-1. Summary of all studied Fc labels. The Fc-PNA conjugates are listed in the order of decreasing stability of their Fc labels, with regard to the discussion below.
No. or Scheme
x =
100 % HPLC
stability
Degradation Mechanism
P31
100 % – – √ –
P33
100 % – – √ A
e. g. P26
100 % – – – A
P36
100 % – – – B.III
P40
100 % – – n. d. (B.III)
Fig. 3-23
35.3 % 19.3 % 45.4 % – A, B.I
Fig. 3-16 (P38)
26.1 % (100 %
– –
73.9 % –)a n. d. B.I
Fig. 3-16 (P39)
– (100 %
– –
100 % –)a n. d. B.I
Fig. 3-16
– – 95.1 % n. d. B.II
In order to elucidate the impact of the triazole ring onto the stability of the Fc-Tz-labels,
ferrocene was conjugated according to the following reported synthetic route to the
unprotected N-terminus of the resin-bound t3-PNA sequence H–t t t–LysBoc via the reductive
amination of ferrocenealdehyde.
Fe
PNA
( )x PNA
( )xPNA
( )x
NN
N
FeO
NN
N
OHN
O
Fe
O
Fe
O
NN
N
Fe
NN
N
O
Fe
Fe
O
NN
NFe
NN
NFe
O
NN
N
OFe
O

3. Strategies for the Ferrocene-Labeling of PNA
48
Fig. 3-23. N-terminal Fc conjugation via the reductive amination of ferrocene aldehyde.
ESI-MS of the crude product mixture obtained after cleavage from the resin with
TFA/TIS/phenol reveals no starting material (≙ acetylated analog of the starting material)
and besides the expected product (35 %) both of the discussed decomposition products with
the product of mechanism B.I forming the base peak (45 %) and a deficit of the product of
mechanism A (19 %). With this, a lower chemical stability than that of amide-bound Fc
moieties like in P26 is exhibited, wherein the α-positioned carbonyl group impedes a
degradation according to mechanism B.I. P38 reveals in contrast a lower stability than the
expected product of Fig. 3-23. Since P38 also reveals an α-positioned CH2 group but the
triazole ring in β position, the diminished stability is attributed to the increased tendency for
protonation of the electron rich triazole ring in contrast to the β-positioned secondary
amine, which requires being protonated in P38 for a decomposition according to mechanism
B.I. With this, the structural requirements for decomposition mechanism B.I as well as the
impact of the triazole ring therefore are proven. Tab. 3-1 furthermore reveals a larger
stability of P38 compared to P39, since solely the PNA degradation product could be
detected after TFA cleavage for the latter, whereas after cleavage of P38 the Fc-containing
product could be detected at least fractionally (26.1 %) (referring to Fig. 3-16). The increased
stability of P38 is ascribed to the electron withdrawing carbonyl group in α-position to the
triazole ring, which reduces electron density at the triazole ring and disfavors the
protonation step in mechanism B.I. According to this, the products of the inverse
alkyne/azide cycloaddition, which generally exhibit Fc moieties directly or indirectly bound
to a nitrogen atom of the triazole ring, are sensitive to a degradation according to
mechanism B.I, B.II or B.III. The products of the regular azide/alkyne cycloaddition do not
fulfill the structural requirements of either mechanism B.I or B.II (Fc is directly or indirectly
bound to a carbon atom of the triazole ring) and reveal larger stabilities, even than the
amide-bound Fc moiety of e. g. P26.
tH - t t t LysBoc
a) reductive amination NaBH3CN, DMF, (AcOH) 20 h, a.t.b) Capping acetic anhydride/DMFc) Cleavage TFA/TIS/phenol
O
Fe
H
t t t LysNH2Fe

3. Strategies for the Ferrocene-Labeling of PNA
49
3.6 Conclusion
As two possible new key reactions for the solid-phase conjugation of Fc derivatives to
internal or N-terminal positions of PNA oligomers, the Pd0 catalyzed Sonogashira cross-
coupling between terminal alkynes and iodo derivatives was studied as well as the [3+2]-
azide/alkyne cycloaddition (click chemistry) between terminal alkynes and azido derivatives.
The synthesis of an N-terminally Fmoc protected 5-iodouracil PNA monomer, as an iodo
derivative of the standard PNA monomers t / u, succeeded in five steps and yielded a
monomer of excellent purity, which could be easily incorporated into standard SPPS in an
analogous manner to the standard PNA monomers. With this, an insertion of the iodo
functional group at optional internal (and terminal) PNA strand positions is facilitated. The
solid-phase Sonogashira cross coupling of alkyne functionalized ferrocene derivatives to the
iodo functionalized PNA oligomers however did not protrude as a reliable key reaction for
the conjugation of ferrocene, since besides a low extent of conversion furthermore
degradation of the Fc label as well as the PNA oligomer was observed. Therefore an
optimization of the reaction conditions and further studies of this key reaction were
discontinued.
The [2+3] azide/alkyne cycloaddition in contrast, revealed to be a facile, reliable and
high-yielding key reaction for the conjugation of certain Fc derivatives to the PNA N-
terminus. Thereby, this key reaction revealed to be sufficiently chemoselective, to nearly
quantitatively proceed equally well at the solid phase as well as at dissolved PNA oligomers.
Altogether, a small library of six Fc-Tz-PNA conjugates was synthesized and comprehensively
characterized, revealing six new N-terminal Fc labels. With this, the [2+3]-azide/alkyne
cycloaddition was demonstrated to be a versatile key reaction, which facilitates the
conjugation of various Fc derivatives to PNA oligomers. The azide or alkyne pre-
functionalization of the PNA oligomers could be performed at the solid phase in a facile and
high-yielding peptide coupling reaction with the respective azide or alkyne carboxylic acid
derivatives. The coupling reactions succeeded under conditions analogous to those of the
standard amino acids coupling, hence offering the possibility for automation. With this, the
PNA pre-functionalization, as an additional step within this labeling strategy compared to
the classical route, is sufficiently facile to render the total labeling strategy competitive.
Although the inverse arrangement of the cycloaddition (azido ferrocene derivative + alkynyl
functionalized PNA) bears the synthetic advantage of a decreased probability of side
reactions, the regular arrangement (alkynyl ferrocene derivative + azide functionalized PNA)
yields Fc-Tz labels, which exhibit a significantly larger stability than those generated by the

3. Strategies for the Ferrocene-Labeling of PNA
50
inverse mode, since possible degradation reactions are impeded. Thereby, the two Fc-Tz
labels of PNA conjugates P31 and P33, resulting from the regular cycloaddition, revealed a
large stability towards TFA cleavage, mass spectrometry, HPLC, storage and furthermore
electrochemical treatment, which was even improved compared to the classical amide-
bound Fc labels.

4. Synthesis of Ferrocene-Conjugated PNA Oligomers
51
4. Synthesis of Ferrocene-Conjugated PNA Oligomers
4.1 Objective and Choice of Target Sequences
This section deals with the solid-phase synthesis and characterization of different Fc-
PNA and Fc-Tz-PNA oligomers/conjugates, which were designed for an application as the
DNA capture probes in the following interfacial and biosensing studies of Fc-PNA modified
gold surfaces, which will be presented in section 6. The choice of PNA target sequences was
guided by the future aim, to facilitate an identification of bacterial stems with the designed
Fc-PNA biosensor. The genetic information of a prokaryotic cell is encoded in the DNA, which
is localized in the cytoplasm, but is furthermore found in the form of ribosomal RNA (rRNA),
which is encoded by ribosomal DNA (rDNA) and located in the ribosomes. Whereas one
prokaryotic cell exhibits one copy of DNA, ~10.000 copies of rRNA are present, which
renders rRNA a suitable target, since no amplification via polymerase chain reaction (PCR) is
required after isolation of the rRNA. Prokaryotic cells reveal three types of rRNA, namely
32S, 16S and 5S rRNA, which differ in their size and shape and can be isolated as total RNA
and further purified to their components. Thereof the 16S rRNA was chosen as the primary
gene target, since it provides with a size of ~1500 nt a selection of possible target regions
with varying degrees of gene conservation, however reduces the overall number of genes so
that a choice of short and unique target sequences within the 16S rRNA appears feasible.
With 412 = 1.7 x 10⁷ nucleobase permutations within a 12-mer target sequence, the number
of nucleobases of the 16S rRNA is significantly exceeded, which renders a 12 nt long
sequence already sufficiently long to facilitate the targeting of a unique sequence.

4. Synthesis of Ferrocene-Conjugated PNA Oligomers
52
Fig. 4-1. Secondary structure of 16S rRNA of E. coli (black: double strand, white: single-stranded loops).
The following three 12 nt long target sequences (Tab. 4-1) were selected in
collaboration with the group of Prof. Dr. Narberhaus (Ruhr-Universität Bochum, Lehrstuhl
Biologie der Mikroorganismen) from the 16S rRNA of the three bacterial genera Escherichia
(Escherichia (E.) coli), Pseudomonas (Pseudomonas (P.) aeruginosa) and Salmonella
(Salmonella (S.) enterica). These target sequences are located in analogous sections in the
central domain of the 16S rRNA (654 nt – 666 nt of E. coli, indicated in Fig. 4-1), which are
sufficiently conserved to be characteristic for the respective genus without revealing genetic
diversity for subspecies, however the gene regions requires not to be highly-conserved, to
still reveal differences between the three genera. The chosen sequences of E. coli and S.
enterica only differ by one internal nucleobase, which is due to the fact that those both
genera belong to the family Enterobacteriaceae. Pseudomonas are less related to the other
two genera (family: Pseudomonadaceae) with a separation of this family brand to an earlier
point of time in the phylogenetic tree, and the chosen sequence differs by an internal
nucleobase triplet from the other two sequences. Concluding, the chosen sequences are
5’ (1)
3’ (1542)

4. Synthesis of Ferrocene-Conjugated PNA Oligomers
53
unique for the respective genus, however exclusively within the 16S rRNAs and this choice of
bacterial genera.
Tab. 4-1. Alignment (Section 630 nt – 690 nt) of bacterial 16S rRNA of E. coli K12, S. enterica and P. aeruginosa.
16S rRNA Sequences (5’�3’)
nt‡ 630 640 650 660 670 680
E. coli ACUGCAUCUG AUACUGGCAA GCUU GAGUCU CGUAGA GGGG GGUAGAAUUC CAGGUGUAGC
S. enterica ACUGCAUUCS AAACUGGCAR GCUU GAGUCU UGUAGA GGGG GGUAGAAUUC CACGUGUAGC
P. aeruginosa ACUGCAUCCN AAACUACUGA GCUA GAGUAC GGUAGA GGGU GGUGGAAUUU CCUGUGUAGC
congruence† * * * * * * * ** * * * * * * * * * * * * * * * * * * * * * * * * * * * * * * * * * * * * * * * * * * * * * * * * * * * *
† Identical nucleotides are marked by an asterisk. ‡ numbering refers to E. coli.
The corresponding PNA sequences (Tab. 4-2), which are complementary to the chosen
three 16S rRNA sequences, will be synthesized in this work as the DNA/RNA recognition
element of the Fc-PNA capture probes and will be embedded in different probe designs. The
sequences do not reveal self-complementarity, so that self-dimerization as well as hair-pin
formation is excluded. The GC content, which determines the duplex stability, exhibits to be
(G+C) = 42 % or 50 %, respectively. The sequence length as well as the ratio of purine to
pyrimidine nucleobases determines the solubility of PNA oligomers in aqueous solution as
well as the tendency to form aggregates. Purine-rich PNA sequences with a purine content
of (G+A) > 60 % are reported to tend to aggregate and reveal a diminished solubility in
aqueous media.111
Tab. 4-2. PNA target sequences.
Bacterial target
PNA Sequences (N�C) G+C / %
G+A / %
E. coli t c t a c g a g a c t c 50 42
S. enterica t c t a c a a g a c t c 42 42
P. aeruginosa t c t a c c g t a c t c 50 24
4.2 Solid-Phase PNA Synthesis
The synthesis of PNA can be carried out according to standard protocols for Fmoc or Boc
solid-phase synthesis, which could be adopted from peptide synthesis due to the
(pseudo)peptidic structure of the PNA backbone.233, 247 Thereby, the PNA strand is
successively constructed at a polymer resin as solid support, by prolongation of the growing

4. Synthesis of Ferrocene-Conjugated PNA Oligomers
54
chain from the C- to the N-terminus, attaching one side-chain protected PNA monomer per
coupling cycle (see Fig. 4-4), without the need of a stereoselective synthesis due to the
achiral PNA. The Fmoc protecting group strategy (Fmoc(Bhoc) protected monomers, acid
labile resin linker) bears advantages over the Boc protecting group strategy (Boc(Z)
protected monomers, base or HF labile resin linker) due to milder conditions, efficiency,
safety and orthogonality,233 however the Boc strategy benefits from lower costs and less
aggregation. Generally, the synthesis of PNA faces special challenges due to the electrically
neutral PNA backbone, which facilitates PNA aggregation, and furthermore the nucleobases,
which present more bulky side chains compared to the standard amino acids and evoke with
this a reduced PNA monomer coupling efficiency.
All PNA oligomers and conjugates were synthesized from the following commercially
available PNA monomer building blocks by manual Fmoc solid-phase PNA synthesis. The N-
terminus of the PNA monomers is protected with the semi-permanent, base labile
protecting group Fmoc, whereas the primary amino groups of the nucleobases A, C and G
carry the permanent, acid labile protecting group Bhoc.
Fig. 4-2. PNA monomer building blocks.
NH
N
O
OH
O
O
O
N
HN
O
O
Thymine PNA monomerFmoc-T-OH
NH
N
O
OH
O
O
ON
N
NH
O
O
O
NH
N
O
OH
O
O
O
N
NN
N
NHO
O
NH
N
O
OH
O
O
O
N
NN
N
OH
NH
O
O
Cytosine PNA monomerFmoc-C(Bhoc)-OH
Guanine PNA monomerFmoc-G(Bhoc)-OH
Adenine PNA monomerFmoc-A(Bhoc)-OH

4. Synthesis of Ferrocene-Conjugated PNA Oligomers
55
The PNA sequences are assembled at polystyrene resins as solid support, which were
chosen to provide a low loading capacity, in order to decrease the probability of
intermolecular interactions between the strands and consequently the self-aggregation of
the electrically neutral PNA strands. Therefore, TentaGel® resins from Rapp Polymer, Inc.
(Tübingen, Germany) were used, which are grafted copolymers, with a low cross-linked
polystyrene matrix with grafted polyethylene glycol chains, to which the respective
functional group is tethered (Fig. 4-3). These TentaGel® resins provide an increased swelling
volume and a low loading capacity, optimized for the synthesis of difficult and long
sequences.248
Fig. 4-3. Architecture of TentaGel® R PBH and RAM resins.
For the synthesis of the trimer PNA model sequences in section 3, the lysine preloaded
resin TentaGel® R RAM–LysBoc Fmoc was chosen, which provides a low loading of 0.2 mmol/g
and exposes a peptide amide at the PNA C-terminus after cleavage of the completed
sequence with 60 – 95 % of TFA. The resin TentaGel® R PHB–CysTrt Fmoc (0.18 mmol/g) was
used as the solid support for the synthesis of all the 12-mer PNA capture probes for
biosensor applications, described in this section, which yields a free peptide at the C-
terminus of the synthesized PNA oligomer after cleavage from the resin with 50 – 95 % of
TFA. The preloaded cysteine amino acid provides the thiol function, which is required for the
later immobilization of the PNA capture probes to gold surfaces.
CH2
HCO
OO
O
n
X
polystyrenematrix
polyethylene glycolspacer
functionalgroup
TentaGel®:
TentaGel® R PHB TentaGel® R RAM
X =O
OH
O
OHN
Fmoc
OCH3
OCH3

4. Synthesis of Ferrocene-Conjugated PNA Oligomers
56
Fig. 4-4. Coupling cycle for the SPPS of an n-mer PNA oligomer/conjugate (nucleobase Nb = A, T, G or C).
Fig. 4-4 shows the coupling cycle for the solid phase synthesis of an n-mer PNA oligomer
or conjugate. In order to couple a PNA monomer of the general form Fmoc-PNA-OH (Nb = A,
T, G or C nucleobase) to the unprotected primary amino group at the N-terminus of a resin-
bound sequence, the respective monomer requires the preactivation of its carboxylic acid
function with a coupling agent, which facilitates the nucleophilic attack of the primary amino
group. The generally lower coupling efficiency of PNA monomers compared to amino acids is
addressed by using the azabenzotriazole salt HATU, which is one of the most efficient
commercially available coupling reagents.249 The enhanced coupling efficiency and selectivity
of HATU compared to its analogs TBTU or HBTU is attributed to a second aza-coordination
position in ε-position to the formed active ester.249 The coupling efficiency is furthermore
dependent on the sequence of the PNA oligomer, whereby the coupling of purine bases
generally bears more difficulties than the coupling of pyrimidine bases, which impedes
especially the synthesis of sequences with adjacent purine bases.250 The success of a
coupling reaction is monitored by the Kaiser test for primary amino groups, which had not
undergone a coupling reaction but can be subsequently acetylated with acetic anhydride in a
capping reaction, in order to facilitate a HPLC separation of the resulting truncated
sequences. Subsequent to the n-fold repetition of coupling and Fmoc-deprotection (20 %
piperidine (v/v) in DMF) according to the coupling cycle in Fig. 4-4, the completed n-mer PNA
sequence can be terminated by the coupling of various carboxylic acid derivatives to its
unprotected N-terminus. The termination with an azide or alkyne carboxylic acid derivative
provided a functional group for a further N-terminal ferrocene modification (section 3.4,
4.4), whereas the PNA termination with ferrocenecarboxylic acid (section 4.3) or acetic
anhydride (section 4.3.1) completed the respective PNA conjugate. The cleavage was
generally performed with a mixture of TFA/TIS/phenol = 85:5:10, whereby TIS acted as a
carbocation scavenger and the addition of the antioxidant phenol furthermore impeded a
ON
NH
O
H
Nb
ON
NH
ONb
O
O
couplingFmoc PNA-OH
HATU, DMF2,6-lutidine, DIPEA
termination
OH
O
X
cleavage
TFA/TIS/phenol
ON
NH
ONb
X
O
O
O
cappingAc2O, DIPEA
DMF
deprotection
piperidinDMF
Kaiser test
n=n+1
n n

4. Synthesis of Ferrocene-Conjugated PNA Oligomers
57
possible oxidation of the attached Fc moiety upon the TFA acid cleavage conditions.251, 252
The cleaved crude PNA oligomers and conjugates were purified by preparative HPLC.253 The
HPLC pure products (analyzed by analytical HPLC) were characterized by MALDI-ToF and ESI
mass spectrometry, whereby MALDI-ToF MS provides a low extent of fragmentation,
whereas ESI-MS provides a high mass accuracy.254
4.3 Synthesis of Fc-PNA Bioconjugates
The Fc-PNA conjugates described in this section exhibit the general structure shown in
Fig. 4-5. The solid-phase PNA synthesis was performed according to the general procedure
and the coupling cycle shown in Fig. 4-4. The ferrocene label was generally attached to the
PNA N-terminus via the classical key reaction shown in Fig. 1-10, acting as the sequence
terminating step in Fig. 4-4, to yield the Fc-PNA conjugates with an amide-bound ferrocene
label. While the PNA sequences vary, all conjugates exhibit the same Lys–Ahx–Cys peptidic
linker at their C-terminus, whose constitution was developed by A. Maurer.252 A cysteine
residue located at its terminal position provides a thiol-function for the later chemisorption
of the Fc-PNA conjugate to gold surfaces via Au-S linkage. ε-aminohexanoic acid is
introduced as a spacer molecule between the cysteine residue and the PNA sequence, in
order to enlarge the distance between the gold surface and the PNA recognition unit and to
thereby facilitate the hybridization process of the surface-confined Fc-PNA capture probe
with a provided DNA analyte. Therefore, the cysteine preloaded resin TentaGel® R PHB–
CysTrt Fmoc is used for the synthesis of all PNA conjugates in this section. An additional lysine
is introduced in order to enhance the solubility of the Fc-PNA bioconjugates in aqueous
solutions and to diminish PNA self-aggregation, by carrying a positive charge at the free
primary amino group at pH 7.92
Fig. 4-5. Target structure of Fc-PNA conjugates.
Fe
O
NH
N
ONb
NH
NNH
NNH
HN
NH
NH2
O
NbO
OO
Nb
O
O
NH2
OSH
On
PNAFc Linker
N-terminus C-terminus

4. Synthesis of Ferrocene-Conjugated PNA Oligomers
58
4.3.1 Set 1 – Fc-PNA Bioconjugates with Bacterial Target Sequences
The first set (set 1) of three Fc-PNA capture probes is shown in Tab. 4-3. The capture
probes P24, P25 and P26 comprise as recognition elements the three bacterial PNA target
sequences, which are embedded in the general structure shown in Fig. 4-5. With this, these
Fc-PNA conjugates present the basic Fc labeled capture probes for a possible detection of
the bacterial target sequences of Tab. 4-1.
Tab. 4-3. Set 1 – Fc-PNA conjugates with 12-mer bacterial PNA sequences.
No. PNA Capture Probes (N�C)
P24-E.coli Fc - t c t a c g a g a c t c Lys Ahx CysOH
P26-Salm Fc - t c t a c a a g a c t c Lys Ahx CysOH
P25-Pseu Fc - t c t a c c g t a c t c Lys Ahx CysOH
The solid-phase synthesis of P24, P25 and P26 was performed according to the general
procedures and coupling cycle shown in Fig. 4-4, by performing the N-terminal coupling of
ferrocenecarboxylic acid (Fig. 1-10) as the termination step. Cleavage from the resin with
TFA/TIS/phenol (85:5:10) yielded the Fc-PNA conjugates with a good yield (≳ 70 %) and
already a good purity of (≳ 90 %), which could be increased to 100 % by only one preparative
HPLC run. Analytical HPLC of the purified Fc-PNA conjugates revealed retention times of tR =
12.4 ± 0.2 min. MALDI-ToF MS of the purified as well as the crude compounds exclusively
exhibited the [M+H]+ peak of the respective Fc-PNA conjugate, without showing any peaks
corresponding to truncated sequence fragments, which indicates that all conversions to the
target compounds had proceeded nearly quantitatively. This was confirmed by ESI-MS,
which exclusively revealed mass peaks correlated to the respective Fc-PNA conjugate, by
generally exhibiting the respective [M+4H]4+ peak as the base peak. This tendency to form
multi-charged species in ESI-MS is characteristic for this ionization technique and frequently
observed in the ESI-MS analysis of large biomolecules.255

4. Synthesis of Ferrocene-Conjugated PNA Oligomers
59
Fig. 4-6. MALDI-ToF MS of the Fc-PNA conjugates of set 1 and corresponding HPLC chromatograms (* signals related to impurities at the column material and not related to the respective sample).
Although the Fc-PNA conjugates could be purified by HPLC, MALDI-ToF MS of the
purified batches revealed after less than one week of storage at -80 °C under argon a second
mass peak in varying intensities, which could be related to [M-CpFe+H]+ (ratio [M-CpFe+H]+ :
[M+H]+ = 9.7 : 1 to 0.1 : 1). This indicates that the Fc label of the conjugates undergoes a
decomposition reaction to varying extents with the loss of CpFe (M = 120.9 g/mol), for which
a mechanism comparable to that shown in Fig. 3-21 is suggested. Since the [M-CpFe+H]+
peak was never detected of any crude Fc-PNA conjugate (not even after two years of storage
at -20 °C without inert gas) nor of the purified conjugates directly after the HPLC purification,
it is considered that upon HPLC purification the Fc0 oxidation is promoted and a nucleophilic
environment (solvent: water/ACN) facilitates the Fc+ decomposition according to Fig. 3-21.245
1500 2000 2500 3000 3500 4000 4500 50000
100
200
300
400
500
600
700
Inte
ns.
[M+H]+
3772.9
1500 2000 2500 3000 3500 4000 4500 50000
50
100
150
200
250
300
Inte
ns.
[M+H]+
3790.3
[M+2H]2+
1896.5
1500 2000 2500 3000 3500 4000 4500 50000
10
20
30
40
50
60
70
80
Inte
ns.
[M+H]+
3738.6
P24
P25
P26
0 5 10 15 20 25 30
0
20
40
60
80
100
Abs
. / m
Au
t / min
tR = 12.4 min
* *
0 5 10 15 20 25 300.0
0.1
0.2
0.3
0.4
0.5
Abs
. /A
u
tR = 12.5 min
t / min
5 10 15 20 25 30
100
75
50
25
0
Ab
s. / m
Au
0
tR = 12.5 min
* *
t / min
m / z
m / z
m / z

4. Synthesis of Ferrocene-Conjugated PNA Oligomers
60
Fig. 4-7. MALDI-ToF MS of P24 before (black) and after HPLC purification (red).
4.3.2 Set 2 – Ac-PNA Oligomers with Bacterial Target Sequences
A second set (set 2), consisting of the non-redoxactive analogs P12, P13 and P14 of the
Fc-PNA capture probes of set 1 were synthesized, wherein the PNA N-terminus carries an
acetyl group instead of a ferrocene moiety. Set 2 is mainly required as a non-metal
containing control in synthesis and characterization. Furthermore, set 2 serves as control
sequences for UV melting experiments, wherein the impact of different N-terminal labels
onto the duplex stability was studied.
Tab. 4-4. Set 2 – N-terminally acetylated analogs of the Fc-PNA conjugates of set 1.
No. PNA Capture Probes (N�C)
P12-E.coli Ac - t c t a c g a g a c t c Lys Ahx CysOH
P14-Salm Ac - t c t a c a a g a c t c Lys Ahx CysOH
P13-Pseu Ac - t c t a c c g t a c t c Lys Ahx CysOH
The solid-phase synthesis of P12, P13 and P14 was performed according to the general
procedures and the coupling cycle shown in Fig. 4-4, whereby the sequence termination step
was performed by the coupling of acetic anhydride to the deprotected PNA N-terminus.
HPLC of the crude compounds revealed a better purity than the crude Fc-PNA conjugates,
which was improved to 100 % after one preparative HPLC run. MALDI-ToF MS revealed
exclusively the respective [M+H]+ peak, whereas ESI-MS exhibits a series of multi-charged
species correlated to the respective Ac-PNA oligomer, with the respective [M+3H]3+ or
[M+4H]4+ peak as the base peak. The tendency to form the 4-fold charged [M+4H]4+ peaks
was found to be slightly lower for the Ac-PNA oligomers compared to the corresponding Fc-
PNA analogs, in favor of the 3-fold charged [M+3H]3+ species. Analytical HPLC of the three
2000 2500 3000 3500 4000 4500 50000.0
0.2
0.4
0.6
0.8
1.0
norm
. int
ens.
m / z
P24 crudeP24 after prep. HPLC
[M+H]+
3789.6
[M-CpFe+H]+
3669.6
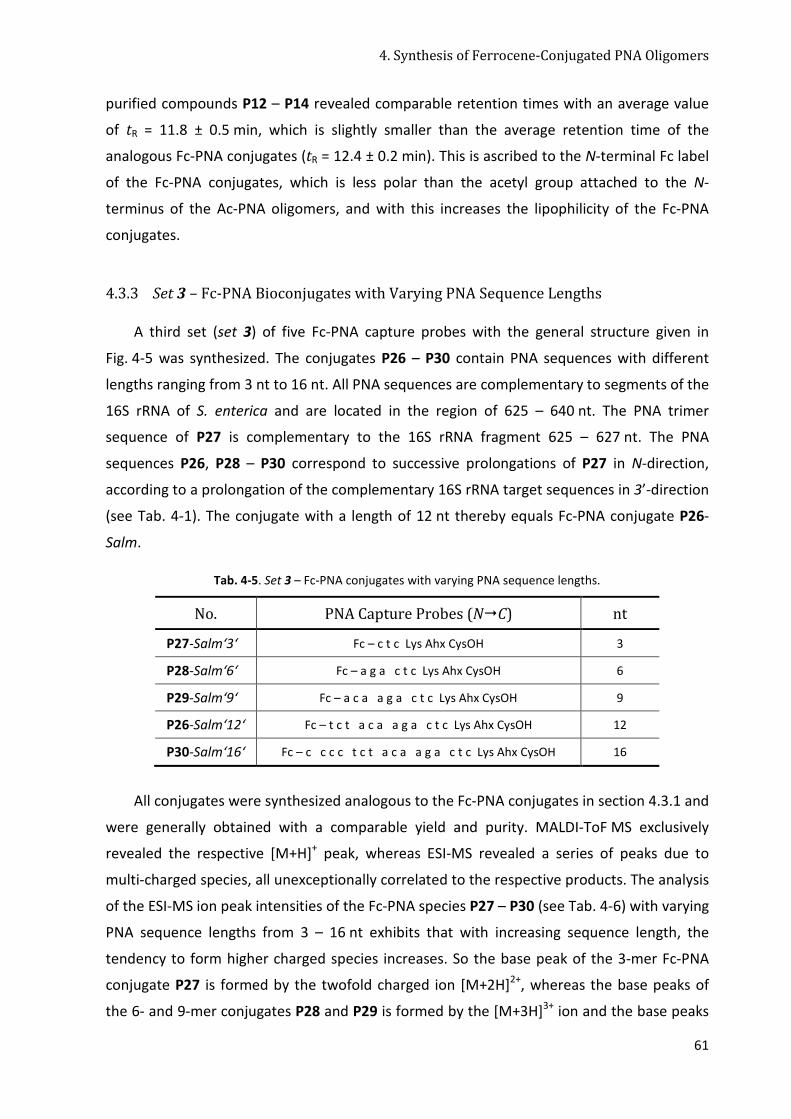
4. Synthesis of Ferrocene-Conjugated PNA Oligomers
61
purified compounds P12 – P14 revealed comparable retention times with an average value
of tR = 11.8 ± 0.5 min, which is slightly smaller than the average retention time of the
analogous Fc-PNA conjugates (tR = 12.4 ± 0.2 min). This is ascribed to the N-terminal Fc label
of the Fc-PNA conjugates, which is less polar than the acetyl group attached to the N-
terminus of the Ac-PNA oligomers, and with this increases the lipophilicity of the Fc-PNA
conjugates.
4.3.3 Set 3 – Fc-PNA Bioconjugates with Varying PNA Sequence Lengths
A third set (set 3) of five Fc-PNA capture probes with the general structure given in
Fig. 4-5 was synthesized. The conjugates P26 – P30 contain PNA sequences with different
lengths ranging from 3 nt to 16 nt. All PNA sequences are complementary to segments of the
16S rRNA of S. enterica and are located in the region of 625 – 640 nt. The PNA trimer
sequence of P27 is complementary to the 16S rRNA fragment 625 – 627 nt. The PNA
sequences P26, P28 – P30 correspond to successive prolongations of P27 in N-direction,
according to a prolongation of the complementary 16S rRNA target sequences in 3’-direction
(see Tab. 4-1). The conjugate with a length of 12 nt thereby equals Fc-PNA conjugate P26-
Salm.
Tab. 4-5. Set 3 – Fc-PNA conjugates with varying PNA sequence lengths.
No. PNA Capture Probes (N�C) nt
P27-Salm‘3‘ Fc – c t c Lys Ahx CysOH 3
P28-Salm‘6‘ Fc – a g a c t c Lys Ahx CysOH 6
P29-Salm‘9‘ Fc – a c a a g a c t c Lys Ahx CysOH 9
P26-Salm‘12‘ Fc – t c t a c a a g a c t c Lys Ahx CysOH 12
P30-Salm‘16‘ Fc – c c c c t c t a c a a g a c t c Lys Ahx CysOH 16
All conjugates were synthesized analogous to the Fc-PNA conjugates in section 4.3.1 and
were generally obtained with a comparable yield and purity. MALDI-ToF MS exclusively
revealed the respective [M+H]+ peak, whereas ESI-MS revealed a series of peaks due to
multi-charged species, all unexceptionally correlated to the respective products. The analysis
of the ESI-MS ion peak intensities of the Fc-PNA species P27 – P30 (see Tab. 4-6) with varying
PNA sequence lengths from 3 – 16 nt exhibits that with increasing sequence length, the
tendency to form higher charged species increases. So the base peak of the 3-mer Fc-PNA
conjugate P27 is formed by the twofold charged ion [M+2H]2+, whereas the base peaks of
the 6- and 9-mer conjugates P28 and P29 is formed by the [M+3H]3+ ion and the base peaks

4. Synthesis of Ferrocene-Conjugated PNA Oligomers
62
of the 12- and 16-mer conjugate P26 and P30 is formed by the 4-fold charged [M+4H]4+ ion.
The analysis of all measured mass peaks underlines this tendency by showing decreasing
peak intensities of the lower charged species and increasing peak intensities for the higher
charged species with growing PNA sequence length. Thereby, overall no mass peaks could be
detected due to a species, which was higher than 5-fold charged.
Tab. 4-6. ESI-MS analysis of Fc-PNA conjugates P27 – P30.
Fc-PNA Conjugate
lnt
/ nt [M+H]+
/ % †
[M+2H]2+ / % †
[M+3H]3+ / % †
[M+4H]4+ / % †
[M+5H]5+ / % †
P27 3 5.5 100 – – –
P28 6 4.0 52.0 100 12.4 –
P29 9 – 13.2 100 12.6 0.5
P26 12 – 11.8 47.1 100 6.5
P30 16 – – 27.8 100 6.8
† Peak intensities (in %, relative to the respective base peak) of all detected differently charged fragment ions.
4.4 Synthesis of Fc-Tz-PNA Bioconjugates
In this section, the synthesis and characterization of Fc-Tz-PNA conjugates is described,
which exhibit the general structure shown in Fig. 4-8. Thereby, three of the new Fc-Tz labels,
which were described in section 3.4 and are analog to Fc-Tz labels of the trimer t3–PNA
model sequences P31, P33 and P36, were attached to the bacterial 12-mer PNA target
sequences shown in Tab. 4-2. The Fc-labeling was performed by converting the respective
resin-bound N-terminal azide PNA oligomers P17-Pseu or P18–E.coli or alkyne functionalized
PNA oligomer P20-Salm with alkyne or azide ferrocene derivatives in azide/alkyne
cycloadditions using conditions analogous to those described in section 3.4 (Fig. 3-13 and
Fig. 3-16). The C-terminal peptidic linker of all Fc-Tz-PNA conjugates is thereby identical to
that of the Fc-PNA conjugates shown in Fig. 4-5 and all conjugates were synthesized at the
cysteine preloaded resin TentaGel® R PHB–CysTrt Fmoc.

4. Synthesis of Ferrocene-Conjugated PNA Oligomers
63
Fig. 4-8. General structure of the Fc-Tz-PNA capture probes of set 5 (Tab. 4-8).
4.4.1 Set 4 – Azide- and Alkyne Functionalized PNA Precursors of Set 5
The solid-phase PNA synthesis of the N-terminally azide functionalized PNA precursors
P17-Pseu or P18-E.coli as well as the alkyne functionalized PNA precursor P20-Salm of the
Fc-Tz-PNA conjugates of set 5 was performed according to the general procedure and the
coupling cycle shown in Fig. 4-4, whereby the sequence terminating step persisted in the N-
terminal peptide coupling with azido acetic acid or propynoic acid, analogous to the
synthesis of the t3-PNA model compounds P16 and P19, respectively (Fig. 3-11). MALDI-ToF
MS characterization of the cleaved products exclusively revealed the respective [M+H]+ mass
peaks, indicating that the N-terminal azide and alkyne functionalization proceeded equally
well at the mixed nucleobase, 12-mer PNA sequences.
Tab. 4-7. Set 4 – N-terminally azide (Az-) and alkyne (HCC-) functionalized PNA precursors of set 5.
No. PNA Capture Probes (N�C)
P18-E.coli Az - t c t a c g a g a c t c Lys Ahx CysOH
P17-Pseu Az - t c t a c c g t a c t c Lys Ahx CysOH
P20-Salm HCC - t c t a c a a g a c t c Lys Ahx CysOH
O
NH
N
ONb
NH
NNH
NNH
HN
NH
NH2
O
NbO
OO
Nb
O
O
NH2
OSH
On
PNAFc Linker
N-terminus C-terminus
NN N
Fe
P32-Pseu
R
R=N
NN
Fe
P37-Salm
NN N
NH
O
Fe
P34-E.ColiP35-Pseu

4. Synthesis of Ferrocene-Conjugated PNA Oligomers
64
4.4.2 Set 5 – Fc-Tz-PNA Bioconjugates with Bacterial Target Sequences
Tab. 4-8 shows the Fc-Tz-PNA conjugates of set 5, which were all synthesized via the
azide/alkyne cycloaddition at the resin-bound N-terminally azide functionalized precursor
‘P17‘-Pseu or ‘P18‘-E.coli or the alkyne functionalized precursor ‘P20’-Salm.
Tab. 4-8. Set 5 – Fc-Tz-PNA conjugates with 12-mer bacterial PNA sequences.
No. PNA Capture Probes (N�C)
P34-E.coli Fc(DEPA)-Tz(MeCO) - t c t a c g a g a c t c Lys Ahx CysOH
P35-Pseu Fc(DEPA)-Tz(MeCO) - t c t a c c g t a c t c Lys Ahx CysOH
P32-Pseu Fc-Tz(MeCO) - t c t a c c g t a c t c Lys Ahx CysOH
P37-Salm Fc-Tz(CO) - t c t a c a a g a c t c Lys Ahx CysOH
The resin-bound azide functionalized precursors ‘P17‘-Pseu or ‘P18‘-E.coli were
converted in a regular azide/alkyne cycloaddition according to the synthetic scheme shown
in Fig. 3-13 with DEPA-ferrocene under analogous reaction conditions, to yield the expected
products P32-Pseu, P35-Pseu or P34-E.coli, respectively. The resin-bound alkyne
functionalized precursor ‘P20’-Salm was converted in an inverse azide/alkyne cycloaddition
with azidoferrocene according to the synthetic scheme shown in Fig. 3-16, to yield the
expected product P37-Salm.
Analytical HPLC of the crude Fc-Tz-PNA conjugates, which were obtained after cleavage
from the resin with TFA/TIS/phenol (85:5:10), revealed already good purities, comparable to
the purities of the crude Fc-PNA conjugates. MALDI-ToF MS of the crude products exclusively
exhibited peaks corresponding to the expected products, and no peaks corresponding to
truncated sequences, side products or starting materials were detected. This indicates that
the regular and the inverse azide/alkyne cycloaddition had proceeded at the resin-bound
mixed nucleobase, 12-mer PNA sequences equally well like at the t3-PNA model compounds
and yields products of comparable purity like the peptide chemistry based Fc labeling
strategy. The HPLC purity could be further improved after one preparative HPLC run to
100 % and MALDI-ToF MS of the pure compounds exhibited exclusively the respective
[M+H]+ mass peak. HPLC chromatograms of the purified Fc-Tz-PNA conjugates revealed
generally 1 – 2 min larger retention times (tR = 13.4 – 14.5 min) than the corresponding Fc-
PNA conjugates of the same PNA sequence. This increase in lipophilicity is ascribed to the
non-polar triazole ring as the additional structural element and reflects in a significantly
lower solubility of the triazole-containing Fc-Tz-PNA conjugates in aqueous solution.
However, a sufficient solubility was achieved in 1 : 1 (v/v) mixtures of ACN/water. MALDI-

4. Synthesis of Ferrocene-Conjugated PNA Oligomers
65
ToF mass spectrometry of the crude products revealed besides the respective [M+H]+ mass
peak furthermore a peak of higher mass, corresponding to the respective copper adduct
[M+Cu]+ (crude spectrum of P34 exemplary shown in Fig. 4-9). A peak corresponding to
[M+Cu]+ was never detected in MS of any of the t3-PNA analogs of the set 5, whereas it was
always detected to varying extents (49 – 79 % of [M+H]+) in MALDI-ToF MS of all the crude
12-mer Fc-Tz-PNA conjugates, which was generally completely removed after HPLC
purification. MALDI-ToF MS of all the crude 12-mer Fc-Tz-PNA conjugates furthermore
revealed a significantly enhanced background noise than MS of the analogous crude t3-Fc-Tz-
PNA conjugates or the Fc-PNA conjugates of the same PNA sequence, which indicates a
larger content of salts. The incorporation of an additional washing step with ACN in the final
washing procedure improved the quality of MS of the crude products as well as it reduced
the intensity of the [M+Cu]+ peak. In analogy to the Fc-PNA conjugates, the Fc-Tz-PNA
conjugates also revealed in ESI-MS a series of multi-charged species, which all correlated to
the expected products. Besides the homo-nuclear species of the general form [M+nH]n+
furthermore a series of highly charged, dinuclear species of the general form [2M+nH]n+
were detected, which was never observed for the analogous t3-PNA model compounds, any
of the Fc-PNA conjugates nor the respective azide or alkyne functionalized PNA precursor
molecules. However, the formation of such cluster ions is frequently reported in ESI-MS
analysis of biomolecules.255 Thereby, the base peak was varying between the respective
[M+3H]3+, [M+4H]4+ and [M+5H]5+ peaks and the base peak within the dinuclear series was
either the respective [2M+7H]7+ or [2M+9H]9+ peak.

4. Synthesis of Ferrocene-Conjugated PNA Oligomers
66
Fig. 4-9. MALDI-ToF MS of the Fc-Tz-PNA conjugates of set 5 and corresponding HPLC chromatograms. HPLC
and MS were measured of the purified compounds except MALDI-ToF MS of P34.
4.5 Conclusion
In the previous section, the solid-phase synthesis, HPLC purification and comprehensive
characterization of five different sets of PNA conjugates was described. The Fc- labeled PNA
conjugates of sets 1, 3 and 5 are eligible for the use as capture probes in the following
biosensor studies (section 6). Sets 1 and 5 comprise the same three different PNA target
sequences derived from the bacterial genera E. coli, P. aeruginosa and S. enterica as the
fundamental capture probe sets for a later electrochemical differentiation of the three
bacterial genera, whereas set 1 exhibits identical Fc labels and, in contrast, every PNA
sequence of set 5 is labeled with one specific Fc-Tz label, resulting in three different Fc-Tz
0 5 10 15 20 25 300
20
40
60
80
100
Abs
. / m
Au
t / min
tR = 14.5 min
0 5 10 15 20 25 300
0.1
0.2
0.3
0.4
0.5
0.6
Abs
. /A
u
t / min
tR = 13.4 min
0 5 10 15 20 25 300
0.1
0.2
0.3
0.4
0.5
0.6
Abs
. /A
u
t / min
tR = 14.0 min
[M+H]+
3841.1
1500 2000 2500 3000 3500 4000 4500 50000
5
10
15
20
25
30
Inte
ns.
1500 2000 2500 3000 3500 4000 4500 50000
5
10
15
20
25
30
35
Inte
ns.
[M+H]+
3819.8
1500 2000 2500 3000 3500 4000 4500 50000
5
10
15
20
25
Inte
ns.
[M+H]+
3986.9
[M+Cu]+
4048.6
P37
P34
P32
m / z
m / z
m / z

4. Synthesis of Ferrocene-Conjugated PNA Oligomers
67
labels in total. Set 3 furthermore presents the basis for interfacial studies of a PNA length
dependency of the electrochemical response. All described products revealed already good
purities before HPLC purification and no peaks corresponding to truncated sequences, side
products or starting materials could be determined with MALDI-ToF MS of the crude
products. MALDI-ToF MS of the purified compounds generally exhibited the corresponding
[M+H]+ peak, whereas ESI-MS exhibited a series of multi-charged species, which all could be
related to the expected products. With this, the regular as well as the inverse azide/alkyne
cycloaddition revealed to be a convenient and selective key reaction for the solid-phase Fc-
Tz-labeling of mixed nucleobase, 12-mer PNA oligomers, fully comparable with the classical
Fc-labeling route via peptide coupling (Fig. 1-10) concerning product conversion, yield and
purity, however a presumably larger salt content impairs the MS analysis of the crude Fc-Tz-
PNA conjugates. This key reaction furthermore surmounts the classical route by facilitating
the introduction of a small library of different Fc labels to the PNA N-terminus, which were
moreover totally stable to the harsh PNA cleavage conditions.

5. UV Melting Studies
68
5. UV Melting Studies
5.1 Objective
The UV melting experiments of various PNA•DNA duplexes were undertaken, in order to
address two general questions. The experiments described in section 5.3 conduce to the
elucidation of the temperature dependency of the nucleic acids structural conformation
(helical/coil conformation), as a preparation for the later biosensor studies (section 6). The
knowledge about the actual strand conformation at the respective working temperature
(herein in general: T = 20 °C) is of fundamental significance for a clear interpretation of the
biosensor’s measuring response. With this, misinterpretations due to imperfect
hybridization events can be excluded, which is especially important for duplexes with an
internal mismatch position and in general for duplexes with minor melting temperatures.
Furthermore, a precise temperature controlled modulation between the single- and double-
stranded states is facilitated based on the UV determined temperature profile, which can be
exploited for denaturation/annealing studies. These UV melting studies will be directly
performed at Fc-PNA•DNA duplexes with the Fc-PNA conjugates described in section 4.3,
which will be used as DNA capture probes in the following biosensor studies and
furthermore exhibit all different PNA sequences used in this work. In contrast, the UV
melting studies described in section 5.4 were performed in order to study the impact of the
presented new N-terminal Fc labels (section 3.4) onto the thermodynamic stability of the
corresponding Fc-Tz-PNA•DNA duplexes. Therefore, the N-terminally acetylated PNA
oligomers (set 2, Tab. 4-4) are exploited as a non-metal containing reference. Moreover, the
studies on the triazole-containing duplexes are relevant for the dual-potential biosensor
presented in section 6.7.2.
5.2 UV Melting Curve Analysis
PNA forms stable duplexes with DNA, RNA or PNA, wherein the antiparallel strand
orientation is thermodynamically favored over a parallel strand orientation (∆TM = 1-2 °C/bp
between parallel and antiparallel duplexes).95 The thermodynamic stability of a nucleic acid
duplex is strongly dependent on the temperature, which can be exploited for an
experimental study of the duplex stability. Thereby, the reversible phase transition from the
highly ordered, helical state of the duplex (at low temperatures) to the random coil state of
nucleic acid single strands (at high temperatures), the so-called melting of a nucleic acid

5. UV Melting Studies
69
duplex (reverse process: duplex formation upon annealing of single strands), is thermally
induced by the application of a controlled temperature program. During this melting
process, the two complementary strands break up by the loss of the connecting Watson-
Crick base pairing, which proceeds as a cooperative process, wherein the breaking up of
some base pairs induces the breaking up of adjacent base pairs, and with this the breaking
apart of the whole duplex into the respective single strands. This phase transition can be
physically monitored by UV, since the nucleic acid melting is accompanied by the loss of π-
stacking, which evokes an hyperchrome effect, detected as an increase in absorbance
intensity at a wavelength of λ = 260 nm. The recorded absorbance-vs.-T plot is called the
melting curve of a duplex, which exhibits a sigmoidal increase in absorbance due the
cooperative character of the melting process (Fig. 5-1, black line).
Fig. 5-1. UV melting curve of P25•D2 (black line) and its 1st derivative (red line, scale not shown).
In order to judge on the melting process, generally the extent of hyperchromicity hci is
determined and furthermore a value fm,ii which attributes to the sharpness of the
cooperative process.234 The temperature, where 50 % of one strand are bound to its
complementary strand in the duplex state, and the other half is present as its single strand
(total molar ratio ss : ds = 2 : 1) is called the melting temperature TM of the duplex. It equals
the temperature, where the maximal increase in absorbance occurs, which corresponds to
the x-axis intercept of the inflexion point of the melting curve. The exact TM value can be
reliably red out from the x-axis intercept of the maximum of the melting curves first
derivative (Fig. 5-1, red line). TM depends on the enthalpy ∆H0 and the entropy ∆S
0 of the
bimolecular melting process according to the following equation, which is derived from the
i ℎ7 = 89:.(40°<)�89:.(=°<)
89:.(=°<)
ii Analysis from the 1st derivative of a melting curve: >? = �@A BCDBEFGHH ICJEB @E B@HF K@LCKGK ∙ 10O
0 10 20 30 40 50 60 70 80 90
0.38
0.39
0.40
0.41
0.42
0.43
T / °C
Abs
.
TM

5. UV Melting Studies
70
Gibbs-Helmholtz equation and renders TM a quantity for the thermodynamic stability of the
duplex (Ct: total strand concentration).256, 257
P = ∆R�∆S�$�∙TUVWXY Z (5.1)
The van’t Hoff reaction enthalpy ΔHvH is related to the y-axis intercept of the maximum of
the melting curve’s first derivative (at TM) according to the following equation (α: fraction of
nucleic acids in the single stranded state):257
∆[�R = 6?] V^_^�Z�`�a
(5.2)
The equilibrium association constant K at any given temperature T equals to eq. (5.3) and
was calculated at T = TM to eq. (5.4):257
b = exp V∆S�� − ∆R�
�� Z (5.3)
b�g = 4hi (5.4)
Aoki et al. presented association constants of K25°C = 1.45 x 10⁹ M-1 for a 10-mer and of
K25°C = 1.42 x 10¹¹ M-1 for a 15-mer PNA•DNA duplex.258 These values indicate that the
duplex association rate kass is significantly larger than its dissociation rate kdiss and the
portion of PNA single strands under the standard working conditions applied in this thesis
(T = 20 °C, DNA : PNA > 1.1 : 1) negligible. The PNA•DNA hybridization is reported to
generally proceed faster than the hybridization of DNA analogs, which was ascribed to the
absence of electrostatic backbone-backbone repulsion.95, 106
The nearest neighbor model takes into account the contribution of base stacking
between neighboring nucleobases to predict the melting temperatures of DNA•DNA
duplexes. It is based on experimentally determined, incremental thermodynamic parameters
of the assembling DNA base pairs, which reveal the following tendency of their
thermodynamic stabilities:131, 256, 259-263
G • C > A • T > G • G > G • T ≈ G • A > T • T ≈ A • A > T • C ≥ A • C ≥ C • C (5.5)
The most stable base pairs G•C and A•T are denominated complementary according to
the Watson-Crick base pairing rules, whereby the three hydrogen bonds connecting G and C
evoke the larger stability of this base pair compared to the A•T base pair (two hydrogen
bonds). This renders the percentaged GC content of a duplex in a first approximation

5. UV Melting Studies
71
proportional to its thermodynamic stability. All other base pairs are denominated
mismatches. The free energy ∆G0 (and analog ∆H
0 and ∆S0) of a DNA•DNA duplex is
calculated from the reported incremental thermodynamic values of the assembling base
pairs according to the following formula, to facilitate a prediction for TM according to (5.1).
∆rst8∙st8 = u vC∆rCC
+ ∆rxUxy + ∆r:z{ (5.6)
Nielsen et al. refined this model for a prediction of PNA•DNA melting temperatures based on
the predicted TM of the analogous DNA•DNA duplex according to the following formula (fpyr:
fractional pyrimidine content, lnt: PNA length in number of nucleotides):
P(PNA ∙ DNA) = 20.79 + 0.83 ∙ P(DNA ∙ DNA) − 26.13>�z� + 0.44�UE (5.7)
Due to its electrically neutral backbone and the absence of electrostatic backbone-
backbone repulsion, PNA forms duplexes with RNA and DNA, which are more stable than the
analogous duplexes with DNA. Thereby, an average increase in the melting temperature of
1 °C/bp was determined for a PNA•DNA duplex in comparison with the sequence analog
DNA•DNA duplexes, whereas even more stable duplexes between PNA and RNA, which
reveal an increase of 1.5 °C/bp compared to their DNA•RNA analog.95, 106, 264 According to
(5.5), the thermodynamic stability of a nucleic acid duplex furthermore strictly correlates to
the presence and type of base pair mismatches, whereby short duplexes are already
significantly destabilized by the presence of more than one point mutation. An impact of the
strand position of a point mutation was studied by Igloi et al. for PNA•DNA duplexes, who
determined a terminal single base mismatch to be less destabilizing than an internal single
base mismatch.109 Besides its nucleobase sequence and strand length, the melting
temperature of a nucleic acid duplex furthermore depends on physical parameters like the
pH of the solvent and the nucleic acid strand concentration. The sensitivity of the duplex
stability towards the salt concentration of the solvent is significantly less developed for
PNA•DNA compared to DNA•DNA duplexes, which is again attributed to the absence of
electrostatic backbone-backbone repulsion.111

5. UV Melting Studies
72
5.3 Studies on the Temperature Profile
5.3.1 Duplexes 1 – Bacterial Target Sequences
The first set of duplexes comprises nine Fc-PNA•DNA duplexes, which result from the
cross hybridization of the three bacterial PNA target sequences P24-E.coli, P25-Pseu and
P26-Salm (Tab. 4-3, set 1) with the three respectively complementary 12-mer DNA target
sequences D1-E.coli, D2-Pseu and D3-Salm. Tab. 5-1 shows the corresponding hybridization
scheme for the formation of all possible Fc-PNA•DNA duplexes. Besides the three fully-
complementary duplexes P24•D1, P25•D2 and P26•D3, hereby two duplexes with one
internal mismatch, respectively, result (P24•D3, P26•D1), whereas the remaining four
duplexes exhibit internal triple mismatches. This set of duplexes constitutes the basic set of
duplexes for a later Fc-PNA biosensor analysis of the three chosen bacterial stems, and will
be primarily applied for the general interfacial and analytical studies of Fc-PNA biosensors
(section 6.5) and the proof of different sensing concepts (section 6.7).
Tab. 5-1. UV melting curve analysis of the Fc-PNA•DNA duplexes 1 – bacterial system.
Fc-PNA (N � C) DNA (3’ � 5’)
P24-E.coli Fc - t c t a c g a g a c t c
- Lys Ahx CysOH
P25-Pseu Fc - t c t a c c g t a c t c
- Lys Ahx CysOH
P26-Salm Fc - t c t a c a a g a c t c
- Lys Ahx CysOH
D1
A G A T G C T C T G A G 62.5 ± 0.1
– c g t/C T C
37.6 ± 0.4 a/C
D2
A G A T G G C A T G A G
– g a g/G C A
54.4 ± 0.3 –
a a g/G C A
D3
A G A T G T T C T G A G
51.3 ± 0.1 g/T
– c g t/T T C
60.0 ± 0.7
The fully complementary duplexes P24•D1 and P26•D3 revealed a melting point of TM ≥
60 °C, whereas P25•D2 exhibits a lower value of TM = 54.4 °C. This exceptionally small TM of
P25•D2 does not correlate to the respective GC content, which is the smallest for P26•D3,
and moreover does not correlate to the ∆G0 tendency predicted by the nearest neigbour
model (–∆G0: P24•D1 > P25•D2 > P26•D3). Although the duplexes P24•D3 and P26•D1
possess both one internal single mismatch position, both duplexes revealed a distinct
cooperative melting process. Thereby, P26•D1 revealed a melting temperature, which was
~20 °C lower than that of the corresponding fully-complementary duplex P26•D3, whereas
P24•D3 exhibited a TM value which was just ~10 °C lower than that of its fully-
complementary analog P24•D1. This different extent of destabilization can be explained with
the nearest neighbor model base pair tendency (5.5). A thermodynamically very stable g/C
base pair of P24•D1 is exchanged for the formation of P24•D3 by a g/T base pair, which

5. UV Melting Studies
73
presents as the second stable mismatch still a very stable base pair to yield a minor decrease
in the melting temperature of -10 °C. In contrast, a stable a/T base pair of P26•D3 is
replaced by an a/C mismatch for the formation of P26•D1, which presents the second
unstable base pair of the tendency (5.5) to cause a significant destabilization of the
mismatch duplex, explaining the significantly larger destabilization of -20 °C. The melting
profile furthermore approves the assumption that both duplexes form a helical, base-
stacked duplex structure at a working temperature of T = 20 °C, since no significant increase
in absorbance (≙ loss of base stacking) had occurred yet at that temperature. The four
remaining Fc-PNA/DNA combinations P24/D2, P25/D1, P25/D3 and P26/D2, which would
result in duplexes with an internal triple mismatch, did not reveal a distinct cooperative
melting process, indicating that no helical duplex structure is formed within the studied
temperature spectrum.
Fig. 5-2. Melting curves of the Fc-PNA•DNA duplexes 1 of Tab. 5-1 (Normalization of absorbance according to
the extent of hyperchromicity hc with respect to the absorbance at T = 5 °C).
P24•D1P24•D2P24•D3
P25•D1P25•D2P25•D3
P26•D1P26•D2P26•D3
0 10 20 30 40 50 60 70 80 900
2
4
6
8
10
12
14
16
TM= 54.4 °C
T / °C
hc /
%
0 10 20 30 40 50 60 70 80 900
2
4
6
8
10
12
14
TM= 51.3 °C
T / °C
hc /
%
TM = 62.5 °C
0 10 20 30 40 50 60 70 80 900
2
4
6
8
10
12
14
16
T / °C
hc/ %
TM= 37.6 °C
TM= 60.0 °C

5. UV Melting Studies
74
5.3.2 Duplexes 2 – Variation of the Sequence Length
A second set of Fc-PNA•DNA duplexes was studied, which comprises five duplexes
resulting from the hybridization of the Fc-PNA conjugates P26 – P30 with PNA sequence
length of 3 – 16 nt (Tab. 4-5, set 3) with the respective fully-complementary DNA sequences
D3, D15 – D18 of equal nucleotide lengths. The UV analysis of these duplexes provides the
basis for the study of the length dependency of the electron transfer process, which is
presented in sections 6.5.6 and 6.6.1.4.
Tab. 5-2. UV melting curve analysis of the Fc-PNA•DNA duplexes 2 with varying sequence lengths.
Fc-PNA•DNA lnt
/nt TM / °C
ℎ7=�40°<{�� / %
fM
P27•D15
Fc – c t c Lys Ahx CysOH G A G
3 – 9.0 ± 0.2 –
P28•D16
Fc – a g a c t c Lys Ahx CysOH T C T G A G
6 – 6.9 ± 0.6 –
P29•D17
Fc - a c a a g a c t c Lys Ahx CysOH T G T T C T G A G
9 44.8 ± 0.6 13.6 ± 0.4 0.31
P26•D3
Fc - t c t a c a a g a c t c Lys Ahx CysOH A G A T G T T C T G A G
12 60.0 ± 0.7 15.3 ± 0.2 1.08
P30•D18
Fc - c c c c t c t a c a a g a c t c Lys Ahx CysOH G G G G A G A T G T T C T G A G
16 66.7 ± 0.3 13.8 ± 0.1 0.64
Tab. 5-2 reveals that solely the longer duplexes P29•D17, P26•D3 and P30•D18 with a
lengths of > 9 nt reveal a distinct cooperative melting process with a percentaged increase in
the absorbance of > 13 % and reliable fM values. Thereby, the determined TM values increase
with the sequence length from 44.8 °C (9 nt) to 66.7 °C (16 nt). The melting profiles
furthermore indicate, that all these three duplexes form a helical duplex structure at a
working temperature of T = 20 °C. In contrast, the melting curves of the 3 and 6 nt long
duplexes P27•D15 and P28•D16 did not show a significant cooperative melting process,
indicating that at T = 20 °C completely denaturized single strands have to be assumed.

5. UV Melting Studies
75
Fig. 5-3. UV melting curves of the Fc-PNA•DNA duplexes 2 shown in Tab. 5-2.
5.3.3 Duplexes 3 – Variation of a Single Mismatch Position
A third set of twelve single-mismatch Fc-PNA/DNA duplexes was derived from the fully-
complementary duplex P26•D3. The mismatch duplexes result from the successive
introduction of point mutations into P26•D3 from position 1 (P26•D4) to position 12
(P26•D14) (counting in N to C direction). The introduced twelve mismatch base pairs were
thereby chosen to provoke similar and strong duplex destabilizing effects according to the
general tendency (5.5). With the limitations due to the given PNA sequence of P26 and the
resulting three possible mismatch base pairs per PNA strand position, mainly c/A (A/c) and
t/C mismatches were introduced into P26•D3.
Tab. 5-3. UV melting curve analysis of the Fc-PNA•DNA duplexes 3 – Mismatch position gradient.
Fc-PNA (N � C) DNA (5’ � 3’)
P26-Salm Fc - t c t a c a a g a c t c Lys Ahx CysOH
Mismatch (Position) TM / °C
D4
C G A T G T T C T G A G t/C (1) 56.4 ± 0.2
D5
A A A T G T T C T G A G c/A (2) 52.0 ± 0.5
D6
A G C T G T T C T G A G t/C (3) 48.5 ± 0.4
D7
A G A C G T T C T G A G a/C (4) 42.8 ± 0.4
D8
A G A T A T T C T G A G c/A (5) 32.2 ± 0.7
D1
A G A T G C T C T G A G a/C (6) 37.6 ± 0.4
D9
A G A T G T C C T G A G a/C (7) 36.4 ± 0.4
D10
A G A T G T T A T G A G g/A (8) 34.4 ± 0.4
P27•D15 (3nt)P28•D16 (6nt)P29•D17 (9nt)P26•D3 (12nt)P30•D18 (16nt)
0 10 20 30 40 50 60 70 80 90
0
2
4
6
8
10
12
14
hc
/ %
T / °C

5. UV Melting Studies
76
D11
A G A T G T T C C G A G a/C (9) 39.6 ± 0.2
D12
A G A T G T T C T A A G c/A (10) 38.7 ± 0.3
D13
A G A T G T T C T G C G t/C (11) 54.1 ± 0.4
D14
A G A T G T T C T G A A c/A (12) 55.0 ± 0.5
Fig. 5-4 correlates the determined Fc-PNA•DNA melting points TM with the strand
position of the respective internal mismatch. Although the mismatches were chosen to
evoke a comparable destabilization to the duplex according to the nearest neighbor model,
the measured TM values spread over a large range of ΔTM ~ 30 °C. Furthermore it is revealed
that the TM values decrease with a dislocation of the SNP from terminal to internal positions,
which is coherent with literature reports.109
Fig. 5-4. Dependency of the Fc-PNA•DNA melting temperatures TM on the SNP position.
The melting curve of the least stable duplex P26•D8 (SNP located at strand position 5)
with TM = 32.2 °C thereby reveals that no significant increase in absorbance and
consequently strand separation had occurred at a temperature of T = 20 °C, which will be
the working temperature for the later biosensor experiments. With this it is considered that
all SNP duplexes shown in Tab. 5-3 form a helical duplex state at the working temperature of
T = 20 °C.
SNP strand position
TM /°
C
30
35
40
45
50
55
60
0 1 2 3 4 5 6 7 8 9 10 11 12 13
t c t a c a a g a c t cFe
O
LysAhx CysOH

5. UV Melting Studies
77
5.3.4 PNA Self-Melting
A special feature of PNA single strands is their tendency to form a self-stacking of
nucleobases, whereof MD simulations of Nilsson et al. revealed that in aqueous medium at
room temperature a helical-like, base-stacked and highly ordered structure is strongly
favored over a random coil state.127 This behavior is facilitated by the absence of charge
repulsion and is not observed in DNA single strands. As a main reason for this, furthermore
the carbonyl-methylene base-backbone linker of PNA is discussed. It is more flexible than
the more rigid pentose linker of DNA, hence allowing backbone rearrangements129 and
thereby facilitating the energy gain due to the base-stacking. In case that the helical-like,
base-stacked structure is actually adopted at room temperature, a cooperative loss of base-
stacking is expected with increasing temperature and the increase in absorbance due to the
hyperchrome effect requires to be detectable UV spectroscopically, analogous to the melting
process of double-stranded DNA. As one consequence from this, the PNA concentration
requires to be generally determined at a larger temperature (generally applied in this work:
T = 85 °C), where the base self-stacking is absent, in order to apply the extinction
coefficients of (unstacked) DNA nucleobases for a calculation of the PNA concentration.
The UV melting experiment of the single-stranded Fc-PNA oligomer P26 in 0.1 M PBS
(pH 7.4) shows that at a wavelength of λ = 260 nm actually a cooperative melting process is
detected with an increase in absorbance of hc = 7.7 %. Comparison with its fully-
complementary duplex reveals that the hyperchrome effect of P26•D3 is with a value of hc =
15.3 % exactly twice the number of that of P26. Since the total number of nucleic acid single
strands was equal in both melting experiments (total concentration: css = 1.7 µM) it can be
concluded that although the single-stranded and the double-stranded structures of P26 are
stabilized by base-stacking at room temperature, the effect is twice as strong in the double
helical structure of P26•D3 (confirmed by the analogous melting experiments of P25 and
P25•D2). Also the sharpness of the cooperative melting of P26 is lower than that of P26•D3,
however it is still significant with a value of fM = 0.70 and larger than half of the value of
P26•D3 (fM = 1.08). The melting profile of P26 exhibits a self-melting temperature of TSM =
36.9 ± 0.2 °C with no significant increase in absorbance until the temperature reaches a
value of T = 30 °C.

5. UV Melting Studies
78
Fig. 5-5. UV melting curves of P26 and P26•D3. Dashed lines: 1st derivatives of the melting curves.
It is concluded that P26 adopts at temperatures below its melting point a base-stacking
stabilized, helical-like structure, which is coherent with the MD predictions of Nilsson et al.
When the melting point is reached, the base-stacking cooperatively breaks up and P26
undergoes a phase transition to the random, coil-like conformation.
5.4 Impact of the Fc-Label
In this section, the impact of all different N-terminal Fc-labels onto the thermodynamic
stability of PNA•DNA duplex will be studied. Therefore, the melting temperatures of Fc- and
Fc-Tz-labeled oligomers with the same PNA sequence are compared to the respective N-
terminally acetylated analog. The significance of the N-terminally acetylated derivative as
the reference will be elucidated exemplary for the Salm sequence set, by the comparison
with the N-terminally non-modified derivative P15-Salm. All melting curves were undertaken
at fully-complementary PNA•DNA duplexes, wherein the DNA complement was of equal
length as the PNA sequence, but furthermore with PNA•DNA duplexes with dangling ends,
wherein the DNA complement exhibited a two-sided sequence overhang of 5 nucleotides,
which were selected based on the respective bacterial 16S rRNA (Tab. 4-1). The latter studies
are of high relevance for a later study of biological 16S rRNA with Fc-PNA biosensors,
wherein the target region will exhibit a longer sequence length than the 12-mer sequence of
the PNA capture probe. The following tables Tab. 5-4, Tab. 5-5 and Tab. 5-6 summarize the
melting curve analysis of all different types of N-terminally labeled PNA
oligomers/conjugates, ordered with respect to the PNA sequence derived from 16S rRNA
from E.coli, P. aeruginosa or S. enetrica.
0 10 20 30 40 50 60 70 80 90
-4
-2
0
2
4
6
8
10
12
14
16 P26P26•D3
T / °C
hc
/ %

5. UV Melting Studies
79
Tab. 5-4. UV melting curve analysis of differently labeled E.coli PNA sequences.
Fc-PNA (N � C) DNA (3’ � 5’)
t c t a c g a g a c t c – Lys Ahx CysOH
P12-E.coli
P24-E.coli
P34-E.coli
D1
A G A T G C T C T G A G 62.6 ± 0.3 62.5 ± 0.1 64.1 ± 0.2
D19
� G G G G G A G A T G C T C T G A G T T C G A
65.3 ± 0.2 65.8 ± 0.9 59.8 ± 0.5
Tab. 5-5. UV melting curve analysis of differently labeled P. aeruginosa PNA sequences.
Fc-PNA (N � C) DNA (3’ � 5’)
t c t a c c g t a c t c – Lys Ahx CysOH
P13-Pseu
P25-Pseu
P32-Pseu
D2
A G A T G G C A T G A G n. d. 54.4 ± 0.3 55.5 ± 0.6
D20
� G T G G G A G A T G G C A T G A G A T C G A
n. d. 58.1 ± 0.3 57.0 ± 0.3
Tab. 5-6. UV melting curve analysis of differently labeled S. enterica PNA sequences.
Fc-PNA (N � C) DNA (3’ � 5’)
t c t a c a a g a c t c – Lys Ahx CysOH
P15-Salm
P14-Salm
P26-Salm
P37-Salm
D3
A G A T G T T C T G A G 56.0 ± 0.1 55.9 ± 0.3 60.0 ± 0.7 57.4 ± 0.5
D21
� G G G G G A G A T G T T C T G A G T T C G G
59.9 ± 0.8 60.6 ± 0.1 62.4 ± 0.7 60.1 ± 0.3
O
O
Fe
NN N
NH
O
Fe
O
O
FeN
N NFe
HO
O
Fe
NN
N
Fe

5. UV Melting Studies
80
In order to determine the reliability of N-terminally acetylated PNA conjugates as the
standard reference conjugate, the melting temperatures of duplexes of the N-terminally
non-modified conjugate P15-Salm and the N-terminally acetylated conjugate P14-Salm are
compared. Tab. 5-6 reveals that the duplexes with the 12-mer DNA target sequence D3 as
well as the duplexes with the overhang sequence D21 reveal comparable melting
temperatures. This indicates no significant impact of the acetyl group onto the duplex
stability and further qualifies the acetylated derivates as a reference for the studies of the
influence of the N-terminal labels onto the duplex stability. Thereby, the both-sided
overhang of 5-nucleotides evokes a stabilization compared to the duplex with D3 for the
non-modified oligomer P15 as well as the N-terminally acetylated derivatives P12 and P14,
which is coherent with the stabilization of DNA•DNA duplexes by one nucleotide overhangs,
as reported by SantaLucia et al.265 Hereby, the overhang stabilization at the S. enterica
sequence is with ~ 4 °C slightly larger than at the E. coli sequence with 2.7 °C.
The comparison of the Fc-PNA conjugates with the respective acetylated derivatives
reveals for the E. coli set no significant changes in their TM values, whereas a 4 °C larger TM
value is detected within the S. enterica set for P26•D3 compared to its N-terminally
acetylated analog. Therefore, solely a slight tendency for stabilization can be ascribed to the
Fc moiety. Comparing the effect of the sequence overhang onto the DNA duplexes of the Fc-
PNA conjugates P24, P25 and P26 of all sets reveals that the overhang generally evokes a
stabilization of the duplex about ∆TM = 3.1 ± 0.5 °C, which is on average slightly smaller than
that of the acetylated analogs. The terminating base pairs and first dangling nucleotide is
equal in all the three sequences, except for the P. aeruginosa system, which is terminated at
its 5’-terminus with the first overhanging nucleotide being an adenine in ,��(i<..)� instead of
.��(i<..)� of the E. coli and S. enterica sets. A larger stabilizing effect of an overhanging adenine
nucleobase was observed by SantaLucia et al.,265 which is coherent with the largest observed
stabilizing effect of Fc-PNA P. aeruginosa set within the Fc-PNA conjugates.
The impact of the base pair, which is located adjacent to the Fc moiety, onto the duplex
stability was studied by comparison of the TM value of P24•D1 with an adjacent t/A base pair
.8���y and that of the fully-complementary duplex P23•D22, which reveals the same PNA
sequence like P24 but in the opposite orientation, to exhibit a c/G base pair adjacent to the
Fc moiety in .����� . P23•D22 reveals a melting temperature of ∆TM = 60.8 ± 0.6 °C, which is
slightly lower than that of P24•D1. With regard to the smaller stability of a t/A compared to
a c/G base pair this result indicates, that the t/A base pair is slightly better stabilized when it
5. UV Melting Studies
81
is located adjacent to the Fc moiety in P24•D1 than adjacent to the peptidic Lys-Ahx-Cys
linker in P23•D22.
Comparison of the TM values of the 12-mer Fc-Tz-PNA•DNA duplexes with the analogous
Fc-PNA analogs of the same PNA sequence shows that the Fc-Tz-PNA•DNA duplexes P32•D2
and P34•D1 exhibit a 1.1 °C and 1.6 °C, respectively, higher TM value than their Fc-PNA•DNA
analog, whereas P37•D3 exhibits a 2.6 °C lower TM value than its Fc-labeled analog P26•D3.
Although clearly more examples are required for a general statement, the triazole ring is
methylene bridged to the amide CO in P32•D2 and P34•D1, whereas it is located closer to
the duplex in P37•D3, which potentially facilitates a repulsion between the electron-rich
triazole ring and the negatively charged DNA backbone, to result in a diminished duplex
stability. A stabilizing effect of the sequence overhang was observed at P32 and P37 of 1.5 °C
and 2.7 °C, respectively, whereas at P34 in contrast a significant destabilization of 4.3 °C is
detected. A reason for this effect is possibly related to the larger size/length of the DEPA-
ferrocene label of P34. In the conjugates P32 and P37 the Fc moiety evokes a small
stabilization and the Tz ring presumably a small destabilizing effect, to result in a smaller
stabilization than in the analogous Fc-PNA duplexes at least in the P. aeruginosa system. In
contrast, the Fc-moiety in the DEPA-Fc label is presumably located too far away from the
duplex structure to exert a stabilizing effect, which results in a destabilization due to a
repulsive interaction between the electron-rich Tz ring and the directly opposed negatively
charged DNA overhang.
5.5 Conclusion
The UV melting curve analysis of the duplexes 1 – 3 provides the foundation for the
following Fc-PNA biosensor studies (section 6) with regard to a differentiation of the three
bacteria genera E. coli, P. aeruginosa and S. enterica (duplexes 1) and the dependency of the
sensor response on the PNA length of the Fc-PNA capture probe (duplexes 2) as well as the
position of a single point mutation (duplexes 3). The focus of the UV analysis was on the
elucidation of the secondary structure of the duplexes at a working temperature of T =
20 °C, which is of high relevance for a clear interpretation of the electrochemical response of
a Fc-PNA biosensor. Thereby, all fully-complementary duplexes with a length ≥ 9nt revealed
melting temperatures of TM = 44.8 – 66.7 °C and all duplexes with a single point mutation
revealed values of TM = 32.2 – 56.4 °C. The melting profiles of all those duplexes indicate the
presence of a double helical secondary structure at a working temperature of T = 20 °C,

5. UV Melting Studies
82
where with regard to the reported large association constants of K ~ 109 – 1011 M-1,258 the
fraction of single strands is negligible.
The presented studies revealed that the impact of the different N-terminal acetyl-,
ferrocenyl- or ferrocene-triazolyl labels onto the duplex stability is relatively small. A
maximal difference in the melting temperature of TM = 4 °C was detected within the
differently labeled species of the S. enterica set. A general tendency for the duplex
stabilization by a both-sided sequence overhang of 5 nucleotides was detected for all
differently N-terminal labels, which is coherent with a reported duplex stabilization by a one-
nucleotide overhang in unlabeled DNA•DNA duplexes.265 However, one exception was
determined for the DEPA-Fc labeled conjugate P34, where the overhang evoked a significant
destabilization of ~ 4 °C. Generally, the TM difference between the 12-mer Fc-Tz-PNA
duplexes and their Fc-PNA analogs were maximal of ∆TM = 2.6 °C, which is a negligible
difference for the following biosensor studies.

6. Electrochemical Studies
83
6. Electrochemical Studies
6.1 Objective
This part of the thesis deals with the development, characterization and electrochemical
analysis of Fc-PNA/Au interfaces (section 6.5 and 6.6) as the basis for an application of N-
terminally ferrocenylated and C-terminally gold surface grafted PNA strands as a biosensor
for the detection of DNA sequences (section 6.7).
Preliminary to the electrochemical studies of Fc(-Tz)-PNA modified gold surfaces
(sections 6.5 – 6.7), the different Fc head groups of the synthesized Fc(-Tz)-PNA conjugates
were electrochemically characterized by CV and SWV of the dissolved PNA species at a
(bare) glassy carbon working electrode (section 6.4). The focus of these studies was on the
determination of the redox potentials of the different Fc labels as well as the examination of
their (electro)chemical reversibility independent from any surface effects in order to
elucidate, which Fc(-Tz)-PNA conjugates qualify for the use as Fc-PNA capture probes for the
preparation of DNA sensor surfaces. Furthermore, the influence of Fc-PNA•DNA duplex
formation with fully-complementary as well as single point-mutated DNA strands on the
electrochemical properties of the PNA-tethered Fc head groups were investigated.
Section 6.5 deals with the preparation, characterization and electrochemical analysis of
different interfacial designs of Fc-PNA modified gold surfaces. These studies aim to establish
a clear correlation between electrochemical response and surface modification event, in
order to facilitate a definite interpretation of the Fc-PNA sensor response for the later
analysis of DNA sequences. In these studies, different voltammetric parameters will be
examined with respect to their significance and qualification for the analysis of the sensor
response, to present the basis for the development of Fc-PNA biosensor strategies (section
6.7). Section 6.6 deals with the kinetic analysis of the electron transfer process at Fc-PNA-
modified surfaces, in order to elucidate the dominating electron transfer pathway with
regard to the theoretical mechanisms of an electron transfer induced by the mechanical
bending of the surface tethered strands as an alternative to the electron transport through
the nucleic acid strands (see Fig. 1-5). These studies are of fundamental importance for the
development of an advanced understanding about how different nucleic acid strand
characteristics determine the redox process at Fc-PNA-modified surfaces.
In the final part (section 6.7), the elucidated electron transfer process at different well-
characterized interfaces will be employed to developed three concepts for the analysis of

6. Electrochemical Studies
84
DNA with Fc-PNA modified sensing surfaces. The analysis of DNA will be studied with the
focus on the detection of single nucleobase mismatches. Besides two simple approaches of
loosely packed, individual Fc-PNA sensing surfaces as well as chip confined, densely packed
Fc-PNA layers, furthermore an advanced dual-potential sensor strategy will be investigated.
6.2 Voltammetric Techniques
6.2.1 Cyclic Voltammetry
Cyclic voltammetry (CV) is a potential sweep technique wherein the potential E of a
working electrode (WE) is linearly changed according to a specific potential-time profile and
the resulting current flow i through an electrolyte solution is detected. In CV, E is linearly
changed with a constant scan rate v during a voltammetric scan according to a triangular-
shaped potential-time course (Fig. 6-2, red line), which is characterized by start (Estart),
switching (Eλ) and end potential (Eend). In the simplest case of CV, the potential is increased
with a constant scan rate v = dE/dt in the anodic scan, to reach the switching potential Eλ
until it is again linearly decreased in the cathodic scan (v = -dE/dt) to reach Eend. During this
work, exclusively the one-electron, reversible redox process of ferrocene Fc0/+ will studied.266
Fig. 6-1. Fc0/+ redox process.
Fig. 6-2 exemplary shows the current i response (current-time domain, black line) of a
PNA-tethered ferrocene moiety (example: P30/MCH interface, section 6.6.1.4) upon
application of the described typical CV potential wave form (potential-time domain, red line)
in a potential range of 0 – 0.8 V, wherein the Fc moiety is initially (at Estart) only present in its
reduced state Fc0.
Fe II Fe III
+
+ e-kf
kb

6. Electrochemical Studies
85
Fig. 6-2. Applied potential-time course (red line) and detected current-time response (black line) in CV.
Presented example: reversible Fc0/+ redox process determined at the P30/MCH interface (section 6.6.1.4).
When the applied potential approaches the formal potential of the redox process in the
anodic scan, the electron transfer (ET) occurs with the heterogeneous rate constant kf, to
cause a faradaic current if and an increase of the concentration of Fc moieties in the oxidized
Fc+ state. Subsequent the current increase, which is determined by the potential dependent
Fc0/Fc+ concentration profile adjacent to the electrode surface and controlled by the
diffusion of the Fc moieties, a potential independent decay with t-1/2 proceeds, which finally
constitutes the peak shaped current response (Fig. 6-2, black line). The reverse is proceeding
in the cathodic scan, such that the cyclic voltammogram of a reversible redox process,
typically presented in a current-vs.-potential diagram (Fig. 6-3), comprises a current
maximum ipa at Epa in the anodic scan and a current minimum ipc at Epc in the cathodic scan.
Fig. 6-3. Measured current-potential plot of CV (example: P30/MCH interface).
Based on the peak currents ipc and ipa and the peak potentials Epc and Epa as the
detected primary parameters, CV can provide qualitative as well as quantitative information
about e. g. the reversibility, the thermodynamics and kinetics or the reaction mechanism of
2 4 6 8 10 12 14 16 18-0.1
0.0
0.1
0.2
0.3
0.4
0.5
0.6
0.7
0.8
time t / s
pote
ntia
lE
/V
-0.6
-0.4
-0.2
0.0
0.2
0.4
0.6
currenti / µA
Estart Eend
Eλ
-0.1 0.0 0.1 0.2 0.3 0.4 0.5 0.6 0.7 0.8-0.6
-0.4
-0.2
0.0
0.2
0.4
0.6
Eλ
Estart
Eend
Epa
Epc
ipa
ipc
curr
ent
i / µ
A
potentialE / V

6. Electrochemical Studies
86
a redox process. A diffusion-limited, Nernstian reversible redox process is thereby
characterized by the following equations, whereby (i) ipc/ipa = 1, (ii) ΔE = 59 mV and (iii) n
= 1 indicate complete reversibility:267
� = 0.4463 V����Z# ]⁄ v� ]⁄ ��#/]h∗�# ]⁄ (6.1)
�#/] = ���$���] = �0� + ��
�� �v����� (6.2)
In contrast, the diffusionless redox process of an electroactive adsorbate layer is controlled
by the rate of the electron transfer (ET) process and characterized by the following
equations:
�#/] = �0� + V����Z �v V��
��Z (6.3)
� = V����O�� Z ��� (6.4)
During a voltammetric scan between E = 0 – 0.8 V, as generally performed during this work,
a positive electric field is linearly increased and again decreased (potential of zero charge
(pzc) of polycrystalline gold surfaces: pzc ≈ 0.0 V vs. Ag/AgCl).268, 269 According to the Gouy-
Chapman theory, a diffusion layer is thereupon formed adjacent the electrode surface across
which the potential drops according to:
� = �0���L (6.5)
(ϕ = potential in the bulk electrolyte, ϕ0 = potential at the electrode surface) with the Debye
length of the electric field defined as (Bjerrum length lB (= q2/εkT) of water at T = 300 K: lB =
0.71 nm):
�# = #143∙H¡∙¢ (6.6)
The formation of the diffusion layer evokes a charging current ic, which is directly
proportional to the scan rate v according to the equation
|�¤| = �hJ� (6.7)
and is always present in CV, since the applied potential is continuously changed (q = E x Cd).

6. Electrochemical Studies
87
6.2.2 Square Wave and Differential Pulse Voltammetry
Square wave (SWV) and differential pulse (DPV) voltammetry belong to the class of
pulse voltammetry methods, wherein a potential program of successive potential steps
(pulses) is applied to the working electrode in contrast to CV, where the applied potential is
continuously changed (potential sweep technique). An improved discrimination of the
capacitive charging current compared to CV is achieved by sampling the current after
application of a potential step (see τf and τr in Fig. 6-4, left). According to the Cottrell
equation (6.8), the faradaic current if of a diffusion limited system decays with t-1/2 after
application of a potential E (under Cottrell conditions).267
�(¥) = ��¦��§/�¤�∗3§/� ∙ #
√E (6.8)
At a constant electrode area A and electrolyte concentration, a charging current ic only
flows according to eq. (6.7) when the potential is changed. In contrast to CV, where the
continuous flow of ic results from dE/dt ≠ 0 during the whole time scale of the voltammetric
scan, charging current in pulse voltammetry only flows at the pulse edges with dE/dt ≠ 0
and not at their treads (dE/dt = 0). After application of the potential step, ic decays
exponentially with the cell time constant RuCd, whereby the electrode charging is completed
by 99 % after five cell time constants.267 This renders the selection of the sampling time with
τ > 5 RuCd already sufficient for an effective suppression of the charging background current
and furthermore largely prevents the loss of faradaic current if, which would occur at late
sampling times due to the if decay according to (6.8).267 This forms the basis for the excellent
selectivity of 1 – 0.1 mM, which is achieved with normal pulse voltammetry compared to
potential sweep techniques. SWV and DPV differ by the applied potential staircase
waveform as well as point of current sampling, as demonstrated in Fig. 6-4.
Fig. 6-4. Excitation potential waveforms of SWV (left) and DPV (right). Reproduced according to Bard and
Faulkner with the respective standard parameters applied in this work (SWV: ΔEp = 25 mV, ΔEs = 5 mV, tp = 10 ms, f = 50 Hz. DPV: ΔEp = 10 mV, ΔEs = 1 mV, tp = 50 ms, v = 4 mV/s).267
~ ~
~ ~
0 20 40 60 80 100 120-30
-20
-10
0
10
20
30
40
50
60
E /
mV
t / ms0.0 0.2 0.4 0.6 0.8 1.0
0
2
4
6
8
10
12
14
16
E /
mV
t / s
SWV DPV
~ ~ ~ ~
tp
∆Ep
∆Es
τf
τr
τ1
τ2
double pulses1 2 3 4
pulses1 2 3
∆Ep
∆Es
tp

6. Electrochemical Studies
88
The excitation potential waveforms of SWV and DPV are characterized by a staircase
scan of successive potential steps, whereupon the applied potential is changed from E to
E + ∆Es and which are superimposed by a potential pulse. In DPV, a potential pulse with the
pulse height ∆Ep in scan direction is applied at the beginning of every tread of the potential
E, which is dislodged after tp (pulse width). The corresponding DPV scan rate corresponds to
v = ∆Es/(τ1’- τ1). In SWV, every tread of the staircase scan is superimposed by a symmetrical
double pulse, which is opposite to the scan direction. The potential waveform is
characterized by the pulse height ∆Ep and the pulse width tp, which can be alternatively
expressed by the SWV frequency f = 1/2tp. The SWV scan rate v corresponds to v = f · �Es. A
large increase in sensitivity, compared to normal pulse voltammetry, to a detection limit of
10 nM is achieved, by sampling the current in SWV and DPV twice per potential step and
recording the differential current Δip. In DPV, the current is sampled before the pulse (i(τ1)
at E) and at the end of its tread (i(τ2) at E + ∆Ep), whereof the differential current Δip = τ2 –
τ1 is recorded, which is negative for an increasing staircase course with �Es > 0, and vice
versa.267 In SWV, the current is sampled at the end of the forward pulse at τf at the end of
the backward pulse at τr. As measuring response, ip(τf) and ip(τr) as well as the differential
current Δip = τf – τr are recorded vs. the staircase tread potential, whereby Δip in SWV gains
a larger intensity and sensitivity compared to Δip recorded in DPV, due to the contribution of
forward and backward scan, which enlarges the total Δip. Typical DPV and SWV
voltammograms will be shown in the following sections. SWV of the reversible redox process
of a diffusing species is characterized by the following equations.
� = �0� + ���� ln���ª (6.9)
Δ� = ��¦��§/�¤�∗3§/�E�§/� ∆¬ (6.10)
The dimensionless peak current Δψp thereby depends on the pulse height ΔEp, the step
potential ΔEs and the number of electrons n and equals Δψp = 0.5648 for the here chosen
standard measuring conditions of ΔEp = 25 mV and ΔEs = 5 mV.270 The forward and reverse
current in SWV resembles a CV and yields similar information, combined with a significantly
larger sensitivity.

6. Electrochemical Studies
89
6.2.3 Theory of Electron Transfer Kinetics
In all kinetic studies which will be presented in chapter 6.6, the quasi-reversible redox
process of PNA-tethered Fc moieties (Fig. 6-1) is treated, wherein the reduced state (Fc0) as
well as the oxidized state (Fc+) are strongly, but not necessarily diffusionless adsorbed at the
gold surface via the PNA(•DNA). The heterogeneous electron transfer (ET) between the
reduced form of the PNA-bound Fc moiety and the gold surface (oxidation of Fc0) is evoked
by the application of a potential between WE and RE, which alters the Fermi level ®�¦G of the
gold surface (unbiased Au: ®�¦G = 5.53 eV271). The ET occurs, if the energy gap between the
Fermi levels ®�¦G and ®��¯ of the two involved phases exceeds the energy, which is required
for the formation of the transition state (‘activated complex’), which has to be traversed for
the formation of the Fc+ oxidized state. The free energy ∆G0,‡ of that transition state is
thereby determined by different energy contributions like e. g. the reorganization energy λi
(λ = 0.85 eV for a ferrocene alkanethiol modified gold electrode)272, electrostatic energy
terms (ion pairing, attractive and repulsive forces) or solvation energy.267 The free energy of
the oxidation ∆r@‡ is furthermore determined by the applied potential E, and depends on
∆r@0,‡ at the formal potential E0’ according to:
∆r@‡ = ∆r@‡ + ±�(� − �0′) (6.11)
Therein, the transfer coefficient α (α = 0 – 1) reflects the symmetry of the intersection region
of the free-energy dependency of the transition between Fc0 and Fc+. In the Butler-Volmer
model, the rate constant kf of the oxidation (analog kb) is determined by ∆r@‡ according to
the following, Arrhenius type equation:
³F = �F�´�∆µ�‡� ¶
(6.12)
The standard rate constant k0 of a heterogeneous ET reaction directly reflects the kinetic
features of a redox reaction (≙ the time a redox couples requires to reach equilibrium) and is
reached at E0’, where kf = kb.
For an experimental determination of k0, its relation to the overpotential η = E - Eeq
ii
according to eq. (6.11) and (6.12) is exploited. The overpotential equals η = 0 for a maximal
i The reorganization energy λ reflects the energy, which is required for the transformation of the nuclear conformation of participating molecules. It comprises an inner contribution λin, which attributes to the redox partners, and an outer contribution λout, which attributes to the environment, e. g. solvent molecules. ii Overpotential µ refers to the additional potential compared to the equilibrium potential, which is required to evoke an ET at a given electron transfer rate.

6. Electrochemical Studies
90
fast heterogeneous ET, which is e. g. expected for diffusionless adsorbed redox species
located at a small distance to the electrode surface.267 In adiabatic processes, deviations
from η = 0 result from a deceleration of the ET rate, which e. g. occurs in diffusion-limited
(Nernstian ideal: η = 29.5 mV) or generally mass transfer limited redox processes as well as
in systems, where an electrode approach of the redox species is impeded and the redox
process is facilitated by an electron tunneling through the electrolyte solution to render it
limited by the charge transfer resistance RCT. For diffusionless systems, Marcus theory
predicts an exponential decay of the ET rate constant with an increasing distance of the
redox center to the electrode surface according to the following equation (β = decay
constant):
³0 ∝ �(�¸L) (6.13)
CV qualifies for an analysis of kinetic parameters (k0, α), since it facilitates the study of
the electron transfer rate relatively to an externally applied CV scan rate. The most valuable
analytical parameter for a kinetic analysis with CV is the overpotential η = ∆(Epa-E1/2), which
relates to the ET rate according to eq. (6.11) and (6.12). As long as the applied scan rate v is
small compared to k0 of the heterogeneous ET, the redox process is not limited by its ET rate
and resides in thermodynamic equilibrium with kf = kb. The increase of the CV scan rate to v
≥ k0 externally enforces a limitation of the ET to render the ET kinetically controlled, and the
overpotential η becomes sensitive to the applied CV scan rate. Thereby, k0 gets increasingly,
relatively smaller compared to v, which reflects in a drift of the overpotential to increasingly
larger values according to (6.11) with a detectable increase in the CV peak separation ∆(Epa-
E0’). This proceeds, until k0 gets too small relatively to the applied large v, to cause a
detectable ET during the short time scale of the voltammetric scan. A CV analysis of the ET
kinetics hence requires the application of a larger range of CV scan rates in order to enforce
the system into the respective overpotential region. For the analysis of fast ET processes,
which reveal a scan rate sensitivity of the overpotential only at large v, fast scan cyclic
voltammetry (FSCV) reveals to be a powerful tool, since it facilitates the application of large
scan rates up to 25 kV/s. Difficulties of this method arise from the fact that the charging
background current linearly depends on v according to eq. (6.7), while the diffusion-limited
faradaic peak current only depends on v1/2 according to eq. (6.1). Due to this and the
increase of the peak widths when the applied can rate is becoming fast compared to the
electron transfer rate, it is increasingly difficult with an increasing CV scan rate to detect and
analyze the CV peaks.

6. Electrochemical Studies
91
Fig. 6-5 demonstrates a typical scan rate dependency of the overpotential ∆(Ep-E0’) of a
(largely) ET limited redox process, determined at a P26•D3/MCH modified electrode by FSCV
in a scan rate range of v = 0.1 – 2000 V/s.
Fig. 6-5. FSCV analysis of a P26•D3/MCH modified gold electrode.
The FSCV based determination of the rate constants kf and kb and the transfer coefficient α
of the ET process of diffusionless adsorbed, redox active species (exemplary: P26•D3/MCH
interface in Fig. 6-5) can be performed according to E. Laviron based on the following,
Marcus theory derived equations, as long as a peak separation of n∆E > 200 mV can be
experimentally achieved:273, 274
� ¯ = �0� − V ��_��Z �v V_���
��A¹Z (6.14)
� @ = �0� + V ��(#�_)��Z �v º(#�_)���
��A» ¼ (6.15)
These equations can be solved, to allow a determination of kf, kb and α from the ∆(Epa/pc-
E1/2) vs. ln v plot (see Fig. 6-5) according to the following equations.
� ¯ − �0� = − V ��_��Z �v V _��
��A¹Z − V ��_��Z ln � (6.16)
� @ − �0� = V ��(#�_)��Z �v º(#�_)��
��A» ¼ + V ��(#�_)��Z ln � (6.17)
The linear fits of the scan rate sensitive overpotential region (dashed lines in Fig. 6-5),
when v becomes fast compared to k0, facilitates the calculation of α from the slope B, and kf
and kb from their y-axis intercepts A according to the following equations (exemplarily
formulated for the anodic fit of the plot of ∆(Epa-E0’) vs. ln v):
-2 0 2 4 6 8-0.2
-0.1
0.0
0.1
0.2
Δ(E
p-E
0’) /
V
ln v / Vs-1
Epc
Epa
6. Electrochemical Studies
92
± = 1 − ����½» (6.18)
³F = (#�_)���� �º�(§�¾)¿»À�
� ¼ (6.19)
By using the half-wave potential E1/2 instead of the formal potential E0’ in all calculations, the
system is formally brought into thermodynamic equilibrium with kf = kb = k0, which
facilitates the calculation of the standard ET rate constants k0 from the ∆(Epa-E0’) vs. ln v
applying the described equations and method.275
The analysis of ET kinetics can be furthermore performed by SWV, which was mainly
studied by Osteryoung and O’Dea.276, 277 In analogy to CV, the faradaic process requires for
an analysis of the ET kinetics to be enforced to large overpotentials by the variation of SWV
parameters, whereby the potential separation between the peaks in the SWV forward and
backward scans is exploited as the basis for the kinetic analysis. Two different measuring
modes can be applied, wherein only one SWV parameter is modulated, respectively. In the
first measuring mode (pulse mode I), large SWV frequencies f (small tp) are applied, which
directly corresponds to the FSCV technique described in the previous section. The second
mode (pulse mode II) is the application of large pulse heights ΔEp, wherefore a separation of
the peaks in forward and backward current is predicted already at low frequencies.276, 278 In
contrast to SWV pulse mode I as well as to the FSCV technique, the anodic peak Epa (forward
scan) is shifted to more negative, and the cathodic peak Epc (backward scan) is shifted to
more positive values. The reason for this is that Epa is detected at the applied potential E
with E + ∆Ep = Epa, where an increase of the amplitude A = ∆Ep evokes that Epa is detected at
increasingly smaller applied potentials E, explaining the anodic shift of Epa with an increasing
SWV amplitude (vice versa counts for Epc). Since the ET rate constants kf and kb are
modulated only linearly by varying f (tp), but are modulated exponentially by varying the
SWV amplitude ΔEp, the latter mode responses more sensitively towards the ET kinetics.276
In comparison to a FSCV analysis of the ET kinetics, the SWV pulse technique mainly benefits
from the smaller capacitive background currents in SWV (see section 6.2.2).
6.3 Structural Characteristics of Fc-PNA and Fc-PNA•DNA Strands
The mechanical properties of Fc-PNA(•DNA) strands will be addressed in this section
based on the WLC model (section 1.2.2). In order to calculate the contour length lc for PNA
single strands and PNA•DNA duplexes, a helical-like, base-stacked structure is assumed for

6. Electrochemical Studies
93
the PNA single strand based on the self-melting studies of P26 (section 5.3.4) and a double-
helical, B-type structure is assumed for the PNA•DNA duplex based on the UV melting curve
analysis and reported NMR and X-ray analysis.97 According to this, a helical rise per base pair
of 3.2 Å for the single strand and of 3.5 Å for the PNA•DNA duplex were adopted from
literature.84, 97 For the attached ferrocene moiety the reported helical rise per base pair of
5 Å84 was adopted from literature, whereas the contour length of the peptidic Lys-Ahx-Cys
linker was determined with the software Molecular Modeling Pro Plus (ChemSW, Inc.,
Fairfield, CA, USA) and energy minimized by the MM2 method to yield an estimated value of
13.8 Å. Tab. 6-1 shows the contour lengths lc of the PNA(•DNA) species P26 – P30 (3 – 16 nt),
which were calculated from the given incremental values.
Tab. 6-1. Molecular characteristics of the single-stranded Fc-PNA conjugates P26 – P30 and their fully-complementary Fc-PNA•DNA duplexes.
Fc-PNA conjugate
lnt / nt
PNA single strand PNA•DNA duplex
lc / Å lc / lp a lc / Å lc / lp a
P27(•D15) 3 29.3 1.4 – b – b
P28(•D16) 6 39.8 2.8 – b – b
P29(•D17) 9 50.3 4.2 47.6 0.06
P26(•D3) 12 60.8 5.6 57.2 0.08
P30(•D18) 16 74.8 7.5 70.0 0.10
Since no values are reported for the persistence length of PNA strands, the elasticity of
PNA single strands and PNA•DNA duplexes will be estimated in comparison to the reported
values of the analogous DNA(•DNA) species (lp(DNA) = 0.75 nm, lp(DNA•DNA) = 50 nm).123, 124
The MD simulations of Nilsson et al.126, 127 and Beratan et al.128 predict a larger flexibility of
PNA compared to DNA due the larger adaptability of the flexible methylene-carbonyl linkage
between the nucleobases and the PNA backbone (section 1.2.2), although a further impact
has to be ascribed to the neutral character of the PNA backbone. In highly charged polymers
like DNA, so called polyelectrolytes, the total persistence length lp comprises besides the
persistence length l0 of the uncharged polymer an additional contribution due to the self-
repelling electrostatic interaction between the charges located at the polymer, which
increases the polymer stiffness and enlarges the persistence length.279-281 This is addressed
in the following equation by the electrostatic persistence length le (λ = Q/lc, average line
charge density along the chain).

6. Electrochemical Studies
94
� = �0 + �� = �0 + �ÁÂ]4Ã] ] (6.20)
With respect to the electrically neutral backbone of PNA, the electrostatic persistence le
equals zero for PNA strands. Reflecting about the total persistence length lp of PNA(•DNA)
species in comparison to lp(PNA(•DNA)) with respect to the structurally dictated persistence
length l0 and the electrostatic persistence length le, results in the following detailed view: (i)
ssPNA: l0(ssPNA) < l0(ssDNA), le = 0 and (ii) PNA•DNA: l0(PNA•DNA) < l0(DNA•DNA),
le(PNA•DNA) = le(DNA•DNA)/2. Whereas the absence of any repelling forces in combination
with the impact of structural properties renders the PNA single strand significantly more
flexible than ssDNA, charge repulsion is still present in the PNA•DNA duplex, rendering its
flexibility more similar to that of the analogous DNA•DNA duplex than it would be for a pure
PNA•PNA duplex. For an estimate of the relevant lc / lp ratios (see Tab. 6-1, compare to
section 1.2.2), the literature values reported for the persistence lengths of the analogous
DNA(•DNA) species are taken, which have to be considered to be actually larger than
lp(PNA). With respect to the discussion so far, the calculated lc / lp ratios hence present the
lower limit of the actual lc / lp values. Thereby, the ratios of lc / lp = 5.6 for P26 and lc / lp =
0.08 for P26•D3 indicate according to this estimate that the P26 single strand actually has to
be considered as rope-like, whereas a rod-like bending elasticity is predicted for the P26•D3
duplex. Molecular modeling of P26 and P26•D3 with YASARA (CMBI – Radboud University,
Nijmegen, The Netherlands) visualizes the 3-dimensional structures of the PNA single and
PNA•DNA double strand.
Fig. 6-6. Molecular models of P26 (left) and P26•D3 (right).

6. Electrochemical Studies
95
6.4 Electrochemical Studies of Dissolved Fc(-Tz)-PNA Conjugates
6.4.1 Electrochemical Setup
A standard three-electrode electrochemical cell consisting of a glassy carbon working
electrode (WE, Ø = 2 mm), an Ag/AgCl (in 3 M KCl) reference electrode (RE) and a platinum
wire as counter electrode (CE), placed in a Faraday cage, was used as the standard setup for
all electrochemical studies in solution. Different electrolyte solutions were used, as denoted
in each case.
The special challenge of these solution studies was in the requirement of a sufficient
volume and concentration of the PNA/electrolyte solution for sufficient signal intensity,
which was difficult to fulfill due to the high cost of PNA and the related availability of solely
minor sample quantities. This challenge was met by performing all measurements with the
following modified electrode arrangement, which facilitates the measurement of small
sample volumes (V ≥ 80 µL).282 Therein, the glassy carbon working electrode was arranged
with its electrode surface faced upwards, to form the electrolyte reservoir with a small
polypropylene tube (see Fig. 6-7).282 Reference and counter electrode were immersed into
the electrolyte solution from above.
Fig. 6-7. Picture of the microvolume electrochemical cell.

6. Electrochemical Studies
96
6.4.2 Fc-PNA Conjugates with Amide-Bound Fc Moieties (Set 1,3)
Exemplary for the Fc-PNA conjugates of sets 1 and 3 (Tab. 4-3 and Tab. 4-5) with amide-
bound Fc moieties, the conjugate P26 was studied by CV and SWV of a 20 µM solution of
P26 in 0.1 M PBS (pH 7.4) as the supporting electrolyte. Besides the single-stranded species
P26 also its fully-complementary duplex P26•D3 as well as the thermodynamically stable
SNP duplex P26•D1, which reveals an internal a/C mismatch, were electrochemically studied.
CV (at v = 0.25 V/s) of all three Fc-PNA species P26, P26•D3 and P26•D1 revealed one-
electron waves with a quasi-reversible Nernstian behavior (data in Tab. 6-2). Thereby, CV of
P26•D3 revealed slight aberrations from the Nernstian ideal, which is ascribed to its smaller
diffusion coefficient, as will be analyzed further down. The CV half-wave potential E1/2 of P26
was determined to be E1/2 = 480 mV vs. Ag/AgCl, as expected for amide-bound ferrocene
derivatives.208 The half-wave potentials of both duplexes P26•D3 as well as P26•D1 were
found to be E1/2 = 440 mV vs. Ag/AgCl, which corresponds to a potential shift about -40 mV
compared to E1/2 of the single-stranded species P26. This effect is ascribed to the negative
charge of the DNA backbone, which is accumulated at the neutral PNA strand upon
hybridization. The phosphate anions of the DNA backbone can exert an electron donating
effect upon the Fc0/+ redox couple, to facilitate the Fc0 oxidation and impede the Fc+
reduction, which explains the shift of E1/2 to more negative values.283 This potential shift is
clearly observable in the SWV overlay shown in Fig. 6-8.
Fig. 6-8. A) CV of P26 (c = 0.8 mM). B) SWV (b. s.) overlay of P26, P26•D1 and P26•D3 (c = 20 µM).
CV at varying scan rates (v = 0.5 – 2 Vs-1) revealed for all species P26, P26•D3 and
P26•D1 that the anodic peak current ipa is linearly proportional to √� (quality of linear fit: R2
> 0.99). This behavior is characteristic for free diffusing species according to the Randles-
Sevcik eq. (6.1).267 This observation suggests that no unspecific adsorption of the Fc-PNA
species to the glassy carbon surface of the WE had occurred during the time scale of the
measurements. A confirmation therefore is given by the unchanged charging current ic,
0.2 0.3 0.4 0.5 0.6 0.7-0.2
-0.1
0.0
0.1
0.2
i / µ
A
E / Vvs.Ag/AgCl
P26
A
P26P26•D1P26•D3
0
0.05
0.10
0.15
0.20
i / µ
A
0.2 0.3 0.4 0.5 0.6 0.7E / Vvs.Ag/AgCl
B

6. Electrochemical Studies
97
determined of the electrode in pure electrolyte solution before and after the respective
measurement.
Fig. 6-9. Randles-Sevcik plot for P26, P26•D3 and P26•D1.
The diffusion coefficients DO of P26, P26•D3 and P26•D1 could hence be determined from
the slopes of the straight lines resulting in the ipa/√�-plot, based on the linearized form of
eq. (6.1) so that DO equals to (S: slope of the respective straight line in Fig. 6-9):
�Ä = 5.0205 V����Z�# Æ]v���](h∗)�] (6.21)
Thereby, a diffusion coefficient of DP26 = 20.3 x 10⁻⁸ cm2/s was determined for the single-
stranded Fc-PNA conjugate P26, whereas a value of DP26•D3 = 1.9 x 10⁻⁸ cm2/s was
determined for its fully-complementary duplex P26•D3. Comparable to the diffusion
coefficients reported for single- and double-stranded Fc-DNA conjugates (20-mer, DssDNA =
2.2 x 10⁻⁶ cm2/s and DdsDNA = 1.7 x 10⁻⁶ cm2/s)88, the PNA single strand P26 exhibits a larger
diffusion coefficient than the PNA•DNA duplex P26•D3, although that difference is
developed to a much larger extent than at the reported DNA analogs. This different behavior
between the two pairs of species is mainly ascribed to the electrically neutral PNA backbone.
The absence of negative charges at the single-stranded Fc-PNA oligomer is considered to
evoke that the diffusion process is less affected by electric field during the electrode
reaction. The accumulation of negative charges upon hybridization with DNA thereby leads
to the smaller diffusion coefficient for P26•D3. In contrast, single- and double-stranded DNA
species are both negatively charged polyelectrolytes hence exhibiting less difference in their
diffusion behavior. The SNP duplex P26•D1 reveals a diffusion coefficient of DP26•D1 = 6.6 x
10-8 cm2/s, which is still significantly lower than DP26 of the single-stranded Fc-PNA species,
however interestingly 3.5-fold larger than DP26•D3 of the fully complementary duplex. Due to
the electrically similar characteristics of P26•D3 and P26•D1 (both negatively charged
polyelectrolytes), the increased flexibility due to the insertion of the mismatch as a flexible
0.5 0.7 0.9 1.1 1.3 1.50
20
40
60
80
100
120
i pa /
nA
√ v / (V/s)1/2
P26P26•D1P26•D3

6. Electrochemical Studies
98
hinge is considered the main reason for that effect. The larger flexibility of P26 can also be
considered as contributing to the larger diffusion coefficient of P26 compared to that of the
more rigid fully complementary duplex P26•D3. According to equation (6.10), the differential
SWV peak current Δip is linearly proportional to 1�Ä (for hÄ∗ = const.). As a result from
different diffusing coefficients D, different peak heights should be observed in differential
SWV (analogous argumentation for CV), which is actually the case for the species P26,
P26•D3 and P26•D1, as shown in Fig. 6-8.B.
Tab. 6-2. CV analysis P26, P26•D3 and P26•D1 (v = 0.25 Vs-1).
Fc-PNA conjugate
E1/2 vs. Fc0/+ / mVa
∆Ep / mVa ipc/ipa ipa
/ nA DO
/ cm2 s-1
P26 481 57 0.98 20.6 20.3 x 10⁻⁸
P26•D1 438 57 1.02 17.5 6.6 x 10⁻⁸
P26•D3 439 76 1.11 14.4 1.9 x 10⁻⁸
Effects of the electric field, the strand flexibility and an internal mismatch were briefly
anticipated in this section for a coherent interpretation of the electrochemical behavior of
the species under study, but will be discussed in more detail in section 6.6.1.
6.4.3 Fc-Tz-PNA Conjugates with Triazole-Linked Fc Moieties (Set 5)
6.4.3.1 Analysis of the Trimer-t3 Model Compounds P31, P33, P36 and P38
The electrochemical behavior of the Fc-Tz-PNA conjugates P31, P33, P36 and P38 with
the trimer model sequence H–t t t–LysNH2 was examined by CV and differential pulse
voltammetry (DPV). Each of these four conjugates contained a ferrocene moiety that was
attached to the N-terminus of the t3-PNA sequence via one of the four specific click reactions
described in section 3.4 (Fig. 3-13, Fig. 3-16 and Fig. 3-19). The compounds are hence
structurally comparable and only differ in the chemical environment of their ferrocene
moieties. Due to a generally significantly poorer solubility of the triazole-containing Fc-Tz-
PNA conjugates compared to the analogous Fc-PNA conjugates in aqueous solution, a
solution of 0.2 M sodium perchlorate in a 1:1 mixture of ACN and MOPS buffer (0.15 M,
pH 7.4) was chosen as the supporting electrolyte for all measurements presented in this
section (c(Fc-Tz-PNA) = 0.8 mM).
CV (at v = 0.25 V/s) of all the Fc-Tz-PNA conjugates revealed one-electron waves with a
quasi-reversible Nernstian behavior. Peak-to-peak separation values of ΔEp = +80 mV to
+114 mV were observed, which are 8 to 42 mV larger than the ΔEp value obtained with the

6. Electrochemical Studies
99
same electrochemical setup for the fully reversible redox couple FcH0/+ (ΔEp = +72 mV). The
azido-PNA derived Fc-PNA conjugates P31 and P33 yielded peak-to-peak current ratios ipc/ipa
close to unity. In contrast, the alkyne-PNA derived conjugates P36 and P38 exhibited
aberrations from the Nernstian ideal with the value of ipc/ipa = 1.17, determined for P38,
being larger and ipc/ipa = 0.81, determined for P36, being smaller than unity. This indicates
that P36 is electrochemically less stable under the chosen conditions. The CV half-wave
potentials E1/2 were determined vs. the redox couple FcH0/+ as an external standard, which
revealed a half-wave potential of E1/2 = 270 mV vs. the Ag/AgCl (in 3 M KCl) reference in the
chosen setup and electrolyte solution. The E1/2 values determined for the Fc-Tz-PNA
conjugates spread over 280 mV and range from E1/2 = -14 mV vs. FcH0/+ for compound P38 to
E1/2 = +269 mV vs. FcH0/+ for compound P36, which was confirmed by DPV.
Fig. 6-10. CV (v = 0.25 V/s) of the Fc-Tz-conjugates P31, P33, P36 and P38.
Conjugate P33 revealed a value of E1/2 = +208 mV (vs. FcH0/+), which corresponds well to
previously measured (section 6.4.2) as well as to literature values for PNA with an amide-
bound Fc moiety.208 This was expected, since conjugate P33 is derived from a
propargylamido ferrocene derivative and therefore contains a Cp-bound amide function.
Conjugate P36 reveals a potential of E1/2 = +269 mV (vs. FcH0/+), corresponding to a shift to
positive potentials of +61 mV compared to P33. In contrast, a potential of E1/2 = +97 mV (vs.
FcH0/+) was determined for conjugate P31, corresponding to a shift of -111 mV to negative
-0.3 -0.2 -0.1 0.0 0.1 0.2
-6
-4
-2
0
2
4
6
8
10
i /µA
E / V vs. FcH0/+
P38
-0.1 0.0 0.1 0.2 0.3
-1
0
1
2
3
i /µA
E / V vs. FcH0/+
P31
0.1 0.2 0.3 0.4 0.5
-1
0
1
2
3i /
µA
E / V vs. FcH0/+
P36
-0.1 0.0 0.1 0.2 0.3 0.4 0.5
-1
0
1
2
3
i /µA
E / V vs. FcH0/+
P33

6. Electrochemical Studies
100
potentials compared to P33. Both conjugates P36 and P31 contain Fc moieties carrying the
triazole structure in α-position to the Cp ring, whereby the Fc moiety of P36 is bound to a
nitrogen atom (N-1), whereas the Fc moiety of P31 is bound to a sp2-hybridized carbon atom
(C-4) of the respective triazole ring. Independent of contributing effects of a probable
Cp/triazole-conjugation, it can be assumed that differences in the electronegativity of the
respective Cp-bound triazole ring atoms have a strong influence on the Fc0/+ half-wave
potentials of P36 and P31.284 The determined half-wave potential of P38 just exhibits a small
shift to negative potentials of E1/2 = -14 mV compared to the FcH0/+ redox couple, which is
comparable to literature values for methyl or methylene substituted ferrocene derivatives285
and is explained by the +I effect of the methylene group in α-position to the Cp ring. This
indicates that the methylene group actually determines the E1/2 value of P38 and suppresses
the influence of the triazole ring by disconnecting it from the Fc moiety. In comparison, P36
with the analogous structure but a direct Fc-Tz connection reveals the largest measured E1/2
value out of this small library of compounds. Arranging the Fc substituents R of the Fc
derivatives P31, P33, P36 and P38 with regard to their electrochemical half-wave potentials
reveals the following order of increasing E1/2 values:
Fig. 6-11. Substituents of Fc-R derivatives arranged according to their half-wave potentials E1/2.
The increase in E1/2 values is therein clearly accompanied by an increase in the electron
withdrawing effect of the molecular fragment in α-position to the Cp ring, as described
above. P38 reveals a lower E1/2 value than FcH due to the +I effect of its α-Csp3, whereas the
-I effect of the sp2 hybridized α-C of P31 evokes a larger E1/2 value than FcH. Whereas P31
obtains only one heteroatom in β-position, P33 exhibits two heteroatoms in β-position,
which cause a larger withdrawing effect for α-Csp2 and a larger E1/2 value. The largest E1/2
value is exhibited by P36, which possesses a heteroatom in α-position to the Cp ring.
Generally, with an increasing electron withdrawing effect, the Fc0 oxidation is impeded,
whereas the Fc+ reduction is facilitated, which explains the observed increase of E1/2 values.
R= < H
O
NN
N
PNA PNAN
N N
OPNA
O
NN
N< < <
PNAN
N N
O
NH
O
P38 FcH P31 P33 P36
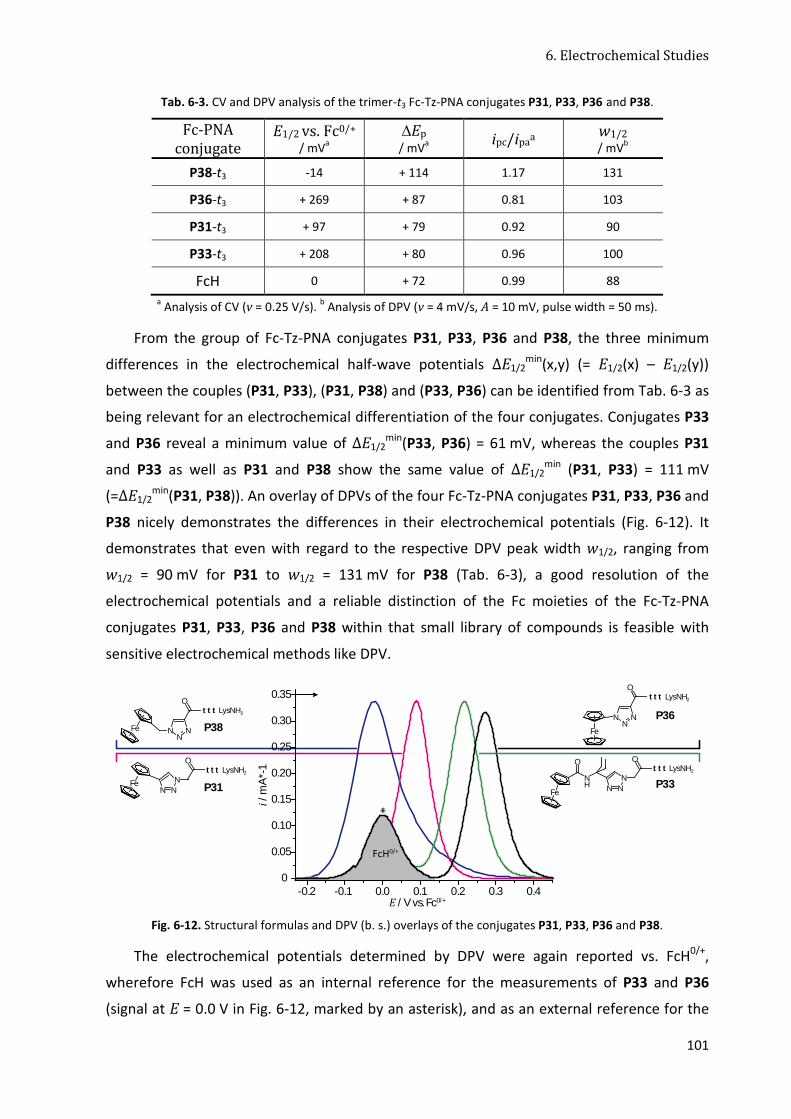
6. Electrochemical Studies
101
Tab. 6-3. CV and DPV analysis of the trimer-t3 Fc-Tz-PNA conjugates P31, P33, P36 and P38.
Fc-PNA conjugate
E1/2 vs. Fc0/+ / mVa
∆Ep / mVa ipc/ipaa w1/2
/ mVb
P38-t3 -14 + 114 1.17 131
P36-t3 + 269 + 87 0.81 103
P31-t3 + 97 + 79 0.92 90
P33-t3 + 208 + 80 0.96 100
FcH 0 + 72 0.99 88
a Analysis of CV (v = 0.25 V/s). b Analysis of DPV (v = 4 mV/s, A = 10 mV, pulse width = 50 ms).
From the group of Fc-Tz-PNA conjugates P31, P33, P36 and P38, the three minimum
differences in the electrochemical half-wave potentials ΔE1/2min(x,y) (= E1/2(x) – E1/2(y))
between the couples (P31, P33), (P31, P38) and (P33, P36) can be identified from Tab. 6-3 as
being relevant for an electrochemical differentiation of the four conjugates. Conjugates P33
and P36 reveal a minimum value of ΔE1/2min(P33, P36) = 61 mV, whereas the couples P31
and P33 as well as P31 and P38 show the same value of ΔE1/2min (P31, P33) = 111 mV
(=ΔE1/2min(P31, P38)). An overlay of DPVs of the four Fc-Tz-PNA conjugates P31, P33, P36 and
P38 nicely demonstrates the differences in their electrochemical potentials (Fig. 6-12). It
demonstrates that even with regard to the respective DPV peak width w1/2, ranging from
w1/2 = 90 mV for P31 to w1/2 = 131 mV for P38 (Tab. 6-3), a good resolution of the
electrochemical potentials and a reliable distinction of the Fc moieties of the Fc-Tz-PNA
conjugates P31, P33, P36 and P38 within that small library of compounds is feasible with
sensitive electrochemical methods like DPV.
Fig. 6-12. Structural formulas and DPV (b. s.) overlays of the conjugates P31, P33, P36 and P38.
The electrochemical potentials determined by DPV were again reported vs. FcH0/+,
wherefore FcH was used as an internal reference for the measurements of P33 and P36
(signal at E = 0.0 V in Fig. 6-12, marked by an asterisk), and as an external reference for the
t t t LysNH2
t t t LysNH2
t t t LysNH2
-0.2 -0.1 0.0 0.1 0.2 0.3 0.40
0.05
0.10
0.15
0.20
0.25
0.30
0.35
i / m
A*-
1
E / Vvs. Fc0/+
FcH0/+
O
NN
N
Fe
NN N
t t t LysNH2
O
NH
O
Fe
NN N
Fe
O
O
NN
NFe
P31 P33
P36P38

6. Electrochemical Studies
102
measurements of P31 and P38 (likewise for all CV measurements), to avoid an overlap of the
corresponding redox processes.
6.4.3.2 Analysis of the 12-mer Fc-Tz-PNA(•DNA) Species P32 and P32•D2
Exemplary for the triazole-containing 12-mer Fc-Tz-PNA conjugates of set 5 (Tab. 4-8),
the conjugate P32 was studied by CV and SWV of a 20 µM solution of P32 in 0.1 M PBS
(pH 7.4) as the supporting electrolyte. Thereby, the single-stranded Fc-Tz-PNA conjugate P32
was electrochemically studied in comparison to its fully-complementary duplex P32•D2.
CV (v = 0.5 V/s) reveals a half-wave potential of E1/2 = 330 mV for P32 whereas the
potential of the fully-complementary duplex P32•D2 is E1/2 = 298 mV, representing a shift to
more negative potentials of about ΔE1/2 = -32 mV. This potential shift is comparable to that
detected at the amide-bound Fc moiety of the conjugates P26 and P26•D3 (section 6.4.2),
and in analogy ascribed to the accumulation of negative charge upon DNA hybridization. The
difference in the E1/2 values of the structurally analogous conjugates P32 (12-mer) and P31
(trimer) is ascribed to the different electrolyte solutions rather than the different sequence
length.
Fig. 6-13. SWV (b. s.) overlay and Randles-Sevcik plot of P32 and P32•D2.
The diffusion coefficients Da of P32 and P32•D2 were determined from the Randles-
Sevcik plot (Fig. 6-13.B) according to eq. (6.21). In analogy to the diffusion coefficients
determined for P26 and P26•D3 (section 6.4.2), the single-stranded species P32 revealed a
significantly, 3.1 times larger diffusion coefficient than the fully-complementary duplex
P32•D2 (Da(P32) = 478.8 x 10⁻⁸ cm2/s, Da(P32•D2) = 48.5 x 10⁻⁸ cm2/s). For this finding, the
same argumentation like that given in section 6.4.2 is considered as explanation.
Interestingly, the diffusion coefficients of P32(•D2) are both about one order of magnitude
larger than that of P26(•D3), which is explained by the presence of the electron-rich triazole
ring. The positive electric field, which is applied during CV or SWV, can exert a more efficient
0.0 0.1 0.2 0.3 0.4 0.5 0.6 0.70.0
0.1
0.2
0.3
0.4
0.5
i / µ
A
E / Vvs.Ag/AgCl0.6 0.8 1.0 1.2 1.4 1.6 1.8 2.0
0.0
0.1
0.2
0.3
0.4
0.5
0.6
0.7
0.8
i p /
µA
P32P32•D2
√ v / (V/s)1/2
A B
P32P32•D2

6. Electrochemical Studies
103
pulling effect onto the electron richer head group of the Fc-Tz-PNA in comparison to the
triazole-free Fc-PNA conjugates, which evidently accelerates the diffusion of the Fc moiety to
the electrode surface. This different diffusion behavior between the two types of species has
to be taken into account in all the following interfacial studies.
6.4.4 Conclusion
The presented studies of Fc-PNA and Fc-Tz-PNA species in solution revealed that all the
different Fc labels exhibit electrochemical half-wave potentials in a range of E1/2 = 255 –
540 mV vs. Ag/AgCl and are electrochemically reversible and stable in both CV and SWV.
However, the Fc label of conjugate P36 appeared to be least electrochemically stable.
Thereby, the single-stranded Fc(-Tz)-PNA species exhibited a different electrochemical
response than the corresponding fully-complementary duplexes. The electrochemical half-
wave potential E1/2, the peak current ip as well as the correlated diffusion coefficient Da were
determined to be generally smaller in the respective duplex state. This electrochemical
sensitivity of the Fc label towards the hybridization with DNA presents a promising finding
for a later application of the Fc(-Tz)-PNA species as the recognition element in
electrochemical DNA biosensors.
The series of the four new Fc-triazole labels of conjugates P31, P33, P36 and P38,
synthesized by click chemistry, exhibited potential differences larger than ΔE1/2min
= 60 mV,
which facilitate a differentiation with sensitive electrochemical methods like SWV or DPV.
This is of significant interest for an application of the Fc-Tz-PNA conjugates as capture probes
in DNA biosensing, since this set of Fc-label provides the basis for a potential selective
labeling of PNA, whereby certain PNA sequence information can be correlated to a certain
electrochemical potential. Vice versa, a clear identification of the respective PNA sequence
by its electrochemical potential is facilitated, such that the set of four Fc labels presents an
interesting ‘four-potential’ labeling tool, which is especially attractive for an electrochemical
SNP detection of the four nucleobases A, T, G and C. With this, the ‘four-potential’ labeling
set presents the basic tool for an electrochemical analog of the ‘four-color’ detection with
four different dyes in classical DNA sequencing. Kuhr et al. were the first to report a related
‘four-potential’ labeling set for the Fc labeling of DNA oligomers, however with a minimal
potential difference of ΔE1/2min
= 34 mV, which is already critically small for a clear
differentiation even with sensitive electrochemical methods.286, 287 The application of the
[2+3] azide/alkyne cycloaddition as one and the same key reaction for the conjugation of all
different ferrocene derivatives bears practical benefits such as the possibility for a synthetic

6. Electrochemical Studies
104
automation. Furthermore, the triazole-linkage between Fc and PNA, as the resulting
common structural motif, evokes a maximal structural (as well as electronic) comparability
within the set of conjugates, which is combined with a significant electrochemical
differentiability. These features present the foundation for the development of a dual-
potential biosensor, which will be presented in section 6.7.2.
6.5 Interfacial Studies of Fc(-Tz)-PNA Modified Gold Surfaces
6.5.1 General Setup
All electrochemical measurements of modified gold electrodes were undertaken using a
standard three-electrode electrochemical cell consisting of the modified gold electrode as
working electrode, an Ag/AgCl (3 M KCl) reference electrode (E0 = –0.21 V vs. NHE)288 and a
platinum wire as counter electrode. The whole setup was placed in a Faraday cage. A
solution of 2.5 mM NaH2PO4 buffer (pH 7.0) containing 0.1 M NaClO4 was chosen as the
standard electrolyte solution for all experiments (deviations are indicated in each case). A
NaClO4/PBS mixture was chosen as the electrolyte instead of pure phosphate buffer, since it
exhibits a lower nucleophilicity which is supposed to prevent the oxidized ferrocenium(III)
cation from degradation.245 The electrolyte solution was purged with argon gas for 15 min
for removal of dissolved gases. During this work, the following three different types of gold
electrodes with polycrystalline, disk-shaped gold surfaces were used as working electrodes.
Fig. 6-14. Pictures of A) 4 x 4 chip. B) Homemade gold microelectrode.
As preparation for the subsequent immobilization process, the gold electrodes of types B
and C were first mechanically polished with wet alumina slurries of decreasing particle sizes
(1.0 µm, 0.3 µm) on polishing cloth, then rinsed with MilliporeTM water and polished again on
moistened polishing cloth to remove adsorbed alumina traces. Afterwards, all gold surfaces
(types A – C) were electrochemically cleaned by performing cyclic voltammetry in 0.5 M
sulfuric acid in a potential range of E = 0.0 – 1.7 V vs. Ag/AgCl (in 3 M KCl) at a scan rate of
v = 0.1 Vs-1 until stable oxidation/reduction currents of the formed gold oxide indicated a

6. Electrochemical Studies
105
clean gold surface (about 50 cycles).289 After rinsing with MilliporeTM water, the freshly
prepared gold electrodes were immediately subjected to the immobilization process (section
6.5.2.1) to avoid contamination of the gold surface.
Fig. 6-15. CV of a gold microelectrode (Ø = 0.01 mm) in A) 0.5 M sulfuric acid (v = 0.1 V/s) and
B) 0.1 M PBS (pH 7.4), (v = 0.05 V/s).
The microscopic surface area Areal of a gold electrode was determined applying the
method of Bennekom et al., which is based on the quantitative analysis of the electrolytic
formation of a gold oxide monolayer (Au : O = 1:1) during CV in a potential range of -0.1 –
1.2 V (Fig. 6-15.B: v = 0.05 V/s, two scans. Electrolyte: 0.1 M PBS, pH 7.4).155 The charge QAuO
which is required for the complete reduction of the gold oxide monolayer equals the integral
of the background subtracted cathodic peak at Epc = 0.47 V vs. Ag/AgCl according to eq.
(6.23) (Fig. 6-15.B, shaded area). Areal is obtained after dividing QAuO by a theoretical value
for the charge density σth = 482 µC/cm2, which is required for the reduction of an ideal
monolayer of chemisorbed oxygen on a polycrystalline gold surface.290 The quality of a gold
surface is characterized by its roughness factor ρ, which is defined as the ratio of the
microscopic Areal and the theoretical geometric surface area Aideal (�CJ�@H = #O Ç ∙ ∅]).267
É = ���@H�CJ�@H (6.22)
The purchased gold electrodes with Ø = 2 mm as well as the chip embedded microelectrodes
(Ø = 0.01 mm) exhibited excellent roughness factors of ρ ≈ 1, the homemade micro-
electrodes (Ø = 0.01 – 0.25 mm) in contrast revealed lower roughness factors of ρ = 1.5 – 2.
The choice of the electrode type for a certain experiment was taken based on the
roughness factor ρ and the dimension of the electrode surface. Microelectrodesi show a
i IUPAC Definition for a microelectrode: Microelectrode is any electrode whose characteristic dimension is, under the given experimental conditions, comparable to or smaller than the diffusion layer thickness, δ. Under these conditions, a steady state or a pseudo steady state (cylindrical electrodes) is attained.291.
0.0 0.2 0.4 0.6 0.8 1.0 1.2 1.4 1.6
-4
-3
-2
-1
0
1
i / n
A
E / Vvs.Ag/AgCl0.0 0.2 0.4 0.6 0.8 1.0 1.2
-0.6
-0.4
-0.2
0.0
0.2
i / n
A
E / Vvs.Ag/AgCl
A B

6. Electrochemical Studies
106
different electrochemical behavior in comparison to macroelectrodes with larger sized
surfaces. Thereby, the low electrode capacitance Cd evokes an improved faradaic-to-
charging current ratio if/ic due to eq. (6.7) and a decrease of the cell time constant RuCd and
hence double-layer charging time. The low if/ic ratio is most relevant for all CV
measurements at Fc-PNA modified surfaces, since the maximal accessible faradaic current is
limited to the electrochemical response of the Fc-moieties tethered to one monolayer of
adsorbed PNA strands with one Fc group per strand. The dual-potential sensor studies in
section 6.7.2 were undertaken with homemade gold-microelectrodes (Ø = 0.1 mm). All FSCV
electron transfer studies were however performed with the less sensitive purchased gold
electrodes with Ø = 2 mm, since the better roughness factor ρ ≈ 1 was chosen at the cost of
a higher sensitivity to provide a defined surface structure for reliable kinetic measurements.
The use of the sensitive and smooth chip embedded microelectrodes (Ø = 0.1 mm) was
restricted to the experiments in section 6.7.3 due to a limited accessibility and operability.
6.5.2 Fc-ssPNA/Au Interface
6.5.2.1 Immobilization, Desorption and Voltammetric Response
The chemisorption of C-terminal thiol-tethered Fc-PNA conjugates onto polycrystalline
gold surfaces is based on the reductive formation of a covalent Au-S bond, which provides a
very strong surface linkage for the PNA conjugate due to a bond energy of ~1.6 eV (for
alkanethiols on Au(111))34, 35. The immobilization was generally performed by incubating the
cleaned gold electrodes with freshly prepared solutions of the respective thiol-tethered Fc-
PNA conjugate in phosphate buffer (0.1 M, pH 7.4). Excess of Fc-PNA conjugate was
subsequently removed by washing the modified electrode thoroughly with MilliporeTM
water.
Fig. 6-16. Chemisorption (black arrows) and oxidative desorption (blue arrows) of thiol- tethered Fc-PNA
species to gold surfaces. Red arrow: electron transfer of chemisorbed Fc-PNA.
S-1/2 H2
3e-
+2 H2O
-3 H+
e-
Fe
SO2H
O
Fe
SH
O
Fe
Adsorption Desorption
P26/Au
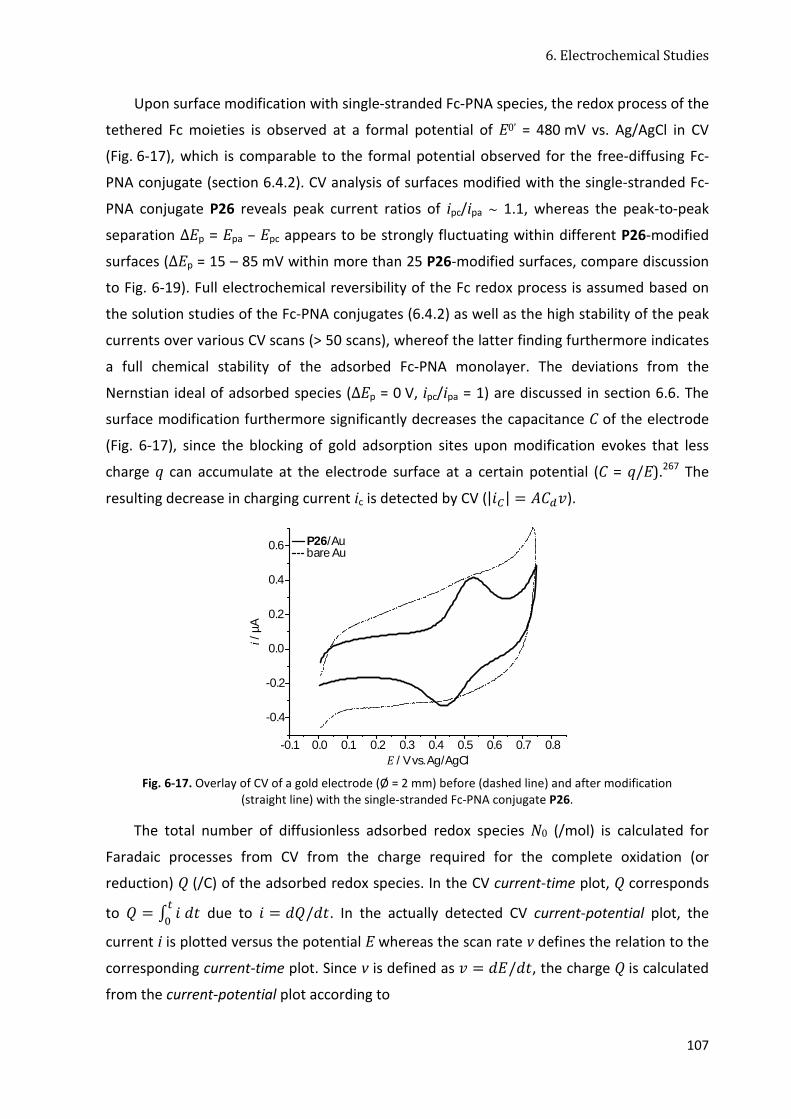
6. Electrochemical Studies
107
Upon surface modification with single-stranded Fc-PNA species, the redox process of the
tethered Fc moieties is observed at a formal potential of E0’ = 480 mV vs. Ag/AgCl in CV
(Fig. 6-17), which is comparable to the formal potential observed for the free-diffusing Fc-
PNA conjugate (section 6.4.2). CV analysis of surfaces modified with the single-stranded Fc-
PNA conjugate P26 reveals peak current ratios of ipc/ipa ~ 1.1, whereas the peak-to-peak
separation ΔEp = Epa – Epc appears to be strongly fluctuating within different P26-modified
surfaces (ΔEp = 15 – 85 mV within more than 25 P26-modified surfaces, compare discussion
to Fig. 6-19). Full electrochemical reversibility of the Fc redox process is assumed based on
the solution studies of the Fc-PNA conjugates (6.4.2) as well as the high stability of the peak
currents over various CV scans (> 50 scans), whereof the latter finding furthermore indicates
a full chemical stability of the adsorbed Fc-PNA monolayer. The deviations from the
Nernstian ideal of adsorbed species (ΔEp = 0 V, ipc/ipa = 1) are discussed in section 6.6. The
surface modification furthermore significantly decreases the capacitance C of the electrode
(Fig. 6-17), since the blocking of gold adsorption sites upon modification evokes that less
charge q can accumulate at the electrode surface at a certain potential (C = q/E).267 The
resulting decrease in charging current ic is detected by CV (|�¤| = �hJ�).
Fig. 6-17. Overlay of CV of a gold electrode (Ø = 2 mm) before (dashed line) and after modification
(straight line) with the single-stranded Fc-PNA conjugate P26.
The total number of diffusionless adsorbed redox species N0 (/mol) is calculated for
Faradaic processes from CV from the charge required for the complete oxidation (or
reduction) Q (/C) of the adsorbed redox species. In the CV current-time plot, Q corresponds
to Ê = Ë � Ì¥E0 due to � = ÌÊ/Ì¥. In the actually detected CV current-potential plot, the
current i is plotted versus the potential E whereas the scan rate v defines the relation to the
corresponding current-time plot. Since v is defined as � = �/̥, the charge Q is calculated
from the current-potential plot according to
-0.1 0.0 0.1 0.2 0.3 0.4 0.5 0.6 0.7 0.8
-0.4
-0.2
0.0
0.2
0.4
0.6
i / µ
A
E / Vvs.Ag/AgCl
P26/Au bare Au

6. Electrochemical Studies
108
Ê = Í �/� Ì��0
(6.23)
hence allowing the determination of Q from the integral of the background subtracted
oxidation (or reduction) wave subsequent to a normalization of the current i vs. the scan
rate v according to the following equation:267
/0 = ÊÎv ∙ � (6.24)
The surface concentration of the adsorbed redox species Γ (/ mol cm-2) results from the
division of the total number of species N0 by the microscopic surface area Areal (/ cm2) of the
electrode:
� = /0���@H (6.25)
The footprint of one molecule of adsorbed redox species FP (/ cm2) equals the electrode
area, one adsorbed molecule adopts with respect to the surface concentration at a statistical
electrode coverage.
�Ï = 1� ∙ /¦ (6.26)
The average intermolecular distance D (/ cm) between two adsorbed redox species at a
statistical electrode coverage corresponds to:88
� = √�Ï = 11� ∙ /¦
(6.27)
Since one Fc moiety pertains to one PNA strand, the gold surface coverage with PNA
strands can be quantified applying these four equations (ΓFc = ΓFc-PNA), as long as the redox
process takes place diffusionless and the electron transfer is hence not limited by diffusion.
According to the discussion in section 6.6, this is generally not the case for adsorbed Fc-
PNA(•DNA) strands, since a diffusion of the tethered Fc head group is facilitated to a certain
extent. The dependency of Qa (determined according to (6.23) after normalization vs. Qa at v
= 500 V/s) from the scan rate v reveals that Qa at the P26 as well as at a P26•D3 surface is
significantly increasing with decreasing v, however, this increase is much more intense at the
P26 modified surface. This behavior is the consequence from the dynamical features of the
surface confined strands, as will be comprehensively analyzed in section 6.6. According to
this discussion, the limitation of the Fc redox process due to its rate or a Fc diffusion induced

6. Electrochemical Studies
109
by fluctuations of the nucleic acid strands decreases at lower scan rates, which results in the
strong increase of Qa observed with decreasing scan rates.
Fig. 6-18. Scan rate dependency of Qa after normalization vs. Qa at v = 500 V/s.
For a quantification of the surface coverage with the eq. (6.24) – (6.27), the redox
process requires to be analyzed at a low scan rate v, where it is ensured that the redox
process is not limited by diffusion and all tethered Fc head groups of the adsorbed PNA
conjugates participate in the electrode reaction. Although Qa has not yet reached a
saturation value at v = 0.1 V/s, this scan rate was chosen for the surface analysis, since it
ensures the electrochemical stability of the Fc label. In section 6.5.4.2, the influence of
different physical immobilization conditions upon the resulting surface coverage of Fc-
PNA(•DNA) species will be quantified with regard to the described parameters.
In order to regenerate the bare gold electrode surface, the modified gold electrode was
subjected to a treatment comprising of mechanical and electrochemical polishing steps
analogous to that described in section 6.5.1 for the preparation of a bare gold electrode. The
electrochemical removal of the adsorbate layer is based on the fact that during CV in 0.5 M
sulfuric acid the oxidative desorption of the PNA strands proceeds at potentials larger than
E = 0.5 V, for which e. g. the 3-electron oxidation shown in Fig. 6-16 is proposed.292,293
Thereby, the first CV scan exhibits an oxidation peak at 0.5 V without a cathodic counterpart,
which indicates the irreversible PNA desorption. The oxidative desorption peak is followed
by the redox process of the bare gold electrode and is largely removed already in the second
CV scan, however more than 50 cycles were generally performed to ensure a good quality of
the regenerated, bare gold surface. Subsequently performed CV in buffer solution indicated
the removal of the adsorbate layer by a strong increase in the electrode capacitance and the
disappearance of the faradaic current of the Fc redox process. The reductive desorption of
PNA strands by applying an electrode bias more negative than E = -0.6 V was refused,268
-1 0 1 20
5
10
15
20
25
30
Qa /
%
log v / Vs-1
P26/AuP26•D3/Au

6. Electrochemical Studies
110
since this was found to provoke an increase in the electrode roughness of the homemade
microelectrodes, which was not observed upon oxidative desorption.
6.5.2.2 Time-Resolved Voltammetric Analysis of the Immobilization Process
In order to develop a deeper understanding of the nature of the adsorption process and
the significance of the CV primary parameters, the adsorption process was studied in time-
resolved fashion. Therefore, freshly prepared gold electrodes (Ø = 2 mm, ρ ~ 1) were
incubated with three differently concentrated solutions (c = 1 µM, 10 µM and 20 µM) of P26
in 0.1 M PBS (pH 7.4) at T = 37 °C and the electrodes were analyzed by CV and SWV at
different points in time during the immobilization process within 2 h.
The analysis of the current response detected with CV at v = 0.1 V/s (for c = 10 µM,
Fig. 6-19.A) reveals that the faradaic current ipa of the Fc redox process as well as the
percentaged decrease of the charging current –Δic increase with proceeding incubation time
following a saturation curve. Both parameters ipa and -Δic are proportional to the surface
concentration of attached Fc head groups ΓFc in the first approximation due to eq. (6.1) or
(6.4) and (6.7), respectively. In consequence, ipa and -Δic are also proportional to the PNA
surface concentration ΓPNA, since one Fc moiety pertains to one PNA strand. The detected
saturation curve-like behavior is predicted for a Langmuir adsorption isotherm according to
the following equation (dC*/dt = c →→→→ dC* = c ∙ dt):
Ð = �Ñt8�Ñt8{�� = bÒ ∙ h∗1 + bÒ ∙ h∗ (6.28)
Based on the linearized form of (6.28), linearity in the plot C*/ΓPNA vs. C* proves that the
adsorption process fulfills Langmuir conditions.
h∗
�Ñt8 = 1�Ñt8{�� ∙ bÒ + 1
�Ñt8{�� ∙ h∗ (6.29)
Actually, both plots (c ∙ t)/ip as well as (c ∙ t)/– Δic vs. (c ∙ t) exhibit linear slopes
indicating that the immobilization process proceeds according to the Langmuir criteria (R2 =
0.9998 and R2 = 0.9986, respectively for c = 10 µM; plots are not shown, data are plotted as i
vs. t in Fig. 6-19.A). From the respective slopes, the maximal peak current ipmax could be
calculated according to (6.29) to yield a value of ipmax = 31.6 nA (≙ jp
max = 1.01 µA/cm2) for
the immobilization of a 10 µM solution of P26, whereas upon immobilization of a 20 µM
solution a significantly larger maximum current of ipmax = 123.1 nA (≙ jp
max = 3.92 µA/cm2; R2
= 0.9957) was obtained. The maximal decrease in charging current -Δicmax was determined in

6. Electrochemical Studies
111
an analogous manner, to yield a value of –Δicmax = 36.6 % for c = 10 µM and a larger value of
–Δicmax = 42.2 % for c = 20 µM (R2 = 0.9957). However, performing the immobilization of P26
under the studied conditions (c = 20 µM, 37 °C, 2 h) without interrupting the immobilization
process for the time dependent measurements, average values of jp = 10.0 ± 4.7 µA/cm2 and
–Δic = (59.2 ± 11.9) % were detected for all experiments, which were generally larger than
the respective maximal values determined in the time-resolved experiment. These
deviations are ascribed to the interruptions of the immobilization for the respective
measurements, whereupon the electrode surface is washed and polarized, which might
affect the surface-tethered Fc-PNA strands as well as the immobilization process. The
maximal expected surface coverage reported for Fc-PNA monolayers comprised of Cys-tn-Fc
(n = 4-6) is ΓPNAmax = 300 pmol/cm2.84, 294 If all Fc heads would take part in a diffusionless
redox process, a theoretical current density of jpmax = 28.7 µA/cm2 would result at v = 0.1 V/s
according to (6.4), which is much larger than jpmax determined from Fig. 6-19 as well as the
maximal value obtained at densely packed surfaces during this work. This already indicates
that not Fc moieties of all the tethered PNA strands contribute to the detected current
response, which will be further investigated in the follow sections and will be ascribed to the
PNA strand as a long and flexible linkage between the Fc moiety and the gold surface, which
renders large Fc-electrode distances with slow electron transfer processes possible.
With regard to the adsorption isotherm for the formation of self-assembled monolayers,
which had been developed by Henderson-Kisliuk (see section 1.1.2), it is considered, that the
immobilization process in the chosen time range is mainly governed by the adsorption
process rather than a re-orientation of the strands, since -Δic as well as ip follow the
Langmuir behavior with a proceeding incubation time.39 A spectroscopic proof for the PNA
immobilization process starting with the adsorption of ‘lying down’ PNA strands, which
crosses over to a strand re-orientation with a straightening up of the strands is reported by
Martín-Gago et al.295 Fig. 6-19.A furthermore reveals that although the adsorption process
can be followed on the basis of both parameters ip and ic, the ip curve reaches its maximum
significantly earlier. Whereas the decrease in electrode capacitance/charging current is the
direct response to the modification of the gold surface to render -Δic a reliable parameter
reflecting the strand adsorption, the faradaic response of the strand-tethered Fc moiety is
furthermore governed by secondary effects like strand re-orientation and strand motion.
According to this, the detected time delay of -Δic is interpreted as an acceleration of the ip
response, which is more rapidly reaching a saturation value than -Δic due to the formation of
‘standing up’ species, provoking an impediment of the ET process and a lower peak current
(for details see discussion in section 6.6.1). This indicates that the Fc-PNA adsorption

6. Electrochemical Studies
112
proceeds with a sliding change-over between the two phases of ‘lying down’ and ‘standing
up’ molecules.
Fig. 6-19. Analysis of CV (v = 0.1 V/s) of the time-resolved immobilization process of P26 (c = 10 µM).
A) Peak and charging current progression (ipa, -∆ic) and B) Peak potential progression (E1/2, Epa, Epc, ∆Ep).
Fig. 6-19.B reveals that with increasing incubation time, the half-wave potential E1/2
significantly decreases about ~ 30 mV. Since the decrease of Epc is more than twice as large
as that of Epa (ΔEpc = - 37 mV, ΔEpa = - 15 mV), an additional increase of the peak-to-peak
separation from ΔEp = 15 mV to 42 mV occurs with proceeding immobilization. This finding
corresponds to a facilitation of the Fc0 oxidation and a stronger impediment of the Fc+
reduction due to –ΔG = nFE0’ with an increasing surface concentration of P26. According to
the Nernst equation for diffusing species (6.2), furthermore a decrease of the DR/DO ratio
evokes a shift of the half-wave potential to more negative values. The FSCV-based kinetic
studies of the time-resolved Fc-PNA adsorption process (section 6.6.1.3) will clarify this
decrease of the DR/DO ratio and furthermore comprehensively explain the primary current
and potential response shown in Fig. 6-19.
This time-resolved analysis of the immobilization process primary showed how sensitive
the redox process at Fc-PNA-modified surfaces is towards the actual Fc-PNA surface
coverage and secondly revealed the significance of the different voltammetric parameters ip,
ic and Ep, to facilitate a clear interpretation of the redox response in all further studies.
6.5.3 Fc-PNA•DNA/Au Interface
As the fundamental feature of a DNA sensing surface, a clear distinction between the
single-stranded capture probes of the recognition layer and the layer of fully-complementary
double-stranded species has to be provided. In this section, the voltammetric characteristics
of the Fc-ssPNA sensing surface will be investigated with respect to this requirement.
∆Ep
0 20 40 60 80 100 120
0.45
0.46
0.47
0.48
0.49
0.50
E /
Vvs
.Ag/
AgC
l
t / min0 20 40 60 80 100 120
0
5
10
15
20
25
30
t / min
i pa /
nA
0
5
10
15
20
25
30
35
–∆ic / %
–∆ic
ipa
Epc
Epa
E1/2
A B

6. Electrochemical Studies
113
6.5.3.1 Primary Response: DNA Hybridization
The preparation of Fc-PNA•DNA-modified gold surfaces was performed either by A) the
direct immobilization of a previously formed Fc-PNA•DNA duplex or by B) the hybridization
at a gold surface which is modified with single-stranded Fc-PNA conjugates. Strategy B)
presents the general mode of operation of DNA biosensors.
Fig. 6-20. Preparation of Fc-PNA•DNA modified gold surfaces by A) direct Fc-PNA•DNA duplex immobilization
and B) DNA hybridization at Fc-PNA modified gold surfaces.
For the performance of strategy A), the Fc-PNA•DNA duplex was previously formed in
0.1 M PBS (pH 7.4) solution from a mixture of the respective Fc-PNA single strand and the
corresponding DNA single strand with an excess of DNA, in order to ensure complete
hybridization of the metal-containing PNA strands (molar ratio Fc-PNA:DNA = 1 : 1.1; c =
20 µM). This mixture was heated up to T = 85 °C for 5 min (removal of aggregates) and then
subjected to a controlled temperature ramp from 85 °C to 4 °C with dT/dt = 0.5 °C/min, in
order to ensure complete hybridization of the single strands. Subsequent to a storage for
30 min at 4 °C, freshly prepared gold electrodes were incubated with the Fc-PNA•DNA
duplex solution. The DNA hybridization at gold surfaces which were modified with Fc-PNA
single strands (strategy B) was performed by incubating the respective Fc-PNA-modified
surface with a solution of the DNA target sequence in 0.1 M PBS (pH 7.4).
An important issue within both strategies A) and B) is the unspecific adsorption of
nucleic acid strands via their nucleobases of other functionalities to accessible gold
adsorption sites, which generally cannot be excluded in these surface designs, and will be
discussed in section 6.5.5.296 Unspecific adsorption of DNA target strands within strategy B)
would be reflected in the further decrease of charging current upon incubation with DNA
analyte, which was observed from time to time, however, only in very view cases. A second
general issue within strategy B) is the completeness of the DNA hybridization at the Fc-PNA
O
SH
e-
S
S
e-
SH
B)
A)
85 °C
Fe
Fe
Fe
Fe
P26/Au
P26•D3/AuAu

6. Electrochemical Studies
114
modified surfaces, which will be addressed in the next section. The regeneration of the
sensor surface of immobilized Fc-PNA single strands from the Fc-PNA•DNA duplex-modified
surface could be achieved thermally by denaturation of the immobilized Fc-PNA•DNA
duplexes at temperatures larger than the duplexes’ melting temperature (T = 85 °C). An
alternative urea-induced denaturation was however not successful.90, 297 Thermal
denaturation of the Fc-PNA•DNA surface was exclusively undertaken at densely packed
surfaces and will be treated in section 6.7.3.
For an analysis of the electrochemical primary response, Fc-PNA•DNA surfaces prepared
according to strategy B) were studied. Comparison of the CV and SWV primary response of
surface-confined Fc-PNA single strands and the corresponding Fc-PNA•DNA duplexes reveals
that the duplex species exhibits a half-wave potential E1/2, which is shifted about 20 – 40 mV
to more negative values, a smaller peak separation ΔEp and a peak current ip, which is about
∆ip = -88.7 (± 1.7) % smaller than that detected at surfaces modified with the P26 single
strand (Fig. 6-21).
Fig. 6-21. CV (v = 0.1 V/s) overlay of P26 and P26•D3 modified gold electrodes
(upper part: original data, bottom part: b. s.).
The decrease in peak current upon hybridization presents as the so-called signal-off
effect the basic characteristic of the Fc-PNA sensing surface. A comprehensive interpretation
of this CV primary response will be developed in the next section based on the FSCV analysis
of the kinetics of the Fc-electrode redox process. In summary, the current decrease is a
consequence from the fact that the approach of the strand-tethered Fc moiety to the
electrode surface is impeded when the Fc moiety is attached to the rigid nucleic acid duplex,
whereas the flexible PNA single strand facilitates the electrode approach of the tethered Fc
-0.2
0.0
0.2
0.4
0.6
i / µ
A
0.1 0.2 0.3 0.4 0.5 0.6 0.7 0.8E / Vvs.Ag/AgCl
-0.2
0.0
0.2~
P26P26•D3
6. Electrochemical Studies
115
moiety towards the electrode. The extent of the signal-off effect as the most relevant
primary sensor response will be analyzed in section 6.5.6 with respect to different
parameters.
6.5.3.2 Time-Resolved Voltammetric Analysis of the Hybridization Process
The hybridization process of target DNA with a gold surface-confined Fc-PNA single
strand (strategy B in Fig. 6-20) was studied in time-resolved fashion, in order to develop a
deeper understanding of the CV primary parameters and to elucidate the time scale of the
hybridization. Based on this study hybridization conditions will be developed, which ensure a
complete hybridization of the surface confined Fc-PNA strands with target DNA. A classical
method for the determination of the extent of DNA hybridization employs the electrostatic
interaction between the negatively charged DNA strands and a free-diffusing redox marker
for a chronocoulometric determination of the total amount of adsorbed DNA strands.298 This
method is however not applied, in order to avoid secondary effects of the redox marker with
regard to the subsequent measurements.
For the time-resolved study of the hybridization process, the hybridization of target DNA
D3 was examined at a gold electrode (Ø = 2 mm, ρ ~ 1), which was modified with a loosely
packed, binary layer of the Fc-PNA single-stranded species P26 (immobilization conditions A
of Tab. 6-4) and a co-SAM of 11-mercaptoundecan-1-ol (MUD) (detailed analysis of co-
immobilization in section 6.5.5). The P26/MUD modified electrode was incubated with a
50 µM solution of D3 in 0.1 M PBS (pH 7.4) at ambient temperature and analyzed by CV and
SWV at different points of time during the hybridization process within 2 h. Fig. 6-22 shows
the SWV analysis of the hybridization process. With proceeding hybridization, the peak
current ip continuously decreases to ~ 20 % of its value at t = 0, and the peak potential
furthermore shifts about 25 mV to more negative values. Both tendencies are expected
according to the CV and SWV differentiation of single and double-stranded Fc-PNA(•DNA) as
presented in the previous section. Fig. 6-22.B demonstrates the time dependencies of ip and
Ep and reveals an exponential decay for both parameters (exponential fit of 2nd order: R2(ip)
= 0.9992, R2(Ep) = 0.9943) with proceeding hybridization time. The current decrease is
predominantly ascribed to the duplex formation rather than an unspecific decay due to a
straightening up of Fc-PNA single strands, since the Ep decrease proceeds in a comparable
time scale like the ip decrease and an Ep decrease is in general not observed at all for this
unspecific current decay. However, the relevance of this unspecific current decay will be
discussed in the following section.

6. Electrochemical Studies
116
Fig. 6-22. SWV analysis of the time-resolved hybridization of D3 at a P26/MUD modified gold electrode.
A) Overlay of SWV (b. s.) and B) Time progression of SWV peak current and potential (ip/ip0, Ep).
This experiment furthermore shows that the hybridization under the described
conditions is already largely complete within 1 h, when both values Ep and ip have reached a
saturation value with a half maximum at of t1/2(Ep) = 9.4 min and t1/2(ip) = 11.2 min. This fast
hybridization rate is ascribed to the neutral PNA capture probes and is documented for the
hybridization of PNA and DNA in solution.95, 106 With this, conditions of c(DNA) = 50 µM, t =
16 h and T = a. t. are considered to ensure a complete hybridization of all present surface-
confined Fc-PNA single strands. Hence, these hybridization conditions were chosen for all
experiments throughout this thesis.
6.5.4 Electron Transfer Mechanism and Implication of the Surface Coverage
6.5.4.1 Choice of Immobilization Conditions
The time-resolved analysis of the immobilization process (section 6.5.2) revealed a
strong influence of the actual PNA surface coverage upon the CV primary parameters as well
as upon the strand dynamics and the kinetics of the ET process. Therefore it is of utmost
importance to strictly control the surface coverage and to work with modified electrodes
with a defined PNA surface coverage and a distinct and well-known electrochemical
response. The two extremes of a densely covered surface with maximal intermolecular
strand interaction and a low surface coverage with ideally no intermolecular strand
interactions are expected to represent the most defined surface coverages. In the following,
different conditions for the immobilization process will be analyzed with regard to the CV
primary response and Fc-PNA surface coverage in order to provide an adjustable surface
coverage and a predictable electrochemical response.
During this work, Fc-PNA conjugates were chemisorbed at gold surfaces either as single-
stranded species or as previously formed fully-complementary or SNP duplexes with DNA.
0 min 5 min
15 min 30 min 60 min
120 min
A
0.2 0.3 0.4 0.5 0.6 0.7
0
10
20
30
40
50
-78%
i / n
A
E / Vvs.Ag/AgCl
25 mV
B0 20 40 60 80 100 120
0.2
0.4
0.6
0.8
1.0
0.455
0.460
0.465
0.470
0.475
0.480
t / min
Ep /V
i p/i
p0 / %
ip/ip0
Ep

6. Electrochemical Studies
117
Significant differences between the adsorption of PNA single strands and PNA•DNA duplexes
arises from the electrically neutral PNA backbone, which facilitates strand aggregation at
purely PNA single-stranded surfaces, whereas the negatively charged DNA backbone evokes
an interstrand repulsion at the PNA•DNA duplex modified gold surfaces. The immobilization
was generally performed by applying one of four different immobilization conditions. Tab.
6-4 summarizes the CV primary response as well as the calculated surface coverage of the Fc-
PNA(•DNA) modified surfaces, which were obtained upon application of these four
immobilization conditions. Conditions A and B present conditions, which yield the two
extremes of a high Fc-ssPNA surface concentration of ΓssPNA = 232.8 pmol/cm2, obtained
upon immobilization for two hours at T = 37 °C (conditions A) and a low Fc-ssPNA surface
coverage of ΓssPNA = 11.0 pmol/cm2 obtained after 16 h at room temperature (conditions B).
Compared to a maximal surface coverage of ΓPNAmax = 300 pmol/cm2, which was reported for
Fc-PNA monolayers of Cys-tn-Fc (n = 4-6),84, 294 conditions A yield a surface coverage of
77.6 %, whereas conditions B yield a very small coverage of 3.7 %. The corresponding
maximal decrease of the electrode capacitance upon immobilization was reported to be –Δic
= 80 %, as determined at an electrode covered with a SAM of a C18 alkyl thiol.299 In
comparison, conditions A yield a value of –Δic = 59.2 %, which is lower than the reported
maximal value, but still significantly larger than the value determined for the low covered
surfaces of conditions B with a value of –Δic = 33.5 %. The intermolecular strand distance D
of the Fc-ssPNA strands immobilized according to the conditions A and B reveals a value of D
= 0.8 nm for the highly-covered surfaces of conditions A and a value of D = 3.9 nm for the
low-loaded surfaces of conditions B. Considering the contour length of P26 analog Fc-PNA
conjugates of LssP26 = 6.08 nm allows the conclusion that conditions A actually reveal
surfaces, where a strong intermolecular strand interaction is present, whereas conditions B
reveals PNA modified surfaces, where the intermolecular strand interaction can be largely
neglected. Conditions B will be most frequently applied in this work, in order to generate
surfaces, where dynamical/thermal strand motions as well as structural rearrangements are
facilitated (sections 6.6, 6.7.1, 6.7.2).
Quantification of the surface coverage of the Fc-PNA•DNA double strands was avoided,
since it cannot be not ensured that all Fc moieties attached to the rigid, cylindrical duplex
conformation participate in the redox process. Therefore, the surface coverage of electrodes
obtained by applying the conditions of conditions C or D was just qualitatively estimated
based on a comparison with conditions A or B, with regard to the decrease in electrode
capacitance. Conditions C are thereby considered to yield comparably low surface coverages

6. Electrochemical Studies
118
like conditions B, whereas conditions D yield the same –Δic value like the densely packed
surfaces obtained with conditions A.
Tab. 6-4. CV analysis of Fc-PNA(•DNA) modified gold surfaces prepared under four different conditions A – D.
Set Species Conditions Response Loading
c / µM
T / °C
t
jp / µA∙cm2
–Δic / %
ΔEp / mV
Γ / pmol cm-2
D / nm
θ / %
A Fc-ssPNA 20 37 2 h 14.7 ± 1.4
59.2 ± 11.9
78.8 ± 21.8
232.8 ± 25.3
0.8
± 0.1 77.6
B Fc-ssPNA 20 20 16 h 4.7
± 0.9
33.5 ± 6.5
57.3 ± 5.4
11.0 ± 1.1
3.9 ± 0.2
3.7
C Fc-PNA•DNA 20 20 16 h n. d. 42.3 ± 1.1
13.2 ± 8.1
– – –
D Fc-PNA•DNA 20 4 5 d n. d. 58.3 ± 1.5
n. d. – – –
6.5.4.2 Response of Fc-PNA(•DNA) Interfaces with regard to the Surface Coverage
The voltammetric primary response under the extreme conditions of a low coverage
(conditions B, C) or high coverage (conditions A, D) significantly differs between Fc-ssPNA
and Fc-PNA•DNA modified surfaces.
Fig. 6-23. CV overlays of P26(•D3) modified electrodes. A) P26 immobilized (electrode: Ø = 2 mm) under
conditions A (red) and B (black). B) P26•D3 immobilized under conditions C (black, Ø = 2 mm) and D (red, Ø = 0.05 mm) (i normalized vs. Ø = 0.1 mm).
Considering the analysis of the previous sections and the studies of Martín-Gago et al., a
straightening up of the strands is held responsible for the decrease/loss of the faradaic
response at the highly covered surfaces. Comparison with the two electron transport
mechanisms proposed for Fc-DNA(•DNA) surfaces (Fig. 1-5) reveals that for low-covered
surfaces an electron transport mechanism based on the mechanical strand bending seems to
be facilitated for both species (mechanism B), Fig. 1-5). In contrast, the straightening-up of
the strands due to the intermolecular strand interactions at high surface coverages impedes
mechanism B), which renders a charge transfer through the strands (mechanism A), Fig. 1-5)
P26•D3: low coverageP26•D3: high coverage
P26: low coverageP26: high coverage
0.0 0.1 0.2 0.3 0.4 0.5 0.6 0.7 0.8-400
-300
-200
-100
0
100
200
300
400
500
i/ n
A
E / Vvs.Ag/AgCl0.0 0.1 0.2 0.3 0.4 0.5 0.6 0.7 0.8
-6
-4
-2
0
2
4
6
8
10
12
i / n
A
E / Vvs.Ag/AgCl
A B

6. Electrochemical Studies
119
the only possible pathway for an electron exchange. The impediment of mechanism B)
thereby appears complete at surfaces densely packed with the rigid Fc-PNA•DNA surfaces,
whereas it has still to be considered to be dominant at surfaces modified with the largely
flexible Fc-PNA single strands. The complete suppression of a faradaic response at the
densely packed Fc-PNA•DNA layers indicates that a CT through the strand also does not
proceed at this interface, which furthermore excludes a contribution of mechanism A) to the
faradaic response of the loosely packed Fc-PNA•DNA surface.
Section 6.6 deals with an elucidation and detailed FSCV analysis of the electron
transport mechanism B) at loosely packed Fc-PNA(•DNA) surfaces. The charge transport
through Fc-PNA(•PNA) modified gold surfaces was analyzed by C. Achim et al. and will be
discussed in section 6.7.3 to be exploited for a DNA analysis at chip-embedded
microelectrodes.
6.5.5 Binary Fc-PNA/Thiol Interfaces
The constitution of gold-based DNA sensing surfaces was developed in the past years to
a binary surface composition, which comprises of the nucleic acid capture probe and an
additional short-chain alkanethiol.296, 300, 301 With the formation of the additional alkanethiol
SAM, all remaining free adsorption sites at the surface are blocked to prevent unspecific,
non-covalent surface contacts and adsorption of the nucleic acid strands of capture probe or
analyte molecules.296 Tarlov et al. determined by XPS that the unspecific adsorption of DNA
is completely inhibited at a purely 6-mercaptohexan-1-ol (MCH) covered gold-surface.296 At
mixed DNA/MCH interfaces, the formation of the MCH co-SAM was furthermore found to
raise the surface confined nucleic acid strands to a more defined conformation with a
preferred orientation of the helical axis of DNA duplexes to the surface normal.301 The
following studies will primary focus on MCH as the most frequently used alkanethiol, which
is known to form well-ordered co-SAMs on gold surfaces and also provides a negatively
polarized, hydroxyl head group, which facilitates the repelling of the negatively charged
backbones of excess DNA analyte molecules.301 General issues concerning to formation of
mixed SAMs are: (i) the presence of pinholes due to the formation of an imperfect
alkanethiol blocking layer, (ii) the inhibition and removal of unspecific adsorption, (iii) the
effect of the co-SAM formation onto the electrochemical response and (iv) an undesired
removal of specifically adsorbed nucleic acid strands.

6. Electrochemical Studies
120
6.5.5.1 Primary Response: MCH Co-Immobilization
The formation of a MCH co-SAM was generally performed sequentially by co-
immobilization of MCH at a gold electrode, which was previously modified by a single- or
double-stranded Fc-PNA(•DNA) species.
Fig. 6-24. Preparation of binary Fc-PNA/MCH monolayers by the co-immobilization of
a short chain alkanethiol to Fc-PNA modified gold surfaces.
The Fc-PNA(•DNA) modified electrode was incubated with an aqueous 1 mM solution of
MCH for 4 h at ambient temperature (as the applied standard conditions optimized in the
following section) in order to obtain a binary composition of the Fc-PNA(•DNA)/MCH
modified surface. Comparison of CV before and after co-immobilization of MCH at a Fc-PNA
modified surface reveals that the peak current ip as well as the charging current ic were
significantly decreased upon co-immobilization of MCH. The decrease in ic is about 77.0 ±
8.3 % and can be clearly ascribed to the reduction of electrode surface area A, which is
accessible for the accumulation of charge (see eq. (6.7)). This value is close to the value of –
Δic = 80 %, which was reported for a complete C18 alkyl blocking layer and hence indicates a
sufficient coverage of all gold adsorption sites by either Fc-PNA or MCH.299 The decrease in ip
is about 75.9 ± 1.6 %, which is a result from the restriction of strand fluctuations upon co-
immobilization. The half-wave potential E1/2 of the Fc redox process remains unchanged
upon co-immobilization, whereas the peak separation ΔEp is significantly diminished about
~ 45 mV, which indicates a significant acceleration of the redox process. A sufficient
explanation for the decrease in ip as well as ΔEp will be given by the ET studies in section
6.6.2.
S
OH
S
OH
S
OH
S
OH
S
OH
S
OH
S
OH
S
OH
S
OH
S
OH
S
OH
S S
OH
e-OH
HS
S
e-Fe Fe
P26/Au P26/MCH/Au

6. Electrochemical Studies
121
Fig. 6-25. CV overlay (v = 0.1 V/s) of P26 and P26/MCH modified gold electrodes
(upper part: original data, bottom part: b. s.).
6.5.5.2 Time-Resolved Analysis of the Co-Immobilization Process
The co-immobilization of the hydroxyl-terminated alkanethiols mercaptoethanol (MET),
mercaptohexan-1-ol (MCH) and 11-mercaptoundecan-1-ol (MUD) at a P26 modified gold
electrode (Ø = 2 mm, ρ ~ 1, ΓP26 = 11.0 ± 1.1 pmol/cm2) was studied in a time-resolved
fashion, in order to elucidate the time scale of the respective co-adsorption as well as the
stability of the P26 film upon co-immobilization, since nucleic acid desorption upon co-
immobilization is frequently discussed in literature.302 Therefore, P26 modified gold
electrodes were incubated with 1 mM solutions of MCH or MET in MilliporeTM water as well
as MUD in abs. ethanol at ambient temperature and the electrodes were analyzed by CV and
SWV at different points in time during the co-immobilization process.
Fig. 6-26 reveals that with proceeding co-immobilization of MCH as well as MET at the
P26 modified gold electrode, the peak current ip of the Fc redox process as well as the
charging current ic decay according to the general eq. (6.28) of a Langmuir adsorption
isotherm (inverted approach), which is proven according to eq. (6.29) by the linear slopes,
which are revealed in the t/ic as well as the t/ip vs. t plots (R2 > 0.999; plots are not shown,
data are plotted as i vs. t in Fig. 6-26). Thereby it is revealed that the charging current at the
P26/MCH interface decays to a value of icmin = 37.6 % of ic
0 (t = 0), whereas ic undergoes a
less significant decay at P26/MET to solely icmin = 68.3 % of ic
0. This is expected, since the C6
alkanethiol MCH provides an optimal SAM package with a furthermore larger layer thickness
than the C2 alkanethiol MET, to more efficiently impede electrolyte ions to penetrate the
SAM. Moreover, Fig. 6-26 reveals a lower adsorption rate of the MCH co-immobilization with
a half maximum at t1/2 = 66.2 min compared to the fast co-adsorption of MET with t1/2 =
-0.2
0.0
0.2
0.4
0.6
i / µ
A
0.1 0.2 0.3 0.4 0.5 0.6 0.7 0.8E / Vvs.Ag/AgCl
-0.2
0.0
0.2~
P26P26/MCH

6. Electrochemical Studies
122
5.7 min, which is clearly ascribed to the smaller MET molecules. The co-immobilization of
MUD was found to proceed faster (t1/2 = 6.5 min), which contradicts the expectation due to
the increased chain length of MUD (C11) compared to MCH (C6), but is presumably related to
the different solvent (ethanol instead of water). From the linear slope exhibited in the t/ip vs.
t plot (R2 = 0.9995) a value of icmin = 43.7 % of ic
0 was calculated.
Fig. 6-26. Percentaged change of ip and ic with the proceeding co-immobilization of
A) MCH and B) MET at a P26 modified gold electrode.
The general reason for a decrease in the peak current ip upon co-immobilization will be
analyzed in the following section. An impediment of the ET reaction due to the electrode
blocking as well as a re-orientation of the surface confined PNA strands with an increase in
strand rigidity and a decrease of diffusion-limitation are discussed as a possible reason for
the observed decrease of ip. These effects would render the decrease in ip linearly
dependent on the progress of co-immobilization and equally significant like a decrease in ic
(with regard to the respective value at t = 0) for an observation of the co-immobilization.
Comparison of the decay in ip with proceeding co-immobilization of MCH and MET reveals
that upon MCH co-immobilization (Fig. 6-26.A) the decay of ip largely follows the decay of ic
in time scale as well as percentaged amount of the respective value at t = 0 to a minimal
value of ipmin = 36.0 %. Such behavior was expected according to the given interpretation.
Thereby, the detected small time delay of the ip compared to the ic decay is interpreted as
the waiting time, which the strand re-orientation requires to react to the co-SAM formation.
Although the time scale of the decay of both ip and ic upon the co-immobilization of MET
(Fig. 6-26.B) are comparable, the percentaged decay of ip to ipmin = 11.9 % is significantly
larger than that of ic. With regard to both effects discussed as responsible for a peak current
decrease, the ip decrease upon MET co-immobilization is expected to be significantly less
developed compared to that upon MCH co-immobilization, since Marcus theory predicts less
ET impediment with a decreasing layer thickness. Also the strand re-orientation is expected
to be less affected by a co-SAM of a smaller layer thickness. Since the opposite is observed
0 100 200 300 400 500 600 700 800 900
0.4
0.5
0.6
0.7
0.8
0.9
1.0
i/i0 /
%
t / min0 20 40 60 80 100 120
0.1
0.2
0.3
0.4
0.5
0.6
0.7
0.8
0.9
1.0
t / min
ic
ip
ic
ip
A Bi/
i0 / %
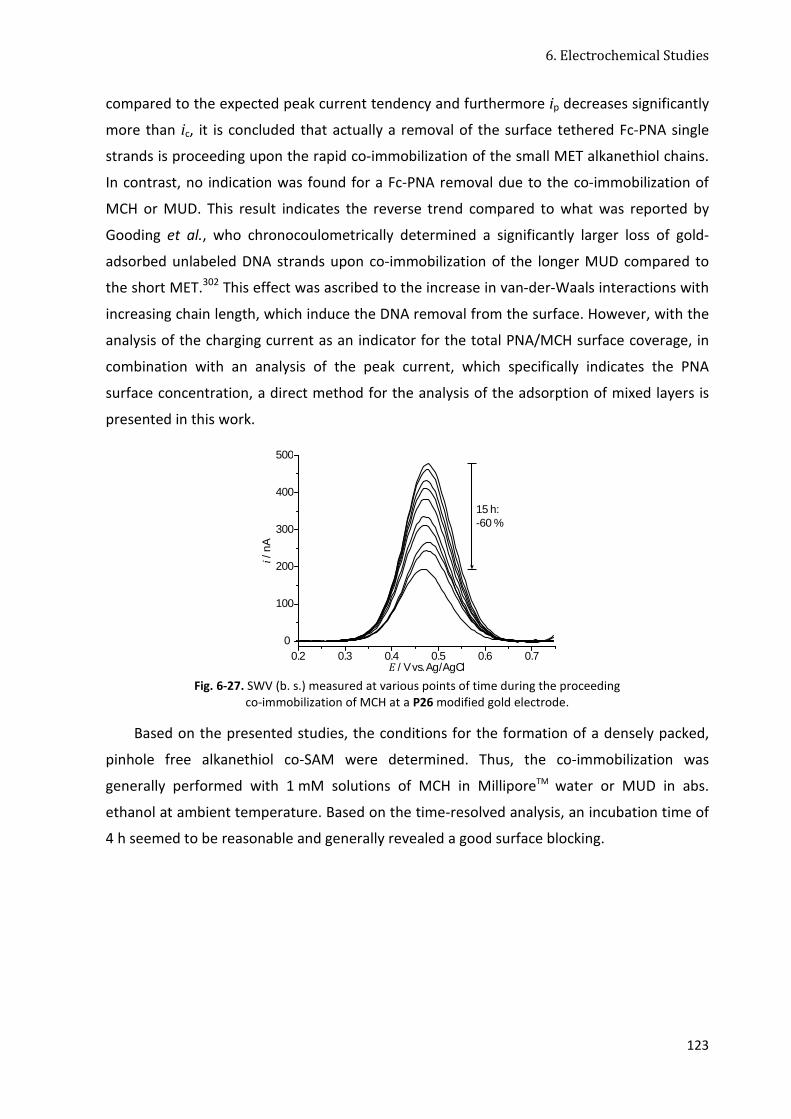
6. Electrochemical Studies
123
compared to the expected peak current tendency and furthermore ip decreases significantly
more than ic, it is concluded that actually a removal of the surface tethered Fc-PNA single
strands is proceeding upon the rapid co-immobilization of the small MET alkanethiol chains.
In contrast, no indication was found for a Fc-PNA removal due to the co-immobilization of
MCH or MUD. This result indicates the reverse trend compared to what was reported by
Gooding et al., who chronocoulometrically determined a significantly larger loss of gold-
adsorbed unlabeled DNA strands upon co-immobilization of the longer MUD compared to
the short MET.302 This effect was ascribed to the increase in van-der-Waals interactions with
increasing chain length, which induce the DNA removal from the surface. However, with the
analysis of the charging current as an indicator for the total PNA/MCH surface coverage, in
combination with an analysis of the peak current, which specifically indicates the PNA
surface concentration, a direct method for the analysis of the adsorption of mixed layers is
presented in this work.
Fig. 6-27. SWV (b. s.) measured at various points of time during the proceeding
co-immobilization of MCH at a P26 modified gold electrode.
Based on the presented studies, the conditions for the formation of a densely packed,
pinhole free alkanethiol co-SAM were determined. Thus, the co-immobilization was
generally performed with 1 mM solutions of MCH in MilliporeTM water or MUD in abs.
ethanol at ambient temperature. Based on the time-resolved analysis, an incubation time of
4 h seemed to be reasonable and generally revealed a good surface blocking.
0.2 0.3 0.4 0.5 0.6 0.70
100
200
300
400
500
i / n
A
E / Vvs.Ag/AgCl
15 h:-60 %

6. Electrochemical Studies
124
6.5.6 The Signal-Off Effect
The basic and most significant response of a Fc-ssPNA sensing surface towards the
hybridization with fully-complementary DNA is the intense decay of the peak current in CV
or SWV, which will be referred to in this work as the signal-off effect. Antedating the results
of the following sections, this specific signal-off effect is mainly ascribed to a dislocation of
the Fc moiety away from the surface induced by the formation of the rigid Fc-PNA•DNA
duplex. Whereas section 6.5.3.2 revealed a linear correlation between the extent of peak
current decay and the proceeding of the hybridization at Fc-ssPNA-modified surfaces,
significant differences in the extent of this signal-off effect are detected at different Fc(-Tz)-
PNA interfaces, which will be analyzed in this section.
Analysis of the signal-off effect over all experiments of this work revealed an unspecific
signal-off effect besides the described specific signal-off upon hybridization with fully-
complementary target DNA (section 6.5.3). That phenomenon is ascribed to a straightening
up of non-hybridized Fc-PNA single strands, inducing a current decay due to the dislocation
of the tethered Fc head group away from the electrode surface. The time-resolved analysis
of the immobilization of Fc-PNA single strands (section 6.5.2.2) presents a proof for the
unspecific signal-off effect, since it reveals a current decay induced by the increasing Fc-PNA
surface concentration in the absence of any DNA analyte. An indicator for an empirical
distinction between a specific and an unspecific signal-off effect appeared to be the cathodic
potential shift of ∆Ep = 33.7 ± 2.1 mV upon hybridization with fully-complementary DNA.
Although the time-resolved analysis of the Fc-PNA immobilization showed that a cathodic
potential shift is also observed with an increasing Fc-PNA surface concentration in the
absence of any DNA analyte, it appeared to be significantly smaller at the standard
conditions of the sensing experiments.
6.5.6.1 The Specific Signal-Off Effect
The specific signal-off effect was described in section 6.5.3 and will be analyzed in-depth
and interpreted in section 6.5.9. The dependency of the signal-off effect on the length of the
PNA strand and the thickness of the co-SAM will be analyzed in the following.
(i) An intensification of the signal-off effect with a prolongation of the PNA sequence
length was determined. Thereby, a current decrease of -71 % is detected at the P29/MCH
interface (9 nt), -76 % at the P26/MCH interface (12 nt) and a signal decrease of -89 % at the
P30/MCH interface (16 nt). Moreover, the cathodic potential shift upon hybridization
decreases with an increasing sequence length.

6. Electrochemical Studies
125
Fig. 6-28. Overlays of SWV (b. s.) of loosely packed A) P26(•D3)/MCH and B) P30(•D18)/MCH interfaces.
Whereas the flexible single strand facilitates the electrode approach of the Fc head group at
both surfaces in a comparable extent, the dislocation of the Fc moiety attached to the rigid
Fc-PNA•DNA duplex increases with the strand length, which evokes the intensification of the
signal-off effect with an increasing Fc-PNA strand length.
(ii) An intensification of the signal-off effect was detected with an increasing thickness of
the co-SAM of the hydroxyl terminated short chain alkanethiols MET (C2), Mercaptobutanol
(MBU, C4), MCH (C6) or MUD (C11) of varying chain lengths at P26/thiol modified interfaces.
This effect was accompanied by a decrease of the cathodic potential shift with an increasing
co-SAM thickness.
Fig. 6-29. Impact of the alkanethiol co-SAM on the signal-off effect. A) SWV (b. s.) of P26 modified surfaces
with different co-adsorbate layers (response of P26/thiol interfaces normalized/calibrated to that of the P26 interface before co-immobilization with respect to ip and Ep). B) ∆ip (= ip(P26/thiol)/ip(P26)) and
∆Ep (=Ep(P26)-Ep(P26/thiol)) dependency from the length of the alkanethiol.
With an increasing thickness of the co-adsorbate layer, longer segments of the adsorbed
strands are fixed within the co-SAM layer, which induces an increasingly straightening up of
the rather rigid Fc-PNA•DNA duplexes and with this the intensification of the signal-off
effect. Impediment of the ET with the evoked increasing Fc-electrode distance is made
P30/MCHP30•D18/MCH
P26/MCHP26•D3/MCH
0.0 0.1 0.2 0.3 0.4 0.5 0.6 0.7
0
100
200
300
400
i / n
A
E / Vvs.Ag/AgCl0.0 0.1 0.2 0.3 0.4 0.5 0.6 0.7
0
50
100
150
200
i / n
A
E / Vvs.Ag/AgCl
A B
-35 mV-76 %
-15 mV-89 %
P26/MUDP26•D3/MUDP26•D3/MCHP26•D3/MBUP26•D3/MET
0.1 0.2 0.3 0.4 0.5 0.6 0.7
0.0
0.2
0.4
0.6
0.8
1.0
i /i p
(P2
6)
/ %
E / Vvs.Ag/AgCl1 2 3 4 5 6 7 8 9 10 11 12
-85
-80
-75
-70
-65
thiol length / C-atoms
Δi p
/ %
20
25
30
35
40
45
50
55
ΔE
p / mV
Δip
ΔEp
A B

6. Electrochemical Studies
126
responsible for the increase of Ep with an increasing co-SAM thickness to larger values than
the determined formal potential of the free-diffusing P26•D3 duplex (section 6.4.2).
6.5.6.2 The Unspecific Signal-Off Effect
The following effects and parameters were found to evoke or be related to the unspecific
signal-off effect.
(i) A large surface area favors a large extent of current decrease upon hybridization,
whereby the P26/MCH interface revealed upon hybridization with fully-complementary DNA
D3 a current decrease of ~ 45 % at a microelectrode with Ø =0.1 mm, whereas a significantly
larger current decrease of ~ 76 % was detected at an electrode with Ø = 2 mm.
This finding is ascribed to the large edge-to-area ratios of microelectrodes, which are
suggested to facilitate strand fluctuations to render shorter Fc-electrode distances with
larger peak currents possible. In contrast, a larger surface area with a smaller edge-to-area
ratio favors intermolecular interactions and hence facilitates an efficient straightening up of
the adsorbed single strands upon incubation with fully-complementary DNA analyte
sequences.
(ii) A high Fc-PNA surface concentration favors the extent of the signal-off effect upon
hybridization with fully-complementary DNA, whereby a decay of ~ 45 % was determined at
a loosely packed microelectrode and a decay of ~ 60 % at a densely packed microelectrode.
This impact was found to be less at the electrodes with Ø = 2 mm than at microelectrodes (Ø
= 0.1 mm).
As an explanation, analog to that for (i), a maximization of the intermolecular interactions
between the adsorbed strands is considered, which is evoked by the larger Fc-PNA surface
concentration and facilitates the straightening up of the adsorbed single (and double)
strands to result in an intensification of the signal-off effect (compare to section 6.5.2.2).
This finding is coherent with spectroscopic studies of PNA(•DNA) surfaces reported by
Martín-Gago et al.295
(iii) Numerous CV, SWV or EIS measurements undertaken at any type of Fc-
PNA(•DNA)/(thiol) interface evoked a current decrease to varying extents, which was not
correlated to any secondary surface modification. Tab. 6-5 exemplary shows the current and
potential change upon application of either FSCV (~ 15 voltammograms) or SWV pulse (~ 20
voltammograms) measurements.
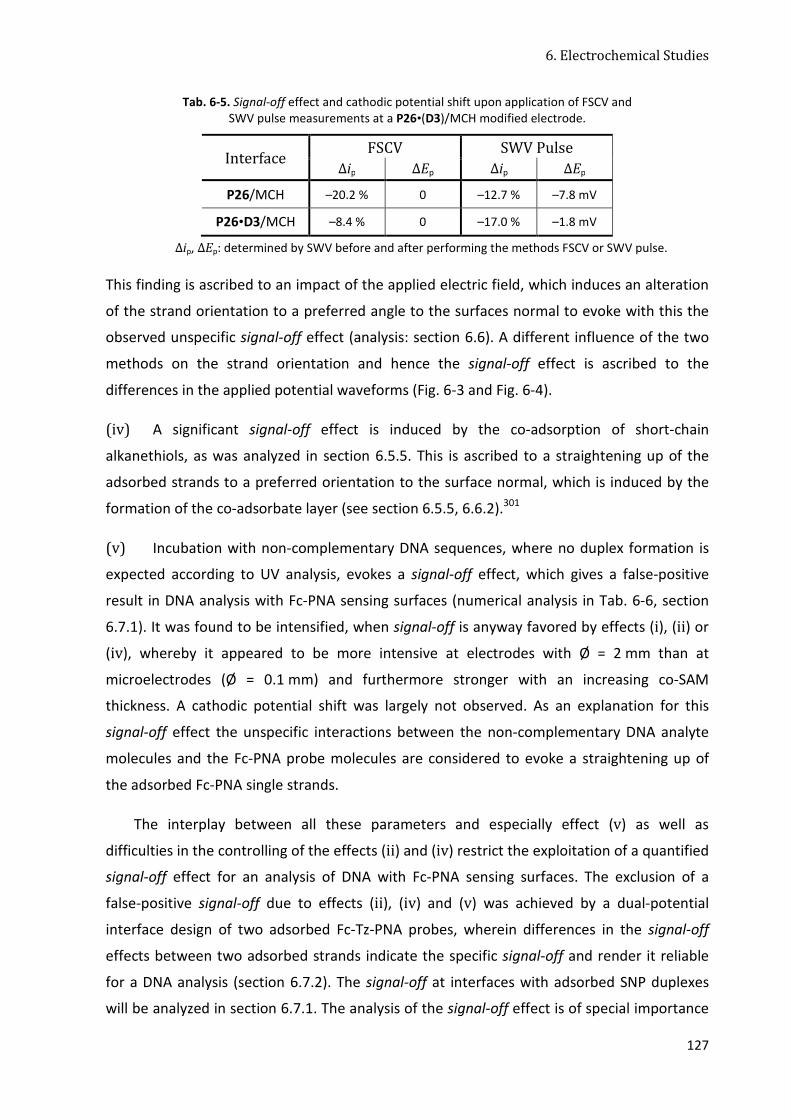
6. Electrochemical Studies
127
Tab. 6-5. Signal-off effect and cathodic potential shift upon application of FSCV and SWV pulse measurements at a P26•(D3)/MCH modified electrode.
Interface FSCV SWV Pulse
∆ip ∆Ep ∆ip ∆Ep
P26/MCH –20.2 % 0 –12.7 % –7.8 mV
P26•D3/MCH –8.4 % 0 –17.0 % –1.8 mV
∆ip, ∆Ep: determined by SWV before and after performing the methods FSCV or SWV pulse.
This finding is ascribed to an impact of the applied electric field, which induces an alteration
of the strand orientation to a preferred angle to the surfaces normal to evoke with this the
observed unspecific signal-off effect (analysis: section 6.6). A different influence of the two
methods on the strand orientation and hence the signal-off effect is ascribed to the
differences in the applied potential waveforms (Fig. 6-3 and Fig. 6-4).
(iv) A significant signal-off effect is induced by the co-adsorption of short-chain
alkanethiols, as was analyzed in section 6.5.5. This is ascribed to a straightening up of the
adsorbed strands to a preferred orientation to the surface normal, which is induced by the
formation of the co-adsorbate layer (see section 6.5.5, 6.6.2).301
(v) Incubation with non-complementary DNA sequences, where no duplex formation is
expected according to UV analysis, evokes a signal-off effect, which gives a false-positive
result in DNA analysis with Fc-PNA sensing surfaces (numerical analysis in Tab. 6-6, section
6.7.1). It was found to be intensified, when signal-off is anyway favored by effects (i), (ii) or
(iv), whereby it appeared to be more intensive at electrodes with Ø = 2 mm than at
microelectrodes (Ø = 0.1 mm) and furthermore stronger with an increasing co-SAM
thickness. A cathodic potential shift was largely not observed. As an explanation for this
signal-off effect the unspecific interactions between the non-complementary DNA analyte
molecules and the Fc-PNA probe molecules are considered to evoke a straightening up of
the adsorbed Fc-PNA single strands.
The interplay between all these parameters and especially effect (v) as well as
difficulties in the controlling of the effects (ii) and (iv) restrict the exploitation of a quantified
signal-off effect for an analysis of DNA with Fc-PNA sensing surfaces. The exclusion of a
false-positive signal-off due to effects (ii), (iv) and (v) was achieved by a dual-potential
interface design of two adsorbed Fc-Tz-PNA probes, wherein differences in the signal-off
effects between two adsorbed strands indicate the specific signal-off and render it reliable
for a DNA analysis (section 6.7.2). The signal-off at interfaces with adsorbed SNP duplexes
will be analyzed in section 6.7.1. The analysis of the signal-off effect is of special importance

6. Electrochemical Studies
128
for an employment of this effect for a DNA analysis with Fc-PNA sensing surfaces, but gives
furthermore information about the impact of the analyzed effects onto the orientation of
surface confined PNA(•DNA) strands, which is of general importance for PNA-based
biosensors.
6.5.7 Fc-Tz-PNA Interfaces
In this section, the electrochemical characteristics of gold electrodes, which were
modified with the triazole-containing Fc-Tz-PNA conjugates presented in section 4.4, will be
analyzed with regard to their voltammetric response. Gold electrodes (Ø = 0.1 mm, ρ = 1.5 –
2.0) were modified with the triazole-containing Fc-Tz-PNA conjugates P32, P34 and P37 in
order to investigate the electrochemical response of the resulting interfaces in comparison
with the well-studied P26(•D3)/(MCH) interfaces with amide-bound Fc moieties. The gold
surfaces were loosely packed with the respective single-stranded species (conditions: 20 µM,
16 h, a.t.; ΓssPNA = 24.5 ± 7.3 pmol/cm2, FP = 25.3 ± 6.4 nm2) and subsequently modified with
a co-adsorbate layer of MCH, according to the procedures described in the previous
sections. The resulting Fc-Tz-ssPNA/MCH interfaces as well as the Fc-Tz-PNA•DNA/MCH
interfaces, obtained after hybridization with fully-complementary DNA, were studied by CV
and SWV.
An overlay of SWV measured at the Fc-Tz-PNA modified surfaces (Fig. 6-30) shows that
the peak potentials Ep of the Fc-Tz-PNA conjugates P32, P34 and P37 are generally 30 – 50
mV more negative than those determined for the structurally analogous, free-diffusing
trimer compounds P31, P33 and P36 (section 6.4.3.1). This is primarily ascribed to a different
electrochemical setup (different electrolytes and working electrodes) and not to surface
effects or differences in the PNA strand lengths, since Ep = 327 mV determined for the 12-
mer P32 in solution is similar to Ep = 318 mV determined at the P32-modified surface.
However, due to the strong impact of varying surface concentrations on the peak potential
(discussion to Fig. 6-19.B in section 6.5.2.2), a large error of ~ 30 mV is generally adherent to
the peak potential of surface confined Fc(-Tz)-PNA conjugates. Considering this error and the
different measuring conditions, the peak potentials, differences and trends of the surface
confined 12-mer Fc-Tz-PNA conjugates P32, P34 and P37 (Fig. 6-30) are coherent with those
determined for the free-diffusing trimer model compounds P31, P33 and P36 at the glassy
carbon working electrode (Fig. 6-12). The potential difference between the P32- and P34-
modified surfaces is of special interest for the preparation of a dual-potential sensing
interface (section 6.7.2), since it reveals to be with ∆(ip(P32)-ip(P34)) = 132.5 mV sufficiently

6. Electrochemical Studies
129
large for a differentiation of the both interfaces with electrochemical methods, as
demonstrated by the SWV overlay in Fig. 6-30.
Fig. 6-30. Overlay of SWV (b. s.) determined at P32, P34, P37 and P26 modified surfaces.
The electrochemical response of the P32/MCH- and P34/MCH-modified surfaces upon
hybridization with the respective fully-complementary DNA sequence under formation of
P32•D2/MCH and P34•D1/MCH modified surfaces was studied by SWV.
Fig. 6-31. Overlays of SWV (b. s.) determined at A) P32(•D2)/MCH and B) P34(•D1)/MCH modified electrodes.
The P32(•D2)/(MCH)- as well as P34(•D1)/(MCH)-modified surfaces revealed stable peak
currents in SWV and CV over various scans, which were comparable to the stability of the
P26(•D3)/(MCH)-modified surfaces. In contrast, the P37 modified surface primarily revealed
stable voltammograms, however, upon continuous performance of SWV or CV, a loss of
signal intensity at Ep(P37) = 490 mV of about 85 % (~ 30 scans) as well as the development
of a second peak at Ep = 210 mV is detected. This finding is ascribed to a proceeding
degradation of the Fc-label of P37, which is coherent with its diminished electrochemical
stability compared to the labels of the other Fc-Tz-PNA conjugates out of the studied choice
of compounds, as determined in section 6.4.3.1 for the trimer analog P36. The
decomposition is assumed to proceed in a nucleophilic attack onto the electrochemically
P32P34P26P37
0.1 0.2 0.3 0.4 0.5 0.6 0.7
0.0
0.2
0.4
0.6
0.8
1.0
i/i p
E / Vvs.Ag/AgCl
P34/MCHP34•D1/MCH
P32/MCHP32•D2/MCH
0.0 0.1 0.2 0.3 0.4 0.5 0.6 0.7
0
1
2
3
4
5
i / n
A
E / Vvs.Ag/AgCl0.0 0.1 0.2 0.3 0.4 0.5 0.6 0.7
0.0
0.5
1.0
1.5
2.0
2.5
i / n
A
E / Vvs.Ag/AgCl
A B
-22 mV-64 %
-30 mV-70 %

6. Electrochemical Studies
130
formed Fc+ in a mechanism, which is analog to mechanism B described in section 3.5
(Fig. 3-22).
Fig. 6-32. Overlay of SWV (b. s.) determined at a P37 modified electrode.
6.5.8 RAIR Spectroscopic and ToF-SI Mass Spectrometric Surface Characterization
A densely packed Fc-PNA•DNA SAM of P24•D1, immobilized to a gold support according
to the conditions D (Tab. 6-4), was studied with reflection adsorption IR spectroscopy
(RAIRS) as well as time-of-flight secondary ion mass spectrometry (ToF-SIMS), in order to
analyze and prove the SAM formation independent from any electrochemical response.
6.5.8.1 RAIRS Analysis of a P24•D1 Monolayer
A densely packed monolayer of Fc-PNA•DNA duplexes P24•D1 on a small gold plate
(conditions D, Tab. 6-4) was studied by RAIRS. Thereby, the modified gold plate is irradiated
with an IR beam and the reflection at the highly reflective substrate is detected, to reveal a
characteristic absorbance vs. wavenumbers IR spectrum of the adsorbed film. The spectrum
is normalized versus a background spectrum determined for a gold plate modified with a C18
alkanethiol. RAIRS provides information about the chemical composition of the adsorbed
film, but furthermore about the molecular orientation within the film. The latter is following
from the surface selection rule, which determines that solely the perpendicular component
of the dipole moment of a vibrational mode can be detected, whereas the parallel
components are screened by the metal surface.28
Fig. 6-33 shows the RAIRS spectrum of the studied P24•D1 film in comparison with the
transmittance vs. wavenumbers IR spectrum of the crude/free P24 conjugate measured at
an ATR unit. The IR spectrum of the P24•D1 film reveals bands which are characteristic for
0.0 0.1 0.2 0.3 0.4 0.5 0.6 0.7
0
1
2
3
4
5
6P37 - 1.scanP37 - 30.scan
i / n
A
E / Vvs.Ag/AgCl

6. Electrochemical Studies
131
functional groups of the DNA (DNA backbone: vsym(PO2-) valence vibrations) as well as the
PNA strand (pseudopeptidic PNA backbone: amid I,II bands) and furthermore of the nucleic
base rings (v(C=O) at ṽ = 1675 cm-), whereby the PNA correlated bands are comparable to IR
spectra reported for gold immobilized PNA.295 A significant proof for the SAM formation is
the impact of the immobilization onto the CH2 valence vibrations at ṽ = 3000 – 3300 cm-1.
Comparison with the IR spectrum measured of the free Fc-PNA conjugate P24 reveals that
the CH2-vibrations vsym and vasym (grey shaded area in Fig. 6-33) of the peptidic linker become
stronger and more defined upon immobilization, which is characteristic for the formation of
a SAM.303 The strong development of the v(C=O) vibration at ṽ = 1675 cm-1 thereby indicates
according to Martín-Gago et al. an upright conformation of the strands, where in-plane
nucleic base vibrations are facilitated in contrast to a ‘lying down’ conformation, where the
nucleic base ring absorptions are impeded. This strand conformation is expected for the here
generated high PNA•DNA surface coverage and coherent with the small CV and SWV peak
currents of the Fc head groups located at a large distance to the electrode surface, as it is
analyzed in the studies at the chip embedded microelectrodes (section 6.7.3).
Fig. 6-33. IR (on ATR) of the Fc-PNA conjugate P24 (black line) and RAIRS of a P24•D1 SAM (red line).
6.5.8.2 ToF-SIMS Analysis of a P24•D1 Monolayer
The densely packed monolayer of P24•D1 on a small gold plate (conditions D, Tab. 6-4)
was furthermore studied mass spectrometrically by ToF-SIMS. Thereby, ultra short primary
Cs+ ion beams (10 kV) are applied to the surface confined film, and the thereof generated
secondary ions are accelerated to a rate which is dependent on the mass of the respective
mass fragment, to be finally analyzed with a detector system according to the respective
time of flight. Screening of the surface with a precise focused primary ion beam facilitates
the mass sensitive recording of secondary ion images, thereby reaching a lateral resolution
~v / cm-1
1000150020002500300035004000
Abs
./T /
norm
. int
ens.
P24•D1 SAM
P24 conjugate
vsym(CH2)
vasym(CH2)
v(C=O) - amid I
vasym(PO2-)
vsym(PO2-)
amid II

6. Electrochemical Studies
132
of up to 200 nm. Variation of the primary ion density furthermore enables to record a depth
profile by the successive material loss with a depth resolution of up to 1 nm.304
The ToF-SIMS spectrum (Fig. 6-34) reveals mass peaks up to m/z = 591 in the negative
mode and up to m/z = 225 in the positive mode. Thereby mass peaks were detected, which
could be related to DNA dimers, DNA nucleosides and nucleotides as well as nucleobases
and PNA monomer fragments, indicating the presence of the Fc-PNA•DNA film.
Furthermore, specific fragments of the N-terminally attached Fc moiety could be detected.
Fig. 6-34. ToF-SIMS spectra of a P24•D1 modified gold surface detected in A) positive and B) negative mode.
Fig. 6-35 shows low-mass region (m/z < 90) ToF-SIMS secondary ion images of the
P24•D1 film, detected in the positive (upper part) and the negative mode (lower part).
Thereby, a high light intensity corresponds to a larger secondary ion density than at the
surrounding gold surface. The P24•D1 film could be imaged based on the secondary ion
densities of seven different ion species per measuring mode, whereby the eights square
shows the overall positive or negative secondary ion image of the total ion density. In the
positive mode, thereby the images of the secondary ions with the ratios m/z = 18, 46, 63, 72
and 90 could be clearly related to the molecular fragments NH4+, CN2H6
+, C2N2H11+, C2N3H6
+
and C3N3H12+, which derive from the PNA or DNA nucleobases. With this, a direct imaging of
the Fc-PNA•DNA film is presented in the ToF-SIMS positive mode (Fig. 6-35). Interestingly,
the sulfur ion density appears to be lower within the film than at the surrounding gold
surface. This is ascribed to Fc-PNA•DNA film, which protects the sulfur atoms of the Au-S-
PNA linkage from a ionization by the primary ion beam and furthermore to the surrounding
bare gold surface, which easily adsorbs sulfur species from the environment, to exhibit a
large sulfur ion density. An analogous explanation is given by Tarlov et al. for a low intensity
of the XPS signal of the sulfur atom in gold-adsorbed DNA single strands.305 The Na+ ion
image as well as the images of the phosphorous species can be ascribed the DNA backbone
as well as to unspecifically attached ions of the NaH2PO4 immobilization buffer (which was
0 50 100 150 200 250 3000
1
2
3
4
5
6
7
8
Inte
ns./1
05
m/z
0 100 200 300 400 500 6000
1
2
3
4
5
Inte
ns/1
05
m/z
A B
[FeCp+H]+ nucleobase[’G’]•+ DNA-dimer
[’C-T’-H]-
DNA-dimer[’A-C’-H2O-H]-
DNA-nucleoside[’G’-H2O-H]-
[’A’-H]-
nucleobase[’T’]-
[FeCpC+H]+
[FeCpC]-

6. Electrochemical Studies
133
however thoroughly removed before the measurement), which would explain the large
density of Na+ ions.
Fig. 6-35. ToF-SIMS images of a P24•D1 monolayer. Upper part: positive mode, lower part: negative mode.
6.5.9 Conclusion
In this section, a deeper understanding of the redox process at N-terminally
ferrocenylated and C-terminally gold grafted PNA strands was developed by the CV and SWV
analysis of different Fc-PNA(•DNA)/(MCH)-modified gold surfaces. A clear correlation was
established between the Fc redox response and different surface modifications like pure Fc-
PNA or Fc-PNA•DNA interfaces as well as binary interfaces resulting from the co-adsorption
of a short-chain, hydroxyl-terminated alkanethiol.
CH-
tc: 927610OH-
tc: 1116406P-
tc: 14342S-
tc: 247028
PO-
tc: 17839PO2
-
tc: 234892PO3
-
tc: 222088total iontc: 72844414
CH+
tc: 16964NH4
+
tc: 315180Na+
tc: 794958CN2H6
+
tc: 46863
C2N2H11+
tc: 165560C2N3H6
+
tc: 22578C3N3H12
+
tc: 15107total iontc: 66859765

6. Electrochemical Studies
134
The time-resolved analysis of the three sequential modification processes of the primary
immobilization of Fc-ssPNA strands, the following co-adsorption of short-chain alkanethiols
(MET, MCH, MUD) and the final hybridization with fully-complementary DNA revealed the
kinetics of the three modification processes, which presents the basis for a controlling of the
surface architecture by the choice of appropriate modification conditions. With the time-
resolved analysis of the charging current ic in combination with the analysis of the faradaic
response of the strand-tethered Fc moiety, a method was chosen, which differentiates
between the modification of the gold surfaces and the response of the Fc head groups,
which is furthermore governed by specific strand characteristics. Based on these studies, the
Fc redox response was found to be very sensitive towards the surface concentration of the
strands, which renders a strict controlling of the surface coverage of utmost importance for
the preparation of a Fc-PNA based sensing surface. In reverse, these studies furthermore
present basis for a clear interpretation of the CV or SWV response.
An in-depth analysis of the hybridization of fully-complementary DNA analyte
sequences at Fc-PNA modified surfaces presents the basic investigations for the
development of Fc-PNA sensor concepts (section 6.7). The DNA hybridization was found to
evoke a significant decay in the peak current (signal-off effect) and the formal potential of
the Fc redox response. The analysis of various parameters (co-adsorbate layer, surface
coverage, PNA length), which induce or enhance the specific as well as an unspecific signal-
off effect forms the basis for a control and design of the Fc-PNA interface in order to employ
the signal-off effect for the analysis of DNA with Fc-PNA sensing surfaces (section 6.7).
Studies of DNA hybridization at Fc-Tz-PNA modified surfaces revealed a behavior which was
analogous to that observed at Fc-PNA modified surfaces. Thereby, P32- and P34-modified
surfaces revealed reversible redox process at different formal potentials and qualified for
the preparation of a dual-potential sensing surface, which will be presented in section 6.7.2.
6.6 Studies on the Mechanical Strand Bending Induced ET Mechanism
6.6.1 ET Kinetics of Fc-PNA(•DNA)/Au Interfaces
6.6.1.1 FSCV Analysis of Fc-PNA(•DNA)/Au Interfaces
The kinetics of the redox process of Fc moieties, which are tethered to gold surface
grafted Fc-PNA single or Fc-PNA•DNA double strands, were studied by means of fast-scan
cyclic voltammetry (FSCV) in a scan rate range of v = 0.1 – 1000 V/s. Freshly prepared gold
electrodes (Ø = 2 mm, ρ ~ 1) were therefore exemplarily modified with the 12-mer Fc-PNA

6. Electrochemical Studies
135
conjugate P26-Salm, which carries an amide-bound Fc moiety, or the corresponding fully-
complementary Fc-PNA•DNA duplex P26•D3, by application of condition set B or C,
respectively, to yield loosely packed surfaces (11.0 ± 1.1 pmol/cm2) with a negligible
intermolecular strand interaction (section 6.5.4.2).
Fig. 6-36 exemplary shows CV measured at a P26 modified electrode at four different scan
rates (v = 0.05, 1, 100, 500 V/s) in a large scan rate range of v = 0.05 – 500 V/s.
Fig. 6-36. CV of a P26 modified gold electrode at scan rates of v = 0.05, 1, 100 and 500 V/s
(Straight line: original data, dashed line: b. s.).
The analysis of CV of P26 and P26•D3 modified gold electrodes in a scan rate range of v = 0.1
– 500 Vs-1 reveals the dependencies of the CV primary parameter peak current ipa and peak
separation Δ(Epa-E1/2) shown in Fig. 6-37.
0.1 0.2 0.3 0.4 0.5 0.6 0.7 0.8
-60
-40
-20
0
20
40
60
80
i / n
A
E / Vvs.Ag/AgCl0.1 0.2 0.3 0.4 0.5 0.6 0.7 0.8
-0.6
-0.4
-0.2
0
0.2
0.4
0.6
i / µ
A
E / Vvs.Ag/AgCl
0.1 0.2 0.3 0.4 0.5 0.6 0.7 0.8
-30
-20
-10
0
10
20
30
i / µ
A
E / Vvs.Ag/AgCl0.1 0.2 0.3 0.4 0.5 0.6 0.7 0.8
-150
-100
-50
0
50
100
150
i / µ
A
E / Vvs.Ag/AgCl
100 V/s 500 V/s
1 V/s50 mV/s

6. Electrochemical Studies
136
Fig. 6-37. CV analysis of P26 and P26•D3 modified gold electrodes from v = 0.1 – 500 V/s. A) Plot of the
overpotential Δ(Epa-E1/2) vs. log v (lines: polynomial fits (4th order, 1000 data points)). B) Plot of the peak current ipa/(N0 v) vs. log v (ipa normalized by the scan rate v and the total amount of adsorbed species N0). C) Plot of the peak current ipa/(N0 v1/2) vs. log v (ipa normalized by the square root of the scan rate v1/2 and N0);
(continuous lines (P26) and dashed lines (P26•D3): fit of the data as described in the text).
A) Analysis of the current response (Fig. 6-37.B, C)
For diffusionless adsorbed redox species and generally ET rate limited redox processes,
the CV peak current is linearly proportional to the applied scan rate v according to eq. (6.4),
whereas for diffusion-limited redox processes of free-diffusing species a proportionality
between the CV peak current and the square root of the applied scan rate is predicted by the
Randles-Sevcik equation (6.1). The peak current normalizations shown in Fig. 6-37.B,C
facilitate an allocation of the redox processes to one of those two extremes. The peak
current in Fig. 6-37.B is normalized vs. v, to expect in case of a rate-limited redox process a
peak current progression of � /� = const., whereas for free-diffusing species a progression
according to eq. (6.30) is expected, as deviated from the Randles-Sevcik equation (6.1).
C�� = B ∗ #
√� (6.30)
Ô = 0.4463 V����Z# ]⁄ v� ]⁄ �1�Õ��Õ
(6.31)
-1 0 1 2 30
20
40
60
80
100
120
140
160
180
∆(E
pa-E
1/2)
/ mV
log v / Vs-1
A
-1 0 1 2 30
2
4
6
8
10
i pa /
(N0v)
/ (C
mol
-1V-1
x 10
3 )
log v / Vs-1
B-1 0 1 2 3
0
2
4
6
8
10
12
14
16
18
log v / Vs-1
i pa /
(N0
v)
/ (A
mol
-1 (s
/V)1/
2x
103 )
C
P26/AuP26•D3/Au
P26/AuP26•D3/Au
P26/AuP26•D3/Au

6. Electrochemical Studies
137
The peak current in Fig. 6-37.C in contrast is normalized vs. √�, to expect in case of a
diffusion-limited redox process a peak current progression of � /√� = const., whereas for
rate-limited processes a progression according to eq. (6.32) is expected, which was deviated
from eq. (6.4).
C�√� = A ∗ √� (6.32)
A = V����O�� Z ��
(6.33)
In both plots Fig. 6-37.B and C, P26/Au reveals a behavior which appears to be very
close to the ideal characteristics of linear diffusion according to eq. (6.1), since the peak
current in Fig. 6-37.C is largely independent from the scan rate and the current devolution in
Fig. 6-37.B could be fitted with a good quality (R2 = 0.9976) with eq. (6.30) (B = (2.27 ± 0.03)
x 105). This unexpected diffusion characteristic of the Fc moiety of P26 indicates a large
elasticity of the surface grafted, Fc-electrode linking PNA single strand, which induces a
diffusion like motion to the tethered Fc moiety by thermal strand fluctuations. This
interpretation is coherent with the discussed large elasticity of PNA single strands and
indicates how the strand properties govern the ET process of the tethered Fc moiety. The
strand elasticity thereby appears to be sufficiently large, such that the tethered Fc moiety
mimics the characteristics of a free diffusing species. The Randles-Sevcik equation (6.1) is
adapted in order to address the diffusion motion of the Fc-moiety of the surface confined
P26 by replacing the coefficient D of the free diffusion by Dr for the restricted diffusion at
the surface and furthermore by replacing the bulk concentration C* by the surface
concentration Γ of the strands to yield the following equation:
� = 0.4463(��/)# ]⁄ v� ]⁄ �1�Õ��Õ√� (6.34)
According to eq. (6.34), the diffusion coefficient �� was calculated from the slope of the
straight line resulting in the classical Randles-Sevcik plot (ip vs. √� plot, data not shown), to
yield a value of �� = 2.42 x 103 cm2/s. This corresponds to a significant increase in the
diffusion coefficient about several orders of magnitude compared to the corresponding
diffusion coefficient DO = 20.3 x 10⁻⁸ cm2/s of the Fc moiety attached to the free diffusing P26
single strand. An analogous increase in the diffusion coefficient upon the grafting of Fc-DNA
strands to gold surfaces was reported by Anne et al.88 This acceleration of the diffusion
motion of the Fc moiety upon surface grafting can be ascribed to the restriction of the Fc
motion to a maximal distance to the electrode of xmax, which is defined by the contour
length lc(P26) of the linking PNA single strand and holds the Fc-moiety in close proximity to
the gold surface.

6. Electrochemical Studies
138
In contrast, the peak current progression determined at the P26•D3 modified surface
did reveal no distinct characteristic of a diffusion-limited redox process (fitting of Fig. 6-37.B
with eq. (6.30): R2 = 0.7393; Fig. 6-37.C: �/√� ≠ const.) nor that of rate-limited system (fitting
of Fig. 6-37.C with eq. (6.32): R2 = 0.0499). This indicates a redox process with a
characteristic intermediate between that of the two extremes of a totally diffusion-limited
process and a rate limited redox process on the other hand with the peak current comprising
a diffusion-limited portion ip,D as well as a rate-limited portion ip,k according to the following
equation.
1� = 1
� ,� + 1� ,A (6.35)
The significant better fitting quality of Fig. 6-37.B with eq. (6.30) compared to Fig. 6-37.C
with eq. (6.32) however indicates a larger contribution of ip,D, although the diffusion
limitation of the redox process at the P26•D3 interface is generally smaller than that at the
P26 interface with its nearly ideal diffusion-limited characteristic. Eq. (6.35) can be expressed
in terms of eq. (6.36) based on eq. (6.4) and (6.34) with the coefficients A and B defined by
eq. (6.31) and (6.33), to yield eq. (6.37) as an expression for the current progression
intermediate between diffusion and rate limitation.
1� = 1
�� + 1Ô√� (6.36)
� = �Ô��√� + Ô (6.37)
Fitting of the ipa vs. v plot determined at the P26•D3/Au interface with eq. (6.37) reveals
a goodness of fit of R2 = 0.9942, which presents a significant improvement compared to the
fits based on eq. (6.4) or (6.34) and underscores, that the ET process at the P26•D3/Au
interfaces is intermediate between those of a diffusion-limited or a rate-limited system. This
ET characteristic is attributed to an increased strand rigidity and the accumulation of
negative charge upon hybridization with DNA, as the two main structural characteristics in
which the P26•D3 double helix differs from the P26 single strand. With regard to this, the
decrease of strand elasticity and the attractive interaction between the positive electric field
and the negatively charged P26•D3 polyelectrolyte restrict the thermal strand fluctuations
and render the ET process to a greater extent limited by its rate.

6. Electrochemical Studies
139
B) Analysis of the overpotential η (Fig. 6-37.A)
The dependency of the overpotential η (= Epa-E1/2) from the scan rate v was determined
at both interfaces P26/Au and P26•D3/Au (Fig. 6-37.A), in order to elucidate the kinetics of
the ET reaction. As long as the scan rate v is small compared to all possibly ET rate
determining processes, η equals zero (equilibrium state), but significantly increases as soon
as increasing potential scan rates v enforce one process to be rate determining (compare to
section 6.2.3).
Fig. 6-37.A shows that the redox processes at both interfaces P26/Au as well as
P26•D3/Au reveal overpotentials η (= Epa-E1/2), which range below a peak separation of ∆Ep
= 110 mV until the scan rate increases to v > 50 V/s. In this low scan rate region already
difference between the P26/Au and P26•D3/Au redox processes are exhibited. The
P26•D3/Au interface reveals at v < 10 V/s solely slightly increasing overpotentials, which are
ranging between the Nernstian ideal for surface confined (∆Ep = 0 mV) and that for diffusion-
limited processes (∆Ep = 59 mV),267 as it is coherent with the analysis of the current
progression. The P26/Au interface in contrast reveals overpotentials, which are significantly
increasing to a saddle point to yield large values of ∆Ep = 110 mV already at v < 10 V/s. This
overpotential characteristic correlates to the elucidated diffusion motion of the Fc moiety
tethered to the P26 strand, which impedes the ET process already at low scan rates analog
to free-diffusing species, where the diffusion motion evokes an enlargement of the
Nernstian value for adsorbed species of ∆Ep = 0 mV to a Nernstian value of ∆Ep = 59 mV.
A significant increase in η to values of ∆Ep > 0.2 V occurs at both interfaces at v > 10 V/s.
It has to be assumed that in this large scan rate region the strand fluctuations becomes slow
compared to the applied scan rate which impedes a diffusion of Fc head groups to the
electrode surface during the time scale of the voltammetric scan. This suggest, that at the
large scan rates the strand fluctuations are ‘kinetically frozen’, which fixes the tethered Fc
moieties at certain distances x to the electrode surface. As a result from this, the ET process
is rendered diffusionless, where an electron exchange can only proceed due to electron
tunneling, which facilitates the determination of the associated standard ET rate constants
k0 according to E. Laviron based on the Marcus theory derived equations (6.14) and (6.15)
for diffusionless redox processes.274, 273 According to Marcus theory, the standard ET rate
constant k0 exponentially decays according to (6.13) with an increasing distance x between
the redox center and the electrode surface.267 Due to the lack of organizing interactions
between the strands within the loosely packed layers, the surface composition has to be
considered as inhomogeneous with various strand conformations and Fc head groups being

6. Electrochemical Studies
140
located at various distances to the electrode between the two extremes of a maximal xmax
and minimal xmin possible distance, which facilitate ET reactions with different rate
constants. An indicator therefore is the enlargement of the full-width at half-maximum
∆Ep,1/2 of the anodic peak (v = 0.1 V/s) to ∆Ep,1/2(P26•D3/Au) = 125.2 mV and ∆Ep,1/2(P26/Au)
= 137.5 mV compared to the Nernstian value of ∆Ep,1/2 = 90.3/n mV.267 The determined k0
value hence reflects the distance xk of the maximum electron tunneling probability (≙
maximum of the shaded curves in Fig. 6-38) with regard to the respective electrode distance
dependent concentration profile of Fc head groups and eq. (6.13). Based on eq. (6.14) and
(6.15), a value of k0 = 0.68 x 10³ s-1 (α = 0.64) was determined at P26/Au and a larger value of
k0 = 1.15 x 10³ s-1 (α = 0.66) at the P26•D3/Au interface. The order of magnitude of these
values is intermediate between a literature values of k0 = 6 x 10⁸ s-1, which was extrapolated
for Fc moieties located close to the surface,84,306 and values which were reported by Achim
et al. for the charge transport through 10-mer Fc-PNA strands (k0 = 0.7 x 10⁻² s-1 for ssPNA
and k0 = 9.0 x 10⁻² s-1 for dsPNA•PNA)85. Since these reported k
0 values approximate the
limiting cases of ET reactions occurring over the maximal or minimal possible distances xmin
and xmax, respectively, a proof is given, that the studied ET process is occurring from strand
conformations, which evoke a maximal concentration of Fc-head groups being located
intermediate between xmax and xmin. In due consideration of the peak current analysis, the
purely diffusion-limited ET process at the P26/Au interface correlates to a smaller k0 value
than that determined at the P26•D3/Au interface, where a process intermediate between
diffusion- and rate limitation was elucidated. This indicates, that the diffusion motion of the
Fc moiety tethered to P26 enlarges xk by dislocating the maximal concentration of Fc head
groups away from the surface, whereas a smaller xk is favored at the P26•D3/Au interface,
related to a faster ET. Considering that the electrically neutral PNA single strand remains
largely unaffected by the applied positive electric field, the thermal fluctuations of the
flexible single strands evoke a broad distribution (∆Ep,1/2(P26/Au) = 137.5 mV) of
possible/favorable locations of the Fc moiety between xmax and xmin with a large average
distance xk. The diminished thermal fluctuations of the rigid P26•D3 duplex give rise to a
decrease in the distribution of favored Fc locations (underscored by ∆Ep,1/2(P26•D3/Au) =
125.2 mV), however as such give no explanation for the shift of xk to smaller values. Latter
can be comprehensively explained if the attractive interaction between the applied positive
electric field and the negatively charged P26•D3 polyelectrolyte is regarded, which will be
discussed in the next section. An induced pulling effect of the electric field can be reliably
considered to be the reason for the shift of xk to smaller values than realized at the P26/Au
interface and to evoke therewith an acceleration of the ET reaction. Fig. 6-38 graphically
demonstrates this interpretation of the ET kinetics.

6. Electrochemical Studies
141
Fig. 6-38. Proposed nanoscopic model of the A) Fc-PNA and B) Fc-PNA•DNA surface dynamics
(shaded area: possible distribution of Fc head groups with respect to the distance to the gold surface between the extremal values xmin and xmax).
6.6.1.2 Reflection about Nanoscopic Effects at Fc-PNA(•DNA) Interfaces
Two main factors are considered to actually determine the strand dynamics and the strand
orientation at large CV scan rates, and with this the resulting average Fc-electrode distances
xk and the correlated ET rate constants k0:
(i) Mechanical bending properties of the strands. According to Kierfeld et al., the strand’s
inherent elastic bending energy governs the dynamical, thermal strand fluctuation, the
strands can perform at the gold surface.125 As discussed in section 6.3, the PNA single strand
obtains a significantly larger elasticity than the rather rigid PNA•DNA duplex. With regard to
(Fig. 6-38), a large strand elasticity facilitates a large spectrum of Fc-electrode distances x
upon thermal strand fluctuations, which is diminished with a decreasing strand elasticity.
The impact of different bending elasticities of single- and double-stranded DNA onto the
diffusion characteristic of the tethered Fc moiety is addressed by the in-plane elastic bending
model of Anne et al. According to this model, a diffusionless electrochemical response is
predicted for the Fc-PNA single strand, whereas a diffusion limited response is predicted for
the Fc-PNA•DNA duplex. The elucidated reverse trend has to be ascribed to the
characteristic differences of PNA compared to DNA, which will be addressed in the following
section by considering that the electrochemical response of the Fc-moiety is moreover
determined by the specific interaction of the surface tethered Fc-PNA(•DNA) strands with
the applied electric field.
(ii) Strand interactions with the electric field. Due to the neutral PNA backbone, the PNA
single strand possesses a fundamentally different electric nature compared to the PNA•DNA
duplex, which presents a negatively charged polyelectrolyte. The strand’s electric nature
becomes relevant, since during a voltammetric scan between E = 0 – 0.8 V, 1.46 nm (~ one
S
Fe
e-
S
Fe
e-
S
Fe
e-
Ø x
dist
ance
x
Fe
Fe
e-e-
Ø x
dist
ance
xxk
xk
S

6. Electrochemical Studies
142
nucleobase, calculated for I = 0.1 M with κ-1 = 1.03 nm according to eq. (6.6)) of the surface-
bound strands (at a theoretical tilt angle of θ = 45° to the surface normal) are directly
exposed to a positive electric field for 16 s (v = 0.1 V/s) to 1.6 ms (v = 1000 V/s). According to
Rant et al., the electric field influences the orientation and dynamics of the negatively
charged polyelectrolyte chains of single- and double-stranded DNA, although just a small
segment of the strand is directly affected by the electric field. The electric field of the
PNA•DNA strand can be approximated by a line of charge, wherein each base pair (bp)
carries the point charge q = -0.24 ∙ e (e = elementary charge). With respect to different
directions of the electric field strength vectors of the electric field of the electrode and that
of the surface bound PNA•DNA polyelectrolytes, the force �×, which is exerted by the electric
field onto the PNA•DNA strand can be expressed by summation over the forces �ØÙÚÚÚ× that act
onto the respective point charges i of the PNA•DNA strand orthogonal to the electrode
surface (direction z) according to eq. (6.38). The electric field strength vector �Ú× of the point
charge i is expressed by eq. (6.39) according to Gauss’ law (vacuum permittivity ε0, relative
permittivity ε0, �× = Û×/Û, Û× = position vector of the point charge).307
�× = u ÜC�Ú×ØCC
(6.38)
�Ú×Ø = Ü4ÇÝ0Ý� ∙ �×�Û] (6.39)
The potential energy W of the PNA•DNA strand hence essentially depends on the strand’s
angle θ to its surface normal due to the exponential decay of the electric field according to
(6.5). W can be expressed by eq. (6.40), Wherein ϕ(zi) equals the potential acting onto the
respective point charge i orthogonal to the electrode surface (direction z), which is given by
eq. (6.5).268
Þ = u ÜC�(Ã)CC
(6.40)
Different strand elasticities of the single- and the double-stranded DNA(•DNA) species
are reported to result in different, electrically induced surface dynamics.308 After applying a
positive potential, the dsDNA strand is rapidly pulled to the surface within less than 0.25 ms,
as soon as the random thermal strand motions directs the strand to a critical tilt angle and
the electric forces exceed the thermal energy kT.308 A similar behavior has to be assumed for
the PNA(•DNA) duplexes, whereas for the electrically neutral PNA single strands solely
significant weaker inductive effects can be considered to cause a pulling effect. Furthermore,
the electric field is exerting a repelling effect onto the Fc head group, which is positively
charged in its oxidized state (Fc0 ↔ Fc+ + e-). This repelling effect is considered to be weaker

6. Electrochemical Studies
143
in the P26•D3 duplex state, since the negative charge of the DNA backbone is already
exerting a screening of the positive charge which is reflected in the measured lower formal
potential of P26•D3 compared to P26.
Within this idealized theoretical treatment, the impact of the electrolyte solution was
neglected although a large significance has to be ascribed to its ionic strength. The
accumulation of counterions from the electrolyte solution at the positively charged
electrode surface as well as at the negatively charged PNA•DNA polyelectrolyte evokes a
screening of the electric field of the biased surface (impact on the Debye length κ-1, see eq.
(6.6)) as well as of that of the PNA•DNA strand. The fraction θ of a polyelectrolyte’s charge
which is compensated by the localization of cations from the electrolyte solution (here
considered: monovalent Na+ counterions) at the strand is expressed in form of the following
equation according to Manning’s condensation theory (ξ: dimensionless structural
parameter; b: axial distance between two elementary charges, b = lc/lnt = 0.35 nm for
PNA•DNA duplexes; lB: Bjerrum length, lB = 0.71 nm for water at T = 300 K).309, 310
Ð = 1 − ß�# (6.41)
ß = �Áà (6.42)
The thereof calculated fraction of θ = 0.51 indicates that the effective charge of a
PNA•DNA duplex is bisected due to the screening of charge in the electrolyte solution, which
however renders it still sufficiently large to be the reason for an attractive interaction with
the positively biased electrode surface, as it was discussed in the last paragraph. According
to Rant et al., θ is largely constant and independent from the electrolyte strength until I =
0.1 M, which equals the ionic strength of the standard buffer solution that was used in this
work.309 At larger ionic strengths, when the salt concentration of the electrolyte solution
approaches the local concentration of PNA•DNA localized counter ions, the accumulation of
counter ions at the polyelectrolyte increases to result in an effective screening of charge
with fractions of θ > 0.51. This diminishes the potential energy W of the PNA•DNA strand
(eq. (6.40)) and hence the attractive interaction between the PNA•DNA strand and the gold
surface, but furthermore increases the strand elasticity due to the decrease of the
electrostatic persistence le (in eq. (6.20)) and hence of the total persistence length lp. The
actual impact of different electrolyte strengths will be investigated in the next section.
In summary it is considered that the actual average Fc-electrode distance x, which
dictates the determined ET rate constant, is mainly the result of the competition between
the DNA attracting and Fc repelling forces of the electric field, with respect to the inherent

6. Electrochemical Studies
144
nucleic strand elasticity. The large ET rate constant k0 = 1.15 x 10³ s-1 of P26•D3 indicates
that the Fc head groups are located at rather small average Fc-electrode distances. Since
P26•D3 exhibits characteristics of a rigid polyelectrolyte, the positively charged field exerts a
pulling effect onto the duplex when the thermal energy kT is exceeded, to favor short Fc-
electrode distances and decrease the average Fc-electrode distance compared to that
distance resulting from solely thermal motions of the duplex strand. The resulting restriction
of possible Fc-electrode distances and hence the space over which diffusion can proceed
evokes, that the ET process is less limited by diffusion, although the current analysis
revealed that still diffusion limitation is present. In contrast, the P26 single strand reveals
with its 1.7 fold lower ET rate of k0 = 0.68 x 10³ s-1 that larger Fc-electrode distances are
favored compared to P26•D3. Considering the weaker pulling effect due to solely inductive
interaction of the electric field with the neutral PNA strand, the thermal motions of the
strand are less restricted to result in a large spectrum of possible Fc-electrode distances over
which diffusion can proceed. Furthermore, the larger elasticity of the single strand enables
rather stochastical motions for the Fc head group compared to the bending or rotational
duplex motions. Concluding, the flexible single strand facilitates various, (more) equivalent
Fc-electrode distances, hence shifting the average Fc-electrode distance away from the
surface and rendering the ET process diffusion limited. The Fc+–electrode repelling effect is
moreover disfavoring short Fc-electrode distances for the neutral P26, but is are largely
negligible for the negatively charged P26•D3 due to the attractive interaction between the
strand and positively charged electrode surface.
6.6.1.3 Time-Resolved FSCV Analysis of the Immobilization Process
The FSCV analysis of the P26 redox process at different points of time t during its
immobilization with cP26 = 20 µM (section 6.5.2.2), was performed by applying scan rates v in
a large range between v = 0.1 – 500 V/s.
The CV current response between v = 0.1 – 500 V/s is presented in Fig. 6-39.A by
plotting the anodic peak current ipa vs. the square root of the scan rate √�. For the Nernstian
ideal of diffusionless, surface confined redox species, the peak current is linearly dependent
on v according to (6.4) to reveal a f(√�) ~ √�� . Interestingly, Fig. 6-39.A reveals linear slopes of
the peak currents ipa (as well for ipc) in the ip vs. √� plot (R2 = 0.9892 – 0.9977), which proofs
a dependency of the peak current on √� like it is described for free diffusing species in eq.
(6.1). Based on this finding, a significant diffusion character is ascribed to the redox process
of the Fc moiety tethered to the PNA single strand, whereby eq. (6.1) presents an excellent

6. Electrochemical Studies
145
approximation for the scan rate dependency of the resulting peak current. Furthermore,
Fig. 6-39.A reveals a decrease of the slope S with proceeding PNA immobilization. Taking
(6.34) as an approximation for the peak current function, the slope equals
Æ = 0.4463 ´��¶
# ]⁄v� ]⁄ �1�Ä��Ä (6.43)
Thereof, an increase of S with an increasing surface concentration ΓPNA (=ΓO) and
incubation time t is expected. The actually determined decrease of S can be ascribed based
on (6.43) solely to a decrease of the diffusion coefficient �� , since the surface coverage is
clearly increasing with the progressing incubation of the electrode with P26 (proof by the
decay of the charging current, Fig. 6-19.A). It is considered that with increasing ΓPNA, the
lateral interactions between the adsorbed PNA strands increase, to provide less degree of
freedom for thermal motions of the PNA strands which reflects in a restricted diffusion for
the tethered Fc head group with a smaller lateral diffusion coefficient.
Fig. 6-39. Analysis of the FSCV peak current response of the P26 immobilization process. A) Randles-Sevcik plot
at different points of immobilization time. B) Slopes S of the straight lines of anodic (ipa) and cathodic (ipc) Randles-Sevcik plots at different points of time during the immobilization process.
Fig. 6-40.A shows the peak separation ∆(Epa-E1/2) over the whole scan rate range of v = 0.1 –
500 V/s, determined at four different points of time during the immobilization of P26,
whereas Fig. 6-40.B demonstrates the k0 values determined thereof during various points of
time during the immobilization of P26.
0 2 4 6 8 10 12 14 16 18 20 220
2
4
6
8
10
12
14
16
18
i pa /
µA
v / (V/s)1/2√
5 min 15 min 60 min 16 h
A B
0 20 40 60 80 100 120 140 16 h
0.4
0.6
0.8
1.0
1.2
1.4
slop
eS
t / min
oxidationreduction
~~
~

6. Electrochemical Studies
146
Fig. 6-40. A) FSCV analysis of the overpotential Epa-E1/2 at different points of time during the immobilization
of P26. B) Electron transfer rate constants k0 calculated from the plots in A) according to E. Laviron.273
The peak separation values ∆Ep in the diffusion-limited regime (v < 10 V/s) reveal a
strong dependency on the P26 surface coverage. With an increasing surface coverage until
an immobilization of t = 60 min and decreasing diffusion coefficients �� (as analyzed in
Fig. 6-39), increasingly smaller scan rates are already fast compared to the diffusion motion,
to render the system into the diffusion limited overpotential region at v < 10 V/s. After an
immobilization of t = 16 h, the ∆Ep curve in Fig. 6-40.A reveals an altered shape of largely
constant ∆Ep values over the whole range of v = 0.1 – 10 V/s. This is ascribed to a loss of the
diffusion motion at the densely packed surface, to render the detected large ∆Ep values the
result of an ET rate and Fc-electrode distance limited ET.
Fig. 6-40.B reveals that the ET rate constants k0 significantly increase with an increasing
surface coverage, to show again a slight decrease at t = 16 h. With regard to Fig. 6-38, the
increase of k0 has to be ascribed to a decline of the average Fc-electrode distance Øx with an
increase of the P26 surface coverage. This finding contradicts an increasing formation of
‘standing up’ species, which would be expected with an increasing ssPNA surface
concentration according to the results of Martín-Gago et al. as well as to the determined �Ä�
decrease of the tethered Fc-moiety (Fig. 6-39) with the proceeding immobilization.
Considering the large elasticity of PNA single strands and the tendency of PNA to self-
aggregation it can be assumed that the increase of strand interactions with the increasing
surface coverage evokes the formation of a densely packed random coil state, which
encloses the Fc head groups to increasingly discriminate maximal Fc-electrode distances and
favor increasingly smaller average Fc-electrode distances Øx with correspondingly larger k0
values. This interpretation is coherent with the progression of the Fc peak potential E1/2
during the immobilization process (Fig. 6-19.B), which indicated a facilitation of the ET
process with an increasing ssPNA surface coverage. This interpretation is visualized in the
nanoscopic model in Fig. 6-41.
-1 0 1 2 30
20
40
60
80
100
120
140
160 5 min 15 min 60 min 16 h
log v / Vs-1
∆(E
pa-E
1/2)
/ mV
0 20 40 60 80 100 120 140 16 h0.5
0.6
0.7
0.8
0.9
1.0
1.1
k0 /
s-1 x
103
t / min
A B~~

6. Electrochemical Studies
147
Fig. 6-41. Proposed nanoscopic model for loosely and densely packed Fc-PNA modified surfaces.
6.6.1.4 PNA Sequence Length Dependency of the ET Kinetics
Gold surfaces (Ø = 2 mm, ρ ~ 1) were loosely packed with the single-stranded Fc-PNA
conjugates P26 – P30 of varying PNA sequence lengths between 3 – 16 nt, in order to
elucidate the length dependency of the strand’s mechanical bending properties with FSCV in
a scan rate range of v = 0.1 – 1000 V/s.
Fig. 6-42 shows the Epa-E1/2 vs. log v plot determined at the P26 – P30 modified surfaces
and primary reveals with an increasing PNA sequence length a significant increase of the
peak separation values in the low scan rate region (v < 10 V/s). With regard to the increasing
strand flexibility (increasing lc/lp values), this effect is ascribed to an increasing diffusion
characteristic of the strand tethered Fc head group from a PNA lengths of 3 nt to 16 nt,
which limits the ET process with a growing strand length at increasingly lower scan rates, to
render the system 16-mer P30 interface already at small scan rates into the diffusion-limited
overpotential region. This interpretation is underscored by the ip/√� vs. log v plot, which
reveals an increasing scan rate sensitivity of ip/√� with a decreasing PNA strand length,
whereas the longer Fc-PNA strands P29, P26 and P30 reveal a largely constant characteristic,
as expected for diffusion limited redox processes (eq. (6.1)). Thereby, the flexibility of the 9-
mer Fc-PNA conjugate P29 appears to be sufficient to induce a significant diffusion motion to
the tethered Fc moiety. The ET of the Fc-moiety tethered to the short 3-mer P27 strand
reveals the least diffusion characteristic, which is ascribed to a large rigidity as is coherent
with the small lc/lp ratio of 1.4. The revealed bell shaped curve progression in the ip/√� plot
(Fig. 6-42) is furthermore observed by Anne et al. and Inouye et al. for Fc-DNA•DNA duplexes
and was ascribed to their rigidity.53, 88
S
e-
S
e-
e-
Øx
SSS SSS SS
Øx
loosely packed densely packed
Fe
Fe
Fe
Fe
Fe
Fe
FeFe
Fe Fe
Fe
S

6. Electrochemical Studies
148
Fig. 6-42. FSCV analysis of P26 - P30 modified surfaces at v = 0.1 – 1000 V/s. A) Plot of the peak current ipa/(N0
v1/2) vs. log v (ipa normalized by the square root of the scan rate v1/2 and N0) B) Plot of the overpotential
Δ(Epa-E1/2) vs. log v. (lines: polynomial fits (4th order, 1000 data points)).
Within the P29/Au (9 nt), P26/Au (12 nt) and P30/Au (16 nt) interfaces, where the
strand tethered Fc moieties reveal comparable diffusion characteristics according to
Fig. 6-42.B, a clear decrease of the determined ET rate constant k0 with the strand length is
determined of k0(P29) = 1.18 x 10³ s-1, k0(P26) = 0.68 x 10³ s-1 and k
0(P30) = 0.51 x 10³ s-1.
With regard to Fig. 6-38, the thermal strand motion in the diffusion controlled low scan rate
region of a longer PNA strand results in a larger spectrum of realized Fc-electrode distances,
than can be realized at a shorter strand. Thereby xmax increases with the increasing PNA
length, whereas xmin can be considered to be comparable for the P29, P26 and P30 due to
the diffusion-limited redox processes. At large v, average Fc-electrode distance Øx are
realized, which are directly proportional to the strand length, and hence inversely
proportional to k0. With this correct prediction of the determined length dependency of the
k0, a further proof for the model in Fig. 6-38 and the basic interpretation of the standard ET
rate constants k0 is given. P27 and P28 reveal with k0(P27) = 0.99 x 10³ s-1 and k0(P28) = 0.82
x 103 s-1 a deviation from the described k0 length dependency, which is ascribed to the
decreasing diffusion characteristic for the short PNA strands, to impede a facile prediction of
xmin and a k0 tendency based on the kinetic data. A direct proof for this interpretation is
given by the decrease of the diffusion residual CV current with a decreasing strand length
(Fig. 6-43).
-1 0 1 2 30
5
10
15
20
25P27/AuP28/AuP29/AuP26/AuP30/Au
i pa /
(N0
v)
/ (A
mol
-1 (s
/V)1/
2x
105 )
√
B-1 0 1 2
0.00
0.05
0.10
0.15
0.20
0.25
0.30
Epa
-E1/
2 /V
log v / Vs-1log v / Vs-1
A
P27/AuP28/AuP29/AuP26/AuP30/Au

6. Electrochemical Studies
149
Fig. 6-43. Overlay of the background subtracted, anodic CV scans of P27 (continuous line), P28 (dashed line)
and P30 (dotted line) modified gold surfaces.
The following nanoscopic model visualizes this interpretation of the kinetic data and the
strand motion.
Fig. 6-44. Proposed nanoscopic model for the PNA length dependency of the ET kinetics.
6.6.2 ET Kinetics of Binary Fc-PNA(•DNA)/MCH Interfaces
6.6.2.1 FSCV Analysis of Fc-PNA(•DNA)/MCH Interfaces
The influence of the formation of a mercaptohexan-1-ol (MCH) co-SAM at Fc-PNA(•DNA)
modified gold electrodes upon the Fc redox kinetics, were studied by means of FSCV in a
scan rate range of v = 0.1 – 1000 V/s. Gold electrodes (Ø = 2 mm, ρ ~ 1), which were
preloaded with a loosely packed monolayer (11.0 ± 1.1 pmol/cm2) of P26 single strands as
well as P26•D3 double strands.
0.1 0.2 0.3 0.4 0.5 0.6 0.7 0.8
0.0
0.2
0.4
0.6
0.8 P27/AuP28/AuP30/Au
i/ µ
A
E / Vvs.Ag/AgCl
Fe
S
Øx
S
Øx
S
Øx
S
Øx
S
x
Fe
Fe
Fe
Fe
Fe
Fe Fe Fe

6. Electrochemical Studies
150
Fig. 6-45. CV analysis of P26(•D3) and P26(•D3)/MCH modified gold electrodes from v = 0.1 – 500 V/s. A) Plot of the peak current ipa/(N0 v1/2) vs. log v (ipa normalized by the square root of the scan rate v1/2 and N0) B) Plot of
the overpotential Δ(Epa-E1/2) vs. log v. (lines: polynomial fits (4th order, 1000 data points)).
The scan rate dependency of the peak separation ∆(Epa-E1/2) of the four interfaces
P26(•D3) and P26(•D3)/MCH shown in Fig. 6-45.A reveals that the co-immobilization of MCH
accelerates the ET reaction at the P26 modified surface as well as at the P26•D3 modified
gold surface, whereas the P26•D3/MCH surface exhibits with an ET rate constant of
k0 = 2.53 x 10³ s-1 still a larger value than the P26/MCH surface with k0 = 2.13 x 10³ s-1. The
general acceleration of the ET process upon MCH co-immobilization is surprising, since the
blocking of free adsorption sites with an additional alkanethiol is generally expected to
impede the electron transfer due to Marcus theory, since the closest possible Fc-electrode
distance is enlarged by the introduction of the blocking layer which reflects in an increase in
the decay constant β of eq. (6.13) about 1.07 per CH2 of the blocking SAM.34, 267 As a main
reason for this inverted effect, changes of the electric field upon MCH modification are
considered. A densely packed alkanethiol monolayer prevents the accumulation of counter
ions at the electrode surface and due to this, only a moderate/linear decay of the electric
field takes place across the MCH layer.268 The electrode distance, where a diffusion layer is
formed and the significant exponential decay of the electric field occurs, is hence shifted
away from the electrode surface about the MCH layer thickness (d(MCH) = 1.2 nm301).
According to this, larger parts of the nucleic acid strands are affected by the electric field
after co-immobilization with MCH. The resulting enhanced pulling effect evokes smaller
average Fc-electrode distances, reflecting in the observed larger ET rate constants.
Interestingly, at the P26 modified surface a 3.1 fold acceleration of the ET process after MCH
co-immobilization is observed, compared to solely a 2.2 fold acceleration determined at the
P26•D3 surface. This is surprising, since less impact of the electric field shifting is expected
for the PNA single strand, since exclusively inductive forces can be considered for causing a
pulling effect.
-1 0 1 2 3048
12162024283236404448
log v / Vs-1
A
P26P26/MCHP26•D3P26•D3/MCH
i pa /
(N0
v)
/ (A
mol
-1 (s
/V)1/
2x
103 )
B-1 0 1 2 3
0.00
0.05
0.10
0.15
0.20P26P26/MCHP26•D3P26•D3/MCH
Epa
-E1/
2 /V
log v / Vs-1

6. Electrochemical Studies
151
Fig. 6-46. Proposed nanoscopic model for the ET kinetics at B) PNA•DNA and C) PNA•DNA/MCH modified
surfaces. A) Potential decay with respect to the distance to the electrode surface calculated according to the Gouy-Chapman theory.
As a second parameter dictating the larger ET rate constants after co-immobilization of
MCH, the loss of strand flexibility is considered. The formation of the MCH SAM evokes that
a segment of the linker is embedded in the MCH layer and the length of the remaining
strand segment which is accessible to thermal motions is hence reduced (decreased lc/lp
ratio for P26 and P26•D3). The loss of strand flexibility is expected to directly restrict the
diffusion-like behavior of the tethered Fc head group. According to eq. (6.1) and the
discussion in section 6.6.1, a lower diffusion coefficient should directly result in a lower CV
peak current iP, which is actually observed for P26/MCH (Fig. 6-25) and analog at
P26•D3/MCH. Furthermore, the Δ(Epa-E1/2) values in the thermodynamically controlled low
scan rate region (v < 10 V/s) are at both surfaces significantly smaller after MCH co-
immobilization, indicating a transition to surface confined, diffusionless species. Following
the discussion in section 6.6.1, a restricted strand flexibility combined with the exposition to
the attractive force exerted by the electric field results in a smaller average Fc-electrode
distance, corresponding to the determined larger ET rate constants at P26/MCH and
P26•D3/MCH compared to the pure P26 and P26•D3. The actually determined kinetics of the
ET process are thereby considered as the result of the competing effects of a deceleration
due to an increased Fc-electrode distance and the superimposed acceleration due to the
enhanced attraction due to the shift of the electric field.
6.6.2.2 ET Kinetics upon Modulation of the Electric Field Strength
In order to further elucidate the electrostatic effects of the electric field onto the nucleic
acid strand orientation/dynamics and the kinetics of the ET process, the impact of changes in
the Debye lengths of the electric field onto the electrode kinetics were studied. A possibility
to experimentally modulate the Debye length κ–1, is to vary the ionic strength I of the
electrolyte solution. Eq. (6.6) reveals that κ–1 is decaying with an increasing ionic strength I,
φ / φ0
0
1
2
3
4
5
6
0.00.10.20.30.40.50.6
x/ n
mS
Fe
θ1
x/ n
m
Øx
S
OH
S
OH
S
OH
S
OH
S
OH
S
OH
S
OH
S
OH
S
OH
S S
OH
S
OH
S
OH
S
OH
S
OH
S
OH
S
OH
S
OH
S
OH
S
OH
S
OH
θ2
Fe
x/ n
m
Øx
AuAu/MCH
A
B C

6. Electrochemical Studies
152
corresponding to a compression of the diffusion layer and a decline of the electrode distance
x, over which the electric field can exert a significant electric force (see also eq. (6.5)).
Besides this screening of the electric field of the electrode (i), an increase of the ionic
strength furthermore evokes (ii) the screening of the electric field of the negatively charged
DNA polyelectrolytes, which results in a suppression of the intermolecular repulsion
between DNA strands and a decrease of the electrostatic persistence length le (and with this
furthermore of the persistence lp) according to eq. (6.20) and (iii) an increase of the
electrolyte conductivity, which renders the counterion movement increasingly less rate
determining for the ET process.
FSCV studies were performed at P26/MCH and P26•D3/MCH modified gold electrodes in
four electrolyte solutions of different ionic strengths ranging between 10 mM and 1 M
(pH 7.0; A, B, C: 2.5 mM PBS + 10 mM, 0.1 M, 0.25 M NaClO4, D: 10 mM PBS + 1 M NaClO4).
As described in 6.6.2, the diffusion layer is shifted away from the electrode upon MCH co-
immobilization, hence the modulation of the electric field occurs in the diffusion layer
adjacent to the MCH film.
Fig. 6-47. FSCV analysis of P26(•D3)/MCH interfaces with varying electrolyte strengths (I = 0.01 – 1 M). A) Plot of the overpotential Δ(Epa-E1/2) vs. log v (lines: polynomial fits (4th order, 1000 data points)). B) Electron transfer
rate constants k0 calculated according to E. Laviron from the plots in A) (straight lines: exponential growth fit) and Debye lengths κ-1 calculated from eq. (6.6).
Fig. 6-47.B reveals that the ET process at both interfaces P26/MCH and P26•D3/MCH is
significantly accelerated with increasing ionic strength, which is generally due to an
enhanced electrolyte conductivity with an increasing salt concentration according to
Kohlrausch’s law for strong electrolytes. However, the ET process at the P26•D3/MCH
surface appears much more sensitive towards an increase in the ionic strength compared to
the ET process at the P26/MCH surface (acceleration from I = 10 mM to I = 1 M: 14.3 fold at
P26/MCH, 23.0 fold at P26•D3/MCH). Thereby the difference in the ET rate constants of both
surfaces is at I = 1 M more than 80 times larger than at I = 0.1 M. Hence, the general ET
-1 0 1 2 30.00
0.05
0.10
0.15
0.20
0.25
0.30
0.35
0.40
log v / Vs-1
∆(E
pa-E
1/2)
/V
0.0 0.2 0.4 0.6 0.8 1.00
2
4
6
8
10
I / M
0.0
0.5
1.0
1.5
2.0
2.5
3.0
κ-1 / nm
k0 /
s-1
x 10
3
0.01 M0.10 M0.25 M1.00 M
A B
P26•D3/MCHP26/MCH
κ-1

6. Electrochemical Studies
153
acceleration due to an increase of conductivity is evidently overlaid by a second trend,
where differences in the structural characteristics of P26 and P26•D3 contribute.
At low ionic strengths, the long ranging electric field is affecting large parts of the
nucleic acid strands, corresponding to about more than ~55 % of an upright conformation of
the nucleic acid strands of P26 and P26•D3 (I = 0.01 M: κ-1 = 2.71 nm + d(MCH), θ = 90°).
Hence it has to be assumed that the actual strand orientation and the resulting ET kinetics
are mainly determined by the field-induced, counteracting effects of strand-electrode
attraction and Fc+–electrode repulsion (see 6.6.1). With increasing ionic strength, the field is
repressed to the electrode surface and the strand fraction which is affected by the electric
field is decreased up to solely about one nucleobase at an upright conformation at I = 1 M
(1 M: κ-1 = 0.33 nm + d(MCH)). Furthermore, the negative charges located at the DNA
backbone are effectively screened at high ionic strengths. As the sum of the electric forces
are hence becoming small compared to the thermal energy kT at high ionic strengths, the
nucleic acid strand orientation gets predominantly dictated by thermal strand motions. This
evokes ET kinetics for the Fc head groups, which unrestrictedly reflect the inherent elastic
bending properties of the Fc-electrode connecting strands. With this, the ET rate constant
determined at high ionic strengths, exclusively reflects structure determined, preferential
average Fc-electrode distances to reveal that the preferred average Fc-electrode distance of
the P26•D3 duplex is significantly smaller than for the P26 single strand. This interpretation
is underscored by ellipsometry measurements, reported of 10mer Fc-PNA(•DNA) strands of
the same general structure like P26 and P26•D3.252 Thereby the PNA•DNA duplex exhibited
as expected significant smaller layer thicknesses of d = 17.7 ± 0.2 Å, whereas larger values of
d = 34.2 ± 0.2 Å were measured for the PNA single strand. These results are furthermore in
agreement with molecular model shown in Fig. 6-38, which predicted a significant larger
spectrum of possible Fc-electrode distances for the flexible Fc-PNA single strand compared
to the rigid Fc-PNA•DNA duplex, which can be directly correlated with the overall layer
thickness.
6.6.3 Kinetic Analysis with SWV at Varying Pulse Frequencies
The ET process of loosely packed Fc(-Tz)-PNA monolayers at gold microelectrodes (Ø =
0.1 mm, ρ = 1.5 – 2) was studied by the SWV pulse mode I (compare to section 6.2.3) in a
frequency range of f = 8 Hz to 1500 Hz, an amplitude of A = 25 mV and a step potential of
5 mV. The method will be studied taking the monolayer of the single-stranded Fc-Tz-PNA
conjugate P32 as an example. Further studies of the binary interfaces of P32, P34 and P26

6. Electrochemical Studies
154
will be performed in order to study the impact of different Fc labels, and the comparison
between the P32/MCH and the P32•D2/MCH interface should clarify the impact of PNA•DNA
duplex formation.
Fig. 6-48. SWV (b. s.) of a P32-modified gold electrode at the SWV frequencies f = 10 and 500 Hz (A = 25 mV)
(Straight line: differential current; dashed line: forward (positive) and backward (negative) current).
Fig. 6-48 exemplary demonstrates SWV of the P32 interface at two different SWV
frequencies of f = 10 Hz (v = 0.05 V) and f = 500 Hz (v = 2.5 V) and a constant amplitude of A
= 25 mV. Whereas at f = 10 Hz no peak separation is revealed and ifor is slightly larger than
iback (ifor/iback = 1.8), at larger f = 500 Hz the peak separation is increased as expected, but
furthermore the backward current iback is significantly smaller than ifor (ifor/iback = 8.8).
Fig. 6-49 presents the SWV analysis (ip, Ep) of the P32 interface in a scan rate of v = 0.1 –
2.5 V/s in direct comparison with the analogous values obtained from CV measurements at
the same interface.
Fig. 6-49. CV (red) and SWV (black) analysis of the P32 interface in a scan rate range of v = 0.1 – 2.5 V/s.
A) Peak current progression (SWV: ∆ip, ipa, –ipc; CV: ipa, –ipc). B) Peak potential progression (SWV: Epa, Epc; CV: Epa, Epc)
Fig. 6-49.A reveals that whereas ip(CV) is monotonic increasing, as predicted by eq. (6.1)
for diffusion-limited or eq. (6.4) for rate limited processes and analyzed in the last section for
the P26 interface, the differential SWV peak current ∆ip is increasing to a maximum at v =
-0.1 0.0 0.1 0.2 0.3 0.4 0.5 0.6 0.7-0.4
-0.2
0.0
0.2
0.4
0.6
0.8
1.0
i / n
A
E / Vvs.Ag/AgCl-0.1 0.0 0.1 0.2 0.3 0.4 0.5 0.6 0.7
-2
0
2
4
6
8
10
12
14
i / n
AE / Vvs.Ag/AgCl
10 Hz 500 Hz
0.0 0.5 1.0 1.5 2.0 2.50.26
0.28
0.30
0.32
0.34
Ep /
Vvs
.Ag/
AgC
l
v / Vs-10.0 0.5 1.0 1.5 2.0 2.5
02468
101214161820
i / n
A
v / Vs-1
Ep(CV)Ep(SWV)
ip(CV)ip(SWV)
A B

6. Electrochemical Studies
155
0.75 V/s (150 Hz) and subsequently decaying. This non-monotonic behavior is not coherent
with eq. (6.10), which predicts for the differential SWV peak current ∆ip a dependency on
1/tp (≙√�) and √�, to be proportional to ip determined by CV at a certain scan rate
(assumption: diffusion-limited redox process). This proportionality results from equalizing
(6.1) and (6.10) (after transferring the latter into the scan rate domain with tp = 1/400 v and
∆Es = 5 mV) to eq. (6.44), which gives eq. (6.45) for n = 1 at T = 293.15 K.
� (CV) = 14.2798����� ∙ ∆� (SWV) (6.44)
� (CV) = 2.27 ∙ ∆� (SWV) (6.45)
Eq. (6.10) and (6.45) render the current increase at low v reasonable, whereas the current
decay at scan rates larger than v = 0.75 V/s is unpredicted. The analysis of the SWV forward
(ipa) and backward (ipc) peak currents shows that this ∆ip decay is mainly the result from a
decay in ipc, whereas the ipa progression exhibits a saturation curve. This is coherent with
Fig. 6-49.B, which reveals a significant decrease of Epc, corresponding to an impediment of
the Fc+ reduction with increasing f, which is accompanied with a solely slight increase of Epa
and is not exhibited in CV.
This deviation of the SWV ∆ip progression from the corresponding and predicted CV ip
response indicates that the application of the SWV potential waveform (/measuring mode)
renders a process limiting to the ET reaction, which is not limiting in CV measurements at
comparable scan rates. With respect to the SWV potential waveform (Fig. 6-50), an increase
in the SWV frequency f corresponds to a shortening of the pulse width tp, which clearly
corresponds to a current increase assuming a Cottrell like current decay (eq. (6.8)) after
application of the potential pulse (basis for eq. (6.10)), but is however not coherent with the
detected ip profile (Fig. 6-49.A). From the experimentally detected ipa(f) and ipc(f) function,
instead the ipa(t) and ipc(t) current decay functions shown in Fig. 6-50 (dashed lines) could be
deduced. This experimentally determined current decay functions have to be considered as
the overlay of various decay functions, resulting from Fc head groups, which are located at
various distances to the electrode surface. Every distinct Fc-electrode distance is related to a
certain concentration of Fc head groups and a distinct ET rate constant k0 according to eq.
(6.13), which together determine the respective current decay function.

6. Electrochemical Studies
156
Fig. 6-50. SWV potential waveform: one tread with f = 50 Hz, A = 25 mV (green), tp shortening at f = 83 Hz
(dashed red) and f = 250 Hz (dashed blue). Black lines: Cottrell decay according to eq. (6.8), ip(t)th (straight line); experimental current decay, as suggested according to experimental data of the P32 interface
shown in Fig. 6-49.A, ip(t)exp (dashed line)).
Whereas the ipa(t) function remains rather constant at its maximal value with an
increasing pulse width until tp = 7.5 ms, the -ipc(t) function monotonically increases until tp =
7.5 ms. Following the discussion, this directly correlates with a rather uniform distribution of
Fc0 groups with respect to the distance to the electrode surface, whereas the concentration
of Fc+ groups increases with an increasing distance x to reach a maximal concentration at tp =
7.5 ms. As an explanation for this different behavior of Fc0 and Fc+, the interaction with the
positively charged electric field adjacent to the electrode surface is suggested. Whereas both
Fc moieties are attached to the neutral PNA strand, to which presumably minor electrostatic
effects are exerted by the electric field, the repulsion between the positively charged Fc+
moiety and the electric field evokes a dislocation of the Fc moiety away from the electrode
surface, to yield a maximal Fc concentration at a distance related to a slower ET rate
constant (E > pzc during the whole measurement). Based on the previous discussion, this
motion of the Fc moiety during the measurement is facilitated by the fluctuations of the
flexible, Fc and electrode connecting PNA single strand. Since a single SWV measurement
comprises a series of potential pulses (Fig. 6-4), the PNA single strand performs ongoing
fluctuations upon application of this oscillating electric field, which direct the attached Fc
moiety alternating away from the surface (Fc+ state) or to a uniform distribution in
electrostatic relaxation (Fc0 state). This consideration reveals the significant difference in the
study of ET processes with SWV in comparison to CV measurements, where the electric field
is not oscillation but instead linearly built up in the anodic scan and then continuously
decreased in the cathodic scan.
Fig. 6-51.A reveals the SWV determined ip(v) profiles of the three different binary
interfaces P26/MCH, P32/MCH and P34/MCH. Whereas the interfaces of the two Fc-Tz-PNA
50 Hz 83 Hz250 Hz
0 5 10 15 20 25-30
-20
-10
0
10
20
30
E /
mV
t / ms
-5
0
5
10
i / µAip(t)th
ip(t)exp

6. Electrochemical Studies
157
conjugates P32 and P34 reveal nearly identical ip(v) profiles, P26/MCH reveals slight
deviations thereof, which indicate a maximal Fc0/+ concentration at a larger Fc-electrode
distance than at the Fc-Tz-PNA interfaces (compare to the discussion to Fig. 6-50) and a
related slower ET process. As a reason for this, an attractive interaction between the
electron-rich triazole ring of the Fc-Tz-PNA conjugates is suggested, which evokes a
preference of shorter Fc-electrode distances compared to that at the P26 interface. A
consequence from these different ET kinetics (and a second proof for this interpretation) is
the different behavior of Fc-Tz-PNA compared to Fc-PNA capture probes in the preparation
of a dual-potential interface (section 6.7.2).
Fig. 6-51. A) SWV ip(v) profile of the P26/MCH, P32/MCH and P34/MCH interfaces (ip normalized vs. ip
max). B) SWV ip(v) profile of the P32/MCH and the P32•D2/MCH interface
(vs. ip scale: , ; vs. ip/ipmax scale: , ).
Fig. 6-51.B reveals the ip(v) profile of the binary MCH interfaces of the single-stranded
Fc-Tz-PNA conjugate P32 and its fully-complementary duplex P32•D2. The plot of the
normalized peak current (ip/ipmax) reveals for the P32•D2/MCH interface a slight shift of the
maximum to larger scan rates, corresponding to an acceleration of the ET process and a
dislocation of the maximal Fc concentration towards the electrode surface, which is
coherent with the results of the FSCV analysis of P26 and P26•D3 interfaces (section 6.6.1.1).
Furthermore, the current decay after reaching of the maximum is with ∆∆ip = –41.7 %
significantly larger at the P32/MCH interface than at the P32•D2/MCH interface with ∆∆ip =
–20.2 %. As an explanation for this it is suggested that the dislocation of the Fc+ moieties
away from the surface (as the main reason for the strong decay of the ip(f) function, see
above), is restricted by the attractive interaction between the negatively charged DNA
backbone and the electric field, which dominates over the Fc+ repulsion. The different
diffusion characteristics furthermore evoke a significantly smaller peak current for the
P32•D2 duplex (real ip scale in Fig. 6-51, signal-off), which was already analyzed in section
6.5.7. Based on this interpretation, the SWV pulse method and the thereof analyzed ip(f)
profiles facilitate a differentiation between interfaces of immobilized single- and double-
0.0 0.5 1.0 1.5 2.0 2.5
0.0
0.2
0.4
0.6
0.8
1.0
i p/i
pmax
v / Vs-1
A B
P34/MCHP32/MCHP26/MCH
P32/MCHP32•D2/MCH
0 1 2 3 4 5 6 7 80123456789
10111213
0.0
0.2
0.4
0.6
0.8
1.0
i p /
nA
ip /ip max
v / Vs-1

6. Electrochemical Studies
158
stranded PNA(•DNA) species, which will exploited for the DNA analysis with the dual-
potential interface (section 6.7.2).
6.6.4 Conclusion
In this section, the kinetics of the ET process at gold surfaces, which were loosely packed
with layers of N-terminally ferrocenylated peptide nucleic acid (PNA) strands or Fc-PNA•DNA
duplexes was studied by FSCV as well as a SWV pulse method. The FSCV studies revealed
that the kinetics and the diffusion characteristics of the Fc-electrode ET process are clearly
dictated by the interplay of the elastic bending properties and the specific electric field
interaction of the nucleic acid strand, which connects the biased surface with the strand
tethered Fc moiety. A nanoscopic model (Fig. 6-38) was proposed for the dynamical strand
motion, which demonstrates the reverse correlation between the extent of diffusion
limitation (at low scan rates) and the size of the ET rate constants k0 (determined a large
scan rates). Thus, the determined ET rate constants are considered to electrochemically
reflect the Fc-PNA(•DNA) surface dynamics. Based on the determined ET rate constants, a
clear picture of the surface dynamics of immobilized ssPNA and fully complementary
PNA(•DNA) was developed. The kinetics of the pure Fc-PNA(•DNA)-modified surfaces were
studied as well as those of binary Fc-PNA(•DNA)/MCH-modified surfaces. The following
general findings were determined: (i) Fc moieties attached to flexible PNA single strands
reveal a significantly larger diffusion-limitation and a slower ET process (≙ larger average Fc-
electrode distance) as compared to Fc moieties attached to the rigid PNA•DNA duplexes.
This is the inverse trend compared to that reported for analogous DNA systems.88 The
inverse behavior was found to originate from the ssPNA’s neutral character and the switch in
the electric nature occurring upon DNA hybridization, thus rendering the interaction with
the electric field as the main reason for the significantly different ET process of surface
confined Fc-PNA single strands and Fc-PNA•DNA duplexes. (ii) The co-immobilization of MCH
to PNA(•DNA)-modified gold electrodes results in a significant acceleration of the Fc-
electrode ET process at both surfaces. This is ascribed to the electric field, which is shifted
upon MCH co-immobilization by the thickness of the MCH layer. Larger parts of the
PNA(•DNA) strand are affected by the electric field and direct the strand to generally larger
tilt angles θ between strand and surface normal. Together with a decreased flexibility due to
MCH co-immobilization, smaller average Fc-electrode distances are attained which are
reflected in larger ET rates. (iii) With a decreasing strand length at electrically identical
monolayers, the diffusion-limited ET process increasingly reveals the characteristic of a rate-
limited system, which hence can be clearly ascribed to the related increase in strand

6. Electrochemical Studies
159
stiffness. (iv) FSCV studies at increasing surface densities reveal an increasing diffusion-
limitation, wherefore the increasing rate constants indicate the formation of a random coil
state at high coverages.
The insights about the strand’s elastic bending properties and dynamical fluctuations as
well as effects exerted by the electric field, which together determine the characteristics of
the ET process as well as the interfacial properties of loosely packed Fc-PNA(•DNA) surfaces,
obtain high relevance for PNA sensing surfaces in a general sense, and furthermore present
the theoretical foundation for an electrochemical DNA detection strategy with Fc-PNA
recognition layers, which are based on the kinetics of the Fc redox process. Further
investigation of this ET mechanism with regard to the impact of single point mutations will
be presented in section 6.7.
6.7 DNA Sensor Concepts
6.7.1 Interfaces of Immobilized Fc-PNA•DNA Duplexes with a Single Mismatch
Studies about the impact of a single point mutation in 12 nt long, surface grafted Fc-
PNA•DNA duplexes of P26 will be presented in this section. The focus will be on the
electrochemical response and the mechanical bending properties in comparison to that of
the fully-complementary analog P26•D3. In order to investigate the impact of a single point
mutation upon the mechanical bending based ET mechanism B in section 1.1.4, a systematic
study of the twelve Fc-PNA•DNA duplexes P26•D1, P26•D4 – P26•D14 (Tab. 5-3) with a
position dependent permuted single point mutation will be presented.
6.7.1.1 Primary Response: SNP Fc-PNA•DNA Interface
Gold surfaces (Ø = 2 mm, ρ = 1) were modified with the SNP duplexes P26•D1, P26•D4 –
P26•D14 shown in Tab. 5-3 (duplexes 3, section 5.3.3), which all present analogs of P26•D3
with a single point mutation. Thereby the modification strategies A or B of Fig. 6-20 were
applied under conditions B or C (Tab. 6-4), to yield loosely packed monolayers.
Fig. 6-52 exemplary shows an overlay of CV of surfaces modified with P26, P26•D3 and
exemplary the SNP duplex P26•D1 (TM = 37.6 °C, modification strategy A) with an a/C point
mutation located at position 6 (counting from PNA C-terminus). It shows that the P26•D1
interface exhibits a strong decrease in the peak current ip of -∆ip = 61.6 (± 11.0) % (signal-off
effect) and a shift of the half-wave potential E1/2 to more negative values about -∆E1/2 = 5 to

6. Electrochemical Studies
160
15 mV compared to CV of the P26-modified surface. The CV response of the other studied
interfaces P26•D4/Au – P26•D14/Au shows a comparable response like P26•D1/Au and the
here indicated -∆ip and -∆E1/2 values result from the analysis of all studied SNP duplex
interfaces with the SNP located at varying strand position, explaining the larger error. The
observed effects of peak current and half-wave potential decay compared to the P26
interface are analogous to the voltammetric response of the fully-complementary duplex
P26•D3, although both effects are developed to a smaller extent (P26•D3/Au: -∆E1/2 = - 20 to
40 mV, -∆ip = 88.7 (± 1.7) %, section 6.5.3). Based on this different extent of the signal-off
effect, a differentiation between a duplex with single point mutation and its fully-
complementary analog is feasible by CV or SWV measurements in principle. The difference in
the signal-off effect is even larger at the respective binary Fc-PNA•DNA/MCH surfaces with
-∆ip = 21.4 (± 13.1) % at the SNP duplex modified surfaces compared to -∆ip = 89.5 (± 6.8) %
at the P26•D3/MCH interface.
Fig. 6-52. CV overlay (v = 0.1 V/s) of P26, P26•D3 and P26•D1 modified gold electrodes.
(upper part: original data, bottom part: b. s.)
However, by applying strategy B of Fig. 6-20 instead of strategy A and performing the
hybridization with D3 or the mismatch analyte sequences D1, D4 – D14 at P26 or P26/MCH
modified surfaces reveals that the unspecific signal-off effect (section 6.5.6.2) largely
impedes the generation of a reproducible and DNA analyte specific sensor response. The
false positive detection of the non-complementary target strand D2 with P26(/MCH)
modified surfaces at large surface coverages, larger surface area (Ø = 2 mm) or binary
monolayer composition reveals the significance of the unspecific signal-off effect and with
P26P26•D1P26•D3
-0.2
0.0
0.2
0.4
0.6
i / µ
A
0.1 0.2 0.3 0.4 0.5 0.6 0.7 0.8
E / Vvs.Ag/AgCl
-0.2
0.0
0.2~

6. Electrochemical Studies
161
this the limitation of a quantified signal-off effect for an analysis of DNA with Fc-PNA sensing
surfaces. A further problem of this strategy lies in the fact that this detection strategy bases
on the analysis of small peak intensities, which result after the decay of the current upon
hybridization.
Tab. 6-6. Signal-off effect at different interfacial designs.
-∆ip
/ % D1 D2 D3
P26 † 37 n. d. 83
P26/MBU ‡ 57 34 72
P26/MCH ‡ 70 73 71
P26/MUD ‡ 80 82 85
Prepared by applying immobilization conditions B, Tab. 6-4; analysis from anodic scan of CV at v = 0.5 V/s. † Microelectrode (Ø = 0.1 mm). ‡ Macroelectrode (Ø = 2 mm).
Following the discussion about the ET mechanisms at Fc-PNA(•DNA)-modified surfaces,
the larger peak currents detected at the SNP duplex interfaces compared to that detected at
the P26•D3/Au interface are a further proof for the redox response being predominantly
evoked by ET mechanism B of Fig. 1-5 rather than mechanism A. For the latter being the
dominating ET mechanism, the peak current of the SNP duplex interfaces would be expected
to be smaller than ip(P26•D3/Au) due to an impediment of the CT through the SNP strand
according to Barton et al. (compare to section 1.1.4 and 6.7.3).57, 80, 81
6.7.1.2 Mechanical Bending Induced ET at SNP Fc-PNA•DNA Interfaces
The influence of single nucleotide polymorphism (SNP) onto the Fc-electrode kinetics of
gold surface confined Fc-PNA•DNA strands was studied by means of FSCV in a scan rate
range of v = 0.1 – 1000 V/s. Therefore, gold electrodes (gold electrodes: Ø = 2 mm, ρ ~ 1)
were loosely packed (< 10 %) with the set of SNP duplexes P26•D1 and P26•D4 – P26•D14 as
shown in Tab. 5-2, wherein the single point mutation is position dependent permuted from
the PNA N – to C – terminus. The pure Fc-PNA•DNA (interface 1), as well as the binary Fc-
PNA•DNA/MCH interface design (interface 2) was studied. Conclusions about the actual
impact of the point mutation onto the kinetics of the ET process are facilitated, since within
all modified surfaces of one type of interface (interface 1 or 2) the electric field as well as the
overall electrostatic forces are constant.
The standard ET rate constants k0 determined at the surfaces solely modified with the
Fc-PNA•DNA duplexes P26•(D1, D3 – D14) (interface 1) exhibited the following trend

6. Electrochemical Studies
162
(Fig. 6-53.A): with an increasing dislocation of the mismatch position from the PNA C-
terminus towards the N-terminus (away from the gold surface and the peptidic linker
towards the Fc head group) the ET rates are declining from values comparable to k0(P26•D1)
of the fully-complementary duplex towards values comparable to k0(P26) of the Fc-PNA
single strand. This tendency indicates with respect to the discussion to Fig. 6-38 that upon
shift of the mismatch from the C to the N terminus, the average distance between the Fc
head and the electrode surface is enlarged. Thereby, the determined ET rate constants range
from k0 = 0.64 x 10³ s-1 for P26•D6/Au with the point mutation located at strand position 10,
to a 1.9 fold larger value of k0 = 1.22 x 10³ s-1 for P26•D14/Au with the mismatch located at
strand position 1.
Fig. 6-53. Grey bars: ET rate constants k0 determined at surfaces modified with P26•D1 and P26•D3 – P26•D14.
A) Fc-PNA•DNA modified surfaces, interface 1. B) Fc-PNA•DNA/MCH modified surfaces, interface 2. Red bars: TM values of the Fc-PNA•DNA duplexes P26•D1 and P26•D3 – P26•D14 (Tab. 5-3). (lines: polynomial
fits (4th order, 1000 data points))
At the Fc-PNA•DNA/MCH modified surfaces (Fig. 6-53.B, interface 2), all SNP duplexes
reveal larger ET rate constants k0 than determined at the respective surfaces before co-
immobilization of MCH. This is coherent with the ET acceleration observed after MCH co-
immobilization at the P26•D3 surface (section 6.6.2). Hence, the same field-shifting effect
like that described in section 6.6.2 for the P26•D3 surface, is considered to cause the ET
acceleration at the P26•(D1, D4 – D14)/MCH surfaces. The ET rate constants thereby range
from k0 = 1.55 x 10³ s-1 for P26•D9/MCH, with the mismatch being located at strand position
6 to a 1.5 fold larger value of k0 = 2.40 x 10³ s-1 for P26•D14/MCH. With this, a similar decay
of the ET rate constants with increasing mismatch positions like at the solely Fc-PNA•DNA
modified surfaces is observed, however a weak minimum is observed at mismatch
position 6, which is followed by a slight increase of the ET rates until position 10.
S c t c a g a a c a t c t
OHOH
OHOH
OH
SS
SS
SS
c t c a g a a c a t c t
20
40
60
80
100
120
0.0
0.2
0.4
0.6
0.8
1.0
1.2
1.4
20
40
60
80
100
120
0.0
0.5
1.0
1.5
2.0
2.5
3.0
k0 /
s-1 x
103
k0 /
s-1 x
103
TM / °C
TM / °C
A B
P26·D
3
P26·D
14
P26·D
13
P26·D
12
P26·D
11
P26·D
10
P26·D
9
P26·D
1
P26·D
8
P26·D
7
P26·D
6
P26·D
5
P26·D
4
P26·D
3
P26·D
3
P26·D
14
P26·D
13
P26·D
12
P26·D
11
P26·D
10
P26·D
9
P26·D
1
P26·D
8
P26·D
7
P26·D
6
P26·D
5
P26·D
4
P26·D
3
Fc-PNA•DNAinterface 1
Fc-PNA•DNA/MCHinterface 2
FeFe

6. Electrochemical Studies
163
Discussion of the SNP Fc-PNA(•DNA)/(MCH) ET kinetics:
Based on the following assumptions and restrictions, theoretical values for minimal and
maximal possible Fc-electrode distances xmin and xmax were calculated for all Fc-PNA•DNA
duplexes P26•(D1, D3 – D14) at the Fc-PNA•DNA as well as at the Fc-PNA•DNA/MCH-
modified surface: (i) the single mismatch divides the fully complementary duplex P26•D3
into two segments A and B, which behave like rigid rods being connected by the single
mismatch as a flexible hinge; (ii) the electric field dictates a preferential angle θ between
segment A and the surface normal, which is assumed to be larger for the Fc-PNA•DNA/MCH
modified surface based on the general faster ET rate constants as determined section 6.6.2
(assumed tilt angles θ: Fc-PNA•DNA θ = 40°, Fc-PNA•DNA/MCH θ = 65°); (iii) the flexible
mismatch enables segment B to perform thermal motions around the mismatch as its
anchoring point to segment A, however it is electrostatically disfavored to undercut a certain
bending angle α = ∢A,B due to DNA/DNA repulsion between segments A and B (α = angle of
maximal deflection of segment B; assumption: α = 120°). Based on these assumptions, the
resulting geometrically restricted values for xmin and xmax were calculated according to the
following trigonometric relations, which refer to Fig. 6-54.
xmin calculates according to the following equations, whereby for the Fc-PNA•DNA interface
xmin = Y and for the Fc-PNA•DNA/MCH interface xmin = Y + d(MCH):
ä = � ∙ cos(�) (6.46)
� = 1�] + Ô] − 2�Ô cos(±) (6.47)
sin(é) = ¦ :xU (_)� (6.48)
� = Ð + 60 − é (6.49)
xmax calculates according to the following equation, whereby for the Fc-PNA•DNA interface
xmin = E + B and for the Fc-PNA•DNA/MCH interface xmin = E + B + d(MCH):
� = � ∙ cos(Ð) (6.50)
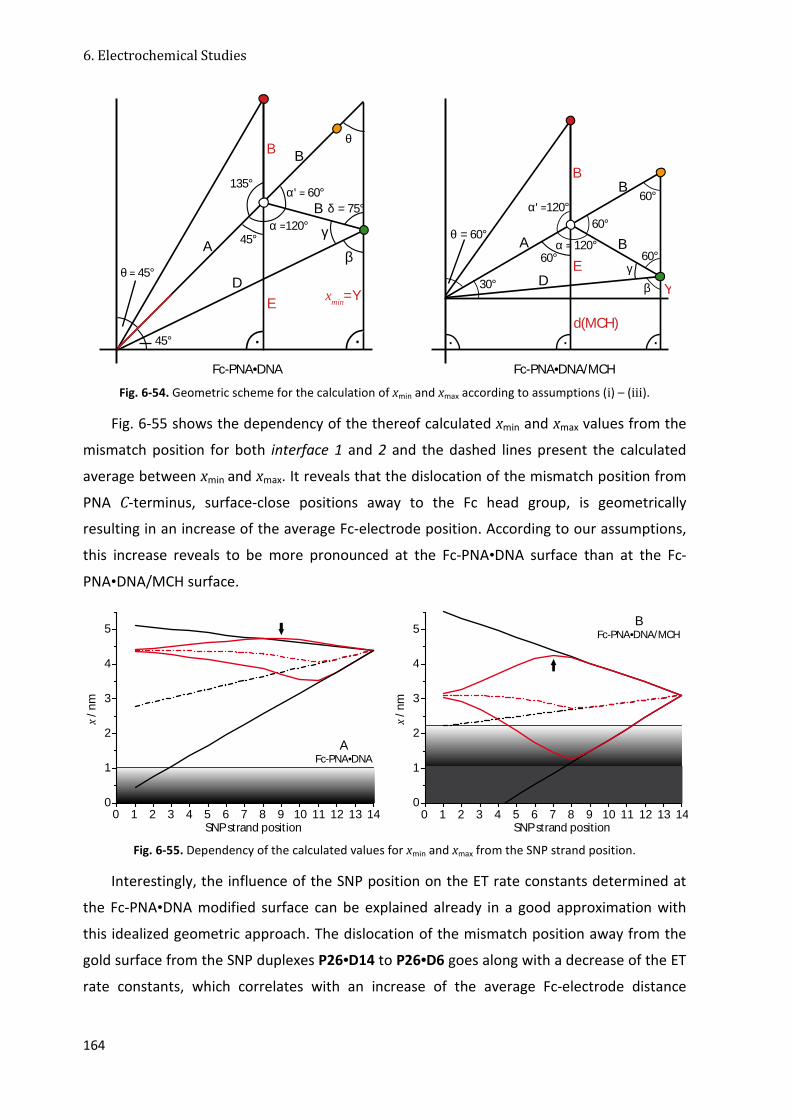
6. Electrochemical Studies
164
Fig. 6-54. Geometric scheme for the calculation of xmin and xmax according to assumptions (i) – (iii).
Fig. 6-55 shows the dependency of the thereof calculated xmin and xmax values from the
mismatch position for both interface 1 and 2 and the dashed lines present the calculated
average between xmin and xmax. It reveals that the dislocation of the mismatch position from
PNA C-terminus, surface-close positions away to the Fc head group, is geometrically
resulting in an increase of the average Fc-electrode position. According to our assumptions,
this increase reveals to be more pronounced at the Fc-PNA•DNA surface than at the Fc-
PNA•DNA/MCH surface.
Fig. 6-55. Dependency of the calculated values for xmin and xmax from the SNP strand position.
Interestingly, the influence of the SNP position on the ET rate constants determined at
the Fc-PNA•DNA modified surface can be explained already in a good approximation with
this idealized geometric approach. The dislocation of the mismatch position away from the
gold surface from the SNP duplexes P26•D14 to P26•D6 goes along with a decrease of the ET
rate constants, which correlates with an increase of the average Fc-electrode distance
γβ Y
·
B
B
D
α = 120°
60°
30°
60°
60°
θ = 60°
·
A
B
E60°
α' =120°
d(MCH)·
A
B
α' = 60°
θ
B
xmin
=Y
δ = 75°
D
γ
β
··
θ = 45°
B
E
45°
45°
135°
α =120°
Fc-PNA•DNA Fc-PNA•DNA/MCH
0 1 2 3 4 5 6 7 8 9 10 11 12 13 140
1
2
3
4
5
x / n
m
SNP strand position
AFc-PNA•DNA
0 1 2 3 4 5 6 7 8 9 10 11 12 13 140
1
2
3
4
5
x / n
m
SNP strand position
BFc-PNA•DNA/MCH

6. Electrochemical Studies
165
according to the interpretation given in 6.6.1. This result is directly predicted by the
geometric calculation demonstrated in Fig. 6-55 (black dashed line).
However, the large ET rate constant of the fully-complementary duplex, which indicates
that P26•D3 corresponds to a theoretical mismatch position zero in our model, cannot be
fully explained by this idealized model, since according to our assumptions P26•D3 should
behave like a duplex with a theoretical mismatch position >12. Therefore, the impact of the
electric field leading to assumption (ii) is considered in a more sophisticated manner.
Considering that as long as the mismatch position is located close to the gold-tethered end,
the electric field affects segment A as well as segment B. In this case, thermal motions of
segment B around the flexible mismatch position are restricted which corresponds to angles
α close to α = 180°, resulting in SNP duplexes with a structural conformation similar to that
of the fully complementary duplex P26•D3. This prediction is in good agreement with the ET
rates observed for P26•D11 – P26•D14 (positions 1 – 4), which reveal similar large ET rate
constants like P26•D3. As the mismatch position is dislocated further away from the C-
terminus (position > 4), the impact of the electric field onto segment B is declining to enable
a larger degree of freedom for segment B, corresponding to an angle α decreasing with
increasing SNP positions from α = 180° to α = 120° (angle α for maximal bending of segment
B towards segment A determined by DNA/DNA repulsion: assumption αmin = 120°). The
progression of the bending angle α with an increasing SNP position as shown in Fig. 6-56
presents assumption (iv).
Fig. 6-56. Assumption (iv) about the SNP dependency of the bending angle α
at Fc-PNA•DNA and Fc-PNA•DNA/MCH modified surfaces.
The geometric model was adapted according to this assumption, to yield the minimal
xmin and maximal xmax Fc-electrode distances as shown in Fig. 6-55 (red lines). With this, a
prediction of maximal and minimal Fc-electrode distances is obtained, which bases on
geometric restrictions with respect to the attractive DNA pulling force exerted by the electric
0 1 2 3 4 5 6 7 8 9 10 11 12 13 14
120
130
140
150
160
170
180
α/ °
SNP strand position
Fc-PNA•DNA Fc-PNA•DNA/MCH

6. Electrochemical Studies
166
field. The determined ET rate constants of all SNP duplexes P26•(D1, D3 – D14) are in good
agreement with the maximal Fc-electrode distances xmax calculated according to our
assumptions (Fig. 6-55.A). The decrease in ET rate constants from duplexes P26•D10 to
P26•D6 with SNP position 5 to 10 corresponds to an increase of the average Fc-electrode
distance as predicted by the model, whereby P26•D7 presents the maximum (SNP position
9) of the theoretical xmax curve, which is in good agreement with the experimentally
determined k0 minimum at SNP position 10 for the P26•D6 interface. The optimized model
thereby also predicts the large rate constant of the fully-complementary duplex P26•D3
correctly (≈ minima of xmax curve at positions < 1 or larger > 12) and independent on
considering P26•D3 with segment A or segment B being equal to zero. As main reason for
the fact that the experimental values fit the xmax curve and not a theoretically calculated
average Fc-electrode distance, the Fc-electrode repelling effect is considered which is not
considered in the optimized model. The optimized model predicts the maximal or minimal
possible Fc-electrode distances according to our assumptions, whereas the experimental
values indicate the favored Fc-electrode distances out of the possible spectrum. Small Fc-
electrode distances are evidently disfavored over large distance (xmax curve), wherefore the
repulsive interaction the electric field is exerting onto the positively charged oxidized state
of the ferrocene moiety Fc+ is considered as main reason.
Fig. 6-55.B reveals the analogous calculations for the theoretical Fc-electrode distances
xmin and xmax for the Fc-PNA•DNA/MCH modified surfaces. The simple model thereby
assumes a larger tilt angle θ = 65°, which attributes to a stronger pulling effect of the electric
field due to its shift of about the thickness of the MCH layer thickness. This assumption is
coherent with the considerations in section 6.6.2 as well as the ET rate constants determined
at the P26•(D1, D4 – D14)/MCH interfaces, which are generally larger than the ET rate
constants of the pure P26•(D1, D4 – D14) modified surfaces. The optimized calculations of
xmin and xmax analogously incorporate a decrease of the bending angle α from α = 180° to
120° with an increasing SNP position. Thereby it is supposed that the decrease of α occurs
more rapid at the Fc-PNA•DNA/MCH surfaces than at the pure Fc-PNA•DNA surfaces,
because the further reaching electric field enhances besides the attractive pulling effect also
the Fc+–electrode repulsion. With this, the Fc+–electrode repulsion is counteracting the
strand pulling effect already at lower SNP positions. The corresponding xmax curve of this
optimized model (Fig. 6-55.B) predicts the general course of the ET rates constants of the
P26•(D1, D4 – D14)/MCH surfaces including the two main differences between the Fc-
PNA•DNA/MCH and the Fc-PNA•DNA surfaces. It predicts for the Fc-PNA•DNA/MCH interface
a maximal Fc-electrode distance for a duplex with a point mutation being located at position

6. Electrochemical Studies
167
7, whereas at the Fc-PNA•DNA interface this maximal Fc-electrode distance is predicted for a
point mutation located at strand position 9. This is coherent with the experimentally
determined k0 values, since at the Fc-PNA•DNA/MCH interface the minimal k
0 value (≙
maximal Fc-electrode distance) is determined for the P26•D9/MCH interface with the point
mutation being located at strand position 6 (prediction: 7), whereas at the Fc-PNA•DNA
interface the k0 minimum is reached for the P26•D6 interface, where the point mutation is
located at the larger strand position 10 (prediction: 9). Secondly, the difference between the
smallest and the largest ET rate constants is 1.5 times larger at the Fc-PNA•DNA/MCH
surface than at the Fc-PNA•DNA surface, which is also coherent with the predictions of the
model (Fig. 6-55). Based on the developed model, the following molecular model (Fig. 6-57)
for SNP Fc-PNA•DNA/(MCH) interfaces is proposed, which demonstrates the electric forces
determining the preferred Fc-electrode distances of SNP Fc-PNA•DNA duplexes under the
discussed geometric restrictions.
Fig. 6-57. Proposed nanoscopic model of the strand dynamics at
A) SNP Fc-PNA•DNA and B) SNP Fc-PNA•DNA/MCH interfaces.
The consent between the theoretical calculations and the experimental ET rate
constants k0 validates the assumptions (i) – (iv) about the geometric restrictions and acting
electric forces, and furthermore gives a proof for the correlation between the average Fc-
electrode distance x and the determined ET rate constants.
6.7.1.3 Conclusion
The FSCV analysis of the mechanical bending based ET at loosely packed Fc-PNA(•DNA)
with internal single mismatches at varying strand positions revealed that a single point
mutation can be theoretically treated as a flexible hinge between two rigid, double helical
segments. The interaction with the electric field at biased surfaces determines a strong
position dependency of the kinetics of the ET process. Thereby, the introduction of a
mismatch position was found to generally decelerate the ET process of the tethered Fc-
F1
F2B
A
S S S
OH
S
OH
S
OH
S
OH
S
OH
S
OH
S
OH
S
OH
S
OH
S
OH
S
OH
S
OH
S
OH
S
OH
S
OH
S
OH
S
OH
S
OH
S
OH
S
OH
S
OH
S
OH
θ2
F1
F2
α
B
A
α
θ1
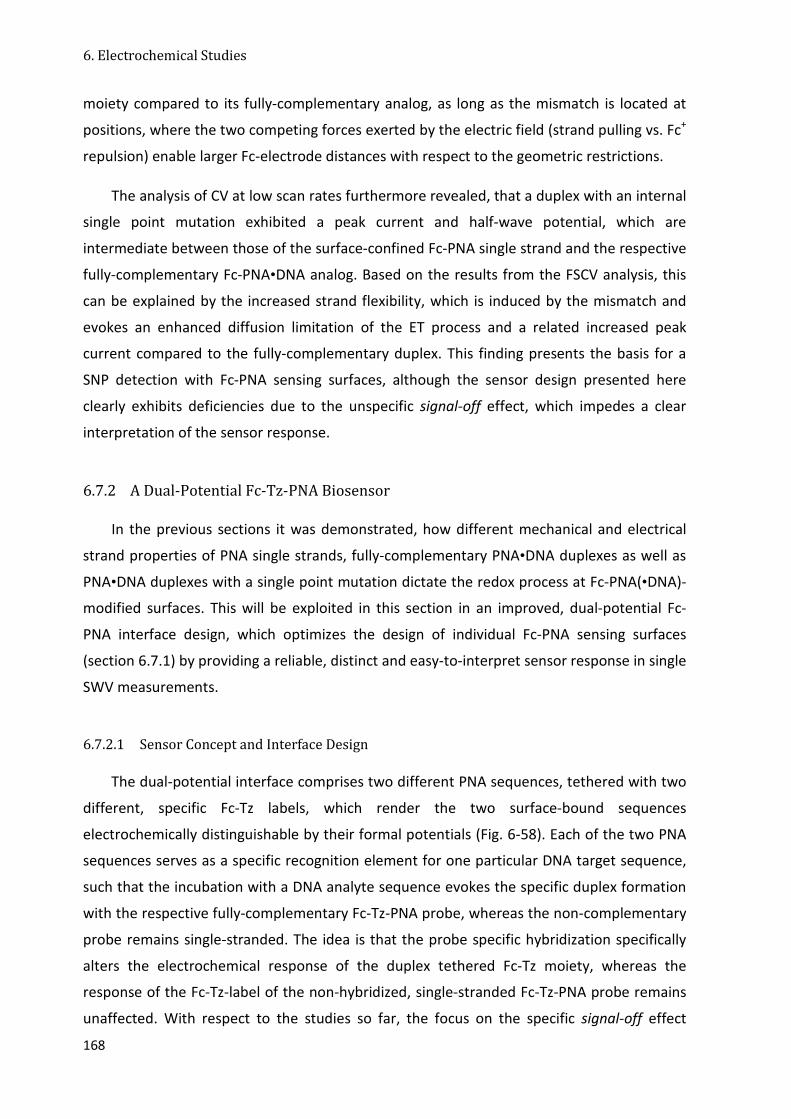
6. Electrochemical Studies
168
moiety compared to its fully-complementary analog, as long as the mismatch is located at
positions, where the two competing forces exerted by the electric field (strand pulling vs. Fc+
repulsion) enable larger Fc-electrode distances with respect to the geometric restrictions.
The analysis of CV at low scan rates furthermore revealed, that a duplex with an internal
single point mutation exhibited a peak current and half-wave potential, which are
intermediate between those of the surface-confined Fc-PNA single strand and the respective
fully-complementary Fc-PNA•DNA analog. Based on the results from the FSCV analysis, this
can be explained by the increased strand flexibility, which is induced by the mismatch and
evokes an enhanced diffusion limitation of the ET process and a related increased peak
current compared to the fully-complementary duplex. This finding presents the basis for a
SNP detection with Fc-PNA sensing surfaces, although the sensor design presented here
clearly exhibits deficiencies due to the unspecific signal-off effect, which impedes a clear
interpretation of the sensor response.
6.7.2 A Dual-Potential Fc-Tz-PNA Biosensor
In the previous sections it was demonstrated, how different mechanical and electrical
strand properties of PNA single strands, fully-complementary PNA•DNA duplexes as well as
PNA•DNA duplexes with a single point mutation dictate the redox process at Fc-PNA(•DNA)-
modified surfaces. This will be exploited in this section in an improved, dual-potential Fc-
PNA interface design, which optimizes the design of individual Fc-PNA sensing surfaces
(section 6.7.1) by providing a reliable, distinct and easy-to-interpret sensor response in single
SWV measurements.
6.7.2.1 Sensor Concept and Interface Design
The dual-potential interface comprises two different PNA sequences, tethered with two
different, specific Fc-Tz labels, which render the two surface-bound sequences
electrochemically distinguishable by their formal potentials (Fig. 6-58). Each of the two PNA
sequences serves as a specific recognition element for one particular DNA target sequence,
such that the incubation with a DNA analyte sequence evokes the specific duplex formation
with the respective fully-complementary Fc-Tz-PNA probe, whereas the non-complementary
probe remains single-stranded. The idea is that the probe specific hybridization specifically
alters the electrochemical response of the duplex tethered Fc-Tz moiety, whereas the
response of the Fc-Tz-label of the non-hybridized, single-stranded Fc-Tz-PNA probe remains
unaffected. With respect to the studies so far, the focus on the specific signal-off effect
6. Electrochemical Studies
169
thereby seems to be most promising for an analysis with single SWV or CV measurements.
This sensor concept is supposed to overcome the difficulties of the individual Fc-PNA sensing
surfaces by providing the second Fc-Tz-PNA capture probe as an internal reference for all
electrochemically detectable events.
The dual-potential Fc-Tz-PNA sensing surface was designed with respect to the
interfacial studies presented in section 6.5 following the aim to yield a maximal specific
signal-off effect with a good discrimination between a single-stranded species, a fully-
complementary duplex as well as a single mismatch duplex. Based on the studies in section
6.5.6 the choice was on the use of microelectrodes and a low Fc-Tz-PNA surface coverage,
since these aspects were found to favor the specific over the unspecific signal-off effect.
Furthermore, a MCH co-adsorbate layer was chosen in order to decrease the capacitive
current and efficiently avoid the formation of unspecific adsorption.
6.7.2.2 Choice of Capture Probes and Target DNA
As the two capture probes for the dual-potential sensing surface, the triazole-containing
Fc-Tz-PNA conjugates P32 and P34 with the half-wave potentials E1/2(P32) = 310 mV and
E1/2(P34) = 450 mV vs. Ag/AgCl, determined at the respective individually modified
interfaces (section 6.5.7), were chosen. These conjugates qualified for the construction of
the dual-potential sensing surface due to the significant difference in their half-wave
potentials of ΔE1/2 = 140 mV, their excellent electrochemical reversibility and stability
(section 3.5) as well as the structurally analog triazole bridged Fc moieties.
The PNA sequences of P32-Pseu and P34-E.coli differ by an internal base pair triplet, to
render the DNA target sequence, which is fully-complementary to the one capture probe,
non-complementary to the respective other capture probe (fully-complementary: P32•D2
and P34•D1; non-complementary: P32/D1 and P34/D2; see section 5). With a detection of
the target sequences D1-E.coli or D2-Pseu, the general functional principal of the dual-
potential sensing surface will be studied. The electrochemical response upon hybridization
with a third target sequence D3-Salm, which is non-complementary to P32 and reveals a
thermodynamically stable internal SNP to P34, will be studied in order to determine the
mismatch sensitivity of the dual-potential sensor response.

6. Electrochemical Studies
170
6.7.2.3 Primary Response: The Dual-Potential Sensing Interface
The dual-potential biosensor interface P32+P34/MCH was constructed by the
simultaneous adsorption of an equimolar ratio of the single-stranded Fc-Tz-PNA capture
probes P32 and P34 analog to the conditions B described in Tab. 6-4 (cP32+P34 = 20 µM, T =
r. t., t = 16 h) at freshly prepared gold microelectrodes (Ø = 0.1 mm, ρ = 1.5 - 2), to yield low
surface concentrations of ΓP32+P34 = 21.9 ± 2.7 pmol/cm2 and corresponding large footprints
of 25.8 ± 3.0 nm2 per molecule. Subsequently, all remaining free adsorption sites were
blocked by the sequential adsorption of a MCH co-SAM (analogous to section 6.5.5), to yield
the ternary P32+P34/MCH interface. The modified surfaces were studied by CV and SWV.
Fig. 6-58. Preparation of the ternary P32+P34/MCH dual-potential interface.
SWV and CV measurements of the P32+P34/MCH interface show two distinguishable,
but overlapping redox signals induced by P32 and P34 (Fig. 6-59), respectively, which reveal
peak potentials of E1/2 (P32) = 328 ± 2 mV and E1/2 (P34) = 454 ± 4 mV vs. Ag/AgCl with a
difference of Δ(Ep(P32) – Ep(P34)) = 125 ± 5 mV (Fig. 6-59). The analysis of the individual
peaks was generally performed from the background subtracted SWV, which were
subsequently subjected to a deconvolution by applying a regular Gauss functions and
assuming two impulses (Gauss fit: cor. R2 > 0.99958, χ2 < 5.58 x 10⁻²¹). The determined peak
potentials and potential differences are comparable to those determined at the surfaces,
which were individually modified with P32/MCH or P34/MCH, respectively (section 6.5.7),
with a slightly smaller potential difference (∆∆E = 8 mV). The equimolar P32/P34 ratio of the
immobilization solution was thereby not strictly correlated to the resulting ratio of the
capture probes surface concentrations Γ(P32)/Γ(P34), which was actually ranging from
1/0.66 to 1/1.30. Since no general preference for the adsorption of either P32 or P34 was
observed, the deviation from the 1:1 ratio of the immobilization solution is ascribed to
kinetic instabilities during the adsorption process.
Fe N
N N
O
SH
P32
N
N N
O
NH
O
Fe
SH
P34
OHHS
S S
Fe Fee- e-
P32+P34
S
OH
S
OH
S
OH
S
OH
S
OH
S
OH
S
OH
S
OH
S
OH
S
OH
S
OH
S
OH
S
OH
S
OH
S S
OH
S
OH
S
OH
S
OH
SS
OH
Fe Fee-
S
OH
S
OH
e-
P32+P34/MCH
MCH

6. Electrochemical Studies
171
Fig. 6-59. A) CV and B) SWV of the P32+P34/MCH interface.
In order to examine the necessity for the use of capture probes with structurally
comparable Fc-Tz labels, a second dual-potential interface was prepared, which uses P32
and the Fc-PNA conjugate P26 instead of the Fc-Tz-PNA conjugate P34 as the capture
probes. P26 obtains a similar same half-wave potential like P34, since both conjugates
obtain amide-bound Fc moieties (see section 6.5.7), but does not reveal a triazole-linked Fc
moiety. The P32+P26/MCH surface resulted from the simultaneous of an equimolar ratio of
P32 and P26 and sequential co-adsorption of MCH. In contrast to the P32+P34/MCH
interface, the P32+P26/MCH revealed a strong preference for the ET process of P32
compared to that of P26 with ratios of Γ(P32)/Γ(P26) ranging from 1/0.27 – 1/0.36, which
could not be significantly affected by the adjustment of the molar P26/P32 ratio of the
immobilization solution. This is ascribed to the structurally different Fc labels, as the only
basic difference between P26 and P34, and will be addressed in the next section by the
analysis of the ET kinetics.
6.7.2.4 SWV Pulse Analysis of the P32+P34/MCH Interface
The ET process at the P32+P34/MCH interface was studied by the SWV pulse mode I
(compare to section 6.6.3) in a frequency range of f = 8 Hz to 1500 Hz (A = 25 mV, ∆Es =
5 mV). Fig. 6-60 shows a 3-dimensional plot of all measured, background subtracted SWV,
whereas Fig. 6-63 shows the analysis of the peak currents ip(P32) and ip(P34) within this
frequency range.
SWV pulse analysis of the individual P32/MCH or P34/MCH modified surfaces
(Fig. 6-51.A, section 6.6.3) revealed a very similar frequency dependency of the redox
processes at the two interfaces, which was explained by the structurally similar Fc-Tz-labels
of P32 and P34. Although the peak currents ip(P32) and ip(P34) determined at the
P32+P34/MCH interface show a progression with f, which is in principle comparable to that
0.0 0.1 0.2 0.3 0.4 0.5 0.6 0.7-2
-1
0
1
2
i / n
A
E / Vvs.Ag/AgCl0.0 0.1 0.2 0.3 0.4 0.5 0.6 0.7
0
2
4
6
8
10
12
14
16
18
20
i / n
A
E / Vvs.Ag/AgCl
A B

6. Electrochemical Studies
172
at the individually modified surfaces, significant differences between ip(P32) and ip(P34) are
exhibited at frequencies smaller than f = 0.5 kHz, where ip(P32) becomes larger than ip(P34).
The peak current ratio ip(P32)/ip(P34) is thereby constantly decreasing with increasing
frequencies f from ip(P32)/ip(P34) = 2.9 : 1 at f = 8 Hz to ip(P32)/ip(P34) = 1.5 : 1 at f = 1.7 kHz.
This observation can be explained by an electronic interaction between P32 and P34 at
lower frequencies, which facilitates an indirect electron transfer mechanism in which P34
reduces P32 and therefore contributes to the peak current of P32. The 3-dimensional plot
(Fig. 6-60) nicely demonstrates the frequency dependence of the electronic interaction
between P32 and P34 at the P32+P34/MCH sensor surface. Because this secondary
mechanism appears kinetically largely suppressed at higher frequencies (f > 0.5 kHz),
voltammograms at f = 1.0 kHz were used for the following biosensor studies.
Fig. 6-60. SWV (b. s.) determined at the P32+P34/MCH interface at various frequencies (f = 8 – 1500 Hz).
Regarding the second dual-potential interface P32+P26/MCH, the strong preference of
the ET of P32 compared to that of P26 can now be explained by a disfavoring of the direct ET
of P26 in favor of an indirect electron transfer mechanism, in which P26 reduces P32 and
therefore contributes to the peak current of P32. The SWV pulse analysis of the individual
binary surfaces (section 6.6.3) revealed, that the ET processes of P32 and P34 are kinetically
comparable, while the ET process of P26 was found to be decelerated compared to that of
P32 and P34 which was explained by their structurally different Fc labels (see explanation to
Fig. 6-51.A). With regard to the kinetic competition between the direct and the indirect ET
mechanism of P26 at the dual-potential surfaces, this kinetic disfavoring of the P26
compared to the P32 ET mechanism requires to result at the dual-potential interface in a
favoring of the indirect ET mechanism, which explains the observed Γ(P32)/Γ(P26) ratios.
This furthermore explains why the Γ(P32)/Γ(P26) ratio could not be significantly affected by

6. Electrochemical Studies
173
the adjustment of the molar P26/P32 ratio of the immobilization solution. In contrast, the
kinetically comparable ET processes of P32 and P34 facilitated the preparation of surfaces
with varying Γ(P32)/Γ(P34) ratios, which indicates the necessity for the use of the
structurally comparable Fc-Tz labels in order to generate an ideal dual-response of two
probes, which are electrochemically distinguishable by their potential but otherwise exhibit
fully-comparable redox processes.
6.7.2.5 DNA Detection with the Dual-Potential Sensing Interface
The detection of the target DNA sequences D1-E.coli or D2-Pseu with the dual-potential
interface was examined, by incubation of the P32+P34/MCH modified gold electrodes with a
50 µM solution of either D1 or D2 for 16 h at ambient temperature according to the scheme
shown in Fig. 6-62. According to the analysis in section 6.5.3.2, the complete hybridization of
the target DNA sequence (exclusively) to the respective fully-complementary Fc-Tz-PNA
capture probe is expected under these conditions, to result in the formation of either a
P32•D2+P34/MCH (hybridization with D2) or P32+P34•D1/MCH interface (hybridization with
D1).
SWV (f = 1.0 kHz) overlays in Fig. 6-61 reveal the influence of the hybridization with
target DNA sequences D2 (Fig. 6-61.A) or D1 (Fig. 6-61.B) onto the SWV response of the
P32+P34/MCH surface. Fig. 6-61.A shows that the hybridization with D2 at the
P32+P34/MCH results in a marked decrease in the peak current ip(P32) at E1/2 = 328 mV,
which is related to the fully-complementary Fc-Tz-PNA capture probe P32. The peak current
ip(P34) at E1/2 = 454 mV, related to the non-complementary capture probe P34, in contrast
remains nearly unaffected. This selective signal-off is exactly what is expected according to
the discussion in section 6.5.6. Moreover, an increase of the potential difference ∆(Ep(P34)-
Ep(P32)) = +8.3 mV is detected, which is related to the cathodic potential shift, which was
observed at the individually Fc-Tz-PNA modified surfaces (e. g. Fig. 6-31). The hybridization
with D1 at the P32+P34/MCH interface (Fig. 6-61.B) also reveals the expected decrease in
peak current, which is related to its fully-complementary capture probe P34, and the
expected decrease in the peak potential difference of -11.5 mV. Interestingly, a
simultaneous increase of the P32-induced signal is observed, which can be explained by an
enhancement of the secondary electron transfer mechanism due to the decrease of the
potential difference ∆Ep between P32 and P34. Tab. 6-7 summarizes the sensor response
towards hybridization with D1 or D2 with regard to the relative signal-off effect as well as
the relative decrease in the peak potential difference.

6. Electrochemical Studies
174
Fig. 6-61. SWV (b. s., f = 1.0 kHz) response of the P32+P34/MCH interface (straight line; deconvolution thereof
shown in dark grey) upon hybridization with A) DNA analyte D2, P32•D2+P34/MCH interface and B) DNA analyte D1, P32+P34•D1/MCH interface (dashed lines, deconvolution thereof shown in light grey;
* signal induced by the capture probe, which hybridizes upon incubation with target DNA).
The electrochemical response upon the hybridization with target DNA can be visualized
and analyzed easily by subtracting the SWV data of the sensing interface P32+P34/MCH
from the SWV data of the sensor surfaces P32•D2+P34/MCH or P32+P34•D1/MCH,
respectively, obtained after hybridization with target sequences D2 or D1 (Fig. 6-62).
Fig. 6-62. SWV analysis of DNA target sequences D1 and D2 with the dual-potential sensor surface
P32+P34/MCH. A) ∆i = i(P32•D2+P34/MCH)-i(P32+P34/MCH). B) ∆i = i(P32+P34•D1/MCH)-i(P32+P34/MCH).
By this mathematical operation, a hybridization-induced current decrease results in a
negative signal, whereas non-affected signals of the respective non-complementary internal
reference decrease to zero. This data presentation simplifies a complex data analysis
1
2
3
4
5
6
7i /
nA
* A
2
3
4
5
6
7
8
9
10 B
i / n
A
*
0.1 0.2 0.3 0.4 0.5 0.6 0.70
E / V vs. Ag/AgCl0.1 0.2 0.3 0.4 0.5 0.6
0
1
E / V vs. Ag/AgCl0.7
0.0 0.1 0.2 0.3 0.4 0.5 0.6 0.7 0.8
-2
-1
0
1
2
E / Vvs.Ag/AgCl
∆i/ n
A
*∆Ep
0.0 0.1 0.2 0.3 0.4 0.5 0.6 0.7 0.8-5
-4
-3
-2
-1
0
E / Vvs.Ag/AgCl
*
∆i /
nA
A
B
S
OH
S
OH
S
OH
S
OH
S
OH
S
OH
S
OH
S
OH
S
OH
S
OH
S
OH
S
OH
S
OH
S
OH
S S
OH
S
OH
S
OH
S
OH
SS
OH
Fe
S
OH
S
OH
e-
e-Fe
S
OH
S
OH
S
OH
S
OH
S
OH
S
OH
S
OH
S
OH
S
OH
S
OH
S
OH
S
OH
S
OH
S
OH
S S
OH
S
OH
S
OH
S
OH
SS
OH
S
OH
S
OH
Fe
Fe
e-
e-
P32+P34/MCH
P32•D2+P34/MCH
P32+P34•D1/MCH
D2
D1

6. Electrochemical Studies
175
consisting of background subtraction and signal deconvolution, to readily provide a clear-cut
electrochemical response about the hybridization event.
SNP detection was examined by incubation of the P32+P34/MCH sensor interface with
target DNA D3, which exhibits a thermodynamically stable internal mismatch with P34 and is
non-complementary to P32. Tab. 6-7 shows that D3 induces changes in peak current and
potential difference with the same tendency like its fully-complementary analog D2,
although both effects are developed to a significantly smaller extent. This response can be
explained by the impaired signal-off effect upon hybridization with a SNP target DNA, as was
analyzed in the previous section.
Tab. 6-7. SWV analysis of the P32+P34/MCH interface upon incubation with DNA analyte D1, D2 or D3.
A) ∆ip (P32), ∆ip (P34): peak current difference of P32 or P34 before and after incubation with DNA; ∆∆ip = ∆ip
(P32)- ∆ip (P34). B) ∆Ep = Ep (P34)- Ep (P32); ∆∆Ep: difference in ∆Ep before and after incubation with DNA.
6.7.2.6 SWV Pulse Analysis of the P32•D2+P34/MCH and P32+P34•D1/MCH Interfaces
The ET processes at the P32•D2+P34/MCH and P32+P34•D2/MCH interfaces, resulting
from selective hybridization at the P32+P34/MCH sensing interface with D1 or D2 (see
Fig. 6-62), respectively, were studied by the SWV pulse mode I in a frequency range of f =
8 Hz to 1500 Hz (A = 25 mV, ∆Es = 5 mV). Fig. 6-63 shows the analysis of the peak currents
ip(P32) and ip(P34) within this frequency range at the P32•D2+P34/MCH and
P32+P34•D2/MCH interfaces in comparison to those peak currents determined at the single-
stranded, dual-potential P32+P34/MCH sensing interface (see Fig. 6-60).
Fig. 6-63.A shows the analysis of the hybridization of the P32+P34/MCH interface with
target DNA D2. Remarkably, the frequency dependency of the P32-induced peak current
ip(P32) (black spots) exhibits nearly the same response upon hybridization with the fully-
complementary DNA analyte D2, like it does at the individually P32/MCH-modified interface
upon D2 hybridization (Fig. 6-51.B, see explanation therein). In contrast, the frequency of
the peak current ip(P34) of the non-hybridized capture probe P34 is just slightly affected by
the incubation with D2 at f < 0.5 kHz, to also exhibit smaller ip(P34) values in this frequency
region like before incubation with D2. This is ascribed to an unspecific signal-off effect,
∆∆ip / %
A D2 G A G T A C G GT A G AD1 G A G TC T C GT A G AD3 G A G TC T T GT A G A
∆∆Ep / mV
B
Changes in peak current differences ∆ip Changes in peak potential differences∆EpTarget DNA (5’→3’)
-60 -40 -30 -20 -10 0 10 20-50 30 -10 -5 0 5 10-15 15

6. Electrochemical Studies
176
which is suggested to be induced by the rigid, neighboring P32•D2 double strands and
provokes a straightening up of the P34 single strands to result in the detected decay of
ip(P34). Fig. 6-63.B demonstrates the analogous analysis of the incubation of the
P32+P34/MCH interface with target DNA D1. It is revealed, that the frequency dependency
of the P34-induced peak current ip(P34) (red spots) alters upon hybridization with the fully-
complementary DNA analyte D1 with the same tendency like ip(P32) did at the
P32•D2+P34/MCH interface (Fig. 6-63.A), however the changes are exhibited to a smaller
extent, which is ascribed to the loss of ip(P34•D1) in favor of the indirect electron transfer
mechanism. The secondary ET mechanism is furthermore made responsible to the
enlargement of the peak current ip(P32) of the single-stranded capture probe P32 over the
whole range of frequencies.
Fig. 6-63. Dependency of the SWV peak current ip on the SWV frequency f determined at the P32+P34/MCH
interface before and after hybridization with A) D2 or B) D1.
With this it is demonstrated, how the different strand properties of Fc-Tz-PNA single
strands and Fc-PNA•DNA duplexes specifically affect the ET kinetics of the tethered Fc
moieties in a mixed monolayer of the two species, to give a characteristic SWV frequency
profile. The dual-potential design thereby reveals significant benefits over a kinetic analysis
of the individually Fc(-Tz)-PNA modified surfaces, since it facilitates direct and reliable
conclusions about the strand properties, whereas a misinterpretation of the electrochemical
response due to secondary effects (see unspecific signal-off effect) are inherently excluded.
6.7.2.7 Sensor Incubation with Bacterial RNA
With respect to the background of this thesis, to prepare a Fc-PNA based biosensor for
the final differentiation of bacterial stems (section 4.1), the developed dual-potential sensing
interface P32+P34/MCH was tested with regard to its ability to analyze biological material
and identify bacterial stems. Capture probe P32 targets a unique sequence in the 16S rRNA
0.00 0.25 0.50 0.75 1.00 1.25 1.500
2
4
6
8
10
12
14
i p /
nA
f / kHz0.00 0.25 0.50 0.75 1.00 1.25 1.50
0
5
10
15
20
i p /
nA
f / kHz
P32+P34/MCHP32•D2+P34/MCHP32 responseP34 response
P32+P34/MCHP32+P34•D1/MCHP32 responseP34 response
A B

6. Electrochemical Studies
177
of P. aeruginosa (or P. putida) (R2), which equals the target sequence D2, while P34 targets a
sequence in the analog RNA region of E. coli (R1), which equals target DNA D1. Hence, the
differentiation and identification of those two bacterial stems with the P32+P34/MCH sensor
interface was examined in an exploratory experiment. Instead of the pathogen species P.
aeruginosa, the non-pathogen Pseudomonas species P. putida was analyzed in this
experiment, which is fully sequence-analog in the target region.
For this experiment, the whole procedure of immobilization of P32 and P34, MCH co-
adsorption and finally hybridization with the bacterial 16S rRNA was performed in analogy to
the previously described experiments. However, due to the high sensitivity of RNA towards
widely present RNAses, the whole procedure required to be performed RNAses-free by using
sterile equipment, autoclaved buffer solutions, RNAses-free MilliporeTM water as well as
hand gloves. Subsequent to the preparation of the P32+P34/MCH sensor interface, the
hybridization with the isolated 16S rRNA of E. coli (1.8 µg/µL in PBS, pH 7.4) R1 as well as the
hybridization with total RNA (32S, 16S and 5S rRNA) of P. putida (1.5 µg/µL in PBS, pH 7.4) R2
was performed. Fig. 6-64 demonstrates the SWV overlay (f = 1.0 kHz) of the respective dual-
potential interfaces.
Fig. 6-64. SWV (b. s., f = 1.0 kHz) of the P32+P34/MCH interface (straight line; deconvolution thereof shown in dark grey) upon hybridization with A. RNA analyte R2 (total RNA of P. putida (1.5 µg/µL)), P32•R2+P34/MCH
and B. RNA analyte R1 (16S rRNA of E. coli), P32 +P34•R1/MCH (dashed lines, deconvolution thereof shown in light grey; * signal induced by the capture probe, which hybridizes upon incubation with target 16S rRNA).
It is revealed, that the clear and specific response, which was obtained upon
hybridization with the 12-mer DNA analogs D1 and D2 at the P32+P34/MCH interface
(Fig. 6-61) is not obtained upon incubation with bacterial RNA. Instead, the P32 and P34
redox processes reveal a slight shift of Ep(P32) and Ep(P34) to larger potentials, as well as a
slight decay of the peak currents ip(P32) and ip(P34) at both interfaces. Both effects indicate
an impediment of the ET process upon incubation and a related unspecific signal-off effect,
presumably due to the unspecific interaction of the bulky RNA (~ 1500 nt) with the sensing
0.1 0.2 0.3 0.4 0.5 0.6 0.70123456789
1011
i/ n
A
E / Vvs.Ag/AgCl0.1 0.2 0.3 0.4 0.5 0.6 0.7
0
1
2
3
4
5
6
7
8
i / n
A
E / Vvs.Ag/AgCl
A B
*
*

6. Electrochemical Studies
178
surface, evoking a straightening up of the Fc-Tz-PNA single strands. However, the SWV
measurements indicate, that the sensing surface is not harmed by incubation with the
biological material and furthermore no interfering signals due to additional cell ingredients
or salts were detected. The numerical analysis of the relative off-sensing effect and the
relative peak current decrease at the both surfaces (Tab. 6-8) interestingly reveals the same
tendency like that observed upon hybridization with the 12-mer DNA analogs shown in
Tab. 6-7, however exhibited to a significantly smaller extent. Although this effect is much too
small to reveal any significance for a detection of the bacterial sequences it anyhow
demonstrates the quality of this sensing surface, since the fact that this slight response could
be analyzed in spite of the present unspecific signal-off effect is clearly ascribed to the dual-
potential design. Hence, this result is considered to be promising enough to pursue an
optimization of this sensor concept towards a recognition of biological material in the future.
Tab. 6-8. SWV analysis of the incubation of the P32+P34/MCH interface with bacterial RNA analyte R1 and R2.
A. ∆ip (P32), ∆ip (P34): peak current difference of P32 or P34 before and after incubation with DNA; ∆∆ip = ∆ip
(P32)- ∆ip (P34). B. ∆Ep = Ep (P34)- Ep (P32); ∆∆Ep: difference in before and after incubation with RNA.
6.7.2.8 Conclusion
Within this section, a new Fc-PNA interface design for the reliable analysis of DNA with
single SWV measurements was presented. Thereby, the interaction of one DNA analyte
sequence with two different, electrochemically distinguishable PNA probes is simultaneously
studied at one and the same sensor interface, hence providing two independent sequence
information on the DNA analyte, which are derived from two independent PNA-DNA
interactions. DNA target sequences, which were fully-complementary to either capture
probe P32 or P34 and non-complementary to the respective other probe could be readily
identified based on selective and clear changes in peak current and potential. Moreover, the
sensor interface clearly discriminates the SNP sequence D3 from its fully-complementary
analog D2 by its electrochemical signature, although both target sequences form
thermodynamically comparably stable duplexes with P34. Besides its working principle, the
main advantage of this dual-potential design over the individual Fc-PNA sensing interfaces
appears to be the maximal data comparability and integrity arising from the simultaneous
study of one DNA target strand with two Fc-Tz-PNA capture probes at one sensor surface
∆∆ip / %
A R2 ..T A) G A G T A C G GT A G A (G G..R1 ..TT) G A G TC T C GT A G A (G G..
∆∆Ep / mV
B
Changes in peak current differences ∆ip Changes in peak potential differences∆EpTarget RNA (5’→3’)
-10.5 -7.5 -6.0 -4.5 -3.0 -1.5 0 1.5-9.0 3 -4 -2 0 2 4-6 6
6. Electrochemical Studies
179
under constant and identical conditions, wherein the second capture probe acts as an
internal reference for all electrochemically detectable events. Thereby, the impact of
variations in the sensor architecture, like the Fc-Tz-PNA surface concentration or MCH
packing differences, and generally unspecific interactions on the sensor response are
excluded, which renders the detected signal-off effect a clear indicator for the probe specific
hybridization event and furthermore the determined specific ET kinetics clearly ascribable to
the strand properties. Evidently, this biosensor concept is expandable to a single-electrode
sensor with a multipotential/multiple capture probes recognition interface for a
simultaneous detection of numerous DNA analyte sequences.
6.7.3 A Chip-Based Analysis of DNA Sequences
This section deals with a third concept for DNA detection with Fc-PNA modified
surfaces, which employs densely packed Fc-PNA monolayers on chip-embedded gold
microelectrodes and exploits hybridization-induced differences in faradaic and charging
current for a qualitative CV detection of DNA analytes.
6.7.3.1 Setup
All measurements in this section were performed with a 1 cm x 1 cm chip, whereupon
16 independently accessible gold microelectrodes with a diameter of Ø = 0.01 mm were
localized in four groups of four electrodes each. With this, four different surface
modifications could be carried out per chip, with four copies each. The bare gold surfaces
were investigated with AFM, which revealed a significantly smoother gold surface structure
(ρ ~ 1) than that obtained after mechanical polishing of the homemade gold
microelectrodes (ρ = 1.5 – 2). All surface modifications were experimentally performed, by
spotting a 2 µL drop of the respective solution on every 4-electrode square and placing the
chip into a densely sealed Petri dish with a humid atmosphere.

6. Electrochemical Studies
180
Fig. 6-65. Architecture of the 4 x 4 microelectrode chip.
For all measurements of the 4 x 4 chip, a standard three-electrode electrochemical cell
was used, which comprised the 4 x 4 chip embedded micro gold electrodes (Ø = 0.01 mm) as
WE, a Ag/AgCl (in 3 M KCl) as RE and a platinum wire as CE, analogous to all other setups in
section 6. The RE was connected to the electrolyte solution via a salt bridge of KNO3/Agar, in
order to avoid contamination of the electrode with chloride ions, which can cause unwanted
signals at gold electrodes. A solution of 2.5 mM NaH2PO4 buffer (pH 7.0) containing 0.1 M
NaClO4 was chosen as the standard electrolyte for all measurements in this section. For the
measurement, a 2 µL drop of the electrolyte solution was dropped onto a group of four
microelectrodes of the chip (fixed at a plastic nail), and the CE and RE (via the salt bridge)
were immersed from above into the electrolyte solution. The position of the electrodes was
regulated with a micro adjustment device.
Fig. 6-66. Setup for the measurements at the 4 x 4 chip.
10 µm
50 µm
copper contacts
disk shapedgold microelectrode

6. Electrochemical Studies
181
6.7.3.2 Primary Response: Densely Packed Fc-PNA•DNA Monolayers
The chip-embedded gold microelectrodes (Ø = 0.01 mm, ρ ~ 1) were primarily modified
with a densely packed film of the previously formed Fc-PNA•DNA duplex P24•D1 by applying
conditions D (Tab. 6-4, c = 20 µM, t = 5 d, T = 4 °C). The long immobilization time and low
temperature were chosen in order to generate a densely packed Fc-PNA•DNA film with a
maximal degree of order, as was confirmed by the strong decrease of the charging current of
about -∆ic = 58.3 ± 1.5 upon immobilization. In contrast to the P24•D1-modification of
individual gold microelectrodes (Ø = 0.05 mm, ρ ~ 1.5 – 2) under the same conditions
(Fig. 6-23.B, red line), which did not reveal any detectable faradaic process, hereby a weak
and broad faradaic response is detected (Fig. 6-67). The large peak separation of Epa-Epc ~
200 mV indicates a very slow electron transfer process, where the significantly faster
mechanical bending based ET mechanism B) (Fig. 1-5) seems to be impeded at the here
generated high surface coverages (compare section 6.5.4).
Fig. 6-67. CV (v = 1 V/s) of a densely packed P24•D1 monolayer at a chip embedded microelectrode.
Comparison to reports of C. Achim et al., who determined for the electron transfer
through Fc-PNA•PNA strands small electron transfer rate constants of k0 = 0.09 s-1 for Fc-
(t•a)10-Cys and k0 = 0.038 s-1 for the analogous 15-mer duplex with comparable low and
broad peaks,85 makes a charge transfer through the Fc-PNA•DNA duplex as the reason for
the observed faradaic process possible, which will be discussed in the following.
Furthermore, a significantly faster ET process due to the mechanical strand bending would
result in much smaller peak separations Epa-Epc (see section 6.6). The fact that this slow ET
process is exclusively observed at the chip embedded microelectrodes is ascribed to their
increased sensitivity due to the high quality of the gold surface (ρ ~ 1 determined by AFM)
combined with the large if/ic ratio of the microelectrodes with Ø = 0.01 mm.
0.0 0.1 0.2 0.3 0.4 0.5 0.6 0.7
-0.6
-0.4
-0.2
0.0
0.2
0.4
i / n
A
E / Vvs.Ag/AgCl

6. Electrochemical Studies
182
6.7.3.3 Denaturation of Fc-PNA•DNA Monolayers – Preparation of the Sensing Surface
For an analysis of DNA target sequences, the densely packed P24•D1 layer requires to
be primarily denaturized in order to expose the highly covered Fc-ssPNA sensor surface.
Therefore, all chip embedded microelectrodes were incubated with 0.1 M PBS (pH 7.4) and
the chip was placed in a densely sealed Petri dish as a humid chamber, to thermally evoke
the duplex denaturation by heating up the chip for 10 min to T = 85 °C. Removal of the PBS
solution and thoroughly washing with MilliporeTM water at 85 °C generates the Fc-ssPNA
sensor surface.
Fig. 6-68. Thermal denaturation of a densely packed P24•D1 monolayer.
Fig. 6-69 shows CV (v = 1 V/s) before and after denaturation of the P24•D1 monolayer.
It reveals an intense increase in the charging current ic as well as in the faradaic current if
upon denaturation (Fig. 6-69). This presents a significant difference to loosely packed Fc-
PNA(•DNA) surfaces, wherein mainly changes in the faradaic current if are detected between
Fc-PNA and Fc-PNA•DNA monolayers and the charging current ic remains largely unaffected
(compare Fig. 6-21). In these studies, the changes in the faradaic response were ascribed to
the different mechanical strand properties, which dictate the faradaic response. A significant
difference between loosely and densely packed Fc-PNA(•DNA) surfaces is seen the extent of
intermolecular interactions between the adsorbed strands. Whereas these interactions are
negligible at loosely packed surfaces, theses interactions are maximized at the densely
covered interfaces. Consequently, these interactions evoke that the individual strand
characteristics (elasticity, electric charge) furthermore affect the properties of the respective
monolayer, as a further impact additional to their influence on the Fc redox process. The
detected charging current thereby reflects the permeability of the respective monolayer for
a diffusion of electrolyte ions to the gold surfaces. The significant larger charging current of
the P24 interface is related to a large ion permeability of the Fc-PNA monolayer. This is
suggested to be caused by a disordered state of the monolayer, induced by the random
strand conformations of the highly flexible PNA single strands, and furthermore the absence
SS SSSS SS SSS
Fe
S
Fe
S
Fe
SS
Fe
85 °C
e-
P24/Au
+
_+_
+
_
+_+
_
+_
+_
+
_+
_
+
_
_ _
+ _
P24•D1/Au
+_ +_ +_ +_ +_
SS SS SS S S
SSSS
e-
+_ +_ +_ +_ +_
FeFeFeFeFe
Fe

6. Electrochemical Studies
183
of electrostatic repulsion, which facilitates the approach of electrolyte anions to the
positively charged gold surface. In contrast, the low charging current of the P24•D1 interface
is explained by the formation of a well-ordered monolayer of rigid PNA•DNA duplexes, which
effectively impedes the ion permeability. The electrostatic repulsion, which the negative
electric field of the Fc-PNA•DNA monolayer exerts onto the electrolyte anions moreover
decreases the ion permeability. This basic concept is comparable to that employed by
Umezawa et al. in their ion-channel DNA sensor, as demonstrated in Fig. 1-16 (section
1.2.5).200, 201
Fig. 6-69. CV (v = 1 V/s) of a gold microelectrode before and after denaturation
of the densely packed P24•D1 layer.
The faradaic ET process of the strand tethered Fc moiety is thereby dictated by the
strand characteristic, analogous to the effects at the loosely packed surfaces. However, at
the densely packed surfaces furthermore the respective monolayer permeability also
determines the electrode approach of the Fc head group and secondly the high extent of
strand interactions impedes the diffusion motion of the tethered Fc moiety (compare to the
time-resolved analysis of the immobilization process, section 6.5.2.2). The ET process, which
thereby becomes distance as well as diffusion limited, exhibits also at the single-stranded Fc-
PNA surface with a peak separation of Epa-Epc ~ 150 mV (v = 1 V/s) to be significantly slower
than at the loosely packed Fc-ssPNA surfaces, however it reveals to be, as expected, faster
than the ET at the densely packed Fc-PNA•DNA duplex interface (Epa-Epc ~ 200 mV).
6.7.3.4 DNA Analysis with a Densely Packed Fc-PNA Monolayer
In order to examine the DNA detection capability of densely covered, single-stranded Fc-
PNA modified surfaces, the P24 modified surface, obtained according to Fig. 6-68, was
incubated with fully-complementary DNA D1 as well as with the SNP DNA target sequence
0.0 0.1 0.2 0.3 0.4 0.5 0.6 0.7
-6
-4
-2
0
2
4
6
i / n
A
E / Vvs.Ag/AgCl
P24•D1P24
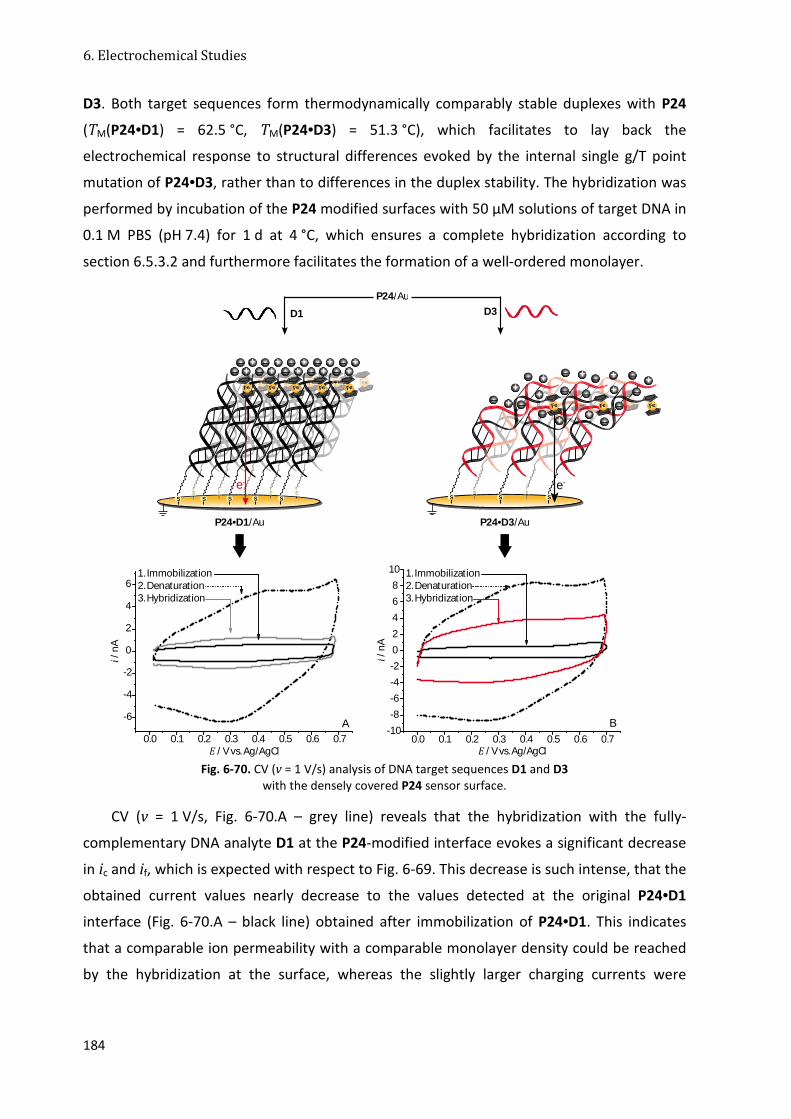
6. Electrochemical Studies
184
D3. Both target sequences form thermodynamically comparably stable duplexes with P24
(TM(P24•D1) = 62.5 °C, TM(P24•D3) = 51.3 °C), which facilitates to lay back the
electrochemical response to structural differences evoked by the internal single g/T point
mutation of P24•D3, rather than to differences in the duplex stability. The hybridization was
performed by incubation of the P24 modified surfaces with 50 µM solutions of target DNA in
0.1 M PBS (pH 7.4) for 1 d at 4 °C, which ensures a complete hybridization according to
section 6.5.3.2 and furthermore facilitates the formation of a well-ordered monolayer.
Fig. 6-70. CV (v = 1 V/s) analysis of DNA target sequences D1 and D3
with the densely covered P24 sensor surface.
CV (v = 1 V/s, Fig. 6-70.A – grey line) reveals that the hybridization with the fully-
complementary DNA analyte D1 at the P24-modified interface evokes a significant decrease
in ic and if, which is expected with respect to Fig. 6-69. This decrease is such intense, that the
obtained current values nearly decrease to the values detected at the original P24•D1
interface (Fig. 6-70.A – black line) obtained after immobilization of P24•D1. This indicates
that a comparable ion permeability with a comparable monolayer density could be reached
by the hybridization at the surface, whereas the slightly larger charging currents were
0.0 0.1 0.2 0.3 0.4 0.5 0.6 0.7
-6
-4
-2
0
2
4
6
i / n
A
E / Vvs.Ag/AgCl0.0 0.1 0.2 0.3 0.4 0.5 0.6 0.7
-10
-8
-6
-4
-2
0
2
4
6
8
10
i / n
A
E / Vvs.Ag/AgCl
A B
1. Immobilization2.Denaturation3.Hybridization
1. Immobilization2.Denaturation3.Hybridization
D1 D3P24/Au
P24•D1/Au P24•D3/Au
+_ +_ +_ +_ +_
SS SS SS S S
SSSS
e-
SSSSS SS
e-
+_ +_ +_ +_ +_
+_ +
_ +_
+
_+
_
+_ + _ +_
+
_
+_
_
_FeFeFe
FeFeFeFeFe

6. Electrochemical Studies
185
ascribed to a slightly lower degree of order of the monolayer, which is presumably due to
the shorter incubation time (1 d hybridization compared to 5 d immobilization).
In order to examine the recyclability of the P24 sensor surface, the cycle of denaturation
of the P24•D1 sensor surface (analogous to Fig. 6-68) and hybridization of the P24 surface
with D1 (analogous to Fig. 6-70.A) was performed repeatedly at a gold microelectrode (Ø =
0.05 mm, ρ ~ 1.5). CV was performed subsequent to every surface modification step, to
determine the ip and ic current response. Thereby, an intense increase of ip and ic was
detected after every denaturation step and an intense decrease of ip and ic after every step
of hybridization with D1 within four successive hybridization/denaturation cycles. This
current response is expected and coherent with the current response determined upon
denaturation of the P24•D1 sensor surface (Fig. 6-68) and that determined upon
hybridization of the P24 surface with D1, respectively. Fig. 6-71 demonstrates the faradaic
response detected over the four examined cycles. With this, the regenerability and
recyclability of the P24 sensor surface was proven, which succeeded without a detectable
loss of surface confined strands or damage in functionality, at least within the examined four
successive cycles. However, a slight increase in the charging current with a proceeding
number of cycles indicates a decrease in the quality of the sensor surface.
Fig. 6-71. Recyclability of the P24 sensor surface (ip analyzed from CV at v = 1 V/s).
Fig. 6-70.B reveals, that the hybridization of the denaturized P24 sensor surface with the
SNP DNA analyte D3 revealed significantly larger faradaic and charging currents, than
detected upon hybridization with the fully-complementary target sequence D1, but were
however still smaller than the current response determined at the single-stranded P24
surface. The larger charging current indicates a larger ion permeability of the P24•D3
compared to the P24•D1 monolayer and hence a lower strand packing density. It is
suggested that the structural deviations of the individual SNP duplexes from their fully-
complementary analogs (section 6.7.1) reflect in a decrease of the degree of order of the
densely packed monolayer, in comparison to the fully-complementary P24•D1 monolayer.
P24•D1P24
0
0.2
0.4
0.6
0.8
1
1 2 3 4cycle number
i p/i
p(P
24
-1) /
%

6. Electrochemical Studies
186
The detected increase of faradaic current of the P24•D3 compared to the P24•D1 monolayer
contradicts the assumption that an ET through the duplex (mechanism A), Fig. 1-5) causes
the faradaic reaction, since an introduced base pair mismatch is reported to cause the
depletion of the ET through the strand.57, 80, 81 With respect to the studied mechanical
bending based ET mechanism B) (Fig. 1-5) of SNP Fc-PNA•DNA duplexes (section 6.7.1), the
specific SNP duplex structural characteristics are considered to increase the faradaic current
in two manners: (i) the increase in strand elasticity promotes the diffusion motion of the
tethered Fc moiety and (ii) the decreased monolayer packing density facilitates the
electrode approaching of the Fc moiety to shorter distances than in the P24•D1 monolayer.
Fig. 6-72. Faradaic ipa and charging current ic determined from CV (v = 1 V/s) at
P24, P24•D1 and P24•D3 modified surfaces.
With the analysis of the charging current ic of the densely covered interfaces in the
described experiments, an electrochemical proof was given for the impact of different
strand characteristics onto the monolayer properties, which is independent from the
faradaic response of the tethered Fc moiety. Thereby, the general finding elucidated at the
loosely packed surfaces that the strand elasticity of the SNP duplex is intermediate between
that of the rigid duplex and the flexible single strand, could be underscored at the densely
packed layers. However, the CV analysis of the charging current presents a rather qualitative
method and the use of electrochemical impedance spectroscopy promises a more
sophisticated analysis of the interfacial characteristics of the densely packed layers.
6.7.4 Conclusion
In this section, three sensor concepts for the detection of DNA analyte sequences with
Fc(-Tz)-PNA sensing surface were presented, which exploit differences in the mechanical
bending based ET mechanisms of surface confined single stranded, double stranded and
0.0
0.2
0.4
0.6
0.8
1.0
1.2
1.4
1.6
1.8
P24•D1/Au P24•D3/Au P24/Au
i / n
A
ic ipa ic ipa ic ipa

6. Electrochemical Studies
187
mismatched Fc-PNA(•DNA) species in different manners. As the basic characteristics of Fc-
PNA sensing surfaces, a strong decay in the peak current (signal-off effect) as well as a
cathodic shift of the formal potential upon hybridization with DNA sequences form the basis
for a DNA detection at loosely covered Fc(-Tz)-PNA interfaces. The electrochemical behavior
of surface-confined Fc-PNA•DNA duplexes with an incorporated single point mutation was
found to reveal an electrochemical behavior intermediate between that of the fully-
complementary and the single stranded analogs, which presents the basis for a SNP
discrimination with Fc-PNA sensing surfaces.
The analysis of the most facile Fc-PNA sensor design (section 6.7.1) exhibited significant
deficiencies for the use as a DNA biosensor due to the unspecific signal-off effect, which
impedes a clear interpretation of the sensor response. These deficiencies could be overcome
with the construction of a dual-potential interface of two electrochemically distinguishable
Fc-Tz-PNA capture probes with different sequences. Therein, a hybridization with target DNA
could be clearly allocated to one of the two immobilized probes due to the specific redox
response of its Fc-Tz label. With the second capture probe as an internal standard for all
electrochemically detectable events, the clear identification of fully-complementary DNA
with a good discrimination of SNP was feasible, whereby the interpretation of the sensor
response was not impeded by unspecific effects. An exploratory experiment with bacterial
target RNA sequences proved the quality of this sensor concept, by revealing slight, but
similar tendencies like that observed for the synthetic DNA target sequences in a detection
of crude, bacterial RNA taken from the bacterial stems P. putida and E. coli.
In a third sensor concept the slow ET processes at densely packed Fc-PNA surface were
exploited for a DNA analysis, which was facilitated by the use of sensitive chip-embedded
microelectrodes. The DNA detection thereby was based on different permeabilities of the
dense monolayers, which were determined by the characteristics of the individual strands.
Based on the measure of differences in peak current and charging current, an analysis of the
surface tethered strands was feasible.

7. Conclusion and Outlook
188
7. Conclusion and Outlook
In this work, the development and in-depth electrochemical analysis of sensing surfaces
comprised of N-terminally ferrocenylated and C-terminally gold surface grafted PNA capture
probes was described, which was guided by the aim to combine the favorable properties of
PNA with those of an electrochemical analysis for a highly specific DNA detection with a
quick and facile read-out. Starting from the target-oriented probe synthesis and the design
of different Fc(-Tz)-PNA/Au interfaces, the detailed analysis of the electron transfer process
at Fc(-Tz)-PNA-modified gold surface revealed a clear understanding of the relation between
molecular characteristics and composition of the modified surfaces and the detected
electrochemical response, which finally facilitated the development of different sensing
concepts for an analysis of DNA sequences.
A new click chemistry based approach was examined for the N-terminal solid-phase
labeling of PNA oligomers with ferrocene derivatives (section 3). This labeling strategy
revealed to proceed with an excellent conversion and to be eligible for the synthesis of
different Fc-Tz-PNA conjugates with high yields and purities. The electrochemical analysis of
a small library of four PNA conjugates with different N-terminal Fc-Tz labels revealed clearly
distinguishable formal potentials, to render this library the electrochemical analog of the
classical 4-color labeling for a DNA sequencing. This demonstrated that the click chemistry
based labeling strategy is feasible for a tuning of the electrochemical properties of ferrocene
containing PNA oligomers.
Fig. 7-1. Click chemistry based ‘four-potential‘ ferrocene labeling of PNA.
Various Fc(-Tz)-PNA oligomers were synthesized by SPPS, HPLC purified and mass
spectrometrically characterized (section 4) for the use as capture probes at Fc(-Tz)-PNA
sensing surfaces. The chosen PNA sequences target analogous, 12-nt long regions in the 16S
t t t LysNH2
t t t LysNH2
t t t LysNH2
-0.2 -0.1 0.0 0.1 0.2 0.3 0.40
0.05
0.10
0.15
0.20
0.25
0.30
0.35
i / m
A*-
1
E / Vvs. Fc0/+
FcH0/+
O
NN
N
Fe
NN N
t t t LysNH2
O
NH
O
Fe
NN N
Fe
O
O
NN
NFe
P31 P33
P36P38

7. Conclusion and Outlook
189
rRNA of the three bacterial stems E. coli, P. aeruginosa and S. enterica, in order to provide
the molecular biological basis for a later differentiation of these bacterial stems with Fc(-Tz)-
PNA sensing surfaces. UV melting experiments of the synthesized Fc(-Tz)-PNA conjugates
with synthetic DNA sequences (section 5) revealed the formation of stable fully-
complementary duplexes with TM values ranging between 54 °C and 62 °C and furthermore
two thermodynamically stable duplexes with single mismatches, which together constitute
the basis for the DNA sensing studies. Thereby the N-terminal label was found to merely
affect the duplex stability with a determined maximal alteration of the melting temperature
of 4 °C caused by a label variation.
Fc(-Tz)-PNA(•DNA) strands were immobilized to macro-, micro- as well as chip
embedded electrodes under various conditions to yield different interfacial designs, which
were electrochemically investigated and furthermore characterized by RAIRS and ToF-SIMS
(section 6.5). The one-electron redox process of the Fc0/+ redox couple at the modified
surfaces was found to be fully reversible and the adsorbed monolayers chemically stable.
The time-resolved electrochemical analysis of all relevant modification processes facilitated
the clear correlation between the detected electrochemical response and the different
molecular adsorption processes and furthermore constitutes the basis for a target-oriented
adjustment of the surface architecture by the control of the modification conditions. Studies
of mixed monolayers of the Fc-PNA conjugate and an additional alkane thiol exhibited a
reliable co-SAM formation with the alkane thiols MCH and MUD, which evoked a reliable
surface blocking (decrease in capacitance) for an impediment of unspecific adsorption and
did not exhibit any removal of adsorbed Fc-PNA strands.
Fig. 7-2. Sequential Fc-PNA(•DNA)/MCH modification of gold surfaces.
The hybridization with DNA at Fc-PNA modified surfaces resulted in a marked decrease
in the faradaic current, which is referred to as the signal-off effect and presents the main
characteristic of a DNA detection with Fc-PNA sensing surfaces. A detailed analysis of this
effect with respect to the impact of the Fc-PNA surface concentration, the PNA strand
length, the electrode size, different co-SAMs as well as repeated measurements revealed
that besides the specific, hybridization-induced signal-off effect, an unspecific signal-off
O
SH
Fe OHHS
S
e-Fe
Fc-PNA/Au
S
OH
S
OH
S
OH
S
OH
S
OH
S
OH
S
OH
S
OH
S
OH
S
OH
S
OH
S S
OH
e-Fe
Fc-PNA/MCH
S
OH
S
OH
S
OH
S
OH
S
OH
S
OH
S
OH
S
OH
S
OH
S
OH
S
OH
S S
OH
Fc-PNA•DNA/MCH
e-Fe
Fc-PNA MCH DNA

7. Conclusion and Outlook
190
contributes to the detected current decrease, which is ascribed to the straightening up of
adsorbed PNA single strands. Small electrode diameters, a low Fc-PNA surface coverage as
well as co-SAMs of short alkane thiols were found to suppress the unspecific signal-off
effect. However, the signal-off effect revealed to be not sufficiently reliable to form the basis
for a DNA analysis with Fc-PNA sensing surfaces. The fast-scan CV analysis of the electron
transfer kinetics at Fc-PNA and Fc-PNA•DNA modified surfaces revealed significant
differences between the two interfaces, which could be attributed to differences in the
strands’ bending elasticity and electrical properties. The following nanoscopic model was
developed for the clear correlation of the determined rate constants k0 with the Fc-
electrode distance xk of maximum electron tunneling probability, which is determined by
respective strand properties. The highly flexible Fc-PNA single strands exhibited a diffusion-
limited electron transfer process, whereat the diffusion motion increases xk to yield smaller
k0 values than determined for the Fc-PNA•DNA duplex. This duplex strand reveals a less
diffusion-limited ET process with larger k0 values, which is attributed to the increased strand
rigidity and the attractive interaction between the applied positive electric field and the
negatively charged PNA•DNA strand.
Fig. 7-3. Proposed nanoscopic model of the A) Fc-PNA and B) Fc-PNA•DNA surface dynamics.
The FSCV analysis of a series of directly immobilized Fc-PNA•DNA duplexes with single
mismatches at varying strand positions revealed larger currents and smaller k0 values than
detected at surfaces of their fully-complementary analog. The deceleration of the ET process
revealed to depend on the strand position of the mismatch, whereby smaller k0 values were
detected as long as the mismatch is located at positions, where the two competing forces
exerted by the electric field (strand pulling vs. Fc+ repulsion) enable larger Fc-electrode
distances with respect to the geometric restrictions. The congruence between
experimentally determined k0 values and a developed geometric model for the strand
dynamics suggests that the mismatch can be treated as a flexible hinge in the rigid duplex
S
Fe
e-
S
Fe
e-
S
Fe
e-
Ø x
dist
ance
x
Fe
Fe
e-e-
Ø x
dist
ance
xxk
xk
S

7. Conclusion and Outlook
191
structure, which increases the diffusion-limitation of the redox process as it is demonstrated
in the molecular model shown in Fig. 7-4. The current differences were however too small to
be clearly detected with a Fc-PNA sensing surface purely based on the signal-off effect.
Fig. 7-4. Molecular model for the ET kinetics of SNP Fc-PNA(•DNA)/(MCH)-modified surfaces.
These studies present the general structural precondition for a DNA detection and single
mismatch discrimination with PNA sensing surfaces that bases on the change of structural
monolayer properties upon DNA hybridization. In this work, two different DNA sensor
concepts were presented, which employ these structural changes for a specific DNA
detection with voltammetric methods. A dual-potential sensing surface of two different,
electrochemically distinguishable Fc-Tz-PNA probes was demonstrated to reliable identify
DNA analyte sequences which were fully-complementary to one of the capture probes and
thereby discriminate analyte sequences with single mismatches. The detection based the
probe specific, relative changes in SWV peak current and peak potential upon hybridization
with DNA analytes. The second concept employs the slow ET processes at densely packed
individual Fc-PNA sensing surfaces using sensitive chip-embedded microelectrodes. The DNA
detection thereby was facilitated by changes in the permeabilities of the dense monolayers
induced by different strand properties, which enabled a DNA detection based on the
changes in CV peak and charging current.
F1
F2B
A
S S S
OH
S
OH
S
OH
S
OH
S
OH
S
OH
S
OH
S
OH
S
OH
S
OH
S
OH
S
OH
S
OH
S
OH
S
OH
S
OH
S
OH
S
OH
S
OH
S
OH
S
OH
S
OH
θ2
F1
F2
α
B
A
α
θ1

7. Conclusion and Outlook
192
Fig. 7-5. Developed concepts for DNA detection with Fc(-Tz)-PNA sensing surfaces. Upper part: Dual-potential
Fc-Tz-PNA sensing surfaces (section 6.7.2). Lower part: Densely packed Fc-PNA sensing surfaces (section 6.7.3).
The dual-potential sensor interface demonstrated significant and general advances of
an electrochemical DNA detection with Fc-PNA sensing surfaces since it facilitated the DNA
detection with a rapid, facile and easy-to-interpret electrochemical sensor read-out and
revealed a good discrimination of single mismatches as well as the compatibility with
biological samples, which is characteristic for PNA. Based on this promising starting point an
expansion of the dual-potential biosensor concept towards a single-electrode sensor with a
multipotential/multiple capture probes recognition interface for the simultaneous detection
of numerous DNA analyte sequences appears very attractive. For an optimization of
individual Fc-PNA sensing surfaces towards a more specific, sensitive and reliable detection
of DNA analytes, the use of PNA probes with a longer PNA sequence length appears
promising. Further approaches could embrace the coupling of the Fc0/+ redox process to that
of a free diffusing redox mediator, the use of redox active intercalators for an enhanced CT
through the PNA(•DNA) strand as well as the employment of multi-redox labeled PNA probes
with redox active moieties conjugated to different strand segments, which furthermore
could present interesting tools for a more advanced analysis of the PNA(•DNA) surfaces
dynamics. Besides a voltammetric DNA detection, an amperometric or electrochemical
impedance spectroscopy based DNA detection could be pursued.
SS SSSS SS SSS
Fe
S
Fe
S
Fe
SS
Fe
e-
P24/Au
+
_+_
+
_
+_+
_
+_
+_
+
_+
_
+
_
_ _
+_
Fe
P24•D1/Au
+_ +_ +_ +_ +_
SS SS SS S S
SSSS
e-
+_ +_ +_ +_ +_
FeFeFeFeFe
D1
S
OH
S
OH
S
OH
S
OH
S
OH
S
OH
S
OH
S
OH
S
OH
S
OH
S
OH
S
OH
S
OH
S
OH
S S
OH
S
OH
S
OH
S
OH
SS
OH
Fe
S
OH
S
OH
e-
e-Fe
P32•D2+P34/MCH
S
OH
S
OH
S
OH
S
OH
S
OH
S
OH
S
OH
S
OH
S
OH
S
OH
S
OH
S
OH
S
OH
S
OH
S S
OH
S
OH
S
OH
S
OH
SS
OH
Fe Fee-
S
OH
S
OH
e-
P32+P34/MCHD2

8. Experimental Section
193
8. Experimental Section
8.1 General Procedures
8.1.1 Chemicals and Solvents
All reagents and HPLC-grade solvents were purchased from Acros (Geel, Belgium),
Aldrich/Sigma/Fluka (Deisenhofen, Germany), E. Merck (Darmstadt, Germany), J.T. Baker
(Deventer, The Netherlands), Novabiochem (Laufelfingen, Switzerland) and IRIS Biotech
(Marktredwitz, Germany) and were used without further purification. The preloaded
polystyrene resins were purchased from Rapp Polymers (Tübingen, Germany). Only L-Amino
acids were used throughout. Fmoc/Bhoc protected PNA monomers were purchased from
Link Technologies (Edinburgh, Scotland) and ASM (Hannover, Germany). HPLC-purified DNA
oligonucleotides were purchased from MWG biotech (Ebersberg, Germany). All solutions
were freshly prepared before use. HPLC fractions of all products were frozen in liquid
nitrogen and lyophilized using an Edwards® Modulyo freeze dryer. The preparation and
handling of azide materials was performed at all stages on the smallest possible amounts
and with routine precautions in order to minimize the risk of possible decomposition and
explosions. Higher temperatures were avoided generally and light was excluded during all
stages of the handling of azidoferrocene. All aqueous solutions for the UV- and the
electrochemical measurements were prepared with MilliporeTM water, filtered with a
0.22 µm sterile syringe filter and degassed by purging with argon (5 min per 5 mL) before
use. All buffered solutions were prepared with high grade salts on trace metals basis with a
chloride content of less than 5 mg/kg.
8.1.2 Instrumentation and Methods
8.1.2.1 Elemental Analysis
Elemental analysis was performed in the C, H, N mode on the instrument ‘CHNSO Vario EL
1998’ provided by Elementar Analysensysteme GmbH (Hanau, Germany).
8.1.2.2 IR Spectroscopy
ATR-IR spectroscopy was performed on a diamond ATR unit at 4 cm-1 spectral resolution
using the FT-IR spectrometer ‘Tensor 27’ (Bruker, Karlsruhe, Germany). RAIRS spectroscopy
of a gold substrate confined Fc-PNA•DNA monolayer was performed on the FT-IR

8. Experimental Section
194
spectrometer ‘Excalibur FTS-3000’ (Bio-Rad Laboratories GmbH, Hemel Hempstead, UK). The
positions of the IR vibrations are indicated in wavenumbers ṽ (cm-1). The following
abbreviations are used to indicate the vibration intensity: s - strong, m - medium, w - weak.
8.1.2.3 Mass Spectrometry
MALDI-ToF mass spectra were recorded on the instrument ‘Daltonics® Autoflex’ (Bruker,
Karlsruhe, Germany) in linear mode with positive polarity using sinapic acid as the matrix
(6 mg/mL in ACN/water (+0.1 % TFA) = 2:1). ESI mass spectra were recorded on the Bruker
instrument ‘Esquire 6000’ (sputtering voltage 4 kV; nebulizer pressure 10 – 20 psi; drying
gas: 5 – 10 L/min, 300 °C; flow rate 240 µL/h).
ToF-SIMS of a gold substrate confined Fc-PNA•DNA film was recorded on the instrument
‘ION-TOF-SIMS IV’ (ION-TOF GmbH, Münster, Germany) using a 10 kV Cs+ primary ion beam.
The measurements were performed at Surface Science Western at the University of Western
Ontario (London, ON, Canada). The characteristic mass-to-charge ratios m/z of molecule,
fragment or radical ions are given in brackets, to be followed by the relative peak intensity.
8.1.2.4 NMR Spectroscopy
NMR spectra were recorded on the Bruker spectrometer ‘DRX 400’ (1H-NMR operating at
400 MHz, 13C-NMR operating at 100.6 MHz) in deuterated solvents. The chemical shifts δ
(ppm) were reported relatively to the 1H or 13C signal of the internal standard
tetramethylsilane (TMS). The calibration of the ppm scale was carried out indirectly, by
calibrating against the residual signals of the deuterated solvents (DMSO-d6: 1H – 2.49 ppm
(quintet), 13C – 39.5 ppm (septet); CDCl3: 1H – 7.26 ppm (s), 13C – 77.0 ppm (t)), which in turn
are calibrated against TMS. The coupling constants J are indicated in Hz and the multiplicities
of the signals are abbreviated as follows: s – singlet, d – doublet, t – triplet, q – quartet, dd –
doublet of doublets, “t” – pseudo triplet, m – multiplet, br - broadened.
8.1.2.5 Reactions under the Exclusion of Air and Moisture
All reactions which required the exclusion of air and moisture were carried out in glassware
equipment, which was flame-dried under vacuum and subsequently filled with inert gas.
Solids and liquids were added under a counter flow of inert gas. Exclusively dry solvents
were used, which were taken out of Sure/SealTM bottles (Aldrich, Deisenhofen, Germany)
under inert gas atmosphere or were degassed by purging with inert gas straight before use.

8. Experimental Section
195
8.1.2.6 Chromatography on Silica Gel
Thin layer chromatography (TLC) was performed on with silica gel Si60 (particle size: 0.040 -
0.063 mm) coated aluminum TLC-plates (Aldrich/Sigma/Fluka, Deisenhofen, Germany) in a
TLC chamber with equilibrium of chamber with eluent vapor. Silica gel served as stationary
phase, wherein a UV indicator was incorporated, to enable a visualization of the TLC
chromatographical profile by UV radiation. A two-component solvent mixture served as
mobile phase, as specified in each case. TLC was used for the reaction monitoring, as well as
for the detection of the chromatographical profile for column chromatography on silica gel.
Preparative column chromatography was performed on silica gel Si60 (particle size: 0.040 -
0.063 mm), which was purchased from E. Merck (Darmstadt, Germany). A two-component
solvent mixture served as mobile phase, as specified in each case. Liquid crude products
were straight subjected to column chromatography, whereas solid crude products were
incorporated into 1 g of silica gel beforehand. The received fractions were analyzed by TLC,
pure product fractions were combined and the purified product was obtained after removal
of the solvent under reduced pressure to dryness.
8.1.2.7 HPLC Purification and Analysis
HPLC analysis and purification of PNA oligomers and conjugates was performed on a
customized Varian ProStar 210 System (Varian Inc., Palo Alto, CA, USA), equipped with a PDA
detector and auto sampler, using Varian DynaStar C-18 reverse phase columns for analytical
(250 x 4 mm) and preparative (250 x 21 mm) runs. Analytical (flow rate: 1.0 mL/min) and
preparative (flow rate: 4.7 mL/min) runs were performed with a linear gradient of A
(MilliporeTM water containing 0.1 % v/v TFA) and B (acetonitrile (Baker, HPLC-grade),
containing 0.1 % v/v TFA). Analytical runs: t = 0 min 5 % B, t = 20 min 80 % B, t = 25 min 5 %
B. Preparative runs: t = 0 min 5 % B, t = 12 min 15 % B, t = 32 min 40 % B, t = 50 min 80 % B, t
= 60 min 5 % B. All samples were filtrated before injection, using a 0.22 µm syringe filter.
Spectra were recorded at 254 nm and 25 °C and the retention times (tR / min) are indicated
in each case.
8.1.2.8 Lyphilization
Solutions of PNA (crude PNA oligomers/conjugates, HPLC fractions of the purified
compounds) in ACN/water (+0.1 % TFA) were frozen in liquid nitrogen and lyophilized using
an Edwards® Modulyo freeze dryer.

8. Experimental Section
196
8.1.3 Electrochemical Equipment
8.1.3.1 Electrodes
Polycrystalline gold electrodes with a diameter of Ø = 2 mm were purchased from
CH Instruments (Austin, TX, USA). The chip with 4 x 4 embedded disk-shaped
microelectrodes (Ø = 0.01 mm) was designed and built by X. Bin at the Nanofabrication
Laboratory of the University of Western Ontario (London, ON, Canada), according to
standard construction manual and techniques. Polycrystalline gold micro-electrodes
(Ø = 0.01 mm, 0.05 mm, 0.1 mm and 0.25 mm), glassy carbon electrodes (Ø = 2 mm),
Ag/AgCl (in 3 M KCl) reference electrodes, and platinum counter electrodes were homemade
according to standard procedures (section 8.5.2).
8.1.3.2 Potentiostats
The potentiostat microAutolab III/FRA2 from Eco Chemie B.V. (Utrecht, The Netherlands),
operated by using the GPEW 4.7 software, was used for all SWV and CV measurements at
(modified) gold microelectrodes presented in sections 6.5 and 6.7.2 as well as for the
solution studies at glassy carbon electrodes presented in section 6.4.2 and 6.4.3.2. The
potentiostat PGSTAT128N from Eco Chemie B.V. (Utrecht, The Netherlands), equipped with
the ADC164 module and operated using the GPES 4.7 or the NOVA software, was used for all
FSCV measurements presented in sections 6.6 and 6.7.1 and furthermore for measurements
at gold electrodes (Ø = 2 mm) presented in section 6.5. All voltammetric measurements at
the 4 x 4 chip, performed at the University of Western Ontario (London, ON, Canada), were
recorded using the potentiostat CHI650C from CH Instruments (Austin, TX, USA) operated by
the software CHI650C electrochemical workstation version 8.10. The CV and DPV
measurements of solutions of the trimer Fc-Tz-PNA conjugates at a glassy carbon electrode
(section 6.4.3.1) were performed on a BES potentiostat from Princeton Applied Research
(Oak Ridge, TN, USA) operated by the MS DOS software M270.

8. Experimental Section
197
8.2 Synthesis of Ferrocene Derivatives and 5-Iodouracil PNA Monomer
8.2.1 5-Iodouracil PNA Monomer
5-Iodouracil PNA monomer P5 was synthesized according to the synthetic scheme presented
in Fig. 3-6.
tert-Butyl N-(2-aminoethyl)glycinate (P1)
30.79 mL (27.67 g, 460.4 mmol) of ethylenediamine were dissolved in 200 mL DCM. The
solution was cooled down to 0 °C and a solution of 7.99 mL (10.56 g, 54.2 mmol) tert-butyl
bromoacetate in 40 mL DCM was added dropwise over a period of 3-4 h under vigorous
stirring, forming a white precipitate. The solution was allowed to slowly reach ambient
temperature, and then stirred overnight. The reaction mixture was washed three times with
50 mL of water and the combined aqueous phases were subsequently back-extracted with
50 mL DCM. The combined organic phases were dried over sodium sulfate. After filtration,
the clear filtrate was directly used for the synthesis of P2 without further purification
(theoretical yield: 9.44 g (54.2 mmol)).
tert-Butyl N-[2-(N-9-fluorenylmethoxycarbonyl)aminoethyl] glycinate hydrochloride – PNA
Backbone (P2)
7.56 mL (43.3 mmol) DIPEA were added to the solution of P1 in DCM (final filtrate from first
synthetic step) under vigorous stirring. A solution of 14.61 g (43.3 mmol) Fmoc-succinimide
in 75 mL DCM was added dropwise over a period of 3 h at ambient temperature and the
resulting solution was stirred overnight. Then the solution was washed five times with 50 mL
1 N hydrochloric acid, and once with 50 mL brine. The combined aqueous phases were back-
extracted with 50 mL DCM. The combined organic phases were dried over magnesium
H2N
HN
O
O
+CH2Cl2
0°C, 3-4 h
H2NNH2Br
O
O
P1
Fmoc-ONSu
CH2Cl2
DIPEA
RT, 12 h
H2N
HN
O
O NH
HN
O
OO
O
P1 P2

8. Experimental Section
198
sulfate, filtered and the filtrate was reduced to ¼ of its volume under reduced pressure. The
product crystallized out of the clear solution at -10 °C overnight forming white crystals. After
filtration, the product was washed with 15 mL n-hexane and dried under reduced pressure
yielding 10.32 g (23.8 mmol, 55.0 %) of the HCl salt of the PNA backbone P2•HCl as a white,
amorphous powder. (Lit. P1, P2: Thomson et al.233)
P2: C23H28N2O4 (396.48 g/mol): calc. C 59.26, H 6.48, N 6.01; found C 59.59, H 6.20, N 5.62
(P2•1.90 HCl, 465.75 g/mol). 1H-NMR (400 MHz, DMSO-d6): δ [ppm] = 9.30 (br, 2H; NH), 7.88
(d, 3J = 7.5 Hz, 2H; H4Fmoc, H
5Fmoc
), 7.68 (d, 3J = 7.4 Hz, 2H; H1Fmoc, H
8Fmoc), 7.42 („t“, 3J = 7.2 Hz,
2H, H3Fmoc, H
6Fmoc), 7.32 („t“, 3
J = 7.4 Hz, 2H; H2Fmoc, H
7Fmoc), 4.32 (d, 3
J = 6.8 Hz, 2H; H10Fmoc),
4.22 (t, 3J = 6.7 Hz, 1H; H9
Fmoc), 3.85 (s, 2H; H14BB), 3.32 (t, 3
J = 5.9 Hz, 2H; H12BB), 3.00 (t, 3
J =
6.0 Hz, 2H; H13BB), 1.45 (s, 9H; C(CH3)3). 13
C-NMR (100.6 MHz, DMSO-d6): δ [ppm] = 165.56
(C15BB), 156.20 (C11
Fmoc), 143.73 (C8aFmoc, C9a
Fmoc), 140.67 (C4aFmoc, C4b
Fmoc), 127.55 (C1Fmoc,
C8Fmoc), 126.99 (C4
Fmoc, C5
Fmoc), 125.06 (C2Fmoc, C
7Fmoc), 120.05 (C3
Fmoc, C6
Fmoc), 82.97 (C(CH3)3),
65.56 (C10Fmoc), 47.20 (C14
BB), 46.61 (C9Fmoc), 46.36 (C13
BB), 36.55 (C12BB), 27.57 (C(CH3)3). ESI-
MS (pos): m/z ([%]) = 341.08 [M-C(CH3)3+2H]+ (34.1), 396.97 [M+H]+ (100.0), 792.51 [2M+H]+
(7.6). IR (ATR): ṽ [cm-1] = 3393.3 (νNH; w), 1748.5 (νC=O; m), 1716.6 (νC=O (Amid-I); s), 1526.2
(νC=C, νC=O (Amid-II); s).
1-Carboxymethyl-5-iodouracil (P3)
A solution of 8.49 g (151.4 mmol) KOH in 25 mL dest. water was heated to 40-50 °C, wherein
9.01 g (37.8 mmol) 5-iodouracil were dissolved. Subsequently, a solution of 7.89 g
(56.8 mmol) 2-bromoacetic acid was added dropwise at 40-50 °C over a period of 1 h. After
stirring overnight, the pH was adjusted to a value of pH = 5.5 with conc. hydrochloric acid.
The solution was stored at -10 °C for 2 h, whereupon the excess of 5-iodouracil crystallized.
After filtration, the pH of the filtrate was adjusted to a value of pH 2, whereupon the product
precipitated. Precipitation was completed by storage at -10 °C for 2 h. Then the product was
BrCH2COOH
KOH, H2O
50°C, 2 h; a.t., 12 h
HN
NH
O
O
I HN
N
O
O
I
OH
O
P3

8. Experimental Section
199
filtered and dried under reduced pressure to yield 6.90 g (23.3 mmol, 61.6 %) of 1-
carboxymethyl-5-iodouracil P3 as a white solid (Lit. P3: according to Withers et al.311).
P3: C6H5IN2O4 (296.02 g/mol): 1H-NMR (400 MHz, DMSO-d6): δ [ppm] = 13.24 (br, 1H; OH),
11.75 (s, 1H; NH), 8.20 (s, 1H; CH), 4.39 (s, 2H; CH2). 13C-NMR (100.6 MHz, d2O, DMSO-d6): δ
[ppm] = 170.10 (COAc), 162.07 (C4), 151.43 (C2), 151.22 (CH), 68.26 (CI), 49.65 (CαAc). ESI-MS
(neg): m/z ([%]) = 295.09 [M-H]- (100.0), 590.71 [2M-H]- (33.2), 612.88 [2M-2H+Na]- (12.2).
IR (ATR): ṽ [cm-1] = 3600-3100 (νO-H; br), 2995.1 (ν=C-H; m), 2835.2 (νCH2; m), 1682.0 (νC=C; s),
1649.8 (νC=O (Amid-I); s), 1613.1 (νC=O (Amid-II); s), 1427.2 (δC-O-H, δCH2; s), 1207.7 (νC-O; s).
tert-Butyl N-[2-(N-9-fluorenylmethoxycarbonyl)aminoethyl]-N-[(5-iodouracil-1-yl)acetyl]
glycinate (P4)
All reaction steps were carried out under the exclusion of air and moisture. 2.13 g
(4.9 mmol) of P2 were suspended in 20 mL anhydrous DCM and subsequently extracted with
saturated aq. NaHCO3 solution. The organic phase was dried over magnesium sulfate for
10 min. After filtration and removal of the solvent under reduced pressure, the HCl-free PNA
backbone P2 was obtained as a white solid. The solid was dissolved in 35 mL DMF and 4.37 g
(14.8 mmol) 5-iodouracil acetic acid P3 were added. After complete dissolution, 2.83 g
(14.8 mol) EDC•HCl were added in two portions within 30 min at ambient temperature.
Subsequently the solution was stirred overnight. Then the solvent was removed under
reduced pressure and the remaining residue was co-evaporated with 2 x 20 mL methanol.
135 mL degassed water were added to the residue under stirring. The resulting precipitate
was filtered, washed with degassed cold water and dried under reduced pressure. The crude
product was purified by flash chromatography on silica gel (DCM : MeOH = 3:1), to yield
2.41 g (3.6 mmol, 72.6 %) of P4 as a white solid (Lit. P4: adapted from Thomson et al.233).
NH
NO
O
O
OO
N
HN
O
I
O
NH
HN
O
OO
O
HN
N
O
O
I
OH
O
P3
DMF, a.t., 12 h
EDC
P4P2

8. Experimental Section
200
P4: C29H31IN4O7 (674.48 g/mol): 1H-NMR (400 MHz, DMSO-d6): δ [ppm] = 10.16 (br, 1H; NH),
8.02/7.94 (s, 1H; H6U-I), 7.87 (d, 3
J = 7.5 Hz, 2H; H4Fmoc, H
5Fmoc), 7.83 (d, 3J = 7.4 Hz, 2H; H1
Fmoc,
H8Fmoc), 7.40 („t“d, 3
J = 7.4 Hz, 4J = 1.0 Hz, 2H; H3
Fmoc, H6
Fmoc), 7.33 („t“d, 3J = 7.4 Hz, 4
J = 1.1
Hz, 2H; H2Fmoc, H7
Fmoc), 4.70/4.51 (s, 2H; HαAcmin/maj), 4.34/4.30 (d, 3
J = 6.7/6.9 Hz, 2H;
H10Fmoc
min/maj), 4.22 (t, 3J = 6.3 Hz, 1H; H9
Fmoc), 3.93 (s, 2H; H14BB), 3.37/3.31 (t, 3
J = 6.7/6.7 Hz,
2H; H12BB
min/maj), 3.25/3.11 (t, 3J = 5.6/5.9 Hz, 2H; H13
BBmin/maj), 1.45/1.38 (s, 9H; H17
BBmin/maj).
13C-NMR (100.6 MHz, DMSO-d6): δ [ppm] = 171.31/170.97 (COAc), 167.83/166.81 (C15
BB),
162.14/160.94 (C4U-I), 157.14/156.03 (C11
Fmoc), 150.54 (C2U-I), 150.37 (C6
U-I), 142.43 (C8aFmoc,
C9aFmoc), 139.27 (C4a
Fmoc, C4b
Fmoc), 128.76 (C1Fmoc, C
8Fmoc), 127.13 (C4
Fmoc, C5
Fmoc), 121.22 (C2Fmoc,
C7Fmoc), 119.86 (C3
Fmoc, C6Fmoc), 80.80/79.03 (C(CH3)3), 67.58/67.54 (C5
U-I), 65.34 (C10Fmoc),
48.64 (CαAc), 47.69 (C14BB), 46.83 (C9
Fmoc), 46.62 (C13BB), 35.63 (C12
BB), 27.55/27.49 (C(CH3)3).
ESI-MS (pos): m/z ([%]) = 697.04 [M+Na]+ (44.5), 675.05 [M+H]+ (97.9), 619.01 [M-
C(CH3)3+H]+ (100.0). IR (ATR): ṽ [cm-1] = 3344.2, 3192.0 (νNH; w), 2977.9 (ν=C-H; m), 2896.7
(νCH2; m), 1733.9 (νC=O; m), 1704.1 (νC=O; s), 1676.1 (νC=O (Amid-I); s), 1522.8 (νC=C, νC=O (Amid-
II); s).
N-[2-(N-9-Fluorenylmethoxycarbonyl) aminoethyl]-N-[(5-iodouracil-1-yl) acetyl] glycine –
5-Iodouracil PNA Monomer (P5)
2.00 g (3.0 mmol) of P4 were suspended in a mixture of 16 mL conc. acetic acid and 8 mL 4 N
hydrochloric acid and stirred for 48 h at ambient temperature, whereupon the product
precipitated as a white solid. The solvent was removed under reduced pressure and the
residue was purified by chromatography on silica gel (cyclohexane : EtOAc = 1:3), to yield
1.35 g (2.1 mmol, 69.3 %) of 5-iodouracil PNA monomer P5 as a white solid. (Lit. P3 – P5:
adapted from Kovács et al.232)
NH
N
O
OO
OO
N
HNI
O
O
NH
N
O
OHO
OO
N
HNI
O
O
4N HCl : AcOH = 1 : 2
a.t., 48 h
P4 P5

8. Experimental Section
201
P5: C25H23IN4O7 (618.38 g/mol): calc. C 45.02, H 3.69, N 8.40, found. C 45.02, H 3.88, N 8.22
(P5•1.32 HCl, 666.37 g/mol). 1H-NMR (400 MHz, DMSO-d6): δ [ppm] = 10.50 (br, 1H; NH),
7.94/7.91 (s, 1H; H6U-I
min/maj), 7.87 (d, 3J = 7.6 Hz, 2H; H4
Fmoc, H5
Fmoc), 7.83 (d, 3J = 7.4 Hz, 2H;
H1Fmoc, H
8Fmoc), 7.40 (td, 3J = 7.4 Hz, 4J = 1.2 Hz, 2H; H3
Fmoc, H6
Fmoc), 7.33 (td, 3J = 7.5 Hz, 4J = 1.2
Hz, 2H; H2Fmoc, H
7Fmoc), 4.62/4.49 (m, 2H; H10
Fmocmin/maj), 4.51/4.68 (s, 2H; HαAc
min/maj), 4.20 (m,
1H; H9Fmoc), 3.68 (s, 2H; H14
BB), 3.35 (t, 3J = 6.4 Hz, 2H; H12
BBmin/maj), 3.13/3.23 (t, 3
J = 6.0/6.4
Hz, 2H; H13BB
min/maj). 13C-NMR (100.6 MHz, DMSO-d6): δ [ppm] = 167.38 (C15
BB),
162.17/161.07 (C4U-I), 155.92 (C11
BB), 150.71 (C2U-I), 150.57(C6
U-I), 142.44 (C8aFmoc, C9a
Fmoc),
139.28 (C4aFmoc, C
4bFmoc), 128.78 (C1
Fmoc, C8
Fmoc ), 127.15 (C4Fmoc, C
5Fmoc), 121.23 (C2
Fmoc, C7
Fmoc),
119.88 (C3Fmoc, C
6Fmoc), 67.43 (C5
U-I), 65.47 (C10Fmoc), 48.47 (CαAc), 47.90 (C14
BB), 47.84 (C9Fmoc),
46.58 (C13BB), 35.65 (C12
BB). ESI-MS (neg): m/z ([%]) = 616.87 [M-H]- (100.0), 1234.60 [2M-H]-
(73.3).
1H-NMR (400 MHz) of P2 – P5:
δ [ppm] P3
d2O, DMSO-d6 P2
DMSO-d6
P4
DMSO-d6
P5 DMSO-d6
NHU-I 11.75 – 10.16 10.50
H6U-I
maj/min 8.20 – 8.02 / 7.94 7.94 / 7.91
HαAcmin/maj 4.39 – 4.70 / 4.51 4.68 / 4.51
H4Fmoc,H
5Fmoc – 7.88 7.87 7.87
H1Fmoc,H
8Fmoc – 7.68 7.83 7.83
H3Fmoc,H
6Fmoc – 7.42 7.40 7.40
H2Fmoc,H
7Fmoc – 7.32 7.33 7.33
H10Fmoc
min/maj – 4.32 4.34 / 4.30 4.62 / 4.49
H9Fmoc – 4.22 4.22 4.20
H14BB – 3.85 3.93 3.68
H12BB
min/maj – 3.32 3.37 / 3.31 3.35
H13BB
min/maj – 3.00 3.25 / 3.11 3.23 / 3.13
H17BB
min/maj – 1.45 1.45 / 1.38 –
Tab. 8-1. Comparison of 1H-NMR shifts of compounds P2 – P5.

8. Experimental Section
202
13C-NMR (100.6 MHz) of P2 – P5:
δ [ppm] P3
d2O, DMSO-d6
P2
DMSO-d6
P4
DMSO-d6
P5 DMSO-d6
COAcmin/maj
170.10 – 171.31 170.97
Intensity too low
C2U-I 151.43 – 150.54 150.71
C4U-I
min/maj 162.07 –
162.14 160.94
162.17 161.07
C5U-I
min/maj 68.26 –
67.58 67.54
67.43
C6U-I 151.22 – 150.37 150.57
CαAc 49.65 – 48.64 48.47
C1Fmoc, C
8Fmoc – 127.55 128.76 128.78
C2Fmoc, C
7Fmoc – 125.06 121.22 121.23
C3Fmoc, C
6Fmoc – 120.05 119.86 119.88
C4Fmoc, C
5Fmoc – 126.99 127.13 127.15
C8aFmoc, C
9aFmoc – 143.73 142.43 142.44
C4aFmoc, C
4bFmoc – 140.67 139.27 139.28
C11BB
min/maj – 156.20 157.14 156.03
155.92
C9Fmoc – 46.61 46.83 47.84
C10Fmoc – 65.56 65.34 65.47
C12BB – 36.55 35.63 35.65
C13BB – 46.36 46.62 46.58
C14BB – 47.20 47.69 47.90
C15BB
min/maj – 165.56 167.83 166.81
167.38
C(CH3)3min/maj – 82.97
80.80 79.03
–
C(CH3)3min/maj – 27.57
27.55 27.49
–
Tab. 8-2. Comparison of 13C-NMR shifts of compounds P2 – P5.

8. Experimental Section
203
8.2.2 Ferrocene Building Blocks
The ferrocene derivatives ferrocenecarboxylic acid, azidomethylferrocene and
carboxazidoferrocene were synthesized according to the synthetic schemes presented in
Fig. 3-3 and Fig. 3-5.
(2-Chlorobenzoyl) ferrocene (P6)
All reaction steps were carried out under the exclusion of air and moisture. A solution of
9.30 g (50.0 mmol) ferrocene and 8.75 g (50.0 mmol) 2-chlorobenzoyl chloride in DCM was
prepared. At 0 °C, 7.00 g (52.5 mmol) anhydrous aluminium chloride were added at a rate,
whereupon the temperature did not exceed 5 °C. The appearance of a deep blue color
indicated that the reaction was occurring. Then the solution was stirred for 30 min at 0 °C
and for additional 2 h at ambient temperature. Afterwards, the solution was cooled again to
0 °C, 200 mL water were added and the solution was stirred vigorously for further 30 min.
After separation of the resulting two-phase mixture, the aqueous phase was extracted three
times with 100 mL DCM and the combined organic phases were washed twice with 100 mL
aq. sodium hydroxide solution (10 %). The organic phase was dried over sodium sulfate,
filtered and the solvent was removed under reduced pressure. After drying the remaining
residue under reduced pressure, 17.18 g (52.9 mmol, quantitative conversion) of (2-
chlorobenzoyl) ferrocene P6 were obtained as a red, viscous oil. The crude product P6 was
used for the synthesis of ferrocenecarboxylic acid P7 without further purification.
P6: C17H13ClFeO (324.58 g/mol): ESI-MS (pos): m/z ([%]) = 324.17 [M+] (100.0).
Fe
O Cl
O Cl
Cl AlCl3
DCM0°C, 1 h; a.t., 2.5 h
+
P6
Fe

8. Experimental Section
204
Ferrocenecarboxylic acid (P7)
All reaction steps were carried out under the exclusion of air and moisture. A solution of
23.0 g (0.21 mol) potassium tert-butoxide in 300 mL DME was prepared and 1.1 mL water
were added under stirring. A solution of 17.18 g (52.9 mmol) of the crude (2-chlorobenzoyl)
ferrocene P6 in 40 mL DME were added to the resulting slurry. The mixture was stirred for
1 h and refluxed under argon until the color faded to tan, indicating the completion of the
reaction (1 h). After the reaction mixture was allowed to cool to ambient temperature, the
mixture was poured into 500 mL dest. water, washed three times with 100 mL diethyl ether
and the combined organic phases were back-extracted three times with 50 mL aq. sodium
hydroxide solution (10 %). The combined aqueous phases were acidified with conc.
hydrochloric acid, whereupon the product precipitated as a light brown solid. The precipitate
was filtered off and air dried, yielding 10.33 g (44.9 mmol, 84.8 %) of ferrocenecarboxylic
acid P7 as an orange brown powder. (Lit. P6, P7: Reeves et al.222)
P7: C11H10FeO2 (230.04 g/mol): calc. C 57.43, H 4.38, found C 57.08, H 3.70. 1H-NMR (400
MHz, DMSO-d6): δ [ppm] = 12.09 (br, 1H; OH), 4.69 (“t“, 3J = 1.8 Hz, 2H; H2,5), 4.42 (“t“, 3
J =
1.8 Hz, 2H; H3,4), 4.20 (s, 5H; H6-10). 13C-NMR (100.6 MHz, DMSO-d6): δ [ppm] = 172.03 (C1’),
71.83 (C1), 70.95 (C2,5), 69.83 (C3,4), 69.42 (C6-10). ESI-MS (neg): m/z ([%]) = 229.02 [M-H]-
(100.0).
Fe
O
OHH2O, t-BuOK
DME60°C, 1 h, N2
Fe
O Cl
P6 P7

8. Experimental Section
205
Ferrocenemethanol (P8)
All reaction steps were carried out under the exclusion of air and moisture. A solution of
4.00 g (17.4 mmol) ferrocenecarboxylic acid P7 in 125 mL freshly distilled diethyl ether was
refluxed at 50 °C. 17.4 mL (17.4 mmol) of a 1 M solution of lithium aluminum hydride in
diethyl ether were added dropwise to this solution. After refluxing overnight at 50 °C, the
reaction was quenched by adding sat. sodium hydrogen carbonate solution (aq.) to the
reaction mixture. Then the organic phase was separated and the aqueous phase was
extracted three times with diethyl ether. The combined organic phases were dried over
magnesium sulfate, filtered and the solvent was removed under reduced pressure. Thereby,
2.73 g (12.6 mmol, 72.7 %) of ferrocenemethanol P8 were obtained as a yellowish brown
solid.
P8: C11H12FeO (216.06 g/mol): calc. C 61.15, H 5.60, found C 60.60, H 5.34. 1H-NMR (400
MHz, DMSO-d6): δ [ppm] = 4.67 (t, 3J = 5.8 Hz, 1H; OH), 4.20 (d, 3
J = 4.7 Hz, 2H; CH2), 4.17
(“t“, J = 1.8 Hz, 2H; H2,5), 4.12 (s, 5H; H6-10), 4.08 (“t“, J = 1.8 Hz, 2H; H3,4). 13C-NMR (100.6
MHz, DMSO-d6): δ [ppm] = 88.34 (C1), 68.06 (C6-10), 67.97 (C2,5), 67.30 (C3,4), 59.07 (CH2). FAB-
MS (pos): m/z ([%]) = 217.0 [M+H]+ (14.0), 216.0 [M]+ (100.0), 199.0 [M-OH]+ (45.9). IR (ATR):
ṽ [cm-1] = 3237.5 (νOH; s), 3089.1 – 2873.2 (νCH, νCH2; m), 1470.3 – 1410.2 (νC=C; m), 1379.7
(δCH2, δOH; m), 1235.7 (νCO; s).
Fe
O
OH
P7
Fe
OHLiAlH4
Et2O50°C, 18 h
P8

8. Experimental Section
206
Azidomethylferrocene (P9)
A solution of 1.50 g (6.9 mmol) ferrocenemethanol P8 and 2.71 g (41.7 mmol) sodium azide
in 90 mL acetic acid were stirred at 50 °C for 3 h. Then DCM was added to the reaction
mixture and the organic phase was washed with 200 mL of sat. sodium hydrogen carbonate
solution (aq.) sufficiently often, until the evolution of gas was terminated. The organic phase
was dried over sodium sulfate, filtered and the solvent was removed under reduced
pressure to dryness. The resulting crude product was purified by chromatography on silica
gel (EtOAc : cyclohexane = 1:25), to yield 1.48 g (6.1 mmol, 88.5 %) of azidomethylferrocene
P9 as a highly viscous dark red oil. (Lit. P9: Santoyo-González et al.226)
P9: C11H11FeN3 (241.07 g/mol): 1H-NMR (400 MHz, CDCl3): δ [ppm] = 4.24 (“t“, 3
J = 1.8 Hz,
2H; H2,5), 4.20 (“t“, 3J = 1.8 Hz, 2H; H3,4), 4.17 (s, 5H; H6-10), 4.12 (s, 2H; CH2). 13
C-NMR (100.6
MHz, CDCl3): δ [ppm] = 82.13 (C1), 68.69 (C6-10,3,4), 68.55 (C2,5), 50.90 (CH2N3). ESI-MS (pos):
m/z ([%]) = 242.27 [M+H]+ (100.0), 241.26 [M]+ (85.2), 200.02 [M-N3+H]+ (34.3). IR (ATR):
ṽ [cm-1] = 2095.0, 2068.9 (νN3, s, db).
Carboxazidoferrocene (P10)
1.00 g (4.4 mmol) Ferrocenecarboxylic acid P7 was suspended in 0.74 mL dest. water and
sufficient acetone was added to dissolve it. At 0 °C, a solution of 697.0 µL (506.0 mg,
5.0 mmol) triethylamine in 8.25 mL acetone was added. While maintaining the temperature
at 0 °C, a solution of 607.7 mg (5.6 mmol) ethyl chloroformate in 2.25 mL acetone was
added. After stirring for 30 min at 0 °C, a solution of 435.6 mg (6.7 mmol) sodium azide in
Fe
OH
P8
Fe
N3NaN3
AcOH50°C, 3 h
P9
Fe
N3
O
NaN3
H2O, acetone0°C, 1 h
Fe
O
OH
P7 P10

8. Experimental Section
207
water was added. After stirring for 1 h at 0 °C, the mixture was poured into ice-water and
extracted three times with methylene chloride. The combined organic phases were
successively washed with a 5 % solution of sodium hydrogen carbonate (aq.) and brine and
then dried over sodium sulfate. After filtration, the solvent was removed under reduced
pressure to dryness, to yield 0.82 g (3.2 mmol, 72.8 %) of ferrocenecarboxazide P10 as a red
solid. (Lit. P10: Rapić et al.228)
P10: C11H9FeON3 (255.05 g/mol): 1H-NMR (400 MHz, CDCl3): δ [ppm] = 4.82 (“t“, 3
J = 2.0 Hz,
2H; H2,5), 4.51 (“t“, 3J = 2.0 Hz, 2H; H3,4), 4.25 (s, 5H; H6-10). 13
C-NMR (100.6 MHz, CDCl3): δ
[ppm] = 210.68 (C1’), 74.52 (C1), 72.67 (C2,5), 70.39 (C3,4), 70.25 (C6-10). ESI-MS (pos): m/z ([%])
= 241.17 [M-N]•+ (22.4), 239.18 [M-NH2-]+ (69.3). IR (ATR): ṽ [cm-1] = 2148.6, 2136.4 (νN3; s,
db), 1671.9 (νCO; s).
8.3 Solid-Phase Synthesis of PNA Oligomers and Conjugates
8.3.1 General Procedure
The solid phase synthesis of all PNA oligomers and conjugates was performed applying Fmoc
protecting group strategy according to the general coupling procedure shown in Fig. 4-4. The
PNA sequences were synthesized from the N-terminally Fmoc protected, commercially
available PNA monomer building blocks, which carried a Bhoc protecting group at the
primary amino groups of the nucleobases adenine, cytosine and guanine, as shown in
Fig. 4-2. As solid support, the low loaded TentaGel® polystyrene resins TentaGel® R PHB–
CysTrt Fmoc (0.18 mmol/g) or TentaGel® R PHB LysBoc Fmoc (0.20 mmol/g) were used, which
were preloaded with the amino acids cysteine or lysine, respectively. SPPS was in general
performed manually using polypropylene syringes (volume: 2 mL to 10 mL) as reactions
vessels, which were equipped with a polypropylene frit at the bottom (so called Batch
reactors). The resin was placed into the Batch-reactor, and all reaction- and washing steps
were performed by suctioning the respective solvent or freshly prepared solution into the
reactor, treating the resin with the solution/solvent under agitation at a mechanical shaker
(640 rpm) for the indicated time and subsequently draining off the solution/solvent.
Washing steps were carried out by treating the resin 5 times and each time for 20 s under
agitation in the indicated solvent. Reactions at higher temperatures (50 °C) were carried out
by placing the mechanical shaker into a preheated oven. All solutions were freshly prepared
before use.

8. Experimental Section
208
All PNA oligomers/conjugates described in this work were synthesized, by successively
performing steps 1 – 5 of the following synthesis procedure, whereby all instructions refer to
100 mg (≙ 18 µmol) of TentaGel® R PHB–CysTrt Fmoc resin. Thereby the prolongation of the
PNA/peptide strand was performed by repeating the coupling/deprotection cycle (steps 2.a-
2.e) for the coupling of every building block until the target sequence was completed. The
coupling of the amino acids lysine and aminohexanoic acid as well as the modified
5-iodouracil PNA monomer were incorporated in the general procedure. All further
modifications of the PNA oligomers were performed subsequent to the PNA synthesis,
according to the synthetic procedures described in the following sections.
1. Swelling of the resin
The resin was placed into the Batch reactor, washed with DMF (5 x for 20 s
respectively), and subsequently incubated with DMF for 1 h under agitation.
2. Coupling/deprotectin cycle
a. Deprotection of the N-terminus
The N-terminal Fmoc-protecting group of the resin-bound amino acid or growing
PNA/peptide strand was removed by treating the resin twice (2 min and 10 min) with
a solution of piperidine in DMF (20 %, v/v) under agitation. In between the two
deprotection steps, the resin was washed with DMF (2 x) and after the second
deprotection step, the resin was washed with DMF (5 x), DCM (5 x) and DMF (5 x).
b. Preactivation of the PNA monomer
5 equiv. (90 µmol) of the respective PNA monomer, amino acid or carboxylic acid
derivative were activated with 4.5 equiv. (81 µmol) of the activation reagent HATU or
TBTU (+HOBt) in 1 mL of a solution of 2,6-lutidine (0.3 M) and DIPEA (0.2 M) in DMF.
Coupling reagent and preactivation time vary with the respective building block and
are summarized for all used building blocks in Tab. 8-3.

8. Experimental Section
209
Building Block Reagent (5 equiv., 90 µmol)
Coupling Reagent
(4.5 equiv., 81 µmol)
Preactivation Time
Amino acids Lysine Lys(Boc)Fmoc TBTU, HOBt 2 min
ε-Amino-hexanoic aid
ε-Ahx-Fmoc TBTU, HOBt 2 min
PNA monomers
adenine Fmoc-A(Bhoc)-OH HATU 5 min
thymine Fmoc-T-OH HATU 2 min
guanine Fmoc-G(Bhoc)-OH HATU 2 min
cytosine Fmoc-C(Bhoc)-OH HATU 7 min
Carboxylic acid derivatives
ferrocene- carboxylic acid
Fc-CO2H HATU, HOBt 2 min
propynoic acid HATU 2 min
4-pentynoic acid
TBTU, HOBt 3 min
azidoacetic acid TBTU, HOBt 2 min
Tab. 8-3. Coupling conditions for all used building blocks.
c. Coupling of a monomer building block
The resin obtained from 2.a was treated with the coupling solution obtained from 2.b
under agitation at 50 °C for the coupling of a building block. The reaction time
required for complete conversion was determined by the Kaiser test (2.d) and
generally larger than 12 min. With an increasing strand length longer coupling times
(> 1 h) as well double or triple coupling were required. Subsequently, the resin was
washed with DMF (5 x).
d. Kaiser test
The completion of the coupling reaction 2.c was monitored using the Kaiser test
(color detection of free primary amino groups). Therefore, a 1:1:1 mixture of the
following solutions (one drop each) was prepared in an Eppendorf tube:
Kaiser reagent 1: 5 % (w/v) ninhydrin in ethanol
Kaiser reagent 2: 1 mM potassium cyanide in pyridine
Kaiser reagent 3: 80 % (v/v) phenol in ethanol
A few resin beads were separated from the bulk resin and poured into the prepared
Kaiser mixture, to be subsequently heated up to 110 °C for 2 min. Blue colored resin
beads prove the existence of free primary amino groups (unprotected N-terminus)
and therefore detect an uncompleted coupling reaction.

8. Experimental Section
210
e. Acetylation of free amino groups
Remaining free primary amino groups were acetylated by treating the preloaded
resin with 3 mL of a solution of acetic anhydride (5 %, v/v) and DIPEA (6 %, v/v) in
DMF for 3 min under agitation. Subsequently, the resin was washed with DMF (5 x).
3. Shrinking of the resin
The resin was shrunk by washing with methanol (5 x). Subsequently, the resin was
completely dried under reduced pressure.
4. Cleavage of the PNA oligomer/conjugate
The completed PNA oligomer/conjugate was cleaved from the solid support by
treating the shrunk and dry resin for 3 h with a solution of TFA/TIS/phenol = 85:5:10
(v/v/v). After filtration through the frit of the batch reactor and washing the resin
with DCM (3 x), the combined filtrates were concentrated under reduced pressure, to
remove TFA and excess of solvent.
5. Workup
The crude product was precipitated from the remaining residue with ice-cold diethyl
ether. After centrifugation (10 min, 8000 rpm), the excess of diethyl ether was
removed and the remaining crude product was washed three times with ice-cold
diethyl ether, which was removed after each washing step. The crude product was
finally air-dried and subsequently dissolved in ACN/water. This solution was filtrated
using a syringe filter and then lyophilized.
6. HPLC Purification
Analytical and semi-preparative HPLC runs were generally performed by applying the
solvent gradients and the setup described in section 8.1.2.7. Semi-preparative HPLC
was performed for the purification of the crude products, whereas analytical HPLC
was applied to determine the chromatographical profile of the crude product as well
as the purity of a PNA sample. The PNA samples were generally injected as a solution
of the PNA conjugate/oligomer in water (+0.1 % TFA), which was previously filtered
through a 0.22 µm sterile filter (per semi-preparative run: ~ 8 mg PNA
conjugate/oligomer in 0.5 mL water (+0.1 % TFA)).
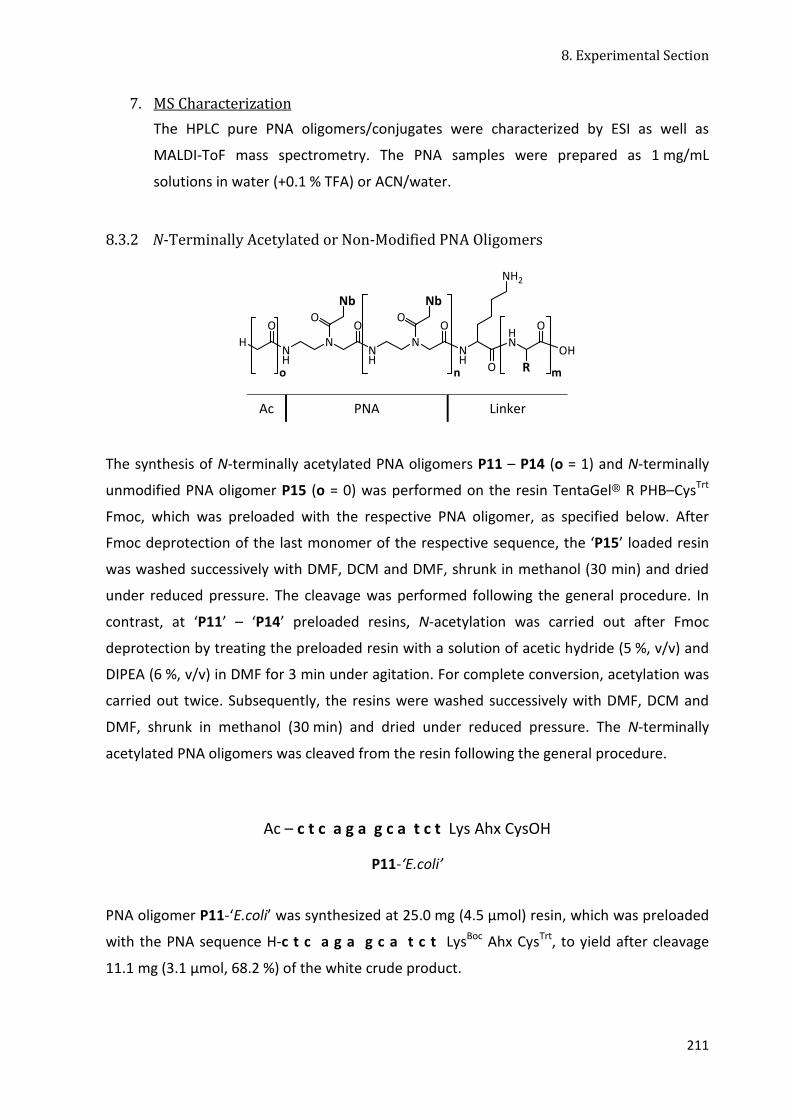
8. Experimental Section
211
7. MS Characterization
The HPLC pure PNA oligomers/conjugates were characterized by ESI as well as
MALDI-ToF mass spectrometry. The PNA samples were prepared as 1 mg/mL
solutions in water (+0.1 % TFA) or ACN/water.
8.3.2 N-Terminally Acetylated or Non-Modified PNA Oligomers
Ac PNA Linker
The synthesis of N-terminally acetylated PNA oligomers P11 – P14 (o = 1) and N-terminally
unmodified PNA oligomer P15 (o = 0) was performed on the resin TentaGel® R PHB–CysTrt
Fmoc, which was preloaded with the respective PNA oligomer, as specified below. After
Fmoc deprotection of the last monomer of the respective sequence, the ‘P15’ loaded resin
was washed successively with DMF, DCM and DMF, shrunk in methanol (30 min) and dried
under reduced pressure. The cleavage was performed following the general procedure. In
contrast, at ‘P11’ – ‘P14’ preloaded resins, N-acetylation was carried out after Fmoc
deprotection by treating the preloaded resin with a solution of acetic hydride (5 %, v/v) and
DIPEA (6 %, v/v) in DMF for 3 min under agitation. For complete conversion, acetylation was
carried out twice. Subsequently, the resins were washed successively with DMF, DCM and
DMF, shrunk in methanol (30 min) and dried under reduced pressure. The N-terminally
acetylated PNA oligomers was cleaved from the resin following the general procedure.
Ac – c t c a g a g c a t c t Lys Ahx CysOH
P11-‘E.coli’
PNA oligomer P11-‘E.coli’ was synthesized at 25.0 mg (4.5 µmol) resin, which was preloaded
with the PNA sequence H-c t c a g a g c a t c t LysBoc Ahx CysTrt, to yield after cleavage
11.1 mg (3.1 µmol, 68.2 %) of the white crude product.
NH
n
N
ONb
O
NH
O
HN
O
N
ONb
NH
O
NH2
O
OH
R m
H
o

8. Experimental Section
212
P11-‘E.coli’: C141H191N71O41S (3616.58 g/mol): MALDI-ToF MS: m/z ([%]) = 3618.4 [M+H]+
(100.0). HPLC: tR = 12.8 min.
Ac – t c t a c g a g a c t c Lys Ahx CysOH
P12-E.coli
PNA oligomer P12-E.coli was synthesized at 25.0 mg (4.5 µmol) resin, which was preloaded
with the PNA sequence H-t c t a c g a g a c t c LysBoc Ahx CysTrt, to yield after cleavage
12.1 mg (3.3 µmol, 74.3 %) of the white crude product.
P12-E.coli: C141H191N71O41S (3616.58 g/mol): MALDI-ToF MS: m/z ([%]) = 3617.3 [M+H]+
(100.0). ESI-MS: m/z ([%]) = 1206.0 [M+3H]3+ (25.5), 904.9 [M+4H]4+ (100), 724.2 [M+5H]5+
(17.3), 603.6 [M+6H]6+ (4.1). HPLC: tR = 12.6 min.
Ac – t c t a c c g t a c t c Lys Ahx CysOH
P13-Pseu
PNA oligomer P13-Pseu was synthesized at 25.0 mg (4.5 µmol) resin, which was preloaded
with the PNA sequence H-t c t a c c g t a c t c LysBoc Ahx CysTrt, to yield after cleavage
10.9 mg (3.1 µmol, 67.9 %) of the white crude product.
P13-Pseu: C144H192N66O43S (3567.55 g/mol): MALDI-ToF MS: m/z ([%]) = 3570.1 [M+H]+
(100.0). ESI-MS: m/z ([%]) = 1189.6 [M+3H]3+ (100.0), 892.6 [M+4H]4+ (77.1). HPLC: tR = 11.4
min.
Ac – t c t a c a a g a c t c Lys Ahx CysOH
P14-Salm
PNA oligomer P14-Salm was synthesized at 25.0 mg (4.5 µmol) resin, which was preloaded
with the PNA sequence H-t c t a c a a g a c t c LysBoc Ahx CysTrt, to yield after cleavage
10.9 mg (3.0 µmol, 67.3 %) of the white crude product.

8. Experimental Section
213
P14-Salm: C145H191N71O40S (3600.59 g/mol): MALDI-ToF MS: m/z ([%]) = 3603.0 [M+H]+
(100.0). ESI-MS: m/z ([%]) = 1800.7 [M+2H]2+ (11.4), 1201.0 [M+3H]3+ (84.8), 900.8 [M+4H]4+
(100), 720.8 [M+5H]5+ (8.1). HPLC: tR = 11.5 min.
H – t c t a c a a g a c t c Lys Ahx CysOH
P15-Salm
PNA oligomer P15-Salm was synthesized at 15.0 mg (2.7 µmol) resin, which was preloaded
with the PNA sequence H-t c t a c a a g a c t c LysBoc Ahx CysTrt. The N-terminus was not
acetylated and the oligomer was cleaved from the resin straight after coupling of the last
PNA monomer to yield 8.5 mg (2.4 µmol, 88.5 %) of the white crude product.
P15-Salm: C143H189N71O39S (3558.55 g/mol): ESI-MS: m/z ([%]) = 1186.7 [M+3H]3+ (25.7),
890.4 [M+4H]4+ (100), 712.6 [M+5H]5+ (33.6), 594.0 [M+6H]6+ (14.2), 509.3 [M+7H]7+ (1.7).
8.3.3 N-Terminally Azide-Functionalized PNA Oligomers
Az PNA Linker
The synthesis of the N-terminally azide functionalized PNA oligomers P16 – P18 was
performed on polystryene resins, which were preloaded with the respective, N-terminally
Fmoc deprotected PNA oligomer, as specified below. 2-Azidoacetic acid (5 equiv.) was
preactivated with TBTU and HOBt•H2O (4.5 equiv. each) in DMF, adding DIPEA (10 equiv.,
0.2 M) and 2,6-Lutidine (10 equiv., 0.3 M), for 3 min in an Eppendorf tube. Subsequently, the
preloaded polystyrene resin was treated with the solution containing the activated acid
under agitation at ambient temperature for 1 h. The resin was successively washed with
DMF, DCM and DMF, shrunk in methanol (30 min) and dried under reduced pressure.
NH
n
N
ONb
O
NH
O
HN
O
N
ONb
NH
O
NH2
O
NH2
R m
N3

8. Experimental Section
214
Az – t t t LysNH2
P16-t3
Azido-PNA oligomer P16-t3 was synthesized at 50.0 mg (10.0 µmol) of the resin TentaGel® R
RAM–LysBoc Fmoc (0.20 mmol/g), which was preloaded with the PNA sequence H-t t t LysBoc.
After splitting the resin beads in a mass ratio of 1 : 9, the cleavage was performed according
to the general procedure at 5 mg (1.0 µmol) of the azido-PNA loaded resin beads. Thereby,
0.85 mg (0.8 µmol, 82.8 %) of the crude azido-PNA oligomer P16-t3 were obtained as a white
powder.
P16-t3: C41H58N18O14 (1027.01 g/mol): ESI-MS: m/z ([%]) = 1027.3 [M+H]+ (100), 514.2
[M+2H]2+ (57). HPLC: tR = 9.6 min. IR (ATR): ṽ [cm-1] = 2109.5 (νN3; s).
Az – t c t a c c g t a c t c Lys Ahx CysOH
P17-Pseu
Azido-PNA oligomer P17-Pseu was synthesized at 50.0 mg (9.0 µmol) of the resin TentaGel®
R PHB–CysTrt Fmoc (0.18 mmol/g) which was preloaded with the N-terminally deprotected
PNA sequence H-t c t a c c g t a c t c LysBoc Ahx CysTrt. After splitting the resin beads in a
mass ratio of 1 : 9, the cleavage according to the general procedure was performed at 5 mg
(0.9 µmol) of the azido-PNA loaded resin beads. Thereby, 2.6 mg (0.72 µmol, 80.1 %) of the
crude azido-PNA oligomer P17-Pseu were obtained as a white powder.
P17-Pseu: C144H192N70O42S (3607.57 g/mol): MALDI-ToF MS: m/z ([%]) = 3609.6 [M+H]+
(100.0). ESI-MS: m/z ([%]) = 1203.9 [M+3H]3+ (16.2), 903.0 [M+4H]4+ (100).
Az – t c t a c g a g a c t c Lys Ahx CysOH
P18-E.coli
Azido-PNA oligomer P18-E.coli was synthesized at 50.0 mg (9.0 µmol) of the resin TentaGel®
R PHB–CysTrt Fmoc (0.18 mmol/g) which was preloaded with the N-terminally deprotected
PNA sequence H-t c t a c g a g a c t c LysBoc Ahx CysTrt. After splitting the resin beads in a
mass ratio of 1 : 9, the cleavage according to the general procedure was performed at 5 mg

8. Experimental Section
215
(0.9 µmol) of the azido-PNA loaded resin beads. Thereby, 2.7 mg (0.74 µmol, 82.0 %) of the
crude azido-PNA oligomer P18-E.coli were obtained as a white powder.
P18-E.coli: C145H191N75O40S (3656.61 g/mol): MALDI-ToF MS: m/z ([%]) = 3659.7 [M+H]+ (100).
8.3.4 N-Terminally Alkyne-Functionalized PNA Oligomers
HCC PNA Linker
The synthesis of the N-terminally propynoic acid functionalized PNA oligomers P19 – P20
was performed on polystryene resins, which were preloaded with the respective, N-
terminally Fmoc deprotected PNA oligomer, as specified below. Propynoic acid (5 equiv.)
was preactivated with HATU (4.5 equiv.) in DMF for 3 min in an Eppendorf tube, by adding
DIPEA (10 equiv., 0.2 M) and 2,6-Lutidine (10 equiv., 0.3 M). Subsequently, the preloaded
polystyrene resin was treated with the solution containing the activated acid under agitation
at 50 °C for 30 min. For complete conversion (monitoring by the Kaiser test), the coupling of
propynoic acid needed to be repeated three times. Afterwards, the brownish resin was
successively washed with DMF, DCM and DMF, shrunk in methanol (30 min) and dried under
reduced pressure.
HCC – t t t LysNH2
P19-t3
The propynoic acid labeled PNA oligomer P19-t3 was synthesized at 50.0 mg (10.0 µmol) of
the resin TentaGel® R RAM–LysBoc Fmoc (0.20 mmol/g), which was preloaded with the PNA
sequence H-t t t LysBoc. After splitting the resin beads in a mass ratio of 1 : 9, the cleavage
was performed according to the general procedure at 5 mg (1.0 µmol) of the propynoic acid
labeled PNA loaded resin beads. Thereby, 0.86 mg (0.9 µmol, 86.4 %) of the crude propynoic
acid labeled PNA oligomer P19-t3 were obtained as a white powder.
NH
n
N
ONb
O
NH
O
HN
O
N
ONb
NH
O
NH2
O
NH2
R m
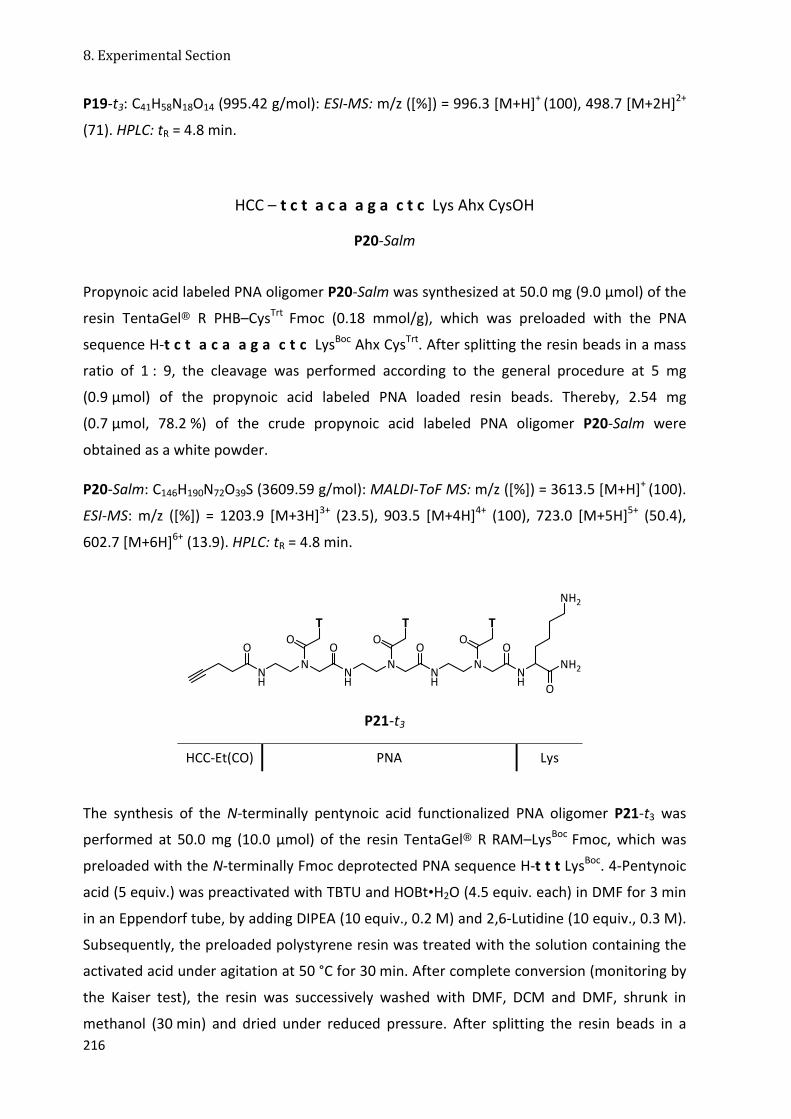
8. Experimental Section
216
P19-t3: C41H58N18O14 (995.42 g/mol): ESI-MS: m/z ([%]) = 996.3 [M+H]+ (100), 498.7 [M+2H]2+
(71). HPLC: tR = 4.8 min.
HCC – t c t a c a a g a c t c Lys Ahx CysOH
P20-Salm
Propynoic acid labeled PNA oligomer P20-Salm was synthesized at 50.0 mg (9.0 µmol) of the
resin TentaGel® R PHB–CysTrt Fmoc (0.18 mmol/g), which was preloaded with the PNA
sequence H-t c t a c a a g a c t c LysBoc Ahx CysTrt. After splitting the resin beads in a mass
ratio of 1 : 9, the cleavage was performed according to the general procedure at 5 mg
(0.9 µmol) of the propynoic acid labeled PNA loaded resin beads. Thereby, 2.54 mg
(0.7 µmol, 78.2 %) of the crude propynoic acid labeled PNA oligomer P20-Salm were
obtained as a white powder.
P20-Salm: C146H190N72O39S (3609.59 g/mol): MALDI-ToF MS: m/z ([%]) = 3613.5 [M+H]+ (100).
ESI-MS: m/z ([%]) = 1203.9 [M+3H]3+ (23.5), 903.5 [M+4H]4+ (100), 723.0 [M+5H]5+ (50.4),
602.7 [M+6H]6+ (13.9). HPLC: tR = 4.8 min.
P21-t3
HCC-Et(CO) PNA Lys
The synthesis of the N-terminally pentynoic acid functionalized PNA oligomer P21-t3 was
performed at 50.0 mg (10.0 µmol) of the resin TentaGel® R RAM–LysBoc Fmoc, which was
preloaded with the N-terminally Fmoc deprotected PNA sequence H-t t t LysBoc. 4-Pentynoic
acid (5 equiv.) was preactivated with TBTU and HOBt•H2O (4.5 equiv. each) in DMF for 3 min
in an Eppendorf tube, by adding DIPEA (10 equiv., 0.2 M) and 2,6-Lutidine (10 equiv., 0.3 M).
Subsequently, the preloaded polystyrene resin was treated with the solution containing the
activated acid under agitation at 50 °C for 30 min. After complete conversion (monitoring by
the Kaiser test), the resin was successively washed with DMF, DCM and DMF, shrunk in
methanol (30 min) and dried under reduced pressure. After splitting the resin beads in a
NH
N
OT
OO
N
OT
NH
O
NH
N
OT
O
NH
NH2
O
NH2

8. Experimental Section
217
mass ratio of 1 : 9, the cleavage was performed according to the general procedure at 5 mg
(1.0 µmol) of the propynoic acid labeled PNA loaded resin beads. Thereby, 7.42 mg
(7.3 µmol, 72.5 %) of the crude propynoic acid labeled PNA oligomer P21-t3 were obtained
as a white powder.
P21-t3: C44H61N15O14 (1023.45 g/mol): ESI-MS: m/z ([%]) = 1024.4 [M+H]+ (100), 512.7
[M+2H]2+ (60). HPLC: tR = 10.0 min.
8.3.5 Internally Iodo-Functionalized PNA Oligomer
P22-t3
Ac PNA uI PNA Lys Cys
The synthesis of P22-t3 was performed at 50.0 mg (9.0 µmol) of the resin TentaGel® R PHB–
CysTrt Fmoc according to the general procedure for PNA synthesis, by incorporation 5-
iodouracil PNA monomer P5 and N-terminal acetylation of the Fmoc-deprotected,
completed sequence. The incorporation of P5 was performed according to the standard
conditions for the coupling of the thymine PNA monomer. 5-Iodouracil PNA monomer
(5 equiv.) was preactivated with HATU (4.5 equiv.) in DMF for 3 min in an Eppendorf tube, by
adding DIPEA (10 equiv., 0.2 M) and 2,6-Lutidine (10 equiv., 0.3 M). The polystyrene resin,
which was preloaded with an N-terminally Fmoc deprotected PNA sequence t–LysBoc CysTrt
was treated with the solution containing the activated acid under agitation at ambient
temperature for 1.15 h or at 50 °C for 15 min. After complete conversion (monitoring by
Kaiser test), the PNA synthesis was continued according to the general procedure. After
completion of the the sequence, the resin was successively washed with DMF, DCM and
DMF, shrunk in methanol (30 min) and dried under reduced pressure. The cleavage from the
resin was performed according to the standard procedure, to yield 8.67 mg (7.2 µmol,
80.1 %) of the crude PNA oligomer P22-t3 as a white powder.
P22-t3: C43H60IN15O16S (1202.00 g/mol): MALDI-ToF MS: m/z ([%]) = 1202.8 [M+H]+ (100). ESI-
MS: 1202.1 [M+H]+ (52.2), 601.6 [M+2H]2+ (100). HPLC: tR = 8.4 min.
NH
N
OO
NH
O
O
N
O
NH
O
NH2
NNH
OO
TNT
HN
O
O
I
HN
O
OH
SH

8. Experimental Section
218
8.3.6 N-Terminally Fc-Labeled PNA Conjugates
Fc PNA Linker
Fc-PNA conjugates P23 – P30 were synthesized on the resin TentaGel® R PHB–CysTrt Fmoc,
which was preloaded with the respective N-terminally Fmoc deprotected PNA oligomer, as
specified below. Ferrocenecarboxylic acid (5 equiv.) was preactivated with HATU and
HOBt•H2O (4.5 equiv. each) in DMF for 3 min in an Eppendorf tube, by adding DIPEA
(10 equiv, 0.2 M) and 2,6-Lutidine (10 equiv, 0.3 M). Subsequently, the respective resin was
treated with the solution containing the activated acid under agitation at ambient
temperature for 3 h. Then the brownish resin was successively washed with DMF, DCM and
DMF, shrunk in methanol (30 min) and dried under reduced pressure. The cleavage from the
resin was performed with TFA/TIS/phenol = 85:5:10.
Fc – c t c a g a g c a t c t Lys Ahx CysOH
P23-‘E.coli’
Fc-PNA conjugate P23-‘E.coli’ was synthesized at 100.0 mg (18.0 µmol) resin, which was
preloaded with the N-terminally deprotected PNA sequence H-c t c a g a g c a t c t LysBoc
Ahx CysTrt. Cleavage from the resin yielded 52.4 mg (13.8 µmol, 76.9 %) as a yellowish
powder.
P23-‘E.coli’: C154H197FeN71O41S (3786.57 g/mol): MALDI-ToF MS: m/z ([%]) = 3788.3 [M+H]+
(100). ESI-MS: m/z ([%]) = 1262.7 [M+3H]3+ (29.8), 947.4 [M+4H]4+ (100), 758.2 [M+5H]5+
(26.7), 632.0 [M+6H]6+ (3.3). HPLC: tR = 12.0 min.
NH
n
N
O
Nb
O
NH
O
HN
O
N
O
Nb
NH
O
NH2
O
OH
R mFe

8. Experimental Section
219
Fc – t c t a c g a g a c t c Lys Ahx CysOH
P24-E.coli
Fc-PNA conjugate P24-E.coli was synthesized at 100.0 mg (18.0 µmol) resin, which was
preloaded with the N-terminally deprotected PNA sequence H-t c t a c g a g a c t c LysBoc
Ahx CysTrt. Cleavage from the resin yielded 42.1 mg (11.1 µmol, 61.8 %) as a yellowish
powder.
P24-E.coli: C154H197FeN71O41S (3786.57 g/mol): MALDI-ToF MS: m/z ([%]) = 3784.9 [M+H]+
(100). ESI-MS: m/z ([%]) = 1262.7 [M+3H]3+ (35.2), 947.4 [M+4H]4+ (100), 758.2 [M+5H]5+
(17.0), 632.0 [M+6H]6+ (2.9). HPLC: tR = 12.5 min.
Fc – t c t a c c g t a c t c Lys Ahx CysOH
P25-Pseu
Fc-PNA conjugate P25-Pseu was synthesized at 100.0 mg (18.0 µmol) resin, which was
preloaded with the N-terminally deprotected PNA sequence H-t c t a c c g t a c t c LysBoc
Ahx CysTrt. Cleavage from the resin yielded 52.7 mg (14.1 µmol, 78.3 %) as a yellowish
powder.
P25-Pseu: C153H198FeN66O43S (3737.54 g/mol): MALDI-ToF MS: m/z ([%]) = 3738.4 [M+H]+
(100). ESI-MS: m/z ([%]) = 1869.1 [M+2H]2+ (9.8), 1246.3 [M+3H]3+ (59.7), 935.0 [M+4H]4+
(100). HPLC: tR = 12.4 min.
Fc – t c t a c a a g a c t c Lys Ahx CysOH
P26-Salm
Fc-PNA conjugate P26-Salm was synthesized at 100.0 mg (18.0 µmol) resin, which was
preloaded with the N-terminally deprotected PNA sequence H-t c t a c a a g a c t c LysBoc
Ahx CysTrt. Cleavage from the resin yielded 53.6 mg (14.2 µmol, 79.0 %) as a yellowish
powder.

8. Experimental Section
220
P26-Salm: C154H197FeN71O40S (3770.57 g/mol): MALDI-ToF MS: m/z ([%]) = 3772.3 [M+H]+
(100). ESI-MS: m/z ([%]) = 1885.1 [M+2H]2+ (11.8), 1257.6 [M+3H]3+ (47.1), 943.5 [M+4H]4+
(100), 754.8 [M+5H]5+ (6.5). HPLC: tR = 12.5 min.
Fc – c t c Lys Ahx CysOH
P27-Salm‘3‘
Fc-PNA conjugate P27-Salm’3’ was synthesized at 20.0 mg (3.6 µmol) resin, which was
preloaded with the N-terminally deprotected PNA sequence H-c t c LysBoc Ahx CysTrt.
Cleavage from the resin yielded 3.4 mg (2.5 µmol, 70.3 %) as a yellowish powder.
P27-Salm’3’: C57H78FeN18O15S (1343.25 g/mol): ESI-MS: m/z ([%]) = 1343.2 [M+H]+ (5.5),
672.2 [M+2H]2+ (100). LC-MS: tR = 6.4 min.
Fc – a g a c t c Lys Ahx CysOH
P28-Salm‘6‘
Fc-PNA conjugate P28-Salm‘6‘ was synthesized at 20.0 mg (3.6 µmol) resin, which was
preloaded with the N-terminally deprotected PNA sequence H-a g a c t c LysBoc Ahx CysTrt.
Cleavage from the resin yielded 6.7 mg (3.1 µmol, 85.2 %) as a yellowish powder.
P28-Salm‘6‘: C90H117FeN39O22S (2185.05 g/mol): ESI-MS: m/z ([%]) = 2184.9 [M+H]+ (4.0),
1093.2 [M+2H]2+ (52.0), 729.2 [M+3H]3+ (100), 547.2 [M+4H]4+ (12.4). LC-MS: tR = 6.3/6.5 min
(dp).
Fc – a c a a g a c t c Lys Ahx CysOH
P29-Salm‘9‘
Fc-PNA conjugate P29-Salm‘9‘ was synthesized at 20.0 mg (3.6 µmol) resin, which was
preloaded with the N-terminally deprotected PNA sequence H-a c a a g a c t c LysBoc Ahx
CysTrt. Cleavage from the resin yielded 8.3 mg (2.8 µmol, 77.2 %) as a yellowish powder.
P29-Salm‘9‘: C122H156FeN58O29S (2986.83 g/mol): ESI-MS: m/z ([%]) = 1493.7 [M+2H]2+ (13.2),
996.4 [M+3H]3+ (100), 747.5 [M+4H]4+ (12.6), 598.8 [M+5H]5+ (0.5). LC-MS: tR = 6.2 min.

8. Experimental Section
221
Fc – c c c c t c t a c a a g a c t c Lys Ahx CysOH
P30-Salm‘16‘
Fc-PNA conjugate P30-Salm’16’ was synthesized at 20.0 mg (3.6 µmol) resin, which was
preloaded with the N-terminally deprotected PNA sequence H-a c a a g a c t c LysBoc Ahx
CysTrt. Cleavage from the resin yielded 11.7 mg (2.4 µmol, 68.1 %) as a yellowish powder.
P30-Salm’16’: C194H249FeN91O52S (4775.54 g/mol): ESI-MS: m/z ([%]) = 1592.3 [M+3H]3+
(27.8), 1194.6 [M+4H]4+ (100), 955.9 [M+5H]5+ (6.8). LC-MS: tR = 6.1 min.
8.3.7 N-Terminally Fc-Tz-Labeled PNA Conjugates
8.3.7.1 Regular [2+3]-Azide/Alkyne Cycloadditions
Fc-Tz(MeCO) PNA Linker
Fc-Tz(MeCO) PNA conjugates P31 and P32 were synthesized on polystyrene resins, which
were preloaded with the respective azido functionalized PNA precursor. Under exclusion of
air, moisture and light, the shrunk and dried preloaded resin was swollen in dry DMF (1 h).
After draining off the solvent, the following solutions were successively inserted into the
batch reactor: DIPEA/2,6-Lutidine in DMF (10 equiv. each), ethynylferrocene in DMF
(5 equiv., 1 %) and copper(I) bromide (2 equiv.) in ACN. The resin was incubated with this
reaction mixture for 2 d at ambient temperature under agitation. Then the resin was
successively washed with DMF, DCM, ACN, DCM and DMF, shrunk in methanol (30 min) and
dried under reduced pressure.
NH
n
N
ONb
O
NH
O
HN
O
N
ONb
NH
O
NH2
O
NH2
R m
FeN
NN

8. Experimental Section
222
Fc-Tz(MeCO) – t t t LysNH2
P31-t3
20 mg (4.0 µmol) of TentaGel® R RAM–LysBoc Fmoc, which was preloaded with the N-
terminally azide functionalized t3–PNA precursor ‘P16’-t3, was converted with 4.2 mg
(20.0 µmol) ethynylferrocene. Cleavage from the resin yielded 4.4 mg (3.6 µmol, 88.9 %) of
P31-t3 as a yellowish solid.
P31-t3: C53H68FeN18O14 (1237.06 g/mol): ESI-MS: m/z ([%]) = 1237.2 [M+H]+ (25), 619.2
[M+2H]2+ (100). HPLC: tR = 13.2 min.
Fc-Tz(MeCO) – t c t a c c g t a c t c Lys Ahx CysOH
P32-Pseu
50 mg (9.0 µmol) of TentaGel® R PHB–CysTrt Fmoc which was preloaded with the N-
terminally azide functionalized 12-mer PNA precursor ‘P17’-Pseu was converted with 9.5 mg
(45.0 µmol) ethynylferrocene. Cleavage from the resin yielded 22.9 mg (6.0 µmol, 66.7 %) of
P32-Pseu as a yellowish solid.
P32-Pseu: C156H201FeN69O43S (3818.60 g/mol): MALDI-ToF MS: m/z ([%]) = 3819.8 [M+H]+
(100). ESI-MS: m/z ([%]) = 1527.2 [2M+5H]5+ (12.1), 1273.2 [M+3H]3+ (31.5), 1092.0
[2M+7H]7+ (22.1), 955.2 [M+4H]4+ (55.6), 849.1 [2M+9H]9+ (58.1), 764.4 [M+5H]5+ (100),
694.9 [2M+11H]11+ (44.7), 637.3 [M+6H]6+ (15.2). HPLC: tR = 13.4 min.
Fc(DEPA)-Tz(MeCO) PNA Linker
Fc(DEPA)-Tz(MeCO) PNA conjugates P33, P34 and P35 were synthesized on polystyrene
resins, which were preloaded with the respective azido functionalized PNA precursor. Under
NH
n
N
O
Nb
O
NH
O
HN
O
N
O
Nb
NH
O
NH2
O
NH2
R m
Fe
N
NN
NHO

8. Experimental Section
223
exclusion of air, moisture and light, the shrunk and dried preloaded resin was swollen in dry
DMF (1 h). After draining off the solvent, the following solutions were successively
introduced into the batch reactor: DIPEA/2,6-Lutidine in DMF (10 equiv. each), DEPA
ferrocene in DMF (5 equiv., 1 %) and copper(I) bromide (2 equiv.) in ACN. The resin was
incubated with this reaction mixture for 2 d at ambient temperature under agitation. Then
the resin was successively washed with DMF, DCM, ACN, DCM and DMF, shrunk in methanol
(30 min) and dried under reduced pressure.
Fc(DEPA)-Tz(MeCO) – t t t LysNH2
P33-t3
20 mg (4.0 µmol) of TentaGel® R RAM–LysBoc Fmoc, which was preloaded with the N-
terminally azide functionalized t3–PNA precursor ‘P16’-t3, was converted with 6.5 mg
(20.0 µmol) DEPA ferrocene. Cleavage from the resin yielded 4.9 mg (3.6 µmol, 90.7 %) of
P33-t3 as a yellowish solid.
P33-t3: C59H79FeN19O15 (1350.22 g/mol): ESI-MS: m/z ([%]) = 1350.3 [M+H]+ (22), 675.7
[M+2H]2+ (100). HPLC: tR = 13.1 min.
Fc(DEPA)-Tz(MeCO) – t c t a c g a g a c t c Lys Ahx CysOH
P34-E.coli
50 mg (9.0 µmol) of TentaGel® R PHB–CysTrt Fmoc which was preloaded with the N-
terminally azide functionalized 12-mer PNA precursor ‘P18’-E.coli was converted with
14.5 mg (45.0 µmol) DEPA ferrocene. Cleavage from the resin yielded 26.3 mg (6.6 µmol,
73.4 %) of P34-E.coli as a yellowish solid.
P34-E.coli: C163H211FeN75O42S (3980.81 g/mol): MALDI-ToF MS: m/z ([%]) = 3986.9 [M+H]+
(100). ESI-MS: m/z ([%]) = 1592.5 [2M+5H]5+ (20.5), 1327.3 [M+3H]3+ (100), 1138.1
[2M+7H]7+ (76.8), 995.4 [M+4H]4+ (26.8). HPLC: tR = 14.0 min.

8. Experimental Section
224
Fc(DEPA)-Tz(MeCO) – t c t a c c g t a c t c Lys Ahx CysOH
P35-Pseu
50 mg (9.0 µmol) of TentaGel® R PHB–CysTrt Fmoc which was preloaded with the N-
terminally azide functionalized 12-mer PNA precursor ‘P17’-Pseu was converted with
14.5 mg (45.0 µmol) DEPA ferrocene. Cleavage from the resin yielded 22.4 mg (5.7 µmol,
63.3 %) of P35-Pseu as a yellowish solid.
P35-Pseu: C162H212FeN70O44S (3931.77 g/mol): MALDI-ToF MS: m/z ([%]) = 3936.2 [M+H]+
(100). ESI-MS: m/z ([%]) = 1573.0 [2M+5H]5+ (19.0), 1311.0 [M+3H]3+ (100), 1124.2
[2M+7H]7+ (42.3), 983.6 [M+4H]4+ (91.5), 874.5 [2M+9H]9+ (49.4), 787.0 [M+5H]5+ (33.0).
HPLC: tR = 13.9 min.
8.3.7.2 Inverse [2+3]-Azide/Alkyne Cycloadditions
Fc-Tz(CO) PNA Linker
Fc-Tz(CO) PNA conjugates P36 and P37 were synthesized on polystyrene resins, which were
preloaded with the respective propynoic acid functionalized PNA precursor. Under exclusion
of air, moisture and light, the shrunk and dried preloaded resin was swollen in dry DMF (1 h).
After draining off the solvent, the following solutions were successively introduced into the
batch reactor: DIPEA/2,6-Lutidine in DMF (10 equiv. each), azidoferrocene in DMF (5 equiv.,
1 %) and copper(I) bromide (2 equiv.) in ACN. The resin was incubated with this reaction
mixture for 2 d at ambient temperature under agitation. Then the resin was successively
washed with DMF, DCM, ACN, DCM and DMF, shrunk in methanol (30 min) and dried under
reduced pressure.
NH
n
N
ONb
O
NH
O
HN
O
N
ONb
NH
O
NH2
O
NH2
R mFe
NN N

8. Experimental Section
225
Fc-Tz(CO) – t t t LysNH2
P36-t3
20 mg (4.0 µmol) of TentaGel® R RAM–LysBoc Fmoc, which was preloaded with the N-
terminally propynoic acid functionalized t3–PNA precursor ‘P19’-t3, was converted with
4.5 mg (20.0 µmol) azidoferrocene. Cleavage from the resin yielded 3.8 mg (3.1 µmol,
77.7 %) of P36-t3 as a yellowish solid.
P36-t3: C52H66FeN18O14 (1223.04 g/mol): ESI-MS: m/z ([%]) = 1223.2 [M+H]+ (41), 612.2
[M+2H]2+ (100). HPLC: tR = 13.7 min.
Fc-Tz(CO) – t c t a c a a g a c t c Lys Ahx CysOH
P37-Salm
50 mg (9.0 µmol) of TentaGel® R PHB–CysTrt Fmoc which was preloaded with the N-
terminally propynoic acid functionalized 12-mer PNA precursor ‘P20’-Salm was converted
with 10.2 mg (45.0 µmol) azidoferrocene. Cleavage from the resin yielded 25.6 mg (6.7 µmol,
74.1 %) of P37-Salm as a yellowish solid.
P37-Salm: C156H198FeN74O40S (3837.62 g/mol): MALDI-ToF MS: m/z ([%]) = 3841.1 [M+H]+
(100). ESI-MS: m/z ([%]) = 1535.0 [2M+5H]5+ (2.3), 1279.5 [M+3H]3+ (94.4), 1096.9 [2M+7H]7+
(89.4), 960.1 [M+4H]4+ (100), 853.5 [2M+9H]9+ (95.3), 768.3 [M+5H]5+ (56.5), 698.7
[2M+11H]11+ (26.9). HPLC: tR = 14.5 min.
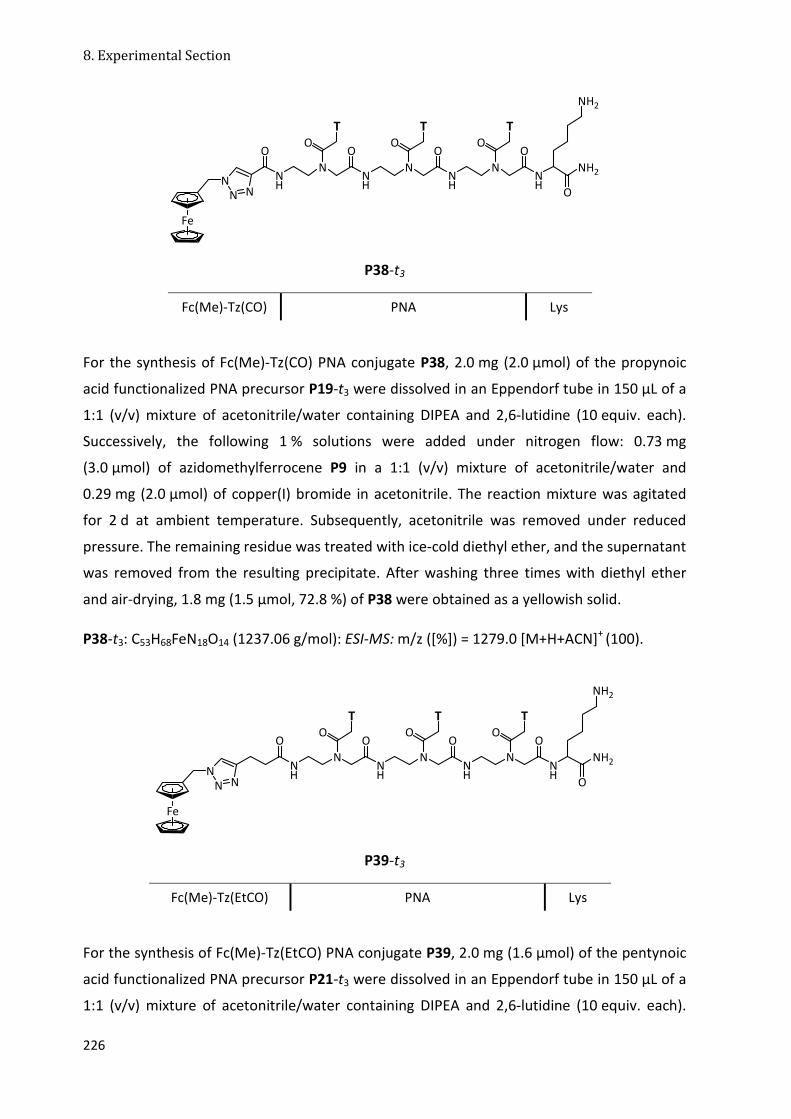
8. Experimental Section
226
P38-t3
Fc(Me)-Tz(CO) PNA Lys
For the synthesis of Fc(Me)-Tz(CO) PNA conjugate P38, 2.0 mg (2.0 μmol) of the propynoic
acid functionalized PNA precursor P19-t3 were dissolved in an Eppendorf tube in 150 μL of a
1:1 (v/v) mixture of acetonitrile/water containing DIPEA and 2,6-lutidine (10 equiv. each).
Successively, the following 1 % solutions were added under nitrogen flow: 0.73 mg
(3.0 µmol) of azidomethylferrocene P9 in a 1:1 (v/v) mixture of acetonitrile/water and
0.29 mg (2.0 μmol) of copper(I) bromide in acetonitrile. The reaction mixture was agitated
for 2 d at ambient temperature. Subsequently, acetonitrile was removed under reduced
pressure. The remaining residue was treated with ice-cold diethyl ether, and the supernatant
was removed from the resulting precipitate. After washing three times with diethyl ether
and air-drying, 1.8 mg (1.5 µmol, 72.8 %) of P38 were obtained as a yellowish solid.
P38-t3: C53H68FeN18O14 (1237.06 g/mol): ESI-MS: m/z ([%]) = 1279.0 [M+H+ACN]+ (100).
P39-t3
Fc(Me)-Tz(EtCO) PNA Lys
For the synthesis of Fc(Me)-Tz(EtCO) PNA conjugate P39, 2.0 mg (1.6 μmol) of the pentynoic
acid functionalized PNA precursor P21-t3 were dissolved in an Eppendorf tube in 150 μL of a
1:1 (v/v) mixture of acetonitrile/water containing DIPEA and 2,6-lutidine (10 equiv. each).
NH
N
OT
OO
N
OT
NH
O
Fe
NN N
NH
N
OT
O
NH
NH2
O
NH2
NH
N
OT
OO
N
OT
NH
O
Fe
NN N
NH
N
OT
O
NH
NH2
O
NH2

8. Experimental Section
227
Successively, the following 1 % solutions were added under nitrogen flow: 0.58 mg
(2.4 µmol) of azidomethylferrocene P9 in a 1:1 (v/v) mixture of acetonitrile/water and
0.23 mg (1.6 μmol) of copper(I) bromide in acetonitrile. The reaction mixture was agitated
for 2 d at ambient temperature. Subsequently, acetonitrile was removed under reduced
pressure. The remaining residue was treated with ice-cold diethyl ether, and the supernatant
was removed from the resulting precipitate. After washing three times with diethyl ether
and air-drying, 1.1 mg (0.87 µmol, 54.3 %) of P39 were obtained as a white/yellowish solid.
P39-t3: C55H72FeN18O14 (1265.12 g/mol): ESI-MS: m/z ([%]) = 1329.2 [M+Na+ACN]+ (11.1),
1307.2 [M+H+ACN]+ (33.3), 1288.2 [M+Na]+ (100).
P40-t3
Fc-Tz(EtCO) PNA Lys
Fc-Tz(EtCO) PNA conjugate P40 was synthesized on 20 mg (4.0 µmol) of TentaGel® R RAM–
LysBoc Fmoc, which was preloaded with the N-terminally pentynoic acid functionalized t3–
PNA precursor ‘P21’-t3. Under exclusion of air, moisture and light, the shrunk and dried
preloaded resin was swollen in dry DMF (1 h). After draining off the solvent, the following
solutions were successively introduced into the batch reactor: 6.8 µL (40.0 µmol) DIPEA and
4.7 µL (40.0 µmol) 2,6-Lutidine in 277.8 µL DMF, 4.5 mg (20.0 µmol) azidoferrocene in DMF
and 1.2 mg (8.0 µmol) copper(I) bromide in 57.4 µL ACN. The resin was incubated with this
reaction mixture for 2 d at ambient temperature under agitation. Then the resin was
successively washed with DMF, DCM, ACN, DCM and DMF, shrunk in methanol (30 min) and
dried under reduced pressure. Cleavage from the resin yielded 4.2 mg (3.4 µmol, 83.9 %) of
P40-t3 as a yellowish solid.
P40-t3: C54H70FeN18O14 (1251.09 g/mol): ESI-MS: m/z ([%]) = 1251.3 [M+H]+ (13), 626.2
[M+2H]2+ (100). HPLC: tR = 13.2 min.
NH
N
OT
OO
N
OT
NH
O
Fe
NN N
NH
N
OT
O
NH
NH2
O
NH2

8. Experimental Section
228
8.3.8 N-terminally Triazole-Modified PNA Conjugates
P41-t3
Tz(CO) PNA Lys
P41-t3 was characterized as the unexpected main product of the solid-phase conversion of
the resin-bound propynoic acid functionalized PNA precursor ‘P19’ with
azidomethylferrocene P9, which was formed besides the expected Fc-Tz-PNA conjugate P38
(synthetic scheme in Fig. 3-16).
P41-t3: C42H58N18O14 (1039.02 g/mol): ESI-MS: m/z ([%]) = 1061.3 [M+Na]+ (18.8), 1039.3 [M]+
(100.0), 531.2 [M+Na]2+ (43.6), 520.2 [M+H]2+ (71.1); 1237.2 [P38]+ (4.9), 629.6 [P38+Na]2+
(15.6), 618.7 [P38+H]2+ (62.1).
P42-t3
Tz(EtCO) PNA Lys
P42-t3 was characterized as the unexpected product of the solid-phase conversions of the
resin-bound pentynoic acid functionalized PNA precursor ‘P21’ with azidomethylferrocene
P9 or carboxazidoferrocene P10 (synthetic scheme in Fig. 3-16).
P42-t3: C47H67N19O15S (1170.22 g/mol): ESI-MS: m/z ([%]) = 1171.3 [M+H]+ (43.7), 780.9
[2M+3H]3+ (100), 586.2 [M+2H]2+ (73.4). HPLC: tR = 9.6 min.
NH
N
OT
OO
N
OT
NH
O
HNN N
NH
N
OT
O
NH
NH2
O
NH2
NH
N
O
T
OO
N
O
T
NH
O
HNN N
NH
N
O
T
O
NH
NH2
O
NH2

8. Experimental Section
229
8.3.9 Overview of all Synthesized PNA Conjugates/Oligomers
N-terminal Modification
No. Sequence (N � C) M / gmol-1
ε /cm2µmol-1
P11-‘E.coli‘ Ac – c t c a g a g c a t c t
Lys Ahx CysOH 3616.58 116.7
P12-E.coli Ac – t c t a c g a g a c t c
Lys Ahx CysOH 3616.58 116.7
P13-Pseu Ac – t c t a c c g t a c t c Lys Ahx CysOH 3567.55 106.5
P14-Salm Ac – t c t a c a a g a c t c
Lys Ahx CysOH 3600.59 118.7
P15-Salm H – t c t a c a a g a c t c Lys Ahx CysOH 3558.55 118.7
P16-t3 Az – t t t LysNH2 1027.01 25.8
P17-Pseu Az – t c t a c c g t a c t c
Lys Ahx CysOH 3607.57 106.5
P18-E.coli Az – t c t a c g a g a c t c
Lys Ahx CysOH 3656.61 116.7
P19-t3 HCC – t t t Lys NH2 995.42 25.8
P20-Salm HCC – t c t a c a a g a c t c
Lys Ahx CysOH 3609.59 118.7
P21-t3 HCC-Et – t t t Lys NH2 1023.45 25.8
P22-t3 Ac – t uI t Lys CysOH 1202.00 25.8
P23-‘E.coli‘ Fc – c t c a g a g c a t c t Lys Ahx CysOH 3786.57 126.2
P24-E.coli Fc – t c t a c g a g a c t c Lys Ahx CysOH 3786.57 126.2
P25-Pseu Fc – t c t a c c g t a c t c Lys Ahx CysOH 3737.54 116.0
P26-Salm Fc – t c t a c a a g a c t c Lys Ahx CysOH 3770.57 128.2
P27-Salm‘3‘ Fc – c t c Lys Ahx CysOH 1343.25 31.3
P28-Salm‘6‘ Fc – a g a c t c Lys Ahx CysOH 2185.05 70.4
P29-Salm‘9‘ Fc – a c a a g a c t c Lys Ahx CysOH 2986.83 104.4
P30-Salm‘16‘ Fc – c c c c t c t a c a a g a c t c
Lys Ahx CysOH 4775.54 154.6
P31-t3 Fc-Tz(MeCO) – t t t Lys NH2 1237.06 35.3
P32-Pseu Fc-Tz(MeCO) – t c t a c c g t a c t c
Lys Ahx CysOH 3818.60 116.0
P33-t3 Fc(DEPA)-Tz(MeCO) – t t t Lys NH2 1350.22 35.3
P34-E.coli Fc(DEPA)-Tz(MeCO) – t c t a c g a g a c
t c Lys Ahx CysOH 3980.81 126.2
P35-Pseu Fc(DEPA)-Tz(MeCO) – t c t a c c g t a c t
c Lys Ahx CysOH 3931.77 116.0
O
H
O
N3
O
O
O
Fe
NN
N
FeO
NN
N
OHN
O
Fe

8. Experimental Section
230
P36-t3 Fc-Tz(CO) – t t t Lys NH2 1233.04 35.3
P37-Salm Fc-Tz(CO) – t c t a c a a g a c t c
Lys Ahx CysOH 3837.62 128.2
P38-t3 Fc(Me)-Tz(CO) – t t t Lys NH2 1237.06 35.3
P39-t3 Fc(Me)-Tz(EtCO) – t t t Lys NH2 1265.12 35.3
P40-t3 Fc-Tz(EtCO) – t t t Lys NH2 1251.09 35.3
P41-t3 H-Tz(CO) – t t t Lys NH2 1039.02 25.8
P42-t3 H-Tz(EtCO) – t t t Lys NH2 1170.22 25.8
8.4 UV Melting Experiments
8.4.1 General Procedures
The UV measurements were performed with the UV/VIS – spectrophotometer Varian
Cary 100 Conc from Varian Inc. (Palo Alto, CA, USA), equipped with a 6x6 multicell block and
Peltier thermostat and running with the Cary Win UV software with Cary Bio package. Quartz
Suprasil QS cuvettes (4 x 10 mm; Vmax = 1.4 mL; type: 114B) were used, which were
purchased from Hellma (Müllheim, Germany). The cuvettes were densely sealed with Teflon
caps for all measurements at higher temperatures to avoid solvent evaporation.
Measurements at lower temperatures (T < 15 °C) required purging of the multicell block
with nitrogen gas, in order to prevent steaming up of the cuvettes.
Stock solutions of the purchased DNA oligomers and the synthesized PNA conjugates
(both: HPLC purified) were prepared by dissolving the solid oligomer/conjugate in aq.
phosphate buffer at a physiological pH (0.1 M NaH2PO4, pH 7.4). DNA stock solutions were
straight used or permanently stored at T = -20 °C. PNA stock solutions were shortly heated-
O
NN
N
Fe
O
NN
NFe
NN
NFe
O
NN
N
O
Fe
O
HNN
N
HNN
N
O
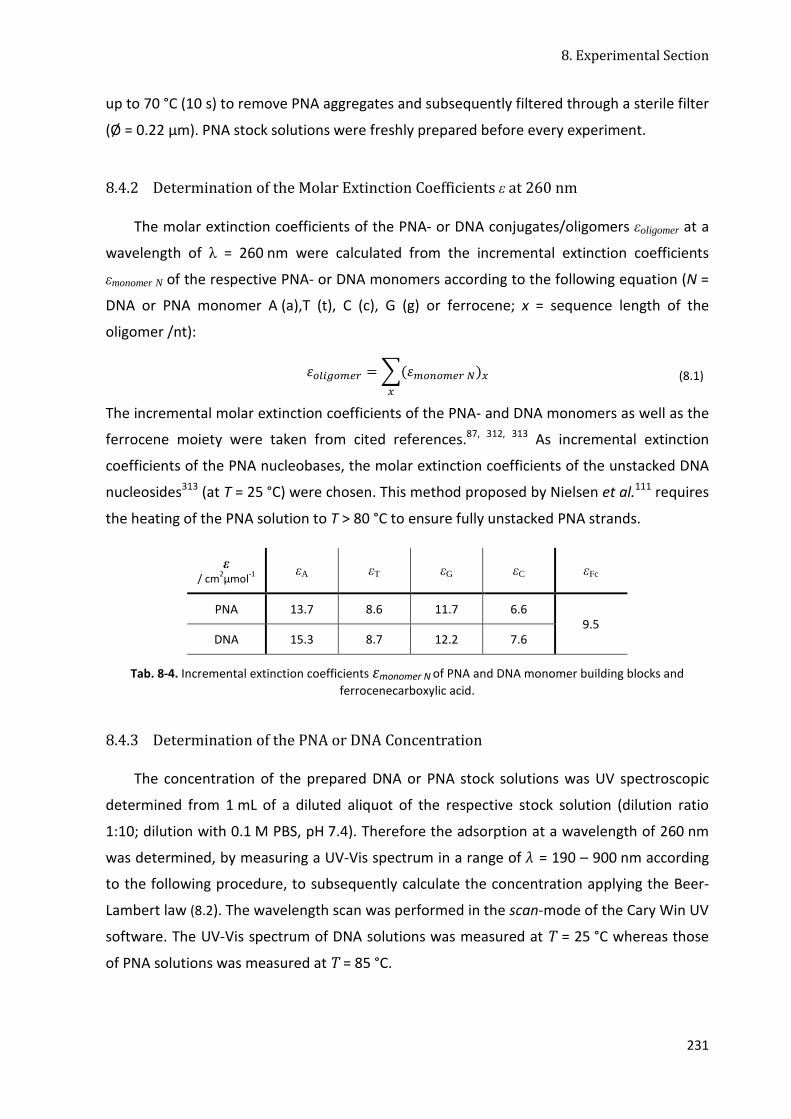
8. Experimental Section
231
up to 70 °C (10 s) to remove PNA aggregates and subsequently filtered through a sterile filter
(Ø = 0.22 µm). PNA stock solutions were freshly prepared before every experiment.
8.4.2 Determination of the Molar Extinction Coefficients ε at 260 nm
The molar extinction coefficients of the PNA- or DNA conjugates/oligomers εoligomer at a
wavelength of λ = 260 nm were calculated from the incremental extinction coefficients
εmonomer N of the respective PNA- or DNA monomers according to the following equation (N =
DNA or PNA monomer A (a),T (t), C (c), G (g) or ferrocene; x = sequence length of the
oligomer /nt):
ÝÕHCDÕK�� = u(ÝKÕ�ÕK�� �)LL
(8.1)
The incremental molar extinction coefficients of the PNA- and DNA monomers as well as the
ferrocene moiety were taken from cited references.87, 312, 313 As incremental extinction
coefficients of the PNA nucleobases, the molar extinction coefficients of the unstacked DNA
nucleosides313 (at T = 25 °C) were chosen. This method proposed by Nielsen et al.111 requires
the heating of the PNA solution to T > 80 °C to ensure fully unstacked PNA strands.
ε / cm2µmol-1
εA εT εG εC εFc
PNA 13.7 8.6 11.7 6.6 9.5
DNA 15.3 8.7 12.2 7.6
Tab. 8-4. Incremental extinction coefficients εmonomer N of PNA and DNA monomer building blocks and
ferrocenecarboxylic acid.
8.4.3 Determination of the PNA or DNA Concentration
The concentration of the prepared DNA or PNA stock solutions was UV spectroscopic
determined from 1 mL of a diluted aliquot of the respective stock solution (dilution ratio
1:10; dilution with 0.1 M PBS, pH 7.4). Therefore the adsorption at a wavelength of 260 nm
was determined, by measuring a UV-Vis spectrum in a range of λ = 190 – 900 nm according
to the following procedure, to subsequently calculate the concentration applying the Beer-
Lambert law (8.2). The wavelength scan was performed in the scan-mode of the Cary Win UV
software. The UV-Vis spectrum of DNA solutions was measured at T = 25 °C whereas those
of PNA solutions was measured at T = 85 °C.

8. Experimental Section
232
General procedure:
a. Zero the instrument (without cuvettes)
b. Adjust temperature (T = 25 °C for DNA, T = 85 °C for PNA solutions)
c. Record baseline from λ = 190 – 900 nm
(cuvettes filled with PBS (slots 1, 7), equilibration for 5 min)
d. Record wavelength scan from λ = 190 – 900 nm vs. the recorded baseline
(cuvette in slot 1 filled with sample, equilibration for 5 min)
e. Collect adsorption value at λ = 260 nm
The concentration of the diluted aliquot was determined according to the Beer-Lambert law
(A = absorption; ε = molar extinction coefficient of the PNA conjugate or DNA oligomer
/cm2µmol-1; c = concentration /µM; l = cuvette path length /cm):
� = Ý ∙ 7 ∙ � (8.2)
The concentration of the respective stock solution could be determined applying the rule of
three due to the linear correlation between concentration c and adsorption A. The
concentration of stock solutions was generally determined by averaging over three
independent measurements to eliminate errors mainly due to pipetting.
8.4.4 UV Melting Curves
For the measurement of (Fc-)PNA•DNA or DNA•DNA UV melting curves, stock solutions
of the respective PNA conjugates and DNA oligomers were mixed in a molar 1:1 ratio, to
obtain after dilution with 0.1 M PBS (pH 7.4) 1 mL of a solution with the final duplex
concentration of 1.7 µM. The UV melting curve (A260 vs. T) was recorded at a wavelength of
λ = 260 nm with the thermal-mode of the Cary Win UV software.
General procedure:
a. Multizero the instrument
(cuvettes filled with PBS; T = 25 °C)
b. Fill the cuvettes with prepared nucleic acid mixtures
(except cuvette in slot 1: filled with PBS)
c. Densely seal the cuvettes with Teflon plug ins
d. Start nitrogen purging of the cuvette block
e. Run temperature profile at λ = 260 nm (Tab. 8-5)
(at T = 85 °C between step 1 and 2: remove bubbles)

8. Experimental Section
233
The following temperature profile was applied, which consists of the primary removal of
PNA aggregates and denaturation of already formed nucleic acid duplexes (step 1), the
subsequent formation of the nucleic acid duplex in a controlled annealing step (step 2.a) and
the final melting of the nucleic acid duplex (step 2.b). During one experiment, annealing
(step 2.a) and melting (step 2.b) were repeated altogether three times before the
experiment was finished with returning the temperature to 25 °C (step 3). At every
temperature vertex (T = 4 °C or 85 °C) the temperature was kept constant for 5 min for
equilibration.
Step Rate
/ °C min-1 TStart / °C
TEnd / °C
Process
1 2.0 25 85 deaggregation/
denaturation
2.a 0.5 85 4 annealing
2.b 0.5 4 85 denaturation
3 2.0 85 25
Tab. 8-5. Melting curve temperature profile.
One absorption value A260 was recorded per °C at λ = 260 nm, to yield the sigmoid UV
melting curve in the A260 vs. T plot for dT/dt = +0.5 °C/min (analogous: UV annealing curve
for dT/dt = -0.5 °C/min). The obtained crude data were saved as ASCII files and analyzed with
Origin® 7G. Thereby, the sigmoid melting curve (dA260/dT) was first subjected to a
polynomial fit (9th order/1000 data points), whereof the first deviation was formed, whose
maximum was read out as the melting point TM of the studied nucleic acid duplex. The
determined thermodynamic data were finally averaged over six measurements resulting
from two independent experiments.
8.4.5 DNA Oligomers
No. Sequence (3’ � 5’) ε / cm2µmol-1
D1 A G A T G C T C T G A G 136.0
D2 A G A T G G C A T G A G 147.2
D3 A G A T G T T C T G A G 137.1
D4 C G A T G T T C T G A G 129.4
D5 A A A T G T T C T G A G 140.2
D6 A G C T G T T C T G A G 129.4

8. Experimental Section
234
D7 A G A C G T T C T G A G 136.0
D8 A G A T A T T C T G A G 140.2
D9 A G A T G T C C T G A G 136.0
D10 A G A T G T T A T G A G 144.8
D11 A G A T G T T C C G A G 136.0
D12 A G A T G T T C T A A G 140.2
D13 A G A T G T T C T G C G 129.4
D14 A G A T G T T C T G A A 140.2
D15 G A G 39.7
D16 T C T G A G 64.7
D17 T G T T C T G A G 94.3
D18 G G G G A G A T G T T C T G A G 185.9
D19 G G G G G A G A T G C T C T G A G T T C G A 249.5
D20 G T G G G A G A T G G C A T G A G A T C G A 263.8
D21 G G G G G A G A T G T T C T G A G T T C G G 247.5
D22 G A G T C T C G T A G A 136.0
8.4.6 Analysis of (Fc-)PNA•DNA Melting Curves
No. TM [°C]
TAnneal [°C]
∆A5-80°C [%]
fM
P24•D1 62.5 ± 0.1 59.9 ± 0.6 11.1 ± 0.2 0.55
P12•D1 62.6 ± 0.3 59.0 ± 0.1 14.0 ± 0.1 0.73
P24•D19 65.8 ± 0.9 57.1 ± 0.3 13.0 ± 0.1 0.45
P12•D19 65.3 ± 0.2 62.4 ± 0.03 15.1 ± 0.05 1.11
P24•D2 – – 8.5 ± 0.1 0.05
P12•D2 – – 10.9 ± 0.2 0.13
P24•D3 51.3 ± 0.1 50.1 ± 0.1 11.7 ± 0.1 0.47
P12•D3 49.9 ± 0.1 52.6 ± 0.3 16.6 ± 0.2 0.95
P25•D1 – – 11.0 ± 0.4 0.07
P25•D2 54.4 ± 0.3 53.0 ± 0.4 13.4 ± 0.6 0.70
P25•D20 58.1 ± 0.3 56.4 ± 0.1 16.3 ± 0.01 1.14
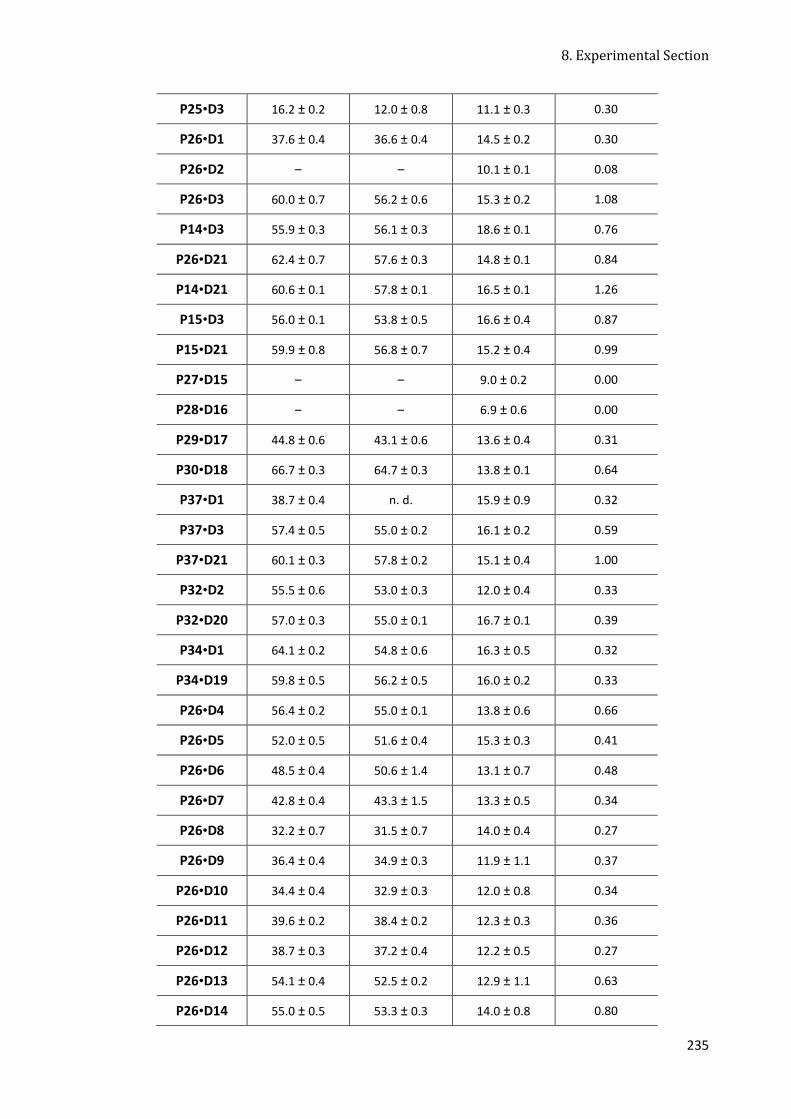
8. Experimental Section
235
P25•D3 16.2 ± 0.2 12.0 ± 0.8 11.1 ± 0.3 0.30
P26•D1 37.6 ± 0.4 36.6 ± 0.4 14.5 ± 0.2 0.30
P26•D2 – – 10.1 ± 0.1 0.08
P26•D3 60.0 ± 0.7 56.2 ± 0.6 15.3 ± 0.2 1.08
P14•D3 55.9 ± 0.3 56.1 ± 0.3 18.6 ± 0.1 0.76
P26•D21 62.4 ± 0.7 57.6 ± 0.3 14.8 ± 0.1 0.84
P14•D21 60.6 ± 0.1 57.8 ± 0.1 16.5 ± 0.1 1.26
P15•D3 56.0 ± 0.1 53.8 ± 0.5 16.6 ± 0.4 0.87
P15•D21 59.9 ± 0.8 56.8 ± 0.7 15.2 ± 0.4 0.99
P27•D15 – – 9.0 ± 0.2 0.00
P28•D16 – – 6.9 ± 0.6 0.00
P29•D17 44.8 ± 0.6 43.1 ± 0.6 13.6 ± 0.4 0.31
P30•D18 66.7 ± 0.3 64.7 ± 0.3 13.8 ± 0.1 0.64
P37•D1 38.7 ± 0.4 n. d. 15.9 ± 0.9 0.32
P37•D3 57.4 ± 0.5 55.0 ± 0.2 16.1 ± 0.2 0.59
P37•D21 60.1 ± 0.3 57.8 ± 0.2 15.1 ± 0.4 1.00
P32•D2 55.5 ± 0.6 53.0 ± 0.3 12.0 ± 0.4 0.33
P32•D20 57.0 ± 0.3 55.0 ± 0.1 16.7 ± 0.1 0.39
P34•D1 64.1 ± 0.2 54.8 ± 0.6 16.3 ± 0.5 0.32
P34•D19 59.8 ± 0.5 56.2 ± 0.5 16.0 ± 0.2 0.33
P26•D4 56.4 ± 0.2 55.0 ± 0.1 13.8 ± 0.6 0.66
P26•D5 52.0 ± 0.5 51.6 ± 0.4 15.3 ± 0.3 0.41
P26•D6 48.5 ± 0.4 50.6 ± 1.4 13.1 ± 0.7 0.48
P26•D7 42.8 ± 0.4 43.3 ± 1.5 13.3 ± 0.5 0.34
P26•D8 32.2 ± 0.7 31.5 ± 0.7 14.0 ± 0.4 0.27
P26•D9 36.4 ± 0.4 34.9 ± 0.3 11.9 ± 1.1 0.37
P26•D10 34.4 ± 0.4 32.9 ± 0.3 12.0 ± 0.8 0.34
P26•D11 39.6 ± 0.2 38.4 ± 0.2 12.3 ± 0.3 0.36
P26•D12 38.7 ± 0.3 37.2 ± 0.4 12.2 ± 0.5 0.27
P26•D13 54.1 ± 0.4 52.5 ± 0.2 12.9 ± 1.1 0.63
P26•D14 55.0 ± 0.5 53.3 ± 0.3 14.0 ± 0.8 0.80

8. Experimental Section
236
P23•D22 60.8 ± 0.6 59.1 ± 0.4 8.4 ± 0.4 0.60
P25-self 26.5 ± 0.6 n. d. 5.8 ± 0.2 0.21
P26-self 36.9 ± 0.2 n. d. 7.7 ± 0.1 0.70
8.5 Electrochemical Measurements and Surface Modifications
8.5.1 Electrochemical Setup and Measurement Conditions
A standard three-electrode electrochemical cell consisting of a working electrode (WE),
a homemade Ag/AgCl (in 3 M KCl) reference electrode (RE) and a platinum wire (Ø = 0.5 mm,
Goodfellow, Bad Nauheim, Germany) formed to a spiral as counter electrode (CE) was used
as the standard setup for all electrochemical studies. Glassy carbon electrodes (Ø = 2 mm),
bare or modified polycrystalline gold electrode (Ø = 2 mm, 0.1 mm, 0.05 mm) or chip-
embedded microelectrodes (Ø = 0.01 mm) were used as WE. All electrodes were immersed
into an electrolyte solution and the whole setup was placed in a Faraday cage for the
measurements. As standard electrolyte for all interfacial studies, 0.1 M NaClO4 + 2.5 mM PBS
(pH 7.0) was used and deviations thereof are denoted in each case. For the studies of free-
diffusing Fc(-Tz)-PNA conjugates, the respective conjugate was dissolved either in a solution
of 0.2 M sodium perchlorate in a 1:1 mixture of ACN and aq. MOPS buffer (0.15 M, pH 7.4)
or in aq. NaH2PO4 (0.1 M, pH 7.4) buffer as the supporting electrolyte. The respective
electrolyte solution was prepared from high grade salts on trace metals basis with a chloride
content of less than 5 mg/kg with MilliporeTM water or HPLC grade ACN, and was degassed
by purging with argon gas for 5 min per 5 mL solution before every experiment. All
experiments were carried out at ambient temperature. All CV, SWV and DPV measurements
were generally carried out in a potential range of E = 0 – 0.8 V vs. Ag/AgCl, exceptions
thereof mainly concern electrode pretreatment/regeneration steps and are denoted in each
case. CV was generally carried out with a scan rate of v = 0.1 V/s and SWV by applying the
parameters ΔEp = 25 mV, ΔEs = 5 mV, tp = 10 ms and f = 50 Hz, unless otherwise denoted.
Deviations thereof mainly concern the FSCV measurements and the SWV pulse technique.
DPV was generally carried out by applying the parameters ΔEp = 10 mV, ΔEs = 1 mV, tp =
50 ms and v = 4 mV/s.

8. Experimental Section
237
8.5.2 Fabrication and Preparation of Electrodes and the Salt Bridge
8.5.2.1 Gold-Microelectrodes
All measurements at gold-microelectrodes were performed with homemade
polycrystalline gold-microelectrodes (diameter: Ø = 0.01 mm, 0.05 mm, 0.1 mm). The
electrodes were fabricated by primarily pulling a soda glass capillary (Ø = 1 mm; Hilgenberg
GMBH, Malsfeld, Germany) into two halves and sealing the pulled tip with a gas torch. A
piece of ~ 8 mm of a gold-wire (Goodfellow, Bad Nauheim, Germany) was cleaned by ultra
sonic treatment in ethanol, then inserted into the glass capillary, moved to the sealed
capillary tip and smelted under the exclusion of air and moisture with the help of a tungsten
heating spiral (~ 15 A, 3 min at three different spots). The overhanging end of the gold wire
(~ 1/3) was connected with a copper wire (Ø = 0.5 mm, ~ 10 cm). Therefore, the de-
insulated end of the copper wire was inserted into the glass capillary together with a ~
5 mm long piece of solder (Ø = 0.5 mm), such that a parallel arrangement of gold wire,
copper wire and solder resulted. The wires were connected by carefully melting the solder
with a heat gun, while the copper wire was carefully pushed towards the capillary tip. The
open antipodal end to the pulled tip was sealed by using glue and heat shrink tube. A formed
spiral of the free de-insulated end of the copper wire was connected with solder to facilitate
electric conductance.
Subsequent to the electrode fabrication, the gold surface was exposed by polishing the
capillary tip with sand paper (3M, Neuss, Germany). Then, the gold surface was first
mechanically polished with wet alumina slurries (particle sizes: 1.0 µm, 0.3 µm; Leco,
St. Joseph, MI, USA) on polishing cloth (Heraeus, Weinheim, Germany), thoroughly rinsed
with MilliporeTM water, polished again on clean moistened polishing cloth to remove
adsorbed alumina traces and thoroughly rinsed again with MilliporeTM water for at least 20 s.
Afterwards, the gold surface was electrochemically polished by performing cyclic
voltammetry in 0.5 M sulfuric acid between 0.0 – 1.7 V vs. Ag/AgCl (in 3 M KCl) at a scan rate
of 0.1 V/s until stable oxidation/reduction currents of the formed gold oxide proved a clean
gold surface (about 50 cycles). After rinsing with MilliporeTM water, the freshly prepared gold
electrodes were straight subjected to the immobilization process, to avoid any
contamination of the gold surface.

8. Experimental Section
238
8.5.2.2 Ag/AgCl Reference Electrode
For the preparation of an Ag/AgCl micro reference electrode, primary a solution
reservoir was prepared from a Pasteur pipette. Thereby the glass pipette was cut off at both
ends to the desired lengths of tip and reservoir. A ceramic frit (length: ~ 3 mm) was inserted
to the tip end, which was then melted by a gas torch, until the glass was firmly sealing the
frit. After polishing the tip with sandpaper until a contact with solution was facilitated at
both ends, the glass reservoir was completed. The Ag/AgCl electrode was prepared by first
curling an Ag wire to a spiral. Using a potential source (Voltcraft DC power supply) at an
electrochemical cell consisting of the Ag wire as working electrode (+) and a Pt wire as
counter electrode (-), AgCl was electroprecipitated on the Ag wire in an electrolyte solution
of 3 M KCl and 0.1 M HCl (5 V for 5 min followed by 10 V for 10 min).
Anode (+): 2�ê0 + 2h�� → 2�ê¢h� + 2��
Cathode (-): 2[�ª$ + 2�� → [] ↑ +2[]ª
Finally, the AgCl coated Ag wire was soldered to a de-insulated Cu wire and the soldering
part was protected by shrinking tubes. The Ag/AgCl electrode was then introduced into the
glass reservoir, which was filled with a 3 M KCl solution, and fixed with a shrinking tube (Ø =
4 mm) at the reservoir. Then the frit-containing tip was connected to a vacuum line, to fill
the frit with the 3 M KCl solution until a flow through the frit was enabled. The quality of the
fabricated reference electrode was finally tested by measuring the potential drift to a
standard Ag/AgCl reference electrode using a multimeter. The Ag/AgCl reference electrode
was permanently stored in 3 M KCl solution, when not in use.
In order to avoid contamination of the electrolyte solution with chloride ions, the
Ag/AgCl reference electrode was interconnected via a pre-vial (or a salt bridge, see below)
with the electrolyte solution. The pre-vial comprised a glass reservoir with a frit at the
bottom, which was constructed in an analogous manner to the glass reservoir of the RE and
filled with buffer solution (0.1 M NaClO4 and 2.5 mM NaH2PO4, pH 7.0). The potential drift of
the RE/pre-vial construction towards a standard Ag/AgCl RE was again checked with a
multimeter.
8.5.2.3 Salt Bridge
The salt bridge comprised a miniature U-shaped glass tube (formed from a Pasteur
pipette), which was filled with a concentrated, aqueous KNO3 solution, which was thickened
with Agar. The gel-like solution was produced by bringing 100 mL MilliporeTM water to a boil,

8. Experimental Section
239
dissolving 10.1 g KNO3 (0.1 mol) and, after removing the beaker from the heating plate,
adding 5 g Agar while stirring continuously. Subsequently, the hot gel-like solution was
introduced into the glass tube, making sure that no air bubbles are enclosed and an excess
of gel was present at both tube ends. The cool salt bridge was be straightly used and was
generally stored by dipping both ends of the U-shaped glass tube into a concentrated KNO3
solution.
8.5.3 Modification of Gold Surfaces
The primary surface modification of gold electrodes with thiol-tethered Fc(-Tz)-
PNA(•DNA) conjugates was performed by incubating the freshly prepared, bare gold
electrode surfaces (preparation according to 6.5.1) with buffered solutions of the respective
Fc(-Tz)-PNA(•DNA) species. Secondary modification with DNA oligomers or short chain
alkanethiols was performed by incubating the Fc(-Tz)-PNA(•DNA) preloaded gold surfaces
with the respective solutions (sequential mode of surface modification). The surface
modification of gold electrodes with a diameter of Ø = 2 mm was performed by covering the
gold surface of the straightened up electrode with 5 µL of the respective incubation solution.
Incubation of gold microelectrodes (Ø = 0.1 mm, 0.05 mm) was carried out by dip-coating.
Thereby the microelectrode is placed upside down into a 0.2 mL Eppendorf tube, which
contains 20 µL of the incubation solution, without touching the tube material with the gold
surface. Surface modifications at the chip-located microelectrodes (4 x 4) were performed by
spotting a rectangle of four microelectrodes with 2 µL of the incubation solution, thus
allowing four parallel and independent surface modifications per 4 x 4 chip.
During the incubation, the electrodes were placed into a with Parafilm® closely sealed
humid chamber to avoid evaporation of the solvent. The gold-electrodes (Ø = 2 mm) were
therefore covered with a 1 mL syringe tip and placed into a BD FalconTM tube, which
contained a moistened tissue paper, whereas the gold microelectrodes were placed with the
Eppendorf incubation vessel into a water-containing and sealed beaker onto an Eppendorf
carrier. The chip was placed into a Petri dish on a moistened filter paper as humid chamber.
Subsequent to each incubation step, the modified electrodes were first thoroughly rinsed
with MilliporeTM water (20 s), to remove excess of the reagent or loosely bound material, and
then electrochemically analyzed by SWV and CV, applying the standard parameters.

8. Experimental Section
240
8.5.3.1 Modification with a (Single) Fc(-Tz)-ssPNA Conjugate
For the immobilization process, Fc-ssPNA species were generally dissolved in 0.1 M PBS
(pH 7.4), whereas Fc-Tz-ssPNA species were dissolved in a 1:1 mixture of PBS (0.1 M, pH 7.4)
and ACN, due to a poorer solubility of the triazole-containing conjugates in aqueous
solutions. The immobilization process was performed by applying conditions A or B of Tab.
6-4, in order to adjust a high Fc(-Tz)-ssPNA surface concentration of Γ = 232.8 ±
25.3 pmol/cm2 (conditions A: c = 20 µM, 2 h, T = 37 °C) or a low ssPNA surface concentration
of Γ = 11.0 ± 1.1 pmol/cm2 (conditions B: c = 20 µM, 16 h, a.t.).
8.5.3.2 Modification with two Fc(-Tz)-ssPNA Conjugates
The double immobilization of two Fc(-Tz)-ssPNA conjugates was performed, by
incubating a freshly prepared bare gold-microelectrode (Ø = 0.1 mm, ρ = 1.5 – 2.0) with an
equimolar, 20 µM solution of the respective two PNA species (parallel mode of surface
modification) for 16 h at ambient temperature. The respective (individual) Fc(-Tz)-ssPNA
solutions were prepared as described in 8.5.3.1.
8.5.3.3 Modification with a Fc-PNA•DNA Duplex
The formation of the free diffusing Fc-PNA•DNA duplexes was performed by mixing
solutions of the single-stranded Fc-ssPNA conjugate with the respective single-stranded DNA
oligomer in a ratio of 1 : 1.01 (1 % excess of DNA to ensure that no single-stranded Fc-PNA
conjugate remains) to a final concentration of 20 µM in phosphate buffer (0.1 M NaH2PO4,
pH 7.4). This oligonucleotide solution was heated up to 70 °C for 5 min, to ensure complete
denaturation, and subsequently subjected to a temperature ramp driving from 70 °C to 4 °C
with a cooling rate of 0.5 °C/min. Thereby a quantitative annealing of the single strand to the
respective Fc-PNA•DNA duplex at the respective annealing temperature is ensured. The
resulting Fc-PNA•DNA duplex solutions were stored for ~ 1 h at 4 °C. Subsequently, a bare
gold electrode was incubated with this Fc-PNA•DNA solution, applying one of the condition
sets C or D of Tab. 6-4, in order to adjust a high (conditions D: c = 20 µM, 5 d, T = 4 °C) or a
low Fc-PNA•DNA surface concentration (conditions C: c = 20 µM, 16 h, a.t.).

8. Experimental Section
241
8.5.3.4 Sequential Modification with Short-Chain Alkanethiols
During this work, Fc(-Tz)-PNA(•DNA) modified gold surfaces were frequently co-modified
with a co-SAM of a short chain, hydroxyl terminated alkanethiol, in order to block all free
remaining adsorption sites of the modified gold surface. This co-immobilization was
predominantly performed with 6-mercaptohexan-1-ol (MCH). Asides MCH, the co-SAM
formation of the following alkanethiols was investigated: β-mercaptoethanol (MET), 11-
mercaptoundecan-1-ol (MUD) and 4-mercaptobutan-1-ol (MBU). The co-immobilization was
performed sequentially, by incubating the Fc(-Tz)-PNA(•DNA) modified gold electrodes with
a 1 mM solution of the respective alkanethiol in MilliporeTM water (MCH, MET, MBU) or abs.
ethanol (MUD) for 4 h at ambient temperature.
8.5.3.5 Hybridization with DNA Oligomers
The hybridization of a Fc(-Tz)-PNA single strand at a Fc(-Tz)-ssPNA or Fc(-Tz)-ssPNA/MCH
modified gold electrode with a fully-complementary or SNP DNA oligonucleotide, was
performed by incubating the Fc(-Tz)-ssPNA(/MCH) modified gold electrode with a 50 µM
solution of the respective DNA oligomer in 0.1 M PBS (pH 7.4) for 16 h at ambient
temperature.
8.5.3.6 Oxidative Desorption of Monolayers
The bare electrode surface was regenerated subsequent to any antedated surface
modification by the oxidative desorption of the respective monolayer at E = 0.5 V without
any mechanical polishing steps.292,293 Therefore, the modified electrode was subjected to CV
in 0.5 M sulfuric between of E = 0.0 – 1.7 V vs. Ag/AgCl (in 3 M KCl) at a scan rate of 0.1 Vs-1
until stable oxidation/reduction currents of the formed gold oxide proof a clean gold surface
(about 50 cycles). An intense increase in the charging current ic in CV performed in
electrolyte solution (0.1 M NaClO4, 2.5 mM NaH2PO4, pH 7.0) indicates the removal of the
SAM. After rinsing with MilliporeTM water, the regenerated bare gold electrodes can be
straight used for a further immobilization process.

8. Experimental Section
242
8.5.4 Anayltical Data of a P24•D1-Modified Gold Surface
8.5.4.1 RAIRS Analysis of a P24•D1-Modified Gold Surface
P24•D1/Au: RAIRS: ṽ [cm-1] = 2926.3 (νCH2; m), 2858.9 (νCH2; w), 1680.1 (νC=O (Amid-I); s),
1613.5 (νC=O (Amid-II); m), 1237.4 (νPO2-; w), 1078.6 (νPO2-; w).
8.5.4.2 ToF-SIMS Analysis of a P24•D1 Modified Gold Electrode
P24•D1/Au: Na12C272H334FeN119O113P12S (7537.89 g/mol): ToF-SIMS (pos): m/z ([%]) = 41.0
[NCNH]•+ (59.7), 55.1 (43.5), 69.1 [NCNCNH2]•+ (36.4), 81.1 (20.1), 91.1 (16.1), 109.1 (4.1),
122.12 [FeCp+H]+ (14.0), 132.9 [FeCpC+H]+ (100.0), 147.11 (3.3), 150.2 nucleobase [‘G’]•+
(20.2), 164.98 PNA monomer fragment [‘g’CH3]+ (5.6), 186.97 (1.6), 197.01 (3.0). ToF-SIMS
(neg): m/z ([%]) = 26.01 (100.0), 121.04 [FeCp]- (11.8), 126.9 nucleobase [‘T‘]-, (67.9), 134.1
nucleobase [A-H]- (3.9), 196.97 [FcC]- (64.7), 231.9 DNA-nucleoside: [‘A‘-H2O-H]- (2.8), 224.0
DNA-nucleoside: [‘T‘-H2O]- (21.5), 249.0 DNA-nucleoside: [‘G‘-H2O-H]-, [‘A‘-H]- (30.5), 255.0
[FcCONCH2CH2]-• (6.1), 305.2 DNA-nucleotide: [‘C‘-H]- (4.3), 420.0 (44.6), 520.9 DNA-dimer:
[‘A C‘-H2O-H]- (6.0), 590.9 DNA-dimer: [‘C T‘-H]- (11.2).
8.5.4.3 Determined ET Rate Constants k0 and transfer coefficients α
Tab. 8-6. ET rate constants k0 of Fc-PNA(•DNA)/(MCH) interfaces of P26 and P26•D3 – P26•D14.
No. Sequence SNP (nt)
PNA•DNA PNA•DNA/MCH
k0 /s-1*103 α
k0 /s-1*103 α
P26-Salm Fc – t c t a c a a g a c t c
Lys Ahx CysOH – 0.68 0.64 2.13 0.80
P26-Salm•D3 A G A T G T T C T G A G – 1.15 0.66 2.53 0.61
P26-Salm•D14 A G A T G T T C T G A A c/A (1) 1.22 0.64 2.40 0.61
P26-Salm•D13 A G A T G T T C T G C G t/C (2) 1.01 0.49 2.26 0.72
P26-Salm•D12 A G A T G T T C T A A G c/A (3) n.d. n.d.
P26-Salm•D11 A G A T G T T C C G A G a/C (4) 1.16 0.66 2.31 0.66
P26-Salm•D10 A G A T G T T A T G A G g/A (5) 1.12 0.62 1.93 0.90
P26-Salm•D9 A G A T G T C C T G A G a/C (6) 0.86 0.88 1.55 0.89
P26-Salm•D1 A G A T G C T C T G A G a/C (7) 1.02 0.69 2.02 0.82
P26-Salm•D8 A G A T A T T C T G A G c/A (8) 0.94 0.70 1.83 0.84
P26-Salm•D7 A G A C G T T C T G A G a/C (9) 0.87 0.75 2.18 0.88
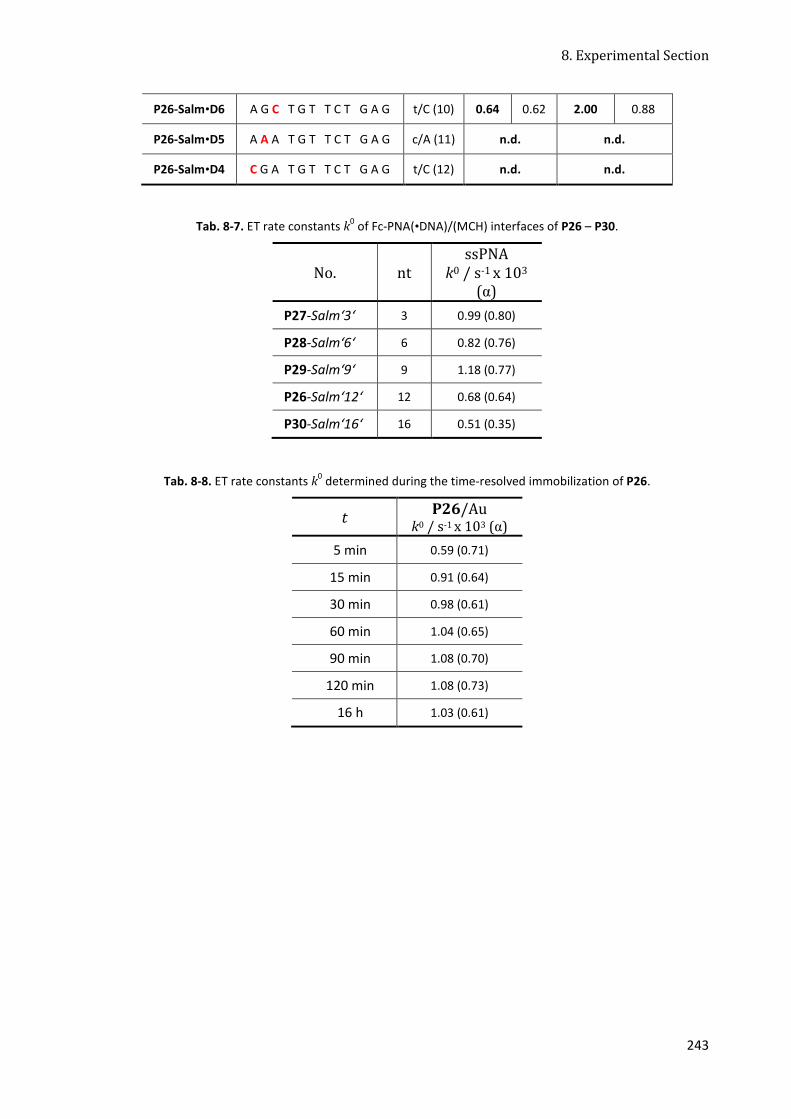
8. Experimental Section
243
P26-Salm•D6 A G C T G T T C T G A G t/C (10) 0.64 0.62 2.00 0.88
P26-Salm•D5 A A A T G T T C T G A G c/A (11) n.d. n.d.
P26-Salm•D4 C G A T G T T C T G A G t/C (12) n.d. n.d.
Tab. 8-7. ET rate constants k0 of Fc-PNA(•DNA)/(MCH) interfaces of P26 – P30.
No. nt ssPNA
k0 / s-1 x 10³
(α)
P27-Salm‘3‘ 3 0.99 (0.80)
P28-Salm‘6‘ 6 0.82 (0.76)
P29-Salm‘9‘ 9 1.18 (0.77)
P26-Salm‘12‘ 12 0.68 (0.64)
P30-Salm‘16‘ 16 0.51 (0.35)
Tab. 8-8. ET rate constants k0 determined during the time-resolved immobilization of P26.
t P26/Au k0 / s-1 x 10³ (α)
5 min 0.59 (0.71)
15 min 0.91 (0.64)
30 min 0.98 (0.61)
60 min 1.04 (0.65)
90 min 1.08 (0.70)
120 min 1.08 (0.73)
16 h 1.03 (0.61)

9. References
244
9. References
1. IUPAC-IUB, Nomenclature and Symbolism for Amino Acids and Peptides, http://www.chem.qmul.ac.uk/iupac/AminoAcid/, accessed: 11/10/2010.
2. B. D. Malhotra, A. Chaube, Sens. Actuators B 2003, 91, 117. 3. A. Brouwers, D. Bernard, M. Langlois, Point of Care 2005, 4, 36. 4. R. Eden-Firstenberg, B. J. Schaertel, J. Food Protect. 1988, 51, 811. 5. M. Maseini, Pure Appl. Chem. 2001, 73, 23. 6. F. M. Burkle, Prehosp. Disast. Med. 2003, 18, 258. 7. J. Wang, Nucl. Acids Res. 2000, 28, 3011. 8. B. Strehlitz, N. Nikolaus, R. Stoltenburg, Sensors 2008, 8, 4296. 9. L. Bousse, Sens. Actuators B 1996, 34, 270. 10. J. Wang, Analytical Electrochemistry, Wiley-VCH, New York, USA, 2001. 11. J. H. Watterson, S. Raha, C. C. Kotoris, C. C. Wust, F. Gharabaghi, S. C. Jantzi, N. K.
Haynes, N. H. Gendron, U. J. Krull, A. E. Mackenzie, P. A. E. Piunno, Nucl. Acids Res. 2004, 32, e18/1.
12. I. Willner, F. Patolsky, Y. Weizmann, B. Willner, Talanta 2002, 56, 847. 13. D. Dell'Atti, M. Zavaglia, S. Tombelli, G. Bertacca, A. O. Cavazzana, G. Bevilacqua, M.
Minunni, M. Mascini, Clin. Chim. Acta 2007, 383, 140. 14. M. Stobiecka, J. M. Cieśla, B. Janowska, B. Tudek, H. Radecka, Sensors 2007, 1462. 15. T. T. Goodrich, H. J. Lee, R. M. Corn, Anal. Chem. 2004, 76, 6173. 16. T. Jiang, M. Minunni, P. Wilson, J. Zhang, A. Turner, M. Mascini, Biosens.
Bioelectron. 2005, 20, 1939. 17. A. K. Sinensky, A. M. Belcher, Nat. nanotechnol. 2007, 2, 653. 18. B. Danielsson, J. Biotechnol. 1990, 15, 187. 19. B. Xie, B. Danielsson, F. Winquist, Sens. Actuators B 1993, 15-16, 443. 20. Ó. A. Loaiza, S. Campuzano, M. Pedrero, M. I. Pividori, P. García, J. M. Pingarrón,
Anal. Chem. 2008, 80, 8239. 21. X. Zhu, K. Han, G. Li, Anal. Chem. 2006, 78, 2447. 22. S. Cagnin, M. Caraballo, C. Guiducci, P. Martini, M. Ross, M. SantaAna, D. Danley, T.
West, G. Lanfranchi, Sensors 2009, 9, 3122. 23. www.affymetrix.com, accessed: 11/10/2010.
24. www.genomics.agilent.com, accessed: 11/10/2010.
25. K. J. Odenthal, J. J. Gooding, Analyst 2007, 132, 603. 26. M. Mir, A. Homs, J. Samitier, Electrophoresis 2009, 30, 3386. 27. G. F. Bickerstaff, Methods Biotechnol. 1997, 1, 1. 28. M. Kind, C. Woell, Chem. Unserer Zeit 2008, 42, 128. 29. D. Ozkan, A. Erdem, P. Kara, K. Kerman, J. J. Gooding, P. E. Nielsen, M. Ozsoz,
Electrochem. Commun. 2002, 796. 30. Q. Wang, H. Moriyama, Langmuir 2009, 25, 10834. 31. S.-Y. Oh, Y.-J. Yun, D.-Y. Kim, S.-H. Han, Langmuir 1999, 15, 4690.

9. References
245
32. J. J. Hickman, C. F. Zou, D. Ofer, P. D. Harvey, M. S. Wrighton, P. E. Laibinis, C. D. Bain, G. M. Whitesides, J. Am. Chem. Soc. 1989, 111, 7271.
33. S. Brandriss, S. Margel, Langmuir 1993, 9, 1232. 34. L. H. Dubois, R. G. Nuzzo, Annu. Rev. Phys. Chem. 1992, 43, 437. 35. A. Ulman, Chem. Rev. 1996, 96, 1533. 36. C. D. Bain, E. B. Troughton, Y. T. Tao, J. Evall, G. M. Whitesides, R. G. Nuzzo, J. Am.
Chem. Soc. 1989, 111, 321. 37. C. D. Bain, J. Evall, G. M. Whitesides, J. Am. Chem. Soc. 1989, 111, 7155. 38. C. D. Bain, G. M. Whitesides, J. Am. Chem. Soc. 1989, 111, 7164. 39. A. P. Henderson, L. N. Seetohul, A. K. Dean, P. Russell, S. Pruneanu, Z. Ali, Langmuir
2009, 25, 931. 40. A. Caviani Pease, D. Solas, E. J. Sullivan, M. T. Cronin, C. P. Holmes, S. P. A. Fodor,
Proc. Natl. Acad. Sci. USA 1994, 91, 5022. 41. E. Paleček, F. Jelen, Crit. Rev. Anal. Chem. 2002, 32, 261. 42. T. G. Drummond, M. G. Hill, J. K. Barton, Nat. Biotechnol. 2003, 21, 1192. 43. M. L. Pedano, G. A. Rivas, Sensors 2005, 5, 424. 44. C. A. M. Seidel, A. Schulz, M. H. M. Sauer, J. Phys. Chem. 1996, 100, 5541. 45. E. Paleček, Electroanalysis 1996, 8, 7. 46. K. Kerman, D. Ozkan, P. Kara, B. Meric, J. J. Gooding, M. Ozsoz, Anal. Chim. Acta
2002, 462, 39. 47. A. A. Gorodetsky, W. J. Hammond, M. G. Hill, K. Slowinski, J. K. Barton, Langmuir
2008, 24, 14282. 48. Y. Xiao, X. Qu, K. W. Plaxco, A. J. Heeger, J. Am. Chem. Soc. 2007, 129, 11896. 49. C. Fan, K. W. Plaxco, A. J. Heeger, Proc. Natl. Acad. Sci. USA 2003, 100, 9134. 50. M. Inouye, R. Ikeda, M. Takase, T. Tsuri, J. Chiba, Proc. Natl. Acad. Sci. USA 2005,
102, 11606. 51. R. Ikeda, S. Kitagawa, J. Chiba, M. Inouye, Chem. Eur. J. 2009, 15, 7048. 52. R. Ikeda, A. Akaishi, J. Chiba, M. Inouye, ChemBioChem 2007, 8, 2219. 53. R. Ikeda, S. Kobayashi, J. Chiba, M. Inouye, Chem. Eur. J. 2009, 15, 4822. 54. C. Tansil Natalia, H. Xie, F. Xie, Z. Gao, Anal. Chem. 2005, 77, 126. 55. S. Takenaka, Y. Uto, M. Takagi, H. Kondo, Chem. Lett. 1998, 989. 56. F. Patolsky, A. Lichtenstein, I. Willner, Nat. Biotechnol. 2001, 19, 253. 57. E. M. Boon, D. M. Ceres, T. G. Drummond, M. G. Hill, J. K. Barton, Nat. Biotechnol.
2000, 18, 1096. 58. E. M. Boon, J. K. Barton, V. Bhagat, M. Nersissian, W. Wang, M. G. Hill, Langmuir
2003, 19, 9255. 59. Y. Xu, H. Cai, P.-G. He, Y.-Z. Fang, Electroanalysis 2004, 16, 150. 60. M. Gębala, L. Stoica, S. Neugebauer, W. Schuhmann, Electroanalysis 2009, 21, 325. 61. Y. Wang, C. Li, X. Li, Y. Li, H.-B. Kraatz, Anal. Chem. 2008, 80, 2255. 62. Y.-T. Long, C.-Z. Li, T. C. Sutherland, H.-B. Kraatz, J. S. Lee, Anal. Chem. 2004, 76,
4059. 63. X. Li, J. S. Lee, H.-B. Kraatz, Anal. Chem. 2006, 78, 6096.

9. References
246
64. F. Turcu, A. Schulte, G. Hartwich, W. Schuhmann, Biosens. Bioelectron. 2004, 20, 925.
65. F. Turcu, A. Schulte, G. Hartwich, W. Schuhmann, Angew. Chem., Int. Ed. 2004, 43, 3482.
66. P. M. Diakowski, H.-B. Kraatz, Chem. Commun. 2009, 1189. 67. A. Anne, C. Demaille, J. Am. Chem. Soc. 2008, 130, 9812. 68. M. Bixon, B. Giese, S. Wessely, T. Langenbacher, M. E. Michel-Beyerle, J. Jortner,
Proc. Natl. Acad. Sci. USA 1999, 96, 11713. 69. S. Delaney, J. K. Barton, J. Org. Chem. 2003, 68, 6475. 70. J. Jortner, M. Bixon, M. E. Langenbacher, M. E. Michel-Beyerle, Proc. Natl. Acad. Sci.
USA 1998, 95, 12759. 71. D. N. Beratan, S. Priyadarshy, S. M. Risser, Chem. Biol. 1997, 4, 3. 72. M. W. Grinstaff, Angew. Chem., Int. Ed. 1999, 111, 24. 73. H.-A. Wagenknecht, Chem. Unserer Zeit 2002, 5, 318. 74. T. Liu, J. K. Barton, J. Am. Chem. Soc. 2005, 127, 10160. 75. D. I. Spivey, Trans. Faraday Soc. 1962, 58, 411. 76. A. S. Györgi, Proc. Natl. Acad. Sci. USA 1960, 46, 1444. 77. M. E. Núñez, J. K. Barton, Curr. Opi. Struct. Biol. 2000, 4, 199. 78. B. Giese, Annu. Rev. Biochem. 2002, 71, 51. 79. G. B. Schuster, Acc. Chem. Res. 2000, 33, 253. 80. S. O. Kelley, J. K. Barton, Bioconjugate Chem. 1997, 8, 31. 81. S. O. Kelley, N. M. Jackson, M. G. Hill, J. K. Barton, Angew. Chem., Int. Ed. 1999, 38,
941. 82. N. Edirisinghe, V. Apalkov, J. Berashevich, T. Chakraborty, Nanotechnol. 2010, 21,
245101. 83. B. Giese, M. Spichty, ChemPhysChem 2000, 1, 195. 84. A. Paul, R. M. Watson, P. Lund, Y. Xing, K. Burke, Y. He, E. Borguet, C. Achim, D. H.
Waldeck, J. Phys. Chem. C 2008, 112, 7233. 85. A. Paul, R. M. Watson, E. Wierzbinski, K. L. Davis, A. Sha, C. Achim, D. H. Waldeck, J.
Phys. Chem. B 2009, DOI: 10.1021/jp906910h. 86. A. Paul, S. Bezer, R. Venkatramani, L. Kocsis, E. Wierzbinski, A. Balaeff, S. Keinan,
D. N. Beratan, C. Achim, D. H. Waldeck, J. Am. Chem. Soc. 2009, 131, 6498. 87. A. Anne, A. Bouchardon, J. Moiroux, J. Am. Chem. Soc. 2003, 125, 1112. 88. A. Anne, C. Demaille, J. Am. Chem. Soc. 2006, 128, 542. 89. R. Y. Lai, D. S. Seferos, A. J. Heeger, G. C. Bazan, K. W. Plaxco, Langmuir 2006, 22,
10796. 90. H. Aoki, H. Tao, Analyst 2007, 132, 784. 91. P. E. Nielsen, M. Egholm, R. H. Berg, O. Buchardt, Science 1991, 254, 1497. 92. M. Egholm, O. Buchardt, P. E. Nielsen, R. H. Berg, J. Am. Chem. Soc. 1992, 114,
1895. 93. K. L. Dueholm, M. Egholm, C. Behrens, L. Christensen, H. F. Hansen, T. Vulpius, K.
H. Petersen, R. H. Berg, P. E. Nielsen, O. Buchardt, J. Org. Chem. 1994, 59, 5767. 94. R. B. Merrifield, J. Am. Chem. Soc. 1963, 85, 2149.

9. References
247
95. M. Egholm, O. Buchardt, L. Christensen, C. Behrens, S. M. Freier, D. A. Driver, R. H. Berg, S. K. Kim, B. Norden, P. E. Nielsen, Nature 1993, 365, 566.
96. P. Wittung, P. E. Nielsen, O. Buchardt, E. M., B. Norden, Nature 1994, 368, 561. 97. M. Eriksson, Nucleos., Nucleot., Nucleic Acids 1997, 16, 617. 98. M. Leijon, A. Graslund, P. E. Nielsen, O. Buchardt, B. Norden, S. M. Kristensen, M.
Eriksson, Biochemistry 1994, 33, 9820. 99. J. S. Kastrup, M. Pilgaard, F. S. Jørgensen, P. E. Nielsen, H. Rasmussen, FEBS Lett.
1995, 363, 115. 100. P. E. Nielsen, G. Haaima, Chem. Soc. Rev. 1997, 73. 101. L. Betts, J. A. Josey, J. M. Veal, S. R. Jordan, Science 1995, 270, 1838. 102. H. Rasmussen, J. S. Kastrup, J. N. Nielsen, J. M. Nielsen, P. E. Nielsen, Nat. Struct.
Biol. 1997, 4, 98. 103. T. Ratilainen, A. Holmén, E. Tuite, G. Haaima, L. Christensen, P. E. Nielsen, B.
Nordén, Biochemistry 1998, 37, 12331. 104. B. Datta, B. A. Armitage, J Am Chem Soc 2001, 123, 9612. 105. J. Lohse, O. Dahl, P. E. Nielsen, Proc. Natl. Acad. Sci. USA 1999, 96, 11804. 106. K. K. Jensen, H. Ørum, P. E. Nielsen, B. Nordén, Biochemistry 1997, 36, 5072. 107. S. K. Kim, P. E. Nielsen, M. Egholm, O. Buchardt, R. H. Berg, B. Norden, J. Am. Chem.
Soc. 1993, 115, 6477. 108. H. Knudsen, P. E. Nielsen, Nucl. Acids Res. 1996, 24, 494. 109. G. L. Igloi, Proc. Natl. Acad. Sci. USA 1998, 95, 8562. 110. T. Ratilainen, A. Holmén, E. Tuite, P. E. Nielsen, B. Nordén, Biochemistry 2000, 39,
7781. 111. P. E. Nielsen, M. Egholm, Peptide Nucleic Acids - Protocols and Applications,
Horizon Scientific Press, 1999. 112. V. V. Demidov, V. N. Potaman, M. D. Frank-Kamenetskii, M. Egholm, O. Buchardt, S.
H. Sönnichsen, P. E. Nielsen, Biochem. Pharmacol. 1994, 48, 1310. 113. G. Wang, X. S. Xu, Cell Res. 2004, 14, 111. 114. U. Soomets, M. Hällbrink, Ü. Langel, Front. Bioscience 1999, 4, d782. 115. L. C. Boffa, E. M. Carpaneto, B. Granelli, M. R. Mariani, Gene Ther. Mol. Biol. 2000, 5,
47. 116. L. Good, P. E. Nielsen, Antisense Nucleic Acid Drug Dev. 1997, 7, 431. 117. J. Wang, E. Paleček, P. E. Nielsen, G. Rivas, X. Cai, H. Shiraishi, N. Dontha, D. Luo, P.
A. M. Farias, J. Am. Chem. Soc. 1996, 118, 7667. 118. J. Wang, Biosens. Bioelectron. 1998, 13, 757. 119. H. Ørum, Curr. Issues Mol. Biol. 2000, 2, 27. 120. H. Ørum, P. E. Nielsen, M. Egholm, R. H. Berg, O. Buchardt, C. Stanley, Nucl. Acids
Res. 1993, 21, 5332. 121. J. A. Schellman, Biopolymers 1974, 13, 217. 122. IUPAC, Compendium of Chemical Terminology, 1997. 123. S. B. Smith, Y. Cui, C. Bustamante, Science 1996, 271, 795. 124. C. G. Baumann, S. B. Smith, V. A. Bloomfield, C. Bustamante, Proc. Natl. Acad. Sci.
USA 1997, 94, 6185.

9. References
248
125. P. Gutjahr, R. Lipowsky, J. Kierfeld, Europhys. Lett. 2006, 76, 994. 126. S. Sen, L. Nilsson, J. Am. Chem. Soc. 1998, 120, 619. 127. S. Sen, L. Nilsson, J. Am. Chem. Soc. 2001, 123, 7414. 128. E. Hatcher, A. Balaeff, S. Keinan, R. Venkatramani, D. N. Beratan, J. Am. Chem. Soc.
2008, 130, 11752. 129. B. Petersson, B. B. Nielsen, H. Rasmussen, I. Kjøller Larsen, M. Gajhede, P. E.
Nielsen, J. S. Kastrup, J. Am. Chem. Soc. 2005, 127, 1424. 130. J. L. Gerton, P. O. Brown, J. Biol. Chem. 1997, 272, 25809. 131. N. Peyret, P. A. Seneviratne, H. T. Allawi, J. SantaLucia, Jr., Biochemistry 1999, 38,
3468. 132. B. P. Scottoline, S. Chow, V. Ellison, P. O. Brown, Genes Dev. 1997, 11, 371. 133. A. Engelman, K. Mizuuchi, R. Craigie, Cell 1991, 67, 1211. 134. L. P. M. Orbons, G. A. van der Marel, J. H. van Boom, C. Altona, Eur. J. Biochem.
1987, 170, 225. 135. Z. Wang, N. He, S. Li, J. Nanosci. Nanotechnol. 2009, 9, 6465. 136. K. A. Schallhorn, K. O. Freedman, J. M. Moore, J. Lin, P. C. Ke, Appl. Phys. Lett. 2005,
87, 1. 137. L. Barisic, M. Cakic, K. A. Mahmoud, Y.-n. Liu, H.-B. Kraatz, H. Pritzkow, S. I. Kirin,
N. Metzler-Nolte, V. Rapic, Chem. Eur. J. 2006, 12, 4965. 138. M. S. Robillard, A. R. P. M. Valentijn, N. J. Meeuwenoord, G. A. Van der Marel, J. H.
Van Boom, J. Reedijk, Angew. Chem., Int. Ed. 2000, 39, 3096. 139. M. S. Robillard, S. van Alphen, N. J. Meeuwenoord, B. A. J. Jansen, G. A. van der
Marel, J. H. van Boom, J. Reedijk, New J. Chem. 2005, 29, 220. 140. E. Meggers, Chem. Commun. 2009, 1001. 141. S. Gencaslan, W. S. Sheldrick, Eur. J. Inorg. Chem. 2005, 3840. 142. J. C. Braman, H. Huang, (Stratagene, USA). Application: WO, 2002, p. 88 pp. 143. M. J. Adam, C. L. Fisher, S. R. Bayly, C. Orvig, N. C. Lim, T. J. Storr, C. B. Ewart,
(TRIUMF, Can.). Application: US, 2006, p. 27 pp. 144. B. K. Singh, R. K. Sharma, B. S. Garg, Spectrochimi. Acta A 2006, 63, 96. 145. M. Cais, S. Dani, Y. Eden, O. Gandolfi, M. Horn, E. E. Isaacs, Y. Josephy, Y. Saar, E.
Slovin, L. Snarsky, Nature 1977, 270, 535. 146. M. Cais, E. Slovin, L. Snarsky, J. Organomet. Chem. 1978, 160, 223. 147. N. J. Forrow, N. C. Foulds, J. E. Frew, J. T. Law, Bioconjugate Chem. 2004, 15, 137. 148. M. Salmain, A. Vessières, P. Brossier, I. S. Butler, G. Jaouen, J. Immunol. Methods
1992, 148, 65. 149. A. Vessières, M. Salmain, P. Brossier, G. Jaouen, J. Pharm. Biomed. Anal. 1999, 21,
625. 150. G. Guillena, G. Rodriguez, M. Albrecht, G. van Koten, Chem. Eur. J. 2002, 8, 5368. 151. G. Guillena, M. Halkes Koen, G. Rodriguez, D. Batema Guido, G. van Koten, P.
Kamerling Johannis, Org. Lett. 2003, 5, 2021. 152. N. Metzler-Nolte, in Bioorganometallics, ed. G. Jaouen, Wiley-VCh, Weinheim,
2006, pp. 125-179.

9. References
249
153. J. C. Verheijen, G. A. van der Marel, J. H. van Boom, N. Metzler-Nolte, Bioconjugate
Chem. 2000, 11, 741. 154. A. Hess, N. Metzler-Nolte, Chem. Commun. 1999, 885. 155. J. C. Hoogvliet, M. Dijksma, B. Kamp, W. P. Van Bennekom, Anal. Chem. 2000, 72,
2016. 156. C. Baldoli, E. Licandro, S. Maiorana, D. Resemini, C. Rigamonti, L. Falciola, M.
Longhi, P. R. Mussini, J. Electroanal. Chem. 2005, 585, 197. 157. C. Baldoli, L. Falciola, E. Licandro, S. Maiorana, P. Mussini, P. Ramani, C.
Rigamonti, G. Zinzalla, J. Organomet. Chem. 2006, 691, 539. 158. G. Gasser, M. J. Belousoff, A. M. Bond, L. Spiccia, J. Org. Chem. 2006, 71, 7565. 159. G. Gasser, L. Spiccia, J. Org. Chem. 2008, 693, 2478. 160. C. Baldoli, C. Rigamonti, S. Maiorana, E. Licandro, L. Falciola, P. R. Mussini, Chem.
Eur. J. 2006, 12, 4091. 161. C. Baldoli, S. Maiorana, E. Licandro, G. Zinzalla, D. Perdicchia, Org. Lett. 2002, 4,
4341. 162. S. Maiorana, E. Licandro, D. Perdicchia, C. Baldoli, B. Vandoni, C. Giannini, M.
Salmain, J. Mol. Cat. A 2003, 204-205, 165. 163. C. Baldoli, P. Cerea, C. Giannini, E. Licandro, C. Rigamonti, S. Maiorana, Synlett
2005, 1984. 164. C. Baldoli, L. Falciola, E. Licandro, S. Maiorana, P. Mussini, P. Ramani, C.
Rigamonti, G. Zinzalla, J. Organomet. Chem. 2004, 689, 4791. 165. C. Xavier, C. Giannini, L. Gano, S. Maiorana, R. Alberto, I. Santos, J. Biol. Inorg.
Chem. 2008, 13, 1335. 166. R. Huisgen, Angew. Chem. 1963, 75, 604. 167. H. C. Kolb, M. G. Finn, K. B. Sharpless, Angew. Chem. Int. Ed. 2001, 40, 2004. 168. V. V. Rostovtsev, L. G. Green, V. V. Fokin, K. B. Sharpless, Angew. Chem. Int. Ed.
2002, 41, 2596. 169. Q. Wang, T. R. Chan, R. Hilgraf, V. V. Fokin, K. B. Sharpless, M. G. Finn, J. Am. Chem.
Soc. 2003, 125, 3192. 170. L. Jierry, N. Ben Ameur, J.-S. Thomann, B. Frisch, E. Gonthier, J.-C. Voegel, B.
Senger, G. Decher, O. Felix, P. Schaaf, P. Mesini, F. Boulmedais, Macromolecules 2010, 43, 3994.
171. F. Himo, T. Lovell, R. Hilgraf, V. V. Rostovtsev, L. Noodleman, K. B. Sharpless, V. V. Fokin, J. Am. Chem. Soc. 2005, 127, 210.
172. R. Sustmann, Pure Appl. Chem. 1974, 40, 569. 173. J.-F. Lutz, Angew. Chem., Int. Ed. 2008, 47, 2182. 174. J. M. Baskin, J. A. Prescher, S. T. Laughlin, N. J. Agard, P. V. Chang, I. A. Miller, A. Lo,
J. A. Codelli, C. R. Bertozzi, Proc. Natl. Acad. Sci. USA 2007, 104, 16793. 175. N. J. Agard, J. A. Prescher, C. R. Bertozzi, J. Am. Chem. Soc. 2004, 126, 15046. 176. N. J. Agard, J. M. Baskin, J. A. Prescher, A. Lo, C. R. Bertozzi, ACS Chem. Biol. 2006,
1, 644. 177. X. Ning, J. Guo, M. A. Wolfert, G.-J. Boons, Angew. Chem., Int. Ed. 2008, 47, 2253. 178. C. Glaser, Ber. Dtsch. Chem. Ges. 1869, 2, 422.

9. References
250
179. F. Straus, Justus Liebigs Ann. Chem. 1905, 342, 190. 180. P. Siemsen, R. C. Livingston, F. Diederich, Angew. Chem., Int. Ed. 2000, 39, 2632. 181. C. J. Burrows, J. G. Muller, Chem. Rev. 1998, 98, 1109. 182. S. T. Laughlin, J. M. Baskin, S. L. Amacher, C. R. Bertozzi, Science 2008, 320, 664. 183. P. M. E. Gramlich, C. T. Wirges, A. Manetto, T. Carell, Angew. Chem. Int. Ed. 2008,
47, 8350. 184. P. M. E. Gramlich, S. Warncke, J. Gierlich, T. Carell, Angew. Chem. Int. Ed. 2008, 47,
3442. 185. J. Gierlich, G. A. Burley, P. M. E. Gramlich, D. M. Hammond, T. Carell, Org. Lett.
2006, 8, 3639. 186. K. E. Beatty, F. Xie, Q. Wang, D. A. Tirrell, J. Am. Chem. Soc. 2005, 127, 14150. 187. A. J. Link, M. K. S. Vink, D. A. Tirrell, J. Am. Chem. Soc. 2004, 126, 10598. 188. A. J. Link, D. A. Tirrell, J. Am. Chem. Soc. 2003, 125, 11164. 189. T. L. Mindt, H. Struthers, L. Brans, T. Anguelov, C. Schweinsberg, V. Maes, D.
Tourwé, R. Schibli, J. Am. Chem. Soc. 2006, 128, 15096. 190. T. L. Mindt, H. Struthers, E. García-Garayoa, D. Desbouis, R. Schibli, Chimia 2007,
61, 725. 191. R. A. Turner, A. G. Oliver, R. S. Lokey, Org. Lett. 2007, 9, 5011. 192. E. Mateo-Martí, C. Briones, C. M. Pradier, J. A. Martín-Gago, Biosens. Bioelectron.
2007, 22, 1926. 193. C. Briones, E. Mateo-Marti, C. Gomez-Navarro, V. Parro, E. Roman, J. A. Martin-
Gago, Phys. Rev. Lett. 2004, 93, 208101. 194. J. Wang, P. E. Nielsen, M. Jiang, X. Cai, J. R. Fernandes, D. H. Grant, M. Ozsoz, A.
Beglieter, M. Mowat, Anal. Chem. 1997, 69, 5200. 195. G. Prencipe, S. Maiorana, P. Verderio, M. Colombo, P. Fermo, E. Caneva, D.
Prosperi, E. Licandro, Chem. Commun. 2009, 6017. 196. G. Jagerszki, R. E. Gyurcsanyi, L. Hoefler, E. Pretsch, Nano Lett. 2007, 7, 1609. 197. R. Kanjanawarut, X. Su, Anal. Chem. 2009, 81, 6122. 198. X. Su, R. Kanjanawarut, ACS Nano 2009, 3, 2751. 199. H. Aoki, Y. Umezawa, Analyst 2003, 128, 681. 200. H. Aoki, Y. Umezawa, Electroanalysis 2002, 14, 1405. 201. H. Aoki, P. Buhlmann, Y. Umezawa, Electroanalysis 2000, 12, 1272. 202. M. Steichen, Y. Decrem, E. Godfroid, C. Buess-Herman, Biosens. Bioelectron. 2007,
22, 2237. 203. J. Liu, S. Tian, P. E. Nielsen, W. Knoll, Chem. Commun. 2005, 2969. 204. T. H. Degefa, J. Kwak, J. Electroanal. Chem. 2008, 612, 37. 205. S. D. Keighley, P. Estrela, P. Li, P. Migliorato, Biosens. Bioelectron. 2008, 24, 906. 206. C. Li, X. Li, X. Liu, H.-B. Kraatz, Anal. Chem. 2010, 82, 1166. 207. L. Gao, C. Li, X. Li, H.-B. Kraatz, Chem. Commun. 2010, 46, 6344. 208. A. Maurer, H.-B. Kraatz, N. Metzler-Nolte, Eur. J. Inorg. Chem. 2005, 3207. 209. E. Paleček, M. Trefulka, M. Fojta, Electrochem. Commun. 2009, 11, 359. 210. X. Luo, T. Ming-Hung Lee, I. M. Hsing, Anal. Chem. 2008, 80, 7341. 211. H. Aoki, H. Tao, Anal. Sci. 2008, 24, 929.

9. References
251
212. D. Ozkan, P. Kara, K. Kerman, B. Meric, A. Erdem, F. Jelen, P. E. Nielsen, M. Ozsoz, Bioelectrochem. 2002, 58, 119.
213. K. Hashimoto, Y. Ishimori, Lap on a Chip 2001, 1, 61. 214. M. S. Hejazi, M. H. Pournaghi-Azar, F. Ahour, Anal. Biochem. 2010, 399, 118. 215. F. Le Floch, H.-A. Ho, P. Harding-Lepage, M. Bédard, R. Neagu-Plesu, M. Leclerc,
Adv. Mater. 2005, 17, 1251. 216. F. R. Raymond, H.-A. Ho, R. Peytavi, L. Bissonnette, M. Boissinot, F. J. Picard, M.
Leclerc, M. G. Bergeron, BMC Biotechnol. 2005, 5, doi:10.1186/1472-6750-5-10. 217. S. Gaylord Brent, J. Heeger Alan, C. Bazan Guillermo, Proc. Natl. Acad. Sci. USA
2002, 99, 10954. 218. E. S. Baker, J. W. Hong, B. S. Gaylord, G. C. Bazan, M. T. Bowers, J. Am. Chem. Soc.
2006, 128, 8484. 219. O. Brosch, T. Weyhermüller, N. Metzler-Nolte, Eur. J. Inorg. Chem. 2000, 323. 220. U. Hoffmanns, N. Metzler-Nolte, Bioconjugate Chem. 2006, 17, 204. 221. C. R. Bertozzi, J. A. Prescher, Nat. Chem. Biol. 2005, 1, 13. 222. E. R. Biehl, P. C. Reeves, Synthesis 1973, 360. 223. U. Hoffmanns, Dissertation, Ruperto-Carola University, Heidelberg, Germany,
2005, pp. 1-183. 224. S. D. Köster, Unpublished Dissertation, Ruhr-University Bochum, Bochum,
Germany, 2010. 225. Y. N. Sheinker, L. B. Senyavina, V. N. Zheltova, Dokl. Akad. Nauk SSSR 1965, 160,
1339. 226. J. M. Casas-Solvas, A. Vargas-Berenguel, L. F. Capitán-Vallvey, F. Santoyo-
González, Org. Lett. 2004, 6, 3687. 227. Z. Dori, R. F. Ziolo, Chem. Rev. 1973, 73, 247. 228. J. Lapić, G. Pavlović, D. Siebler, K. Heinze, V. Rapić, Organometallics 2008, 27, 726. 229. K. Sonogashira, Y. Tohda, N. Hagihara, Tet. Lett. 1975, 4467. 230. E.-I. Negishi, L. Anastasia, Chem. Rev. 2003, 103, 1979. 231. T. Kersebohm, S. I. Kirin, N. Metzler-Nolte, Bioorg. Med. Chem. Lett. 2006, 16,
2964. 232. Z. Timar, L. Kovacs, G. Kovacs, Z. Schmel, J. Chem. Soc., Perkin Trans. 1 2000, 19. 233. S. A. Thomson, J. A. Josey, R. Cadilla, M. D. Gaul, C. F. Hassman, M. J. Luzzio, A. J.
Pipe, K. L. Reed, D. J. Ricca, R. W. Wiethe, S. A. Noble, Tetrahedron 1995, 51, 6179. 234. T. Kersebohm, Dissertation, Ruperto-Carola University of Heidelberg, Heidelberg,
Germany, 2005, pp. 1-252. 235. W. G. Schneider, H. Spiesecke, J . Chem. Phys. 1961, 35, 722. 236. A. C. Neto, L. C. Ducati, R. Rittner, C. F. Tormena, R. H. Contreras, G. Frenking, J.
Chem. Theory Comput. 2009, 5, 2222. 237. S. M. Chen, V. Mohan, J. S. Kiely, M. C. Griffith, R. H. Griffey, Tetrahedron Lett. 1994,
35, 5105. 238. J. A. Marsden, M. M. Haley, in Metal-catalyzed cross-coupling reactions 1, eds. A. de
Meijere, F. Diederich, Wiley-VCH, Weinheim, 2004, pp. 317-394. 239. R. H. E. Hudson, G. Li, J. Tse, Tet. Lett. 2002, 43, 1381.

9. References
252
240. S. G. Alvarez, M. T. Alvarez, Synthesis 1997, 413. 241. E. Kaiser, R. L. Colescott, C. D. Bossinger, P. I. Cook, Anal. Biochem. 1970, 34, 595. 242. E. Lieber, C. N. R. Rao, T. S. Chao, C. W. W. Hoffman, Anal. Chem. 1957, 29, 916. 243. C. W. Tornoe, C. Christensen, M. Meldal, J. Org. Chem. 2002, 67, 3057. 244. M. Eriksson, P. E. Nielsen, Q. Rev. Biophys. 1996, 29, 369. 245. R. Prins, A. R. Korswagen, A. G. T. G. Kortbeek, J. Organomet. Chem. 1972, 39, 335. 246. J. P. Hurvois, C. Moinet, J. Organomet. Chem. 2005, 690, 1829. 247. L. Christensen, R. Fitzpatrick, B. Gildea, K. H. Petersen, H. F. Hansen, T. Koch, M.
Egholm, O. Buchardt, P. E. Nielsen, J. Coull, J. Pept. Sci. 1995, 1, 175. 248. R. P. Inc., www.rapp-polymere.com, accessed: 11/10/2010.
249. A. Speicher, T. Klaus, T. Eicher, J. prakt. Chem. 1998, 340, 581. 250. D. R. Corey, Trends Biotechnol. 1997, 15, 224. 251. E. Cassano, M. Macchia, M. Hamdan, P. Rovera, Lett. Pept. Sci. 1996, 3, 117. 252. A. Maurer, Dissertation, Ruprecht-Karls-Universität Heidelberg, Heidelberg,
2005, pp. 1-248. 253. Y. Wei, M. Marino, B. Thompson, J. E. Girard, J. Chromatogr. A 1999, 864, 49. 254. J. M. Butler, P. Jiang-Baucom, M. Huang, P. Belgrader, J. E. Girard, Anal. Chem.
1996, 68, 3283. 255. J. Gross, Mass Spectrometry, Springer, Berlin Heidelberg, Germany, 2004. 256. J. SantaLucia, Jr., H. T. Allawi, P. A. Seneviratne, Biochemistry 1996, 35, 3555. 257. L. A. Marky, K. J. Breslauer, Biopolymers 1987, 26, 1601. 258. H. Aoki, H. Tao, Analyst 2005, 130, 1478. 259. H. T. Allawi, J. SantaLucia, Jr., Biochemistry 1997, 36, 10581. 260. H. T. Allawi, J. SantaLucia, Jr., Biochemistry 1998, 37, 2170. 261. H. T. Allawi, J. SantaLucia, Jr., Biochemistry 1998, 37, 9435. 262. H. T. Allawi, J. SantaLucia, Jr., Nucl. Acids Res. 1998, 26, 2694. 263. J. SantaLucia, Jr., Proc. Natl. Acad. Sci. USA 1998, 95, 1460. 264. B. Hyrup, M. Egholm, O. Buchardt, P. E. Nielsen, Bioorg. Med. Chem. Lett. 1996, 6,
1083. 265. S. Bommarito, N. Peyret, J. SantaLucia, Jr., Nucl. Acids Res. 2000, 28, 1929. 266. A. J. Zara, S. S. Machado, L. O. S. Bulhoes, J. Electroanal. Chem. 1987, 221, 165. 267. A. J. Bard, L. R. Faulkner, John Wiley & Sons, Inc., New York, 2001. 268. U. Rant, K. Arinaga, S. Fujita, N. Yokoyama, G. Abstreiter, M. Tornow, Org. Biomol.
Chem. 2006, 4, 3448. 269. D. I. Leikis, K. V. Rybalka, E. S. Sevastyanov, A. N. Frumkin, J. Electroanal. Chem.
1973, 46, 161. 270. J. Osteryoung, J. O'Dea, Electroanal. Chem. 1986, 14, 209. 271. N. W. Ashcroft, N. D. Mermin, Solid State Physics 1976. 272. C. E. D. Chidsey, Science 1991, 251, 919. 273. E. Laviron, J. Electroanal. Chem. 1979, 101, 19. 274. R. A. Marcus, Annu. Rev. Phys. Chem. 1964, 15, 155. 275. M. Chahma, J. S. Lee, H.-B. Kraatz, J. Electroanal. Chem. 2004, 567, 283. 276. J. J. O'Dea, J. G. Osteryoung, Anal. Chem. 1993, 65, 3090.

9. References
253
277. J. O'Dea, J. Osteryoung, T. Lane, J. Phys. Chem. 1986, 90, 2761. 278. J. J. O'Dea, A. Ribes, J. G. Osteryoung, J. Electroanal. Chem. 1993, 345, 287. 279. T. Odijk, J. Polym. Sci. Part B: Polym. Phys. 1977, 15, 477. 280. G. Ariel, D. Andelman, Phys. Rev. E 2003, 67, 1. 281. J. Skolnick, M. Fixman, Macromolecules 1977, 10, 944. 282. K. Habermüller, W. Schuhmann, Electroanalysis 1998, 10, 1281. 283. T. Ihara, Y. Maruo, S. Takenaka, M. Takagi, Nucl. Acids Res. 1996, 24, 4273. 284. S. M. Batterjee, M. I. Marzouk, M. E. Aazab, M. A. El-Hashash, Appl. Organomet.
Chem. 2003, 17, 291. 285. S. P. Gubin, Pure Appl. Chem. 1970, 23, 463. 286. S. A. Brazill, P. H. Kim, W. G. Kuhr, Anal. Chem. 2001, 73, 4882. 287. S. A. Brazill, W. G. Kuhr, Anal. Chem. 2002, 74, 3421. 288. E. P. Friis, J. E. T. Andersen, L. L. Madsen, N. Bonander, P. Møller, J. Ulstrup,
Electrochim. Acta 1998, 43, 1114. 289. C.-Z. Li, Y.-T. Long, H.-B. Kraatz, J. S. Lee, J. Phys. Chem. B 2003, 107, 2291. 290. U. Oesch, J. Janata, Electrochim. Acta 1983, 28, 1237. 291. K. Štulík, C. Amatore, K. Holub, V. Mareček, W. Kutner, Pure Appl. Chem. 2000, 72,
1483. 292. C. A. Widrig, C. Chung, M. D. Porter, J. Electroanal. Chem. 1991, 310, 335. 293. D. F. Yang, H. Al-Maznai, M. Morin, J. Phys. Chem. B 1997, 101, 1158. 294. R. C. Mucic, M. K. Herrlein, C. A. Mirkin, R. L. Letsinger, Chem. Commun. 1996, 4,
555-557. 295. E. Mateo-Marti, C. Briones, E. Roman, E. Briand, C. M. Pradier, J. A. Martin-Gago,
Langmuir 2005, 21, 9510. 296. T. M. Herne, M. J. Tarlov, J. Am. Chem. Soc. 1997, 119, 8916. 297. D. W. Dodd, R. H. E. Hudson, Electrophoresis 2007, 28, 3884. 298. A. B. Steel, T. M. Herne, M. J. Tarlov, Anal. Chem. 1998, 70, 4670. 299. H. O. Finklea, Electroanal. Chem. 1996, 19, 109. 300. F. J. Mearns, E. L. S. Wong, K. Short, D. B. Hibbert, J. J. Gooding, Electroanalysis
2006, 18, 1971. 301. R. Levicky, T. M. Herne, M. J. Tarlov, S. K. Satija, J. Am. Chem. Soc. 1998, 120, 9787. 302. E. L. S. Wong, E. Chow, J. J. Gooding, Langmuir 2005, 21, 6957. 303. R. Arnold, W. Azzam, A. Terfort, C. Woell, Langmuir 2002, 18, 3980. 304. A. Benninghoven, Angew. Chem., Int. Ed. 1994, 33, 1023. 305. D. Y. Petrovykh, V. Pérez-Dieste, A. Opdahl, H. Kimura-Suda, J. M. Sullivan, M. J.
Tarlov, F. J. Himpsel, L. J. Whitman, J. Am. Chem. Soc. 2006, 128, 2. 306. J. F. Smalley, S. W. Feldberg, C. E. D. Chidsey, M. R. Linford, M. D. Newton, Y.-P. Lid,
J. Phys. Chem. 1995, 99, 13141. 307. P. A. Tipler, Physik, Spektrum Verlag, 1998. 308. U. Rant, K. Arinaga, M. Tornow, Y. W. Kim, R. R. Netz, S. Fujita, N. Yokoyama, G.
Abstreiter, Biophys. J. 2006, 90, 3666. 309. U. Rant, K. Arinaga, T. Fujiwara, S. Fujita, M. Tornow, N. Yokoyama, G. Abstreiter,
Biophys. J. 2003, 85, 3858.

9. References
254
310. G. S. Manning, Q. Rev. Biophys. II 1978, 2, 179. 311. A. S. Jones, P. Lewis, S. F. Withers, Tetrahedron 1973, 29, 2293. 312. J. D. Puglisi, J. I. Tinoco, Methods Enzymol. 1989, 180, 304. 313. R. M. C. Dawson, D. C. Elliott, W. H. Elliott, K. M. Jones, Data for Biochemical
Research, Oxford University Press, Oxford, UK, 1989.

List of Publications
The following publications resulted from this dissertation:
Paper
A. Full Papers
1. S. D. Köster, J. Dittrich, G. Gasser, N. Hüsken, I. C. Henao Castañeda, J. L. Jios,
C. O. Della Védova, N. Metzler-Nolte, ‘Spectroscopic and Electrochemical
Studies of Ferrocenyl Triazole Amino Acid and Peptide Bioconjugates
Synthesized by Click Chemistry’, Organometallics 2008, 27, 6326-6332.
2. N. Hüsken, G. Gasser, S. D. Köster, N. Metzler-Nolte, ‘”Four-Potential”
Ferrocene Labeling of PNA Oligomers via Click Chemistry’, Bioconjugate Chem.
2009, 20, 8, 1578-1586.
3. N. Hüsken, M. Gębala, W. Schuhmann, N. Metzler-Nolte, ‘A Single-Electrode,
Dual-Potential Ferrocene-PNA Biosensor for the Detection of DNA’,
ChemBioChem 2010, 11, 12, 1754-1761.
4. N. Hüsken, M. Gębala, F. La Mantia, W. Schuhmann, N. Metzler-Nolte,
‘Electron-transfer kinetics as a means to studying Fc-PNA(•DNA) surface
dynamics‘, submitted.
5. N. Hüsken, M. Gębala, F. La Mantia, W. Schuhmann, N. Metzler-Nolte, ‘The
impact of single mismatches onto the electron transfer process of surface-
confined Fc-PNA•DNA strands’, in preparation.
6. A. Groß, N. Hüsken, N. Metzler-Nolte, ‘A Ruthenocenyl PNA bioconjugate –
synthesis, cellular uptake, cytotoxicity and electrochemical studies‘, in
preparation.
B. Communications
1. G. Gasser, N. Hüsken, S. D. Köster, N. Metzler-Nolte, Chem. Commun. 2008,
3675-3677.

Conference Proceedings
A. Oral Presentations
1. N. Hüsken, G. Gasser, N. Metzler-Nolte, ‘PNA labeling via Click Chemistry at
the solid phase‘, 4th International Symposium on Bioorganometallic Chemistry
(ISBOMC), 06 – 10 Jul 2008, Missoula, MT, USA.
2. N. Hüsken, M. Gębala, W. Schuhmann, N. Metzler-Nolte, ‘Ferrocene-PNA
conjugates as electrochemical DNA Biosensors’, 6th German Biosensor
Symposium (DBS), 29 Mar – 01 Apr 2009, Freiburg, Germany.
B. Poster Presentations
1. N. Hüsken, A. Maurer, N. Metzler-Nolte, ‘Metallocene-PNA Conjugates as
New Biosensors’, 5th German Biosensor Symposium (DBS), 18 – 21 Mar 2007,
Bochum, Germany.
2. N. Hüsken, A. Maurer, N. Metzler-Nolte, ‘Synthesis of ferrocene-PNA
conjugates as biosensors for detection and identification of nucleic acids’, J.
Biol. Inorg. Chem. 2007, (Suppl. 1), 12, S219, 13th International Conference on
Biological Inorganic Chemistry (ICBIC), 15 – 20 Jul 2007, Vienna, Austria.
3. N. Hüsken, N. Metzler-Nolte, ‘’Four-Potential’ PNA Labeling via Click
Chemistry’, 7th Ferrocene Colloquium, 16 – 18 Feb 2009, Düsseldorf, Germany.
4. N. Hüsken, H.-B. Kraatz, N. Metzler-Nolte, ’A chip-based Fc-PNA biosensor’, J.
Biol. Inorg. Chem. 2009, (Suppl. 1), 14, S180, 14th International Conference on
Biological Inorganic Chemistry (ICBIC), 25 – 30 Jul 2009, Nagoya, Japan.
5. N. Hüsken, M. Gębala, W. Schuhmann, N. Metzler-Nolte, ‘Electrochemical
studies on Fc-PNA(•DNA) surface dynamics’, p. 122, 5th International
Symposium on Bioorganometallic Chemistry (ISBOMC), 05 – 09 Jul 2010,
Bochum, Germany.
6. N. Hüsken, M. Gębala, W. Schuhmann, N. Metzler-Nolte, ‘Electron transfer
kinetics of gold surface grafted Fc-PNA(•DNA) strands’, p. 212,
Electrochemistry 2010, 13 – 15 Sept 2010 Bochum, Germany.