ferritin secretion in aedes aegypti larval...
TRANSCRIPT

Ferritin Secretion in Aedes aegypti Larval Cells
Item Type text; Electronic Thesis
Authors Shen, Meng-Chieh
Publisher The University of Arizona.
Rights Copyright © is held by the author. Digital access to this materialis made possible by the University Libraries, University of Arizona.Further transmission, reproduction or presentation (such aspublic display or performance) of protected items is prohibitedexcept with permission of the author.
Download date 05/06/2018 10:06:45
Link to Item http://hdl.handle.net/10150/193385

FERRITIN SECRETION IN AEDES AEGYPTI LARVAL CELLS
by
Meng-Chieh Shen
________________________ Copyright © Meng-Chieh Shen 2006
A Thesis Submitted to the Faculty of the
DEPARTMENT OF NUTRITIONAL SCIENCES
In Partial Fulfillment of the Requirements For the Degree of
MASTER OF SCIENCE
In the Graduate College
THE UNIVERSITY OF ARIZONA
2 0 0 6

2
STATEMENT BY AUTHOR This thesis has been submitted in partial fulfillment of requirements for an advanced degree at The University of Arizona and is deposited in the University Library to be made available to borrowers under rules of the Library. Brief quotations from this thesis are allowable without special permission, provided that accurate acknowledgment of source is made. Requests for permission for extended quotation from or reproduction of this manuscript in whole or in part may be granted by the copyright holder.
SIGNED: ____Meng-Chieh Shen_____________________
APPROVAL BY THESIS DIRECTOR
This thesis has been approved on the date shown below:
_____________________________ _______May 8, 2006________ Dr. Joy J. Winzerling Date

3
ACKNOWLEDGEMENTS
I would like to thank my advisor Dr. Joy Winzerling for her instruction and guidance. I
am grateful to Dawn L. Geiser, Jonathan J. Mayo and Edwin A. Kohlhepp for helping and
supporting me to achieve this task.

4
DEDICATION
I would like to dedicate this manuscript to my family, friends and colleagues who support
and inspire me through this journey. I especially would like to dedicate this achievement
to my parents, Chad-Yi Shen and Yueh-Chun Chang who devote themselves to help me
achieving my dream.

5
TABLE OF CONTENTS
LIST OF FIGURES ............................................................................................................ 6 ABSTRACT........................................................................................................................ 7 CHAPTER 1: REVIEW OF LITERATURE ...................................................................... 8
Pertinent Iron Metabolism in Vertebrates ....................................................................... 8 Iron Metabolism in Insects............................................................................................ 11 Secretory Pathway in Mammalian Cells....................................................................... 14 Iron and Ferritin in A. aegypti....................................................................................... 16
CHAPTER 2: MATERIALS AND METHODS............................................................... 18 Chemicals...................................................................................................................... 18 Cell Culture Protocol .................................................................................................... 18 Cell Viability and Cell Number .................................................................................... 19 Iron Determination........................................................................................................ 19 Thiobarbituric Reactive Substances Assay ................................................................... 20 Immunoblots ................................................................................................................. 20 Immunohistochemistry of Permeabilized Cells ............................................................ 21 Immunochemistry for Living Cells............................................................................... 22 Statistics ........................................................................................................................ 22
CHAPTER 3: RESULTS .................................................................................................. 23 The Effects of BFA on CCL-125 Cells ......................................................................... 23
Viability and numbers of CCL-125 cells do not change with BFA treatment. ......... 24 The Golgi integrity of CCL-125 cells is altered by BFA treatment. ......................... 25
The Effects of Iron on the Localization of Ferritin in CCL-125 Cells ......................... 26 Ferritin is localized to the Golgi apparatus. .............................................................. 27
The Effects of BFA on Iron-Induced Ferritin Secretion ............................................... 28 BFA and iron treatment does not decrease cell viability or cell division.................. 29 BFA does not reduce iron uptake into CCL-125 Cells. ............................................ 30 Treatment with iron or BFA does not increase lipid peroxidation of CCL-125 cells.................................................................................................................................... 31 Iron treatment increases vesicle-associated ferritin. ................................................. 32 BFA does not block iron-induced ferritin secretion. ................................................. 36
Treatment with a Second Golgi Blocking Agent, Monensin ........................................ 37 Cell viability decreases with monensin dose. ........................................................... 38
The Effects of BFA or Monensin on Ferritin Secretion ................................................ 39 Iron influenced cell viability as measured by MTS. ................................................. 41 Iron uptake by CCL-125 cells is not changed by the addition of BFA or monensin.43 BFA or monensin do not block iron-induced ferritin secretion of CCL-125 cells.... 44
CHAPTER 4: DISCUSSION AND FUTURE DIRECTION ........................................... 48 REFERENCES ................................................................................................................. 52

6
LIST OF FIGURES
Figure 1. Iron uptake and export in the enterocyte. .......................................................... 10 Figure 2. Cell viability and cell division are not decreased by BFA treatment................. 24 Figure 3. Golgi complex of CCL-125 cells is altered by BFA treatment. ........................ 26 Figure 4. Ferritin co-localizes with the Golgi apparatus in CCL-125 cells. ..................... 27 Figure 5. BFA alone or combined with FAC does not reduce viability or division of CCL-125 cells. ........................................................................................................................... 29 Figure 6. Iron is uptake by CCL-125 cells........................................................................ 31 Figure 7. MDA standard curve.......................................................................................... 32 Figure 8. Ferritin distribution in CCL-125 cells following iron and BFA exposure......... 35 Figure 9. Iron-induced ferritin secretion is not blocked by BFA. ..................................... 36 Figure 10. Cell viability of CCL-125 cells decrease with increasing concentration of Monensin........................................................................................................................... 39 Figure 11. The experimental design for testing BFA and monensin as blocking agents of ferritin secretion. ............................................................................................................... 41 Figure 12. Cell viability of CCL-125 cells is reduced by iron and monensin. ................. 42 Figure 13. Cell division of CCL-125 cells is not affected by iron or BFA....................... 43 Figure 14. Iron uptake is not compromised by treatment with BFA or Monensin. .......... 44 Figure 15. Ferritin secretion in response to iron supplementation increases with time.... 45 Figure 16. BFA and monensin did not decrease ferritin secretion by 12 h. ...................... 46 Figure 17. BFA and monensin did not decrease ferritin secretion by 18 h....................... 47

7
ABSTRACT
Female mosquitoes lay eggs after the consuming a blood meal. The iron storage
protein ferritin could be involved with iron movement among body tissues in insects.
Mosquito ferritin is present in hemolymph (blood) and the messages for the heavy and
light chain subunits contain secretion signal sequences. These subunits may be targeted
to the secretory pathway. We found that Aedes aegypti larval cells (CCL-125) exposed
to iron as ferric ammonium citrate (FAC) increased ferritin secretion in a dose-dependent
manner. In order to study the secretory pathway of ferritin, we attempted to disrupt the
Golgi by treating CCL-125 cells with brefeldin A (BFA) and monensin. Unexpectedly,
neither BFA nor monensin inhibits iron-induced ferritin secretion. These data suggest
that either CCL-125 cells are highly resistant to these agents or ferritin is secreted
independently of the classical ER-Golgi pathway.

8
CHAPTER 1
REVIEW OF LITERATURE
Aedes aegypti mosquitoes are the primary world-wide vectors for yellow fever and
dengue. There are about 200,000 cases of yellow fever per year that result in 30,000
deaths (1). Dengue is considered an emerging disease and the World Health Organization
estimates that there are about 50 million cases per year (2). One of the best ways to
prevent transmission of dengue and yellow fever is to control mosquito populations.
Mosquitoes must blood-feed in order to complete their life cycle. The blood meal
provides a high level of iron that is required for egg development. We are interested in
developing control strategies that interfere with this process.
Pertinent Iron Metabolism in Vertebrates
In vertebrates, the majority of iron is associated with hemoglobin and that is
essential for oxygen binding. Iron is also a cofactor for a variety of enzymes such as
cytochrome P450, aconitase and ribonucleotide reductase (3). Although iron is an
essential metal for almost all living organisms, excess iron is toxic. This is because
ferrous oxidation can result in generation of hydroxyl radicals through the Fenton
reaction. Hydroxyl radicals are very reactive and have the ability to compromise a wide
range of cellular constituents (4). Therefore, organisms must have a way of managing
this mineral in order to meet the body’s requirement and prevent cytotoxic effects.
Iron absorption occurs mainly in the duodenum and proximal jejunum and dietary
iron occurs in both the heme and non-heme forms. Iron absorption in mature mammalian
intestinal mucosa cells is summarized in Figure 1. Dietary heme can be absorbed through

9
the heme carrier protein 1 [HCP1, (5)] on the apical membrane of enterocytes. Iron is
released as the ferrous form through a subsequent reaction involving heme and heme
oxygenase. Non-heme iron from the diet occurs predominantly as ferric. It is reduced to
Fe2+ by a duodenal ferric reductase, Dcytb (6), and is subsequently transported into the
enterocyte via the divalent cation transport protein, DMT1 [also referred to DCT1/
NRAMP2/ SLC11A2, (7)]. Once Fe2+ enters the enterocyte, it can be stored inside
ferritin or transported to the circulation through the basolateral membrane iron exporter,
ferroportin (Fpn, also known as IREG/MTP/Slc11a3). Hephaestin, a multicopper oxidase
that is on the basolateral membrane of enterocytes, catalyzes oxidation of Fe2+ to Fe3+ (8).
Fe3+ is then released and bound to the blood iron transport protein, transferrin, and
transported to target tissues. Transferrin is a ~80 kDa glycoprotein which binds to two
atoms of Fe3+. Somatic cells take up diferric-transferrin via transferrin receptors by
receptor-mediated endocytosis. Fe 3+ dissociates from transferrin as the pH lowers in the
endosome. It is reduced by an unknown oxidoreductase (9-12) and Fe2+ is then
transported out of the endosome by DMT1 (13) and subsequently utilized or stored inside
ferritin. The apo-transferrin-transferrin receptor complex is recycled to the plasma
membrane where apo-tranferrin is released into the blood.

10
Heme Heme
Ferritin
Heme Ox
Fe2+
Fe2+ Iron PoolFe 2+
Fe 2+
Hephaestin
Fe 3+
Transferrin
Non Heme
Dcytb
Fe 3+
Fe2+
Mature intestinal mucosa cell
EnterocyteBasolateralApical
DMT1 Fpn
HCP1Heme Heme
Ferritin
Heme Ox
Fe2+
Fe2+ Iron PoolFe 2+
Fe 2+
Hephaestin
Fe 3+
Transferrin
Fe 3+
Transferrin
Non Heme
Dcytb
Fe 3+
Fe2+
Mature intestinal mucosa cell
EnterocyteBasolateralApical
DMT1 Fpn
HCP1
Figure 1. Iron uptake and export in the enterocyte. This cartoon represents mature intestinal mucosa cells. Iron absorption is accomplished by DMT1 (divalent metal transporter), Dcytb (duodenal ferric reductase), HCP1 (heme carrier protein 1), Fpn (ferriportin) and Hephastin.
Ferritin is a highly conserved iron storage protein. In vertebrates, ferritin is mainly
present in the cytoplasm and is composed of 24 heavy (H) and light (L) chain subunits.
The main function of ferritin is to store iron. Each ferritin molecule can hold up to 4,500
Fe 3+ atoms (14,15). Ferritin can oxidize Fe 2+ to Fe 3+ and aggregate iron in combination
with phosphate and oxygen inside the protein cavity to form the iron core. Ferritin H-
chain subunits contain the ferroxidase centers that are important for Fe 2+ oxidation. The
L-chain subunits contain nucleation sites responsible for core formation (16) Ferritin H
and L subunits are encoded by two different genes. Ferritin plays an important role in
maintaining iron homeostasis by capturing and storing iron from the intracellular labile
iron pool.

11
Low levels of ferritin are present in human serum. It is secreted from liver and
lymphoid cells and is elevated in iron overload and inflammation. Serum ferritin is iron-
poor and consists primarily of glycosylated ferritin L chains with only trace amounts of
ferritin H. Ferritin secretion has been studied in HepG2 cells [human hepatocytes, (17)].
When HepG2 cells were treated with ferrous sulfate, the synthesis of ferritin increased
greatly, but only minimal amounts of ferritin were secreted and the secreted form was
predominately ferritin L (17). Treatment of HepG2 cells with Interleukein-1ß (IL-1ß)
increased ferritin L synthesis and secretion. The secretion of ferritin L was blocked by
treating HepG2 cells with BFA(17). These suggesting that ferritin L is secreted through
the classical ER-Golgi pathway.
Iron Metabolism in Insects
Female mosquitoes must blood feed for oogenesis (egg laying). The blood meal is a
great source of iron in the form of heme and non-heme iron. An increased level of whole
body iron was observed following blood feeding in Aedes egypti (Geiser, Vazquez and
Winzerling, unpublished). This iron was primarily observed in the hemolymph (blood)
and the ovaries. These data indicate that mosquitoes can absorb iron from a blood meal.
However, the pathways involved in iron absorption, delivery and use are still unknown.
Mosquitoes secrete a substance from the gut cells during feeding that surrounds the food
bolus called the peritrophic matrix (PM) (18). This layer separates gut epithelium from
food. Studies in A. aegypti indicate that heme binds with the PM and binding is increased
with digestion time; this results in most of the heme being excreted (18). Early studies in
the laboratory of Dr. John Law indicated that iron absorption from heme was a saturable

12
process while iron from ferric-transferrin was absorbed in a linear relationship to dose
(Kulakowsky and Law, unpublished). Our laboratory recently identified a message for a
putative DMT1 from Anopheles gambiae cells (4a3B and Moss 55). A. gambiae is the
primary mosquito vector for malaria. The putative DMT1 message levels were regulated
by iron (Geiser, Shen and Winzerling, unpublished). These findings suggest that non-
heme iron could be taken up by mosquito cells via DMT1. Alternatively, the putative
DMT1 could be involved in the movement of iron among cell compartments.
Mosquitoes have hemolymph transferrin. However, mosquito transferrin has been
identified as having one iron-binding site in the N-terminal lobe, whereas the C-terminal
lobe does not bind iron. This differs greatly from that of mammalian transferring, which
has binding sites in both the N and C-terminus. Mosquito transferrin is a 66 kDa protein.
Transferrin synthesis and secretion are increased when mosquito cells are exposed to
bacteria. This finding suggests this transferrin may play an important role in innate
immune response (19). When moth larvae (Manduca sexta) were injected with Fe59-
mammalian transferrin, the radioactive iron left the hemolymph rapidly and entered the
fat body (liver) and carcass. However, after 24 hours, about 40% of the radioactive iron
appeared in hemolymph associated with ferritin (20,21). This suggests that a diferric-
transferrin could transfer iron to insect tissues for further processing, but this finding has
not been explored in mosquitoes. Mosquitoes degrade protein in the gut and have a
variety of protein digestive enzymes. Thus, it seems probable that dietary holo-transferrin
would be digested and the iron released for uptake into the gut epithelial cells. In A.
aegypti, transferrin mRNA levels increase at 6 h after blood feeding, reach a peak at 12 h,
13
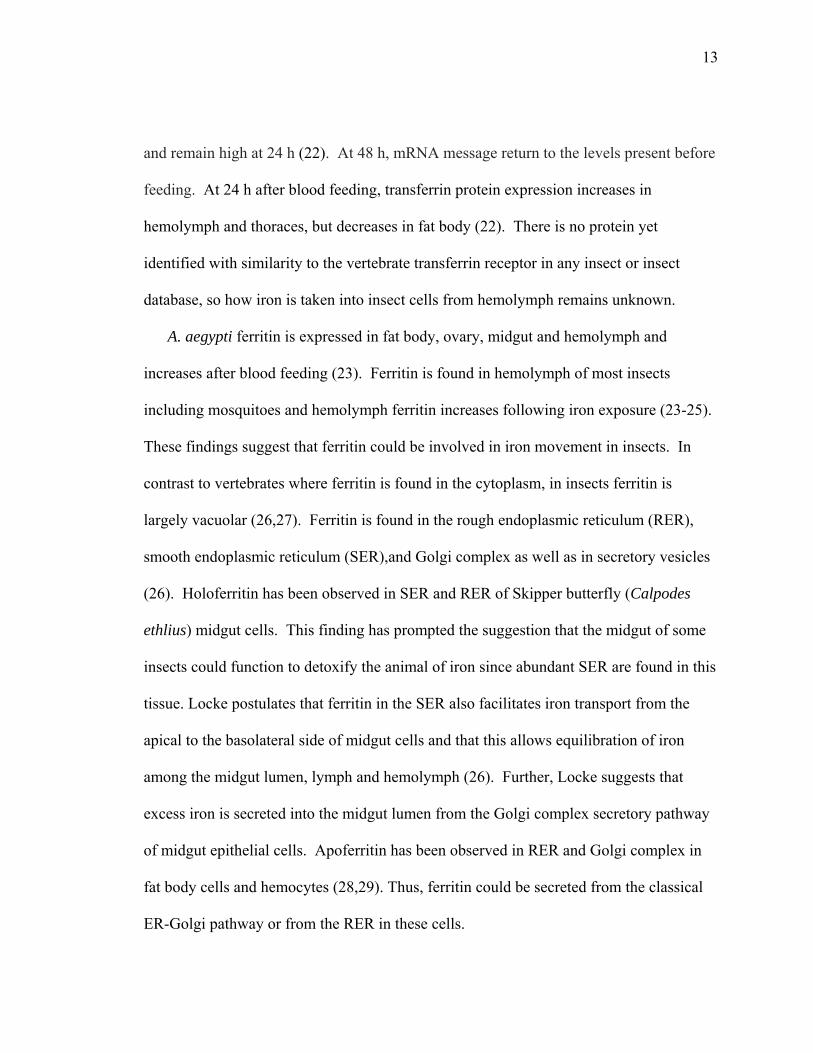
and remain high at 24 h (22). At 48 h, mRNA message return to the levels present before
feeding. At 24 h after blood feeding, transferrin protein expression increases in
hemolymph and thoraces, but decreases in fat body (22). There is no protein yet
identified with similarity to the vertebrate transferrin receptor in any insect or insect
database, so how iron is taken into insect cells from hemolymph remains unknown.
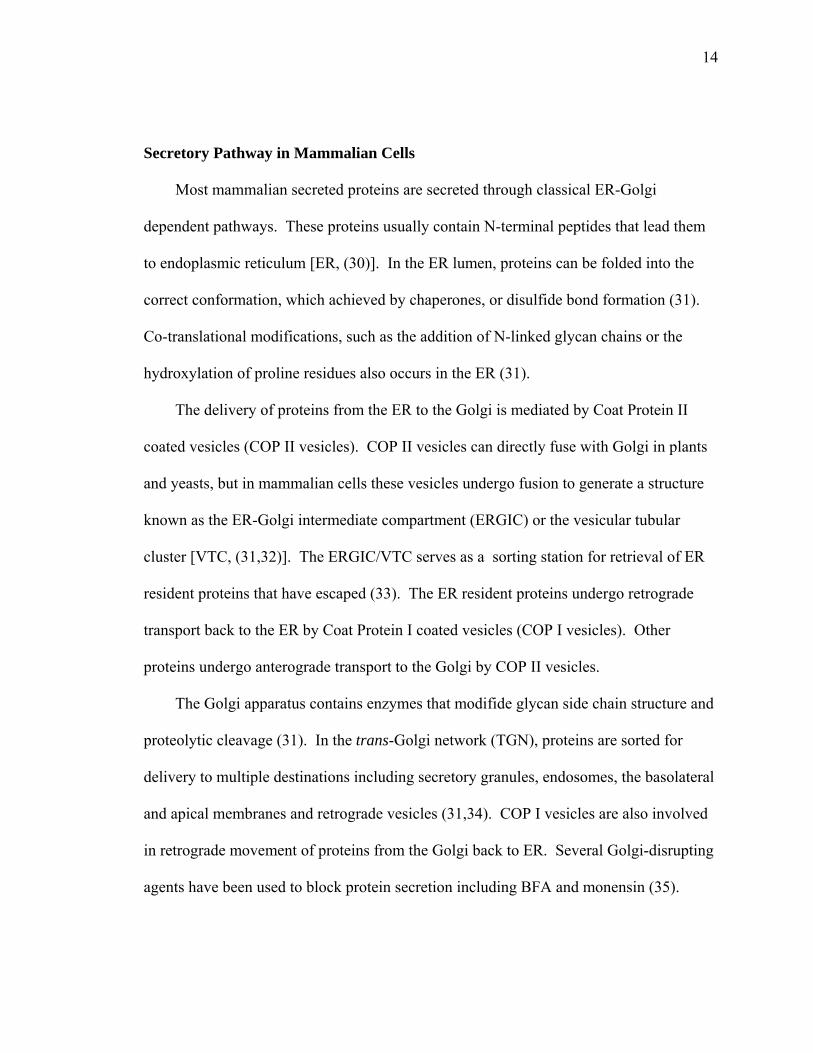
. aegypti ferritin is expressed in fat body, ovary, midgut and hemolymph and
increases after blood feeding (23). Ferritin is found in hemolymph of most insects
including mosquitoes and hemolymph ferritin increases following iron exposure (23-25).
These findings suggest that ferritin could be involved in iron movement in insects. In
contrast to vertebrates where ferritin is found in the cytoplasm, in insects ferritin is
largely vacuolar (26,27). Ferritin is found in the rough endoplasmic reticulum (RER),
smooth endoplasmic reticulum (SER),and Golgi complex as well as in secretory vesicles
(26). Holoferritin has been observed in SER and RER of Skipper butterfly (Calpodes
ethlius) midgut cells. This finding has prompted the suggestion that the midgut of some
insects could function to detoxify the animal of iron since abundant SER are found in this
tissue. Locke postulates that ferritin in the SER also facilitates iron transport from the
apical to the basolateral side of midgut cells and that this allows equilibration of iron
among the midgut lumen, lymph and hemolymph (26). Further, Locke suggests that
excess iron is secreted into the midgut lumen from the Golgi complex secretory pathway
of midgut epithelial cells. Apoferritin has been observed in RER and Golgi complex in
fat body cells and hemocytes (28,29). Thus, ferritin could be secreted from the classical
ER-Golgi pathway or from the RER in these cells.
A
14
Secretory Pathway in Mammalian Cells
Most mammalian secreted proteins are secreted through classical ER-Golgi
dependent pathways. These proteins usually contain N-terminal peptides that lead them
to endoplasmic reticulum [ER, (30)]. In the ER lumen, proteins can be folded into the
correct conformation, which achieved by chaperones, or disulfide bond formation (31).
Co-translational modifications, such as the addition of N-linked glycan chains or the
hydroxylation of proline residues also occurs in the ER (31).
The delivery of proteins from the ER to the Golgi is mediated by Coat Protein II
coated vesicles (COP II vesicles). COP II vesicles can directly fuse with Golgi in plants
and yeasts, but in mammalian cells these vesicles undergo fusion to generate a structure
known as the ER-Golgi intermediate compartment (ERGIC) or the vesicular tubular
cluster [VTC, (31,32)]. The ERGIC/VTC serves as a sorting station for retrieval of ER
resident proteins that have escaped (33). The ER resident proteins undergo retrograde
transport back to the ER by Coat Protein I coated vesicles (COP I vesicles). Other
proteins undergo anterograde transport to the Golgi by COP II vesicles.
The Golgi apparatus contains enzymes that modifide glycan side chain structure and
proteolytic cleavage (31). In the trans-Golgi network (TGN), proteins are sorted for
delivery to multiple destinations including secretory granules, endosomes, the basolateral
and apical membranes and retrograde vesicles (31,34). COP I vesicles are also involved
in retrograde movement of proteins from the Golgi back to ER. Several Golgi-disrupting
agents have been used to block protein secretion including BFA and monensin (35).

15
BFA is a fungal metabolite. It disrupts Golgi function by inhibiting COP I vesicles
formation (36,37). Treatment with BFA induces reversible morphological changes. The
loss of COP I coat proteins is followed by extensive tubulation of Golgi apparatus which
eventually fuse with the ER. Tubulation also is observed for the endo-membrane system
of the secretory pathway including endosomes, lysosomes and trans-Golgi network (38).
Not all cells are sensitive to BFA or react to it by merging the Golgi apparatus with the
ER. Multidrug resistant cells and wild strains of Saccharomyces cerevisiae are
insensitive to BFA (35,39). In PtK1 (Potorous tridactylis kidney) and MDCK (Canis
familiaris kidney) cells, the Golgi apparatus is resistant to BFA, while the endosomal
compartment undergoes tabulation (35).
Monensin is a carboxylic ionophore that disrupts Golgi function by interfering with
Na+/H+ exchange (35). The presence of cholesterol enhances sensitivity to monensin.
This could be the reason that monensin impacts the trans-Golgi (cholesterol-rich
membranes) more strongly than the cis-Golgi. Monensin also causes a change of Golgi
apparatus morphology. It leads to osmotic swelling of the Golgi cisternae increasingly
from cis to trans. Consequently, trafficking across the Golgi cisternae is slow and
enzymatic processing is inefficient in the swollen compartments. Thus, Golgi functions
such as glycan structure modification, proteolysis, and sulfonation are reduced. Notably,
some membrane proteins and secretory products are still secreted, but are incompletely
processed (40).
Not all proteins are secreted from the classical ER-Golgi pathway, and these proteins
use alternative pathways for secretion. Such proteins generally lack a signal peptide, do

16
not have ER-Golgi dependent post-translational modifications and their secretion is not
inhibited by BFA. These non-classical pathways have been reviewed by Nickle et. al
(41,42). These proteins are synthesized on free ribosomes in the cytoplasm. Four
different potential non-classical secretion routes have been discussed in the literature.
First, the pathway for the export of Interleukin 1 β (IL-1 β) and engrailed homeoprotein
isoform 2 involves import of the protein into intracellular vesicles which are probably
endosomal compartment. Second, fibroblast growth factor 1 and 2 (FGF-1 and 2) is
probably directly transported to the extracellular space by a plasma membrane transporter.
The third potential pathway involves a flip-flop mechanism which is observed for the
leishmania cell surface protein, HASPB. The last postulated export route involves the
formation of exosomes and vesicles. The galectins has been suggested to be secreted
using this pathway.
Iron and Ferritin in A. aegypti
A. aegypti ferritin consists of four subunit types, heavy chains of 24 and 26 kDa, a
light chain of 28 kDa and a rare subunit of unknown composition of 30 kDa (24, 43).
Ferritin messages and protein levels increase after blood feeding (23). Hemolymph
ferritin consists primarily 26 kDa heavy chain subunits (23). The midgut of blood-fed
mosquitoes is the main site of increased ferritin messages. Protein levels increase in
midgut, fat body, hemolymph, and ovaries. These data suggest that ferritin might be used
to sequester iron from a blood meal to prevent oxidative stress and to serve as an iron
source for embryo development.
Iron exposure increases ferritin synthesis and secretion in A. aegypti larval cells

17
(CCL-125) (43). Cytoplasmic ferritin in these cells consists of both the light chain and
heavy chain subunits and is maximal at low levels of iron exposure. The level of
cytoplasmic ferritin reflects the cytoplasmic iron pool. Secreted ferritin, which primarily
consists of heavy chain subunits, increases in direct linear relationship to iron dose. The
cytoplasmic iron remains relatively stable over all iron doses treatment, while the iron
content of membrane fraction increases with increasing iron dose. Theses data indicate
that excess iron is removed from CCL-125 cells by secreting holo-ferritin. Ferritin
synthesis and secretion could be the primary mechanisms that allow mosquitoes to defend
against intracellular iron overload (43).
In time course experiments, we evaluated for ferritin synthesis and distribution, as
well as iron uptake and distribution in CCL-125 cells treated with 100 mM ferric
ammonium citrate [FAC, (44)]. These studies show that cytoplasmic ferritin increases at
9 h after iron exposure and declines by 18 h. Ferritin present in membrane extract shows
a biphasic response to iron. Membrane ferrtin at 6 h and 12 h is significantly greater than
at 9 h and 18 h, respectively. Ferritin secretion into the medium starts at 9 h and
increases with time of iron exposure. Iron exposure does not significantly increase
cytoplasmic iron levels, but increases iron in the membrane extracts. Immuofluorescent
microscopy shows ferritin co-localizes with a Golgi marker (ceramide). Both A. aegypti
ferritin subunits contain signal peptides, so they could be targeted to secretory pathway
for secretion (21). These data indicate excess intracellular iron is stored in ferritin which
is eventually distributed to the secretory pathway for secretion.

18
CHAPTER 2
MATERIALS AND METHODS
Chemicals
BFA (Sigma, St Louis, MO) was dissolved (10 mg/ml) in 100% ethanol and the
solution stored at -20°C for use as stock solution. Monensin (Sigma) stock solution (1
mg/ml) was made in 100% ethanol and stored at -20º C until used. Ferric ammonium
citrate (FAC, 18.3% iron, 1 μg Fe/μg) was obtained from Sigma and dissolved in Hanks
Balanced Salt Solution (HBSS, Invitrogen Corporation, Carlsbad, CA) immediately prior
to use.
Cell Culture Protocol
A. aegypti larval cells (CCL-125) were obtained from the American Type Culture
Collection (Manassas, VA). Cells are grown and maintained in Medium A: 75% DMEM
high glucose medium (Invitrogen) and 25% Sf-900 II (Invitrogen) supplemented with
15% heat-inactivated fetal bovine serum (Gemini Bio-Products, Calabasas, CA) and
0.15% antibiotics/antimycotics (Invitrogen), as stock cultures in a water-jacketed
incubator with 10% humidity and a 95% air-5% CO2 atmosphere at 28oC. CCL-125 cells
are seeded onto coverslips in 35 mm Petri dishes or 24-well plates. In some cases, cells
are seeded in 25 cm2 flasks.
All experiments are performed on cells at >50% (coverslips) or >80% (flasks)
confluence under sterile conditions. At the start of each experiment, Medium A is
removed and the cells are washed twice with HBSS. Serum-free, Medium A is placed on
the cells and the cells are incubated for one hour (28oC, 5% CO2). Following this
19
incubation, the medium is replaced with fresh serum-free, Medium A, and the cells are
treated as indicated in the protocol for each experiment. In some cases, 0.15%
antibiotics/antimycotics is supplemented to the medium.
Cell Viability and Cell Number
Cell viability is determined in triplicate by CellTiter 96® Aqueous One Solution
Cell Proliferation Assay per manufacturer’s instructions (Promega Corporation, Madison,
WI). The MTS assays measure mitochondrial function. The MTS tetrazolium compound
(Owen’s reagent) is bioreduced by cells into a colored formazan product. MTS
absorbance is measured using a Lucy 2 plate reader (Anthos Labtech Instruments GmbH,
Wals, Austria) at 492 nm.
Total cell number is measured by the LIVE/DEAD® Viability/Cytotoxicity Assay
(Molecular Probes, Eugene, OR) per manufacturer’s instructions. In some cases, cell
number is measured by the SYTOX Green nucleic acid stain following manufacturer’s
instructions (Molecular Probes). The LIVE/DEAD® Viability/Cytotoxicity Assay is
measured by excitation at 540 nm and emission at 635 nm. SYTOX Green is measured
by excitation at 485 nm and emission at 535 nm. Both assays were measured using a
SpectraFluor Plate Reader (Tecan, Research Triangle, NC).
Iron Determination
Iron uptake by cells is measured by calcein fluorescent quench by the
LIVE/DEAD® Viability/Cytotoxicity Assay per manufacturer’s instructions (Molecular
Probes). Calcein is added to a final concentration of 1 µM and cells are incubated for 45
min. Fluorescence is measured by excitation at 485 nm and emission at 535 nm using a

20
spectraFluor Plate Reader (Tecan).
Thiobarbituric Reactive Substances Assay
Potential oxidative stress is measured as the extent of lipid peroxidation
determined by measuring thiobarbituric acid (TBA)-reactive substances (TBARS) using a
modified method from Morel et al. (45). Briefly, 250 µl of 0.2% BHT is added to the
tops of 5 ml frozen media aliquots from the CCL-125 cells. These samples are allowed
to thaw on ice. The TBARS master mix is made by adding a 1:1 ratio of 25% TCA: 0.7%
TBA in a 1 ml aliquot for each sample. Once the samples thaw, 100 µl of each sample is
added to an aliquot of TBARS master mix. The samples are incubated for 20 min at 95oC
and placed on ice for 10 min. The samples are then centrifuged at 1000 g for 30 min.
Absorbance (550 nm) of 100 µl of each sample is measured in triplicate in a 96-well plate
using a Lucy 2 (Anthos Labtech Instruments GmbH). Freshly diluted malonyldialdehyde
(MDA) is used as a standard and values are reported as TBARS absorbance at 550 nm.
Immunoblots
Proteins are resolved on homogeneous sodium dodecyl sulfate-polyacrylamide gel
(17.5 or 18.5%) by electrophoresis (SDS-PAGE). Purified A. aegypti ferritin (1 μg, (46))
is used where indicated as a positive control. Following resolution, the proteins are
transferred to nitrocellulose membranes using an electrophoretic blotting system
apparatus (C.B.S. Scientific Company, INC, Del Mar, CA.) according to manufacturer's
specifications. Efficient transfer is confirmed by Ponceau S staining and with
Kaleidoscope molecular weight markers (BIORAD, Hercules, CA). The nitrocellulose
membranes are blocked overnight in 4.0 % non-fat dry milk, 25 mM phosphate, 25 mM
21
acetate buffer, pH 7.0, at 4oC. After blocking, the membranes are incubated with anti-A.
aegypti ferritin rabbit serum (1:4000 v/v, a kind gift from Dr. John Law, Athens, GA)
diluted in 4.0 % non-fat dry milk, 25 mM phosphate, 25 mM acetate buffer, 0.02%
sodium azide, pH 7.0, for 2 h at room temperature (RT). The membranes are washed
three times in 25 mM phosphate, 0.02% sodium azide, pH 7.0, and developed with anti-
rabbit alkaline phosphatase conjugate antibody (Jackson Immuno, West Grove, PA)
according to the manufacturer’s methods (BIORAD, Hercules, CA). Digital images are
assessed using a VersaDoc™ 3000 Imaging System (BIORAD) and quantified with
Quantity One 4.5.1 software (BIORAD, Hercules, CA). Data are analyzed by peak
intensity of defined bands corrected for background. Intensity units are arbitrarily
assigned.
Immunohistochemistry of Permeabilized Cells
Following incubation, CCL-125 cells are rinsed in HBSS and fixed in 2.0%
paraformaldehyde/HBSS for 30 min at RT, and then permeabilized with 0.2% Triton X-
100 (Sigma). The Golgi complex is stained with C6NBD-ceramide (Molecular Probes)
following the manual protocol for fixed cells. Nuclei are stained with 4´, 6-diamidino-2-
phenylindole, dilactate (DAPI, dilactate, Molecular Probes Inc) at 1:25,000 dilution for 5
min and washed with HBSS for 15 min. To reduce non-specific binding of antibodies,
fixed cells are incubated in 2% BSA/1% donkey serum/phosphate buffered saline (PBS)
for 30 min at RT. Cells are then incubated for 1 hour (h) with rabbit primary polyclonal
anti-A. aegypti ferritin serum at 1:100 dilution at RT and washed twice with HBSS for 15
min each. The rabbit antibodies are detected using Cy3-conjugated donkey anti-rabbit

22
IgG (Jackson Immuno) at a dilution of 1:800 for 45 min. Cells were examined on a
Nikon ECLIPSE TE300 microscope (Nikon Instruments, Inc., Melville, New York) using
100x (n.a. 1.3) oil immersion or 40x (n.a. 0.6) objective. Stained coverslips were
photographed as digital images on a SenSys cooled CCD camera (Photometrics). For
some experiments, stained coverslips were analyzed on a Leica TCS 4D laser scanning
confocal microscope (Arizona Research Laboratory, Division of Biotechnology, The
University of Arizona, Tucson, AZ) using a 100x (n.a. 1.4) oil immersion objective.
Simultaneous two channel recording was performed and all confocal images were
derived from a single optical section. All images were merged and processed using
Adobe Photoshop 6.0 software (Adobe Systems Inc., San Jose, CA)
Immunochemistry for Living Cells
The Golgi complex was stained with BODYP®TR C5-ceramide (Molecular Probes)
following the manual protocol for living cells.
Statistics
Treatment differences are determined by one-way analysis of variance using the
Tukey’s multiple comparisons test or one-tailed unpaired t-test for comparison of selected
data sets. These data are analyzed and graphed using GraphPad software (Graph Pad
Software, Inc., San Diego, CA).
23
CHAPTER 3
RESULTS
The Effects of BFA on CCL-125 Cells
In previous work, we found that A. aegypti cells can synthesize and secrete
ferritin in response to iron treatment (43). The secretion of ferritin increases in linear
relationship with increasing iron dose and time and secreted ferritin consists
predominantly of the H chain subunits (44). Other studies have shown that blood-feeding
dramatically increases hemolymph ferritin in A. aegypti (23). Thus, we hypothesize that
ferritin secretion could be the primary mechanism that mosquito cells use to defend
against iron overload. BFA has been used to block protein secretion from the Golgi
pathway in many studies (37, 47, 48). This compound disrupts Golgi function. In order
to understand whether ferritin secretion occurs through the classical ER-Golgi pathway,
we evaluated ferritin secretion in response to BFA. As a first step in these experiments,
we determined the time and dose effects of BFA on viability, growth and Golgi apparatus
of CCL-125 cells.
A. aegypti larval cells (CCL-125) were seeded onto coverslips in 24-well plates to
>50% confluence as described in the Materials and Methods. Cells were treated with
100% ethanol (Controls) or with different doses of BFA (2, 4, 6, 8 µg/ml) dissolved in
ethanol and incubated for 0.5, 1, 1.5 or 24 h at 28oC. Following the incubation, cells
were evaluated for viability and total numbers, some coverslips were stained as described
in the Materials and Methods.

24
Viability and numbers of CCL-125 cells do not change with BFA treatment.
Figure 2 shows cell viability and cell number. Cell viability was not altered
significantly by the addition of BFA at any dose or time interval tested as measured by
MTS absorbance (Figure 2A and 2B). Cell number did not change significantly for any
samples (Figure 2C and 2D). From these data we conclude that CCL-125 cells can
tolerate BFA at doses up to 8 µg/ml, without a change in viability or growth.
0 2 4 6 80.00
0.05
0.10
0.15
0.20
0.25
0.30T00.5 h1.0 h1.5 h24 h
BFA (μg/ml)
MT
S (A
bsor
banc
eλ
492)
0.5 1.0 1.5 24.00.00
0.05
0.10
0.15
0.20
0.25
0.300 μg/ml2 μg/ml4 μg/ml6 μg/ml8 μg/ml
BFA
Time (h)
MT
S (A
bsor
banc
eλ
492)
0.0 0.5 1.0 1.5 24.00
10000
20000
30000
40000
500000 μg/ml2 μg/ml4 μg/ml6 μg/ml8 μg/ml
BFA
Time (h)
Eth
idiu
m (E
mis
sion
λ64
5 )
0 2 4 6 80
10000
20000
30000
40000
50000T00.5 h1.0 h1.5 h 24 h
BFA (μg/ml)
Eth
idiu
m (E
mis
sion
λ64
5 )
A B
C D
Figure 2. Cell viability and cell division are not decreased by BFA treatment. A. aegypti CCL-125 larval cells were grown onto coverslips in 24 well plates as described in the Materials and Methods and treated with 100% ethanol (Controls) or with different doses of BFA (2, 4, 6, 8 µg/ml) dissolved in ethanol and incubated for 0.5, 1, 1.5, or 24 h at 28oC. Following the incubation, cells were evaluated for viability by MTS absorbance. The cell viability is shown for A (dose) and B (time). Cell number was determined by ethidium with excitation at 540 nm and emission at 645 nm, and it is shown for C (dose) and D (time).

25
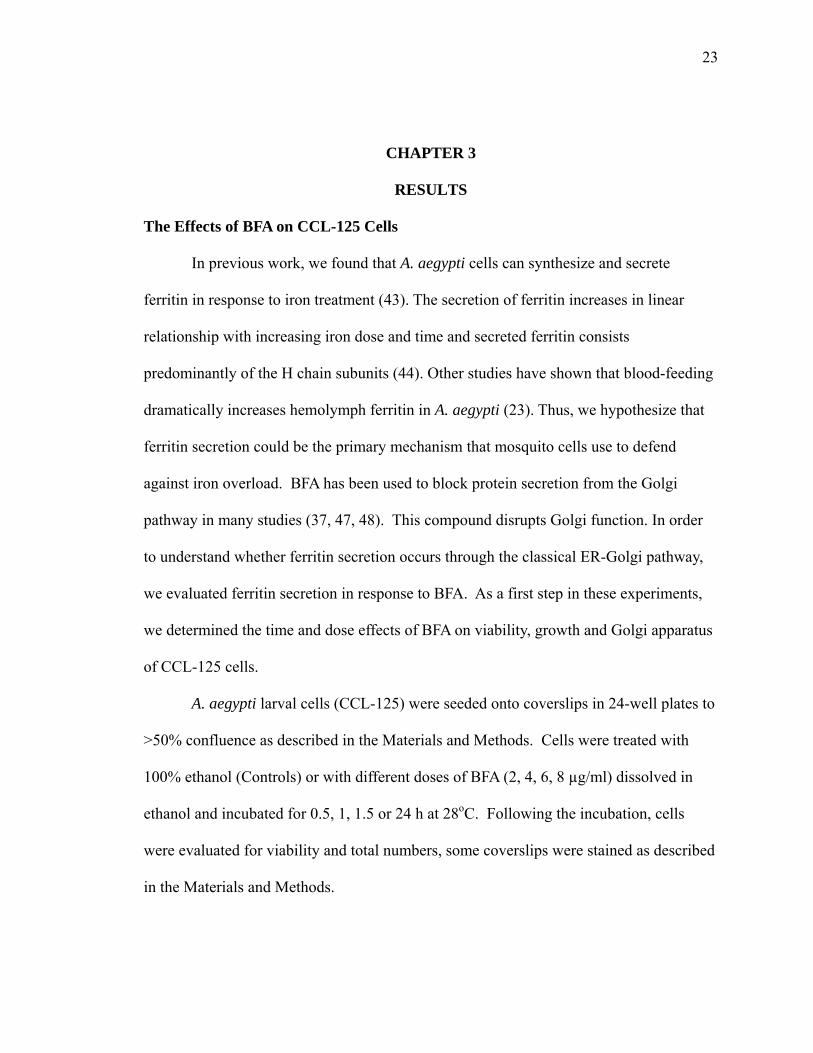
The Golgi integrity of CCL-125 cells is altered by BFA treatment.
BFA treatment of mammalian cells causes Golgi to fuse with the ER (35). We
evaluated the effects of BFA on CCL-125 cells using fluorescent microscopy. Figure 3
shows that the intensity of C6-NBD-ceramide fluorescence is not altered by the different
concentration of BFA after 30 (Figure 3A) or 60 (Figure 3B) min. However, the intensity
of fluorescence decreases with increasing BFA concentration by 90 min (Figure 3C) and
24 h (Figure 3D). These data suggest that BFA causes Golgi disassembly in CCL-125
cells after 90 min. Since C6-NBD-ceramide is subject to rapid fluorescent bleaching, we
are reluctant to draw further conclusions from these assays.
Nucleus and
Golgi
Golgi
Control 4 μg/ml BFA 6 μg/ml BFA 8 μg/ml BFA2 μg/ml BFA30 min
A
Nucleus and
Golgi
Golgi
Control 4 μg/ml BFA 6 μg/ml BFA 8 μg/ml BFA2 μg/ml BFA30 min
A
Nucleus and
Golgi
Golgi
Control 4 μg/ml BFA 6 μg/ml BFA 8 μg/ml BFA2 μg/ml BFA60 minB
Nucleus and
Golgi
Golgi
Control 4 μg/ml BFA 6 μg/ml BFA 8 μg/ml BFA2 μg/ml BFA60 minB
26
Nucleus and
Golgi
Golgi
Control 4 μg/ml BFA 6 μg/ml BFA 8 μg/ml BFA2 μg/ml BFA90 minC
Nucleus and
Golgi
Golgi
Control 4 μg/ml BFA 6 μg/ml BFA 8 μg/ml BFA2 μg/ml BFA90 minC
Nucleus and
Golgi
Golgi
Control 4 μg/ml BFA 6 μg/ml BFA 8 μg/ml BFA2 μg/ml BFA24 hD
Nucleus and
Golgi
Golgi
Control 4 μg/ml BFA 6 μg/ml BFA 8 μg/ml BFA2 μg/ml BFA24 hD
Figure 3. Golgi complex of CCL-125 cells is altered by BFA treatment. Cells were grown onto coverslips in 24-well plates to >50% confluence as described in the Materials and Methods and treated with 100% ethanol (Control) or with different doses of BFA (2, 4, 6, 8 µg/ml) dissolved in ethanol and incubated for 0.5 (A), 1 (B), 1.5 (C), or 24 (D) h at 28oC. Following the incubation, the coverslips were retained, stained and subjected to fluorescent microscopy as described in the Materials and Methods. Golgi is stained with C6-NBD-ceramide, a green fluorescent marker, and the nuclei are stained with DAPI, a blue fluorescent marker, and were examined on a microscope using 40x (n.a. 0.6) objective. The Effects of Iron on the Localization of Ferritin in CCL-125 Cells
Classical secreted proteins are targeted to the Golgi complex by an N-terminal
hydrophobic signal peptide (30). The A. aegypti mosquito ferritin subunits each contain a
putative N-terminal sequence targeting sequence (21). We evaluated the location of

27
ferritin in CCL-125 cells by testing coalescence of ferritin with a Golgi marker. Cells
were grown on coverslips in 24 wells plates to > 50% confluence and treated with HBSS
(control) or HBSS with 100 µM FAC for 18 hours. The coverslips were recovered and
stained as described in the Materials and Methods.
Ferritin is localized to the Golgi apparatus.
Prior work with immunofluorscent microscopy supported that ferritin of CCL-125
cells co-localizes with the Golgi apparatus in the presence or absence of iron (44). We
also reported that iron treatment dramatically increases the levels of membrane and
secreted ferritin in CCL-125 cells. Figure 4 shows that ferritin is perinuclear in CCL-125
cells in the absence of iron treatment and coalesces with the Golgi marker. Following
iron treatment, ferritin is located in Golgi and also in punctate vesicles that do not show
the ceramide stain. These data suggest that ferritin subunits are targeted to the Golgi, but
that there is more than one location of ferritin in these cells following iron treatment.
FAC
Control
GolgiFerritin Overlap Confocal Microscopy
FAC
Control
GolgiFerritin Overlap Confocal Microscopy
Figure 4. Ferritin co-localizes with the Golgi apparatus in CCL-125 cells. CCL-125 cells were grown on coverslips in 24 wells plates to > 50% confluence and treated with HBSS (control) or HBSS with 100 µM FAC for 18 h. The coverslips were stained as described in the Materials and Methods BODYP®TR C5-ceramide stained red shows the Golgi complex, while ferritin identified with rabbit anti-A. aegypti-ferritin serum is

28
visualized with Cy3-conjugated donkey anti-rabbit IgG, a green label. The merged picture shows the overlapping of the stains in yellow. Pictures were taken as described in the Materials and Methods and are used with permission from J.J. Mayo. The Effects of BFA on Iron-Induced Ferritin Secretion
A. aegypti larval cells secrete ferritin in response to iron treatment (43). When
these cells are treated with 100 µM FAC, secreted ferritin can be detected in the culture
medium after 9 h and secretion increases with time to 18 h (44). In the previous
experiments, we observed that treatment with BFA (2-8 µg/ml) did not adversely
influence cell viability or cell division and that the integrity of the Golgi decreases with
increasing BFA after 90 min. We also found that ferritin coalesces with the Golgi marker
for ceramide. In order to answer the question of whether BFA can interfere with iron-
induced ferritin secretion, we pre-treated cells with BFA to disturb Golgi function, and
then induced ferritin secretion with 100 µM FAC. We hypothesized that if ferritin
secretion is through classical ER-Golgi secretory pathway, we would see ferritin secretion
decrease in iron-treated cells following BFA treatment.
CCL-125 cells were seeded on coverslips in 35 mm petridishes. The cells were
treated with fresh serum-free, Medium A with 0.15% antibiotics/antimycotics and 6 µl/ml
ethanol (control) or 6 µg/ml BFA (final concentration) and incubated for 90 min.
Following BFA pretreatment, 100 µM FAC in HBSS or HBSS (control) was added to
culture medium and the cells were incubated for 9 or 18 h at 28°C. Following incubation,
the coverslips were rinsed twice with HBSS and stained as described in the Materials and
Methods.
29
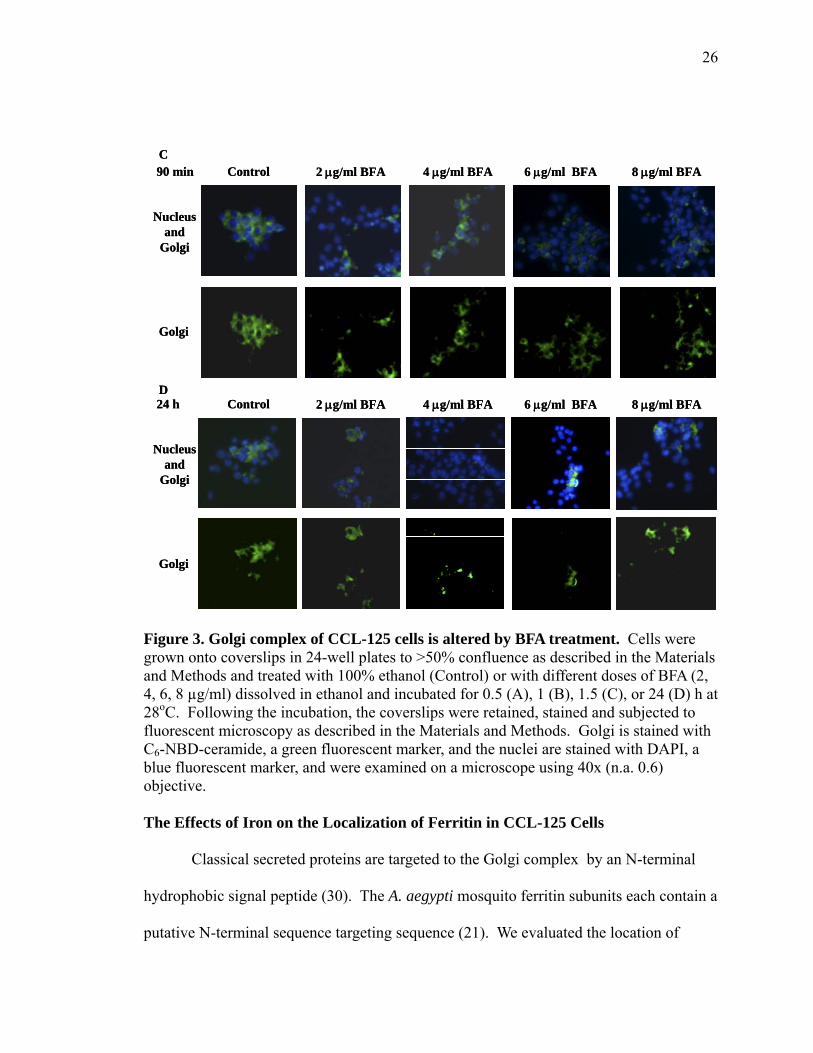
BFA and iron treatment does not decrease cell viability or cell division.
Figure 5A and 5B show that BFA and iron treatment did not reduce viability of
CCL-125 cells as measured by MTS absorbance. No significant differences were
observed for cell viability for any treatment at either time interval. Cell number was
measured by SYTOX Green nuclide stain assay to avoid interference with the ceramide
stain. Cell numbers also were not significantly reduced for any treatment at either time
interval (Figures 5C and 5D).
T0 Control FAC BFA FAC/BFA0.00
0.25
0.50
0.75
1.00
1.25
Treatment (9h)
MT
S (A
bsor
banc
eλ
492)
T0 Control FAC BFA FAC/BFA0.00
0.25
0.50
0.75
1.00
1.25
Treatment (18h)
MT
S (A
bsor
banc
eλ
492)
T0 Control FAC BFA BFA/FAC0
10000
20000
30000
Treatment (9h)
Syto
x G
reen
(Em
issi
onλ
535)
T0 Control FAC BFA BFA/FAC0
10000
20000
30000
Treatment (18h)
Syto
x G
reen
(Em
issi
onλ
535)
A B
C D
Figure 5. BFA alone or combined with FAC does not reduce viability or division of CCL-125 cells. CCL-125 cells were pretreated with BFA and then exposed to 100 µM FAC as described in the protocol and incubated as described. Viability was determined as described in the Materials and Methods by MTS absorbance for cells incubated for 9 (A) or 18 (B) h. Cell numbers were determined by SYTOX green with excitation at 485 and emission at 535 nm at 9 (C) or 18 (D) h. TO=initiation time; Control=6 µl /ml ethanol; FAC=100 µM FAC; BFA= 6 µg/ml BFA. FAC/BFA= 100 µM FAC and 6 µg/ml BFA.
30
BFA does not reduce iron uptake into CCL-125 Cells.
Calcein is a fluorescent metal sensor that detects the cytoplasmic labile iron pool
(44) because chelation of iron by calcein quenches fluorescence. Figure 6A shows that
calcein fluorescence decreases significantly when CCL-125 cells are exposed to iron
alone or in combination with BFA by 9 h (p<0.05) relative to controls. These data
indicated to us that the addition of BFA did not alter iron uptake or the intracellular
accessibility of iron to calcein. Statistical analyses by t-tests for selected treatments and
appropriate controls showed by 9 h a significant decrease occurred in emission for FAC-
treated cells relative to control cells (p<0.05), while cells treated with iron and BFA
showed a similar decrease in emission relative to cells treated with BFA alone (p<0.05).
This decline was sustained at 18 h where a t-test revealed a significant difference for
FAC-treated cells when compared with control cells (p<0.03). Although the decline in
emission for cells treated with BFA/FAC also was sustained at 18 h (Figure 6B), this
value did not reach significance relative to cells treated with BFA alone because of the
variation. From these data we conclude that iron treatment of these cells resulted in iron
uptake that was not changed by the presence of BFA. This agrees with our previous work
showing that iron uptake results in a significant increase in the labile iron pool of CCL-
125 cells and is sustained with time (44).

31
A B
T0 Control FAC BFA BFA/FAC 0
10000
20000
30000
40000
50000
60000
* *
Treatment (9h)
Cal
cein
(Em
issi
onλ
535)
T0 Control FAC BFA BFA/FAC 0
10000
20000
30000
40000
50000
60000
**
Treatment (18h)
Cal
cein
(Em
issi
onλ
535)
Figure 6. Iron is uptake by CCL-125 cells. CCL-125 cells were pretreated with BFA and then exposed to 100 µM FAC as described in the protocol and incubated for 9 or 18 h as described. Calcein was administered as described in the Materials and Methods and evaluated with excitation at 485 and emission at 535 nm. (A) Iron significantly quenches calcein fluorescence by 9 h in both FAC and FAC/BFA groups. (B) The reduction in calcein fluorescence is sustained at 18 h. * Significantly different from control by 9 h (p<0.05). ** Significantly different from control by 18 h (p<0.03). TO=initiation time; Control=6 µl /ml ethanol; FAC=100 µM FAC; BFA= 6 µg/ml BFA. FAC/BFA= 100 µM FAC and 6 µg/ml BFA.
Treatment with iron or BFA does not increase lipid peroxidation of CCL-125
cells.
Iron can induce oxidative stress in cells by Fenton chemistry. In order to
determine whether iron and/or BFA exposure increases oxidative stress in CCL-125 cells,
TBAR assays were conducted (see Materials and Methods). The standard curve for
MDA showed that all values fall within a 95% confidence interval (Figure 7). All values
for all treatment groups were negative (data not shown). These data were repeated three
times with the same results and indicate that lipid peroxidation was not increased for any
treatment group at either time interval. We cannot conclude that oxidative stress was not
induced by iron and/or BFA treatment because TBARS do not directly measure
production of superoxide or hydroxyl radicals. However, from these data we conclude

32
that if oxidative stress occurred with BFA or iron treatments, the cells were able to
recover without an increase in detectable levels of lipid peroxidation.
0 25 50 75 100 1250.0
0.1
0.2
0.3
0.4
MDA mM
Abs
orba
nce
atλ 5
50
Figure 7. MDA standard curve. Freshly diluted MDA was used as a standard. The r2 of linear regression was 0.994.
Iron treatment increases vesicle-associated ferritin.
In previous experiments, we used NBD C6-ceramide to label the Golgi complex.
This marker is not as stable to laser light as is BODYP®TR C5-ceramide (49) a stain used
to detect the Golgi complex in living cells. Ceramide is metabolized to sphingomyelin
(SM) and glucosylceramide (GlcCer) in living cells (49). These metabolites are
subsequently transported from Golgi complex to the cell membrane by a vesicle-
mediated process. BODYP®TR C5-ceramide has been used to trace lipid trafficking (50-
52). In order to see if ferritin follows this secretory pathway, cells were labeled with
BODYP®TR C5-ceramide before treatment. Ferritin distribution was visualized by
staining cells as described in the Materials and Methods. The visualization of ferritin
distribution following different treatments is shown in Figure 8 A (9 h) and 8B (18 h). At
9 h, ferritin in control cells is tightly packed around the nucleus and most is coalesced
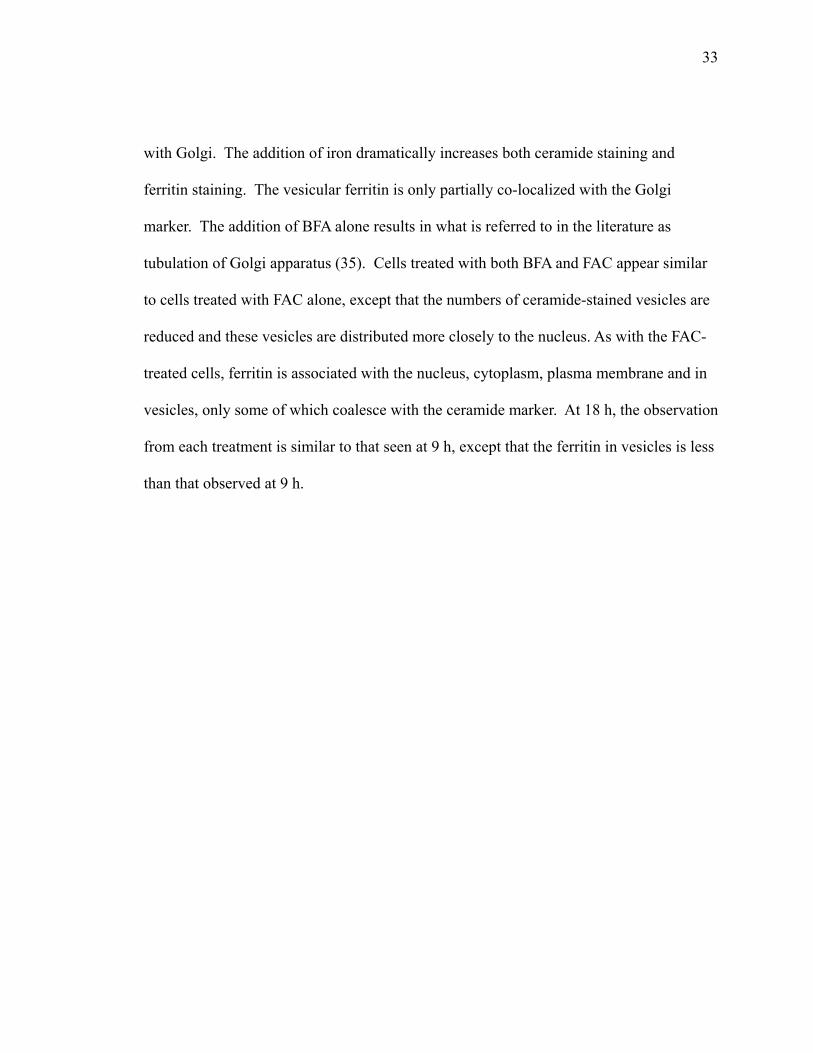
33
with Golgi. The addition of iron dramatically increases both ceramide staining and
ferritin staining. The vesicular ferritin is only partially co-localized with the Golgi
marker. The addition of BFA alone results in what is referred to in the literature as
tubulation of Golgi apparatus (35). Cells treated with both BFA and FAC appear similar
to cells treated with FAC alone, except that the numbers of ceramide-stained vesicles are
reduced and these vesicles are distributed more closely to the nucleus. As with the FAC-
treated cells, ferritin is associated with the nucleus, cytoplasm, plasma membrane and in
vesicles, only some of which coalesce with the ceramide marker. At 18 h, the observation
from each treatment is similar to that seen at 9 h, except that the ferritin in vesicles is less
than that observed at 9 h.
34
A. 9 hControl
FAC
BFA
BFA/FAC
Ceramide Ferritin OverlapA. 9 hControl
FAC
BFA
BFA/FAC
Ceramide Ferritin Overlap

35
B. 18 hControl
FAC
BFA
BFA/FAC
Ceramide Ferritin OverlapB. 18 hControl
FAC
BFA
BFA/FAC
Ceramide Ferritin Overlap
Figure 8. Ferritin distribution in CCL-125 cells following iron and BFA exposure. CCL-125 cells were pretreated with BFA and then exposed to 100 µM FAC for 9 (A) or 18 (B) h as described. BODYP®TR C5-ceramide was added prior to treatment and ferritin was visualized in permeabilized cells as described in the Materials and Methods. Golgi complex is stained with BODYP®TR C5-ceramide shown in red while ferritin identified with rabbit anti-A. aegypti-ferritin is visualized with Cy 3 TM conjugated goat anti-rabbit IgG shown in green. The overlapping area of Golgi and ferritin is shown in yellow. BFA=6 µg/ml BFA; FAC=100µM FAC; Control=HBSS; BFA/FAC=100µM FAC/6 µg/ml BFA.

36
BFA does not block iron-induced ferritin secretion.
We examined ferritin secretion by immunoblotting samples from the culture
medium conducted as described in the Materials and Methods. In previous studies, we
reported that iron treatment induces ferritin secretion by 9 h, secretion is significantly
increased by 18 h and secreted ferritin consists of only the 24 and 26 kDa H chain
subunits (43,44), Unexpectedly, in these experiments, we found that ferritin secretion is
not blocked by BFA (Figure 9). The amount of secreted ferritin from the FAC/BFA
treatment group is not significantly different from that of cells treated with FAC alone.
This experiment was repeated twice and the data are consistent. The fact ferritin
secretion is not blocked by BFA indicates that either CCL-125 cells are not sensitive to
BFA or that ferritin can be exported independently of the Golgi complex. The latter
notion is supported by the visual images indicating the ferritin is found in vesicles that
are not associated with ceramide and indicate that the customary tubulation of Golgi
following BFA treatment is seen in CCL-125 cells. Unfortunately, at this writing there is
no known protein that is secreted from CCL-125 cells that is blocked by BFA that could
serve as a positive control; work to find a positive control is ongoing. Nonetheless these
data support that ferritin secretion is not blocked by BFA treatment.
C F/B B CF F/B B CF F/B B CFF/B B CFCT0 T018h 9h 18h9h
Set A Set B
2520
kDa
2520
kDa
C F/B B CF F/B B CF F/B B CFF/B B CFCT0 T018h 9h 18h9h
Set A Set B
2520
kDa
2520
kDa
Figure 9. Iron-induced ferritin secretion is not blocked by BFA. CCL-125 cells were pretreated with BFA and then exposed to 100 µM FAC as described above for the time indicated. All lanes were loaded with 6 µg protein from culture medium and the samples were resolved by SDS-PAGE on a 17.5% SDS-gel and transferred to nitrocellulose

37
membrane as described in the Materials and Methods. Rabbit anti-A. aegypti ferritin serum was used to detect ferritin. Data from two sets of three cell culture sets are shown. The first and last lanes are molecular mass standards (BIORAD) C=Control, HBSS; F= 100 µM FAC; B= 6 µg/ml BFA; F/B= 100 µM FAC and 6 µg/ml BFA; T0=initiation time; h=hours. Treatment with a Second Golgi Blocking Agent, Monensin
Our data show that iron-induced ferritin secretion is not reduced by the addition
of BFA. There are some possible reasons for this observation. First, although our results
are consistent with changes in the Golgi following BFA treatment, CCL-125 cells may
not be sufficiently sensitive to BFA to prevent secretion. Other studies have shown that
the Golgi complex is resistant to BFA in multidrug-resistant cells (39). Second, ferritin
could be secreted by other pathways that are independent of the Golgi complex. Secreted
ferritin consists primarily of the H chain that has a glycosylation site. However, available
data indicate that this subunit is not glycosylated, but undergoes some other type of post
translational processing. Holoferritin has been observed in the vacuolar system of
Drosophila melanogaster, another Dipteran, as well as C. ethlius larvae (53). These
authors postulate that ferritin in midgut could use the rough ER or smooth ER for
transport without targeting to the Golgi complex (26,54). Alternatively, one subunit
could be targeted to the Golgi and the other to a second secretory compartment. Since
our polyclonal antibody detects both subunits, we can not at this time discriminate the
locations of the individual subunits. In an effort to further elucidate ferritin secretion and
because we lack a positive control, we tested secretion in the presence of another Golgi
blocking compound, monensin. Monensin has been used to block protein secretion from
the classical Golgi pathway in many studies (35,55). Monensin is a carboxylic ionophore
38
that disrupts Golgi function by interfering with Na+/H+ exchange (35) and thereby,
inhibiting transport primarily from the trans Golgi (cholesterol-rich membranes).
To assess the effects of monensin on CCL-125 cell viability, cells were seeded
onto coverslips in 35 mm petridishes, grown to 50% confluence as described in the
Materials and Methods and subsequently treated with fresh serum-free, antibiotics free
Medium A and HBSS with ethanol (control), or HBSS with 1, 2.5, 5 or 10 µM monensin
and incubated for 1, 1.5, 3 or 6 h at 28oC. Following incubation, the cells were rinsed
twice with HBSS and coverslips were placed into 24-well plates for following assays.
Cell viability decreases with monensin dose.
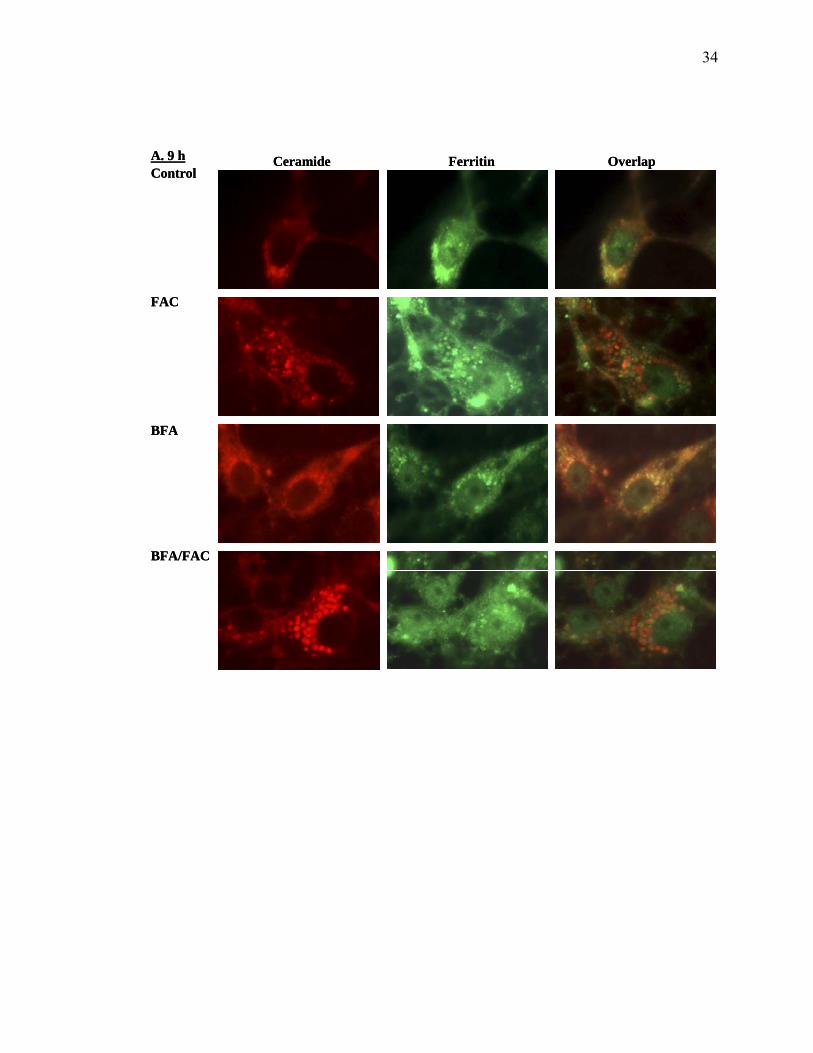
Cell viability declines directly with monensin dose (Figure 10). Treatment of
cells with 1 µM monensin results in a decline in absorbance of 18% relative to control
cells by 1 h. Data suggest that this decline in sustained at 3 (18%) and 9 (28%) h. This
experiment was not repeated; thus, no statistical analysis is reported. Cell number was
determined by SYTOX Green nucleic acid stain. Cell numbers for 2.5, 5 and 10 µM
monensin treatments by 3 h are 8%, 11.5%, and 13.3% lower than controls, respectively.
However, overall these data suggest that monensin does not significantly alter division of
CCL-125 cells. From these preliminary data we conclude that monensin reduces viability
of CCL-125 cells as measured by mitochondrial function, but does not alter cell division.
At 1 µM monensin, cell viability remain at 70% or greater; thus, this level of monensin
was used for the following experiment.

39
1.0 1.5 3.0 9.00
25
50
75
100Control1 μM2.5 μM5 μM10 μM
Monensin
Time (h)
MT
S (%
Con
trol
)
1.0 1.5 3.0 9.00
25
50
75
100
125Control1μM2.5μM5μM10 μM
Time(h)
Syto
x G
reen
( %
Con
trol
) Monensin
A B
Figure 10. Cell viability of CCL-125 cells decrease with increasing concentration of Monensin. A. Cell viability was measured by MTS assay as described in the Materials and Methods. B. Cell number was measured by SYTOX Green nucleic acid stain kit as described in the Materials and Methods. Data are showing as % control. Control=6µl/ml ethanol; h=hour The Effects of BFA or Monensin on Ferritin Secretion
We decided to test a second agent that is known to block secretion of proteins
from the classical ER-Golgi pathway because we did not observe any decrease in ferritin
secretion following treatment with BFA. We previously found that CCL-125 cell
membrane-associated ferritin increases at 6 h, declines at 9 h, peaks at 12 h and declines
at 18 h, and that secreted ferritin can be detected in culture medium by immunoblot
following iron treatment for 9 h (44). We also observed here that iron treatment increases
vesicular ferritin measurably by 9 h. These data, taken together, indicate that by 9 h
ferritin is targeted to a secretory pathway. The experimental design for this set of
experiments differs from that of our previous experiments and is designed to test
blocking of ferritin secretion, after it is targeted to the secretory pathway. We first added
iron to the culture medium to induce ferritin synthesis and targeting for 9 h. We then
added the blocking reagents and continued the incubation for 3 and 9 h.

40
Cells were grown in vented 25 cm2 tissue culture flasks (Corning Incorporated,
Corning, NY) to > 80% confluence as described in the Materials and Methods.
Following the incubation for 1 h in serum-free Medium A, this medium was removed and
replaced with fresh serum-free Medium A with antibiotics/antimycotics to which was
added HBSS (control) or 100 μM FAC to induce ferritin synthesis and secretion. The
cells were subsequently incubated for 9 h at 28oC and then treated with 8µg/ml BFA,
1µM monensin or ethanol (control for BFA and monensin). We chose to use a higher
concentration of BFA because we found in our earlier experiment that this dose does not
decrease viability of CCL-125 cells (Figure 2). Following treatment with either blocking
agent, the cells were incubated for 3 or 9 h. A scheme of this experimental design is
shown in Figure 11.

41
CCL-125 cells
100 µMFAC HBSS
T0
(9 h incubation)
9h
Ethanol BFAHBSS Monensin Ethanol BFAHBSS Monensin
(3 h incubation)
12h
(6 h incubation)
18hEnd End
Iron group Control group
CCL-125 cells
100 µMFAC HBSS
T0
(9 h incubation)
9h
Ethanol BFAHBSS Monensin Ethanol BFAHBSS Monensin
(3 h incubation)
12h
(6 h incubation)
18hEnd End
CCL-125 cells
100 µMFAC HBSS
T0
(9 h incubation)
9h
Ethanol BFAHBSS Monensin Ethanol BFAHBSS Monensin
(3 h incubation)
12h
(6 h incubation)
18hEnd End
Iron group Control group
Figure 11. The experimental design for testing BFA and monensin as blocking agents of ferritin secretion. After 1 hour incubation with serum free medium, the cells in the iron group were treated with 100 µM FAC and an equal volume of HBSS was added to control group. After 9 h incubation, the agents indicated were added to the culture medium and the cells were incubated for 3 or 6 h. Samples were collected at 9, 12, and 18 h post iron treatment (3 and 6 h post chemical treatment). BFA=8 µg/ml BFA; Ethanol=6µl/ml ethanol; Monensin=1 µM monensin; h=Hour; T0=Initiation time.
Iron influenced cell viability as measured by MTS.
Cell viability is shown in Figure 12. A comparison of the iron treatment groups at
9 and 12 h (textured bars) to their respective controls (solid bars of the same color) shows

42
H H Fe H Fe E Fe/E M Fe/M B Fe/B0.0
0.1
0.2
0.3
0.4
9h0h 12h
ab c
d
Treatment
MT
S(A
bsor
banc
eλ 4
92)
H H Fe E Fe/E M Fe/M B Fe/B0.0
0.1
0.2
0.3
0.4
0h 18hTreatment
MTS
(Abs
orba
nceλ 4
92)
*
A B
Figure 12. Cell viability of CCL-125 cells is reduced by iron and monensin. Cells were treated according to the protocol described for Figure 11. (A) Iron treatment compromised mitochondrial activity at 9 h and 12 h. Cell viability is significantly different from their respective FAC-treated groups. (a, p<0.05; b, p<0.05; c, p<0.01; d, p<0.01). (B) Mitochondrial activity recovers by 18 h. *Viability of cells treated with monensin differed significantly from cells treated with HBSS (p<0.001), ethanol (p<0.05) and BFA (p<0.01). H=HBSS; Fe=100 µM FAC; E=6µl/ml ethanol B=BFA BFA (8µg/ml); M=1 µM monensin; h=hour; 0 h=initiation time.
that iron treatment significantly reduced mitochondrial activity by 9 h (p<0.002).
However, the viability was not less than that at 0 h. The MTS decrease was sustained at
12 h (3 h treatment with blocking reagents) for all cells treated with iron. No significant
differences were found among iron-treated groups at 12 h indicating that the addition of
BFA or monensin to the iron-treated cells did not further alter mitochondrial function at
this time interval. Further, the addition of ethanol alone or blocking reagents did not
compromise mitochondrial function as no significant differences were found among the
different control groups. By 18 h, mitochondrial function of the iron-treated groups
recovered except for cells treated with monensin. MTS for cells treated with monensin
differed significantly from cells treated with HBSS (p<0.001), ethanol (p<0.05) and BFA
(p<0.01). This agrees with our previous information that monensin compromises cell

43
viability. However, there was no significant difference between cells treated with FAC
and monensin relative to cells treated with monensin alone. Cell numbers were not
significantly different for any group at 9 and 12 h indicating that cell division was not
compromised and that the values for cell viability analyses reflect changes in
mitochondrial activity and not in cell numbers (Figure 13). By 18 h, no significant
differences were observed when FAC-treated groups (textured bars) were compared with
their respective control group (solid bars of the same color). From these data, we
conclude that the addition of iron results in a decrease in measurable mitochondrial
activity at early time intervals and that this recovers with longer incubation time.
H H Fe H Fe E Fe/E M Fe/M B Fe/B0
10000
20000
30000
40000
50000
9h0h 12h
Treatment
Eth
idiu
m B
rom
idde
(Em
issi
onλ 6
45)
H H Fe E Fe/E M Fe/M B Fe/B0
10000
20000
30000
40000
50000
0h 18hTreatment
Eth
idiu
m B
rom
idde
(Em
issi
onλ
645)
A B
Figure 13. Cell division of CCL-125 cells is not affected by iron or BFA. Cells were treated according to the protocol described for Figure 12 and incubated for 9 (A), 12 (A) or 18 h (B). Treatments did not compromised cell numbers at any time interval. H=HBSS; Fe=100 µM FAC; E=6µl/ml ethanol B=BFA BFA (8µg/ml); M=1 µM monensin; h=hour; 0 h=initiation time.
Iron uptake by CCL-125 cells is not changed by the addition of BFA or monensin.
Fluorescent calcein assay was measured to assess iron uptake by CCL-125 cells.
Calcein fluorescence was quenched by the addition of 100 µM FAC by 9 h relative to

44
control cells at the same time interval (p<0.001, Figure 14). This quench was sustained at
12, and 18 h, FAC-treated cells were significantly different from their respective controls
at p<0.001. But no significant differences were found among FAC-treated groups at
either 12 or 18 h. These data indicate that neither BFA nor monensin interfered with iron
uptake in these cells. From these data we conclude iron was taken into the cells without
compromise for all treatment groups.
H H Fe H Fe E Fe/E M Fe/M B Fe/B0
10000
20000
30000
40000
50000
9h0h 12hTreatment
Cal
cien
(Em
issi
onλ
535)
H Fe E Fe/E M Fe/M B Fe/B0
10000
20000
30000
40000
50000
Treatment (at 18 h)
Cal
cien
(Em
issi
onλ
535)
A B
Figure 14. Iron uptake is not compromised by treatment with BFA or monensin. Cells were treated according to the protocol described for Figure 11 for 9 (A), 12 (A) or 18 h (B). FAC administration resulted in calcein fluoresce quench for all iron-treated groups. All iron treatment groups differed significantly from their respective controls (p<0.001). H=HBSS, Hanks balanced salt solution; F=FAC (100 µM ferric ammonium citrate); B=BFA BFA (8µg/ml); M=monensin (1 µM); h=hour; 0h=initial time.
BFA or monensin do not block iron-induced ferritin secretion of CCL-125 cells.
As we have seen in previous work, ferritin secretion of CCL-125 cells is induced
by the addition of iron and the amount of secreted ferritin increases as a function of
incubation time as seen in Fig 15 ((44), (43,56). Figure 16 shows ferritin secreted in the
culture medium as measured by immunoblotting for three experiments done
simultaneously according to the protocol described for Figure 11. Clearly, iron-induced

45
ferritin secretion was not significantly decreased by addition of either BFA or monensin.
By 12 h, cells treated with FAC and BFA showed ferritin secretion was reduced by only
1.9% relative to cells treated with FAC and ethanol alone. Monensin also does not reduce
ferritin secretion and the levels at 12 h (3 h after treatment with the blocking agent) are
1.2% more than controls. Increasing incubation time did not further reduce secretion in
response to BFA as observed at 18h (6 h post treatment with the blocking agents, Figure
17). Reduction of secreted ferritin at 18 h is 1.2% for FAC/BFA treated cells. A
reduction of 9.7% was observed for FAC/monensin treated cells relative to cells treated
with FAC and ethanol. These data suggest that the Golgi disrupting agents, BFA and
monensin, do not interfere with iron-induced ferritin secretion in CCL-125 larval cells at
these time intervals. Although we can not conclude that greater time would not have
reduced ferritin secretion, our previous experiment where cells were treated with BFA for
18 h argues against this possibility. Taken together our data indicate that although ferritin
coalesces with markers for the Golgi complex, an alternate pathway is employed by these
cells for ferritin secretion.
kDa
12h
FAC FAC HBSS HBSSFACHBSS
18h9h
1 2
2426 25
20
kDa
12h
FAC FAC HBSS HBSSFACHBSS
18h9h
1 2
2426 25
20
Figure 15. Ferritin secretion in response to iron supplementation increases with time. Cells were treated with 100 µM FAC or HBSS according to the protocol described for Figure 11 and incubated for 9, 12 and 18 h. Protein (3 µg) from cell culture media was resolved by 18.5% SDS-PAGE, transferred to nitrocellulose and ferritin was detected as described in the Materials and Methods. Lane 1 is purified Aedes ferritin (1 µg) as a positive control and lane 2 is molecular mass standards (BIORAD) FAC=100 FAC; h=hour.

46
kDa
2520
37
26
kDa
24HBSS9H FAC EtOH BFA MON HBSS EtOH BFA MON HBSS EtOH BFA MON
Set A Set B Set C
1 2
HBSS EtOH BFA MON0
500
1000
1500
2000
2500
3000
3500
Treatment
Peak
Inte
nsity
EtOH BFA MON0.0
0.2
0.4
0.6
0.8
1.0
1.2
Treatment
% o
f Con
trol
A B
kDa
2520
37
26
kDa
24HBSS9H FAC EtOH BFA MON HBSS EtOH BFA MON HBSS EtOH BFA MON
Set A Set B Set C
1 2
HBSS EtOH BFA MON0
500
1000
1500
2000
2500
3000
3500
Treatment
Peak
Inte
nsity
EtOH BFA MON0.0
0.2
0.4
0.6
0.8
1.0
1.2
Treatment
% o
f Con
trol
A B
HBSS EtOH BFA MON0
500
1000
1500
2000
2500
3000
3500
Treatment
Peak
Inte
nsity
EtOH BFA MON0.0
0.2
0.4
0.6
0.8
1.0
1.2
Treatment
% o
f Con
trol
A B
Figure 16. BFA and monensin did not decrease ferritin secretion by 12 h. Cells were treated with 100 µM FAC according to protocol described in figure 11 for 12 h. 3 µg protein from the culture medium was resolved by 18.5% SDS-PAGE. The immunoblot is shown above the graphed data. Panel represents amount of secreted ferritin showing in peak intensity. Figure B is ferritin secretion by % control. First lane was loaded with 1 µg purified Aedes aegypti ferritin as a positive control. Second and last lanes are molecular mass standards (BIORAD). There is no significant difference between all treatments. H=HBSS; F=100 µM FAC; B=8 µg/ml BFA; M=1 µM monensin.

47
HBSS EtOH BFA MON0
500
1000
1500
2000
2500
3000
3500
Treatment
Peak
Inte
nsity
Et OH BFA M ON0.0
0.2
0.4
0.6
0.8
1.0
1.2
Treatment
% o
f Con
trol
A B
24
Set A Set B Set C
kDa
2025
37
HBSS EtOH BFA MON HBSS EtOH BFA MON HBSS EtOH BFA MON26
kDa
1 2
HBSS EtOH BFA MON0
500
1000
1500
2000
2500
3000
3500
Treatment
Peak
Inte
nsity
Et OH BFA M ON0.0
0.2
0.4
0.6
0.8
1.0
1.2
Treatment
% o
f Con
trol
A B
24
Set A Set B Set CSet A Set B Set CSet B Set C
kDa
2025
37
2025
37
HBSS EtOH BFA MON HBSS EtOH BFA MON HBSS EtOH BFA MON26
kDa
1 2
Figure 17. BFA and monensin did not decrease ferritin secretion by 18 h. Cells were treated with 100 µM FAC according to protocol described in figure 12 for 18 h. 3 µg total protein from culture medium was resolved by 18.5% SDS-PAGE. The immunoblot is shown above the graphed data. Panel A represents amount of secreted ferritin by peak intensity. Panel B is ferritin secretion by % control. Lane 1 was loaded with 1 µg purified Aedes aegypti ferritin as a positive control. Second and last lanes are molecular mass standards (BIORAD). There is no significant difference between all treatments. H=HBSS; F=100 µM FAC; B=8 µg/ml BFA; M= 1 µM monensin.

48
CHAPTER 4
DISCUSSION AND FUTURE DIRECTION
Ferritin has been postulated to serve as both a storage protein and a carrier protein
for iron in insects. Studies have shown that blood-feeding dramatically increases
hemolymph ferritin in A. aegypti (23). In our previous work, we found that A. aegypti
cells synthesize and secrete ferritin in response to iron treatment (43). Ferritin secretion
increases in direct linear relationship with iron dose and exposure time and consists
predominantly of the H chain subunit (44). We also found that ferritin co-localizes with
Golgi (44). Thus, we hypothesized that ferritin secretion could be the primary
mechanism that mosquito cells use to defend against iron overload, that this secretion
might occur via the classical ER-Golgi pathway and that we could block ferritin secretion
with Golgi blocking agents.
BFA and monensin have been used to block protein secretion from this classical
pathway in many studies (37,47,48) because these compounds disrupt Golgi function. In
order to test our hypothesis, we used these constituents to block ferritin secretion from
Aedes CCL-125 cells. BFA did not alter viability of CCL-125 cells, while monensin
reduced cell viability. Others have observed that BFA does not alter the viability of cells
of another mosquito line, Aedes albopictus (47,57). When we applied BFA to CCL-125
cells and then induced ferritin secretion with iron, we found that BFA failed to reduce
secretion. To further investigate this, we induced ferritin secretion by exposing the cells
to iron and then attempted to reduce ferritin secretion with either BFA or monensin.
Neither of these Golgi disrupting agents blocked iron-induced ferritin secretion of CCL-

49
125 cells. Why this is we do not know. The fact that neither BFA nor monensin block
iron-induced ferritin secretion strongly implies that ferritin secretion occurs from a
pathway other than the traditional ER-Golgi pathway. Several mammalian proteins are
secreted independent of the Golgi. These proteins are generally lacking a signal peptide
and secretion is not reduced by Golgi disruptive agents, such as BFA and monensin (41).
Although A. aegypti H chain contains a putative signal peptide (21), the role of this signal
sequence in targeting the H chain to the Golgi has not been confirmed. Future studies
evaluating the targeting of H chain ferritin-GFP in mammalian cells using well defined
positive control proteins could serve to further characterize H-chain location.
Alternatively, CCL-125 cells could be resistant to BFA and monensin. The tubulation of
the Golgi complex in response to BFA that we observed and the fact that neither agent
could block iron-induced ferritin secretion argues against this possibility. However, BFA
affects glycoprotein production and formation in West Nile virus infected Vero cells, but
not in A. albopictus C6/36 cells (47). Monensin affected Mayaro virus replication in
infected TC7 (African green monkey kidney) cells, but not in C6/36 cells (57). These
findings suggest that mosquito cells might respond differently to these reagents than
mammalian cells.
Several approaches could be used to further evaluate the ferritin secretion of
CCL-125 cells. We could attempt to block ferritin secretion from the ER using CI-976 (2,
2-methyl-N-92, 4, 6-trimethoxyphenyl) that inhibits COP II vesicles budding from ER
(58). Since the only known way protein exits the ER destined for the Golgi is by COPII
coated vesicles, we could possibly block secretion in this way. Another approach is to
50
use specific antiserum for each ferritin subunit in tandem with markers for other cell
compartments to assess the cellular location of the ferritin subunits. Although we
continue to look for a protein that can serve as a positive control for secretion from the
ER-Golgi pathway in these cells, we also could express a mammalian secreted protein in
CCL-125 cells as a positive control to determine whether A. aegypti ferritin can be
secreted independently from Golgi.
Currently we are studying the processing of the ferritin subunits. One of the most
important functions of Golgi and ER is protein glycosylation. Although the H chain
contains a glycosylation site, studies with Concanavalin A indicate this subunit is not
glycosylated, while studies using enzymatic deglycosylation remain inconclusive at this
time. We also will determine whether secreted ferritin is loaded with iron and if the iron
load increases in response to iron dose by radio-labeled pulse chase experiments. Lastly,
we have initiated transgenic studies in mosquitoes to knock out the H chain by RNAi.
This is an entirely different approach to determine the importance of secreted ferritin to
iron transport and storage in this animal.
The cellular distribution of ferritin as observed by immunofluorescence supports
that ferritin is present prior to iron treatment and that it is found associated with Golgi
and non-Golgi vesicles. Iron treatment dramatically increases ferritin distributed to these
compartments as well as to the cytoplasm. Iron treatment increases vesicular ferritin,
some of which is not co-localized with Golgi; these observations are more apparent at 9 h
than 18 h. These studies support conclusively that ferritin is not found exclusively
within the Golgi. They strongly support our previous work showing that ferritin is
51
present in these cells in the absence of iron and that iron dramatically stimulates
intracellular ferritin in several cell locations. They further suggest that one or both of the
subunits is associated with the nucleus and support that ferritin in the plasma membrane
increases following iron exposure.
In conclusion, mosquito cells secrete ferritin in response to iron exposure, and this
secretion is probably through a non-classical secretory pathway.

52
REFERENCES
1. WHO. (2001) World Health Organization 2. WHO. (2002) World Health Organization 3. Eisenstein, R. S. (2000) Annu Rev Nutr 20, 627-662 4. McCord, J. M. (1998) Semin Hematol 35, 5-12 5. Shayeghi, M., Latunde-Dada, G. O., Oakhill, J. S., Laftah, A. H., Takeuchi, K.,
Halliday, N., Khan, Y., Warley, A., McCann, F. E., Hider, R. C., Frazer, D. M., Anderson, G. J., Vulpe, C. D., Simpson, R. J., and McKie, A. T. (2005) Cell 122, 789-801
6. Latunde-Dada, G. O., Van der Westhuizen, J., Vulpe, C. D., Anderson, G. J., Simpson, R. J., and McKie, A. T. (2002) Blood Cells Molecules & Diseases 29, 356-360
7. Gunshin, H., Mackenzie, B., Berger, U. V., Gunshin, Y., Romero, M. F., Boron, W. F., Nussberger, S., Gollan, J. L., and Hediger, M. A. (1997) Nature 388, 482-488
8. Vulpe, C. D., Kuo, Y. M., Murphy, T. L., Cowley, L., Askwith, C., Libina, N., Gitschier, J., and Anderson, G. J. (1999) Nat Genet 21, 195-199
9. Bali, P. K., Zak, O., and Aisen, P. (1991) Biochemistry 30, 324-328 10. Bali, P. K., and Aisen, P. (1991) Biochemistry 30, 9947-9952 11. Bali, P. K., and Aisen, P. (1992) Biochemistry 31, 3963-3967 12. Nunez, M. T., Gaete, V., Watkins, J. A., and Glass, J. (1990) J Biol Chem 265,
6688-6692 13. Tchernitchko, D., Bourgeois, M., Martin, M. E., and Beaumont, C. (2002)
Biochem J 363, 449-455 14. Harrison, P. M., and Arosio, P. (1996) Biochimica et Biophysica Acta 1275, 161-
203 15. Torti, F. M., and Torti, S. V. (2002) Blood 99, 3505-3516 16. Rucker, P., Torti, F. M., and Torti, S. V. (1996) Journal of Biological Chemistry
271, 33352-33357 17. Ghosh, S., Hevi, S., and Chuck, S. L. (2004) Blood 103, 2369-2376 18. Pascoa, V., Oliveira, P. L., Dansa-Petretski, M., Silva, J. R., Alvarenga, P. H.,
Jacobs-Lorena, M., and Lemos, F. J. (2002) Insect Biochemistry & Molecular Biology 32., 517-523
19. Yoshiga, T., Hernandez, V. P., Fallon, A. M., and Law, J. H. (1997) Proceedings of the National Academy of Sciences of the United States of America 94, 12337-12342
20. Huebers, H. A., Huebers, E., Finch, C. A., Webb, B. A., Truman, J. W., and Riddiford, L. M. (1988) J. Comp. Physiol. B 158, 291-300
21. Nichol, H., Law, J. H., and Winzerling, J. J. (2002) Annual Review of Entomology 47, 535-559
22. Harizanova, N., Georgieva, T., Dunkov, B. C., Yoshiga, T., and Law, J. H. (2005) Insect Molecular Biology 14, 79-88
23. Dunkov, B. C., Georgieva, T., Yoshiga, T., Hall, M., and Law, J. H. (2002)

53
Journal of Insect Science. 2, 7-17 24. Winzerling, J., and Pham, D. Q. (2004) in Comprehensive Insect Physiology,
Biochemistry, Pharmacology and Molecular Biology. Biochemistry and Molecular Biology. (Gilbert, L. I., Iatrou, K., and Gill, S., eds), Elsevier Press
25. Winzerling, J. J., Nez, P., Porath, J., and Law, J. H. (1995) Insect Biochemisty & Molecular Biology 25, 217-224
26. Locke, M. (2003) Annual Review of Entomology 48, 1-27 27. Locke, M., and Leung, H. (1984) Tissue & Cell 16, 739-766 28. Renaud, D. L., Nichol, H., and Locke, M. (1991) Journal of Submicroscopic
Cytology and Pathology 23, 501-507 29. Locke, M., Ketola-Pirie, C., Leung, H., and Nichol, H. (1991) J. Insect Physiol.
37, 297-309 30. Walter, P., Gilmore, R., and Blobel, G. (1984) Cell 38, 5-8 31. Lee, M. C., Miller, E. A., Goldberg, J., Orci, L., and Schekman, R. (2004) Annu
Rev Cell Dev Biol 20, 87-123 32. Martinez-Menarguez, J. A., Geuze, H. J., Slot, J. W., and Klumperman, J. (1999)
Cell 98, 81-90 33. Warren, G., and Mellman, I. (1999) Cell 98, 125-127 34. van Vliet, C., Thomas, E. C., Merino-Trigo, A., Teasdale, R. D., and Gleeson, P. A.
(2003) Prog Biophys Mol Biol 83, 1-45 35. Dinter, A., and Berger, E. G. (1998) Histochem Cell Biol 109, 571-590 36. Donaldson, J. G., Honda, A., and Weigert, R. (2005) Biochim Biophys Acta 1744,
364-373 37. Nebenfuhr, A., Ritzenthaler, C., and Robinson, D. G. (2002) Plant Physiol 130,
1102-1108 38. Lippincott-Schwartz, J., Yuan, L., Tipper, C., Amherdt, M., Orci, L., and Klausner,
R. D. (1991) Cell 67, 601-616 39. Erokhina, M. V., Stavrovskaya, A. A., and Onishchenko, G. E. (1999) Membr Cell
Biol 12, 871-882 40. Mollenhauer, H. H., Morre, D. J., and Rowe, L. D. (1990) Biochim Biophys Acta
1031, 225-246 41. Nickel, W. (2003) Eur J Biochem 270, 2109-2119 42. Nickel, W. (2005) Traffic 6, 607-614 43. Geiser, D. L., Zhang, D., and Winzerling, J. J. (2006) Insect Biochem Mol Biol 36,
177-187 44. Geiser, D. L., Mayo, J. J. and Winzerling, J. J. (2006) Insect Biochemistry &
Molecular Biology Submitted 45. Morel, D. W., DiCorleto, P. E., and Chisolm, G. M. (1984) Arteriosclerosis 4, 357-
364 46. Geiser, D. L., Chavez, C. A., Flores-Munguia, R. F., Winzerling, J. J., and Pham,
D. Q. (2003) European Journal of Biochemistry 270, 1-8 47. Sreenivasan, V., Ng, K. L., and Ng, M. L. (1993) J Virol Methods 45, 1-17 48. Da Costa, L. J., and Rebello, M. A. (1999) Acta Virol 43, 357-360 49. Pagano, R. E., Martin, O. C., Kang, H. C., and Haugland, R. P. (1991) J Cell Biol

54
113, 1267-1279 50. Lipsky, N. G., and Pagano, R. E. (1985) J Cell Biol 100, 27-34 51. Shiao, Y. J., and Vance, J. E. (1993) J Biol Chem 268, 26085-26092 52. van Helvoort, A., Giudici, M. L., Thielemans, M., and van Meer, G. (1997) J Cell
Sci 110 ( Pt 1), 75-83 53. Nichol, H. K., and Locke, M. (1990) Tissue and Cell 22, 767-777 54. Locke, M., and Nichol, H. (1992) Annu. Rev. Entomol. 37, 195-215 55. Gunne, H., and Steiner, H. (1993) Eur J Biochem 214, 287-293 56. Geiser, D. L., Mayo, J. J. and Winzerling, J. J. (unpublished) 57. De Campos, R. M., Ferreira, D. F., Da Veiga, V. F., Rebello, M. A., and Rebello,
M. C. (2003) Acta Virol 47, 113-119 58. Brown, W. J., and Schmidt, J. A. (2005) Methods Enzymol 404, 115-125