feng et al, 2012 - georgia institute of...
TRANSCRIPT

Active deformation near the Nicoya Peninsula, northwestern CostaRica, between 1996 and 2010: Interseismic megathrust coupling
Lujia Feng,1,2 Andrew V. Newman,1 Marino Protti,3 Víctor González,3 Yan Jiang,4
and Timothy H. Dixon4,5
Received 12 February 2012; revised 1 May 2012; accepted 14 May 2012; published 26 June 2012.
[1] We use campaign and continuous GPS measurements at 49 sites between 1996 and2010 to describe the long-term active deformation in and near the Nicoya Peninsula,northwestern Costa Rica. The observed deformation reveals partial partitioning of theCocos-Caribbean oblique convergence into trench-parallel forearc sliver motion and lessoblique thrusting on the subduction interface. The northern Costa Rican forearc translatesnorthwestward as a whole ridge block at 11 � 1 mm/yr relative to the stable Caribbean.The transition from the forearc to the stable Caribbean occurs in a narrow deforming zoneof �16 km wide. Subduction thrust earthquakes take 2/3 of the trench-parallel componentof the plate convergence; however, surface deformation caused by interseismic megathrustcoupling is primarily trench-normal. Two fully coupled patches, one located offshoreNicoya centered at �15 km depth and the other located inland centered at �24 km depth,are identified in Nicoya with the potential to generate an Mw 7.8 1950-type earthquake.Another fully coupled patch SE of Nicoya coincides with the rupture region of the 1990Nicoya Gulf earthquake. Interface microearthquakes, non-volcanic tremor, low-frequencyearthquakes, and transient slow-slip events generally occur in the intermediately to weaklycoupled regions.
Citation: Feng, L., A. V. Newman, M. Protti, V. González, Y. Jiang, and T. H. Dixon (2012), Active deformation near theNicoya Peninsula, northwestern Costa Rica, between 1996 and 2010: Interseismic megathrust coupling, J. Geophys. Res., 117,B06407, doi:10.1029/2012JB009230.
1. Introduction
[2] The Nicoya Peninsula on the Pacific coast of CostaRica in Central America is one of the closest landmasses(within 60–120 km) to the Middle America Trench (MAT).Offshore Nicoya the young oceanic Cocos plate (CO) issubducting underneath the Caribbean plate (CA) at a con-vergence rate of 82.3 � 2.2 mm/yr and in a direction ofN20�E � 2� according to the GPS-based Pacific Velocity(PVEL) model by DeMets et al. [2010] (Figure 1).[3] Owing to such a rapid subduction and the proximity to
the trench, three devastating megathrust earthquakes (likely
M > 7.5) have been recorded directly beneath Nicoya in1853, 1900, and 1950, respectively, following an approxi-mate 50-year characteristic earthquake cycle [Protti et al.,2001]. However, only one large subduction thrust earth-quake, the 1978Mw = 7.0 Sámara earthquake, has occurred inNicoya since 1950. The average slip of the 1978 event wasestimated to be 0.7 m [Protti et al., 2001] accounting for 16%of the potential accumulated slip from 1950 to 2010 assum-ing 100% coupling. Two recent large earthquakes boundedthe peninsula. The Nicaragua subduction segment just NW ofNicoya experienced a shallow Mw = 7.7 tsunami earthquakein 1992 [e.g., Kanamori and Kikuchi, 1993; Satake, 1994;Ihmlé, 1996] and the Nicoya Gulf entrance immediately SEof Nicoya was struck by a deeper Mw = 7.0 event in 1990[Protti et al., 1995; Husen et al., 2002; Bilek et al., 2009](Figure 1b). Neither of these two events ruptured the Nicoyasegment [Protti et al., 1995] indicating the Nicoya segment isa prominent seismic gap with a large 1950-type earthquakemissing (Figure 1b).[4] Warnings about the increasing risk of a large mega-
thrust earthquake striking Nicoya have been issued for twodecades [e.g., Nishenko, 1991; Protti et al., 1995]. Untilrecently, the discovery of transient slow-slip events (SSE)[Protti et al., 2004; Brown et al., 2005; Outerbridge et al.,2010; Jiang et al., 2012], deep low-frequency earthquakes(LFEs) [Brown et al., 2009], and non-volcanic tremor
1School of Earth and Atmospheric Sciences, Georgia Institute ofTechnology, Atlanta, Georgia, USA.
2Now at Earth Observatory of Singapore, Nanyang TechnologicalUniversity, Singapore.
3Observatorio Vulcanológico y Sismológico de Costa Rica, UniversidadNacional, Heredia, Costa Rica.
4Rosenstiel School of Marine and Atmospheric Sciences, University ofMiami, Miami, Florida, USA.
5Now at Department of Geology, University of South Florida, Tampa,Florida, USA.
Corresponding author: L. Feng, Earth Observatory of Singapore,Nanyang Technological University, 50 Nanyang Ave., Block N2-1A-15,639798, Singapore. ([email protected])
©2012. American Geophysical Union. All Rights Reserved.0148-0227/12/2012JB009230
JOURNAL OF GEOPHYSICAL RESEARCH, VOL. 117, B06407, doi:10.1029/2012JB009230, 2012
B06407 1 of 23

Figure 1
FENG ET AL.: NICOYA INTERSEISMIC MEGATHRUST COUPLING B06407B06407
2 of 23

(NVT) [Outerbridge et al., 2010; Walter et al., 2011] alongthe Nicoya segment complicated the characteristic earth-quake cycle and may raise a new question; that is, whetherfrequent silent transient slips have secretly released theaccumulated strain over the last 60 years. Nevertheless,>10 mm/yr subsidence along the coast observed by localresidents [Marshall and Anderson, 1995] and geodeticstudies [Lundgren et al., 1999; Iinuma et al., 2004;Norabuena et al., 2004; LaFemina et al., 2009] stronglysuggests that the overriding plate is probably dragged downby a strong coupling with the subducting plate.[5] To investigate if long-term strong coupling exists on
the Nicoya subduction interface, we present a new inter-seismic megathrust coupling model based on the latestcampaign and continuous GPS data between 1996 and 2010.We show that a potential M � 7.8 megathrust earthquakemay occur in the fully coupled portion of the subductioninterface despite that microearthquakes, NVT, LFEs, andtransient slips occur in the intermediately to weakly coupledregions.
2. GPS Data and Analysis
2.1. Campaign and Continuous GPS
[6] Before 2010, previous campaigns including CASA1994 [Lundgren et al., 1999], CASA 1996 [Lundgren et al.,1999], Costa Rica 2000 [Norabuena et al., 2004], and CostaRica 2003 [LaFemina et al., 2009] provide a long GPScampaign history for Nicoya. Other campaigns were alsocarried out between 1997 and 2003 for three sites (PARK,GR38, and WARN) at Arenal Volcano, which is located eastof Nicoya (Figure 2).[7] We performed the most recent GPS campaign in early
March 2010 almost doubling the observation length sincethe previous campaign in 2003. Twenty-four existing cam-paign sites in both Nicoya and Arenal were reoccupiedmostly for three consecutive UTC days. Four sites (AGUS,CORO, GUAR, and LOCA) were destroyed before the 2010campaign and CABU was missed (Figure 2). For these fivestations, analyses were performed on the previous campaign
data only. For the 2010 campaign, a combination of TrimbleR7 and Trimble 5700 GPS receivers were used along withTrimble Zephyr Geodetic antennas. The recording interval is15 s and the elevation mask is 5�.[8] The Nicoya continuous GPS network was initiated in
2002 with three stations (IND1, HUA2, and PUJE) installedalong a NE-SW transect in central Nicoya and completedwith a total of 19 stations in late 2009 [Outerbridge et al.,2010] (Figure 2). Of the continuous stations, ELVI wasprecluded from the following analysis because of thereceiver malfunction. Likewise, PNE2 is �50 m from pre-vious site PNEG, but had only one fifth of PNEG’s durationand thus was also excluded. Although five other sites (BIJA,CABA, EPZA, LAFE, and VERA) also had similar shortduration of �1 year (Figure A2), they were kept in theanalysis on account of their unique locations. Additionally,we included two continuous GPS stations at Arenal Volcano(AROL and LOLA) from 1996 to 2003 and another con-tinuous site (IRZU) at Irazú Volcano from late 1999 to early2003 (Figure 2).[9] In summary, a total of 49 GPS stations including 29
campaign sites were used in this study covering the NicoyaPeninsula and a large area NE of it (Figure 2). Time series ofall the 49 stations relative to the stable Caribbean plate areprovided in Appendix A (Figures A1–A3). The average timespan is 7.9 years. The average station spacing is 15–20 kmfor Nicoya and �30 km more inland.
2.2. GPS Data Analysis
[10] Using GIPSY 5 software from the Jet PropulsionLaboratory (JPL) along with precise satellite orbits andclocks provided by JPL [Zumberge et al., 1997], all the dataexcept the 1994 campaign that lacks JPL orbit and clockinformation were processed at the Geodesy Lab of the Uni-versity of Miami. The resulting fiducial-free daily solutions[Heflin et al., 1992] were converted to the InternationalTerrestrial Reference Frame 2005 (ITRF2005) [Altamimiet al., 2007]. To keep consistency between the campaignand continuous data, no filtering was implemented, but dailysolutions with formal error larger than 3 times the average
Figure 1. (a) Regional tectonic map of Central America. Plates in this region include Cocos, Caribbean, Nazca, Panama[Marshall et al., 2000], North America, and Pacific. Active spreading centers (thick red lines without arrows), fracture zones(thin red lines), the CNS-EPR boundary (yellow dashed line), and high-relief ridges (gray lines) are based on Barckhausenet al. [2001], MacMillan et al. [2004], and Lonsdale [2005]. Left-lateral transform faults (thick red lines with arrows) aretaken from Plafker [1976] and Rosencrantz and Mann [1991]. Black triangles are volcanoes with evidence of Holoceneactivity [Siebert and Simkin, 2002]. Box outlines the area of Figure 1b. Bathymetry and topography use ETOPO2v2 GlobalGridded 2-minite Database. (b) Large earthquakes in Nicoya and surrounding regions since 1950. Different color patcheswith stars as epicenters indicate rupture areas identified from aftershock distribution for 1950 Nicoya [Güendel, 1986;Avants et al., 2001; Norabuena et al., 2004], 1978 Nicoya [Güendel, 1986; Avants et al., 2001; Norabuena et al., 2004],1983 Osa [Adamek et al., 1987], 1990 Nicoya Gulf [Protti et al., 1995], 1992 Nicaragua [Ihmlé, 1996], and 1999 Quepos[DeShon et al., 2003] earthquakes. Circles are 3-month aftershocks from the OVSICORI seismic catalog for the 1990 eventand from PDE for others. Focal mechanisms are from Adamek et al. [1987] for the 1983 event, from Protti et al. [1995] forthe 1990 event, and the global centroid moment tensor (gCMT) catalog [Ekström et al., 2005] for others. Historically, theNicoya segment has the largest thrust earthquakes (M > 7.5) in the Pacific of Costa Rica compared to moderate-magnitude(7 < M < 7.5) earthquakes in southeastern Costa Rica where the Cocos Ridge subducts and smaller-magnitude (M � 7)earthquakes in central Costa Rica where abundant small isolated seamounts subduct [Protti et al., 1994; Bilek et al.,2003]. Cocos-Caribbean convergence vectors (mm/yr) are derived from the PVEL model by DeMets et al. [2010]. Dashedlines are the boundaries separating seafloor spreading magnetic anomalies into EPR, CNS-1, and CNS-2; solid line is a prop-agator coinciding with the Fisher Ridge [Barckhausen et al., 2001]. CNS, Cocos-Nazca spreading center; EPR, East PacificRise spreading center; CR, Cocos Ridge; FSG, Fisher Seamount Group; QP, Quepos Plateau.
FENG ET AL.: NICOYA INTERSEISMIC MEGATHRUST COUPLING B06407B06407
3 of 23
error were removed as outliers. The long-term interseismicvelocities were estimated by iteratively fitting straight linesthrough individual components of the time series using aweighted least squares method. In each iteration, outliers thathave a deviation from the estimated linear trend larger than 3times the weighted root-mean square scatter (WRMS) wereflagged and removed. The best fit rates were achieved untilno more outliers can be identified.[11] The error calculation adopted an empirical noise
model by Mao et al. [1999], which accounts for both thetime-uncorrelated and time-correlated noises. Individualnoise contributions for the north, east, and vertical compo-nents were separately estimated from WRMS using equa-tions given by Dixon et al. [2000]. Though campaign datawere clustered in a few days with very irregular spacing, theextremely long time span of the data for most sites signifi-cantly reduced uncertainties. The resulting velocities withtheir corresponding errors relative to ITRF2005 are listed inTable 1.[12] Besides interseismic strain accumulation and forearc
sliver motion, other tectonic sources that may contribute tothe raw time series include coseismic offsets, post-seismicdeformation, and/or aseismic transients.
[13] The only significant earthquake that occurred inthis region was the 1992 Mw = 7.7 Nicaragua tsunamiearthquake; however, Norabuena et al. [2004] showed thatthis event likely accounted for <2 mm/yr post-seismicdeformation in Nicoya by 1997. Given our observationperiod from 1996 to 2010, the post-seismic response inducedby the 1992 event was likely on the order of velocityuncertainty, thus not large enough to be considered as asignal source.[14] Six slow-slip episodes were observed near Nicoya
with an average recurrence interval of 21 � 6 months [Jianget al., 2012]. The first episode, in early 2000, including threepulses of transient slow-slip propagating at the shallowsubduction interface, was suggested by correlated flow ratetransients detected across three flowmeters at the frontalprism of the forearc [Brown et al., 2005; LaBonte et al.,2009]. The transient signal was also accompanied withtremor-like noise recorded on collocated ocean bottomseismometers [Brown et al., 2005]. The second episodeincluded two slow-slip transients initiated in May andSeptember 2003, respectively. Both were observed first bythree GPS sites on land [Protti et al., 2004] and 2–3 weekslater by a stepwise pressure change in a prism toe borehole�1 km landward of the trench [Davis and Villinger, 2006].
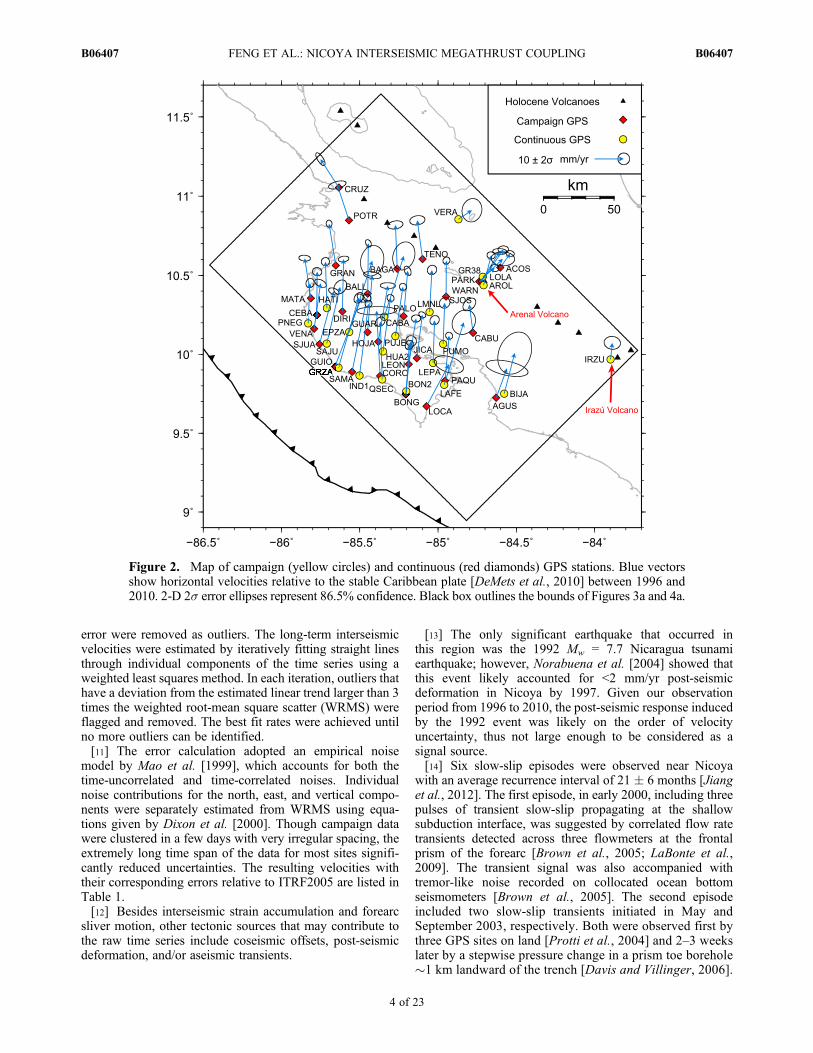
Figure 2. Map of campaign (yellow circles) and continuous (red diamonds) GPS stations. Blue vectorsshow horizontal velocities relative to the stable Caribbean plate [DeMets et al., 2010] between 1996 and2010. 2-D 2s error ellipses represent 86.5% confidence. Black box outlines the bounds of Figures 3a and 4a.
FENG ET AL.: NICOYA INTERSEISMIC MEGATHRUST COUPLING B06407B06407
4 of 23

Table 1. GPS Interseismic Velocities Relative to ITRF2005 and the Stable Caribbean Platea
Site Lat (�N) Lon (�W) Height (m) DT (yrs) Days
Relative to ITRF2005 (mm/yr) Relative to Caribbean (mm/yr)
N 1s E 1s U 1s N 1s E 1s U 1s
Nicoya Campaign SitesACOS 10.5485 84.6024 300.52 14.07 50 11.8 0.3 16.7 0.6 0.1 1.2 4.8 0.5 3.4 0.7 �0.1 1.2AGUS 9.7241 84.6284 70.55 3.01 8 17.0 1.3 17.4 3.5 6.9 5.9 10.1 1.4 3.7 3.6 6.7 5.9BAGA 10.5414 85.2612 123.46 10.01 9 21.6 0.5 12.8 1.2 0.1 1.4 15.0 0.7 �0.6 1.3 �0.1 1.4BALL 10.3834 85.4484 118.18 14.07 9 23.8 0.3 13.6 0.3 0.3 0.9 17.3 0.6 0.2 0.5 0.0 0.9BONG 9.7438 85.2069 21.40 10.04 11 25.0 0.8 15.6 0.8 �4.5 2.0 18.4 0.9 1.9 0.9 �4.7 2.0CABU 10.1358 84.7756 499.18 7.26 10 16.6 1.0 12.3 1.0 0.4 2.5 9.7 1.1 �1.3 1.1 0.2 2.5CEBA 10.2491 85.7761 90.32 10.06 11 21.3 0.5 13.7 0.7 �4.0 1.8 14.8 0.7 0.2 0.8 �4.2 1.8CORO 9.8630 85.3696 98.86 3.00 7 29.0 0.6 12.4 3.4 1.2 5.9 22.3 0.7 �1.2 3.4 1.0 5.9CRUZ 11.0543 85.6337 267.23 14.11 13 16.2 1.0 6.8 0.7 �0.3 1.6 9.7 1.1 �6.3 0.8 �0.5 1.6DIRI 10.2718 85.6106 82.04 10.06 13 24.5 0.3 13.8 0.8 �0.2 1.8 17.9 0.5 0.4 0.9 �0.5 1.8GRAN 10.5622 85.6530 122.36 14.09 17 20.8 0.3 11.0 0.4 �1.7 0.9 14.3 0.6 �2.3 0.5 �2.0 0.9GUAR 10.1400 85.4497 135.44 7.04 6 26.1 0.3 15.1 1.5 �6.8 2.0 19.5 0.6 1.6 1.5 �7.0 2.0GUIO 9.9231 85.6585 31.18 10.02 10 29.9 0.5 22.6 0.6 �9.6 1.1 23.4 0.7 9.0 0.7 �9.9 1.1HOJA 10.0795 85.3824 240.98 10.05 13 25.8 0.2 16.9 1.2 0.1 1.2 19.2 0.5 3.3 1.3 �0.2 1.2JICA 9.9751 85.1360 61.45 14.07 14 21.6 0.3 15.5 0.4 �1.2 0.9 14.9 0.5 1.9 0.6 �1.4 0.9LEON 9.9365 85.1868 276.88 10.00 9 22.4 0.4 16.1 0.7 �3.4 1.6 15.7 0.6 2.5 0.8 �3.6 1.6LOCA 9.6701 85.0742 157.60 3.02 7 21.0 1.4 21.4 2.4 �1.9 3.8 14.3 1.5 7.7 2.5 �2.2 3.8MATA 10.3553 85.8129 77.80 14.06 17 20.1 0.3 11.3 0.9 �3.6 1.1 13.7 0.5 �2.1 1.0 �3.8 1.1PALO 10.2415 85.2203 40.19 10.03 10 22.2 0.6 14.8 0.5 �4.2 1.6 15.5 0.8 1.4 0.6 �4.4 1.6PAQU 9.8322 84.9551 80.31 14.08 13 22.1 0.4 15.1 0.5 �2.4 1.4 15.4 0.6 1.4 0.6 �2.7 1.4POTR 10.8474 85.5691 155.80 10.05 15 18.6 0.6 9.2 1.4 0.2 1.7 12.1 0.7 �4.0 1.5 0.0 1.7SAMA 9.8892 85.5488 45.57 14.05 11 31.8 0.4 18.7 0.6 �10.6 0.9 25.3 0.6 5.1 0.7 �10.8 0.9SJOS 10.3656 84.9482 1062.24 14.10 12 19.0 0.4 13.5 0.5 0.1 1.2 12.3 0.6 0.1 0.6 �0.1 1.2SJUA 10.0632 85.7569 44.36 14.06 13 24.6 0.5 18.5 0.8 �7.7 1.1 18.1 0.6 4.9 0.9 �8.0 1.1TENO 10.6018 85.0983 373.45 10.05 10 20.0 0.6 11.5 1.2 �1.6 2.1 13.3 0.8 �1.8 1.3 �1.8 2.1VENA 10.1611 85.7917 24.76 10.03 11 22.1 0.5 15.7 0.9 �5.3 1.6 15.6 0.7 2.2 1.0 �5.5 1.6
Nicoya Continuous SitesBIJA 9.7500 84.5769 555.63 0.80 294 20.8 3.6 17.3 2.9 12.8 9.2 13.9 3.6 3.6 2.9 12.5 9.2BON2 9.7645 85.2025 27.97 5.32 1702 22.6 0.6 14.7 0.6 �4.6 1.5 15.9 0.8 1.0 0.7 �4.8 1.5CABA 10.2379 85.3435 26.96 0.96 353 27.4 2.3 20.2 1.9 3.2 7.8 20.8 2.4 6.7 1.9 3.0 7.8EPZA 10.1409 85.5681 668.40 0.96 323 31.0 2.5 21.4 2.0 4.3 7.3 24.4 2.6 7.9 2.0 4.1 7.3GRZA 9.9155 85.6356 39.32 4.25 1201 30.4 0.8 20.6 0.7 �11.2 1.8 23.9 0.9 6.9 0.8 �11.4 1.8HATI 10.2922 85.7101 58.60 4.24 1543 22.4 0.6 13.0 0.6 �3.0 1.8 15.9 0.7 �0.5 0.7 �3.3 1.8HUA2 10.0177 85.3517 593.92 6.90 2198 24.9 0.3 16.1 0.4 �3.2 1.1 18.3 0.6 2.6 0.6 �3.5 1.1IND1 9.8646 85.5022 75.29 7.49 2369 31.2 0.4 16.7 0.4 �12.1 1.1 24.6 0.6 3.1 0.6 �12.3 1.1LAFE 9.8071 84.9603 65.24 1.16 426 28.2 2.0 20.3 1.9 �13.5 7.4 21.4 2.1 6.7 2.0 �13.7 7.4LEPA 9.9454 85.0312 20.93 4.37 1579 21.3 0.6 14.1 0.7 �0.1 1.9 14.6 0.8 0.5 0.8 �0.3 1.9LMNL 10.2675 85.0533 102.97 3.33 1216 21.2 0.7 14.3 0.6 0.1 2.4 14.4 0.8 0.8 0.8 �0.1 2.4PNEG 10.1955 85.8290 19.56 4.39 1501 20.2 0.6 14.1 0.6 �6.7 2.0 13.8 0.8 0.6 0.7 �6.9 2.0PUJE 10.1140 85.2725 30.11 6.77 2155 23.6 0.4 16.1 0.4 �2.5 1.1 16.9 0.6 2.6 0.6 �2.8 1.1PUMO 10.0645 84.9667 17.96 3.16 1141 20.9 0.8 14.0 0.8 1.3 2.5 14.1 0.9 0.5 0.9 1.1 2.5QSEC 9.8404 85.3573 17.44 4.36 1355 26.4 0.7 13.0 0.7 �4.7 1.8 19.8 0.8 �0.6 0.8 �4.9 1.8SAJU 10.0671 85.7106 73.44 2.47 903 25.9 1.1 18.1 1.0 �7.0 3.3 19.4 1.2 4.6 1.1 �7.3 3.3VERA 10.8536 84.8690 64.32 1.13 413 9.9 1.9 17.8 1.7 �2.4 6.8 3.1 2.0 4.6 1.7 �2.7 6.8
Volcano SitesAROL 10.4372 84.7092 754.01 7.86 1251 17.0 0.5 16.0 0.6 �4.3 1.4 10.2 0.6 2.6 0.7 �4.6 1.4GR38 10.4619 84.7249 677.04 12.26 16 17.0 0.3 19.8 1.1 1.7 1.7 10.2 0.5 6.4 1.2 1.4 1.7IRZU 9.9669 83.8975 2963.55 3.45 1154 12.9 1.0 14.3 1.3 3.4 3.8 5.7 1.1 0.6 1.4 3.2 3.8LOLA 10.4901 84.7137 575.83 7.88 828 9.9 0.4 17.4 0.6 �4.5 1.3 3.0 0.6 4.1 0.7 �4.8 1.3PARK 10.4602 84.7363 583.15 5.25 18 14.7 1.1 21.5 2.0 �1.2 4.2 7.8 1.2 8.1 2.0 �1.4 4.2WARN 10.4619 84.7209 748.67 12.34 21 17.8 0.4 20.8 0.9 �3.8 2.8 10.9 0.6 7.4 0.9 �4.0 2.8
aITRF2005 is defined by Altamimi et al. [2007]. The conversion from ITRF2005 to the Caribbean plate uses the angular velocity and its covariancematrix determined by DeMets et al. [2010]. A correction for the translation of Earth’s center-of-mass with respect to ITRF2005 is also applied [DeMetset al., 2010]. Abbreviations: Lat, latitude; Lon, longitude; DT, observation time span in years; Days, number of data points used; N, north; E, east; U,vertical; 1s, standard error representing 68% confidence level.
FENG ET AL.: NICOYA INTERSEISMIC MEGATHRUST COUPLING B06407B06407
5 of 23

The best-documented episode was the May 2007 slow-slipevent detected by the continuous GPS and seismic networkin NW Costa Rica [Outerbridge et al., 2010]. The Nicoyacontinuous GPS network also recorded three other episodesin mid-2005, early-2009, and mid-2011 [Jiang et al., 2012].[15] In recent interseismic studies, some effort has been
spent on removing transient slip signals from time series forcontinuous sites and modeling corresponding offsets forcampaign sites [e.g.,Correa-Mora et al., 2008;Holtkamp andBrudzinski, 2010]. We chose not to perform this procedurebecause our major interest lies in determining the long-termstrain accumulation, i.e., information that is useful for iden-tifying the total accumulated slip deficit on the subductioninterface. Conversely, removing transient slip offsets adds theslip back to the time series increasing the velocity 30–50%[Correa-Mora et al., 2008; Outerbridge et al., 2010].Holtkamp and Brudzinski [2010] showed the differencebetween interseismic and intertransient rates reflect slip defi-cit recovered during slow-slip events. Thus, an intertransientcoupling result is not warranted for our purposes. We suggesta clarification between “interseismic” and “intertransient”(see Figure 1 ofCorrea-Mora et al. [2008] for an illustration).A proper selection of either depends on whether the focus ismegathrust coupling for total strain accumulation contribut-ing to large earthquakes (where the total interseismic couplingis appropriate), or the interface coupling that includes strainenergy that is episodically released in transient events (whereintertransient coupling is useful).
3. GPS Interseismic Velocities Relativeto Caribbean
[16] Interseismic velocities in the Caribbean referenceframe (Table 1) are calculated using a CA-ITRF2005 Eulervector (36.9�N, 98.9�W, 0.261�/Ma) and its covariancematrix with adjustment for the translation of Earth’s center-of-mass relative to ITRF2005 [DeMets et al., 2010]. Theresultant horizontal velocities (Figure 2) indicate distinctbehaviors of forearc and non-forearc sites. Non-forearc sitesincluding six volcano sites and two additional sites (ACOSand VERA) NE of the volcanic arc have a relatively smallresidual with respect to the stable Caribbean plate. Volcanosites may be affected by local deformation, but ACOS andVERA are most likely to be on the stable Caribbean[Lundgren et al., 1999]. On the other hand, the forearc siteslocated SW of the volcanic arc show an apparent counter-clockwise rotation as observed by previous studies[Lundgren et al., 1999; Iinuma et al., 2004;Norabuena et al.,2004; LaFemina et al., 2009]. This motion, we suggest, is theresult of forearc sliver motion superimposing on interseismicdeformation. To visualize the relative components of the twotypes of motion, we project horizontal velocities onto localtrench-parallel and trench-normal directions.
3.1. Trench-Parallel Velocities
[17] Trench-parallel GPS velocities of the forearc sitesshow surprising uniformity in its long-term displacementrate, while trench-parallel velocities of the non-forearc sitesfall to almost zero (Figure 3a). Taking the general physio-graphic trend of the trench offshore Nicoya (Figure 7b) asthe preferred trench direction (N45�W), the average trench-parallel rate of the forearc sites is about 11 mm/yr, �1/3 of
the trench-parallel component of the plate convergence. Thestandard error of the weighted average rate is very small(<0.2 mm/yr), but it is calculated on the basis of a predefinedtrench and hence probably underestimated. To account forthe uncertainty in the trench direction, we vary the trenchstrike by �5� from N45�W assuming the chance of havingthe strike outside this range is low. The average rate changesaccordingly from 10 to 12 mm/yr, suggesting an uncertaintyof �1 mm/yr.[18] The rapid rate change from 11 mm/yr to almost zero
occurs within a 16 km wide zone between the forearc andnon-forearc sites (light cyan shaded zone in Figure 3) inaccord with the clustering of frequent strike-slip earthquakeswithin 20 km of the volcanic arc [White and Harlow, 1993].Compared to interseismic deformation zones of >200 km insome other strike-slip fault systems [e.g., Lyon-Caen et al.,2006; Schmalzle et al., 2006], the observed transition zonein northwestern Costa Rica is surprisingly narrow suggestinga possible shallow locking on the forearc-bounding faults.Presumably most of the shear strain induced by the forearcsliver motion is concentrated close to the Central Americanvolcanic arc. Thus, the northern Costa Rican forearc sliverincluding area between MAT and the volcanic arc translatesas a rigid undeforming block.[19] After removing the average sliver motion, most
residual velocities (Figure 3b) are <2 mm/yr indicating littleinternal deformation within the northern Costa Rican fore-arc. However, four coastal sites (gold in Figure 3b) show upto 5 mm/yr deviation from the average. This variation islikely from the strike-slip component of the interseismicstrain accumulation, but remains significantly lower than thepotential 20 mm/yr strike-slip rate that is missing from theoblique convergence. Therefore, the oblique convergenceprobably does not contribute significant trench-parallelinterseismic strain accumulation at the surface; however, aconsiderably larger strike-slip motion would be simulta-neously released when thrusting occurs on the subductioninterface.[20] The residuals also reveal possible differential forearc
motion at the SE end of Nicoya. Three sites (green inFigure 3b) move 3–7 mm/yr slower than others suggestingthat a potential transition zone may exist in the entrance of theNicoya Gulf. We have a detailed discussion on the northernCosta Rican forearc sliver motion separately in another paper(Feng et al., Active deformation near the Nicoya Peninsula,northwestern Costa Rica, between 1996 and 2010: Forearcsliver transport manuscript in preparation, 2012).
3.2. Trench-Normal Velocities
[21] Trench-normal velocities (Figure 4a) are dominatedby elastic interseismic strain accumulation of the upperplate resulting from frictional coupling of the subductioninterface. Generally, the coastal sites (gold in Figure 4a)show the largest trench-normal velocities indicating thelandward projection of the largest coupling offshore. Thevelocity peak at the elbow of the coastline is coincident withthe boundary that separates oceanic crusts generated at theCocos-Nazca spreading center (CNS) and the East PacificRise (EPR) (hereafter referred to as the CNS-EPR boundary)(Figure 1) [Barckhausen et al., 2001]. Overall, the trench-normal velocities decay gradually landward and flatten out
FENG ET AL.: NICOYA INTERSEISMIC MEGATHRUST COUPLING B06407B06407
6 of 23

Figure
3.(a)Interseism
ictrench-parallelvelocitiesfrom
1996
to2010
intheCaribbean-fixed
fram
e[D
eMetsetal.2
010]
and(b)residualsof
thetrench-parallelvelocitieswith
11mm/yrforearcsliver
motionremoved.For
each
subplot,botto
mpanelplotsvelocitiesalongtrench;rightpanelplotsvelocitiesnorm
altotrench
with
thenarrow
velocitytransitio
nzone
high-
lighted
inlig
htcyan.T
renchdirectionistakenas
N45
� W.R
eddiam
onds,the
non-forearcsites;blue
circles,theforearcsites;
goldcircles,thecoastalsites,partof
theforearcsites;greensquares,thesiteswith
largeresidualswith
respecttothenorthern
Costa
Rican
forearc.
FENG ET AL.: NICOYA INTERSEISMIC MEGATHRUST COUPLING B06407B06407
7 of 23

Figure
4.Interseism
ic(a)trench-normal
and(b)vertical
velocitiesfrom
1996
to2010
intheCaribbean-fixed
fram
e[D
eMetset
al.2010].For
each
component,botto
mpanelplotsvelocitiesalongtrench
with
thevelocity
peak
zone
show
nin
pink;rightpanelplotsvelocitiesnorm
alto
trench
with
thenarrow
velocity
transitio
nzone
highlig
hted
inlig
htcyan.
Trenchdirectionistakenas
N45
� W.Red
diam
onds,thenon-forearcsites;blue
circles,theforearcsites;gold
circles,the
coastalsites,partof
theforearcsites.Purplestarsindicate
locatio
nswhere
thepictures
inFigure5weretaken.
FENG ET AL.: NICOYA INTERSEISMIC MEGATHRUST COUPLING B06407B06407
8 of 23

at �5 mm/yr. No obvious difference is apparent across thevolcanic arc.
3.3. Vertical Velocities
[22] Similar to trench-normal velocities, vertical velocities(Figure 4b) mainly originate from interseismic strain accu-mulation. The subsidence rates of the coastal sites (gold sitesin Figure 4b) are the largest (>10 mm/yr) indicating a strongcoupling offshore. Along trench, the vertical velocities showa ‘V’ shape with its peak at the CNS-EPR boundary, whichis also the point on the coast closest to the trench. We alsofind clear evidence of subsidence at coastal areas includingdead and dying trees, eroded fence walls, and erosion ofpoles of electric power lines (Figure 5). We do not observeany clear transition from subsidence to uplift. Mostremaining sites show essentially zero vertical motion.
3.4. Temporal Variations
[23] To investigate if any temporal variation exists, wedivide the observation time from 1996 to 2010 into two7-yearlong periods that are 1996–2003 and 2003–2010.Because the last campaign before our 2010 campaign wasconducted in 2003, the data in 2003 are included in bothperiods. We subtract the interseismic velocities in 1996–2003from those in 2003–2010 (Figure 6). The random orientationsof the difference vectors do not reveal any consistent pattern,and the differences for most sites are smaller than their errors,hence the temporal resolution of our data is not enough toconfidently suggest any temporal variation. However, con-tinuous sites like IND1, HUA2, and PUJE, which have thelongest observation time, show more northeastward or east-ward motion (>5 mm/yr) in 2003–2010 than in 1996–2003(red vectors in Figure 6a), which might indicate increasinginterseismic coupling with time. Other potential evidence forincreased coupling includes more downward motion for mostcostal sites in 2003–2010 than in 1996–2003 (red vectors inFigure 6b).
4. Interseismic Megathrust Coupling Model
[24] We employ the widely used back slip model proposedby Savage [1983] to represent the interseismic strain accu-mulation induced by coupling on the subduction interface. Inthe back slip model, virtual “normal” slip on the coupledregion indicates slip deficit, i.e., slip less than full platemotion. We assume the interseismic strain accumulation ispurely elastic and will be presumably released in future largeearthquakes with negligible permanent deformation in theupper plate.
4.1. Model Input Data
[25] As discussed in section 3.1, the horizontal signalsfrom the interseismic strain accumulation are dominated bythe trench-normal component with little contribution fromthe trench-parallel component. Therefore, we use only thetrench-normal and vertical velocities to invert for slip dis-tribution across the subduction interface. Although verticaluncertainties are 2–3 times larger than horizontal uncertain-ties, vertical velocities are well suited for constraining thedowndip limit of the locking zone [Lundgren et al., 1999].Moreover, the fifteen years’ observation allows us to obtainrelatively reliable vertical measurements for the first time innorthern Costa Rica, and thus the vertical data are includedin the modeling as well.
4.2. Model Geometry
[26] The 2-D geometry of the plate interface is derivedfrom the well-located plate interface and slab seismicity[Ghosh et al., 2008] using the maximum seismicity method[Thomas et al., 2007]. Although steepening of the plateinterface from CNS to EPR has been observed along strikeabove �20 km depth [DeShon et al., 2006], we simplify theinterface using planar row segments that have an increasingdip with depth as a first order approximation. To construct arepresentative 2-D cross section perpendicular to the trenchfrom the original seismically defined interface, we use afunction that has a constant dip of 11.4� from the trench(4.5 km below sea level) to 18.6 km depth, before steepeningas a parabolic function with a maximum dip of 48.1� at
Figure 5. Evidence of subsidence at coastal areas. Locationsare shown in Figure 4b. (a) Fallen trees caused by coastal sub-sidence at Cabo Blanco National Park in December 2009.(b) Dead and dying coconut palms on a previously upliftedmarine terrace behind the relict of a stone seawall built inthe 1990s at West Sámara in June 2008. (c) Eroded fencewall at South Playa Guiones in June 2008. While globalmean sea level has risen from 1950 to 2010, on the Pacificside of Costa Rica, it may have actually dropped [Cazenaveand Llovel, 2010], thus absolute changes in sea level are notexpected to be a significant contribution to the observedcoastal erosion. The local sea level change is primarily tec-tonic subsidence, and possibly as large as 0.6 m since1950 (assuming a subsidence rate of �10 mm/yr).
FENG ET AL.: NICOYA INTERSEISMIC MEGATHRUST COUPLING B06407B06407
9 of 23

62 km depth. The best fit smooth curve is then discretizedinto planar row segments of �5 km width to �60 km depth(Figure 7). As a result, the fault interface is approximated by30 connected planes with increasing dip at depth. A com-parison of our interface with two others by Norabuena et al.[2004] and DeShon et al. [2006] shows small differencesdown to �30 km depth and increasing discrepancies deeper(Figure 7a).[27] The strike of the interface is fixed at N45�W.
Assuming a length of 200 km along strike, the model extends�40 km more on either side of the Nicoya Peninsula to avoidedge effects. The interface is also discretized into 5-km-widesegments along strike (Figure 7b). The total interface iscomposed of 30 � 40 rectangular patches.
4.3. Model Formulation and Inversion
[28] Green functions are calculated for the north, east, andvertical displacements of 43 GPS stations (excluding sixvolcano sites) imposed by unit uniform dip-slip on eachpatch using the dislocation model of Okada [Okada, 1992].By linear superimposing contributions from each patch, thetotal observed deformation could be estimated.[29] Back (normal) slips alone are inverted in the models
with their values only allowed to vary between zero and thetrench-normal component of the CO-CA convergence at thecenter of each patch. We refer the ratio of back slip rate tolocal trench-normal convergence rate as the degree of cou-pling across the plate interface. A back slip at the trench-normal convergence rate represents full coupling, while azero back slip indicates freely slipping. The slips at the topboundary of the fault are set to vary freely, while the slips at
the bottom and side boundaries are fixed at zero back slipimplying freely slipping.[30] To solve this underdetermined problem with more
unknowns (30 � 40 = 1200 patches) than observations(43 � 3 = 129 GPS components), we apply two-dimensional(along strike and dip) second-derivative (Laplacian)smoothing [e.g., Harris and Segall, 1987; Jónsson et al.,2002; Chen et al., 2009] to relate adjacent fault slips.[31] Combining the constraints from data and smoothing,
we seek to solve the linear equation system below thatrelates slips to surface deformation using
w�1d0
� �¼ w�1G
k2D
� �m ð1Þ
where d is the observation vector, m is the unknown slipvector, w is the diagonal matrix constructed from observationerrors, G is the green function matrix, D is the second-orderfinite difference operator [Jónsson et al., 2002], k2 controlsthe weight imposed on the smoothing.[32] The choice of smoothing leads to different model
results and no single solution exists. Increasing smoothingalways increases model misfit; therefore, we visually inspectthe trade-off curve between model misfit and roughness todetermine a preferred model [e.g.,Du et al., 1992; Chen et al.,2009; Newman et al., 2011]. The root-mean square (RMS) ofthe weighted-residual sum of squares (WRSS) is used toquantify model misfit, while the average second-order finitedifference sum of each patch, is used to represent the degree ofsmoothing, and is often referred to as the model roughness[Jónsson et al., 2002].
Figure 6. Rate changes in the Caribbean frame between 2003–2010 and 1996–2003 periods from thisstudy. (a) Horizontal rate changes. Continuous sites IND1, HUA2, and PUJE (red vectors) show morenortheastward or eastward motion in 2003–2010 than in 1996–2003. (b) Vertical rate changes. Most costalsites (red vectors) show more downward motion in 2003–2010 than in 1996–2003.
FENG ET AL.: NICOYA INTERSEISMIC MEGATHRUST COUPLING B06407B06407
10 of 23

4.4. Checkerboard Resolution Test
[33] We first conducted a checkerboard resolution test toassess the spatial resolving capability of the Nicoya GPSnetwork on the assumed fault geometry. Because the networkhas an average station spacing of 15–20 km, which suggeststhe capability of resolving slips with similar scale, we dividedthe fault interface into patches of 15� 20 km2 area, assignedalternating zero and full convergence back slips to them as asynthetic input (Figure 8a), and calculated the displacementsat our stations from this input. Uncertainties of the real datawere added to the synthetic displacements before inverting
for slips. As expected from the dense coverage, the preferredmodel at k = 400 recovers all the patches beneath Nicoya andother patches within �30 km distance to the coastline, butloses resolution dramatically toward the trench where noGPS sites exist and at greater depths where fewer sites areavailable (Figure 8b).
4.5. Model Results
[34] We then ran inversion models using a wide range ofsmoothing parameters. The preferred model at k = 15000(Figure 9b) was chosen because of its location in theinflection corner of the trade-off curve between roughnessand misfit (Figure 9d), which introduces substantialsmoothing but without the cost of large increasing misfit.For comparison, examples of under-smoothed (Figure 9a)and possibly over-smoothed (Figure 9c) are also provided.We define three types of regions: the fully coupled regionwith >90% coupling (red), the partially coupled region with�50% coupling (blue to green), and the freely slippingregion with <10% coupling (purple). Because of the reducedresolution toward the boundaries, we only consider the areaof high resolution near the coastline as shown by our reso-lution test (Figure 8).[35] Independent of the smoothing parameter, high spatial
heterogeneity along both strike and dip is pronouncedamong all three cases. Two fully coupled patches in theNicoya segment, including one offshore centered at �15 kmdepth and the other inland centered at �24 km depth, aresurrounded by freely and partially slipping areas(Figures 9a–9c). This result is different from 50 to 60%coupling found by previous studies [Norabuena et al., 2004;LaFemina et al., 2009]. The overall pattern appears persis-tent during our interseismic observation, but it is unknownwhether it has persisted over many earthquake cycles, asobserved in Kamchatka [Bürgmann et al., 2005], Sumatra[Chlieh et al., 2008], and Japan [Hashimoto et al., 2009]from the close correlation of interseismic slip deficit zoneswith rupture zones of past large earthquakes. In Nicoya, thetwo fully coupled regions do not seem to resemble either ofthe 1950 and 1978 rupture regions (Figure 1b). But we notethat the rupture regions of the two historic events are notvery well determined. Another fully coupled patch SE of theNicoya Peninsula persists in all three cases (Figures 9a–9c).Although this patch approaches the limit of our high-reso-lution area, we suspect the coupling of this area is real,particularly because its location coincides with the rupturezone of the 1990 Nicoya Gulf earthquake (Figure 1b).[36] On the basis of our preferred model (Figure 9b),
the geodetic moment accumulation rate of the Nicoyasegment is calculated to be 9.0 � 1018 N m/yr using rigid-ity = 30 GPa. Assuming the locking has remained constant,the Nicoya segment has accumulated enough strain between1950 and 2010 to generate an Mw 7.8 1950-type earthquake.Continued monitoring of the Nicoya seismic gap is highlyrecommended considering the potential of seismic failurealong the interseismic strong-coupling patches [e.g.,Hashimoto et al., 2009; Moreno et al., 2010].
5. Discussion
[37] The unprecedented image of interseismic couplingalong the shallow subduction megathrust between 1996 and
Figure 7. Model geometry. (a) Cross section of the sub-duction plate interface used in the modeling (blue line) withyellow circles denoting the ends of planar row segments.Green line represents the model interface used byNorabuena et al. [2004]. Red line is the generalized subduc-tion interface from Figure 10 in DeShon et al. [2006]. Zerodepth is at sea level and trench is 4.5 km below sea level.(b) Surface projection of the fault interface and its individualpatches.
FENG ET AL.: NICOYA INTERSEISMIC MEGATHRUST COUPLING B06407B06407
11 of 23

2010 allows us to compare long-term locking with short-term features including microearthquakes, low-frequencyearthquakes (LFEs), non-volcanic tremor (NVT), and slow-slip events (SSE) (Figure 10).
5.1. Correlation Between Interface Microseismicityand Partially Coupled Regions
[38] Most strikingly, the interface seismicity between late-1999 and mid-2001 [Ghosh et al., 2008] is concentrated inthe partially coupled region between the two fully coupledregions forming a narrow band. On the EPR side, the cor-relation between microseismicity and partial coupling isparticularly strong, while on the CNS side some micro-earthquakes appear in the fully coupled area, which mayreflect temporal change in coupling or an artifact due to ourplanar interface geometry. Microearthquakes are almostabsent within the shallow full-coupling zone (a region thatwas instrumented with 14 ocean bottom seismometers dur-ing the 1999–2001 observation) and slightly more occurwithin the deep full-coupling zone. On the contrary, micro-seismicity is dominant in the partial-coupling zones, andmay reflect a transition in effective normal stress thatweakens the plate interface and allows intermediate creep[Schwartz and DeShon, 2007]. Schwartz and DeShon [2007]suggested that plate interface microseismicity correlates withthe 250�C isotherm line where the onset of basalt
dehydration and/or permeability reduction may potentiallyincrease pore pressure and reduce effective normal stress.On the other hand, the location of the microseismicitycoincides with the bending of the subducting plate where dipincreases rapidly (Figure 10a). In the EPR-generated crust,we suspect the normal-faulting, apparent within the sub-ducting slab [von Huene et al., 2000; Ranero and vonHuene, 2000; Ranero et al., 2003], may release more fluidat the sharp downward bend where the slab is flexed, as wassuggested from slab fluid input variations in arc lavas[Patino et al., 2000]. Further north, in Nicaragua, wherebending-related faulting is dominant, the strongest fluidsignals were found in western Nicaragua where lower-platefractures are the most pervasive [Patino et al., 2000].Overall, our results confirm that interseismic microseismic-ity neither defines the strong-coupling patches nor marks theupdip or downdip limit of the seismogenic zone in Nicoya[Newman et al., 2002; Norabuena et al., 2004; DeShon etal., 2006; Schwartz and DeShon, 2007].
5.2. Along-Strike Variations in Coupling
[39] Along strike, a 5-km upward and seaward shift in theupdip limit of interface seismicity has been identified tooccur at the transition from EPR to CNS [Newman et al.,2002; DeShon et al., 2006], which was associated with thethermal difference between the anomalously cold EPR crustdue to hydrothermal circulation and the normal CNS crust
Figure 8. Checkerboard test on the spatial resolution of the dense Nicoya GPS network. (a) Syntheticinput slip distribution used to create a synthetic deformation field. (b) Output best fit slip distribution atk = 400 inverted from the synthetic surface deformation. Green line outlines the area with high resolution.Red diamonds, the campaign sites; yellow circles, the continuous sites.
FENG ET AL.: NICOYA INTERSEISMIC MEGATHRUST COUPLING B06407B06407
12 of 23

Figure 9. Surface projection of interseismic coupling distribution of the best fit models for selectedvalues of the smoothing parameter k: (a) k = 8000, (b) k = 15,000, and (c) k = 30,000. As smoothingincreases, slip becomes more distributed. (d) Trade-off curve between decreased roughness (increasedsmoothing) and increased WRMS misfit. Our preferred model at k = 15000 is chosen in the inflectioncorner of the curve.
FENG ET AL.: NICOYA INTERSEISMIC MEGATHRUST COUPLING B06407B06407
13 of 23

cooled only by conduction [Fisher et al., 2003]. Interest-ingly, we identify a similar upward and seaward along-strikechange in the coupled region crossing the CNS-EPRboundary as mimicked by the seaward shift of the 100�C and150�C isotherm lines (Figure 10b).
5.3. Updip Transition in Coupling
[40] The updip limit of the seismogenic zone defined bythe shallow locked patch is located at �10 km depth and is�25 km landward fromMAT, similar to what was previouslysuggested by Norabuena et al. [2004] (Figure 10b). Thecorrespondence of the 100–150�C isotherm to the updip limitof the seismogenic zone has been shown in many othersubduction zones including south Alaska, Cascadia, Chile,and SW Japan [e.g., Oleskevich et al., 1999; Spinelli andSaffer, 2004]. In this temperature range, water contained insediments that enter subduction zones is released by diage-netic and low-grade metamorphic processes (e.g., opal to
quartz and smectite to illite) and expelled by compaction andconsolidation [Moore and Saffer, 2001]. Spinelli and Saffer[2004] proposed that the dewatering processes coulddecrease fluid pressure, increase effective normal stress andthus may control the transition from aseismic stable sliding tocoseismic stick-slip at shallow depths of the Nicoya subduc-tion zone. The estimated maximum depth of the 100�C iso-therm is slightly updip of the microseismicity [Harris et al.,2010] and within the shallow fully coupled patch. Consider-ing the uncertainties (�20–30 km) associated with modelassumptions [Harris et al., 2010], the 100�C isotherm roughlycorresponds to the updip limit of the seismogenic zone.
5.4. Downdip Transition in Coupling
[41] The downdip region of the deep fully coupled patchfrom our preferred model is located at 28–29 km depth(Figure 10). A very narrow partially coupled transition regionmay exist between the fully coupled region and the conti-nental Moho. The downdip limit of the seismogenic zone hasbeen suggested to be controlled by either the 350�C isothermor the serpentinized mantle wedge depending on which thesubducting plate encounters first [Hyndman et al., 1997;Oleskevich et al., 1999]. Beneath Nicoya, the oceanic slabintersects the continental Moho at 30–35 km depth(Figure 10) with the mantle wedge 15–25% serpentinized[DeShon and Schwartz, 2004; DeShon et al., 2006]; how-ever, the intersection of the 350�C isotherm with the sub-duction interface varies according to different thermalmodels, which makes it difficult to determine the controllingfactor for the downdip limit [DeShon et al., 2006; Harriset al., 2010]. Cooler thermal models without frictionalheating suggest the intersection of 350�C isotherm with thesubducting plate is well below the mantle wedge, while
Figure 10. Comparison of our preferred model atk = 15,000 with interplate microearthquakes, NVT, LFEs,SSE and isotherms. (a) Cross section of the subduction plateinterface with the fully locked (>90%) portion in red. Reddash line is the continental Moho inferred from the tomogra-phy study by DeShon et al. [2006]. Gray circles are interfaceseismicity between late-1999 and mid-2001 taken fromGhosh et al. [2008]. Red circles are LFEs located byBrown et al. [2009]. (b) Surface projection of the interseis-mic coupling distribution of our preferred model. Only highresolution part determined by the checkerboard test is plot-ted. Thin white dash lines are depth contours derived fromour 2-D profile with a contour interval of 10 km. Thick blacksolid line is the CNS-EPR boundary and its landward projec-tion [Barckhausen et al., 2001]. Red dash line is the conti-nental Moho [DeShon et al., 2006; Schwartz and DeShon,2007]. Thick black dash lines are 100�C, 150�C, and200�C isotherms that represent a maximum depth withoutconsidering frictional heating along the plate interface[Harris et al., 2010]. Note the isotherms could shift seawarddepending on models. Yellow curves outline updip anddowndip slip patches of the 2007 SSE determined byOuterbridge et al. [2010]. Black dots are tremors fromOuterbridge et al. [2010] and Walter et al. [2011]. Thedepths of tremors are not well constrained, thus not plottedin Figure 10a. Gray and red circles are the same as describedin Figure 10a.
FENG ET AL.: NICOYA INTERSEISMIC MEGATHRUST COUPLING B06407B06407
14 of 23

Figure A1. GPS time series relative to the stable Caribbean plate for campaign sites in Nicoya. The com-ponents of each station are north (red), east (black), and vertical (blue) from top to bottom. Slope values ofbest fit lines are given in Table 1.
FENG ET AL.: NICOYA INTERSEISMIC MEGATHRUST COUPLING B06407B06407
15 of 23

Figure A1. (continued)
FENG ET AL.: NICOYA INTERSEISMIC MEGATHRUST COUPLING B06407B06407
16 of 23

Figure A1. (continued)
FENG ET AL.: NICOYA INTERSEISMIC MEGATHRUST COUPLING B06407B06407
17 of 23

Figure A2. GPS time series relative to the stable Caribbean plate for continuous sites in Nicoya. Thecomponents of each station are north (red), east (black), and vertical (blue) from top to bottom. Slopevalues of best fit lines are given in Table 1.
FENG ET AL.: NICOYA INTERSEISMIC MEGATHRUST COUPLING B06407B06407
18 of 23

Figure A3. GPS time series relative to the stable Caribbean plate for volcano sites. The components ofeach station are north (red), east (black), and vertical (blue) from top to bottom. Slope values of best fitlines are given in Table 1.
Figure A2. (continued)
FENG ET AL.: NICOYA INTERSEISMIC MEGATHRUST COUPLING B06407B06407
19 of 23

incorporating frictional heating would bring the 350�C iso-therm close to the continental Moho [Harris et al., 2010].Harris and Wang [2002] showed no significant frictionalheating is required for Nicoya, therefore the downdip tran-sition from stick-slip to stable sliding at depth is likely notthermally controlled, but related to the serpentinized mantlewedge [Harris et al., 2010].
5.5. Comparison With NVT, LFEs, and SSE
[42] NVT was first discovered in the Nankai subductionzone in SW Japan [Obara, 2002] and subsequently observedin other subduction zones from Cascadia [Rogers andDragert, 2003], Costa Rica [Brown et al., 2005], Mexico[Payero et al., 2008] to Alaska [Peterson and Christensen,2009]. The NVT waveforms recorded in SW Japan, northernCascadia, and northern Costa Rica contain identifiablesequences of LFEs (�1–5Hz) [Shelly et al., 2007;Brown et al.,2008, 2009; La Rocca et al., 2009, 2010], which suggests thatNVT is likely a superposition of bursts of LFEs.[43] In SW Japan, NVT and LFEs were inferred to be
fluid-enabled weak shear slip near the deep interface seismic-aseismic transition zone from precise relocations of LFEs[Shelly et al., 2006; Brown et al., 2009] and focal mechan-isms of LFEs [Ide et al., 2007]. In Cascadia, the mechanismis less clear and highly debated. NVT was found distributedover a very wide depth range (>40 km wide) [Kao et al.,2005; McCausland et al., 2005; La Rocca et al., 2008],while newer studies placed NVT near the plate interface[La Rocca et al., 2009, 2010] or well-defined structures [Kaoet al., 2009].[44] In Nicoya, Walter et al. [2011] suggested NVT is
distributed throughout the seismogenic zone includingshallow depths. Interestingly, their shallow locations boundone side of the shallow fully coupled region showing goodcorrelation with the freely slipping region, while the deeptremors between the 100�C isotherm and the continentalMoho are more widespread (Figure 10b).[45] LFEs in Nicoya detected by a network autocorrelation
method are clustered at 30–40 km depth [Brown et al.,2009], similar to other subduction zones, with some occur-ring in the partially coupled transition zone and most othersnear the tip of the mantle wedge below the Moho(Figure 10). The locations of LFEs in Nicoya approximatelycorrespond to the 150–200�C isotherms, while temperaturesfor LFEs in SW Japan and Cascadia vary from 325�C to575�C [Peacock, 2009]. The wide range of temperatures forLFEs excludes any dependence on a particular temperatureor metamorphic reaction, but indicates the importance offluid [Peacock, 2009].[46] Seismically detected NVT has been observed to be
concurrent both temporally and spatially with geodeticallydetected transient SSE in SW Japan [e.g., Obara et al.,2004] and Cascadia [e.g., Rogers and Dragert, 2003], thusit has been speculated that NVT, LFEs, and SSE are essen-tially different manifestations of a single process – quasi-static slip [e.g., Shelly et al., 2006;Wech and Creager, 2007;La Rocca et al., 2009, 2010; Peng and Gomberg, 2010].However, NVT and long-term SSE observed in the Mexicansubduction zone are separated spatially and not completelysynchronized in time suggesting different origins for NVTand SSE in Mexico [Kostoglodov et al., 2010]. Kostoglodovet al. [2010] proposed that SSE does not produce seismic
radiation, but may trigger NVT at favorable locationsbecause of changes in the regional stress field.[47] In Nicoya, Outerbridge et al. [2010] studied the 2007
slow-slip event and found two distinct slip patches: oneshallow patch centered at �6 km depth and one deep patchcentered at 25–30 km depth (Figure 10b). Only portions ofthe two patches are within our high resolution area, but thelocations certainly do not overlap the two main fully coupledregions in Nicoya. NVT were found correlated temporallywith the 2007 event but not spatially [Outerbridge et al.,2010].
6. Conclusion
[48] The Nicoya Peninsula, within a distance of 60–120 km to the MAT, is an ideal place to study subductiondynamics. Using the campaign and continuous GPS datafrom 1996 to 2010, we reveal the partial partitioning of theCO-CA plate convergence into 11� 1 mm/yr trench-parallelforearc sliver motion and less oblique thrusting on the sub-duction interface with 20 mm/yr strike-slip motion. Such apartition controls the first-order deformation of NW CostaRica.[49] On the basis of our interseismic megathrust coupling
model, strong coupling dominates the subduction interfacebelow the Nicoya peninsula, despite that interface micro-seismicity, NVT, LFEs, and transient slips can occur in theintermediately to weakly coupled regions on the interface.Transient slow-slip events cannot entirely compensate forthe slip deficit that has accumulated since the last megathrustearthquake in 1950. A potential Mw 7.8 1950-type earth-quake can be expected from the two fully coupled patches ofour best fit interseismic megathrust coupling model, onelocated offshore Nicoya centered at �15 km depth and theother located inland centered at �24 km depth. The updiplimit of the seismogenic zone is located at �10 km depth,while the downdip limit of the seismogenic zone is locatedupdip of the continental Moho and likely controlled by theserpentinized mantle wedge. Interface microseismicity nei-ther defines the strong-coupling patches nor marks the updipor downdip limit of the seismogenic zone in Nicoya.
Appendix A: GPS Time Series Relative to theCaribbean Plate
[50] The conversion from raw time series in the ITRF2005frame to the Caribbean frame uses the angular velocity andits covariance matrix determined by DeMets et al. [2010]. Acorrection for the translation of Earth’s center-of-mass withrespect to ITRF2005 is also applied [DeMets et al., 2010](Figures A1–A3).
[51] Acknowledgments. This study was supported by the NationalScience Foundation grant NSF-0847382 to A.V.N. and based on data andequipment services provided by the UNAVCO facility with support fromNSF and NASA under EAR-0735156. We greatly appreciate help fromYan Luo in the field. Figures were created using Generic Mapping Tools[Wessel and Smith, 1991]. We also thank two anonymous reviewers fortheir useful reviews.
ReferencesAdamek, S., F. Tajima, and D. Wiens (1987), Seismic rupture associated withsubduction of the Cocos ridge, Tectonics, 6(6), 757–774, doi:10.1029/TC006i006p00757.
FENG ET AL.: NICOYA INTERSEISMIC MEGATHRUST COUPLING B06407B06407
20 of 23

Altamimi, Z., X. Collilieux, J. Legrand, B. Garayt, and C. Boucher (2007),ITRF2005: A new release of the International Terrestrial ReferenceFrame based on time series of station positions and Earth OrientationParameters, J. Geophys. Res., 112, B09401, doi:10.1029/2007JB004949.
Avants, M., S. Schwartz, A. Newman, and H. DeShon (2001), Largeunderthrusting earthquakes beneath the Nicoya Peninsula, Eos Trans.AGU, 82(46), Fall Meet. Suppl., Abstract T52E-07.
Barckhausen, U., C. Ranero, R. von Huene, S. Cande, and H. Roeser(2001), Revised tectonic boundaries in the Cocos Plate off Costa Rica:Implications for the segmentation of the convergent margin and for platetectonic models, J. Geophys. Res., 106(B9), 19,207–19,220, doi:10.1029/2001JB000238.
Bilek, S. L., S. Y. Schwartz, and H. R. DeShon (2003), Control of seafloorroughness on earthquake rupture behavior, Geology, 31(5), 455–458,doi:10.1130/0091-7613(2003)031<0455:COSROE>2.0.CO;2.
Bilek, S. L., C. E. Elliott, and C. L. Bertelloni (2009), Triggered seismicityassociated with the 1990 Nicoya, Costa Rica, Mw = 7.0 earthquake, Geo-chem. Geophys. Geosyst., 10, Q04S13, doi:10.1029/2008GC002317.
Brown, J., G. C. Beroza, and D. R. Shelly (2008), An autocorrelationmethod to detect low frequency earthquakes within tremor, Geophys.Res. Lett., 35, L16305, doi:10.1029/2008GL034560.
Brown, J. R., G. C. Beroza, S. Ide, K. Ohta, D. R. Shelly, S. Y. Schwartz,W. Rabbel, M. Thorwart, and H. Kao (2009), Deep low-frequency earth-quakes in tremor localize to the plate interface in multiple subductionzones, Geophys. Res. Lett., 36, L19306, doi:10.1029/2009GL040027.
Brown, K. M., M. D. Tryon, H. R. DeShon, L. M. Dorman, and S. Y.Schwartz (2005), Correlated transient fluid pulsing and seismic tremorin the Costa Rica subduction zone, Earth Planet. Sci. Lett., 238, 189–203, doi:10.1016/j.epsl.2005.06.055.
Bürgmann, R., M. G. Kogan, G. M. Steblov, G. Hilley, V. E. Levin, andE. Apel (2005), Interseismic coupling and asperity distribution along theKamchatka subduction zone, J. Geophys. Res., 110, B07405, doi:10.1029/2005JB003648.
Cazenave, A., and W. Llovel (2010), Contemporary sea level rise, Annu.Rev. Mar. Sci., 2, 145–173, doi:10.1146/annurev-marine-120308-081105.
Chen, T., A. V. Newman, L. Feng, and H. M. Fritz (2009), Slip distributionfrom the 1 April 2007 Solomon Islands earthquake: A unique image ofnear‐trench rupture, Geophys. Res. Lett., 36, L16307, doi:10.1029/2009GL039496.
Chlieh, M., J. P. Avouac, K. Sieh, D. H. Natawidjaja, and J. Galetzka(2008), Heterogeneous coupling of the Sumatran megathrust constrainedby geodetic and paleogeodetic measurements, J. Geophys. Res., 113,B05305, doi:10.1029/2007JB004981.
Correa-Mora, F., C. DeMets, E. Cabral-Cano, B. Marquez-Azua, andO. Diaz-Molina (2008), Interplate coupling and transient slip along thesubduction interface beneath Oaxaca, Mexico, Geophys. J. Int., 175(1),269–290, doi:10.1111/j.1365-246X.2008.03910.x.
Davis, E. E., and H. W. Villinger (2006), Transient formation fluid pres-sures and temperatures in the Costa Rica forearc prism and subductingoceanic basement: CORK monitoring at ODP sites 1253 and 1255, EarthPlanet. Sci. Lett., 245, 232–244, doi:10.1016/j.epsl.2006.02.042.
DeMets, C., R. G. Gordon, and D. F. Argus (2010), Geologically currentplate motions, Geophys. J. Int., 181, 1–80, doi:10.1111/j.1365-246X.2009.04491.x.
DeShon, H. R., and S. Y. Schwartz (2004), Evidence for serpentinization ofthe forearc mantle wedge along the Nicoya Peninsula, Costa Rica,Geophys.Res. Lett., 31, L21611, doi:10.1029/2004GL021179.
DeShon, H. R., S. Y. Schwartz, S. L. Bilek, L. M. Dorman, V. Gonzalez, J. M.Protti, E. R. Flueh, and T. H. Dixon (2003), Seismogenic zone structure ofthe southern Middle America Trench, Costa Rica, J. Geophys. Res.,108(B10), 2491, doi:10.1029/2002JB002294.
DeShon, H. R., S. Y. Schwartz, A. V. Newman, V. Gonzalez, J. M. Protti,L. M. Dorman, T. Dixon, D. E. Sampson, and E. R. Flueh (2006), Seis-mogenic zone structure beneath the Nicoya Peninsula, Costa Rica, fromthree-dimensional local earthquake P- and S-wave tomography, Geophys.J. Int., 164, 109–124, doi:10.1111/j.1365-246X.2005.02809.x.
Dixon, T. H., M. Miller, F. Farina, H. Wang, and D. Johnson (2000),Present-day motion of the Sierra Nevada block and some tectonic impli-cations for the Basin and Range province, North American Cordillera,Tectonics, 19(1), 1–24, doi:10.1029/1998TC001088.
Du, Y., A. Aydin, and P. Segall (1992), Comparison of various inversion tech-niques as applied to the determination of a geophysical deformation modelfor the 1983 Borah Peak earthquake, Bull. Seismol. Soc. Am., 82(4),1840–1866.
Ekström, G., A. M. Dziewonski, N. N. Maternovskaya, and M. Nettles(2005), Global seismicity of 2003: Centroid-moment-tensor solutionsfor 1087 earthquakes, Phys. Earth Planet. Inter., 148(2–4), 327–351,doi:10.1016/j.pepi.2004.09.006.
Fisher, A. T., et al. (2003), Abrupt thermal transition reveals hydrothermalboundary and role of seamounts within the Cocos Plate, Geophys. Res.Lett., 30(11), 1550, doi:10.1029/2002GL016766.
Ghosh, A., A. V. Newman, A. M. Thomas, and G. T. Farmer (2008), Inter-face locking along the subduction megathrust from b-value mapping nearNicoya Peninsula, Costa Rica, Geophys. Res. Lett., 35, L01301,doi:10.1029/2007GL031617.
Güendel, F. (1986), Seismotectonics of Costa Rica: An analytical view ofthe southern terminus of the Middle American Trench, PhD dissertation,Univ. of Calif., Santa Cruz.
Harris, R. A., and P. Segall (1987), Detection of a locked zone at depth onthe Parkfield, California, segment of the San Andreas fault, J. Geophys.Res., 92(B8), 7945–7962, doi:10.1029/JB092iB08p07945.
Harris, R. N., and K. Wang (2002), Thermal models of the Middle AmericaTrench at the Nicoya Peninsula, Costa Rica, Geophys. Res. Lett., 29(21),2010, doi:10.1029/2002GL015406.
Harris, R. N., G. Spinelli, C. R. Ranero, I. Grevemeyer, H. Villinger,and U. Barckhausen (2010), Thermal regime of the Costa Rican conver-gent margin: 2. Thermal models of the shallow Middle America subduc-tion zone offshore Costa Rica, Geochem. Geophys. Geosyst., 11,Q12S29, doi:10.1029/2010GC003273.
Hashimoto, C., A. Noda, T. Sagiya, and M. Matsu’ura (2009), Interplateseismogenic zones along the Kuril-Japan trench inferred from GPS datainversion, Nat. Geosci., 2, 141–144, doi:10.1038/ngeo421.
Heflin, M., et al. (1992), Global geodesy using GPS without fiducial sites,Geophys. Res. Lett., 19(2), 131–134, doi:10.1029/91GL02933.
Holtkamp, S., and M. R. Brudzinski (2010), Determination of slow slip epi-sodes and strain accumulation along the Cascadia margin, J. Geophys.Res., 115, B00A17, doi:10.1029/2008JB006058.
Husen, S., E. Kissling, and R. Quintero (2002), Tomographic evidence for asubducted seamount beneath the Gulf of Nicoya, Costa Rica: The causeof the 1990 Mw = 7.0 Gulf of Nicoya earthquake, Geophys. Res. Lett.,29(8), 1238, doi:10.1029/2001GL014045.
Hyndman, R. D., M. Yamano, and D. A. Oleskevich (1997), The seismo-genic zone of subduction thrust faults, Isl. Arc, 6, 244–260, doi:10.1111/j.1440-1738.1997.tb00175.x.
Ide, S., D. R. Shelly, and G. C. Beroza (2007), The mechanism of deep lowfrequency earthquakes: Further evidence that deep non-volcanic tremor isgenerated by shear slip on the plate interface, Geophys. Res. Lett., 34,L03308, doi:10.1029/2006GL028890.
Ihmlé, P. F. (1996), Monte Carlo slip inversion in the frequency domain:Application to the 1992 Nicaragua Slow Earthquake, Geophys. Res. Lett.,23(9), 913–916, doi:10.1029/96GL00872.
Iinuma, T., et al. (2004), Inter‐plate coupling in the Nicoya Peninsula, CostaRica, as deduced from a trans‐peninsula GPS experiment, Earth Planet.Sci. Lett., 223, 203–212, doi:10.1016/j.epsl.2004.04.016.
Jiang, Y., S. Wdowinski, T. H. Dixon, M. Hackl, M. Protti, and V. González(2012), Slow slip events in Costa Rica detected by continuous GPS observa-tions, 2002–2011, Geochem. Geophys. Geosyst., 13, Q04006, doi:10.1029/2012GC004058.
Jónsson, S., H. Zebker, P. Segall, and F. Amelung (2002), Fault slip distri-bution of the 1999MW 7.1 Hector Mine, California earthquake, estimatedfrom satellite radar and GPS measurements, Bull. Seismol. Soc. Am., 92(4),1377–1389, doi:10.1785/0120000922.
Kanamori, H., and M. Kikuchi (1993), The 1992 Nicaragua earthquake: Aslow tsunami earthquake associated with subducted sediments, Nature,361, 714–716, doi:10.1038/361714a0.
Kao, H., S.-J. Shan, H. Dragert, G. Rogers, J. F. Cassidy, and K. Ramachandran(2005), A wide depth distribution of seismic tremors along the northernCascadia margin, Nature, 436, 841–844, doi:10.1038/nature03903.
Kao, H., S.-J. Shan, H. Dragert, and G. Rogers (2009), Northern Cascadiaepisodic tremor and slip: A decade of tremor observations from 1997 to2007, J. Geophys. Res., 114, B00A12, doi:10.1029/2008JB006046.
Kostoglodov, V., A. Husker, N. M. Shapiro, J. S. Payero, M. Campillo,N. Cotte, and R. Clayton (2010), The 2006 slow slip event and nonvolca-nic tremor in the Mexican subduction zone, Geophys. Res. Lett., 37,L24301, doi:10.1029/2010GL045424.
LaBonte, A. L., K. M. Brown, and Y. Fialko (2009), Hydrologic detectionand finite element modeling of a slow slip event in the Costa Rica prismtoe, J. Geophys. Res., 114, B00A02, doi:10.1029/2008JB005806.
LaFemina, P., T. H. Dixon, R. Govers, E. Norabuena, H. Turner, A. Saballos,G. Mattioli, M. Protti, and W. Strauch (2009), Fore-arc motion and CocosRidge collision in Central America, Geochem. Geophys. Geosyst., 10,Q05S14, doi:10.1029/2008GC002181.
La Rocca, M., D. Galluzzo, S. Malone, W. McCausland, G. Saccorotti, andE. Del Pezzo (2008), Testing small-aperture array analysis on well-locatedearthquakes, and application to the location of deep tremor, Bull. Seismol.Soc. Am., 98(2), 620–635, doi:10.1785/0120060185.
FENG ET AL.: NICOYA INTERSEISMIC MEGATHRUST COUPLING B06407B06407
21 of 23

La Rocca, M., K. C. Creager, D. Galluzzo, S. Malone, J. E. Vidale, J. R.Sweet, and A. G. Wech (2009), Cascadia tremor located near plate inter-face constrained by S minus P wave times, Science, 323, 620–623,doi:10.1126/science.1167112.
La Rocca, M., D. Galluzzo, S. Malone, W. McCausland, and E. Del Pezzo(2010), Array analysis and precise sourcelocation of deep tremor in Cascadia,J. Geophys. Res., 115, B00A20, doi:10.1029/2008JB006041.
Lonsdale, P. (2005), Creation of the Cocos and Nazca plates by fission ofthe Farallon plate, Tectonophysics, 404, 237–264, doi:10.1016/j.tecto.2005.05.011.
Lundgren, P., M. Protti, A. Donnellan, M. Heflin, E. Hernandez, andD. Jefferson (1999), Seismic cycle and plate margin deformation in CostaRica: GPS observations from 1994 to 1997, J. Geophys. Res., 104(B12),28,915–28,926, doi:10.1029/1999JB900283.
Lyon-Caen, H., et al. (2006), Kinematics of the North American-Caribbean-Cocos plates in Central America from new GPS measurements across thePolochic-Motagua fault system, Geophys. Res. Lett., 33, L19309,doi:10.1029/2006GL027694.
MacMillan, I., P. B. Gans, and G. Alvarado (2004), Middle Miocene topresent plate tectonic history of the southern Central American VolcanicArc, Tectonophysics, 392, 325–348, doi:10.1016/j.tecto.2004.04.014.
Mao, A., C. G. A. Harrison, and T. H. Dixon (1999), Noise in GPS coordi-nate time series, J. Geophys. Res., 104(B2), 2797–2816, doi:10.1029/1998JB900033.
Marshall, J. S., and R. S. Anderson (1995), Quaternary uplift and seismic cycledeformation, Peninsula de Nicoya, Costa Rica,Geol. Soc. Am. Bull., 107(4),463–473, doi:10.1130/0016-7606(1995)107<0463:QUASCD>2.3.CO;2.
Marshall, J., D. Fisher, and T. Gardner (2000), Central Costa Rica deformedbelt: Kinematics of diffuse faulting across the western Panama block,Tectonics, 19(3), 468–492, doi:10.1029/1999TC001136.
McCausland, W., S. Malone, and D. Johnson (2005), Temporal and spatialoccurrence of deep non-volcanic tremor: From Washington to northernCalifornia,Geophys. Res. Lett., 32, L24311, doi:10.1029/2005GL024349.
Moore, J. C., and D. Saffer (2001), Updip limit of the seismogenic zonebeneath the accretionary prism of southwest Japan: An effect of diage-netic to low-grade metamorphic processes and increasing effective stress,Geology, 29(2), 183–186, doi:10.1130/0091-7613(2001)029<0183:ULOTSZ>2.0.CO;2.
Moreno, M., M. Rosenau, and O. Onchen (2010), 2010 Maule earthquakeslip correlates with pre‐seismic locking of Andean subduction zone,Nature, 467, 198–202, doi:10.1038/nature09349.
Newman, A. V., S. Y. Schwartz, V. González, H. R. DeShon, J. M. Protti,and L. M. Dorman (2002), Along-strike variability in the seismogeniczone below Nicoya Peninsula, Costa Rica, Geophys. Res. Lett., 29(20),1977, doi:10.1029/2002GL015409.
Newman, A. V., L. Feng, H.M. Fritz, Z. M. Lifton, N. Kalligeris, and Y.Wei(2011), The energetic 2010 Mw 7.1 Solomon Islands tsunami earthquake,Geophys. J. Int., 186, 775–781, doi:10.1111/j.1365-246X.2011.05057.x.
Nishenko, S. P. (1991), Circum-Pacific seismic potential: 1989–1999, PureAppl. Geophys., 135(2), 169–259, doi:10.1007/BF00880240.
Norabuena, E., et al. (2004), Geodetic and seismic constraints on some seis-mogenic zone processes in Costa Rica, J. Geophys. Res., 109, B11403,doi:10.1029/2003JB002931.
Obara, K. (2002), Nonvolcanic deep tremor associated with subduction insouthwest Japan, Science, 296, 1679–1681, doi:10.1126/science.1070378.
Obara, K., H. Hirose, F. Yamamizu, and K. Kasahara (2004), Episodicslow slip events accompanied by non-volcanic tremors in southwestJapan subduction zone, Geophys. Res. Lett., 31, L23602, doi:10.1029/2004GL020848.
Okada, Y. (1992), Internal deformation due to shear and tensile faults in ahalf-space, Bull. Seismol. Soc. Am., 82(2), 1018–1040.
Oleskevich, D. A., R. D. Hyndman, and K. Wang (1999), The updip anddowndip limits to great subduction earthquakes: Thermal and structuralmodels of Cascadia, south Alaska, SW Japan, and Chile, J. Geophys.Res., 104(B7), 14,965–14,991, doi:10.1029/1999JB900060.
Outerbridge, K. C., T. H. Dixon, S. Y. Schwartz, J. I. Walter, M. Protti,V. González, J. Biggs, M. Thorwart, and W. Rabbel (2010), A tremorand slip event on the Cocos-Caribbean subduction zone as measuredby a global positioning system (GPS) and seismic network on the NicoyaPeninsula, Costa Rica, J. Geophys. Res., 115, B10408, doi:10.1029/2009JB006845.
Patino, L. C., M. J. Carr, and M. D. Feigenson (2000), Local and regionalvariations in Central American arc lavas controlled by variations in sub-ducted sediment input, Contrib. Mineral. Petrol., 138(3), 265–283,doi:10.1007/s004100050562.
Payero, J. S., V. Kostoglodov, N. Shapiro, T. Mikumo, A. Iglesias, X. Perez-Campos, and R. W. Clayton (2008), Nonvolcanic tremor observed in theMexican subduction zone, Geophys. Res. Lett., 35, L07305, doi:10.1029/2007GL032877.
Peacock, S. M. (2009), Thermal and metamorphic environment of subduc-tion zone episodic tremor and slip, J. Geophys. Res., 114, B00A07,doi:10.1029/2008JB005978.
Peng, Z., and J. Gomberg (2010), An integrated perspective of the continuumbetween earthquakes and slow-slip phenomena, Nat. Geosci., 3, 599–607,doi:10.1038/ngeo940.
Peterson, C. L., and D. H. Christensen (2009), Possible relationship betweennonvolcanic tremor and the 1998–2001 slow slip event, south centralAlaska, J. Geophys. Res., 114, B06302, doi:10.1029/2008JB006096.
Plafker, G. (1976), Tectonic aspects of the Guatemalan earthquake of 4February 1976, Science, 193, 1201–1208, doi:10.1126/science.193.4259.1201.
Protti, M., F. Güendel, and K. McNally (1994), The geometry of theWadati-Benioff zone under southern Central America and its tectonic sig-nificance: Results from a high-resolution local seismographic network,Phys. Earth Planet. Inter., 84, 271–287, doi:10.1016/0031-9201(94)90046-9.
Protti, M., et al. (1995), The March 25, 1990(Mw = 7.0,ML = 6.8), earthquakeat the entrance of the Nicoya Gulf, Costa Rica: Its prior activity, foreshocks,aftershocks, and triggered seismicity, J. Geophys. Res., 100(B10), 20,345–20,358, doi:10.1029/94JB03099.
Protti, M., M. F. Güendel, and E. Malavassi (2001), Evaluación delPotencial Sísmico de la Península de Nicoya, 1st ed., 144 pp., Ed. Fund.Univ. Nac., Heredia, Costa Rica.
Protti, M., V. González, T. Kato, T. Iinuma, S. Miyazaki, K. Obana,Y. Kaneda, P. LaFemina, T. Dixon, and S. Y. Schwartz (2004), A creepevent on the shallow interface of the Nicoya Peninsula, Costa Rica seismo-genic zone, Eos Trans. AGU, 85(47), Fall Meet. Suppl., Abstract S41D-07.
Ranero, C. R., and R. von Huene (2000), Subduction erosion along theMiddle America convergent margin, Nature, 404, 748–752,doi:10.1038/35008046.
Ranero, C. R., J. Phipps Morgan, K. McIntosh, and C. Reichert (2003),Bending-related faulting and mantle serpentinization at the Middle Amer-ica trench, Nature, 425, 367–373, doi:10.1038/nature01961.
Rogers, G., and H. Dragert (2003), Episodic tremor and slip on the Cascadiasubduction zone: The chatter of silent slip, Science, 300, 1942–1943,doi:10.1126/science.1084783.
Rosencrantz, E., and P. Mann (1991), SeaMARC II mapping of transformfaults in the Cayman Trough, Geology, 19, 690–693, doi:10.1130/0091-7613(1991)019<0690:SIMOTF>2.3.CO;2.
Satake, K. (1994), Mechanism of the 1992 Nicaragua tsunami earthquake,Geophys. Res. Lett., 21(23), 2519–2522, doi:10.1029/94GL02338.
Savage, J. (1983), A dislocation model of strain accumulation and release ata subduction zone, J. Geophys. Res., 88(B6), 4984–4996, doi:10.1029/JB088iB06p04984.
Schmalzle, G., T. Dixon, R. Malservisi, and R. Govers (2006), Strain accu-mulation across the Carrizo segment of the San Andreas Fault, California:Impact of laterally varying crustal properties, J. Geophys. Res., 111,B05403, doi:10.1029/2005JB003843.
Schwartz, S. Y., and H. R. DeShon (2007), Distinct updip limits to geodeticlocking and microseismicity at the northern Costa Rica seismogenic zone:Evidence for two mechanical transitions, in The Seismogenic Zone of Sub-duction Thrust Faults, edited by T. H. Dixon and J. C. Moore, pp. 576–599, Columbia Univ. Press, New York.
Shelly, D. R., G. C. Beroza, S. Ide, and S. Nakamula (2006), Low-frequencyearthquakes in Shikoku, Japan, and their relationship to episodic tremorand slip, Nature, 442, 188–191, doi:10.1038/nature04931.
Shelly, D. R., G. C. Beroza, and S. Ide (2007), Non-volcanic tremor andlow-frequency earthquake swarms, Nature, 446, 305–307, doi:10.1038/nature05666.
Siebert, L., and T. Simkin (2002), Volcanoes of the World: An IllustratedCatalog of Holocene Volcanoes and Their Eruptions, Global VolcanismProgram Digital Inf. Ser., vol. GVP-3, Smithsonian Inst., Washington,D. C. [Available at http://www.volcano.si.edu/world/].
Spinelli, G. A., and D. M. Saffer (2004), Along‐strike variations in under-hrust sediment dewatering on the Nicoya margin, Costa Rica related to theupdip limit of seismicity, Geophys. Res. Lett., 31, L04613, doi:10.1029/2003GL018863.
Thomas, A. M., A. V. Newman, A. Ghosh, and G. T. Farmer (2007), Statis-tical modeling of the Middle America subduction zone using interplateseismicity, paper presented at Seismological Society of America SpringMeeting, Waikoloa, Hawaii.
von Huene, R., C. R. Ranero, W. Weinrebe, and K. Hinz (2000), Quaternaryconvergent margin tectonics of Costa Rica, segmentation of the CocosPlate, and Central American volcanism, Tectonics, 19(2), 314–334,doi:10.1029/1999TC001143.
Walter, J. I., S. Y. Schwartz, J. M. Protti, and V. González (2011), Persistenttremor within the northern Costa Rica seismogenic zone, Geophys. Res.Lett., 38, L01307, doi:10.1029/2010GL045586.
FENG ET AL.: NICOYA INTERSEISMIC MEGATHRUST COUPLING B06407B06407
22 of 23

Wech, A. G., and K. C. Creager (2007), Cascadia tremor polarization evidencefor plate interface slip, Geophys. Res. Lett., 34, L22306, doi:10.1029/2007GL031167.
Wessel, P., and W. H. F. Smith (1991), Free software helps map and displaydata, Eos Trans. AGU, 72, 441, doi:10.1029/90EO00319.
White, R. A., and D. H. Harlow (1993), Destructive upper-crustal earth-quakes of Central America since 1900, Bull. Seismol. Soc. Am., 83(4),1115–1142.
Zumberge, J., M. Heflin, D. Jefferson, M. Watkins, and F. Webb (1997),Precise point positioning for the efficient and robust analysis of GPS datafrom large networks, J. Geophys. Res., 102(B3), 5005–5017, doi:10.1029/96JB03860.
FENG ET AL.: NICOYA INTERSEISMIC MEGATHRUST COUPLING B06407B06407
23 of 23