feeding biochar to cows: an innovative solution for ... · feeding biochar to cows for improving...
TRANSCRIPT

Pedosphere 25(5): 666–679, 2015
ISSN 1002-0160/CN 32-1315/P
c⃝ 2015 Soil Science Society of China
Published by Elsevier B.V. and Science Press
Feeding Biochar to Cows: An Innovative Solution for ImprovingSoil Fertility and Farm Productivity
Stephen JOSEPH1,2,3,10,∗, Doug POW4, Kathy DAWSON5, David R. G. MITCHELL3, Aditya RAWAL9,
James HOOK9, Sarasadat TAHERYMOOSAVI2, Lukas VAN ZWIETEN6, Joshua RUST6, Scott DONNE1,
Paul MUNROE3, Ben PACE2, Ellen GRABER8, Torsten THOMAS7, Shaun NIELSEN7, Jun YE7, Yun LIN1,
PAN Genxing10, LI Lianqing10 and Zakaria M. SOLAIMAN11
1Discipline of Chemistry, University of Newcastle, Callaghan 2308 (Australia)2School of Materials Science and Engineering, University of New South Wales, Sydney 2052 (Australia)3Electron Microscopy Center, AIIM, University of Wollongong, Wollongong 2522 (Australia)4MarronBrook Farm, Manjimup 6258 (Australia)5Warren Catchments Council, 52 Bath St, Manjimup 6258 (Australia)6Wollongbar Primary Industries Institute, NSW Department of Primary Industries,1243 Bruxner Highway, Wollongbar 2477 (Au-
stralia)7Centre for Marine Bio-Innovation, School of Biotechnology and Biomolecular Sciences, The University of New South Wales, Sydney
(Australia)8Institute of Soil, Water and Environmental Sciences, The Volcani Center, Agricultural Research Organization, POB 6, Bet Dagan
50250 (Israel)9Mark Wainwright Analytical Centre, University of New South Wales, Kensington 2052 (Australia)10Institute of Resources, Ecosystem and Environment of Agriculture, Nanjing Agricultural University, Nanjing 210095 (China)11Soil Biology and Molecular Ecology Group, School of Earth and Environment (M087), The University of Western Australia, Craw-
ley 6009 (Australia)
(Received May 7, 2015; revised July 22, 2015)
ABSTRACT
Addition of biochar produced through thermal decomposition of biomass has been seen as a strategy to improve soils and to
sequester carbon (C), but wide scale implementation of the technology requires to devise innovative profitable solutions. To develop
biochar utilisation with an integrated system approach, an innovative program was implemented in 2012 on a 53-ha farm in Western
Australia to determine the costs and benefits of integrating biochar with animal husbandry and improvement of pastures. Biochar
was mixed with molasses and fed directly to cows. The dung-biochar mixture was incorporated into the soil profile by dung beetles.
We studied the changes in soil properties over 3 years. Biochar extracted from fresh dung and from the soil to a depth of 40 cm
was characterised. A preliminary financial analysis of the costs and benefits of this integrated approach was also undertaken. The
preliminary investigation results suggested that this strategy was effective in improving soil properties and increasing returns to the
farmer. It was also concluded that the biochar adsorbed nutrients from the cow’s gut and from the dung. Dung beetles could transport
this nutrient-rich biochar into the soil profile. There was little evidence that the recalcitrant component of the biochar was reduced
through reactions inside the gut or on/in the soil. Further research is required to quantify the long-term impact of integrating biochar
and dung beetles into the rearing of cows.
Key Words: animal husbandry, biochar, C sequestration, dung beetles, financial benefit, pasture
Citation: Joseph S, Pow D, Dawson K, Mitchell D R G, Rawal A, Hook J, Taherymoosavi S, Van Zwieten L, Rust J, Donne S,
Munroe P, Pace B, Graber E, Thomas T, Nielsen S, Ye J, Lin Y, Pan G X, Li L Q and Solaiman Z M. 2015. Feeding biochar to cows:
An innovative solution for improving soil fertility and farm productivity. Pedosphere. 25(5): 666–679.
INTRODUCTION
Activated carbon (C), and more recently biochar,
have been used as a supplement in animal feed. Mc-
Henry (2010) and Blackwell et al. (2009) both de-
vised the case for integrating biochar into production
of meat, both as a feed additive, as a low cost method
of applying biochar to soils and as a potential bedding
material. McHenry (2010) saw feeding biochar as a me-
thod of reducing inputs of chemical fertilisers, impro-
ving soil properties and C sequestration. Previous re-
search has also identified biochar as a potential product
which can improve animal health (Van et al., 2006; Ge-
rlach et al., 2014). Calvelo Pereira et al. (2014) found
∗Corresponding author. E-mail: [email protected].

FEEDING BIOCHAR TO COWS FOR IMPROVING SOIL 667
that biochar mixed with silage or hay did not have
a negative effect on rumen chemistry during in vitro
incubations. Biochar can also assist in reducing the
risk of bioaccumulation of organic pollutants, such as
dichlorodiphenyltrichloroethane (DDT) and Dieldrin
(Hale et al., 2011)
The Western Australian beef herd consists of ap-
proximately two million head of cattle, half of which
are free range on extensive pastoral stations in the
northern rangelands, while the remainders graze the
pastures of the agricultural region of the south and
south-west of the state. In 2011/2012 the Australian
Bureau of Statistics estimated that the gross value of
beef production in Western Australia was $517 mil-
lion. The state exported 220 000 live cattle, valued at
$154 million, in addition to 99 000 t of boxed beef pro-
ducts worth $68 million in 2012. Mature animals pro-
duce about 18 kg of wet dung each day, giving a total
production of over 36 000 000 t dropped onto Western
Australian pastures each year. In some areas the ef-
fluent from this dung has flowed into the river systems
causing eutrophication (Doube et al., 2003). Dung bee-
tles (Bubas bison) are considered to have the potential
to transform this pollutant into a multi-million dollar
production benefit (Fincher, 1981), to increase the per-
meability of soil to water (Doube et al., 2003), and to
significantly reduce the pollution of water bodies.
Surface dung contributes to reliance on veterinary
chemicals to control resultant parasite populations
which dung harbors. The loss of nitrogen (N) from
dung due to volatilization contributes to the need for
higher applications of fertilisers, with the subsequent
effect of increasing soil acidity (Haynes and Naidu,
1998). A major problem is the increase in acidity of
the soil and the need to increase the amount of su-
perphosphate added to the pastures, as well as a need
to supplement feed with expensive hay. The cost of
the conventional practice (CP) of supplementary fee-
ding grass-fed cattle with hay and silage through-
out the annual pasture non-growing period has incre-
ased due to recent severe droughts (Dairy Australia,
2015).
An innovative program has been implemented on
a 53-ha farm in Western Australia (Brook Farm
58◦34.18′ S, 116◦8.34′ E) in 2012 to determine the
costs and benefits of using biochar as a feed supple-
ment and dung beetles as a means of incorporation of
both the dung and biochar into the soil profile. Dung
beetles had been introduced by an adjoining property
in 1990 and these beetles had migrated to the farm by
2009 when the present owner purchased it. Until 2009,
extensive horticulture combined with grazing had be-
en undertaken. Farming practice included the use of
superphosphate, and historically, the organochlori-
ne insecticides DDT, dichlorodiphenyldichloroethylene
(DDE) and Dieldrin were applied. In 2009, the present
owner converted the farm for the raising of steers and
no further insecticides or herbicides were used.
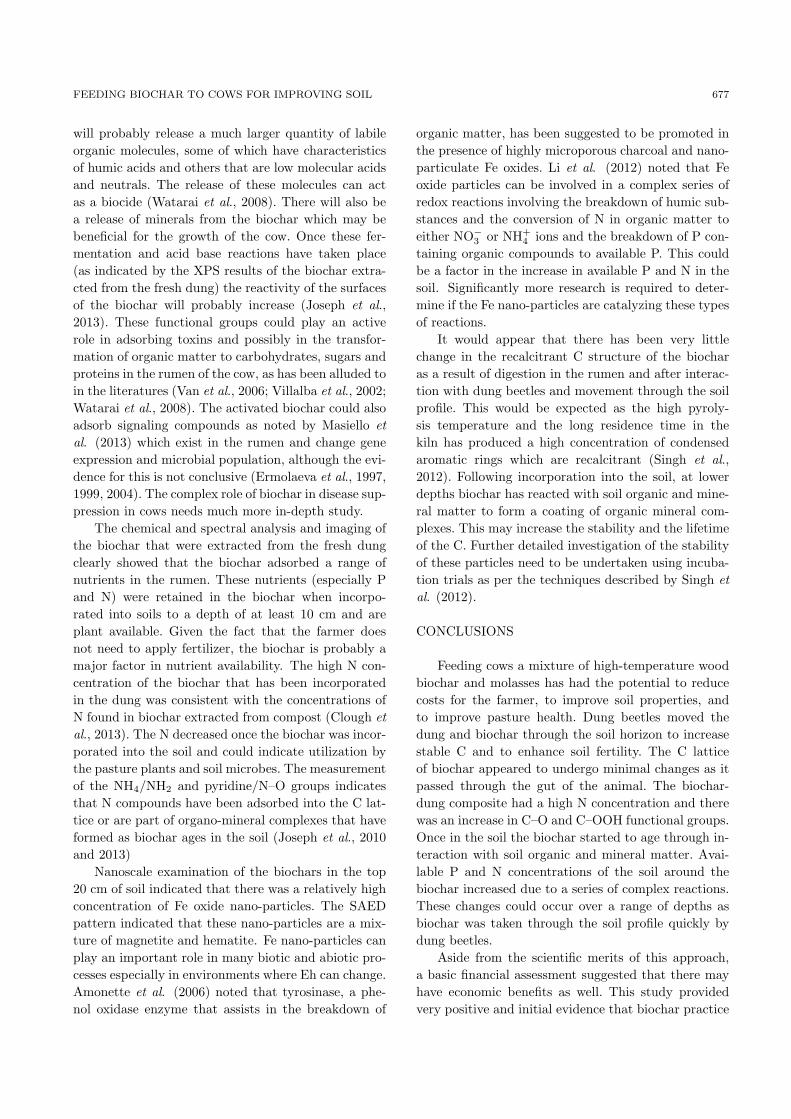
In this program biochar was provided as a feed
supplement to 60 cows. Dung beetles incorporated the
biochar and dung into the pastures to a depth of ap-
proximately 40 cm (Fig. 1). This paper reports a pre-
liminary study to determine the changes that had ta-
ken place in the field that had biochar addition via
animal feed application, over a 3-year period, to exa-
mine the characteristics of the biochar after digestion
through the animal and after soil incorporation by
dung beetles, and to summarise the changes in the cost
of production that had been reported by the farmer. A
detailed study of the changes in all the fields, along
Fig. 1 (a) Dung beetles processing dung with biochar; (b) dung beetles pack dung-biochar mixture into tunnels dug deep into the
soil profile; (c) biochar at bottom of trench where samples were taken.

668 S. JOSEPH et al.
with the economic benefits, will be reported in a sub-
sequent work.
MATERIALS AND METHODS
Method of feeding cows and dung beetle application
In 2012 a new animal husbandry practice was intro-
duced. Cows were fed with a mixture of 0.1 kg day−1
of molasses with 0.33 kg day−1 of jarrah wood biochar
(known as Simcoa biochar) which was purchased from
Simcoa Pty Ltd. (Kemerton, Australia). Biochar was
first fed to cows in the winter to coincide with the ac-
tive season of the dung beetle (mid-April emergence
until mid-October). In 2012–2014 biochar was fed to
cows on all 4 pasture paddocks of the farm at the same
period of the year.
Soil and biochar samples
The soil in the field (known as “East field”), where
biochar was first added in 2012, was classed as a Chro-
mosol (Department of Agriculture and Food Western
Australia). In 2011, before the introduction of the
biochar, 30 core soil samples were taken from a transect
across the “East field” to a depth of 10 cm. These were
combined, put through a 2-mm sieve, riffled and ana-
lysed by CSPB Pty Ltd. (Perth, Australia). Cows were
fed with biochar from 2012 in this field and dung bee-
tles incorporated the resulting dung into the soil profile
(Fig. 1). Soil sampling was carried out along the same
transect in 2015 and a similar analysis to that car-
ried out in 2011 was undertaken. The results are sum-
marised in Table I. Biochar from part of the bulked soil
sample was extracted using the technique reported by
Joseph et al. (2010). Sufficient biochar was collected
to determine the C, N, Colwell P, pH (CaCl2), elec-
trical conductivity (EC) and elemental composition of
the aged biochar.
Characterisation of the biochar following digestion
by the cow and after incorporation into the soil, in-
volved a sampling procedure similar to that used by
Downie et al. (2011). Six soil samples were taken along
this transect to a depth of 40 cm in the “East field”
where animals had grazed for 3 years and where dung
beetle tunnels were visible. A core sampler was used to
take samples at 0–5 cm. A trench was dug to 20–30 cm
and then to 30–40 cm where a spatula was used to col-
lect soil around the dung-filled tunnels at each depth
(Fig. 1). All soil samples were amalgamated and sent
to New South Wales (NSW) Department of Primary
Industries’ Wollongbar Environmental Laboratory for
analysis of EC, pH, total N, organic C, P, K, available
N as NH+4 and NO−
3 , Colwell P, metals and exchangea-
TABLE I
Some basic properties of soil in the study field in 2011 (before the
introduction of biochar) and 2015 (biochar addition via animal
feed application over a 3-year period)
Property 2011 2015
Electrical conductivity (dS m−1) 0.063 0.124
pH (H2O) 5.9 5.9
pH (CaCl2) 4.9 5.2
Total N (g kg−1) NMa) 4.7
Total C (g kg−1) NM 58.1
Total P (mg kg−1) NM 938
Colwell P (mg kg−1) 49 102
Colwell K (mg kg−1) 55 205
KCl-extractable NH+4 -N (mg kg−1) 21 10
KCl-extractable NO−3 -N (mg kg−1) 15 33
Total organic C (g kg−1) 41.7 46.7
Al (cmol(+) kg−1) < 0.100 0.168
Ca (cmol(+) kg−1) 5.10 6.78
K (cmol(+) kg−1) 0.17 0.50
Mg (cmol(+) kg−1) 0.63 0.76
Na (cmol(+) kg−1) 0.10 0.18
a)Not measured.
ble cations as per the procedures given in Van Zwi-
eten et al. (2010). Biochar was separated and washed
from the amalgamated soil samples at each depth using
the procedures described by Lin et al. (2012b). The
separated biochar was labeled as D1, D2 and D3 for the
depths of 0–5, 20–30 and 30–40, respectively. Freshly
deposited dung was also collected and stored at ap-
proximately 4 ◦C until the biochar could be separated
out using the soil extraction method described by Lin
et al. (2012b). This biochar extracted from the dung
was labeled as D0.
Fresh and aged biochars
Jarrah wood biochar was produced in a vertical
retort with a residence time of 12 h at a maximum
temperature of 600 ◦C. Some properties of the biochar
have been published by Dempster et al. (2012). Further
analysis has been carried out as part of this work. The
ultimate, proximate and ash analysis were completed
by Bureau Veritas Pty Ltd. (Singleton, Australia). De-
tailed examination of the fresh biochar was also repor-
ted by Lin et al. (2012a). To complement this work
labile organic species were extracted from the jarrah
wood biochar and analysed using gas chromatography-
mass spectrometry (GC-MS) (Chia et al. 2014).
Scanning electron microscopy (SEM) analysis of
the microstructure of incorporated biochars was per-
formed using a ZEISS Sigma SEM (Munich, Germany)
fitted with a Bruker energy dispersive X-ray spectro-
meter (EDS) (Bruker Corporation, Berlin, Germany).
To provide detailed microstructural, crystallographic

FEEDING BIOCHAR TO COWS FOR IMPROVING SOIL 669
and micro-chemical analysis, both transmission elec-
tron microscopy (TEM) and scanning transmission ele-
ctron microscopy (STEM) were undertaken using a
JEOL ARM200F aberration corrected STEM (JEOL,
Tokyo, Japan) fitted with an electron energy loss spec-
trometer (EELS) and a JEOL large area EDS detector.
To help determine the crystal structure of the mineral
phases, selected area electron diffraction (SAED) was
carried out in TEM mode.
Analysis of approximately 50 particles of aged
biochar extracted from soil samples at each depth was
carried out to determine the range of particle types and
their nominal composition. This gave a reliable indica-
tion of overall mineral content, which might be released
when the biochar was applied to soil. The biochars were
ground to pass through a 100-µm sieve before analy-
sis. Surface functional groups and major mineral ele-
ments were measured using X-ray photoelectron spec-
troscopy (XPS) analysis (Thermo Scientific ESCAL-
AB250Xi; Thermo Scientific, Waltham, USA) with a
500 µm diameter beam of monochromatic Al-Kα ra-
diation (photon energy = 1 486.6 eV) at a pass en-
ergy of 20 eV. The core level binding energies (BEs)
were aligned with respect to the C1s BE of 285.0 eV.
Fourier transform infrared spectroscopy (FTIR) analy-
sis was carried out using the equipment and procedure
as detailed in Joseph et al. (2010 and 2013). Raman
spectroscopy was carried out using the equipment and
procedure detailed in Chia et al. (2012). Since the par-
ticles contained a high content of mineral matter, 12
spectra were taken from near the mineral particles and
from the C matrix. Two peak fitting was used to de-
termine the ratio of D-band to G-band intensity (D/G
ratio) and the particle size as per described in Chia
et al. (2012). Analysis of variance (ANOVA) of the
D/G ratios was carried out to determine if there was
a significant difference between samples both near the
mineral phase and on the C phase.
Solid-state nuclear magnetic resonance (NMR) spec-
troscopy
Solid-state13C cross polarization (CP) nuclear
magnetic resonance (NMR) spectra of the fresh biochar
were acquired (90◦ pulse of 3.2 µs, 195 W, relaxation
delay 1 s) on a 200 Avance spectrometer (Bruker Cor-
poration, Billerica, USA) equipped with a 4.7 Tesla
wide bore superconducting magnet with a resonance
frequency of 50.33 MHz for 13C as described in Baldock
and Smernik (2002). Chemical shifts were externally
referenced to the methyl resonance of hexamethylben-
zene (17.36 ppm) and a Lorentzian line broadening (50
Hz) applied.
The solid-state 13C direct polarization magic an-
gle spinning (DP-MAS) NMR experiments were car-
ried out on the aged biochar on a Bruker AVANCE
III 300 spectrometer (Bruker Corporation, Billerica,
USA) employing a 7 Tesla super conducting magnet
operating at frequencies of 300 and 75 MHz for the 1H
and 13C, respectively. The biochar sample was finely
ground, packed into a 4-mm zirconia rotor with Kel-F
cap, and spun at 12 kHz before NMR analysis. The ra-
tio of the protonated and non-protonated C in the char
was determined according to the method of Brewer et
al. (2009). 13C-90◦ pulse length of 4 µs and 80 kHz1H SPINAL64 decoupling, along with a Hahn-echo be-
fore signal detection to eliminate baseline distortion,
was used to acquire the spectra. A 68 AL64 decou-
pling, along with a Hahn-echo before signal detection
was carried out to eliminate baseline distortion. The
measurement time for the pair of 13C DP-MAS experi-
ments was 24 h.
Financial benefits of feeding biochar
Extensive interviews with the owner of the proper-
ty and other farmers nearby were undertaken to deter-
mine the changes in costs in raising cows using biochar
and molasses mixture, though it was recognized that
this was not a comprehensive economic assessment of
the value of feeding biochar to cattle, but provided a
starting point for a more detailed study.
Statistical analysis
Analysis of ANOVA of the D/G ratios was carried
out using Microsoft Office Excel to determine if there
was a significant difference between biochar samples
both near the mineral phase and on the C phase.
RESULTS
Bulk soil properties
The results of the soil tests carried out indicated
that there was an increase in total organic carbon
(TOC), pH (CaCl2), Colwell P, Colwell K, EC and
all of the exchangeable cations from the 2011 tests to
the 2015 tests (Table I). Properties of the soil samples
from the areas where biochar was extracted are given
in Table II. Soil pH decreased only slightly from 6.2 to
5.8 from the surface (0–5 cm) to a depth of 40 cm, and
soil EC decreased by approximately 50%. Colwell P
and KCl-extractable NH+4 -N in soil increased from 0–5
cm to 20–30 cm and then decreased at 30–40 cm. To-
tal C, K and P, and exchangeable Ca, K, Mg, and Na
in soil decreased by approximately 40%–60% at 20–30
cm.

670 S. JOSEPH et al.
TABLE II
Some physico-chemical properties of the soil samples from areas
where biochar was extracted at three depths
Propertya) 0–5 cm 20–30 cm 30–40 cm
EC (dS m−1) 0.140 0.120 0.075
pH (CaCl2) 6.2 6.1 5.8
Total N (g kg−1) 4.7 2.4 1.1
Total C (g kg−1) 60 36 20
Total P (g kg−1) 1.70 0.97 0.26
Total K (mg kg−1) 160 100 65
Colwell P 160 210 44
NH+4 -N (mg kg−1) 20 28 25
NO−3 -N (mg kg−1) 36.0 7.7 7.0
Al (mg kg−1) 42 43 43
As (mg kg−1) < 5.0 < 5.0 < 5.0
B (mg kg−1) 4.7 4.1 < 4.0
Ca (g kg−1) 3.80 2.00 0.99
Cd (mg kg−1) < 0.3 < 0.3 < 0.3
Co (mg kg−1) 3.6 4.6 5.9
Cr (mg kg−1) 42 49 54
Cu (mg kg−1) 16.0 14.0 7.7
Fe (g kg−1) 42 53 60
K (mg kg−1) 160 100 65
Mg (mg kg−1) 560 370 200
Mn (mg kg−1) 130 130 98
Mo (mg kg−1) 1.6 1.4 1.3
Na (mg kg−1) 60 38 30
Ni (mg kg−1) 5.6 6.0 6.4
Pb (mg kg−1) 6.1 7.4 8.0
S (mg kg−1) 700 480 260
Se (mg kg−1) < 4.0 < 4.0 < 4.0
Zn (mg kg−1) 22.0 15.0 3.7
Exchangeable cation
Al (cmol(+) kg−1) < 0.01 < 0.01 < 0.01
Ca (cmol(+) kg−1) 14.0 7.2 3.6
K (cmol(+) kg−1) 0.200 0.120 0.066
Mg (cmol(+) kg−1) 3.30 2.10 0.95
Na (cmol(+) kg−1) 0.120 0.075 0.054
CEC (cmol(+) kg−1) 18.0 9.4 4.7
Ca/Mg ratio 4.4 3.5 3.8
a)EC = electrical conductivity; NH+4 -N = KCl-extractable NH+
4 -
N; NO−3 -N = KCl-extractable NO−
3 -N; CEC = cation exchange
capacity.
Properties of the fresh biochar
An image of the fresh biochar is given in Fig. 2. The
structure was not typical of high-temperature woody
biochar in that there was little evidence of very small
pores (< 1 µm) within the larger 10–30 µmmacro pores
(Joseph et al., 2010). The surface of these pores ap-
peared to be covered with a layer of amorphous or-
ganic C. The proximate and ultimate analyses of fresh
biochar are given in Table III. The total and fixed C
and ash content were relatively high, which was a func-
tion of the high-temperature and the long residence
time under which the biochar was produced. Howe-
ver, there was a significant concentration of organic
compounds which could have resulted from condensa-
tion of volatiles during the production process. This
would, in part, account for the low surface area of the
biochar and the absence of visible small pores as shown
in Fig. 2.
TABLE III
Proximate and ultimate analyses of the fresh biochar
Parameter Proportion
%
Proximate analysis
Moisture 1.0
Ash 7.8
Volatile matter 16.2
Fixed C 75.0
Ultimate analysis
Total C 82.0
H 2.0
N 0.4
Total S 0.03
O 15.57
The major minerals detected in the fresh biochar
included silica, calcite and quartz. Important metals
and non-metals (excluding Si) identified included 4 000
mg kg−1 Al, 2 500 mg kg−1 Fe, 3 000 mg kg−1 Ca,
1 200 mg kg−1 Na, 3 000 mg kg−1 S, 300 mg kg−1 K,
600 mg kg−1 Mg, 650 mg kg−1 P, and 650 mg kg−1 Zn.
Dempster et al. (2012) measured total C as 851 g kg−1,
total N 6.9 g kg−1, pH (1:5 H2O) 8.41, EC 388 mS
cm−1, cation exchange capacity 9.5 mmol kg−1. The
proportion of aromatic C concentration was 69.1%, ex-
tractable C was 1 653 mg C kg−1, and total pore area
was approximately 8 m2 g−1. These values were low
for high-temperature wood biochars and indicated that
there had been condensation of volatiles on the pores of
the biochar in the kiln. This was in agreement with ob-
servations from the SEM and NMR analyses, described
below.
The NMR spectra (Fig. 3) showed a high concen-
tration of aromatic (aryl) C (77%), but also a signifi-
cant concentration of amorphous C with various oxy-
genated functional groups. This is typical of woody
biochars in which there has been condensation of
volatiles on the inner pores (Joseph et al., 2010). Small
amounts of alkyl, O-alkyl/methoxyl (< 6%), ketone
(2%) and amide/carboxy (3%) groups (Table IV) were
consistent with the results of the XPS analysis below.
Again, this was consistent with high concentration of
condensed organic compounds on the surface of the
pores. It was probable that condensation occurred du-
ring cooling of the biochar in the kiln.
Table V shows the C and N functional groups found
in the fresh biochar from the kiln prior to being fed to
the cows. Although the biochar had been produced at

FEEDING BIOCHAR TO COWS FOR IMPROVING SOIL 671
Fig. 2 Surface image of the jarrah wood biochar (a) and the image of pores (b) in the biochar using the scanning electron microscopy.
Fig. 3 Solid-state 13C nuclear magnetic resonance (NMR) spe-
ctra of fresh jarrah wood biochar. Spinning side bands are found
at 225 and 25 ppm.
TABLE IV
Integration of spectral regions and their chemical assignment
from the solid-state 13C nuclear magnetic resonance (NMR)
spectra describing the C composition of the fresh jarrah wood
biochar
Chemical shift Assignment Percentage of total C
ppm %
0–45 Alkyl < 1
45–60 N-alkyl/methoxyl < 1
60–95 O-alkyl 4.5
95–110 Di-O-alkyl 4.5
110–145 Aryl 77
145–165 O-aryl 8
165–190 Amide/carboxyl 3
190–215 Ketone 2
high-temperatures, there was still a significant concen-
tration of C–O, C=O and COOH groups on the surface
of the fresh biochar, indicating that either some O had
reacted with the surfaces either in the kiln or during
the cooling process, or the surface had organic com-
pounds rich in these functional groups. The concentra-
tions of Al and Si are 12 and 30 g kg−1, respectively,
and are considered high for a wood biochar. Na, Fe
and Mg form a significant component of the mineral
matter on the surface of the biochar (Table VI).
The chemical compounds detected using GC-MS
are presented in Table VII. There was a wide range
of carboxylic acids and alkanes. Benzene, toluene, xy-
lene, naphthalene and diisopropylnaphthalene isomers
(2,6) were also detected in small quantities. Detailed
quantification of these compounds was not carried out,
although they were not considered a risk in high-
temperature biochars (Kookana et al., 2011). Further
testing is needed to determine if any of these aromatic
compounds has accumulated in the tissue of cow.
Properties of the biochar after digestion and incorpo-
ration into the soil
The biochar extracted from the soil samples taken
across the transect to a depth of 10 cm had a total C
content of 640 g kg−1, total N of 14 g kg−1, total P
of 1.1 g kg−1, total K of 0.62 g kg−1, Mg of 0.72 g
kg−1, Ca of 5.3 g kg−1, S of 1.5 g kg−1, pH (CaCl2)
of 6.71, EC of 0.163 mS cm−1, Colwell P of 700 mg
kg−1. Visually, the biochar had a coating of clay and
other mineral matter was reflected in a Fe content of
57 g kg−1 and Al of 42 g kg−1.
Scanning electron microscopy images of the biochar
from fresh dung and from soil samples at 0–5, 20–30
and 30–40 cm are given in Fig. 4a, c, e and g, respec-
tively. It was observed that the biochar extracted from
the fresh dung and from soil sample at 0–5 cm (Figs. 4a
and 4c) had an outer coating of organo-mineral com-

672 S. JOSEPH et al.
TABLE V
Regional scan of C and N functional groups in various biochars using the X-ray photoelectron spectroscopy
Peak Function group Biochara)
Fresh biochar D0 D1 D2 D3
atom%
C1s A C–C/C–H/C=C 64.20 52.29 59.17 50.25 66.35
C1s B C–O 11.43 16.23 15.31 13.96 11.44
C1s C C=O 3.61 6.84 5.31 4.41 2.31
C1s D COOH 2.21 2.75 3.43 4.04 3.61
C1s E Carbonate 1.55 ndb) nd nd nd
N1s A Amino acid N/N–C=O 0.48 3.76 1.77 0.86 0.65
N1s B NH4/NH2 0 0.70 0.14 0.10 nd
N1s C Pyridine/N–O 0 0.50 0.09 nd nd
a)D0 = biochar extracted from freshly deposited cow dung; D1, D2 and D3 = biochar extracted from soil samples at 0–5, 20–30 and
30–40 cm, respectively.b)Not detectable.
TABLE VI
Regional scan of elements in various biochars using the X-ray photoelectron spectroscopy
Name Biochara)
Fresh biochar D0 D1 D2 D3
atom %
C1s 78.85 76.63 81.63 68.52 80.05
O1s 15.41 16.90 14.11 23.63 15.36
N1s 0.75 4.54 2.04 1.08 0.70
Na1s 0.35 0.33 0.25 0.21 1.10
Mg1s 0.20 0.62 0.34 0.5 0.22
P2p ndb) nd 0.19 nd nd
Ca2p nd nd 0.40 nd nd
Fe2p 0.19 0.63 0.11 0.15 0.27
Cl2p 0.08 0.13 0.21 0.23 1.06
Si2p 2.96 0.02 1.02 2.30 1.23
Al2p 1.21 0.20 0.29 3.38 nd
a)D0 = biochar extracted from freshly deposited cow dung; D1, D2 and D3 = biochar extracted from soil samples at 0–5, 20–30 and
30–40 cm, respectively.b)Not detectable.
TABLE VII
Some labile organic compounds extracted from the jarrah wood biochar detected by the gas chromatography-mass spectrometry
Species Compounds
Carboxylic acid Dodecanoic acid, tetradecanoic acid, hexadecanoic acid, heptadecanoic acid, cis-9-octadecenoic acid,
trans-9-octadecenoic acid, octadecanoic acid, eicosanoic acid, docosenoic acid (isomer), docosanoic
acid, tetracosanoic acid
Alkanes Dodecane, tridecane, tetradecane, pentadecane, hexadecane, heptadecane, octadecane, nonadecane,
eicosane
Aromatic hydrocarbon Toluene, xylenes, 1,2,3-trimethyl benzene, naphthalene, diisopropylnaphthalene isomers (2,6)
Other 4-hydroxy-3,5-dimethoxy-denzaldehyde, dibutyl phthalate
plex which had a high concentration of nutrients (P,
K, N, Mg, Ca) and minerals rich in Al, Si and Fe. At
lower depths there was a much lower concentration of
nutrients and a visible coating rich in Al, Si and Fe
(probably clay, SiO2, Fe oxides, alumina). These ob-
servations were similar to those reported by Joseph et
al. (2010) and Lin et al. (2012b).
The TEM and STEM images of minerals on the
surface of the biochar extracted from soil sample at
0–5 cm are shown in Fig. 5a and d, respectively. The
biochar surface had mineral phase particles of 2–10 nm
in diameter and a range of irregular pores were present
with sizes ranging from 2 to 100 nm. The EDS (data
not shown), SAED (Fig. 5b) and EELS analyses (Fig.

FEEDING BIOCHAR TO COWS FOR IMPROVING SOIL 673
Fig. 4 Scanning electron microscopy images of the biochar extracted from the freshly deposited cow dung (a) and from soil samples
at 0–5 cm (c), 20–30 cm (e) and 30–40 cm (g); and the corresponding energy dispersive X-ray spectrometer spectra (b, d, f and h)
showing the major elements on the surface of the biochar.
5c) indicated that the minerals on the surface of the
biochar were mainly SiO2, Al2O3, and Fe3O4. Within
the C lattice and the minerals there was a low con-
centration of P, Cl, K, Ca, S, Cl. Similar structures
were seen in samples taken from the 20–30 and 30–40
cm layers, although there was a higher concentration
of Al/Si/Fe nano-particles in the latter sample (data
not shown).
Fig. 6 and Table VIII show the results of the quan-
titative analysis of the 13C spectra in the biochar ex-
tracted from the top 10 cm of soil along a transect.
The biochar still had a high concentration of non-
protonated C (57% of the total C in the extracted
biochar), indicating a high degree of aromatic conden-
sation. Total aromatic C (excluding the phenolic com-
pounds) in this aged biochar was measured at 69%

674 S. JOSEPH et al.
Fig. 5 (a) Transmission electron microscopy (TEM) image of the minerals on the surface of the biochar extracted from soil sample
at 0–5 cm; (b) selected area electron diffraction (SAED) pattern from the circle area in (a); (c) Fe electron energy loss spectrometer
(EELS) spectra from the circle area in (a); (d) scanning transmission electron microscopy (STEM) image highlighting the presence of
minerals (bright, EDS1) and pores (dark, EDS2) in the biochar.
Fig. 6 Quantitative 13C direct polarization magic angle spin-
ning (DP/MAS) nuclear magnetic resonance (NMR) spectra of
the biochar extracted from the top 10 cm of soil along a tran-
sect. The spinning side bands are found at approximately 295
and −35 ppm. The dotted line is a base line.
which was similar to that measured for the fresh
biochar. Additionally, there was a high concentration
of phenolic (9%), ketonic (5%) and carboxylic (6%)
groups. This would indicate that the adsorption of or-
ganic matter with a high concentration of C functio-
nal groups had occurred, along with oxidation of the
C. This has been recorded in biochars extracted from
similar soil (Joseph et al., 2010).
The XPS results indicated that, as a function of
depth, there were differences in the surface C and
N functional groups and in the type and concentration
of minerals present within the extracted aged biochars
(Tables V and VI). The biochar extracted from the
dung had a higher organic C concentration, being rich
in alcoholic, phenolic, hydroxyl, and/or other groups,

FEEDING BIOCHAR TO COWS FOR IMPROVING SOIL 675
TABLE VIII
Integration of spectral regions and their chemical assignment
from the 13C nuclear magnetic resonance (NMR) spectra de-
scribing the C composition of the biochar extracted from the
top 10 cm of soil along a transect
Chemical shift Assignmenta) Percentage of total C
ppm %
201–183 C=O 4
183–165 COO 5
165–145 Car-O75H0.5 9
145–90 Car-nonprot 57
145–90 Car-H 12
90–50 HCO0.75H0.5 9
50–25 CH1.5 3
25–6 CH3 2
a)Car-O75H0.5 = phenolic C; Car-nonprot = non-protonated aro-
matic C; Car-H = protonated aromatic C.
C=O and COOH groups compared with the fresh bio-
char taken directly from the kiln. The concentration
of COOH groups increased as the biochar aged with
a maximum concentration at the depth of 20–30 cm.
This was consistent with the findings of other au-
thors (Cheng et al., 2006). Three distinct classes of
N functional groups (NH4/NH2, amino acid/N–C=O,
pyridine/N–O) were detected in the biochar after pas-
sing through the animal gut and being buried to a
depth of 30 cm. The amino acid/N–C=O functional
groups were at higher concentrations compared with
the fresh biochar.
Ca and P were detected on the surface of biochar
particles at a depth of 0–5 cm but not with the ot-
her samples. This was consistent with the results of
the soil/biochar analysis given in Tables II and III and
the EDS spectrum given in Fig. 4. The O and Al/Si
concentrations in the biochar reached a maximum at
a depth of 20–30 cm, indicating that maximum reac-
tivity occurred with the Fe/Al/Si-bearing minerals as
the pH and the O concentration in the soils decreased
and the biochar had been incorporated for a signifi-
cant period. These data were consistent with the re-
sults reported by Joseph et al. (2010) and Lin et al.
(2012b) where the mineral formation on the surface of
the biochar reached a maximum following 1–2 years of
incorporation into the soil. They have postulated that
it is the formation of these highly porous, redox-active
organo-mineral complexes on the surface of the biochar
which drives the increased availability of nutrients and
changes in other soil properties over a long period of
time.
The Raman spectra were modeled using two Gaus-
sian functions located at positions characteristic of the
D- and G-bands. These measure the degree of structure
of trigonal sp2 hybridised C in aromatic sheet struc-
tures formed in biochar. Increased D/G ratio indica-
ted more defects in the flat layers of sp2 hybridised C,
which maked up the graphene-like phase in biochar.
The average D/G ratio for the fresh biochar was found
to be 2.22 with a range of 1.83 to 2.38 (D-band 1 380
cm−1, G-band 1 589 cm−1) compared to 2.0 for the
biochar extracted from the fresh dung. The D/G ratio
of the biochar extracted from the soil sample varied
from an average of 1.96 to 2.29 with the ANOVA re-
sult indicating no significant differences between these
values (P = 0.1197, Table IX). These results indicated
that there was very little or no change in the nature of
the C lattice.
TABLE IX
Detailed analysis of variance (ANOVA) of the Raman spectral
data of various biochars
Source of Sum of dfa) Mean F -value P -value
variation squares square
Between groups 0.5930 4 0.1482 1.9456 0.1197
Within groups 3.3527 44 0.0762
Total 3.9458 48
a)Degree of freedom.
Similarities between FTIR spectra enabled the
biochars to divided into two groups: D0 (from fresh
dung), D1 (0–5 cm) and D2 (20–30 cm) biochars; D3
biochar (30–40 cm) and the fresh biochar (Fig. 7). The
biochar from fresh dung had more intense peaks for
aliphatic O–H and O–H stretching in alcohols and phe-
nols as well as a C–H deformation indicating lignins
compared with that from 0–5 and 20–30 cm. There was
only a very low intensity of these vibrational modes
in the biochar from 30–40 cm and none in the fresh
biochar. The presence of aromatic C=C was seen in all
Fig. 7 Fourier transform infrared spectroscopy spectra of fresh
jarrah wood biochar and the biochar extracted from freshly de-
posited cow dung (D0) and from soil samples at three depths of
0–5 (D1), 20–30 (D2), and 30–40 cm (D3).

676 S. JOSEPH et al.
the four biochars between 1 690 and 1 610 cm−1 with
the highest intensities in D0–D2 biochars. It should be
noted that the N–H bend peak also occurred at these
wavenumbers. The peaks at approximately 1 775–1 710
cm−1 originated from C=O functional groups and
were only significant for D0–D2. Except for the fresh
biochar, the D0–D3 biochars had a relatively high in-
tensity at 1 101–1 160 cm−1 which represented C–O
stretching in acids, phenols, ethers or esters and at
1 035–990 cm−1 in Si–O–Si. The D0–D2 biochars had
a relatively high intensity of peaks associated with
amines (3 500–3 300, 1 640–1 500 and 1 025–1 200 cm−1,
respectively).
An initial assessment of financial benefits of feeding
biochar
The following is an initial financial assessment of
the relative yearly costs of raising 60 cows involving
the use of application of chemical fertilisers to pas-
tures, hay supplements and chemical drenching. Cos-
tings were carried out for 3 different options for provi-
sion of hay. In the first conventional practice (CP1)
the farmer buys in hay; the second one (CP2) the
farmer grows hay and pays a contractor to harvest the
hay, and in the third one (CP3) the farmer grows and
harvests the hay himself. These conventional methods
were compared with the practice of feeding biochar and
molasses to cows (biochar practice).
Conventional practice sees calving in January–Fe-
bruary with calves being sold in November–December.
In biochar practice calving occurs in July–August.
Half of the calves are sold in the following June and
another half in December. This practice was develo-
ped to adapt to the changing weather patterns. The
farmer made the following observation: “It is now much
warmer all year, the winters are wet but not nearly as
wet (as in previous years) and the summers are much
hotter and very dry. Summer is now the stress season
for cattle. Pasture growth is excellent through winter,
more sun, warmer days and nights, and not so wa-
terlogged. The perennial grasses are dying out on the
hills as the summers are too hot and dry for so long
months. Thus, I have changed mating to ensure that
calving occurs when at a time of year that makes the
peak nutritional demand on the cow coincident with
maximum feed availability. I believe that selling two
times a year to two markets is a hedge against market
fluctuations actually”
This change in strategy resulted in slightly lower
income but more certainty of long-term viability of the
farm. The following assumptions have been considered
to develop Table X: i) number of cow/calf breeding
units are the same per area (60 cows per 40 ha), ii)
pasture is the same mix of perennial and annual gras-
ses, iii) topography is the same proportion of summer
dry hills and summer moist flats, iv) soil types are
the same mix of heavy Vertisol clay flats, medium red
to brown Chromosols, lighter red to brown Kandosols
and some lateritic gravel, v) paddock sizes and wa-
ter requirements are the same, vi) rotational grazing is
similarly practiced, vii) animal breed and ages are the
same, viii) value of all cow herds is equal, ix) for CP,
60 calves are seld at $900 with total value $54 000, and
x) for biochar practice, 30 calves are seld at $750 and
30 calves at $900 with total value $49 500. This simple
analysis indicates that the profitability may be higher
for biochar practice compared with CP.
TABLE X
Cost of feeding 60 cows year−1 using conventional practice (CP)
compared with biochar practice.
Item CP1 CP2 CP3 Biochar
practice
Fertiliser $5 210 $5 210 $6 630 0
Drench $600 $600 $600 0
Insect spray $500 $500 $500 0
Hay $15 600 $13 200 $7 000 0
Maintenance/depreciation 0 0 $3 000 0
Biochar/molasses 0 0 0 $1 000
Total cost $21 910 $19 510 $17 730 $1 000
Income $54 000 $54 000 $54 000 $49 500
Income − cost $32 090 $34 490 $36 270 $48 500
DISCUSSION
Using activated C, charcoal, humic acids and wood
vinegar as both a feed supplement and for medicinal
purposes has proven effective in a number of studies
(Neuvonen and Olkkola, 1988; Van et al., 2006, Ger-
lach et al., 2014). Jarrah wood biochar, before it enters
into the stomach, has both a relatively high concen-
tration of oxygenated functional groups and a small
concentration of organic molecules. These have chara-
cteristics of humic acids, biopolymers, low molecular
weight acids and neutrals (Lin et al., 2012a) and a
small amount of benzene, toluene, xylene and naph-
thalene. Jarrah wood biochar had a range of organic
molecules similar to some of those found in wood vine-
gar. Its pH is similar to the saliva that is in the mouth
of the cow and thus may have the same buffering ca-
pability (Church, 1987).
Once the biochar enters to the stomach it is in-
volved in both biotic and abiotic chemical reactions in
both acidic and alkaline environments. The research of
Lin et al. (2012a) indicates that the concentration of
O and N functional groups will change and the biochar
FEEDING BIOCHAR TO COWS FOR IMPROVING SOIL 677
will probably release a much larger quantity of labile
organic molecules, some of which have characteristics
of humic acids and others that are low molecular acids
and neutrals. The release of these molecules can act
as a biocide (Watarai et al., 2008). There will also be
a release of minerals from the biochar which may be
beneficial for the growth of the cow. Once these fer-
mentation and acid base reactions have taken place
(as indicated by the XPS results of the biochar extra-
cted from the fresh dung) the reactivity of the surfaces
of the biochar will probably increase (Joseph et al.,
2013). These functional groups could play an active
role in adsorbing toxins and possibly in the transfor-
mation of organic matter to carbohydrates, sugars and
proteins in the rumen of the cow, as has been alluded to
in the literatures (Van et al., 2006; Villalba et al., 2002;
Watarai et al., 2008). The activated biochar could also
adsorb signaling compounds as noted by Masiello et
al. (2013) which exist in the rumen and change gene
expression and microbial population, although the evi-
dence for this is not conclusive (Ermolaeva et al., 1997,
1999, 2004). The complex role of biochar in disease sup-
pression in cows needs much more in-depth study.
The chemical and spectral analysis and imaging of
the biochar that were extracted from the fresh dung
clearly showed that the biochar adsorbed a range of
nutrients in the rumen. These nutrients (especially P
and N) were retained in the biochar when incorpo-
rated into soils to a depth of at least 10 cm and are
plant available. Given the fact that the farmer does
not need to apply fertilizer, the biochar is probably a
major factor in nutrient availability. The high N con-
centration of the biochar that has been incorporated
in the dung was consistent with the concentrations of
N found in biochar extracted from compost (Clough et
al., 2013). The N decreased once the biochar was incor-
porated into the soil and could indicate utilization by
the pasture plants and soil microbes. The measurement
of the NH4/NH2 and pyridine/N–O groups indicates
that N compounds have been adsorbed into the C lat-
tice or are part of organo-mineral complexes that have
formed as biochar ages in the soil (Joseph et al., 2010
and 2013)
Nanoscale examination of the biochars in the top
20 cm of soil indicated that there was a relatively high
concentration of Fe oxide nano-particles. The SAED
pattern indicated that these nano-particles are a mix-
ture of magnetite and hematite. Fe nano-particles can
play an important role in many biotic and abiotic pro-
cesses especially in environments where Eh can change.
Amonette et al. (2006) noted that tyrosinase, a phe-
nol oxidase enzyme that assists in the breakdown of
organic matter, has been suggested to be promoted in
the presence of highly microporous charcoal and nano-
particulate Fe oxides. Li et al. (2012) noted that Fe
oxide particles can be involved in a complex series of
redox reactions involving the breakdown of humic sub-
stances and the conversion of N in organic matter to
either NO−3 or NH+
4 ions and the breakdown of P con-
taining organic compounds to available P. This could
be a factor in the increase in available P and N in the
soil. Significantly more research is required to deter-
mine if the Fe nano-particles are catalyzing these types
of reactions.
It would appear that there has been very little
change in the recalcitrant C structure of the biochar
as a result of digestion in the rumen and after interac-
tion with dung beetles and movement through the soil
profile. This would be expected as the high pyroly-
sis temperature and the long residence time in the
kiln has produced a high concentration of condensed
aromatic rings which are recalcitrant (Singh et al.,
2012). Following incorporation into the soil, at lower
depths biochar has reacted with soil organic and mine-
ral matter to form a coating of organic mineral com-
plexes. This may increase the stability and the lifetime
of the C. Further detailed investigation of the stability
of these particles need to be undertaken using incuba-
tion trials as per the techniques described by Singh et
al. (2012).
CONCLUSIONS
Feeding cows a mixture of high-temperature wood
biochar and molasses has had the potential to reduce
costs for the farmer, to improve soil properties, and
to improve pasture health. Dung beetles moved the
dung and biochar through the soil horizon to increase
stable C and to enhance soil fertility. The C lattice
of biochar appeared to undergo minimal changes as it
passed through the gut of the animal. The biochar-
dung composite had a high N concentration and there
was an increase in C–O and C–OOH functional groups.
Once in the soil the biochar started to age through in-
teraction with soil organic and mineral matter. Avai-
lable P and N concentrations of the soil around the
biochar increased due to a series of complex reactions.
These changes could occur over a range of depths as
biochar was taken through the soil profile quickly by
dung beetles.
Aside from the scientific merits of this approach,
a basic financial assessment suggested that there may
have economic benefits as well. This study provided
very positive and initial evidence that biochar practice

678 S. JOSEPH et al.
could be commercialized very quickly. More detailed
research needs to be undertaken to evaluate a range of
soil types, using different biochar types, biochar/mo-
lasses ratios, and dosage rates and dung beetles species.
There is a need to analyse accurately costs and benefits
to the farmer and also the feasibility of this method for
long-term sequestration of C into soils. Further tests
need to be carried out to determine if there are any
residual toxins, such as polycyclic aromatic hydrocar-
bons or dioxins, which have accumulated in the meat
of the cattle.
ACKNOWLEDGEMENTS
The NMR analysis of the fresh biochar was carried
out by Dr. Lynn McDonald of CSIRO Land and Water,
Australia. We acknowledge the help of the Electron Mi-
croscope and X-ray Unit of University of Newcastle of
Australia, Dr. Bill Gong from XPS Unit of Australia
and the Electron Microscope Unit at the University
of New South Wales, Australia. This research used
the JEOL ARM200F microscope at UoW Electron Mi-
croscopy Centre, University of Wollongong, Australia,
funded by the Linkage, Infrastructure, Equipment and
Facilities (LIEF) grant from the Australian Research
Council (ARC) (No. LE120100104). This work was al-
so supported by the ARC (No. LP120200418), Rene-
wed Carbon Pty Ltd. of Australia and the Depart-
ment of Agriculture, Australian Government’s Carbon
Farming Futures Filling the Research Gap (No.RG-
134978).
REFERENCES
Amonette J, Kim J, Russell C, Hendricks M, Bashore C, Rieck B.
2006. Soil charcoal—a potential humification catalyst. ASA-
CSSA-SSSA International Annual Meetings, Indianapolis,
USA. November 12–16, 2006.
Baldock J A, Smernik R J. 2002. Chemical composition and
bioavailability of thermally altered Pinus resinosa (red pine)
wood. Org Geochem. 33: 1093–1109.
Blackwell P, Riethmuller G, Collins M. 2009. Biochar applica-
tion to soil. In Lehmann J, Joseph S (eds.) Biochar for En-
vironmental Management: Science and Technology. Earth-
scan, London. pp. 207–226.
Brewer C E, Schmidt-Rohr K, Satrio J A, Brown R C. 2009.
Characterization of biochar from fast pyrolysis and gasifica-
tion systems. Environ Prog Sust Energ. 28: 386–396.
Calvelo Pereira R, Muetzel S, Camps Arbestain M, Bishop P, Hi-
na K, Hedley M. 2014. Assessment of the influence of biochar
on rumen and silage fermentation: A laboratory-scale experi-
ment. Anim Feed Sci Tech. 196: 22–31.
Cheng C H, Lehmann J, Thies J E, Burton S D, Engelhard
M H. 2006. Oxidation of black carbon by biotic and abiotic
processes. Org Geochem. 37: 1477–1488.
Chia C H, Marjo C E, Gong B, Joseph S D, Munroe P, Rich
A M. 2012. Imaging of mineral-enriched biochar by FTIR,
Raman and SEM-EDX. Vib Spectrosc. 62: 248–257.
Chia C H, Singh B P, Joseph S, Graber E R, Munroe P. 2014.
Characterization of an enriched biochar. J Anal Appl Pyrol.
108: 26–34.
Church D C. 1987. The Ruminant Animal: Digestive Physiology
and Nutrition. Prentice Hall, Englewood Cliffs.
Clough T J, Condron L M, Kammann C, Muller C. 2013. A
review of biochar and soil nitrogen dynamics. Agronomy. 3:
275–293.
Dairy Australia. 2015. Hay and grain market report. Available
online at http://www.dairyaustralia.com.au/Pastures-and-
Feeding/Supplements-and-nutrition/Supplementary-feeds - 2
/National–Hay-Grain-Market-Report/South-West-WA.aspx
(verified on July 22, 2015)
Dempster D N, Jones D L, Murphy D V. 2012. Clay and biochar
amendments decreased inorganic but not dissolved organic
nitrogen leaching in soil. Aust J Soil Res. 50: 216–221.
Doube B, Dalton G, Ford R. 2003. The potential of dung beetles
to improve the quality of catchment water in Australia. The
First National Conference on Integrated Catchment Manage-
ment, held at the University of Western Sydney, Parramatta.
November 26–27, 2003.
Downie A E, Van Zwieten L, Smernik R J, Morris S, Munroe P
R. 2011. Terra Preta Australis: reassessing the carbon stora-
ge capacity of temperate soils. Agr Ecosyst Environ. 140:
137–147.
Ermolaeva S, Belyi Y, Tartakovskii I. 1999. Characteristics of
induction of virulence factor expression by activated char-
coal in Listeria monocytogenes. FEMS Microbiol Lett. 174:
137–141.
Ermolaeva S, Novella S, Vega Y, Ripio M T, Scortti M, Vazquez-
Boland J A. 2004. Negative control of Listeria monocyto-
genes virulence genes by a diffusible autorepressor. Mol Mi-
crobiol. 52: 601–611.
Ermolaeva S, Varfolomeeva N, Belyi Y, Tartakovskii I. 1997.
Isolation and characterization of a Listeria monocytogenes
mutant strain hyperproducing virulence factors. FEMS Mi-
crobiol Lett. 150: 189–195.
Fincher G T. 1981. The potential value of dung beetles in pas-
ture ecosystems. J Georgia Entomol So. 16: 316–333.
Gerlach H, Gerlach A, Schrodl W, Schottdorf B, Haufe S, Helm
H, Shehata A, Kruger M. 2014. Oral application of charcoal
and humic acids to dairy cows influences Clostridium bo-
tulinum blood serum antibody level and glyphosate excre-
tion in urine. J Clin Toxicol. 4: 186, doi: 10.4172/2161-0495.
1000186.
Hale S, Hanley K, Lehmann J, Zimmerman A R, Cornelissen G.
2011. Effects of chemical, biological, and physical aging as
well as soil addition on the sorption of pyrene to activated
carbon and biochar. Environ Sci Technol. 45: 10445–10453.
Haynes R J, Naidu R. 1998. Influence of lime, fertilizer and
manure applications to soil organic matter content and soil
physical conditions: A review. Nutr Cycl Agroecosys. 51:
123–137.
Joseph S D, Camps-Arbestain M, Lin Y, Munroe P, Chia C
H, Hook J, van Zwieten L, Kimber S, Cowie A, Singh B P,
Lehmann J, Foidl N, Smernik R J, Amonette J E. 2010. An
investigation into the reactions of biochar in soil. Aust J Soil
Res. 48: 501–515.
Joseph S D, Graber E R, Chia C, Munroe P, Donne S, Thomas
T, Nielsen S, Marjo C, Rutlidge H, Pan G X, Li L, Taylor P,
Rawal A, Hook J. 2013. Shifting paradigms: Development
of high-efficiency biochar fertilizers based on nano-structures
and soluble components. Carbon Manage. 4: 323–343.

FEEDING BIOCHAR TO COWS FOR IMPROVING SOIL 679
Kookana R S, Sarmah A K, Van Zwieten L, Krull E, Singh B.
2011. Biochar application to soil: agronomic and environmen-
tal benefits and unintended consequences. Adv Agron. 112:
103–144.
Li Y C, Yu S, Strong J, Wang H L. 2012. Are the biogeochemical
cycles of carbon, nitrogen, sulfur, and phosphorus driven by
the “FeIII-FeII redox wheel” in dynamic redox environments?
J Soils Sediment. 12: 683–693.
Lin Y, Munroe P, Joseph S, Henderson R, Ziolkowski A. 2012a.
Water extractable organic carbon in untreated and chemical
treated biochars. Chemosphere. 87: 151–157.
Lin Y, Munroe P, Joseph S, Kimber S, Van Zwieten L. 2012b.
Nanoscale organo-mineral reactions of biochars in a ferrosol:
an investigation using microscopy. Plant Soil. 357: 369–380.
Masiello C A, Chen Y, Gao X, Liu S, Cheng H Y, Bennett
M R, Rudgers J A,Wagner D S, Zygourakis K, Silberg J
J. 2013. Biochar and microbial signaling: production condi-
tions determine effects on microbial communication. Environ
Sci Technol. 47: 11496–11503.
McHenry M P. 2010. Carbon-based stock feed additives: A re-
search methodology that explores ecologically delivered C
biosequestration, alongside live weights, feed use efficiency,
soil nutrient retention, and perennial fodder plantations. J
Sci Food Agr. 90: 183–187.
Neuvonen P J, Olkkola K T. 1988. Oral activated charcoal in
the treatment of intoxications. Role of single and repeated
doses. Med Toxicol Adv Drug. 3: 33–58.
Singh B P, Cowie A L, Smernik R J. 2012. Biochar carbon sta-
bility in a clayey soil as a function of feedstock and pyrolysis
temperature. Environ Sci Technol. 46: 11770–11778.
Van D T T, Mui N T, Ledin I. 2006. Effect of method of pro-
cessing foliage of Acacia mangium and inclusion of bamboo
charcoal in the diet on performance of growing goats. Anim
Feed Sci Tech. 130: 242–256.
Van Zwieten L, Kimber S, Morris S, Chan K Y, Downie A, Rust
J, Joseph S, Cowie A. 2010. Effects of biochar from slow py-
rolysis of papermill waste on agronomic performance and soil
fertility. Plant Soil. 327: 235–246.
Villalba J J, Provenza F D, Banner R E. 2002. Influence of
macronutrients and activated charcoal on intake of sagebrush
by sheep and goats. J Anim Sci. 80: 2099–2109.
Watarai S, Tana, Koiwa M, 2008. Feeding activated charcoal
from bark containing wood vinegar liquid (Nekka-Rich) is
effective as treatment for cryptosporidiosis in calves. J Dairy
Sci. 91: 1458–1463.