feed the future innovation lab for food security … › fsp › publications ›...
TRANSCRIPT

Feed the Future Innovation Lab for Food Security Policy Research Paper 110 September 2018
MECHANIZATION OUTSOURCING SERVICES IN MYANMAR’S DRY ZONE
By
Ben Belton, Peixun Fang, and Thomas Reardon

ii
Food Security Policy Research Papers This Research Paper series is designed to timely disseminate research and policy analytical outputs generated by the USAID funded Feed the Future Innovation Lab for Food Security Policy (FSP) and its Associate Awards. The FSP project is managed by the Food Security Group (FSG) of the Department of Agricultural, Food, and Resource Economics (AFRE) at Michigan State University (MSU), and implemented in partnership with the International Food Policy Research Institute (IFPRI) and the University of Pretoria (UP). Together, the MSU-IFPRI-UP consortium works with governments, researchers and private sector stakeholders in Feed the Future focus countries in Africa and Asia to increase agricultural productivity, improve dietary diversity and build greater resilience to challenges like climate change that affect livelihoods. The papers are aimed at researchers, policy makers, donor agencies, educators, and international development practitioners. Selected papers will be translated into French, Portuguese, or other languages. Copies of all FSP Research Papers and Policy Briefs are freely downloadable in pdf format from the following Web site: http://www.canr.msu.edu/fsp/publications/ Copies of all FSP papers and briefs are also submitted to the USAID Development Experience Clearing House (DEC) at: http://dec.usaid.gov/

iii
AUTHORS
Ben Belton is Assistant Professor, International Development in the Department of Agricultural, Food, and Resource Economics, Michigan State University, Peixun Fang is Research Analyst at International Food Policy Research Institute (IFPRI), and Thomas Reardon is Professor, Agricultural, Food, and Resource Economics, Michigan State University.
Authors’ Acknowledgment: This research is made possible by the generous support of the American people through the United States Agency for International Development (USAID) under the Feed the Future initiative. FSP grant number AID-482-LA-14-0003. The contents are the responsibility of study authors and do not necessarily reflect the views of USAID or the United States Government. This study is also supported with financial assistance from the Livelihoods and Food Security Trust Fund (LIFT), supported by Australia, Denmark, the European Union, France, Ireland, Italy, Luxembourg, The Netherlands, New Zealand, Sweden, Switzerland, the United Kingdom, the United States of America, and the Mitsubishi Corporation. We thank these donors for their kind contributions to improving the livelihoods and food security of rural people in Myanmar. We also thank Patricia Johannes for formatting assistance. The views expressed herein should in no way be taken to reflect the official opinion of any of the LIFT donors.
This study is made possible by the generous support of the American people through the United States Agency for International Development (USAID) under the Feed the Future initiative. The contents are the responsibility of the study authors and do not necessarily reflect the views of USAID or the United States Government Copyright © 2018, Michigan State University and International Food Policy Research Institute. All rights reserved. This material may be reproduced for personal and not-for-profit use without permission from but with acknowledgment to MSU and International Food Policy Research Institute. Published by the Department of Agricultural, Food, and Resource Economics, Michigan State University, Justin S. Morrill Hall of Agriculture, 446 West Circle Dr., Room 202, East Lansing, Michigan 48824, USA.

iv
EXECUTIVE SUMMARY Outsourcing enterprises that rent out agricultural machinery with operators to farm households have been vital to facilitating rapid agricultural mechanization in Myanmar over the past five years. This report presents results from the first ever study of agricultural machinery outsourcers in Myanmar. One hundred and twenty two outsourcing enterprises were surveyed in 12 Dry Zone townships in December 2017. These included 79 enterprises providing four-wheel tractor (4WT) outsourcing services, 32 providing combine harvester (CH) services, and 11 offering both CH and 4WT services. The following results stand out: Outsourcing of CH and 4WT services is a recent phenomenon, and has expanded extremely rapidly: 88% of 4WT and 94% of CH owned by surveyed outsourcers were purchased during or after 2014. However, purchases of both 4WT and CH slowed in 2017, suggesting that market maturation is beginning. The total area harvested by CH outsourcing enterprises grew 1240% from 2013 to 2017, while that serviced by 4WT outsourcers grew 900%. The average area of land harvested by each CH outsourcing enterprise annually grew from 101 ha in 2013 to 114 ha in 2015, shrinking thereafter as greater competition emerged, to reach 86 ha in 2017. The average area of land worked by 4WT outsourcers was stable from at around 150 ha from 2014 onwards. Agricultural machinery outsourcing enterprises are small businesses. The vast majority own a single machine and are also farmers. Their farms are toward the upper end of the farm size distribution, but they are not large landowners or companies. Agricultural machines were purchased mainly from private machinery supply businesses. This was the case for all CH, and three-quarters of 4WT, despite government efforts to promote tractor sales through the Department of Cooperatives. Machine purchases have been facilitated by access to formal finance. Two-thirds (64%) of CH and just over half (54%) of 4WT were purchased using financing from a bank or machinery dealership. Purchases of 4WT made using credit obtained from government sources accounted for 19% of sales. The introduction of transferrable land use rights (Form 7) has facilitated access to formal finance. Form 7 was used to guarantee almost all machinery loans provided by banks. Provision of outsourcing services is highly profitable. Most of the capital costs of CH outsourcing enterprises can be recovered within two years. Repayment periods are slightly longer for 4WT outsourcing enterprises, but almost all 4WT outsourcers were able to repay loans in full on time. Very few owners or operators of CH or 4WT received formal training on how to use them. Among individuals who had received training, nearly all were trained by machinery supply businesses. Fees charged by outsourcers have remained stable or become cheaper in real terms, indicating the existence of competitive markets.

v
CH enterprises initially served local markets but have expanded their geographical coverage over time, from a ‘core’ of irrigated paddy cultivating areas around Shwebo to other areas of the Dry Zone, the Delta and Bago. Provision of 4WT outsourcing services is much more localized than CH outsourcing. New specialized economic actors and markets for services have emerged extremely quickly in response to opportunities created by the growth of agricultural machinery outsourcing in the areas of: (1) 3rd party transport services; (2) brokers organizing groups of clients; (3) skilled machine operators. Transport logistics from 3rd party providers have lowered entry barriers into CH outsourcing by removing the need to own or operate vehicles used to transport CH. This makes it possible for CH outsourcers to offer services in distant locations without having to visit them in person Brokers acting as intermediaries between prospective service users and CH outsourcing enterprises have largely replaced self-organized groups, conferring advantages to both CH outsourcing enterprises and their customers. CH outsourcers have replaced their own labor with that of hired machine operators, freeing up their own time to engage in activities such as farming or non-farm business.

vi
CONTENTS EXECUTIVE SUMMARY ................................................................................................................................ iv LIST OF TABLES.............................................................................................................................................. vii LIST OF FIGURES ........................................................................................................................................... vii ACRONYMS ....................................................................................................................................................... vii 1. INTRODUCTION .......................................................................................................................................... 1 2. METHODOLOGY ......................................................................................................................................... 2 3. RESULTS .......................................................................................................................................................... 3
3.1. Outsourcing Enterprise Characteristics................................................................................................. 3 3.2. Location ..................................................................................................................................................... 3 3.3 Asset Ownership and Accumulation ...................................................................................................... 3 3.4. Equipment Specifications ........................................................................................................................ 5 3.5. Financing for Machinery Purchases ....................................................................................................... 6 3.6. Training Received ..................................................................................................................................... 7 3.7. Mode of Service Provision ...................................................................................................................... 7 3.8. Seasonality of Service Provision ............................................................................................................. 9 3.9. Location and Area of Service Provision ................................................................................................ 9 3.10. Outsourcing of Logistics and Labor by CH Outsourcing Enterprises ......................................... 12 3.10.1. Transport Services ................................................................................................................... 12 3.10.2. Customer Organization .......................................................................................................... 12 3.10.3. Labor ......................................................................................................................................... 14
4. CONCLUSIONS............................................................................................................................................ 16 REFERENCES ................................................................................................................................................... 17

vii
LIST OF TABLES
TABLE PAGE
1. Number of Four-Wheel Tractors and Combine Harvesters Purchased by Surveyed Outsourcing Enterprises, by Year ........................................................................................................................................ 12
2. Average Size of Machines Purchased by Year (hp) ..................................................................................... 13 3. Share of 4WT Enterprises Offering Services, 2013-2017 ........................................................................... 15 4. Real Price Per Hectare of CH and 4WT Services, 2013-2017 .................................................................... 15 5. Total Area (Ha) Harvested by Surveyed CH Outsourcing Enterprises, by Zone and Year .................. 17 6. Zones Serviced by Combine Harvester Outsourcing Enterprises, by Year (% of Enterprises) ........... 18 7. Number of Surveyed Outsourcing Enterprises Providing 4WT Services, by Location of Service
Provision and Year .......................................................................................................................................... 18 8. Ownership and Operation of Vehicles Used to Transport CH (%) ......................................................... 19 9. Organization of CH Outsourcing Enterprise Customers, 2013-2017 (%) ............................................... 20 10. Mode Organization of CH Outsourcing Service User Groups, 2015-2017 (%) ................................... 20 11. Organization of CH Outsourcing Enterprise Customers, 2013-2017 (%)............................................. 21 12. Source of Labor Employed by CH Outsourcing Enterprises, by Year (%)........................................... 22
LIST OF FIGUES FIGURE PAGE
1. Locations of Surveyed Outsourcing Enterprises, by Type ......................................................................... 11 2. Number of CH Outsourcing Enterprises Providing Services by Region of Service Provided and
Year .................................................................................................................................................................... 17
ACRONYMS AND ABBREVIATIONS
4WT Four-wheel tractor AMD Agricultural Mechanization Department CH Combine harvester MMK Myanmar Kyat READZ Rural Economy and Agriculture Dry Zone

8
1. INTRODUCTION Agriculture in Myanmar has mechanized rapidly over the past five years. On the supply side, mechanization has been facilitated by the emergence of outsourcing enterprises that rent out packages of agricultural machinery and machine operators to farm households. These services have made access to agricultural machinery scale neutral, meaning that farms of all sizes are equally able to utilize a variety of machinery including combine harvesters, four-wheel tractors and mechanical threshers (Win, Belton, and Zhang 2018). However, little is known about the characteristics of outsourcing enterprises, the nature of services they provide, and the ways that these are evolving in the context of an extremely rapidly developing market. This report addresses these knowledge gaps. We present results from a survey of 122 agricultural machinery outsourcing service enterprises, in Myanmar’s Central Dry Zone. The Dry Zone is one of Myanmar’s most important agricultural regions. It is a major producer of rain-fed oilseeds (including sesame, groundnut, sunflower) and pulses (most importantly green gram, chick pea, pigeon pea), and paddy (produced in both monsoon and dry season). Oilseed and pulse production are widely distributed throughout the Dry Zone. Monsoon paddy cultivation is also widespread, but is particularly concentrated in townships served by irrigation schemes, mainly located in the vicinity of the town of Shwebo.

9
2. METHODOLOGY One hundred and twenty-two outsourcing enterprises, from 55 villages in 12 Dry Zone townships (sub-districts) were surveyed in December 2017. Seventy-nine enterprises provided four-wheel tractor (abbreviated here to 4WT) outsourcing services, 32 provided combine harvester (CH) outsourcing services, and 11 offered both types of service (totaling 90 4WT and 43 CH outsourcers). Villages were selected using a sample frame derived from an earlier survey, the Rural Economy and Agriculture Dry Zone community survey (READZ) (Belton et al. 2017). The READZ community survey was implemented in 14 townships. Townships were selected purposively following extensive scoping research to include all the major cropping systems present in the Dry Zone, as well as easily accessible and more remote areas. Three hundred villages were selected at random for survey from a complete list of communities in the 14 townships. The survey instrument captured data on a variety of community characteristics, including numbers of outsourcing enterprises, yielding a list of villages where CH and 4WT outsourcing enterprises were located, and the number of outsourcing enterprises present in each. For the survey that informs this report, all villages identified during the READZ community survey as having one or more CH outsourcing enterprises, and/or three or more 4WT outsourcing enterprises were selected for inclusion in the survey. All CH and 4WT outsourcing enterprises in each village were re-listed with the help of the village head, and subsequently interviewed.
10
3. RESULTS 3.1. Outsourcing Enterprise Characteristics
Providers of CH and 4WT rental services have the following characteristics:
• First, almost all (98%) own agricultural land and practice farming. • Second, their landholdings are three times larger than the average for Dry Zone households
(7.5 ha vs. 2.6 ha). Their farms are toward the upper end of the farm size distribution, but they are not large landowners, nor are they large companies
• Third, they are more likely to operate rural off-farm enterprises such as crop trading or processing, renting out transport services, or operating dry goods stores than households in the general population with similar landholdings. This suggests that many machinery outsourcing services businesses build on pre-existing social networks.
• Fourth, they are relatively highly educated, and are more likely to be employed in a profession than the population average.
• Fifth, they are much more likely to own motor vehicles (motorbikes, cars, six-wheel trucks) than general population, reflecting their higher than average economic status.
3.2. Location
Rental service providers are geographically clustered at two scales: 1) the township; 2) the village. First, at the township level, CH outsourcing enterprises are clustered in locations with high concentrations of irrigated paddy. Four townships surrounding the town of Shwebo in Sagaing region account for 67% of surveyed CH outsourcers. 4WT rental service providers are spread more widely, reflecting the widespread distribution of rain-fed oilseed and pulses cultivation (see Figure 1 on the following page). Second, at village level, outsourcing enterprises tend to be located in villages close to major roads, as indicated by shorter than average travel times to urban areas (37 minutes, vs. 66 minutes in monsoon). This may reflect a tendency for operators of off-farm businesses to be located relatively close to towns, or for towns to have developed in the most productive agricultural areas. Clustering at the village level also follows kinship ties to some extent. Twenty-two percent of 4WT outsourcers and 33% of CH outsourcers report having a close relative who also provided rental services. Among these, 94% live in the same village as the respondent, and the remaining 6% in nearby villages.
3.3. Asset Ownership and Accumulation
Outsourcing enterprises are small businesses. The vast majority own a single machine. CH owners are slightly more likely than 4WT owners to operate more than one machine (16% and 4% of outsourcers, respectively). Nine percent of outsourcers own both CH and 4WT.
Outsourcing of CH and 4WT services is a recent phenomenon, and has expanded extremely rapidly: 88% of 4WT and 94% of CH owned by surveyed outsourcers were purchased during or after 2014. Regular purchases of 4WT began somewhat earlier than those of CH (2011 and 2014, respectively).

11
Figure 1. Locations of Surveyed Outsourcing Enterprises, by Type
Source: authors for all figures unless otherwise noted.

12
This sequence reflects the widely observed trend for power intensive operations (such as plowing) to become mechanized more rapidly than control intensive operations (such as harvesting). However, the rate of increase in purchases of both 4WT and CH fell sharply in 2017, dropping to below 2015 levels, suggesting the onset of market maturation (Table 1).
Table 1. Number of Four-Wheel Tractors and Combine Harvesters Purchased by Surveyed Outsourcing Enterprises, by Year
Machine
In/ before 2010 2011 2012 2013 2014 2015 2016 2017
Four-wheel tractor 2 1 3 6 16 24 30 16 Combine harvester 3 0 0 0 5 14 18 11
Source: authors for all tables unless otherwise noted. Surveyed enterprises owned a variety of agricultural machines other than 4WT and CH. For example, 22% of outsourcers also owned a mechanical thresher or rice mill. CH or 4WT were usually purchased more recently than other items of machinery. For example, 90% of mechanical threshers and rice mills had been purchased prior to ownership of CH or 4WT. Very few service providers had sold or disposed of CH or 4WT. This is also unsurprising given how recently most of these were purchased. CH outsourcing enterprises are more likely than 4WT outsourcers to own machinery associated with paddy cultivation (e.g. power tillers, threshers), reflecting their origins in paddy growing areas. It is possible that these households made use of their knowledge of paddy threshing and accumulated (financial and social) capital when establishing their CH outsourcing activities. The median area of land owned by outsourcers changed little between time of first acquisition of a CH or 4WT and the time of survey (increasing by less than 4%). Thus, at present, there is no evidence of either land accumulation (i.e., investing outsourcing profits in the expansion of farm area), or land divestment (i.e., selling or leasing-out land to facilitate further specialization in rental service provision) by outsourcers taking place. However, the short period of time for which most of these enterprises have been operational means that it is too early to tell whether such patterns will emerge.
3.4. Equipment Specifications
CH outsourcers overwhelmingly purchased a single brand of machine, Kubota (86%). Scoping interviews indicated that this reflects consumer preferences rather than supply side constraints. A number of other brands of combine are available for sale in Myanmar, but are perceived to be of inferior quality or performance to Kubota. The tractor market is far more diverse, with ownership of more than 20 different brands reported. Kubota accounts for the largest share (22%) of this market. Dae Dong (a Korean brand promoted by Department of Cooperatives) is second (13%). Indian brands Sonalika and Preet are 3rd and 4th. The remainder is comprised mainly of an assortment of different Chinese brands.
13
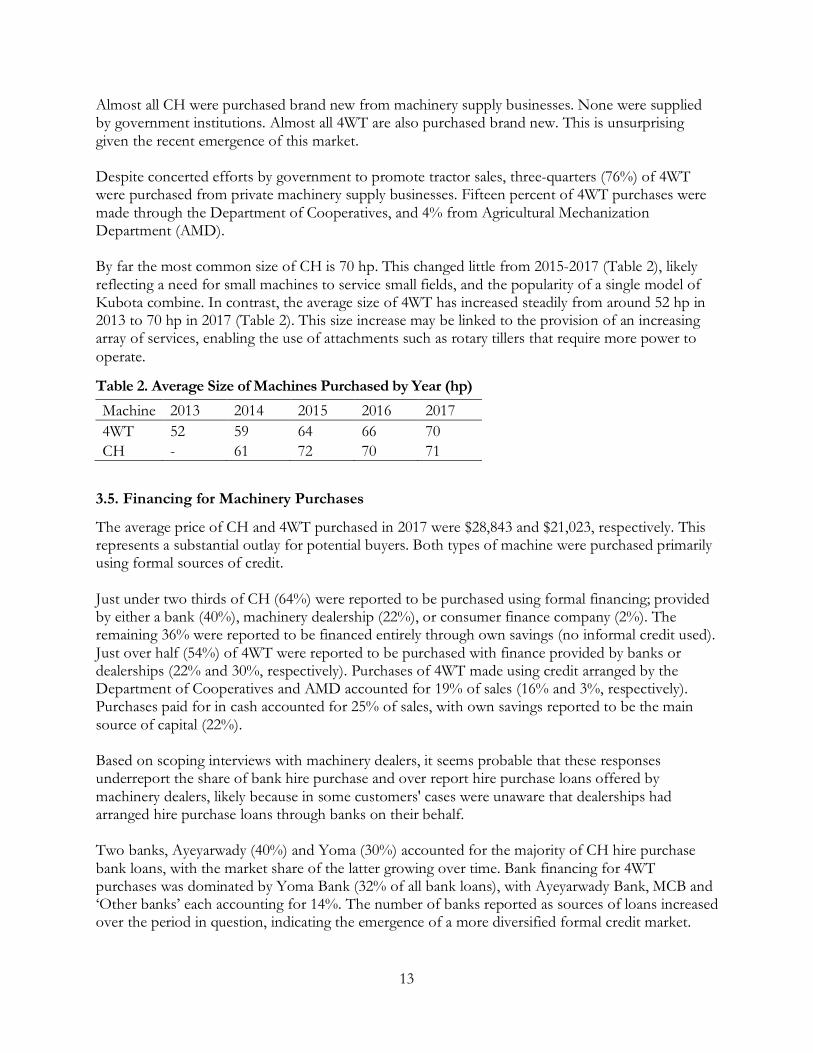
Almost all CH were purchased brand new from machinery supply businesses. None were supplied by government institutions. Almost all 4WT are also purchased brand new. This is unsurprising given the recent emergence of this market. Despite concerted efforts by government to promote tractor sales, three-quarters (76%) of 4WT were purchased from private machinery supply businesses. Fifteen percent of 4WT purchases were made through the Department of Cooperatives, and 4% from Agricultural Mechanization Department (AMD). By far the most common size of CH is 70 hp. This changed little from 2015-2017 (Table 2), likely reflecting a need for small machines to service small fields, and the popularity of a single model of Kubota combine. In contrast, the average size of 4WT has increased steadily from around 52 hp in 2013 to 70 hp in 2017 (Table 2). This size increase may be linked to the provision of an increasing array of services, enabling the use of attachments such as rotary tillers that require more power to operate.
Table 2. Average Size of Machines Purchased by Year (hp) Machine 2013 2014 2015 2016 2017 4WT 52 59 64 66 70 CH - 61 72 70 71
3.5. Financing for Machinery Purchases
The average price of CH and 4WT purchased in 2017 were $28,843 and $21,023, respectively. This represents a substantial outlay for potential buyers. Both types of machine were purchased primarily using formal sources of credit. Just under two thirds of CH (64%) were reported to be purchased using formal financing; provided by either a bank (40%), machinery dealership (22%), or consumer finance company (2%). The remaining 36% were reported to be financed entirely through own savings (no informal credit used). Just over half (54%) of 4WT were reported to be purchased with finance provided by banks or dealerships (22% and 30%, respectively). Purchases of 4WT made using credit arranged by the Department of Cooperatives and AMD accounted for 19% of sales (16% and 3%, respectively). Purchases paid for in cash accounted for 25% of sales, with own savings reported to be the main source of capital (22%). Based on scoping interviews with machinery dealers, it seems probable that these responses underreport the share of bank hire purchase and over report hire purchase loans offered by machinery dealers, likely because in some customers' cases were unaware that dealerships had arranged hire purchase loans through banks on their behalf. Two banks, Ayeyarwady (40%) and Yoma (30%) accounted for the majority of CH hire purchase bank loans, with the market share of the latter growing over time. Bank financing for 4WT purchases was dominated by Yoma Bank (32% of all bank loans), with Ayeyarwady Bank, MCB and ‘Other banks’ each accounting for 14%. The number of banks reported as sources of loans increased over the period in question, indicating the emergence of a more diversified formal credit market.

14
Among respondents who used bank loans to buy CH, 95% reported providing collateral (as compared to 33% of those who reported taking credit from machinery dealerships). Among those CH buyers who provided collateral, 95% reported using an agricultural land use rights certificate (Form 7) for this purpose. A similar pattern was apparent for 4WT purchases; 84% of respondents who took bank loans reported providing collateral, among which 100% used Form 7. These figures indicate the importance of transferrable land use rights (first introduced in 2012) in facilitating access to finance for machine purchases. The median down payment on hire purchase loans for CH was 40% of the total value of the machine, with an average of four repayment installments, repaid over an average of 19 months. No CH outsourcing enterprise reported extending the number of installments paid due to inability to pay on time. In other words, provision of CH outsourcing services is highly profitable, enabling most of the capital costs of the enterprise to be recovered within two years. The average down payment on 4WT hire purchase loans, is similar to that for CH (35%), but with a slightly larger number of loan installments (average five), and longer average loan repayment period of 28 months (8 months longer than that of CH). This is indicative of the lower levels of income generated by provision of 4WT services outsourcing, relative to CH. Nevertheless, only 3% of 4WT outsourcers reported having extended their repayments due to an inability to complete their installments on time, and then by an average of only 4 months each. The mean annual rate of interest paid on loans for 4WT was reported as 11.5% of total costs and mean service charge as 1.5% of total costs, totaling 13% (the maximum annual interest rate payable on bank loans). Slightly lower costs were reported for CH, totaling 11%.
3.6. Training Received
Very few owners or operators of CH or 4WT received formal training on how to use them. The share of CH owners having received such training fell over time, from 33% in 2013 to 10% in 2017. Among individuals who had received training, almost all had been trained by machinery supply businesses. None reported having received training from AMD. Similarly, only 19% of workers employed to operate CH were reported to have received training. This share also fell over time, as the number of outsourcing enterprises grew. Machinery dealerships were also by far the most important source of training for this group (it is likely that ‘on the job’ learning from more experienced workers or machine owners was not reported as a form of training). The share of 4WT owners having received formal training was even lower, at just 4% in 2017, all of whom had been trained by machinery dealerships. Only 12% of the workers hired to operate 4WT in 2017 had received training (up from zero in 2013). Among these, 29% had been trained by AMD, with the remainder being trained by machinery dealerships or ‘other’ sources.
3.7. Mode of Service Provision
Virtually all CH and 4WT were rented out as outsourced services (i.e., the owner provided both the machine and an operator/s), rather than as equipment (i.e., with the farmer renting in the machine and self-operating it). This is unsurprising given that the machines are valuable and require a degree of skill and experience to operate. Most outsourcing enterprises also used the machines to farm their

15
own land (83% of CH owners and 97% of 4WT owners, among those who owned farmland). None of the outsourcers surveyed operate as a ‘one-stop shop’, providing multiple services to their clients. Services provided by CH outsourcers are limited mainly to harvesting, with around 25% of CH enterprises offering bagging and hauling grain from the field as a service. No enterprises offered services such as drying, buying or transporting paddy to market. This situation has changed little over time. These results suggest that CH outsourcing is primarily a farmer to farmer service, although some caution is required given that our sample of outsourcers is entirely rural, and therefore excludes urban rice mills or other enterprises that may have diversified their activities to include harvesting paddy. 4WT outsourcers also offer very few complementary services (e.g. providing inputs, or working as an agent for a mill). However, they do offer a variety of ‘core’ machine operation services, and this has diversified somewhat over time (Table 3). The growing variety of services offered may reflect the availability of attachments that offer new functionality, the increasing average size of tractors that makes power intensive operations such as rotary tilling easier, and the attempts of outsourcers to differentiate themselves from one another and secure customers in an increasingly competitive market.
Table 3. Share of 4WT Enterprises Offering Services, 2013-2017
2013 2014 2015 2016 2017 Plowing 91% 89% 91% 94% 94% Harrowing 0% 29% 23% 34% 28% Rotary tilling 45% 43% 40% 48% 53% Land levelling 9% 18% 12% 23% 27% Towing 0% 4% 2% 3% 3%
Fees charged for harvesting with CH (adjusted for inflation) increased by around one third from around MMK 79,000/ha in 2013 to MMK104,000/ha in 2015, but remained stable thereafter as the supply of services caught up with latent demand. In contrast, the average real price of all services offered by 4WT enterprises has fallen since their year of first introduction, indicating the existence of a highly competitive market (see Table 4).
Table 4. Real Price per Hectare of CH and 4WT Services, 2013-2017* Service 2013 2014 2015 2016 2017 Change (%) Combine harvesting 79,534 96,021 103,894 102,958 106,109 +33 Plowing 37,174 41,044 34,241 34,832 33,121 -11 Harrowing 0 43,323 38,287 35,609 33,862 -22 Rotary tilling 48,412 48,007 42,611 45,487 40,603 -16 Land levelling 148,200 118,027 88,979 69,913 58,904 -60 Towing 0 0 0 9998 5737 -43 *Note: Real prices based on 2017.

16
3.8. Seasonality of Service Provision
As expected, CH rental service provision follows a highly seasonal pattern that matches the seasonality of paddy cultivation. There are three peaks in activity: the harvest of the post-monsoon irrigated rice crop in February and March (this is a relatively minor crop, planted by some farms in the Dry Zone), the harvest of the pre-monsoon irrigated rice crop on June and July1, and the harvest of the monsoon rice crop from October to December (peaking in November). Over time, the post-monsoon crop has assumed lesser importance relative to the other two crops (though the number of outsourcers harvesting the former has remained constant), while the number and share of enterprises harvesting the pre-monsoon and monsoon rice crops have increased. Harvesting of the dry season paddy crop is more heavily mechanized than harvesting of the monsoon paddy crop as a share of planted area, as confirmed by an earlier survey (Belton et al. 2017). However, the total area of monsoon paddy planted is far superior to the area of dry-season paddy, and the biggest peak in the number of enterprises offering outsourcing services now occurs at the end of the monsoon season. The changing seasonality of CH outsourcing services provision supports the observation made above that outsourcers have radiated out from a point of origin in the ‘core’ of irrigated paddy cultivating areas in the command areas of irrigation schemes around Shwebo. They have ventured progressively further afield to reach more widely dispersed and fragmented monsoon paddy growing areas in the Dry Zone and beyond to seek new customers as competition has intensified. However, despite these strongly seasonal trends, there was no month in which CH enterprises did not operate. This suggests a high degree of variability in growing conditions and varietal choice even within zones. No single CH enterprise operated in all 12 months however. Besides seasonal variation in demand, this likely reflects a need to break from operations in order to perform repairs. Demand for 4WT outsourcing services, which (unlike CH services) are utilized by farmers producing a large variety of crops, is much less subject to seasonal variation. Peak demand for 4WT services in 2017 occurred in August (when 50% of outsourcing enterprises provided services), with least demand in January (36% of outsourcing enterprises operational). Peak demand appears to have become later during the year over time, having initially peaked around March, but it is not immediately obvious what the reasons for this pattern are.
3.9. Location and Area of Service Provision
The main areas where CH service providers work can be divided into three zones: (1) Dry Zone (the area they originate from); (2) Delta (main rice growing area of country, 400 miles to the south); (3) Bago (another major rice area, lying in between Dry Zone and Delta). The total area harvested by surveyed CH outsourcing enterprises across the three zones grew
1 Harvest of the pre-monsoon irrigated rice crop starts around one month earlier in the Delta than in Bago and Dry Zone, likely due to the more southerly location of the former, and higher temperatures experienced there during the months of the cool dry season.

17
extremely rapidly from 2013 to 2017, jumping by 1238%. The area trebled between 2015 and 2016 alone, from 1830 ha to 6056 ha, but plateaued thereafter, growing by only 3% in 2017, to 6267 ha (Table 5). A similar pattern is apparent in Figure 2, which shows the number of CH outsourcing enterprises operating by region where services were provided and year.
Table 5. Total Area (Ha) Harvested by Surveyed CH Outsourcing Enterprises, by Zone and Year
2013 2014 2015 2016 2017 Dry Zone 506 897 1547 4253 3983 Delta 0 0 162 1022 937 Bago 0 0 121 781 1347 Total 506 897 1830 6056 6267
High levels of latent demand for CH outsourcing services can be explained by the confluence of factors that result in substantial advantages of mechanized over manual harvesting. First, growing labor scarcity and rapidly rising labor costs (rural wages grew 40% in real terms from 2012 to 2016), linked to rapid outmigration from rural areas of the Dry Zone since 2010 (Belton et al, 2017). Second, greater timeliness, reliability and convenience as compared to marshalling teams of workers. Third, reduced risk of pre-harvest crop losses due to extreme weather events (e.g. heavy rain prior to harvest) and rapid land preparation for the following crop. Fourth, significant reductions in loss of grain during harvesting and threshing (Mather and Belton, 2018).
Figure 2. Number of CH Outsourcing Enterprises Providing Services by Region of Service Provided and Year 2013 2015 2017
All surveyed enterprises provided rental services exclusively in the Dry Zone from 2013-2015, dropping to two-thirds in 2015, and under 50% thereafter. Conversely, the share of enterprises
18
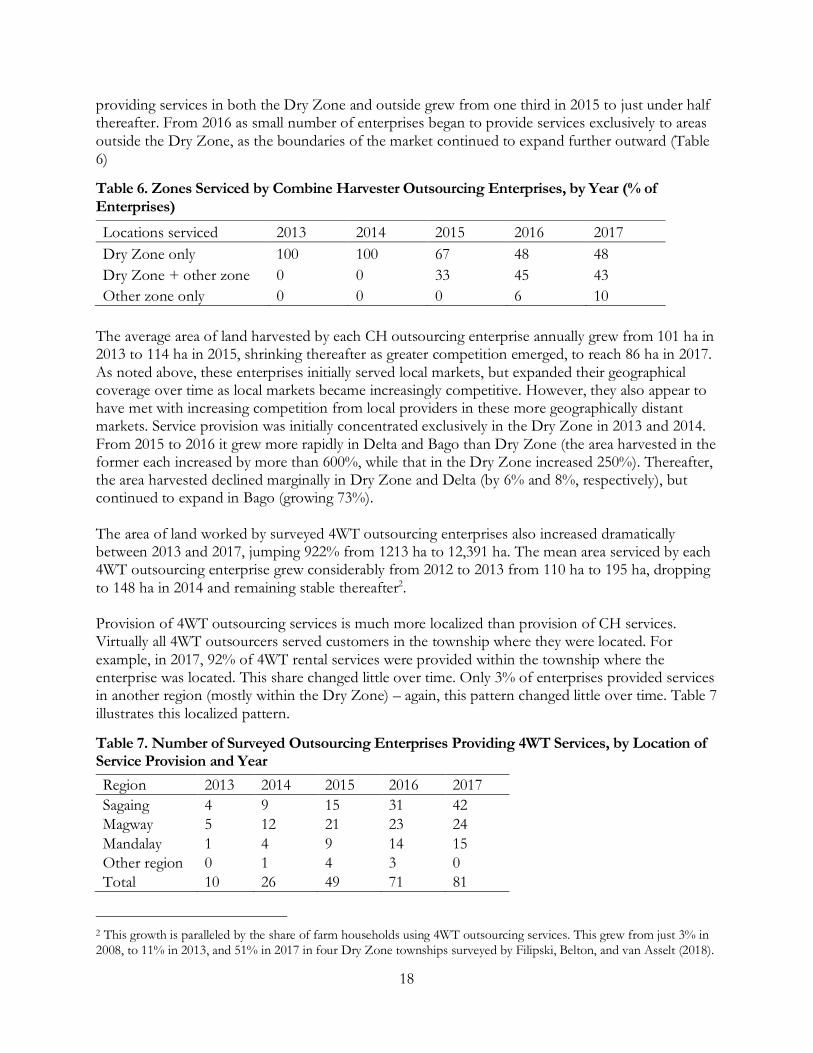
providing services in both the Dry Zone and outside grew from one third in 2015 to just under half thereafter. From 2016 as small number of enterprises began to provide services exclusively to areas outside the Dry Zone, as the boundaries of the market continued to expand further outward (Table 6)
Table 6. Zones Serviced by Combine Harvester Outsourcing Enterprises, by Year (% of Enterprises)
The average area of land harvested by each CH outsourcing enterprise annually grew from 101 ha in 2013 to 114 ha in 2015, shrinking thereafter as greater competition emerged, to reach 86 ha in 2017. As noted above, these enterprises initially served local markets, but expanded their geographical coverage over time as local markets became increasingly competitive. However, they also appear to have met with increasing competition from local providers in these more geographically distant markets. Service provision was initially concentrated exclusively in the Dry Zone in 2013 and 2014. From 2015 to 2016 it grew more rapidly in Delta and Bago than Dry Zone (the area harvested in the former each increased by more than 600%, while that in the Dry Zone increased 250%). Thereafter, the area harvested declined marginally in Dry Zone and Delta (by 6% and 8%, respectively), but continued to expand in Bago (growing 73%). The area of land worked by surveyed 4WT outsourcing enterprises also increased dramatically between 2013 and 2017, jumping 922% from 1213 ha to 12,391 ha. The mean area serviced by each 4WT outsourcing enterprise grew considerably from 2012 to 2013 from 110 ha to 195 ha, dropping to 148 ha in 2014 and remaining stable thereafter2. Provision of 4WT outsourcing services is much more localized than provision of CH services. Virtually all 4WT outsourcers served customers in the township where they were located. For example, in 2017, 92% of 4WT rental services were provided within the township where the enterprise was located. This share changed little over time. Only 3% of enterprises provided services in another region (mostly within the Dry Zone) – again, this pattern changed little over time. Table 7 illustrates this localized pattern.
Table 7. Number of Surveyed Outsourcing Enterprises Providing 4WT Services, by Location of Service Provision and Year Region 2013 2014 2015 2016 2017 Sagaing 4 9 15 31 42 Magway 5 12 21 23 24 Mandalay 1 4 9 14 15 Other region 0 1 4 3 0 Total 10 26 49 71 81
2 This growth is paralleled by the share of farm households using 4WT outsourcing services. This grew from just 3% in 2008, to 11% in 2013, and 51% in 2017 in four Dry Zone townships surveyed by Filipski, Belton, and van Asselt (2018).
Locations serviced 2013 2014 2015 2016 2017 Dry Zone only 100 100 67 48 48 Dry Zone + other zone 0 0 33 45 43 Other zone only 0 0 0 6 10

19
3.10. Outsourcing of Logistics and Labor by CH Outsourcing Enterprises
As the market for CH service provision has expanded geographically to reach more distant areas, CH outsourcing enterprises have themselves begun to outsource a number of roles that they initially preformed. We identify three areas where functions have been outsourced to other actors: (1) transport services; (2) organization of clients; (3) labor. In each of these areas, new specialized actors and markets have emerged extremely rapidly in response to new economic opportunities associated with the growth of agricultural machinery outsourcing services, and have in turn facilitated this growth.
3.10.1. Transport Services
The growth of CH rental services has been accompanied by the growth of 3rd party transport services to deliver CH to the point of use. During 2013-2014, most vehicles used to transport CH were self-owned, or hired-in but self-operated. In 2015, when large numbers of CH outsourcing enterprises began operating for the first time, 90% of outsourcing enterprises made use of 3rd party transport services. This share rose to almost 100% thereafter (Table 8). 3
Table 8. Ownership and Operation of Vehicles Used to Transport CH (%) Mode of operation 2013 2014 2015 2016 2017 Owned by self 50 33 0 0 2 Hired but self-operated 25 17 10 3 0 Operated by 3rd party 25 50 90 97 98
Transport logistics from 3rd party providers have lowered entry barriers into CH outsourcing service provision by removing the need to own and/or operate vehicles needed for CH transport beyond the township where the outsourcing enterprises are located. This makes it possible for CH outsourcer to offer services in distant locations without having to visit them in person. The real cost of transporting CH using 3rd party logistics changed little between 2015 and 2017, at around $250 each for outward and return legs of the journey. 4WT outsourcing service provision is much more localized than CH service provision. As a result, virtually all 4WT travelled to the point of use under their own power (i.e., no vehicle was required to move them). This did not change over time.
3.10.2. Customer Organization
There are three configurations via which agricultural machinery outsourcers may organize the provision of services: (1) agreements with individual farmers; (2) agreements with groups of farmers; (3) a combination of individual and group agreements. Agreements with groups of customers can be organized in one of three ways: (1) organized by outsourcing service providers seeking customers; (2) self-organized by farmers seeking service
3 These figures exclude local journeys made without any form of transport. These accounted for 26% of all journeys in 2017.

20
providers; (3) organized by brokers acting as intermediaries between customers and service providers.
Organization of customers in groups confers economies of scale by offering access to larger areas of farmland than agreements with individual farmers would usually support. For outsourcers, working pre-formed groups (as opposed to organizing groups themselves) lowers search and transaction costs by reducing the need to coordinate timing of service delivery and access across multiple plots of land and collect payment (which is usually made after the harvest has been sold) from multiple farmed. For these reasons, there have been two shifts in the organization of service provision over time: First, from individual to group arrangements. Second, from direct organization of customer groups, to intermediated organization. The second shift has given rise to the increasing importance of brokers, to whom group organization functions are outsourced. The shift from individual to group arrangements is illustrated in Table 9. Although individual arrangements are the most common in every year from 2013 to 2017, they decline in importance over time, from 80% of arrangements on 2013 to just over 50% in 2017. A mix of individual and group arrangements is fairly constant throughout the five years, accounting for approximately 15 to 25% of all rentals, while group arrangements grow in importance from nothing in 2013, to roughly 10% in 2014 and 2015, to around 30% in 2016 and 2017.
Table 9. Organization of CH Outsourcing Enterprise Customers, 2013-2017 (%) Customer organization 2013 2014 2015 2016 2017 Individual farmers 80 75 69 49 53 Individual farmers & groups 20 13 25 22 14 Groups of farmers 0 13 6 29 33
Agreements between enterprises and individuals remained the most common form of arrangement in the Dry Zone, consistently accounting for 70-80% of rental arrangements in each year. In the more distant Delta, enterprises from the Dry Zone began to provide services only in 2015. The share of group arrangements in the Delta increased from 0% in 2015, to 80% in 2017. Given that farm sizes in the Dry Zone and Delta are quite similar, differences in the organization of outsourcing service provision may be ascribed to differences in the transaction costs associated with operating in near and distant locations. Table 10 illustrates the evolution of group organization over time. Local brokers acting as intermediaries between prospective service users and outsourcing enterprises have largely replaced self-organized groups who proactively sought out service providers. The contribution of the latter fell from around 65% of groups formed in 2015, to 13% in 2017. Organization of groups by outsourcing enterprises played no or very little role in all years.
Table 10. Mode Organization of CH Outsourcing Service User Groups, 2015-2017 (%) Mode of group organization 2015 2016 2017 Organized by local broker 40 64 87 Organized by outsourcing enterprise 0 4 0 Self-organized group 80 43 13

21
The role of brokers in group coordination varies only slightly between Delta and Dry Zone (where they are responsible for organizing 91% and 80% of groups receiving services, respectively). The pace at which brokers have come to dominate group formation suggests that this model confers advantages to both CH outsourcing enterprises and their customers. The emergence of this new form of specialized economic actor has been extremely quick, occurring in just 3 years. The main service provided by brokers is group coordination (as reported by 96% of enterprises who worked through a broker in 2017). Other common services performed are collecting payments from customers on behalf of the outsourcing enterprises (92%), and providing accommodation for machine operators (85%). In contrast, 4WT outsourcing is dominated by direct coordination between machine owners and individual customers. Eighty-seven percent of 4WT outsourcing enterprises provided services exclusively to individuals in 2017. In contrast to CH outsourcing, this share has increased over time (from 73% in 2013), while the share of enterprises providing services to groups of farmers, and both individuals and groups has shrunk slightly (Table 11).
Table 11. Organization of CH Outsourcing Enterprise Customers, 2013-2017 (%) Customer organization 2013 2014 2015 2016 2017 Individuals 73 75 88 86 87 Individual farmers & groups 18 21 9 8 9 Groups of farmers 9 4 2 6 2
This pattern reflects the proximity of 4WT outsourcers to their customers, with the short distances travelled making it unnecessary to organize customers in groups in order to achieve economies of scale. The localized nature of 4WT outsourcing also means that service providers and their clients are often likely to be known to one another, reducing the need for intermediaries to collect payment or arrange accommodation. The decline of group arrangements may reflect increasing levels of competition among 4WT outsourcing enterprises, making them increasingly willing to provide services to individual customers.
3.10.3. Labor
CH outsourcers have rapidly substituted hired labor for their own labor power for machine operation. As in the case of logistics and group organization, labor outsourcing is closely linked with the geographical expansion of CH service provision. CH owners presumably find it preferable to send alternates to work away from home for protracted periods of time, freeing up their own time to engage in activities such as farming or non-farm business. This trend may also reflect the increasing availability of skilled (but informally trained) machine operators and, to a lesser extent, the growing ownership of multiple machines, necessitating additional labor to operate. As shown in Table 12 on the following page, 100% of CH owners self-operated their machines in 2013. This share fell fairly steadily to reach just 12% in 2017. Over the same period, the share of enterprises employing hired labor grew from 60% to 97%. The share of outsourcing enterprises employing unpaid family labor remained fairly constant at around 20% from 2014 to 2017.

22
In slightly different terms, hired labor accounted for 30% of the total workforce employed by CH outsourcing enterprises in 2013, rising to 70% in 2017, while owner-operators fell from 50% to 10% of the workforce.
Table 12. Source of Labor Employed by CH Outsourcing Enterprises, by Year (%) Source of labor 2013 2014 2015 2016 2017 Self 100 50 44 20 12 Family labor 40 13 25 18 23 Hired labor 60 88 81 90 96
One average each CH outsourcing enterprise employs one unpaid family member (excluding owner operator) and 2 hired workers. The main roles performed by hired workers are machine operation (93% in 2017) and machine maintenance (70%). A small number of workers perform the role of mechanic (8%). The real rate of pay for CH operators increased by 36% from 2015 to 2017. However, this does not appear to stem from a shortage of skilled labor, as the real wage rate in the Dry Zone rose by a similar amount over this period (Belton et al. 2017), implying that the labor market has responded extremely quickly to emergent sources of demand. There was little change in the composition of labor used by 4WT outsourcing enterprises over time. Own, family and hired labor over time deployed by 52%, 18% and 60% of outsourcers, respectively, in 2017. This pattern is likely to reflect to local nature of 4WT service provision to individual farmers. This means that jobs can be completed quickly, with limited disruption to other economic activities engaged in by the enterprise, creating few incentives to substitute hired workers for family labor. The range of tasks performed by hired 4WT outsourcing workers is similar to that performed by CH outsourcing workers (96% responsible for machine operation, 68% basic machine maintenance, 6% mechanics, in 2017). However, unlike CH workers, the real wage received by hired 4WT operators fell by 47% from 2013-2017, seemingly indicating that that the pool of workers with experience of operating tractors grew extremely rapidly over this period.

23
4. CONCLUSIONS The growth of outsourcing enterprises has played a vital role in facilitating agricultural mechanization in Myanmar over the past five years. Outsourcing businesses emerged extremely rapidly during this period. The area harvested by surveyed CH outsourcing enterprises increased by more than 1200%, while that worked by 4WT outsourcers grew 900%. Around 90% of the machines used were purchased during or after 2014. A vibrant private sector has been by far the main driver of this development. Outsourcing enterprises are small businesses, operated mainly by farm households with landholdings toward the upper end of the farm size distribution, but not companies or large landowners. Their rapid growth reflects the highly profitable nature of outsourcing service provision. For example, the bulk of the capital costs of purchasing a CH costing close to $30,000 can be recovered within two years. All of the CH and three-quarters of 4WT owned by outsourcers were purchased from private machinery supply businesses. Improving access to formal finance has facilitated outsourcers’ acquisition of machinery. Around two thirds of CH and more than onehalf of 4WT acquired using private sources of formal credit, with the remainder purchased largely from savings. The introduction of transferrable land use titles in 2012 have facilitated this development. Form 7 is used to guarantee almost all hire purchase loans provided by private banks. Outsourcers have rapidly expanded their geographical coverage to secure new customers. In the case of CH this has meant moving from a ‘core’ of irrigated paddy cultivating areas around Shwebo, to monsoon paddy cultivating areas of the Dry Zone, and then further still to the Delta and Bago. Fees charged for outsourcing services have remained stable (CH) or become cheaper (4WT) in real terms, reflecting the competitive nature of these markets. New specialized economic actors and markets for services have emerged in response to opportunities created by the growth of agricultural machinery outsourcing. Businesses providing third party logistics transport CH to distant locations, brokers organize groups of clients on behalf of outsourcers, and skilled hired workers have replaced owners as machine operators. This has accelerated the geographical expansion of service provision and made market entry for outsourcers easier. The speed of these simultaneous and mutually reinforcing changes demonstrates that markets in rural Myanmar, including those for land, credit, labor, and services such a brokerage and logistics, can be highly responsive, given the right set of conditions. This observation contrasts sharply with the common perception that markets in rural Myanmar are moribund and highly constrained (e.g. World Bank, 2016). Indeed, the pace of change is such that by 2017, scarcely five years after it began, purchases of 4WT and CH have slowed substantially and the area serviced by individual outsourcing enterprises has stabilized (4WT) or started to shrink (CH), suggesting that the market has already beginning to mature. This is remarkable given that the existence of mechanization outsourcing enterprises in Myanmar was barely recognized even two years ago.

24
REFERENCES Belton, B., M. Filipski, C. Hu, A.T. Oo, and A. Htun. 2017. Rural Transformation in Central Myanmar:
Results from the Rural Economy and Agriculture Dry Zone Survey. Food Security Policy Project Research Paper No. 64. East Lansing: Michigan State University.
Filipski, B., B. Belton, and J. van Asselt. 2018. Agricultural Mechanization in the Dry Zone. Food Security
Policy Project Research Highlight No. 12. East Lansing: Michigan State University. Mather, D. and B. Belton. 2018. Mechanization and Crop Profitability, Productivity and Labor Use in
Myanmar’s Dry Zone. Food Security Policy Project Research Highlight No. 14. East Lansing: Michigan State University.
Win, M.T., B. Belton, and X. Zhang. 2018. Myanmar’s Mechanization Revolution: Evidence of
Emerging Structural Transformation? In Myanmar Transformed? People, Places and Politics, ed. G. McCarthy, J. Chambers, C. Win, and N. Farrelly. Singapore: Institute of Southeast Asian Studies.
World Bank. 2016. Myanmar: Analysis of Farm Production Economics. Washington, DC: The World
Bank.

www.feedthefuture.gov