fedex corporationd18rn0p25nwr6d.cloudfront.net/cik-0001048911/0fdabc2c-57d0-458b-b...fedex...
TRANSCRIPT
UNITED STATESSECURITIES AND EXCHANGE COMMISSION
Washington, D.C. 20549
FORM 8-K
CURRENT REPORTPursuant to Section 13 or 15(d)
of the Securities Exchange Act of 1934
Date of Report (Date of earliest event reported): March 20, 2018
FedEx Corporation(Exact name of registrant as specified in its charter)
Commission File Number 1-15829
Delaware 62-1721435(State or other jurisdiction
of incorporation) (IRS Employer
Identification No.)
942 South Shady Grove Road, Memphis, Tennessee 38120(Address of principal executive offices) (ZIP Code)
Registrant’s telephone number, including area code: (901) 818-7500
Check the appropriate box below if the Form 8-K filing is intended to simultaneously satisfy the filing obligation of the registrant under any of the followingprovisions:
☐ Written communications pursuant to Rule 425 under the Securities Act (17 CFR 230.425)
☐ Soliciting material pursuant to Rule 14a-12 under the Exchange Act (17 CFR 240.14a-12)
☐ Pre-commencement communications pursuant to Rule 14d-2(b) under the Exchange Act (17 CFR 240.14d-2(b))
☐ Pre-commencement communications pursuant to Rule 13e-4(c) under the Exchange Act (17 CFR 240.13e-4(c))
Indicate by check mark whether the registrant is an emerging growth company as defined in Rule 405 of the Securities Act of 1933 (§230.405 of this chapter) orRule 12b-2 of the Securities Exchange Act of 1934 (§240.12b-2 of this chapter).
Emerging growth company ☐
If an emerging growth company, indicate by check mark if the registrant has elected not to use the extended transition period for complying with any new orrevised financial accounting standards provided pursuant to Section 13(a) of the Exchange Act. ☐

EXPLANATORY NOTE
The information in this Report, including the exhibit, is being furnished pursuant to Item 2.02 of Form 8-K and General Instruction B.2 thereunder. Suchinformation shall not be deemed “filed” for purposes of Section 18 of the Securities Exchange Act of 1934, as amended, or otherwise subject to the liabilities ofthat section, nor shall it be deemed incorporated by reference in any filing under the Securities Act of 1933, as amended.
SECTION 2. FINANCIAL INFORMATION.
Item 2.02. Results of Operations and Financial Condition.
Attached as Exhibit 99.1 and incorporated herein by reference is a copy of FedEx Corporation’s press release, dated March 20, 2018, announcing itsfinancial results for the fiscal quarter ended February 28, 2018.
SECTION 9. FINANCIAL STATEMENTS AND EXHIBITS.
Item 9.01. Financial Statements and Exhibits.
(d) Exhibits. The following exhibit is being furnished as part of this Report.
Exhibit Number Description
99.1 Press Release of FedEx Corporation dated March 20, 2018.
2

SIGNATURES
Pursuant to the requirements of the Securities Exchange Act of 1934, the registrant has duly caused this report to be signed on its behalf by the undersignedhereunto duly authorized.
FedEx Corporation
Date: March 20, 2018 By: /s/ John L. Merino John L. Merino
Corporate Vice President andPrincipal Accounting Officer
3

EXHIBIT INDEX Exhibit Number Description
99.1 Press Release of FedEx Corporation dated March 20, 2018.
E-1

Exhibit 99.1
FedEx Corp. Reports Third Quarter Earnings
MEMPHIS, Tenn., March 20, 2018 ... FedEx Corp. (NYSE: FDX) today reported the following consolidated results for the third quarter ended February 28(adjusted measures exclude the items listed below for the applicable fiscal year):
Fiscal 2018 Fiscal 2017
As Reported
(GAAP) Adjusted
(non-GAAP) As Reported
(GAAP) Adjusted
(non-GAAP)Revenue $16.5 billion $16.5 billion $15.0 billion $15.0 billionOperating income $1.00 billion $1.11 billion $1.03 billion $1.10 billionOperating margin 6.1% 6.7% 6.8% 7.4%Net income $2.07 billion $1.02 billion $562 million $625 millionDiluted EPS $7.59 $3.72 $2.07 $2.30
This year’s quarterly consolidated earnings have been adjusted to exclude the benefit of an estimated $1.15 billion reduction in the company’s net U.S. deferred taxliability attributable to the lower statutory rate enacted as part of the Tax Cuts and Jobs Act (TCJA). Additionally, this year’s and last year’s quarterly consolidatedearnings have been adjusted for TNT Express integration expenses. The adjustments are as follows:
Third Quarter Impact per diluted share Fiscal 2018 Fiscal 2017 Net U.S. deferred tax liability remeasurement ($ 4.21) — TNT Express integration expenses 0.34 0.23
“Execution of our long-term growth strategies, customer demand for the unique value of our broad portfolio of solutions and healthy growth in the global economyare driving our performance,” said Frederick W. Smith, FedEx Corp. chairman and chief executive officer. “We expect strong operating performance in each of ourtransportation segments in the fourth quarter.”
- more -
1

Operating results benefited from higher base rates, increased volume at FedEx Ground and FedEx Freight, and a favorable net impact from fuel. Results werenegatively affected by significantly higher variable compensation accruals, increased peak-related costs at FedEx Express and the impact of adverse weather.Variable compensation increased in connection with the company’s pay actions that were announced following the passage of the TCJA. These variablecompensation accruals include the year-to-date impact of the announced changes. TNT Express integration expenses were also higher.
Net results include a tax benefit of $1.53 billion ($5.60 per diluted share) attributable to the TCJA, which has three primary components:
• A provisional benefit of $1.15 billion ($4.21 per diluted share) from the remeasurement of the company’s net U.S. deferred tax liability for lower taxrates;
• A benefit of approximately $200 million ($0.75 per diluted share) from an incremental pension contribution made in February and deductible againstthe company’s prior year taxes at 35%; and
• A benefit of approximately $170 million ($0.60 per diluted share) attributable to the phase-in of the reduced tax rate applied to the company’syear-to-date earnings.
Outlook
FedEx is unable to forecast the fiscal 2018 year-end mark-to-market (MTM) pension accounting adjustments. As a result, the company is unable to provide fiscal2018 earnings-per-share guidance or projected fourth quarter fiscal 2018 consolidated operating income or margin on a GAAP basis.
Before year-end MTM pension accounting adjustments, earnings are now projected to be $17.90 to $18.30 per diluted share for fiscal 2018. The fiscal 2018earnings forecast before year-end MTM pension accounting adjustments and excluding the estimate of the remeasurement of the company’s net U.S. deferred taxliability, expenses related to TNT Express integration and certain first quarter FedEx Trade Networks legal matters is now $15.00 to $15.40 per diluted share.
Before year-end MTM pension accounting adjustments, fourth quarter fiscal 2018 consolidated operating income and margin are projected to be $1.84 billion to$1.94 billion and 10.4% to 11.1%, respectively. Excluding year-end MTM pension accounting adjustments and TNT Express integration expenses, fourth quarterconsolidated operating income and margin are projected to be $1.95 billion to $2.05 billion and 11.0% to 11.8%, respectively.
- more -
2

The projected fourth quarter fiscal 2018 operating margin for each transportation segment is as follows (the adjusted operating margin for the FedEx Expresssegment excludes TNT Express integration expenses):
Projected Fourth Quarter
Operating Margin
As Reported
(GAAP) Adjusted
(Non-GAAP)FedEx Express segment 9.1% to 9.6% 9.9% to 10.4%FedEx Ground segment 17.0% to 17.5% N/AFedEx Freight segment 8.0% to 9.0% N/A
These margin forecasts reflect the March 1, 2018 realignment of the company’s specialty logistics and e-commerce solutions into a new organizational structurewithin the FedEx Express segment. All of the above forecasts assume moderate economic growth.
The capital spending forecast for fiscal 2018 is now $5.8 billion, down $100 million from the prior forecast.
“We are increasing our fiscal 2018 earnings outlook due to foreign tax benefits from our international corporate structure, the benefits from U.S. tax reform andimproved operating performance,” said Alan B. Graf, Jr., FedEx Corp. executive vice president and chief financial officer. “We remain committed to improvingoperating income at the FedEx Express segment by $1.2 to $1.5 billion in fiscal 2020 versus fiscal 2017.”
FedEx Express Segment
For the third quarter, the FedEx Express segment reported (adjusted measures exclude TNT Express integration expenses):
Fiscal 2018 Fiscal 2017
As Reported
(GAAP) Adjusted
(non-GAAP) As Reported
(GAAP) Adjusted
(non-GAAP)Revenue $9.37 billion $9.37 billion $8.57 billion $8.57 billionOperating income $424 million $510 million $557 million $610 millionOperating income YOY change % (24%) (16%) Operating margin 4.5% 5.4% 6.5% 7.1%
- more -
3

Revenue increased due to improved base rates, currency exchange rates and higher fuel surcharges, despite a lingering impact from the June cyberattack affectingTNT Express. Total package volume declined 1%, as lower international domestic and U.S. domestic volumes offset international export package volume growthof 1%. Average daily freight pounds increased 3% on higher volume in both international and U.S. freight services.
As-reported results during the quarter were primarily affected by the estimated impacts of:
• Higher variable compensation accruals
• Increased peak-related costs
• Higher TNT Express integration expenses
• Adverse weather
• Unfavorable currency exchange rates
• Favorable net fuel
Combined, these six factors negatively affected the segment’s year-over-year results by approximately $170 million.
FedEx Ground Segment
For the third quarter, the FedEx Ground segment reported:
Fiscal 2018 Fiscal 2017 ChangeRevenue $5.22 billion $4.69 billion 11%Operating income $634 million $515 million 23%Operating margin 12.1% 11.0% 1.1 pts
Strong revenue growth was driven by average daily package volume growth of 6% and higher base rates. During peak season, record volume was delivered withexceptional service through FedEx Ground’s highly automated and flexible network.
Operating results improved due to the benefits from strong revenue growth and ongoing cost management, partially offset by increased purchased transportation,seasonal staffing and network expansion costs as well as higher variable compensation accruals.
- more -
4

FedEx Freight Segment
For the third quarter, the FedEx Freight segment reported:
Fiscal 2018 Fiscal 2017 ChangeRevenue $1.69 billion $1.49 billion 14%Operating income $55 million $41 million 34%Operating margin 3.2% 2.7% 0.5 pts
Revenue increased due to less-than truckload (LTL) revenue per shipment growth of 8% and average daily LTL shipment growth of 6%.
Operating results improved primarily due to the benefit from higher LTL revenue per shipment, partially offset by higher variable compensation accruals.
Corporate Overview
FedEx Corp. (NYSE: FDX) provides customers and businesses worldwide with a broad portfolio of transportation, e-commerce and business services. With annualrevenues of $64 billion, the company offers integrated business applications through operating companies competing collectively and managed collaboratively,under the respected FedEx brand. Consistently ranked among the world’s most admired and trusted employers, FedEx inspires its more than 425,000 teammembers to remain “absolutely, positively” focused on safety, the highest ethical and professional standards and the needs of their customers and communities. Tolearn more about how FedEx connects people and possibilities around the world, please visit about.fedex.com .
Additional information and operating data are contained in the company’s annual report, Form 10-K, Form 10-Qs, Form 8-Ks, Statistical Books and third quarterfiscal 2018 Earnings Presentation. These materials, as well as a webcast of the earnings release conference call to be held at 5:00 p.m. EDT on March 20, areavailable on the company’s website at investors.fedex.com . A replay of the conference call webcast will be posted on our website following the call.
The Investor Relations page of our website, investors.fedex.com , contains a significant amount of information about FedEx, including our Securities and ExchangeCommission (“SEC”) filings and financial and other information for investors. The information that we post on our Investor Relations website could be deemed tobe material information. We encourage investors, the media and others interested in the company to visit this website from time to time, as information is updatedand new information is posted.
- more -
5

Certain statements in this press release may be considered forward-looking statements, such as statements relating to management’s views with respect to futureevents and financial performance. Such forward-looking statements are subject to risks, uncertainties and other factors which could cause actual results to differmaterially from historical experience or from future results expressed or implied by such forward-looking statements. Potential risks and uncertainties include, butare not limited to, economic conditions in the global markets in which we operate, a significant data breach or other disruption to our technology infrastructure, theongoing impact of the June 27, 2017 cyberattack affecting TNT Express, our ability to successfully integrate the businesses and operations of FedEx Express andTNT Express in the expected time frame or at the expected cost, changes in fuel prices or currency exchange rates, our ability to match capacity to shifting volumelevels, new U.S. domestic or international government regulation, future guidance and interpretations relating to the recently enacted TCJA and our ability torealize the benefits of certain provisions of the TCJA, our ability to effectively operate, integrate and leverage acquired businesses, our ability to achieve our FedExExpress segment profit improvement goal, legal challenges or changes related to owner-operators engaged by FedEx Ground and the drivers providing services ontheir behalf, disruptions or modifications in service by, or changes in the business or financial soundness of, the U.S. Postal Service, the impact from any terroristactivities or international conflicts and other factors which can be found in FedEx Corp.’s and its subsidiaries’ press releases and FedEx Corp.’s filings with theSEC. Any forward-looking statement speaks only as of the date on which it is made. We do not undertake or assume any obligation to update or revise anyforward-looking statement, whether as a result of new information, future events or otherwise.
Media Contact: Jess Bunn 901-818-7463Investor Contact: Mickey Foster 901-818-7468Home Page: fedex.com
- more -
6

RECONCILIATIONS OF NON-GAAP FINANCIAL MEASURESTO GAAP FINANCIAL MEASURES
Third Quarter Fiscal 2018 and Fiscal 2017 Results
The company reports its financial results in accordance with accounting principles generally accepted in the United States (“GAAP” or “reported”). We havesupplemented the reporting of our financial information determined in accordance with GAAP with certain non-GAAP (or “adjusted”) financial measures,including our adjusted third quarter fiscal 2018 and 2017 consolidated operating income and margin, net income and diluted earnings per share, and adjusted thirdquarter fiscal 2018 and 2017 FedEx Express segment operating income and margin. These financial measures have been adjusted to exclude the impact of thefollowing items (as applicable):
• Net U.S. deferred tax liability remeasurement; and
• TNT Express integration expenses.
The provisional benefit from the remeasurement of our net U.S. deferred tax liability is excluded from our third quarter fiscal 2018 consolidated non-GAAPfinancial measures because it results from the non-recurring impact of a significant change in the U.S. federal statutory tax rate due to the enactment of the TCJA.The adjustment to our third quarter fiscal 2018 consolidated financial measures includes only this transitional impact. This provisional benefit is an estimate subjectto adjustment during a 12-month measurement period.
We expect to incur significant expenses over the next few years in connection with our integration of TNT Express. We have adjusted our third quarter fiscal 2018and 2017 consolidated financial measures and the FedEx Express segment third quarter fiscal 2018 and 2017 financial measures to exclude TNT Expressintegration expenses because we generally would not incur such expenses as part of our continuing operations. The integration expenses are incremental costsdirectly associated with the integration of TNT Express, including professional and legal fees, salaries and wages, advertising expenses and travel. Internal salariesand wages are included only to the extent the individuals are assigned full-time to integration activities. The integration expenses also include any restructuringcharges at TNT Express.
We believe these adjusted financial measures facilitate analysis and comparisons of our ongoing business operations because they exclude items that may not beindicative of, or are unrelated to, the company’s and our business segments’ core operating performance, and may assist investors with comparisons to prior periodsand assessing trends in our underlying businesses.
- more -
7

These adjustments are consistent with how management views our businesses. Management uses these non-GAAP financial measures in making financial,operating and planning decisions and evaluating the company’s and each business segment’s ongoing performance.
Our non-GAAP measures are intended to supplement and should be read together with, and are not an alternative or substitute for, and should not be consideredsuperior to, our reported financial results. Accordingly, users of our financial statements should not place undue reliance on these non-GAAP financial measures.Because non-GAAP financial measures are not standardized, it may not be possible to compare these financial measures with other companies’ non-GAAPfinancial measures having the same or similar names. As required by SEC rules, the tables below present a reconciliation of our presented non-GAAP financialmeasures to the most directly comparable GAAP measures.
Fiscal 2018 Earnings-Per-Share Guidance and Fourth Quarter Fiscal 2018 Operating Income and Margin Projections
Our fiscal 2018 earnings-per-share (“EPS”) guidance is a non-GAAP financial measure because it excludes the fiscal 2018 year-end MTM pension accountingadjustments, the provisional benefit from the remeasurement of our net U.S. deferred tax liability, projected fiscal 2018 TNT Express integration expenses (whichinclude any restructuring charges at TNT Express), and charges related to certain first quarter FedEx Trade Networks legal matters.
Our projected fourth quarter fiscal 2018 consolidated operating income and margin are non-GAAP financial measures because they exclude the fiscal 2018year-end MTM pension accounting adjustments and projected fourth quarter fiscal 2018 TNT Express integration expenses. Our projected fourth quarter fiscal2018 FedEx Express segment operating margin is a non-GAAP financial measure because it excludes projected fourth quarter fiscal 2018 TNT Express integrationexpenses.
We have provided fiscal 2018 non-GAAP EPS guidance, projected fourth quarter fiscal 2018 non-GAAP consolidated operating income and margin and projectedfourth quarter fiscal 2018 non-GAAP FedEx Express segment operating margin for the same reasons that were outlined above for historical non-GAAP measures.The fiscal 2018 year-end MTM pension accounting adjustments are excluded from our fiscal 2018 non-GAAP EPS guidance and projected fourth quarter fiscal2018 consolidated operating income and margin because these non-cash items are unrelated to our core operating performance. Similarly, charges related to certainfirst quarter FedEx Trade Networks legal matters are excluded from our fiscal 2018 non-GAAP EPS guidance because they are unrelated to our
- more -
8

core operating performance and to assist investors with assessing trends in our underlying business. The provisional benefit from the remeasurement of our net U.S.deferred tax liability is excluded from our fiscal 2018 non-GAAP EPS guidance for the same reason described above for historical non-GAAP measures. Projectedfiscal 2018 TNT Express integration expenses are excluded from our fiscal 2018 non-GAAP EPS guidance, projected fourth quarter fiscal 2018 non-GAAPconsolidated operating income and margin and FedEx Express segment operating margin for the same reasons described above for historical non-GAAP measures.
We are unable to predict the amount of the year-end MTM pension accounting adjustments, as they are significantly impacted by changes in interest rates and thefinancial markets, so such adjustments are not included in our fiscal 2018 non-GAAP EPS guidance or projected fourth quarter fiscal 2018 consolidated operatingincome or margin. For this reason, a full reconciliation of our fiscal 2018 non-GAAP EPS guidance and projected fourth quarter fiscal 2018 non-GAAPconsolidated operating income and margin to the most directly comparable GAAP measures is impracticable. It is reasonably possible, however, that our fourthquarter fiscal 2018 MTM pension accounting adjustments could have a material impact on our full-year and fourth quarter fiscal 2018 consolidated financialresults. The tables included below titled “Fiscal 2018 Earnings-Per-Share Outlook” and “Fourth Quarter Fiscal 2018 Outlook—FedEx Corporation” outline theimpact of the items that are excluded from our fiscal 2018 non-GAAP EPS guidance and projected fourth quarter fiscal 2018 non-GAAP consolidated operatingincome and margin, other than the year-end MTM pension accounting adjustments.
- more -
9
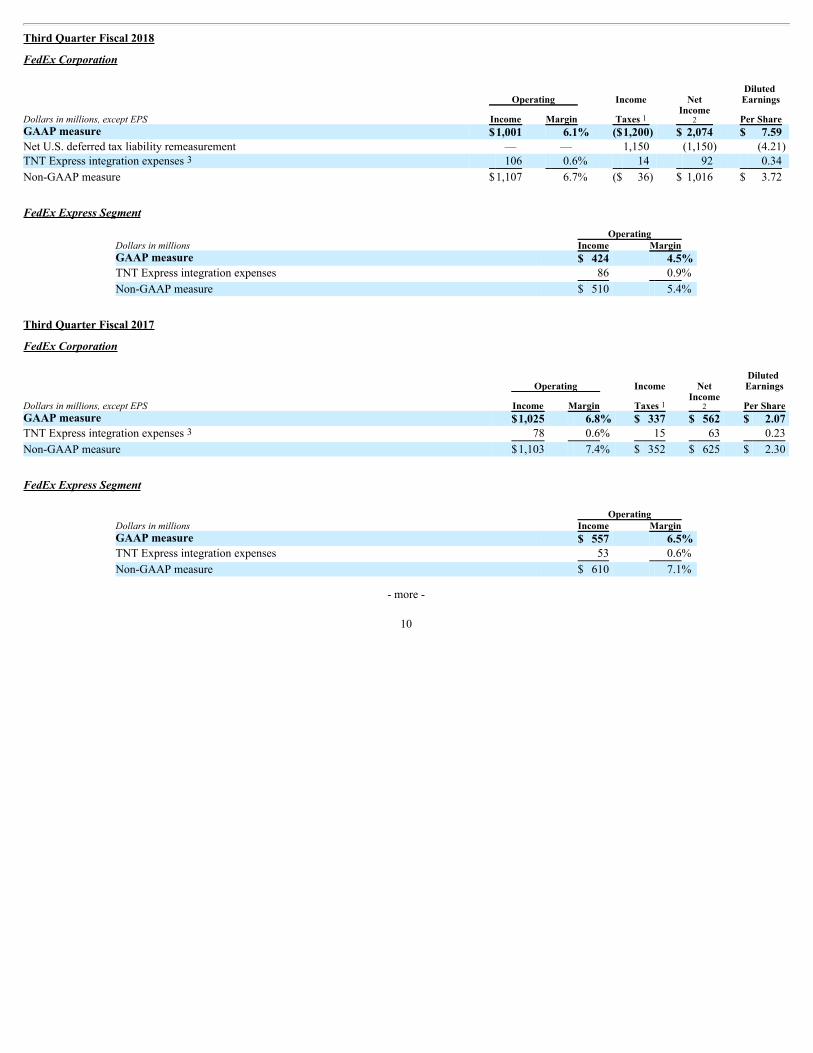
Third Quarter Fiscal 2018
FedEx Corporation Operating Income Net
Diluted Earnings
Dollars in millions, except EPS Income Margin Taxes 1 Income
2 Per Share GAAP measure $1,001 6.1% ($1,200) $ 2,074 $ 7.59 Net U.S. deferred tax liability remeasurement — — 1,150 (1,150) (4.21) TNT Express integration expenses 3 106 0.6% 14 92 0.34
Non-GAAP measure $1,107 6.7% ($ 36) $ 1,016 $ 3.72
FedEx Express Segment
Operating Dollars in millions Income Margin GAAP measure $ 424 4.5% TNT Express integration expenses 86 0.9%
Non-GAAP measure $ 510 5.4%
Third Quarter Fiscal 2017
FedEx Corporation Operating Income Net
Diluted Earnings
Dollars in millions, except EPS Income Margin Taxes 1 Income
2 Per Share GAAP measure $1,025 6.8% $ 337 $ 562 $ 2.07 TNT Express integration expenses 3 78 0.6% 15 63 0.23
Non-GAAP measure $1,103 7.4% $ 352 $ 625 $ 2.30
FedEx Express Segment
Operating Dollars in millions Income Margin GAAP measure $ 557 6.5% TNT Express integration expenses 53 0.6%
Non-GAAP measure $ 610 7.1%
- more -
10

Fiscal 2018 Earnings-Per-Share Outlook
Dollars in millions, except EPS Adjustments Diluted Earnings
Per ShareEarnings per diluted share before MTM pension accounting adjustments(non-GAAP) 4 $17.90 to $18.30
Net U.S. deferred tax liability remeasurement 1 ($ 1,150) (4.21)
TNT Express integration expenses $ 450 Income tax effect 1 (100)
Net of tax effect $ 350 1.29
FedEx Trade Networks legal matters $ 7 Income tax effect 1 (2)
Net of tax effect $ 5 0.02
Earnings per diluted share with adjustments (non-GAAP) 4 $15.00 to $15.40
Fourth Quarter Fiscal 2018 Outlook
FedEx Corporation
OperatingDollars in millions Income MarginOperating results before MTM pension accounting adjustments (non-GAAP) 4 $1,840 to $1,940 10.4% to 11.1%TNT Express integration expenses 3 110 0.6% to 0.7%
Operating results excluding TNT Express integration expenses (non-GAAP) 4 $1,950 to $2,050 11.0% to 11.8%
FedEx Express Segment
Operating
MarginGAAP measure 9.1% to 9.6%TNT Express integration expenses 0.8%
Non-GAAP measure 9.9% to 10.4%
Notes:
1 – Income taxes are based on the company’s approximate statutory tax rates, and for fiscal 2018, give consideration to the effects of the TCJA on the fiscal2018 rates.
2 – Effect of “Total other (expense) income” on net income amount not shown.3 – These expenses are recognized at FedEx Corporate and FedEx Express.4 – The year-end MTM pension accounting adjustments, which are impracticable to calculate at this time, are excluded.
* * *
11

FEDEX CORP. FINANCIAL HIGHLIGHTS
Third Quarter Fiscal 2018(In millions, except earnings per share)
(Unaudited) Three Months Ended Nine Months Ended February 28 February 28 2018 2017 % 2018 2017 % Revenue:
FedEx Express segment $ 9,370 $ 8,569 9% $27,376 $25,671 7% FedEx Ground segment 5,222 4,688 11% 14,790 13,397 10% FedEx Freight segment 1,694 1,492 14% 5,208 4,747 10% FedEx Services segment 397 389 2% 1,213 1,198 1% Eliminations and other (157) (141) NM (451) (422) NM
Total Revenue 16,526 14,997 10% 48,136 44,591 8%
Operating Expenses: Salaries and employee benefits 5,981 5,395 11% 17,241 16,059 7% Purchased transportation 3,935 3,498 12% 11,220 10,169 10% Rentals and landing fees 873 834 5% 2,526 2,426 4% Depreciation and amortization 786 762 3% 2,293 2,241 2% Fuel 914 735 24% 2,435 2,043 19% Maintenance and repairs 628 588 7% 1,968 1,765 12% Other 2,408 2,160 11% 7,073 6,432 10%
Total Operating Expenses 15,525 13,972 11% 44,756 41,135 9%
Operating Income: FedEx Express segment 424 557 (24%) 1,574 1,873 (16%) FedEx Ground segment 634 515 23% 1,781 1,590 12% FedEx Freight segment 55 41 34% 349 264 32% Eliminations, corporate and other (112) (88) NM (324) (271) NM
Total Operating Income 1,001 1,025 (2%) 3,380 3,456 (2%)
Other Income (Expense): Interest, net (125) (122) NM (363) (354) NM Other, net (2) (4) NM (22) 17 NM
Total Other Expense (127) (126) NM (385) (337) NM Pretax Income 874 899 (3%) 2,995 3,119 (4%) Provision for Income Taxes (1,200) 337 NM (450) 1,142 NM
Net Income $ 2,074 $ 562 269% $ 3,445 $ 1,977 74%
Diluted Earnings Per Share $ 7.59 $ 2.07 267% $ 12.63 $ 7.31 73%
Weighted Average Common and Common Equivalent Shares 273 271 1% 272 270 1% Capital Expenditures $ 1,372 $ 1,109 24% $ 3,994 $ 3,790 5%
12

FEDEX CORP. CONDENSED CONSOLIDATED BALANCE SHEETS
Third Quarter Fiscal 2018(In millions)
Feb. 28, 2018 (Unaudited) May 31, 2017 ASSETS
Current Assets Cash and cash equivalents $ 2,789 $ 3,969 Receivables, less allowances 8,671 7,599 Spare parts, supplies and fuel, less allowances 523 514 Prepaid expenses and other 1,592 546
Total current assets 13,575 12,628 Property and Equipment, at Cost 54,377 50,626 Less accumulated depreciation and amortization 26,680 24,645
Net property and equipment 27,697 25,981
Other Long-Term Assets Goodwill 7,464 7,154 Other assets 3,115 2,789
Total other long-term assets 10,579 9,943
$ 51,851 $ 48,552
LIABILITIES AND STOCKHOLDERS’ INVESTMENT
Current Liabilities Short-term borrowings $ 799 $ — Current portion of long-term debt 764 22 Accrued salaries and employee benefits 1,945 1,914 Accounts payable 3,102 2,752 Accrued expenses 2,893 3,230
Total current liabilities 9,503 7,918
Long-Term Debt, Less Current Portion 16,017 14,909
Other Long-Term Liabilities Deferred income taxes 2,401 2,485 Pension, postretirement healthcare and other benefit obligations 2,181 4,487 Self-insurance accruals 1,715 1,494 Deferred lease obligations 532 531 Deferred gains, principally related to aircraft transactions 124 137 Other liabilities 484 518
Total other long-term liabilities 7,437 9,652
Commitments and Contingencies
Common Stockholders’ Investment Common stock, $0.10 par value, 800 million shares authorized 32 32 Additional paid-in capital 3,085 3,005 Retained earnings 23,710 20,833 Accumulated other comprehensive loss (357) (415) Treasury stock, at cost (7,576) (7,382)
Total common stockholders’ investment 18,894 16,073
$ 51,851 $ 48,552
13

FEDEX CORP. CONDENSED CONSOLIDATEDSTATEMENTS OF CASH FLOWS
Third Quarter Fiscal 2018(In millions)(Unaudited)
Nine Months Ended February 28 2018 2017 Operating Activities:
Net income $ 3,445 $ 1,977 Noncash charges:
Depreciation and amortization 2,293 2,241 Other, net (602) 712
Gain from sale of an investment — (35) Changes in operating assets and liabilities, net (3,974) (2,250)
Net cash provided by operating activities 1,162 2,645
Investing Activities: Capital expenditures (3,994) (3,790) Business acquisitions, net of cash acquired (44) — Proceeds from asset dispositions and other 21 123
Net cash used in investing activities (4,017) (3,667)
Financing Activities: Proceeds from short-term borrowings, net 797 — Principal payments on debt (31) (49) Proceeds from debt issuances 1,481 1,190 Proceeds from stock issuances 284 265 Dividends paid (402) (319) Purchase of treasury stock (558) (358) Other, net 6 2
Cash provided by financing activities 1,577 731
Effect of exchange rate changes on cash 98 (70)
Net decrease in cash and cash equivalents (1,180) (361)
Cash and cash equivalents at beginning of period 3,969 3,534
Cash and cash equivalents at end of period $ 2,789 $ 3,173
14

FEDEX EXPRESS SEGMENT FINANCIAL HIGHLIGHTS
Third Quarter Fiscal 2018(Dollars in millions)
(Unaudited) Three Months Ended Nine Months Ended February 28 February 28 2018 2017 % 2018 2017 % Revenues:
Package Revenue: U.S. Overnight Box $1,836 $1,742 5% $ 5,373 $ 5,173 4% U.S. Overnight Envelope 435 422 3% 1,317 1,287 2%
Total U.S. Overnight 2,271 2,164 5% 6,690 6,460 4% U.S. Deferred 996 954 4% 2,796 2,598 8%
Total U.S. Package Revenue 3,267 3,118 5% 9,486 9,058 5%
International Priority 1,813 1,667 9% 5,393 5,144 5% International Economy 793 692 15% 2,378 2,101 13%
Total International Export Package 2,606 2,359 10% 7,771 7,245 7% International Domestic 1 1,128 1,033 9% 3,386 3,136 8%
Total Package Revenue 7,001 6,510 8% 20,643 19,439 6% Freight Revenue:
U.S. 739 667 11% 2,040 1,895 8% International Priority 551 471 17% 1,581 1,396 13% International Economy 492 437 13% 1,354 1,265 7% International Airfreight 86 84 2% 259 270 (4%)
Total Freight Revenue 1,868 1,659 13% 5,234 4,826 8% Other Revenue 2 501 400 25% 1,499 1,406 7%
Total Express Revenue $9,370 $8,569 9% $27,376 $25,671 7% Operating Expenses:
Salaries and employee benefits 3,484 3,170 10% 10,001 9,393 6% Purchased transportation 1,478 1,286 15% 4,346 3,963 10% Rentals and landing fees 532 511 4% 1,520 1,483 2% Depreciation and amortization 425 420 1% 1,254 1,252 — Fuel 782 633 24% 2,088 1,753 19% Maintenance and repairs 420 386 9% 1,327 1,158 15% Intercompany charges 528 473 12% 1,521 1,403 8% Other 1,297 1,133 14% 3,745 3,393 10%
Total Operating Expenses 8,946 8,012 12% 25,802 23,798 8%
Operating Income $ 424 $ 557 (24%) $ 1,574 $ 1,873 (16%)
Operating Margin 4.5% 6.5% (2.0 pts) 5.7% 7.3% (1.6 pts) 1 - International Domestic revenues represent international intra-country operations.2 - Includes FedEx Trade Networks.
15

FEDEX EXPRESS SEGMENT OPERATING HIGHLIGHTS
Third Quarter Fiscal 2018(Unaudited)
Three Months Ended Nine Months Ended February 28 February 28 2018 2017 % 2018 2017 % PACKAGE STATISTICS 1
Average Daily Package Volume (000s): U.S. Overnight Box 1,315 1,322 (1%) 1,249 1,286 (3%) U.S. Overnight Envelope 541 549 (1%) 548 559 (2%)
Total U.S. Overnight Package 1,856 1,871 (1%) 1,797 1,845 (3%) U.S. Deferred 1,026 1,025 — 946 904 5%
Total U.S. Domestic Package 2,882 2,896 — 2,743 2,749 —
International Priority 529 535 (1%) 525 522 1% International Economy 266 253 5% 265 250 6%
Total International Export Package 795 788 1% 790 772 2% International Domestic 2 2,445 2,471 (1%) 2,447 2,391 2%
Total Average Daily Packages 6,122 6,155 (1%) 5,980 5,912 1%
Yield (Revenue Per Package): U.S. Overnight Box $ 22.53 $ 21.24 6% $ 22.64 $ 21.17 7% U.S. Overnight Envelope 12.97 12.41 5% 12.64 12.12 4%
U.S. Overnight Composite 19.74 18.65 6% 19.59 18.43 6% U.S. Deferred 15.66 15.00 4% 15.56 15.13 3%
U.S. Domestic Composite 18.29 17.36 5% 18.20 17.34 5%
International Priority 55.26 50.28 10% 54.06 51.82 4% International Economy 48.01 44.05 9% 47.24 44.24 7%
Total International Export Composite 52.83 48.27 9% 51.77 49.37 5% International Domestic 2 7.44 6.74 10% 7.29 6.90 6%
Composite Package Yield $ 18.45 $ 17.06 8% $ 18.17 $ 17.31 5%
FREIGHT STATISTICS 1
Average Daily Freight Pounds (000s): U.S. 8,757 8,458 4% 8,311 8,231 1% International Priority 5,430 5,238 4% 5,342 5,145 4% International Economy 13,209 12,578 5% 12,215 12,095 1% International Airfreight 1,757 1,995 (12%) 1,850 1,941 (5%)
Total Avg Daily Freight Pounds 29,153 28,269 3% 27,718 27,412 1%
Revenue Per Freight Pound: U.S. $ 1.36 $ 1.27 7% $ 1.29 $ 1.21 7% International Priority 1.64 1.45 13% 1.56 1.43 9% International Economy 0.60 0.56 7% 0.58 0.55 5% International Airfreight 0.78 0.68 15% 0.74 0.73 1%
Composite Freight Yield $ 1.02 $ 0.95 7% $ 0.99 $ 0.93 6%
Operating Weekdays 62 62 — 190 190 —
1 - Package and freight statistics do not include FedEx Trade Networks.2 - International Domestic represents international intra-country operations.
16

FEDEX GROUND SEGMENT FINANCIAL AND OPERATING HIGHLIGHTS
Third Quarter Fiscal 2018(Dollars in millions)
(Unaudited) Three Months Ended Nine Months Ended February 28 February 28 2018 2017 % 2018 2017 % FINANCIAL HIGHLIGHTS
Revenues: FedEx Ground $ 4,824 $ 4,296 12% $13,586 $12,202 11% FedEx Supply Chain 398 392 2% 1,204 1,195 1%
Total Revenues 5,222 4,688 11% 14,790 13,397 10%
Operating Expenses: Salaries and employee benefits 956 834 15% 2,711 2,420 12% Purchased transportation 2,235 2,015 11% 6,194 5,568 11% Rentals 209 197 6% 617 567 9% Depreciation and amortization 187 177 6% 537 508 6% Fuel 4 3 33% 10 8 25% Maintenance and repairs 82 83 (1%) 249 237 5% Intercompany charges 371 330 12% 1,087 983 11% Other 544 534 2% 1,604 1,516 6%
Total Operating Expenses 4,588 4,173 10% 13,009 11,807 10%
Operating Income $ 634 $ 515 23% $ 1,781 $ 1,590 12%
Operating Margin 12.1% 11.0% 1.1 pts 12.0% 11.9% 0.1 pts
OPERATING STATISTICS 1
Operating Weekdays 62 62 — 190 190 — Average Daily Package Volume (000s) 8,993 8,522 6% 8,408 7,963 6% Yield (Revenue Per Package) $ 8.64 $ 8.12 6% $ 8.49 $ 8.05 5% 1 - Operating statistics include only the operations of FedEx Ground (including FedEx SmartPost).
17

FEDEX FREIGHT SEGMENT FINANCIAL AND OPERATING HIGHLIGHTS
Third Quarter Fiscal 2018(Dollars in millions)
(Unaudited) Three Months Ended Nine Months Ended February 28 February 28 2018 2017 % 2018 2017 % FINANCIAL HIGHLIGHTS
Revenue $ 1,694 $ 1,492 14% $ 5,208 $ 4,747 10% Operating Expenses:
Salaries and employee benefits 825 733 13% 2,455 2,266 8% Purchased transportation 263 230 14% 792 739 7% Rentals 41 36 14% 114 101 13% Depreciation and amortization 77 69 12% 219 199 10% Fuel 127 99 28% 336 282 19% Maintenance and repairs 52 50 4% 169 159 6% Intercompany charges 130 120 8% 384 370 4% Other 124 114 9% 390 367 6%
Total Operating Expenses 1,639 1,451 13% 4,859 4,483 8%
Operating Income $ 55 $ 41 34% $ 349 $ 264 32%
Operating Margin 3.2% 2.7% 0.5 pts 6.7% 5.6% 1.1 pts
OPERATING STATISTICS
LTL Operating Weekdays 62 62 — 189 189 — Average Daily LTL Shipments (000s)
Priority 69.7 65.6 6% 73.5 70.3 5% Economy 30.6 29.0 6% 31.5 30.9 2%
Total Average Daily LTL Shipments 100.3 94.6 6% 105.0 101.2 4% Weight Per LTL Shipment (lbs)
Priority 1,232 1,179 4% 1,205 1,173 3% Economy 1,133 1,155 (2%) 1,144 1,121 2%
Composite Weight Per LTL Shipment 1,202 1,172 3% 1,187 1,157 3% LTL Revenue/Shipment
Priority $242.49 $224.63 8% $233.31 $220.64 6% Economy 295.31 272.74 8% 285.99 262.72 9%
Composite LTL Revenue/Shipment $259.20 $239.82 8% $249.32 $233.64 7% LTL Revenue/CWT
Priority $ 19.67 $ 19.06 3% $ 19.37 $ 18.81 3% Economy 26.07 23.61 10% 24.99 23.44 7%
Composite LTL Revenue/CWT $ 21.56 $ 20.47 5% $ 21.01 $ 20.19 4%
18