fedex annual reports 2001
TRANSCRIPT

FedExCorporation
2001AnnualReport
FedEx Corporation 2001 Annual Report

FedEx Corporation
1. Financial Highlights 2. Message from the CEO 6. Message from the CFO7. Financial Information 35. Directors 36. Officers 37. Corporate Information
Only FedEx could create an industry, then 28 years later, grow into so much more than an “overnight” success.
Today, only FedEx offers dedicated networks for express, ground, freight, expedited delivery and unique tradeservices – when customers need greater choice and flexibility in managing their supply chains.
Only FedEx delivers industry-leading, on-time service levels – when time is literally money.
Only FedEx provides the right level of information intensity – when information about the package is still asimportant as delivery of the package itself.
In FY01, only FedEx had the vision to acquire American Freightways – one of the nation’s premier regional, less-than-truckload freight carriers. With the acquisition, we formed FedEx Freight to oversee both AmericanFreightways and Viking Freight.
During a period of challenge and change, only FedEx remains focused on a unique business model – to operateeach company independently, focused on the distinct needs of each customer segment, but also to competecollectively, leveraging our greatest strengths, the power of the FedEx brand and information technology.That’s why FedEx continues to deliver value for our shareowners, meaningful solutions for our customersand continued opportunity for our employees.
Consolidated sales, marketing and technology support
Time-definite, global express package and freight delivery
Small-package ground services, including FedEx Home Delivery
Regional less-than-truckload freight services
Exclusive-use, expedited, door-to-door delivery
Customs brokerage and trade facilitation solutions

11
In thousands, except earnings per share 2001 2000 Percent Change
OPERATING RESULTS
Revenues $19,629,040 $18,256,945 + 8Operating income 1,070,890 1,221,074 –12Operating margin 5.5% 6.7%Net income 584,371 688,336 –15Earnings per share, assuming dilution $ 1.99 $ 2.32 –14Earnings per share, excluding nonrecurring items, assuming dilution(1) $ 2.26 $ 2.32 – 3Cash earnings per share, assuming dilution(2) $ 6.34 $ 6.22 + 2Average common and common equivalent shares 293,179 296,326 – 1EBITDA(3) $ 2,347,300 $ 2,398,663 – 2Capital expenditures(4) $ 1,893,384 $ 1,991,600 – 5
FINANCIAL POSITION
Total assets $13,340,012 $11,527,111 +16Long-term debt 2,121,511 1,782,790 +19Common stockholders’ investment 5,900,420 4,785,243 +23
(1) Nonrecurring items include primarily noncash charges of $124 million ($78 million after tax or $0.27 per diluted share) associated with the curtailing of certain aircraft modificationand development programs and reorganizing operations at FedEx Supply Chain Services, Inc.
(2) Net income plus depreciation and amortization divided by average common equivalent shares.(3) Represents earnings before interest, taxes, depreciation and amortization.(4) Represents actual cash expenditures plus the equivalent amount of cash that would have been expended for the acquisition of assets (principally aircraft), whose use was
obtained through long-term operating leases entered into during the period.
FINANCIAL HIGHLIGHTS
$16.8$15.9$18.3
$19.6
01009998
REVENUES (in billions) RETURN ON AVERAGE EQUITY
14.6%13.5%
14.6%
10.9%
01009998
EARNINGS PER SHARE
$2.10
$1.69
$2.32$1.99
01009998
DEBT TO TOTAL CAPITALIZATION
22.8%
29.3%27.1% 26.4%
01009998
EBITDA (in billions)
$2.2$2.0
$2.4 $2.3
01009998
(3)CAPITAL EXPENDITURES (in billions)
$2.3$2.3$2.0 $1.9
01009998
(4)

June 5FedEx Corp. relaunchesfedex.com to integrate expressand ground functionality.
2
MESSAGE FROM THE CEO
July 8FedEx Express and FedEx Home Delivery make e-commerce history with first-day delivery of 250,000 Harry Potter books for Amazon.com.
July 31FedEx Custom Criticalacquires Passport Transport.
DEAR FELLOW SHAREOWNERS,
The current economic downturn hit almost without warning, leading experts from Wall Street to Main Street to search for easyexplanations. But, at FedEx, we know that a time of great chal-lenge is also a time of great opportunity, a time to step back andtake a look at the larger perspective.
In any annual report, the consolidated financial results capturejust one snapshot in time. But there’s a larger FedEx picture herefor fiscal year 2001 – a picture of solid first-half revenue growth,improved cash flows and effective yield management.
FY01 Financial Results
To view this big picture, look behind the numbers for the full yearended May 31, 2001, and examine the breakdowns for the firstand second half:
• Annual revenue increased 8% to a record $19.6 billion, fueled byfirst-half revenue growth of 9%. Second-half revenue was alsoabove year-ago levels, but grew at a slower 6% pace.
• Net income decreased 15% to $584 million for the year, despite a first-half increase of 10%. In the second half, net incomedropped 38%.
• Earnings per share of $1.99 included a first-half contribution of$1.25, up 15% over the prior year. The second-half contributiondeclined 39% causing EPS to fall 14% for the full year.
The question is clear: What happened between the first and sec-ond half? Certainly, the second-half numbers include one-timecharges associated with curtailing certain aircraft modificationand development programs and reorganizing operations at FedExSupply Chain Services. But larger issues are also at play.
Slowing Consumer Demand
Historically, times of economic slowdown can be traced to a fun-damental imbalance between supply and demand. Our currenteconomic situation is no exception.
After strong growth in consumer demand over a number of years –particularly the demand for high-tech goods – many companiesramped up supply only to discover that demand had droppedsharply. In some cases, faulty business models collapsed entirely.But the result was historically familiar – inventory oversupply ledto increased obsolescence. For FedEx companies, that translatedto softer demand for transportation and, specifically, for expresstransportation tied to the high-tech and durable goods sectors.
2000
Sept 12FedEx Express signs aEuropean operationalagreement with La Poste.
Sept 18FedEx Ground opensNortheast Super Hub inWoodbridge, N.J.
Aug 28FedEx Express boosts globalnetwork with new Europe andAsia connections.
Nov 12FedEx Corp. agrees to acquireAmerican Freightways, whichwill be teamed with VikingFreight to form FedEx Freight.

3
Feb 6FedEx Ground extends FedExHome Delivery coverage to70% of the U.S. population.
In the second half of this fiscal year, the U.S. economy fell harderthan we expected, and the domestic downturn had a ripple effect on select international markets, particularly Asia, which is heavily integrated into U.S. high-tech manufacturing.
It was a wild ride on the economic pendulum, swinging from thepromise of the new Digital Economy back to an Industrial Economyin a cyclical correction. Now, we find that pendulum moving backtoward the center as excess is wrung out of the inventory buildupof last year and as manufacturers begin to come back into balance.
The shakeout in the “dot-com” sector and the rationalization of a number of overbuilt sectors seem largely behind us now.
When the economy picks up – hopefully sooner rather than later –FedEx customers can take advantage of the upturn by selectingthe right mode of transportation with the right level of informa-tion intensity. By better managing both the supply chain and thedemand cycle, we can all manage our way back to growth in ahealthy economy.
A Fiscally Responsible FedEx
How did FedEx continue to increase revenue and yields in this difficult economy? With prudent financial management through
pricing as well as customer and product mix. In addition, wedeferred or cut capital spending and imposed very diligent inter-nal cost controls on travel, entertainment, outside services, newhires and other discretionary spending. Given the slowdown involume, we began to “right-size” our transportation networks,making sure that we don’t carry excess capacity any more thanour customers carry obsolete inventory.
All the while, we remained focused on the five growth strategiesthat we presented to employees beginning in September 2000:
• Grow our core transportation business.• Grow internationally.• Grow our logistics and supply chain offerings.• Grow through e-commerce.• Grow through new services or alliances.
It may sound incongruous to be focused on growth during an eco-nomic decline, but our real challenge is to respond to temporarymarket corrections without sacrificing long-term opportunity. Oneyear of soft results will not change our commitment to growth ordeter us from our goals – improving EPS by 10% to 15% per year,increasing cash flow, improving margins and increasing our returnon capital. In this regard, we will continue to manage our revenuebased not just on volume but on yield as well.
Apr 18FedEx Ground, AmericanFreightways and Viking Freight win NASSTRAC’sCarrier of the Year Award fortheir respective markets.
2001
Jan 10FedEx Express enters into twolandmark service agreementswith the U.S. Postal Service.
Feb 26FedEx Express extends shipping times for customersin many major markets withits FedEx Extra HoursSM service.
Jan 16FedEx Express announces plan to become a launch customer forAirbus A380-800F.
Apr 2FedEx Express initiates an additional China frequency, for a total of 11 weekly flights.
Mar 23FedEx Ground awarded ISO9002 registration, joining FedExExpress and FedEx Services asa bearer of the worldwide ISOquality standard.

4
The Diversified FedEx Portfolio
Perhaps the most significant difference in our response to thiseconomic slowdown versus the 1990–91 recession is a simplefact: FedEx is not the same company we were then. In 1991, wewere a $7.7 billion business focused exclusively on express trans-portation. Our international network was incomplete. While wehad made significant investments in technology, the Internet aswe know it did not exist.
Today, FedEx has expanded and diversified its portfolio to com-pete across a wide spectrum of the transportation market. FedExoffers the broadest range of transportation, logistics and infor-mation services of any company, anywhere – express, ground,freight and even expedited delivery. And we’ve leveraged thestrength of that portfolio over the past year.
When U.S. demand for FedEx Express transportation began towane in the second half of last year, the FedEx Ground businesscontinued to grow. In February, we completed the acquisition ofAmerican Freightways and created FedEx Freight, which over-sees our regional less-than-truckload freight services, includingViking Freight in the western United States. No competitor canmatch the scope and breadth of our transportation services ingeneral and our freight offering in particular.
Our FY01 performance, even during tough economic times, con-firms that the FedEx philosophy of operating independently andcompeting collectively is working, particularly the adjustmentswe made in January 2000, when we rebranded our major operat-ing companies and reorganized to better meet customer needs.It’s clear now that our customers are responding positively tothese strategic changes.
Strong Customer Relationships
When the Smithsonian Institution’s National Zoological Parkneeded reliable delivery of two pandas from China, FedEx was theobvious choice. When Ford Motor Company needed around-the-clock, critical-parts support for its commercial truck customers,FedEx won the business. Wal-Mart, Compaq, General Motors andother valued customers have recently honored FedEx companiesas “carrier of the year.”
In January, we announced major new service agreementsbetween FedEx and the U.S. Postal Service. In one agreement,FedEx Express agreed to provide air transportation for certainPostal Service products, beginning in August 2001. The U.S. PostalService also agreed to the placement of FedEx Drop Boxes outsideU.S. Post Offices nationwide, beginning in March 2001.
These landmark public-private agreements create a winning busi-ness alliance. The Postal Service wins with access to reliable,consolidated air transportation service. FedEx was the onlytransportation company with the capacity and expertise to makethat happen. FedEx wins by generating an estimated $7 billion inrevenue over the life of the seven-year contract. And the Americanpublic wins with greater choice, flexibility and convenience fortheir shipping needs.
Superior FedEx Technology
One interesting byproduct of the Postal Service business allianceis the advanced technology that will allow FedEx to scan andread postal bar codes. It’s in keeping with our customer-focusedtechnology – helping our customers link seamlessly to the FedExsystem and use information to help manage their business.
The FedEx Web site (fedex.com) is one of the most renowned andeasiest to use, and we have continued to enhance our leading-edge, Internet technology. This year alone, we relaunched the site to integrate express and ground functionality, introduced apowerful suite of international shipping tools called FedEx GlobalTrade ManagerSM, opened the online market to small- andmedium-sized businesses with FedEx eCommerce Builder, andannounced the development of FedEx InSightSM to enhance ship-ment visibility and control for select customers.
For over two decades, FedEx has been the industry leader in cus-tomer automation, and now we’re moving from the desktop to thewireless environment. FedEx was the first transportation com-pany to be listed on the AT&T Digital PocketNet Service, and inthe coming months we plan to expand our wireless capabilities toimprove service and productivity.
As we’ve been saying since the late 1970s, the information abouta package is just as important as the delivery of the packageitself. That’s why FedEx is dedicated to integrated transportationand information services – so we can deliver meaningful solu-tions for customers in today’s complex business environment.
Unsurpassed Global Reach
FedEx entered this economic slowdown as a strong, diversifiedcompany – and we will come out even stronger. After all, weemerged from the 1998–99 “Asian Flu” as the leader in Hong Kong,Japan, Taiwan and Malaysia, in addition to our long-standingNo. 1 position in China, where we currently serve 190 cities with11 weekly flights.
Our two strongest international regions – Asia-Pacific andEurope – continued their growth trends during FY01. In Europe,

5
The FedEx physical network provides unsurpassed global reach,serving 211 countries with the most reliable service in the industry.
The FedEx technology network enables real-time information tohelp customers manage supply and demand on a global scale.
And, on a personal note, let me add that FedEx has the besthuman network anywhere – a culture long recognized as a greatplace to work with a passion for customer service. When I facedheart bypass surgery in late November, I knew that this companywould continue under the leadership of the strongest manage-ment team we’ve ever fielded – and that more than 215,000 employ-ees and contractors all around the world would always rise to anychallenge. I’d like to say, once more, a public “thank you” for theoverwhelming support that hastened my complete recovery.
It’s all about perspective. In a year when others faltered, FedExincreased revenue, improved yield-per-package and generated areturn for our shareowners. As soon as the imbalance of supplyand demand rights itself, FedEx will leverage the strength of ourglobal family of companies – and the strength of our customerrelationships – not just to resume our own record of profitablegrowth, but to help restore growth for our customers.
Frederick W. SmithChairman, President and Chief Executive Officer
annual volume growth of 24% held virtually steady from first halfto second half. In Asia, however, the economic slowdown wasapparent with 21% volume growth in the first half, slowing to just3% growth in the second half for an overall 12% annual growthrate. But, to stay focused on the larger picture, remember that theoperative word internationally is “growth” – and it continues tosurpass U.S. domestic volume gains.
As we focus on maximizing our global network and moving ourproduct mix more toward higher-yielding FedEx InternationalPriority® shipments, we are also looking ahead to future inter-national needs. In January, FedEx Express announced it intendsto acquire the Airbus A380-800F high-capacity, long-range air-craft, taking delivery beginning in 2008. The A380 will be capableof flying directly between Asia, Europe and U.S. hubs with nearlytwice the payload of current MD11 aircraft. Also in FY01, weadded our first converted MD10s to the domestic system, withmodifications to enhance mechanical reliability and to reconfig-ure the cockpit for two crew members instead of three. Bothchanges will help us run our global air system more efficientlywhile maintaining superior, on-time service for our customers.
What Happens Next?
Over the years, we have carefully diversified across globalregions and across transportation sectors to create a strong andgrowing FedEx. If there’s a secret to our success, it lies in our bal-anced physical, information and human networks.

6
MESSAGE FROM THE CFO
FedEx Corporation’s financial performance improved significantlyduring the first half of fiscal year 2001 as our new go-to-marketstrategies generated volume and yield growth at FedEx Expressand FedEx Ground. The second half of the year was more finan-cially challenging, however, as our package business wasseverely impacted by a rapidly slowing economy, particularly inthe high-tech and durable goods sectors. Despite these adverseeconomic conditions, we made considerable progress towardour financial goal of becoming cash flow positive. In fact, exclud-ing the costs associated with our acquisition of AmericanFreightways, we attained net cash flow positive status last yearas we pursued the following strategies:
Portfolio Expansion
The acquisition of American Freightways and the formation ofFedEx Freight expanded and enhanced our already formidablearsenal of supply chain solutions. Teamed with Viking Freight,the largest Western regional less-than-truckload carrier,American Freightways provides the perfect extension of ourincreasingly popular less-than-truckload offering to virtually allU.S. ZIP codes.
Yield Improvement
We continued to execute good yield management strategies inFY01 even with a weakening economy and a slowdown in volumegrowth. Package and freight yields improved as we continued to manage our rate levels, customer diversity and volume andfreight mix. Since our yields, especially at FedEx Express, are notquite as high as our primary competitor, we still have substantialopportunity to leverage our industry-leading service offeringsand powerful and trusted brand to grow yields, revenues andmargins as the economy improves.
Cost Containment
We are proud that we were able to contain costs last year whilestill providing the best service in the industry. Cost reductionprograms included a freeze on most hiring, substantially reduc-ing bonus incentive compensation related to profitability and a comprehensive reduction in discretionary expenses at alloperating companies. These steps will remain in place until ourprofitability returns to acceptable levels.
Capital Discipline
For the third year in a row, we managed to lower our capitalexpenditures as both a percentage of revenue and on anabsolute basis, while at the same time expanding our network and improving service. Because of the sluggish growth of the economy this past year, we thoroughly reviewed our long-termcapacity needs. As a result, we adjusted our aircraft programs tobetter match capacity to customer demand as well as maximizeprofitability now and in the future.
The outlook for FY02 is certainly challenging, but we will con-tinue our efforts to penetrate the small- and medium-sized customer base, develop our new alliance with the U.S. PostalService, expand our FedEx Home Delivery service and promoteour new FedEx Freight network. All the while, we will remainfocused on cost containment and capital expenditure disciplinein order to achieve positive cash flow. With the unmatched serv-ice of dedicated employees and contractors worldwide, we willcontinue to successfully overcome the challenges of today’s envi-ronment and position our company for future growth and superiormargins, returns and cash flows as the economy recovers.
Alan B. Graf, Jr.Executive Vice President and Chief Financial Officer

7
MANAGEMENT’S DISCUSSION AND ANALYSIS OF RESULTS OF OPERATIONS AND FINANCIAL CONDITION
RESULTS OF OPERATIONS
CONSOLIDATED RESULTS
The following table compares revenues, operating income, netincome and earnings per diluted share (in millions, except for pershare amounts) for the fiscal years ended May 31:
Percent Change2001/ 2000/
2001 2000 1999 2000 1999
Revenues $19,629 $18,257 $16,773 + 8 + 9Operating income 1,071 1,221 1,163 –12 + 5Net income 584 688 631 –15 + 9
Earnings per diluted share 1.99 2.32 2.10 –14 +10
Our results for 2001 reflect strong performance for the first half ofthe year, which was more than offset by the effects of weakenedeconomic conditions in the second half of the year. Operatingresults for 2001 also reflect charges of $124 million ($78 millionafter tax or $0.27 per diluted share) primarily related to noncashasset impairment charges at FedEx Express.
Revenue growth in 2001 included, among other things, the effectsof the acquisition of American Freightways, which added approxi-mately $630 million to 2001 revenues. Excluding the effects ofbusiness acquisitions in both years, revenues increased 3% for2001. This increase is largely due to the continued revenuegrowth of FedEx Express International Priority (IP) packages,although at a lower rate than that experienced in 2000. Despitethe negative economic effects on demand in the last half of theyear, double-digit volume growth rates during 2001 were experi-enced in the European and Asian markets. U.S. domestic packagevolume at FedEx Express declined slightly from 2000. Volumegrowth was slightly higher than 2000 at FedEx Ground, as thissubsidiary continued to grow its core business and expand itsFedEx Home Delivery service offering.
Effective February 1, 2001, FedEx Express implemented list rateincreases averaging 4.9% for shipments within the U.S. and 2.9%for U.S. export shipments. FedEx Ground also implemented a listrate increase of 3.1% on February 5, 2001. Increased product rev-enue per package (yield) for 2001 for most services included theeffects of these rate increases, the effects of fuel surcharges andother yield-management strategies, including a sales focus onhigher yielding business. These revenue increases were partiallyoffset by a decrease in other revenues, primarily decreased salesof engine noise reduction kits (hushkits) at FedEx Express.
As a result of sharply lower domestic volumes at FedEx Expressin the second half of 2001 and lowered growth forecasts, man-agement committed to eliminate certain excess aircraft capacityrelated to our MD10 program. The MD10 program upgrades andmodifies our older DC10 aircraft to make them more compatiblewith our newer MD11 aircraft. By curtailing the MD10 program,we will avoid approximately $1.1 billion of future capital expendi-tures over the next seven years. In addition, due to the bank-ruptcy of Ayres Corporation, we expensed deposits and relateditems in connection with the Ayres ALM 200 aircraft program. Wealso took actions to reorganize our FedEx Supply Chain Servicessubsidiary to eliminate certain unprofitable, nonstrategic logisticsbusiness and reduce its overhead. Following is a summary ofthese principally noncash charges (in millions) taken in the fourthquarter of 2001:
Impairment of certain assets related to the MD10 aircraft program $ 93Strategic realignment of logistics subsidiary 22Ayres program 9Total $124
In addition to the actions described above, we took other meas-ures during 2001, such as reducing variable compensation pro-grams, limiting staffing additions and lowering discretionaryspending, in an effort to better match our cost structure andcapacity to current business volumes.
Excluding the above charges and the effect of business acquisi-tions, operating income decreased 5% in 2001. Incrementallosses from the continued expansion of our FedEx Ground HomeDelivery service negatively affected operating income by $34 mil-lion in 2001.
Operating results also reflect the continuing implementation of the rebranding and reorganization initiatives begun in 2000.The sales, marketing and most of the information technologyfunctions of our two largest subsidiaries are now centralized inFedEx Services. We have substantially completed the expansionand retraining of our sales force, but continue to incur costsassociated with the retooling of our automation systems andvehicle and facilities rebranding. These costs were approximately$26 million for 2001.
Increased fuel prices negatively impacted year-over-yearexpenses by approximately $160 million for 2001, net of the effectsof jet fuel hedging contracts. In response to higher fuel costs, fuel surcharges have been implemented at all of our transpor-tation subsidiaries, including a 1.25% fuel surcharge that was

Management’s Discussion and Analysis
8
implemented at FedEx Ground on August 7, 2000 and a 4% fuelsurcharge, implemented in 2000, that was in place at FedExExpress throughout 2001. These surcharges offset the impact ofhigher fuel costs in 2001.
We received approximately $92 million in 2001 under jet fuel hedg-ing contracts. Due to slightly moderating fuel prices and the con-tinuation of our fuel surcharge program, we effectively closedour hedge positions by entering into offsetting jet fuel hedgingcontracts during the fourth quarter of 2001. We may, however,enter into jet fuel hedging contracts in the future.
During 2001, we formed a new segment specializing in theregional less-than-truckload (“LTL”) ground transportation offreight. FedEx Freight was formed in the third quarter of 2001 inconnection with the acquisition of American Freightways. Theacquisition was accounted for as a purchase and resulted in therecognition of approximately $600 million in goodwill. FedExFreight also includes Viking. The acquisition of AmericanFreightways was slightly accretive to 2001 earnings per dilutedshare. For further information regarding the acquisition, see“Liquidity” and Note 2 to our financial statements.
Our compensation programs include substantial cash incentiveplans, which are based on financial and operating performance.Results for 2001 included a reduction in operating costs related to such plans. Costs for pension and postretirement benefit pro-grams were approximately $70 million lower, due principally tohigher discount rates and improved asset performance in 2000.
As expected, operating profit from the sale of hushkits declined$40 million in 2001 to $8 million, following a decline of $50 millionin 2000.
For 2000, operating results reflected strong international volumeand yield growth. However, U.S. domestic package volume growthwas below that experienced in 1999. Significantly higher fuelprices resulted in an increase in fuel expense of $273 million, net of $18 million received under jet fuel hedging contracts. OnFebruary 1, 2000, management implemented a 3% fuel surcharge atFedEx Express in response to the higher fuel costs. EffectiveApril 1, 2000, the surcharge was increased to 4%. In the last half of2000, we began the major rebranding and reorganization initiativeof centralizing certain functions in order to enhance revenue growth
and improve financial returns. FedEx Home Delivery also was launched in March 2000. The rebranding and reorganization actionsand FedEx Home Delivery negatively affected 2000 operatingincome by approximately $21 million and $19 million, respectively.
Operating results for 1999 included $81 million in operatingexpenses associated with strike contingency planning duringcontract negotiations between FedEx Express and the FedexPilots Association (“FPA”). To avoid service interruptions relatedto a threatened strike, we began strike contingency planning,including entering into agreements for additional third-party airand ground transportation and establishing special financingarrangements. Negotiations with the FPA ultimately resulted in afive-year collective bargaining agreement that took effect onMay 31, 1999.
Other Income and Expense and Income Taxes
For 2001, net interest expense increased 36% due to higher bor-rowings that were primarily incurred as a result of the prior yearstock repurchase program and additional debt incurred for theAmerican Freightways acquisition. Net interest expenseincreased 8% for 2000, due to higher average debt levels, pri-marily incurred as a result of our stock repurchase program, busi-ness acquisitions and bond redemptions.
Other, net in 2000 included gains of approximately $12 million froman insurance settlement for a destroyed MD11 aircraft andapproximately $11 million from the sale of securities.
Our effective tax rate was 37.0% in 2001, 39.5% in 2000 and 40.5%in 1999. The 37.0% effective tax rate in 2001 was lower than the2000 effective rate primarily due to the utilization of excess for-eign tax credits. Generally, the effective tax rate exceeds thestatutory U.S. federal tax rate because of state income taxes andother factors as identified in Note 9 to our financial statements.For 2002, we expect the effective tax rate to be in the approximaterange of 38.0% to 39.0%.
Outlook
Although management believes that the current economic down-turn is largely cyclical, we expect it to persist at least through thefirst half of 2002. We plan to align capital spending with operating

FedEx Corporation
9
cash flow, continue strict controls over discretionary spendingand implement other measures to reduce commitments for liftcapacity in excess of our needs (see “FedEx Express – Outlook”).
Cash incentive programs for 2002 have been substantiallyreduced for most employees, including all members of seniormanagement, and these programs will begin to pay out only if weexceed our 2002 financial targets. However, anticipated reduc-tions in 2002 incentive costs are expected to be offset by higherpension expense resulting from changes in discount rates andunrealized market declines in pension assets.
Despite the near-term economic outlook, we continue to believethat we are well positioned for long-term growth. In January 2001,FedEx Express entered into a business alliance with the U.S.Postal Service, which is expected to generate revenue of approx-imately $7 billion over seven years and is consistent with ourgoals of improving margins, cash flows and returns. The allianceconsists of two service agreements. In the first nonexclusiveagreement, FedEx Express will install drop boxes at U.S. PostOffices, and in the second agreement, FedEx Express will provideairport-to-airport transportation of Priority, Express and FirstClass Mail. On June 18, 2001, we officially launched the nationalrollout of FedEx Drop Boxes at post offices throughout the coun-try, implementing the first of these service agreements. FedExExpress is scheduled to begin the agreement for air transporta-tion in late August 2001. In 2002, we will also continue the busi-ness alliance in Europe with La Poste, established in 2001.
The acquisition of American Freightways substantially enhancedour overall transportation portfolio by enabling us to offer aregional LTL service virtually everywhere in the United States.During 2002, we will focus on increasing volumes and yields inour core high-quality next- and second-day regional freight serv-ices. In addition, we will continue to expand our FedEx HomeDelivery network and will continue to pursue new service andbusiness opportunities, such as those mentioned above, in sup-port of our long-term growth goals.
Actual results for 2002 will depend upon a number of factors,including the extent and duration of the current economic down-turn, our ability to match capacity with volume levels and our abil-ity to effectively implement our new service and growth initiatives.See “Forward-Looking Statements” for a more complete descrip-tion of potential risks and uncertainties that could affect ourfuture performance.
Recent Accounting Pronouncements
We adopted Statement of Financial Accounting StandardsNo. (“SFAS”) 133, “Accounting for Derivative Instruments andHedging Activities” (as amended by SFAS 137 and SFAS 138) atthe beginning of 2002. The adoption of this Statement will nothave a material effect on our financial position or results of oper-ations for 2002. Because of our previously mentioned fourth quar-ter 2001 actions regarding jet fuel hedging contracts, none of thejet fuel hedging contracts held at May 31, 2001 qualify for hedgeaccounting treatment. However, our usual jet fuel hedging pro-gram does qualify for cash flow hedge accounting treatmentunder which changes in the fair market value of these contractsare recorded to Accumulated Other Comprehensive Income.
During July 2001, SFAS 142, “Goodwill and Other IntangibleAssets” was issued by the Financial Accounting StandardsBoard. Under SFAS 142, goodwill amortization ceases when thenew standard is adopted. The new rules also require an initialgoodwill impairment assessment in the year of adoption andannual impairment tests thereafter. We are permitted under therules to adopt this Statement effective June 1, 2001 or deferadoption until June 1, 2002. Once adopted, goodwill amortizationof approximately $36 million on an annualized basis will cease.We have not yet determined if any impairment charges will resultfrom the adoption of this Statement. At this time, we anticipatethe adoption of these rules, effective as of June 1, 2001.
REPORTABLE SEGMENTS
The formation of FedEx Services, effective June 1, 2000, changedthe way certain costs are captured and allocated between ouroperating segments. For example, salaries, wages and benefits,depreciation and other costs for the sales, marketing and infor-mation technology departments previously incurred at FedExExpress and FedEx Ground are now allocated to these operatingsegments and are included in the line item “Intercompanycharges” on the accompanying financial summaries of ourreportable segments. Consequently, certain segment expensedata presented is not comparable to prior periods. We believe thetotal amounts allocated to the business segments reasonablyreflect the cost of providing such services.

Management’s Discussion and Analysis
10
FEDEX EXPRESS
The following table compares revenues and operating income (in millions) and selected statistics (in thousands, except dollar amounts)for the years ended May 31:
Percent Change2001/ 2000/
2001 2000(1) 1999(1) 2000 1999
Revenues:Package:
U.S. overnight box(2) $ 5,830 $ 5,684 $ 5,409 + 3 + 5U.S. overnight envelope(3) 1,871 1,854 1,776 + 1 + 4U.S. deferred 2,492 2,428 2,271 + 3 + 7
Total domestic package revenue 10,193 9,966 9,456 + 2 + 5
International Priority (IP) 3,940 3,552 3,019 +11 +18Total package revenue 14,133 13,518 12,475 + 5 + 8
Freight:U.S. 651 566 440 +15 +29International 424 492 531 –14 – 7
Total freight revenue 1,075 1,058 971 + 2 + 9Other 326 492 533 –34 – 8
Total revenues $15,534 $15,068 $13,979 + 3 + 8
Operating expenses:Salaries and employee
benefits 6,301Purchased transportation 584Rentals and landing fees 1,419Depreciation and
amortization 797Fuel 1,063Maintenance and repairs 968Intercompany charges 1,317Other(4) 2,238
Total operating expenses 14,687 14,168 13,108 + 4 + 8
Operating income $ 847 $ 900 $ 871 – 6 + 3
Percent Change2001/ 2000/
2001 2000 1999 2000 1999
Package:Average daily packages:
U.S. overnight box 1,264 1,249 1,207 + 1 + 3U.S. overnight envelope 757 771 750 – 2 + 3U.S. deferred 899 916 894 – 2 + 3
Total domestic packages 2,920 2,936 2,851 – 1 + 3
IP 346 319 282 + 8 +13Total packages 3,266 3,255 3,133 – + 4
Revenue per package (yield):U.S. overnight box $18.09 $17.70 $17.51 + 2 + 1U.S. overnight
envelope 9.69 9.36 9.24 + 4 + 1U.S. deferred 10.87 10.31 9.93 + 5 + 4
Domestic composite 13.69 13.21 12.96 + 4 + 2
IP 44.70 43.36 41.87 + 3 + 4Composite 16.97 16.16 15.56 + 5 + 4
Freight:Average daily pounds:
U.S. 4,337 4,693 4,332 – 8 + 8International 2,208 2,420 2,633 – 9 – 8
Total freight 6,545 7,113 6,965 – 8 + 2
Revenue per pound (yield):U.S. $ .59 $ .47 $ .40 +26 +18International .75 .79 .79 – 5 –
Composite .64 .58 .54 +10 + 7
(1) Operating expense detail for 2000 and 1999 has been omitted, as this data is notcomparable to 2001. See “Reportable Segments” above.
(2) The U.S. overnight box category includes packages exceeding 8 ounces in weight.(3) The U.S. overnight envelope category includes envelopes weighing 8 ounces or less.(4) Includes $93 million charge for impairment of certain assets related to the MD10 air-
craft program and $9 million charge related to the Ayres aircraft program.

FedEx Corporation
11
Revenues
Total package revenue increased 5% for 2001, principally due toincreases in yields and IP volumes, partially offset by a decreasein other revenue. Total package yield increased 5% as a result ofour continued yield management strategy, which includes limitinggrowth of less profitable business and recovering the higher costof fuel through a fuel surcharge. The February 2001 domestic rateincreases also contributed to the higher yield.
While the IP volume growth rate was 8% for 2001, this rate wassignificantly impacted by weakness in the Asian economy in thelast half of the year. Average daily volumes for that region haveslowed from a 26% year-over-year growth rate in the first quarterof 2001 to a 1% year-over-year decline in the fourth quarter of2001. For the year, FedEx Express experienced IP average dailyvolume growth rates of 24% and 12% in the European and Asianmarkets, respectively. In the U.S., average daily domestic pack-age volume declined 1% year over year due to the economic soft-ness experienced in the last half of 2001.
Total freight revenue increased slightly in 2001 due to significantlyimproved yields in U.S. freight, partially offset by declines indomestic freight volume and international freight volume and yield.
Other revenue included Canadian domestic revenue, charterservices, logistics services, sales of hushkits and other. Asexpected, revenue from hushkit sales, which has continued todecline over the past few years, was negligible in 2001.
In 2000, total package revenue for FedEx Express increased 8%,principally due to increases in international package volume andyield. List price increases, including an average 2.8% domesticrate increase in March 1999, the fuel surcharges implemented inthe second half of the year, an ongoing yield management pro-gram and a slight increase in average weight per package, allcontributed to the increases in yields in 2000. While growth in U.S. domestic package volume was lower than anticipated, thehigher-yielding IP services experienced strong growth, par-ticularly in Asia and Europe. Total freight revenue increased in 2000 due to higher average daily pounds and improved yields in U.S. freight, offset by declines in international freight pounds.
Operating Income
Excluding the fourth quarter charges related to aircraft, FedExExpress operating income increased 6% in 2001, despite theslowdown in revenue growth. Increased fuel expense reflects
a 17% increase in average jet fuel price per gallon, which con-tributed to a negative impact of approximately $150 million,including the results of jet fuel hedging contracts entered into tomitigate some of the increased jet fuel costs. The effect of higherfuel costs on operating income was fully offset by a 4% fuel sur-charge, in effect since April 1, 2000. Operating income was favor-ably affected by reduced variable compensation and pensioncosts, coupled with intensified cost controls over discretionaryspending. The decrease in maintenance and repairs expense pri-marily reflects fewer aircraft engine maintenance events due tothe timing of scheduled maintenance and favorable negotiatedrates with vendors.
Operating income increased 3% in 2000 despite higher fuel costsand costs associated with the corporate realignment and reor-ganization of the sales, marketing and information technologyfunctions. A 48% increase in average fuel price per gallon had anegative impact of approximately $260 million on 2000 fuel costs,including the results of jet fuel hedging contracts entered into tomitigate some of the increased jet fuel costs. Fuel surchargesimplemented during 2000 partially offset the increase in 2000 fuelcosts. Maintenance and repairs increased in 2000 due to the tim-ing of scheduled maintenance and a greater number of routinecycle checks resulting from fleet usage and certain FederalAviation Administration directives.
Operating income in 1999 was negatively impacted by $81 millionin strike contingency costs and weakness in Asian markets.
Year-over-year comparisons were also affected by declining con-tributions from sales of hushkits. Operating profit from thesesales declined $40 million in 2001 and $50 million in 2000.
Outlook
For 2002, U.S. domestic package volumes are expected to declineslightly. We believe that IP package volumes will grow at approxi-mately the same rate as 2001. New services, including the U.S.Postal Service agreements, are expected to increase revenuesin 2002.
Operating margin for this segment is expected to decrease in2002 (excluding the 2001 charges related to aircraft programs), asincreased pension and health care costs, costs associated withnew services and annual wage increases are not expected to becompletely offset by suspension of variable compensation pro-grams and reductions in discretionary spending.
Management’s Discussion and Analysis
12
Because of substantial lead times associated with the manufac-ture or modification of aircraft, we must generally plan our aircraftorders or modifications three to eight years in advance. Therefore,we must make projections regarding our needed airlift capacitymany years before the aircraft is actually needed. Our past projec-tions included assumptions of volume growth that have not mate-rialized and, in light of current economic projections, are notexpected to do so in the near future. Therefore, we will continue toevaluate further reductions in aircraft programs in order to ration-alize available capacity with current and anticipated business vol-umes where it is economically practicable to do so.
FEDEX GROUND
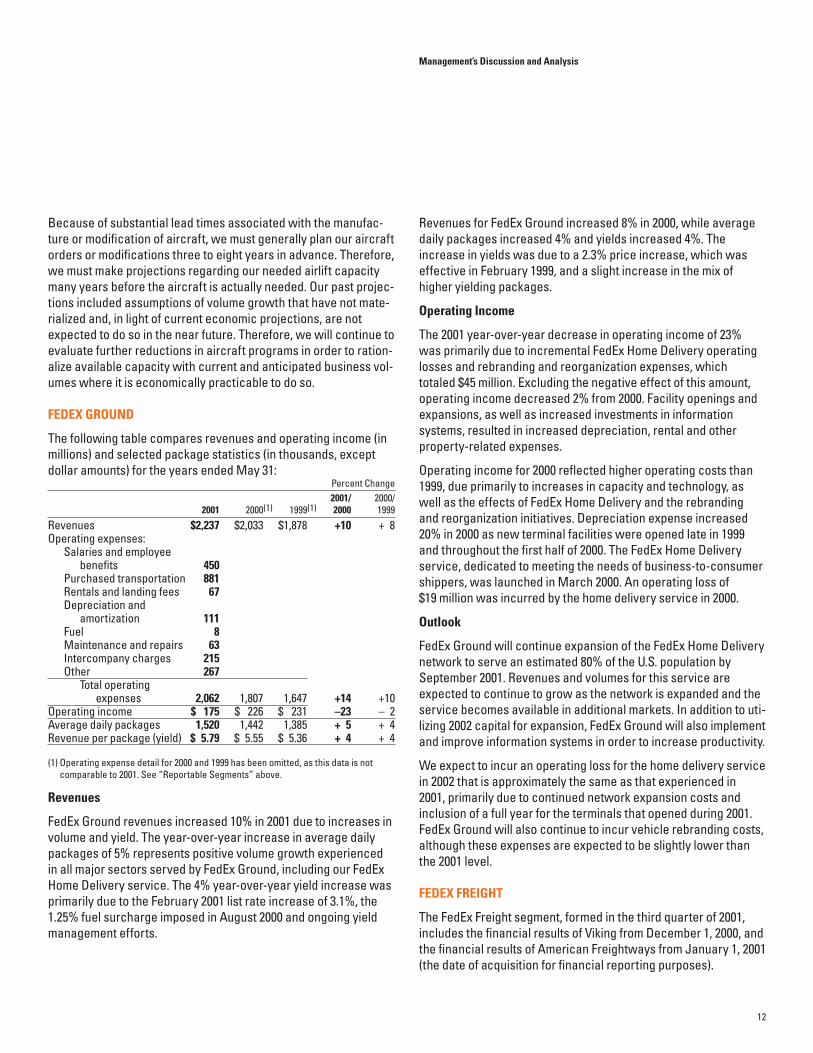
The following table compares revenues and operating income (inmillions) and selected package statistics (in thousands, exceptdollar amounts) for the years ended May 31:
Percent Change2001/ 2000/
2001 2000(1) 1999(1) 2000 1999
Revenues $2,237 $2,033 $1,878 +10 + 8Operating expenses:
Salaries and employee benefits 450
Purchased transportation 881Rentals and landing fees 67Depreciation and
amortization 111Fuel 8Maintenance and repairs 63Intercompany charges 215Other 267
Total operating expenses 2,062 1,807 1,647 +14 +10
Operating income $ 175 $ 226 $ 231 –23 – 2Average daily packages 1,520 1,442 1,385 + 5 + 4Revenue per package (yield) $ 5.79 $ 5.55 $ 5.36 + 4 + 4
(1) Operating expense detail for 2000 and 1999 has been omitted, as this data is notcomparable to 2001. See “Reportable Segments” above.
Revenues
FedEx Ground revenues increased 10% in 2001 due to increases involume and yield. The year-over-year increase in average dailypackages of 5% represents positive volume growth experiencedin all major sectors served by FedEx Ground, including our FedExHome Delivery service. The 4% year-over-year yield increase wasprimarily due to the February 2001 list rate increase of 3.1%, the1.25% fuel surcharge imposed in August 2000 and ongoing yieldmanagement efforts.
Revenues for FedEx Ground increased 8% in 2000, while averagedaily packages increased 4% and yields increased 4%. Theincrease in yields was due to a 2.3% price increase, which waseffective in February 1999, and a slight increase in the mix ofhigher yielding packages.
Operating Income
The 2001 year-over-year decrease in operating income of 23%was primarily due to incremental FedEx Home Delivery operatinglosses and rebranding and reorganization expenses, whichtotaled $45 million. Excluding the negative effect of this amount,operating income decreased 2% from 2000. Facility openings andexpansions, as well as increased investments in informationsystems, resulted in increased depreciation, rental and otherproperty-related expenses.
Operating income for 2000 reflected higher operating costs than1999, due primarily to increases in capacity and technology, aswell as the effects of FedEx Home Delivery and the rebranding and reorganization initiatives. Depreciation expense increased20% in 2000 as new terminal facilities were opened late in 1999and throughout the first half of 2000. The FedEx Home Deliveryservice, dedicated to meeting the needs of business-to-consumershippers, was launched in March 2000. An operating loss of$19 million was incurred by the home delivery service in 2000.
Outlook
FedEx Ground will continue expansion of the FedEx Home Deliverynetwork to serve an estimated 80% of the U.S. population bySeptember 2001. Revenues and volumes for this service areexpected to continue to grow as the network is expanded and theservice becomes available in additional markets. In addition to uti-lizing 2002 capital for expansion, FedEx Ground will also implementand improve information systems in order to increase productivity.
We expect to incur an operating loss for the home delivery servicein 2002 that is approximately the same as that experienced in 2001, primarily due to continued network expansion costs andinclusion of a full year for the terminals that opened during 2001.FedEx Ground will also continue to incur vehicle rebranding costs,although these expenses are expected to be slightly lower thanthe 2001 level.
FEDEX FREIGHT
The FedEx Freight segment, formed in the third quarter of 2001,includes the financial results of Viking from December 1, 2000, andthe financial results of American Freightways from January 1, 2001(the date of acquisition for financial reporting purposes).
FedEx Corporation
13
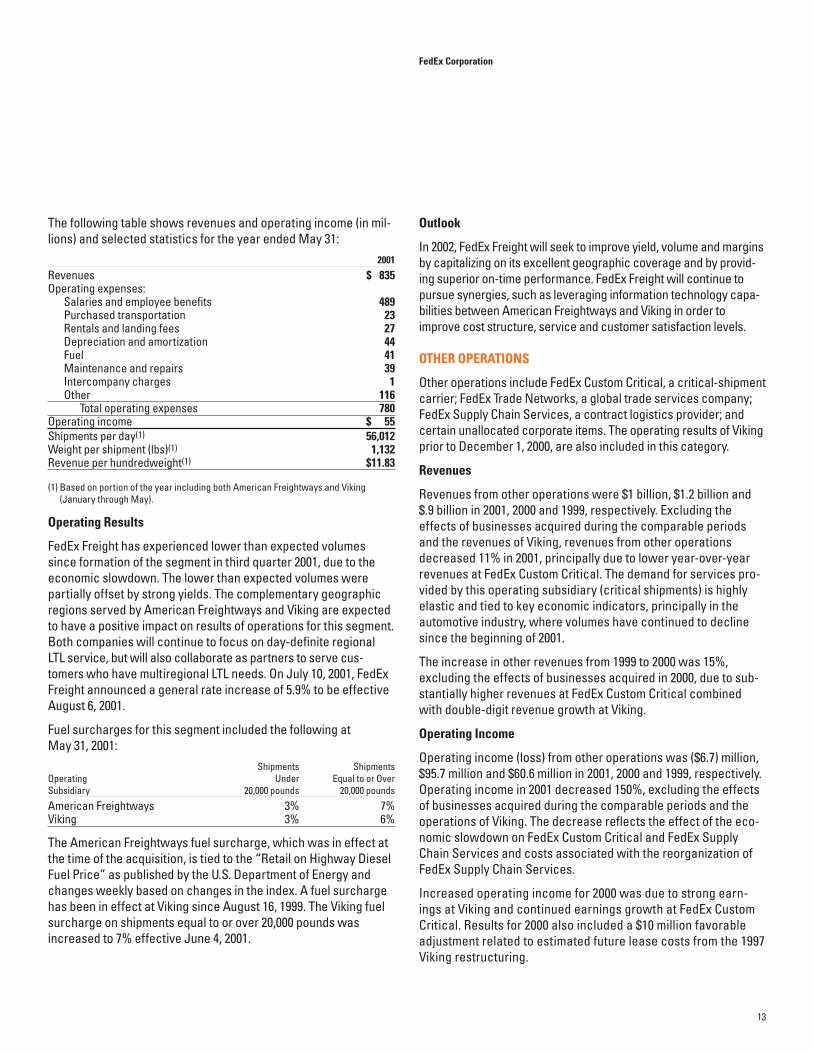
The following table shows revenues and operating income (in mil-lions) and selected statistics for the year ended May 31:
2001
Revenues $ 835Operating expenses:
Salaries and employee benefits 489Purchased transportation 23Rentals and landing fees 27Depreciation and amortization 44Fuel 41Maintenance and repairs 39Intercompany charges 1Other 116
Total operating expenses 780Operating income $ 55Shipments per day(1) 56,012Weight per shipment (lbs)(1) 1,132Revenue per hundredweight(1) $11.83
(1) Based on portion of the year including both American Freightways and Viking(January through May).
Operating Results
FedEx Freight has experienced lower than expected volumessince formation of the segment in third quarter 2001, due to theeconomic slowdown. The lower than expected volumes were partially offset by strong yields. The complementary geographicregions served by American Freightways and Viking are expectedto have a positive impact on results of operations for this segment.Both companies will continue to focus on day-definite regional LTL service, but will also collaborate as partners to serve cus-tomers who have multiregional LTL needs. On July 10, 2001, FedExFreight announced a general rate increase of 5.9% to be effectiveAugust 6, 2001.
Fuel surcharges for this segment included the following atMay 31, 2001:
Shipments Shipments Operating Under Equal to or OverSubsidiary 20,000 pounds 20,000 pounds
American Freightways 3% 7%Viking 3% 6%
The American Freightways fuel surcharge, which was in effect atthe time of the acquisition, is tied to the “Retail on Highway DieselFuel Price” as published by the U.S. Department of Energy andchanges weekly based on changes in the index. A fuel surchargehas been in effect at Viking since August 16, 1999. The Viking fuelsurcharge on shipments equal to or over 20,000 pounds wasincreased to 7% effective June 4, 2001.
Outlook
In 2002, FedEx Freight will seek to improve yield, volume and marginsby capitalizing on its excellent geographic coverage and by provid-ing superior on-time performance. FedEx Freight will continue topursue synergies, such as leveraging information technology capa-bilities between American Freightways and Viking in order toimprove cost structure, service and customer satisfaction levels.
OTHER OPERATIONS
Other operations include FedEx Custom Critical, a critical-shipmentcarrier; FedEx Trade Networks, a global trade services company;FedEx Supply Chain Services, a contract logistics provider; andcertain unallocated corporate items. The operating results of Vikingprior to December 1, 2000, are also included in this category.
Revenues
Revenues from other operations were $1 billion, $1.2 billion and$.9 billion in 2001, 2000 and 1999, respectively. Excluding theeffects of businesses acquired during the comparable periodsand the revenues of Viking, revenues from other operationsdecreased 11% in 2001, principally due to lower year-over-yearrevenues at FedEx Custom Critical. The demand for services pro-vided by this operating subsidiary (critical shipments) is highlyelastic and tied to key economic indicators, principally in theautomotive industry, where volumes have continued to declinesince the beginning of 2001.
The increase in other revenues from 1999 to 2000 was 15%,excluding the effects of businesses acquired in 2000, due to sub-stantially higher revenues at FedEx Custom Critical combinedwith double-digit revenue growth at Viking.
Operating Income
Operating income (loss) from other operations was ($6.7) million,$95.7 million and $60.6 million in 2001, 2000 and 1999, respectively.Operating income in 2001 decreased 150%, excluding the effectsof businesses acquired during the comparable periods and theoperations of Viking. The decrease reflects the effect of the eco-nomic slowdown on FedEx Custom Critical and FedEx SupplyChain Services and costs associated with the reorganization ofFedEx Supply Chain Services.
Increased operating income for 2000 was due to strong earn-ings at Viking and continued earnings growth at FedEx CustomCritical. Results for 2000 also included a $10 million favorableadjustment related to estimated future lease costs from the 1997Viking restructuring.

Management’s Discussion and Analysis
14
Outlook
In 2002, we will continue the strategic realignment of FedEx SupplyChain Services. The new FedEx Supply Chain Services businessmodel includes substantially less emphasis on warehousing activi-ties and an increased focus on alliance-based and informationtechnology-sensitive business. The new business model is moreconsistent with management’s strategy for this operating sub-sidiary, which is to pursue business that enhances the servicesoffered by other operating companies in the FedEx family.
FINANCIAL CONDITION
LIQUIDITY
Cash and cash equivalents totaled $121 million at May 31, 2001,compared to $68 million at May 31, 2000. Cash flows from operat-ing activities during 2001 totaled $2.0 billion, compared to $1.6 bil-lion for 2000 and $1.8 billion for 1999.
Because we incur significant noncash charges, including depre-ciation and amortization, related to the material capital assetsutilized in our business, we believe that the following cash-basedmeasures are useful to us and to our investors as an additionalmeans of evaluating our financial condition. These measuresshould not be considered as a superior alternative to net income,operating income or cash from operations, or to any other operat-ing or liquidity performance measure as defined by generallyaccepted accounting principles.
FedEx’s operations have generated increased cash earnings pershare over the past three years. The following table comparescash earnings (in billions, except per share amounts) for theyears ended May 31:
2001 2000 1999
EBITDA (earnings before interest, taxes,depreciation and amortization) $ 2.3 $ 2.4 $ 2.2
Cash earnings per share (net incomeplus depreciation and amortization divided by average common and common equivalent shares) $6.34 $6.22 $5.54
We have a $1.0 billion revolving credit facility that is generallyused to finance temporary operating cash requirements and toprovide support for the issuance of commercial paper. As ofMay 31, 2001, the entire credit facility remained available and nocommercial paper was outstanding. For more information regard-ing the credit facility, see Note 4 to our financial statements.
During 2001, we acquired American Freightways in a transactionaccounted for as a purchase. The $978 million purchase pricewas a combination of cash and FedEx common stock (11.0 millionshares of treasury stock were utilized). We also assumed approx-imately $240 million in American Freightways debt.
On February 12, 2001, we issued $750 million of senior unsecurednotes in three maturity tranches: three, five and ten years, at$250 million each. Net proceeds from the borrowings were usedto repay indebtedness, principally borrowings under our commer-cial paper program, and for general corporate purposes. Thesenotes are guaranteed by all of our subsidiaries that are not con-sidered minor under Securities and Exchange Commission(“SEC”) regulations. For more information regarding debt instru-ments, see Notes 1 and 4 to our financial statements.
During 2002, certain existing debt at FedEx Express will mature,principally $175 million of 9.875% Senior Notes due April 1, 2002.These notes and the other scheduled 2002 debt payments arereflected in the current portion of long-term debt at May 31, 2001.
In 1999, we filed a $1 billion shelf registration statement with theSEC, indicating that we may issue up to that amount in one ormore offerings of either unsecured debt securities, preferredstock or common stock, or a combination of such instruments.We may, at our option, direct FedEx Express to issue guaranteesof the debt securities.
We believe that cash flow from operations, our commercial paperprogram and revolving bank credit facility will adequately meetour working capital needs for the foreseeable future.
CAPITAL RESOURCES
As mentioned previously, our operations are capital intensive,characterized by significant investments in aircraft, vehicles,computer and telecommunications equipment, package-handlingfacilities and sort equipment. The amount and timing of capitaladditions depend on various factors, including volume growth,domestic and international economic conditions, new or enhancedservices, geographical expansion of services, competition, avail-ability of satisfactory financing and actions of regulatory authorities.

FedEx Corporation
15
The following table compares capital expenditures (includingequivalent capital, which is defined below) for the years endedMay 31 (in millions):
2001 2000 1999
Aircraft and related equipment $ 756 $ 469 $ 606Facilities and sort equipment 353 437 466Information and technology equipment 406 378 366Other equipment 378 343 332
Total capital expenditures 1,893 1,627 1,770Equivalent capital, principally
aircraft-related – 365 561Total $1,893 $1,992 $2,331
We finance a significant amount of aircraft and certain otherequipment needs using long-term operating leases. We believethe determination to lease versus buy equipment is a financingdecision, and both forms of financing are considered when evalu-ating the resources committed for capital. The amount we wouldhave expended to purchase these assets had we not chosen toobtain their use through operating leases is considered equiva-lent capital in the table above. Capital expenditures (includingequivalent capital) over the past two years have been reduced inresponse to lower U.S. domestic volume growth at FedEx Express.This trend of lower U.S. domestic volume growth, along with thecurrent year economic slowdown and its effects on IP volumegrowth, has resulted in future excess airlift capacity. During thefourth quarter of 2001, we began the process of reducing certainplanned aircraft programs, which is expected to result in lowercapital expenditures in future periods (see Note 15 to our finan-cial statements). For 2002, we expect capital spending, includingequivalent capital, to approximate the level of 2001 capitalexpenditures. We plan to continue to make strategic capitalinvestments, particularly in information technology and groundnetwork expansion, in support of our long-term growth goals. Forinformation on our purchase commitments, see Note 13 to ourfinancial statements.
We have historically financed our capital investments through theuse of lease, debt and equity financing in addition to the use ofinternally generated cash from operations. Generally, our prac-tice in recent years with respect to funding new wide-bodied aircraft acquisitions has been to finance such aircraft throughlong-term lease transactions that qualify as off-balance sheetoperating leases under applicable accounting rules. We havedetermined that these operating leases have provided economicbenefits favorable to ownership with respect to market values,liquidity and after-tax cash flows. In the future, other forms ofsecured financing may be pursued to finance aircraft acquisitions
when we determine that it best meets our needs. Historically, wehave been successful in obtaining investment capital, bothdomestic and international, for long-term leases on acceptableterms, although the marketplace for such capital can becomerestricted depending on a variety of economic factors beyond ourcontrol. See Note 4 to our financial statements for additional infor-mation concerning our debt facilities.
We believe the capital resources available to us provide flexi-bility to access the most efficient markets for financing capitalacquisitions, including aircraft, and are adequate for our futurecapital needs.
MARKET RISK SENSITIVE INSTRUMENTS AND POSITIONS
While we currently have market risk sensitive instruments relatedto interest rates, we have no significant exposure to changinginterest rates on our long-term debt because the interest ratesare fixed. As disclosed in Note 4 to our financial statements, wehave outstanding long-term debt (exclusive of capital leases) of$1.9 billion and $1.1 billion at May 31, 2001 and 2000, respectively.Market risk for fixed-rate, long-term debt is estimated as thepotential decrease in fair value resulting from a hypothetical 10%increase in interest rates and amounts to approximately $55 mil-lion as of May 31, 2001 ($54 million as of May 31, 2000). The under-lying fair values of our long-term debt were estimated based onquoted market prices or on the current rates offered for debt withsimilar terms and maturities. Presently, derivative instruments arenot used to manage interest rate risk.
Our earnings are affected by fluctuations in the value of theU.S. dollar compared to foreign currencies as a result of trans-actions in foreign markets. At May 31, 2001, the result of a uniform10% strengthening in the value of the dollar relative to the curren-cies in which our transactions are denominated would result in adecrease in operating income of approximately $70 million for theyear ending May 31, 2002 (the comparable amount in the prior yearwas approximately $50 million). This calculation assumes thateach exchange rate would change in the same direction relativeto the U.S. dollar. In practice, our experience is that exchangerates in the principal foreign markets where we have foreign cur-rency denominated transactions tend to have offsetting fluctua-tions. Therefore, the calculation above is not indicative of ouractual experience in foreign currency transactions. In addition tothe direct effects of changes in exchange rates, which are achanged dollar value of the resulting reported operating results,changes in exchange rates also affect the volume of sales or the

Management’s Discussion and Analysis
16
foreign currency sales price as competitors’ services becomemore or less attractive. The sensitivity analysis of the effects ofchanges in foreign currency exchange rates does not factor in a potential change in sales levels or local currency prices.
Our earnings are also affected by fluctuations in jet fuel prices.Market risk for jet fuel is estimated as the potential decrease inearnings resulting from a hypothetical 10% increase in projectedjet fuel prices applied to projected 2002 usage and amounts to approximately $100 million as of May 31, 2001, compared withapproximately $50 million, net of hedging settlements, as ofMay 31, 2000. Because we also use fuel surcharges to adjust ourpricing in response to changes in fuel costs, the calculationsabove are not necessarily indicative of the impact of changingfuel prices on our earnings. As of May 31, 2001, all outstanding jetfuel hedging contracts were effectively closed by entering intooffsetting jet fuel hedging contracts. See Notes 1 and 13 to ourfinancial statements for accounting policy and additional infor-mation regarding jet fuel hedging contracts.
We do not purchase or hold any material derivative financialinstruments for trading purposes.
EURO CURRENCY CONVERSION
Since the beginning of the European Union’s transition to the euroon January 1, 1999, our subsidiaries have been prepared to quoterates to customers, generate billings and accept payments inboth euro and legacy currencies. The legacy currencies will remainlegal tender through December 31, 2001. We believe the introduc-tion of the euro, any price transparency brought about by itsintroduction and the phasing out of the legacy currencies will nothave a material impact on our consolidated financial position,results of operations or cash flows. Costs associated with theeuro project are being expensed as incurred and are beingfunded entirely by internal cash flows.
FORWARD-LOOKING STATEMENTS
Certain statements contained in this report are “forward-lookingstatements” within the meaning of the Private SecuritiesLitigation Reform Act of 1995, such as statements relating to man-agement’s views with respect to future events and financial per-formance. Such forward-looking statements are subject to risks,
uncertainties and other factors that could cause actual results todiffer materially from historical experience or from future resultsexpressed or implied by such forward-looking statements.Accordingly, a forward-looking statement is not a prediction offuture events or circumstances, and those future events or circum-stances may not occur. A forward-looking statement is usuallyidentified by our use of certain terminology, including “believes,”“expects,” “may,” “will,” “should,” “seeks,” “pro forma,” “antici-pates,” “intends” or “plans” or by discussions of strategies,intentions or outlook. Potential risks and uncertainties include,but are not limited to
• Economic conditions in the markets in which we operate, whichcan affect demand for our services.
• Our ability to match aircraft, vehicle and sort capacity with cus-tomer volume levels.
• The costs and complexities associated with the integration ofcertain of our sales, marketing, customer service and informa-tion technology functions.
• Market acceptance of our new sales, marketing and brandingstrategies, as well as our residential home delivery service.
• Competition from other providers of transportation and logisticsservices, including competitive responses to our new initiatives.
• Our ability to adapt to technological change and to competewith new or improved services offered by our competitors.
• Changes in customer demand patterns, including the impact oftechnology developments on demand for our services.
• Increases in aviation and motor fuel prices.• Work stoppages, strikes or slowdowns by our employees.• Our ability, and that of our principal competitors, to obtain and
maintain aviation rights in important international markets.• Changes in government regulation.• Changes in weather.• Availability of financing on terms acceptable to us.• Other uncertainties detailed herein and from time to time in our
Securities and Exchange Commission filings and press releases.
We undertake no obligation to publicly update or revise any forward-looking statements, whether as a result of new infor-mation, future events or otherwise.
Except as otherwise indicated, any reference to a year meansour fiscal year ended May 31 of the year referenced.

17
Years ended May 31In thousands, except per share amounts 2001 2000 1999
REVENUES $19,629,040 $18,256,945 $16,773,470OPERATING EXPENSES
Salaries and employee benefits 8,263,413 7,597,964 7,087,728Purchased transportation 1,713,027 1,674,854 1,537,785Rentals and landing fees 1,650,048 1,538,713 1,396,694Depreciation and amortization 1,275,774 1,154,863 1,035,118Fuel 1,142,741 918,513 604,929Maintenance and repairs 1,170,103 1,101,424 958,873Other 3,343,044 3,049,540 2,989,257
18,558,150 17,035,871 15,610,384OPERATING INCOME 1,070,890 1,221,074 1,163,086OTHER INCOME (EXPENSE)
Interest, net (143,953) (106,060) (98,191)Other, net 636 22,726 (3,831)
(143,317) (83,334) (102,022)INCOME BEFORE INCOME TAXES 927,573 1,137,740 1,061,064PROVISION FOR INCOME TAXES 343,202 449,404 429,731NET INCOME $ 584,371 $ 688,336 $ 631,333EARNINGS PER COMMON SHARE
Basic $ 2.02 $ 2.36 $ 2.13Assuming dilution $ 1.99 $ 2.32 $ 2.10
The accompanying notes are an integral part of these consolidated financial statements.
CONSOLIDATED STATEMENTS OF INCOME

18
May 31In thousands, except shares 2001 2000
ASSETS
CURRENT ASSETS
Cash and cash equivalents $ 121,302 $ 67,959Receivables, less allowances of $95,815 and $85,972 2,506,044 2,547,043Spare parts, supplies and fuel 269,269 255,291Deferred income taxes 435,406 317,784Prepaid expenses and other 117,040 96,667
Total current assets 3,449,061 3,284,744PROPERTY AND EQUIPMENT, AT COST
Flight equipment 5,312,853 4,960,204Package handling and ground support equipment and vehicles 4,620,894 4,203,927Computer and electronic equipment 2,637,350 2,416,666Other 3,840,899 3,161,746
16,411,996 14,742,543Less accumulated depreciation and amortization 8,311,941 7,659,016
Net property and equipment 8,100,055 7,083,527OTHER ASSETS
Goodwill 1,082,223 500,547Equipment deposits and other assets 708,673 658,293
Total other assets 1,790,896 1,158,840$13,340,012 $11,527,111
LIABILITIES AND STOCKHOLDERS’ INVESTMENT
CURRENT LIABILITIES
Current portion of long-term debt $ 221,392 $ 6,537Accrued salaries and employee benefits 699,906 755,747Accounts payable 1,255,298 1,120,855Accrued expenses 1,072,920 1,007,887
Total current liabilities 3,249,516 2,891,026LONG-TERM DEBT, LESS CURRENT PORTION 1,900,119 1,776,253DEFERRED INCOME TAXES 455,591 344,613OTHER LIABILITIES 1,834,366 1,729,976COMMITMENTS AND CONTINGENCIES (Notes 5, 13 and 14)COMMON STOCKHOLDERS’ INVESTMENT
Common stock, $.10 par value; 800,000,000 shares authorized;298,573,387 shares issued 29,857 29,857
Additional paid-in capital 1,120,627 1,079,462Retained earnings 4,879,647 4,295,041Accumulated other comprehensive income (55,833) (36,074)
5,974,298 5,368,286Less treasury stock, at cost and deferred compensation 73,878 583,043
Total common stockholders’ investment 5,900,420 4,785,243$13,340,012 $11,527,111
The accompanying notes are an integral part of these consolidated financial statements.
CONSOLIDATED BALANCE SHEETS

19
Years ended May 31In thousands 2001 2000 1999
OPERATING ACTIVITIES
Net income $ 584,371 $ 688,336 $ 631,333Adjustments to reconcile net income to cash provided
by operating activities:Depreciation and amortization 1,275,774 1,154,863 1,035,118Provision for uncollectible accounts 112,264 71,107 55,649Aircraft related impairment charges 102,000 – –Deferred income taxes and other noncash items (16,024) (7,363) (34,037)Gain from disposals of property and equipment (4,440) (17,068) (2,330)Changes in operating assets and liabilities, net of the effects of
businesses acquired:Decrease (increase) in receivables 61,702 (404,511) (294,121)(Increase) decrease in other current assets (112,476) 70,720 (155,720)Increase in accounts payable and other operating liabilities 102,390 107,543 555,565Other, net (61,755) (38,385) (19,337)
Cash provided by operating activities 2,043,806 1,625,242 1,772,120INVESTING ACTIVITIES
Purchases of property and equipment, including deposits on aircraft of $7,900, $1,500 and $1,200 (1,893,384) (1,627,418) (1,769,946)
Proceeds from dispositions of property and equipment:Sale-leaseback transactions 237,000 – 80,995Reimbursements of A300 and MD11 deposits – 24,377 67,269Other dispositions 37,444 165,397 195,641
Business acquisitions, net of cash acquired (476,992) (257,095) –Other, net (16,783) (13,378) (22,716)Cash used in investing activities (2,112,715) (1,708,117) (1,448,757)FINANCING ACTIVITIES
Principal payments on debt (650,280) (115,090) (269,367)Proceeds from debt issuances 743,522 517,664 –Proceeds from stock issuances 28,654 15,523 49,932Purchase of treasury stock – (606,506) (8,168)Other, net 356 13,920 (2)Cash provided by (used in) financing activities 122,252 (174,489) (227,605)CASH AND CASH EQUIVALENTS
Net increase (decrease) in cash and cash equivalents 53,343 (257,364) 95,758Balance at beginning of year 67,959 325,323 229,565Balance at end of year $ 121,302 $ 67,959 $ 325,323
The accompanying notes are an integral part of these consolidated financial statements.
CONSOLIDATED STATEMENTS OF CASH FLOWS

20
AccumulatedAdditional Other Com- Deferred
Common Paid-in Retained prehensive Treasury Compen-In thousands, except shares Stock Capital Earnings Income Stock sation Total
BALANCE AT MAY 31, 1998 $14,741 $ 992,821 $2,999,354 $(27,277) $ – $(18,409) $3,961,230Net income – – 631,333 – – – 631,333Foreign currency translation adjustment,
net of deferred tax benefit of $959 – – – (611) – – (611)Unrealized gain on available-for-sale
securities, net of deferred taxes of $2,100 – – – 3,200 – – 3,200
Total comprehensive income 633,922Purchase of treasury stock – – – – (8,168) – (8,168)Two-for-one stock split by FedEx
Corporation in the form of a 100% stock dividend (148,931,996 shares) 14,890 – (14,890) – – – –
Employee incentive plans and other (1,770,626 shares issued) 168 68,491 – – 6,887 (7,766) 67,780
Amortization of deferred compensation – – – – – 8,928 8,928
BALANCE AT MAY 31, 1999 29,799 1,061,312 3,615,797 (24,688) (1,281) (17,247) 4,663,692Net income – – 688,336 – – – 688,336Foreign currency translation adjustment,
net of deferred tax benefit of $1,881 – – – (9,021) – – (9,021)Unrealized loss on available-for-sale
securities, net of deferred tax benefit of $1,513 – – – (2,365) – – (2,365)
Total comprehensive income 676,950Shares issued for acquisition
(175,644 shares) – – 191 – 6,626 – 6,817Purchase of treasury stock – – – – (606,506) – (606,506)Employee incentive plans and other
(1,539,941 shares issued) 58 18,150 (9,283) – 37,067 (13,880) 32,112Amortization of deferred compensation – – – – – 12,178 12,178BALANCE AT MAY 31, 2000 29,857 1,079,462 4,295,041 (36,074) (564,094) (18,949) 4,785,243Net income – – 584,371 – – – 584,371Foreign currency translation adjustment,
net of deferred tax benefit of $6,849 – – – (18,944) – – (18,944)Unrealized loss on available-for-sale
securities, net of deferred tax benefit of $574 – – – (815) – – (815)
Total comprehensive income 564,612Shares issued for acquisition
(11,042,965 shares) – 41,675 27,131 – 437,584 – 506,390Employee incentive plans and other
(1,841,543 shares issued) – (510) (26,896) – 73,020 (12,865) 32,749Amortization of deferred compensation – – – – – 11,426 11,426BALANCE AT MAY 31, 2001 $29,857 $1,120,627 $4,879,647 $(55,833) $ (53,490) $(20,388) $5,900,420
The accompanying notes are an integral part of these consolidated financial statements.
CONSOLIDATED STATEMENTS OF CHANGES INSTOCKHOLDERS’ INVESTMENT AND COMPREHENSIVE INCOME

2121
NOTE 1: DESCRIPTION OF BUSINESS AND SUMMARY OFSIGNIFICANT ACCOUNTING POLICIES
DESCRIPTION OF BUSINESS. FedEx Corporation (“FedEx”) is apremier global provider of transportation, e-commerce and sup-ply chain management services, whose operations are primarilyrepresented by Federal Express Corporation (“FedEx Express”),the world’s largest express transportation company; FedExGround Package System, Inc. (“FedEx Ground”), North America’ssecond largest provider of small-package ground delivery serv-ice; and FedEx Freight System, Inc. (“FedEx Freight”), a leadingprovider of regional less-than-truckload (“LTL”) freight services.Other operating companies included in the FedEx portfolio areFedEx Custom Critical, Inc. (“FedEx Custom Critical”), a critical-shipment carrier; FedEx Trade Networks, Inc. (“FedEx TradeNetworks”), a global trade services company; and FedEx SupplyChain Services, Inc. (“FedEx Supply Chain Services”), a contractlogistics provider.
FedEx Freight was formed in the third quarter of 2001 in con-junction with our acquisition of American Freightways, Inc.(“American Freightways”). FedEx Freight includes the results ofoperations of American Freightways, a multiregional LTL carrier,from January 1, 2001 and Viking Freight, Inc. (“Viking”), an LTLcarrier operating principally in the western United States, fromDecember 1, 2000.
PRINCIPLES OF CONSOLIDATION. The consolidated financialstatements include the accounts of FedEx and its subsidiaries. All significant intercompany accounts and transactions havebeen eliminated.
SUBSIDIARY GUARANTORS. Certain long-term debt containssubsidiary guarantees. The guarantees provided by our sub-sidiaries are full and unconditional, joint and several, and anysubsidiaries which are not guarantors are minor as defined bySecurities and Exchange Commission (“SEC”) regulations. FedEx,as the parent company issuer of this debt, has no independentassets or operations. There are no significant restrictions on ourability or the ability of any guarantor to obtain funds from its sub-sidiaries by means of dividend or loan.
CREDIT RISK. Credit risk in trade receivables is substantially miti-gated by our credit evaluation process, short collection terms,and sales to a large number of customers, as well as the low rev-enue per transaction for most of our transportation services.Allowances for potential credit losses are determined based on historical experience, current evaluation of the composition of accounts receivable and expected credit trends.
REVENUE RECOGNITION. Revenue is recognized upon delivery ofshipments. For shipments in transit, revenue is recorded based onthe percentage of service completed at the balance sheet date.
ADVERTISING. Generally, advertising costs are expensed asincurred and are classified in other operating expenses.Advertising expenses were $236,559,000, $221,511,000 and$202,104,000 in 2001, 2000 and 1999, respectively.
CASH EQUIVALENTS. Cash equivalents in excess of current operating requirements are invested in short-term, interest-bearing instruments with maturities of three months or less at the date of purchase and are stated at cost, which approximatesmarket value. Interest income was $11,197,000, $15,116,000 and$12,399,000 in 2001, 2000 and 1999, respectively.
MARKETABLE SECURITIES. Marketable securities are classifiedas available-for-sale securities and are reported at fair value.Unrealized gains and losses are reported, net of related deferredincome taxes, as a component of accumulated other comprehen-sive income.
SPARE PARTS, SUPPLIES AND FUEL. Spare parts are stated prin-cipally at weighted-average cost. Supplies and fuel are statedprincipally at standard cost, which approximates actual cost on afirst-in, first-out basis. Neither method values inventory in excessof current replacement cost.
PROPERTY AND EQUIPMENT. Expenditures for major additions,improvements, flight equipment modifications and certain equip-ment overhaul costs are capitalized. Maintenance and repairsare charged to expense as incurred. The cost and accumulateddepreciation of property and equipment disposed of are removedfrom the related accounts, and any gain or loss is reflected in theresults of operations.
For financial reporting purposes, depreciation and amortizationof property and equipment is provided on a straight-line basisover the asset’s service life or related lease term as follows:
Flight equipment 5 to 20 yearsPackage handling and ground support
equipment and vehicles 3 to 30 yearsComputer and electronic equipment 3 to 10 yearsOther 2 to 30 years
Aircraft airframes and engines are assigned residual valuesranging up to 20% of asset cost. All other property and equipmenthave no material residual values. Vehicles are depreciated on astraight-line basis over five to 10 years. Depreciation expensewas $1,241,493,000, $1,132,129,000, and $1,017,950,000 in 2001,2000 and 1999, respectively.
NOTES TO CONSOLIDATED FINANCIAL STATEMENTS
Notes to Consolidated Financial Statements
22
For income tax purposes, depreciation is generally computedusing accelerated methods.
CAPITALIZED INTEREST. Interest on funds used to finance theacquisition and modification of aircraft, construction of certainfacilities, and development of certain software up to the date theasset is placed in service is capitalized and included in the cost of the asset. Capitalized interest was $26,536,000, $34,823,000 and$38,880,000 for 2001, 2000 and 1999, respectively.
IMPAIRMENT OF LONG-LIVED ASSETS. Long-lived assets includ-ing goodwill are reviewed for impairment when circumstancesindicate the carrying value of an asset may not be recoverable.For assets that are to be held and used, an impairment is recog-nized when the estimated undiscounted cash flows associatedwith the asset or group of assets is less than their carrying value.If impairment exists, an adjustment is made to write the assetdown to its fair value, and a loss is recorded as the differencebetween the carrying value and fair value. Fair values are deter-mined based on quoted market values, discounted cash flows orinternal and external appraisals, as applicable. Assets to be dis-posed of are carried at the lower of carrying value or estimatednet realizable value. See Notes 15 and 16 for information con-cerning the impairment charges recognized in 2001.
GOODWILL. Goodwill is recognized for the excess of the pur-chase price over the fair value of tangible and identifiable intan-gible net assets of businesses acquired. It is amortized over the estimated period of benefit on a straight-line basis over peri-ods generally ranging from 15 to 40 years. Accumulated amortiza-tion was $201,766,000 and $165,624,000 at May 31, 2001 and 2000, respectively.
INCOME TAXES. Deferred income taxes are provided for the taxeffect of temporary differences between the tax basis of assetsand liabilities and their reported amounts in the financial state-ments. The liability method is used to account for income taxes,which requires deferred taxes to be recorded at the statutory rateexpected to be in effect when the taxes are paid.
We have not provided for U.S. federal income taxes on foreignsubsidiaries’ earnings deemed to be permanently reinvested andany related taxes associated with such earnings are not material.
SELF-INSURANCE ACCRUALS. We are self-insured up to certainlevels for workers’ compensation, employee health care andvehicle liabilities. Accruals are based on the actuarially estimatedundiscounted cost of claims. Included in other liabilities at May 31,2001 and 2000, were $363,664,000 and $324,869,000, respectively,
representing the long-term portion of self-insurance accruals forworkers’ compensation and vehicle liabilities.
DEFERRED LEASE OBLIGATIONS. While certain aircraft and facil-ity leases contain fluctuating or escalating payments, the relatedrent expense is recorded on a straight-line basis over the leaseterm. Included in other liabilities at May 31, 2001 and 2000, were$398,298,000 and $354,566,000, respectively, representing thecumulative difference between rent expense and rent payments.
DEFERRED GAINS. Gains on the sale and leaseback of aircraftand other property and equipment are deferred and amortizedratably over the life of the lease as a reduction of rent expense.Included in other liabilities at May 31, 2001 and 2000 weredeferred gains of $511,932,000 and $533,371,000, respectively.
DERIVATIVE INSTRUMENTS. Through the period ending May 31,2001, jet fuel forward contracts were accounted for as hedgesunder Statement of Financial Accounting Standards No. (“SFAS”)80, “Accounting for Futures Contracts.” At June 1, 2001, weadopted SFAS 133, “Accounting for Derivative Instruments andHedging Activities.” See Recent Pronouncements.
FOREIGN CURRENCY TRANSLATION. Translation gains and lossesof foreign operations that use local currencies as the functionalcurrency are accumulated and reported, net of applicabledeferred income taxes, as a component of accumulated othercomprehensive income within common stockholders’ investment.Transaction gains and losses that arise from exchange rate fluctu-ations on transactions denominated in a currency other than thelocal functional currency are included in the results of operations.Balances for foreign currency translation in accumulated othercomprehensive income were ($55,853,000), ($36,909,000) and($27,888,000) at May 31, 2001, 2000 and 1999, respectively.
RECENT PRONOUNCEMENTS. We adopted SFAS 133, “Accountingfor Derivative Instruments and Hedging Activities” (as amendedby SFAS 137 and SFAS 138) at the beginning of 2002. The adoptionof this Statement will not have a material effect on our financialposition or results of operations for 2002.
RECLASSIFICATIONS. Certain prior year amounts have beenreclassified to conform to the 2001 presentation.
USE OF ESTIMATES. The preparation of the consolidated finan-cial statements in conformity with accounting principles gener-ally accepted in the United States requires the use of estimatesand assumptions that affect the reported amounts of assets andliabilities and disclosure of contingent assets and liabilities at thedate of the financial statements and the reported amounts of rev-enues and expenses during the reporting period. Actual resultscould differ from those estimates.

FedEx Corporation
23
NOTE 2: BUSINESS COMBINATIONS
On February 9, 2001, we completed the acquisition of AmericanFreightways, a multiregional less-than-truckload motor carrier,for approximately $978,000,000, including $471,000,000 in cash,11.0 million shares of FedEx common stock and options to pur-chase 1.5 million shares of FedEx common stock. The acquisitionwas completed in a two-step transaction that included a cashtender offer and a merger that resulted in the acquisition of alloutstanding shares of American Freightways. The first step of thetransaction was completed on December 21, 2000 by acquiring forcash 50.1% of the outstanding shares of American Freightways,or 16,380,038 shares at a price of $28.13 per share. On February 9,2001, American Freightways was merged into a newly-createdsubsidiary of FedEx and each remaining outstanding share ofAmerican Freightways common stock was converted into0.6639 shares of common stock of FedEx. The excess purchaseprice over the estimated fair value of the net assets acquired(approximately $600 million) has been recorded as goodwill and is being amortized ratably over 40 years.
The following unaudited pro forma consolidated results of opera-tions are presented as if the acquisition of American Freightwayshad been made at the beginning of the periods presented:May 31, In thousands, except per share amounts 2001 2000
Revenues $20,493,991 $19,541,425Net income 601,825 710,119Basic earnings per share 2.03 2.35Diluted earnings per share 2.00 2.31
The pro forma consolidated results of operations include adjust-ments to give effect to the amortization of goodwill, interestexpense on acquisition-related debt and certain other purchaseaccounting adjustments. The pro forma information is not neces-sarily indicative of the results of operations that would haveoccurred had the purchase been made at the beginning of the peri-ods presented or the future results of the combined operations.
On March 31, 2000, the common stock of World Tariff, Limited(“World Tariff”) was acquired for approximately $8,400,000 in cashand stock. World Tariff is a source of customs duty and tax infor-mation around the globe. This business is operating as a sub-sidiary of FedEx Trade Networks. The excess of purchase priceover the estimated fair value of the net assets acquired ($8,300,000)has been recorded as goodwill and is being amortized ratablyover 25 years.
On February 29, 2000, the common stock of Tower GroupInternational, Inc. (“Tower”) was acquired for approximately$140,000,000 in cash. Tower primarily provides international cus-toms clearance services. This business is operating as a sub-sidiary of FedEx Trade Networks. The excess of purchase priceover the estimated fair value of the net assets acquired ($30,000,000)has been recorded as goodwill and is being amortized ratablyover 25 years.
On September 10, 1999, the assets of GeoLogistics Air Services,Inc. were acquired for approximately $116,000,000 in cash. Thisbusiness operates under the name Caribbean TransportationServices, Inc. (“CTS”), and is a subsidiary of FedEx Trade Networks.CTS is an airfreight forwarder servicing freight shipments prima-rily between the United States and Puerto Rico. The excess ofpurchase price over the estimated fair value of the net assetsacquired ($103,000,000) has been recorded as goodwill and isbeing amortized ratably over 15 years.
The operating results of these acquired companies are includedin consolidated operations from the date of acquisition. ForAmerican Freightways, the results of operations are includedfrom January 1, 2001, which was the date of acquisition for finan-cial reporting purposes. Pro forma results including these acqui-sitions, except American Freightways, would not differ materiallyfrom reported results in any of the periods presented.
NOTE 3: ACCRUED SALARIES AND EMPLOYEE BENEFITS ANDACCRUED EXPENSES
The components of accrued salaries and employee benefits andaccrued expenses were as follows:May 31In thousands 2001 2000
Salaries $ 192,892 $ 168,582Employee benefits 152,979 260,063Compensated absences 354,035 327,102
Total accrued salaries and employee benefits $ 699,906 $ 755,747
Insurance $ 427,685 $ 363,899Taxes other than income taxes 239,718 237,342Other 405,517 406,646
Total accrued expenses $1,072,920 $1,007,887

Notes to Consolidated Financial Statements
24
NOTE 4: LONG-TERM DEBT AND OTHER FINANCINGARRANGEMENTSMay 31In thousands 2001 2000
Unsecured debt $1,836,616 $ 975,862Commercial paper, weighted-average
interest rate of 6.73% – 521,031Capital lease obligations and tax exempt
bonds, interest rates of 5.35% to 7.88%, due through 2017, less bond reserves of $9,024 247,227 244,545
Other debt, interest rates of 9.68% to 11.12% 37,668 41,3522,121,511 1,782,790
Less current portion 221,392 6,537$1,900,119 $1,776,253
We have a $1,000,000,000 revolving credit agreement with domes-tic and foreign banks. The revolving credit agreement comprisestwo parts. The first part provides for a commitment of $800,000,000through January 27, 2003. The second part provides for a 364-daycommitment for $200,000,000 through September 30, 2001. Interestrates on borrowings under this agreement are generally deter-mined by maturities selected and prevailing market conditions.The revolving credit agreement contains certain covenants andrestrictions, none of which are expected to significantly affectour operations or ability to pay dividends.
As of May 31, 2001, approximately $2,655,000,000 was availablefor the payment of dividends under the restrictive covenant of therevolving credit agreement. Commercial paper borrowings arebacked by unused commitments under the revolving credit agree-ment and reduce the amount available under the agreement. As of May 31, 2001, no commercial paper borrowings were out-standing and the entire credit facility was available.
The components of unsecured debt (net of discounts) were as follows:May 31In thousands 2001 2000
Senior debt:Interest rates of 6.63% to 7.25%,
due through 2011 $ 745,844 $ – Interest rates of 9.65% to 9.88%,
due through 2013 474,161 473,970Interest rate of 7.80%, due 2007 200,000 200,000Interest rates of 6.92% to 8.91%,
due through 2012 117,701 – Bonds, interest rate of 7.60%, due in 2098 239,389 239,382Medium term notes:
Interest rates of 9.95% to 10.57%, due through 2007 59,054 62,510
Other 467 – $1,836,616 $975,862
On February 12, 2001, senior unsecured notes were issued in theamount of $750,000,000. These notes are guaranteed by all of oursubsidiaries that are not considered minor as defined by SEC reg-ulations. Net proceeds from the borrowings were used to repayindebtedness, principally borrowings under the commercialpaper program, and for general corporate purposes. The noteswere issued in three tranches, with the following terms and interest rates:Amount Maturity Rate
$250,000,000 2004 6.625%$250,000,000 2006 6.875%$250,000,000 2011 7.250%
In conjunction with the American Freightways acquisition onFebruary 9, 2001, debt of $240,000,000 was assumed, a portion ofwhich was refinanced subsequent to the acquisition. As of May 31, 2001, $117,701,000 of the assumed debt had not been refinanced and remained outstanding. This debt matures through2012 and bears interest at rates of 6.92% to 8.91%.
Scheduled annual principal maturities of long-term debt for thefive years subsequent to May 31, 2001, are as follows: $221,400,000in 2002; $18,400,000 in 2003; $287,300,000 in 2004; $17,600,000 in2005; and $273,400,000 in 2006.
Long-term debt, exclusive of capital leases, had carrying values of$1,919,000,000 and $1,063,000,000 at May 31, 2001 and 2000, respec-tively, compared with fair values of approximately $1,999,000,000and $1,055,000,000 at those dates. The estimated fair values weredetermined based on quoted market prices or on the current ratesoffered for debt with similar terms and maturities.
NOTE 5: LEASE COMMITMENTS
We utilize certain aircraft, land, facilities and equipment undercapital and operating leases that expire at various dates through2038. In addition, supplemental aircraft are leased under agree-ments that generally provide for cancellation upon 30 days’ notice.
The components of property and equipment recorded under capi-tal leases were as follows:May 31 In thousands 2001 2000
Package handling and ground support equipment and vehicles $196,900 $226,580
Facilities 136,178 134,442Computer and electronic equipment and other 2,858 6,852
335,936 367,874Less accumulated amortization 236,921 260,526
$ 99,015 $107,348
FedEx Corporation
25
Rent expense under operating leases for the years ended May 31was as follows:In thousands 2001 2000 1999
Minimum rentals $1,398,620 $1,298,821 $1,246,259Contingent rentals 91,230 98,755 59,839
$1,489,850 $1,397,576 $1,306,098
Contingent rentals are based on hours flown under supplementalaircraft leases.
A summary of future minimum lease payments under capitalleases and noncancellable operating leases (principally aircraftand facilities) with an initial or remaining term in excess of oneyear at May 31, 2001 is as follows:
Capital Operating In thousands Leases Leases
2002 $ 15,416 $ 1,246,9362003 15,279 1,134,4132004 15,132 1,043,5492005 15,044 981,7772006 15,040 916,084Thereafter 274,665 9,040,570
$350,576 $14,363,329
At May 31, 2001, the present value of future minimum lease pay-ments for capital lease obligations, including certain tax-exemptbonds, was $202,107,000.
FedEx Express makes payments under certain leveraged operatingleases that are sufficient to pay principal and interest on certainpass-through certificates. The pass-through certificates are notdirect obligations of, or guaranteed by, us or FedEx Express.
NOTE 6: PREFERRED STOCK
The Certificate of Incorporation authorizes the Board of Directors,at its discretion, to issue up to 4,000,000 shares of Series PreferredStock. The stock is issuable in series, which may vary as to cer-tain rights and preferences, and has no par value. As of May 31,2001, none of these shares had been issued.
NOTE 7: COMMON STOCKHOLDERS’ INVESTMENT
Treasury Shares
During 2000, we purchased 15,208,356 treasury shares. Of theseshares, 15,000,000, or approximately 5% of our outstanding sharesof common stock, were purchased under a stock repurchase pro-gram at an average cost of $39.75 per share. Approximately11,000,000 of the shares held in treasury were reissued February9, 2001, for the acquisition of American Freightways. During 2001and 2000, treasury shares were also utilized for issuances underthe stock compensation plans discussed below. At May 31, 2001,
and 2000, respectively, 1,244,490 and 14,128,998 shares remained in treasury.
Stock Compensation Plans
Options and awards outstanding under stock-based compen-sation plans at May 31, 2001 are described below. As of May 31,2001, 25,880,128 shares of common stock were reserved forissuance under these plans. The Board of Directors has author-ized the repurchase of common stock necessary for grants oroption exercises under these stock plans.
Accounting Principles Board Opinion No. 25, “Accounting forStock Issued to Employees,” and related interpretations isapplied to measure compensation expense for stock-based com-pensation plans. If compensation cost for stock-based compen-sation plans had been determined under SFAS 123, “Accountingfor Stock-Based Compensation,” net income and earnings pershare would have been the pro forma amounts indicated below:In thousands, except per share amounts 2001 2000 1999
Net income:As reported $584,371 $688,336 $631,333Pro forma 553,033 659,601 609,960
Earnings per share, assuming dilution:As reported $ 1.99 $ 2.32 $ 2.10Pro forma 1.89 2.23 2.03
Fixed Stock Option Plans
Under the provisions of our stock incentive plans, options may begranted to certain key employees (and, under the 1997 plan, todirectors who are not employees) to purchase shares of commonstock at a price not less than its fair market value at the date of grant. Options granted have a maximum term of 10 years.Vesting requirements are determined at the discretion of theCompensation Committee of the Board of Directors. Presently,option vesting periods range from one to eight years. At May 31,2001, there were 7,218,032 shares available for future grantsunder these plans.
Beginning with the grants made on or after June 1, 1995, the fairvalue of each option grant was estimated on the grant date usingthe Black-Scholes option-pricing model with the followingassumptions for each option grant:
2001 2000 1999
Dividend yield 0% 0% 0%Expected volatility 35% 30% 25%Risk-free interest rate 4.3%–6.5% 5.6%–6.8% 4.2%–5.6%Expected lives 2.5–5.5 years 2.5–9.5 years 2.5–5.5 years

Notes to Consolidated Financial Statements
26
The following table summarizes information about our fixed stock option plans for the years ended May 31:
2001 2000 1999Weighted-Average Weighted-Average Weighted-Average
Shares Exercise Price Shares Exercise Price Shares Exercise Price
Outstanding at beginning of year 15,010,651 $29.12 13,399,532 $23.11 13,388,452 $19.74Granted and assumed 4,267,753(1) 31.19 3,218,450 50.79 3,377,500 31.80Exercised (1,465,684) 20.02 (1,232,699) 18.81 (3,135,640) 17.86Forfeited (314,162) 37.25 (374,632) 33.81 (230,780) 26.59___________________ ___________________ ___________________
Outstanding at end of year 17,498,558 30.24 15,010,651 29.12 13,399,532 23.11___________________ ___________________ ___________________
Exercisable at end of year 8,704,009 25.09 5,781,855 21.44 4,404,146 18.57
(1) Includes 1,479,016 options assumed upon acquisition of American Freightways in 2001.
The weighted-average fair value of options granted during the year was $13.19, $16.63 and $9.12 for the years ended May 31, 2001, 2000and 1999, respectively.
The following table summarizes information about fixed stock options outstanding at May 31, 2001:
Options Outstanding Options ExercisableWeighted-Average
Range of Number Remaining Weighted-Average Number Weighted-AverageExercise Prices Outstanding Contractual Life Exercise Price Exercisable Exercise Price
$ 8.63–$12.00 157,274 0.6 years $10.13 157,274 $10.1312.19– 17.70 2,261,561 3.9 years 15.69 1,899,134 15.5918.45– 25.19 4,687,294 4.8 years 20.44 3,023,630 20.4826.44– 37.25 7,018,067 7.4 years 32.41 2,860,491 30.2438.69– 55.94 3,374,362 8.3 years 50.04 763,480 50.75___________________ _________________
8.63– 55.94 17,498,558 6.4 years 30.24 8,704,009 25.09
Restricted Stock Plans
Under the terms of our Restricted Stock Plans, shares of common stock are awarded to key employees. All restrictions on the sharesexpire over periods varying from two to five years from their date of award. Shares are valued at the market price at the date of award.Compensation related to these plans is recorded as a reduction of common stockholders’ investment and is being amortized to expense asrestrictions on such shares expire. In March 2001, the Board of Directors approved an additional restricted stock plan, which authorizedthe issuance of up to 1,000,000 common shares. The following table summarizes information about restricted stock awards for the yearsended May 31:
2001 2000 1999Weighted-Average Weighted-Average Weighted-Average
Shares Fair Value Shares Fair Value Shares Fair Value
Awarded 330,250 $39.89 283,750 $51.90 252,000 $32.71Forfeited 8,438 40.92 20,000 37.71 16,900 44.38
At May 31, 2001, there were 1,163,538 shares available for future awards under these plans. Compensation cost for the restricted stockplans was $11,426,000, $12,178,000 and $8,928,000 for 2001, 2000 and 1999, respectively.

FedEx Corporation
27
NOTE 8: COMPUTATION OF EARNINGS PER SHARE
The calculation of basic earnings per share and earnings per share, assuming dilution, for the years ended May 31 was as follows:In thousands, except per share amounts 2001 2000 1999
Net income applicable to common stockholders $584,371 $688,336 $631,333Weighted-average common shares outstanding 288,745 291,727 295,983Basic earnings per share $ 2.02 $ 2.36 $ 2.13Weighted-average common shares outstanding 288,745 291,727 295,983Common equivalent shares:
Assumed exercise of outstanding dilutive options 14,690 12,735 13,090Less shares repurchased from proceeds of assumed exercise of options (10,256) (8,136) (8,430)
Weighted-average common and common equivalent shares outstanding 293,179 296,326 300,643Earnings per share, assuming dilution $ 1.99 $ 2.32 $ 2.10
NOTE 9: INCOME TAXES
The components of the provision for income taxes for the yearsended May 31 were as follows:In thousands 2001 2000 1999Current provision:
DomesticFederal $310,408 $365,137 $385,164State and local 42,788 48,837 49,918
Foreign 36,152 39,844 22,730389,348 453,818 457,812
Deferred provision (credit):Domestic
Federal (43,043) (3,444) (21,773)State and local (3,088) 469 (4,437)
Foreign (15) (1,439) (1,871)(46,146) (4,414) (28,081)
$343,202 $449,404 $429,731
Income taxes have been provided for foreign operations basedupon the various tax laws and rates of the countries in whichoperations are conducted. There is no direct relationship betweenour overall foreign income tax provision and foreign pretax bookincome due to the different methods of taxation used by coun-tries throughout the world.
A reconciliation of the statutory federal income tax rate to theeffective income tax rate for the years ended May 31 is as follows:
2001 2000 1999Statutory U.S. income tax rate 35.0% 35.0% 35.0%Increase resulting from:
State and local income taxes, net of federal benefit 2.8 2.8 2.8
Other, net (0.8) 1.7 2.7 Effective tax rate 37.0% 39.5% 40.5%
The significant components of deferred tax assets and liabilities as of May 31 were as follows:
In thousands 2001 2000Deferred Tax Deferred Tax Deferred Tax Deferred Tax
Assets Liabilities Assets Liabilities
Property, equipment and leases $ 268,696 $ 815,504 $206,239 $686,547Employee benefits 225,931 118,104 207,297 127,784Self-insurance accruals 276,886 – 245,923 –Other 241,587 99,677 224,615 96,572
$1,013,100 $1,033,285 $884,074 $910,903
NOTE 10: EMPLOYEE BENEFIT PLANS
PENSION PLANS. We sponsor defined benefit pension plans cov-ering a majority of employees. The largest plan covers certainU.S. employees age 21 and over, with at least one year of service,and provides benefits based on average earnings and years ofservice. Plan funding is actuarially determined, and is also sub-ject to certain tax law limitations. International defined benefit
pension plans provide benefits primarily based on final earningsand years of service and are funded in accordance with locallaws and income tax regulations. Plan assets consist primarily of marketable equity securities and fixed income instruments.
In 2001, we changed the actuarial valuation measurement datefor certain of our pension plans from May 31 to February 28 toconform to the measurement date used for our postretirement

Notes to Consolidated Financial Statements
28
The following table provides a reconciliation of the changes in the pension and postretirement health care plans’ benefit obligations andfair value of assets over the two-year period ended May 31, 2001 and a statement of the funded status as of May 31, 2001 and 2000:In thousands Pension Plans Postretirement Health Care Plans
2001 2000 2001 2000
CHANGE IN BENEFIT OBLIGATIONBenefit obligation at beginning of year $4,493,745 $ 4,385,519 $ 257,007 $ 246,186
Service cost 325,371 337,780 25,021 26,450Interest cost 382,391 336,143 22,929 19,579Amendments and benefit enhancements 39,254 12,853 371 1,420Actuarial loss (gain) 210,692 (510,132) (12,141) (28,607)Plan participant contributions – – 1,722 1,112Curtailment gain – – (1,232) – Foreign currency exchange rate changes (10,666) (618) – – Benefits paid (56,879) (67,800) (8,044) (9,133)
Benefit obligation at end of year $5,383,908 $ 4,493,745 $ 285,633 $ 257,007CHANGE IN PLAN ASSETSFair value of plan assets at beginning of year $5,727,416 $ 4,952,431 $ – $ –
Actual return on plan assets (142,537) 630,706 – – Foreign currency exchange rate changes (2,689) (5,192) – – Company contributions 96,723 217,271 6,322 8,021Plan participant contributions – – 1,722 1,112Benefits paid (56,879) (67,800) (8,044) (9,133)
Fair value of plan assets at end of year $5,622,034 $ 5,727,416 $ – $ – FUNDED STATUS OF THE PLANS $ 238,126 $ 1,233,671 $(285,633) $(257,007)
Unrecognized actuarial gain (159,958) (1,173,903) (60,099) (49,286)Unrecognized prior service cost 144,003 121,697 952 254Unrecognized transition amount (9,511) (10,529) – –
Prepaid (accrued) benefit cost $ 212,660 $ 170,936 $(344,780) $(306,039)AMOUNTS RECOGNIZED IN THEBALANCE SHEET AT MAY 31:
Prepaid benefit cost $ 365,340 $ 302,935 $ – $ – Accrued benefit liability (152,680) (131,999) (344,780) (306,039)Minimum pension liability (19,848) (12,662) – – Intangible asset 19,848 12,662 – –
Prepaid (accrued) benefit cost $ 212,660 $ 170,936 $(344,780) $(306,039)
health care plans and to facilitate our planning and budgetingprocess. Additionally, in connection with the 2001 valuation, wechanged to the calculated value method of valuing plan assets.These changes had no impact on our 2001 financial position orresults of operations.
The Federal Express Corporation Employees’ Pension Plan andthe FedEx Ground Package System, Inc. and Certain AffiliatesCareer Reward Pension Plan were merged effective May 31,2001. The name of the newly merged plan is the FedExCorporation Employees’ Pension Plan. No pension benefit formu-las were changed as a result of the merger.
POSTRETIREMENT HEALTH CARE PLANS. FedEx Express andFedEx Corporate Services, Inc. (“FedEx Services”) offer medicaland dental coverage to eligible U.S. retirees and their eligibledependents. Vision coverage is provided for retirees, but not theirdependents. Substantially all FedEx Express and FedEx ServicesU.S. employees become eligible for these benefits at age 55 and older, if they have permanent, continuous service of at least10 years after attainment of age 45 if hired prior to January 1, 1988,or at least 20 years after attainment of age 35 if hired on or afterJanuary 1, 1988. Life insurance benefits are provided only to retireesof the former Tiger International, Inc. who retired prior to acquisition.FedEx Ground offers similar benefits to its eligible retirees.

FedEx Corporation
29
WEIGHTED-AVERAGE ACTUARIAL ASSUMPTIONSPension Plans Postretirement Health Care Plans
2001 2000 1999 2001 2000 1999
Discount rate 7.7% 8.5% 7.5% 8.2% 8.3% 7.3%Rate of increase in future
compensation levels 4.0 5.0 4.6 – – –Expected long-term rate of
return on assets 10.9 10.9 10.9 – – –
Net periodic benefit cost for the years ended May 31 was as follows:In thousands Pension Plans Postretirement Health Care Plans
2001 2000 1999 2001 2000 1999
Service cost $ 325,371 $ 337,780 $ 331,005 $25,021 $26,450 $23,676Interest cost 382,391 336,143 288,221 22,929 19,579 16,962Expected return on plan assets (623,735) (546,169) (483,709) – – –Net amortization and deferral (23,702) 5,977 (1,948) (1,267) (93) (211)Curtailment gain – – – (1,620) – –
$ 60,325 $ 133,731 $ 133,569 $45,063 $45,936 $40,427
The projected benefit obligation, accumulated benefit obligationand fair value of plan assets for the pension plans with benefit obli-gations in excess of plan assets were $258,700,000, $211,700,000and $57,100,000, respectively, as of May 31, 2001, and $177,900,000,$126,300,000 and $2,700,000, respectively, as of May 31, 2000.
Future medical benefit costs are estimated to increase at anannual rate of 8.0% during 2002, decreasing to an annual growthrate of 6.0% in 2007 and thereafter. Future dental benefit costswere estimated to increase at an annual rate of 7.3% during 2002,decreasing to an annual growth rate of 6.0% in 2007 and there-after. Our cost is capped at 150% of the 1993 employer cost and,therefore, is not subject to medical and dental trends after thecapped cost is attained. A 1% change in these annual trend rateswould not have a significant impact on the accumulated postre-tirement benefit obligation at May 31, 2001, or 2001 benefitexpense. Claims are paid as incurred.
DEFINED CONTRIBUTION PLANS. Profit sharing and other definedcontribution plans are in place covering a majority of U.S. employ-ees age 21 and over, with at least one year of service as of thecontribution date. Profit sharing plans provide for discretionaryemployer contributions, which are determined annually by theBoard of Directors. Other plans provide matching funds based onemployee contributions to 401(k) plans. Expense under these
plans was $99,400,000 in 2001, $125,300,000 in 2000 and$137,500,000 in 1999. Included in these expense amounts are cashdistributions made directly to employees of $44,800,000,$39,100,000 and $46,800,000 in 2001, 2000 and 1999, respectively.
NOTE 11: BUSINESS SEGMENT INFORMATION
We have determined our reportable operating segments to beFedEx Express, FedEx Ground and FedEx Freight, each of whichoperates in a single line of business. Segment financial perfor-mance is evaluated based on operating income.
Certain segment assets associated with the sales, marketing andinformation technology departments previously recorded at FedExExpress and FedEx Ground were transferred to FedEx Services inconjunction with its formation effective June 1, 2000. The relateddepreciation and amortization for those assets is now allocatedto these operating segments as “Intercompany charges.”Consequently, 2001 depreciation and amortization expense,assets and capital expenditure segment information presented isnot comparable to prior periods. We believe the total amountsallocated to the business segments reasonably reflect the cost ofproviding such services. Our Other segment also includes theoperations of Viking through November 30, 2000, certain unallo-cated corporate items and eliminations.

Notes to Consolidated Financial Statements
30
The following table provides a reconciliation of reportable seg-ment revenues, depreciation and amortization, operating incomeand segment assets to consolidated financial statement totals:In thousands 2001 2000 1999
RevenuesFedEx Express $15,533,567 $15,068,338 $13,979,277FedEx Ground 2,236,562 2,032,570 1,878,107FedEx Freight 835,298 – –Other 1,023,613 1,156,037 916,086
Consolidated Total $19,629,040 $18,256,945 $16,773,470Depreciation and amortization
FedEx Express $ 796,517 $ 997,735 $ 912,002FedEx Ground 110,934 99,140 82,640FedEx Freight 43,693 – –Other 324,630 57,988 40,476
Consolidated Total $ 1,275,774 $ 1,154,863 $ 1,035,118Operating income (loss)
FedEx Express $ 847,401(1) $ 899,610 $ 871,476(3)
FedEx Ground 175,150 225,812 231,010FedEx Freight 55,032 – –Other (6,693)(2) 95,652 60,600
Consolidated Total $ 1,070,890 $ 1,221,074 $ 1,163,086Segment assets
FedEx Express $ 9,570,621 $ 9,740,539FedEx Ground 1,157,988 1,057,519FedEx Freight 1,703,121 –Other 908,282 729,053
Consolidated Total $13,340,012 $11,527,111
(1) Includes $93,000,000 charge for impairment of certain assets related to the MD10 aircraft program and $9,000,000 charge related to the Ayres program.
(2) Includes $22,000,000 of FedEx Supply Chain Services reorganization costs.(3) Includes $81,000,000 of strike contingency costs.
The following table provides a reconciliation of reportable seg-ment capital expenditures to consolidated totals for the yearsended May 31:In thousands 2001 2000 1999
FedEx Express $1,233,051 $1,330,904 $1,550,161FedEx Ground 212,415 244,073 179,969FedEx Freight 62,276 – –Other 385,642 52,441 39,816Consolidated Total $1,893,384 $1,627,418 $1,769,946
The following table presents revenue by service type and geographic information for the years ended or as of May 31:In thousands 2001 2000 1999
REVENUE BY SERVICE TYPEFedEx Express:
Package:U.S. overnight box(1) $ 5,829,972 $ 5,683,663 $ 5,409,036U.S. overnight envelope(2) 1,870,881 1,854,181 1,776,426U.S. deferred 2,492,522 2,428,002 2,271,151
Total domestic package revenue 10,193,375 9,965,846 9,456,613
International priority 3,939,612 3,551,593 3,018,828Total package revenue 14,132,987 13,517,439 12,475,441
Freight:U.S. 650,779 566,259 439,855International 424,216 492,280 530,759
Other 325,585 492,360 533,222Total FedEx Express 15,533,567 15,068,338 13,979,277
FedEx Ground 2,236,562 2,032,570 1,878,107FedEx Freight 835,298 – –Other 1,023,613 1,156,037 916,086
$19,629,040 $18,256,945 $16,773,470GEOGRAPHIC INFORMATION(3)
Revenues:U.S. $14,857,625 $13,804,849 $12,910,107International 4,771,415 4,452,096 3,863,363
$19,629,040 $18,256,945 $16,773,470Long-lived assets:
U.S. $ 8,637,458 $ 7,224,219International 1,253,493 1,018,148
$ 9,890,951 $ 8,242,367
(1) The U.S. overnight box category includes packages exceeding eight ounces in weight.(2) The U.S. overnight envelope category includes envelopes weighing eight ounces
or less.(3) International revenue includes shipments that either originate in or are destined to
locations outside the United States. Long-lived assets include property and equip-ment, goodwill and other long-term assets. Flight equipment is allocated betweengeographic areas based on usage.

FedEx Corporation
31
NOTE 12: SUPPLEMENTAL CASH FLOW INFORMATION
Cash paid for interest expense and income taxes for the years ended May 31 was as follows:In thousands 2001 2000 1999
Interest (net of capitalized interest) $155,860 $124,964 $114,326Income taxes 444,850 354,614 437,340
Noncash investing and financing activities for the years ended May 31 were as follows:In thousands 2001 2000 1999
Fair value of assets surrendered under exchange agreements (with two airlines) $ – $ 19,450 $ 48,248Fair value of assets acquired under exchange agreements 4,868 28,018 34,580Fair value of assets surrendered (under) over fair value of assets acquired $ (4,868) $ (8,568) $ 13,668Fair value of treasury stock and common stock options issued in business acquisition $506,390 $ 6,817 $ –
NOTE 13: COMMITMENTS AND CONTINGENCIES
Annual purchase commitments under various contracts as of May 31, 2001, were as follows:Aircraft-
In thousands Aircraft Related(1) Other(2) Total
2002 $425,100 $611,200 $359,400 $1,395,7002003 411,500 610,300 13,200 1,035,0002004 231,500 525,000 8,000 764,5002005 261,500 254,300 7,600 523,4002006 228,700 189,700 7,600 426,000
(1) Primarily aircraft modifications, rotables, spare parts and spare engines.(2) Primarily facilities, vehicles, computer and other equipment.
FedEx Express is committed to purchase 27 MD11s, nine DC10s,seven A300s, seven A310s and 75 Ayres ALM 200s to be deliveredthrough 2007. See Note 15 for additional information regardingthe Ayres program. Deposits and progress payments of $8,300,000have been made toward these purchases and other planned air-craft transactions. Because Ayres Corporation filed for Chapter 11bankruptcy protection in November 2000, we believe it is unlikelythat any of the ALM 200 aircraft will be delivered to FedEx Express.The purchase commitment amounts related to these aircraft are$35,100,000, $96,100,000 and $75,800,000 in 2004, 2005 and 2006,respectively, and are included in the above table.
FedEx Express has entered into agreements with two airlines toacquire 53 DC10 aircraft (49 of which had been received as ofMay 31, 2001), spare parts, aircraft engines and other equipment,and maintenance services in exchange for a combination of aircraft engine noise reduction kits and cash. Delivery of theseaircraft began in 1997 and will continue through 2002. Addition-ally, these airlines may exercise put options through December 31,2003, requiring FedEx Express to purchase up to 10 additionalDC10s along with additional aircraft engines and equipment.
In January 2001, FedEx Express entered into a memorandum of understanding to acquire 10 A380 aircraft from AirbusIndustrie. The acquisition of these aircraft is subject to the exe-cution of a definitive purchase agreement, which is currentlyunder negotiation.
During most of 2001 and 2000, we entered into jet fuel hedgingcontracts on behalf of our subsidiary FedEx Express, which weredesigned to limit exposure to fluctuations in jet fuel prices. Underthose jet fuel hedging contracts, payments were made (or received)based on the difference between a fixed price and the marketprice of jet fuel, as determined by an index of spot market pricesrepresenting various geographic regions. The difference wasrecorded as an increase or decrease in fuel expense. Under jetfuel hedging contracts, we received $92,206,000 in 2001 and$18,512,000 in 2000. All outstanding jet fuel hedging contractswere effectively closed at May 31, 2001 by entering into offsettingjet fuel hedging contracts, resulting in a deferred charge ofapproximately $15,000,000, which will be recognized in 2002 asfuel is purchased. At May 31, 2000, the fair value of jet fuel hedgingcontracts, which had no carrying value, was an asset of approxi-mately $51,060,000.

Notes to Consolidated Financial Statements
32
NOTE 14: LEGAL PROCEEDINGS
We are subject to legal proceedings and claims that arise in theordinary course of our business. In our opinion, the aggregate lia-bility, if any, with respect to these actions will not materiallyadversely affect our financial position or results of operations.
NOTE 15: ASSET IMPAIRMENTS
Asset impairment adjustments of $102,000,000 at FedEx Expresswere recorded in the fourth quarter of 2001. Impaired assetswere adjusted to fair value based on estimated fair market val-ues. All charges relating to asset impairments were reflected asother operating expenses in the Consolidated Statements ofIncome. The asset impairment charge was comprised of two parts:
Certain assets related to the MD10 aircraft program $ 93,000,000Ayres Loadmaster program deposits and other 9,000,000
$102,000,000
These aircraft procurement programs were in place to ensureadequate aircraft capacity for future volume growth. Due to low-ered capacity requirements, it became evident during the fourthquarter of 2001 that FedEx Express had more aircraft capacitycommitments than required. Certain aircraft awaiting modifica-tion under the MD10 program and the purchase commitments forthe Ayres aircraft were evaluated and determined to be impaired.
The MD10 program curtailment charge is comprised primarily ofthe write down of impaired DC10 airframes, engines and parts toa nominal estimated salvage value. Costs relating to the disposalof the assets were also recorded. These assets are expected tobe disposed of primarily during 2002. The Ayres Loadmaster program
charge is comprised primarily of the write-off of deposits for aircraft purchases. Capitalized interest and other costs estimatedto be unrecoverable in connection with the bankruptcy of AyresCorporation were also expensed.
NOTE 16: OTHER EVENTS
On April 24, 2001, FedEx Supply Chain Services committed to a planto reorganize certain of its unprofitable, nonstrategic logistics busi-ness and reduce overhead. Total 2001 costs of $22,000,000 wereincurred in connection with this plan, primarily comprising costs forestimated contractual settlements ($8,000,000), asset impairmentcharges ($5,000,000) and severance and employee separation($5,000,000). Asset impairment charges were recognized to reducethe carrying value of long-lived assets (primarily software) to esti-mated fair values, and an accrual of $17,000,000 was recorded forthe remaining reorganization costs. The accrual had a balance ofapproximately $12,000,000 remaining at May 31, 2001, reflecting pri-marily the payment of severance costs and contractual settlements.Approximately 120 principally administrative positions were elimi-nated under the plan. The reorganization will be completed in 2002.
On January 10, 2001, FedEx Express and the U.S. Postal Serviceentered into two service contracts: one for domestic air trans-portation of postal express shipments, and the other for placementof FedEx Drop Boxes at U.S. Post Offices.
In 2000, FedEx Express recorded nonoperating gains of approxi-mately $11,000,000 from the sale of securities and approximately$12,000,000 from the insurance settlement for a leased MD11 air-craft destroyed in October 1999.
NOTE 17: SUMMARY OF QUARTERLY OPERATING RESULTS (UNAUDITED)First Second Third Fourth
In thousands, except per share amounts Quarter Quarter Quarter Quarter(1)
2001Revenues $4,778,736 $4,894,921 $4,838,780 $5,116,603Operating income 310,967 345,412 191,305 223,206Income before income taxes 274,245 315,128 158,489 179,711Net income 168,660 193,804 108,689 113,218Earnings per common share .59 .68 .38 .38Earnings per common share – assuming dilution .58 .67 .37 .38
2000Revenues $4,319,977 $4,570,104 $4,518,057 $4,848,807Operating income 283,807 304,535 206,472 426,260Income before income taxes 262,880 282,928 186,998 404,934Net income 159,034 171,183 113,128 244,991Earnings per common share .53 .58 .39 .86Earnings per common share – assuming dilution .52 .57 .39 .85
(1) Fourth quarter of 2001 includes a $102,000,000 charge for impairment of certain assets related to aircraft programs at FedEx Express and a $22,000,000 reorganization charge atFedEx Supply Chain Services.

33
REPORT OF INDEPENDENT PUBLIC ACCOUNTANTS
To the Stockholders of FedEx Corporation:
We have audited the accompanying consolidated balancesheets of FedEx Corporation (a Delaware corporation) and subsidiaries as of May 31, 2001 and 2000, and the related consoli-dated statements of income, changes in stockholders’ invest-ment and comprehensive income and cash flows for each of thethree years in the period ended May 31, 2001. These financialstatements are the responsibility of FedEx’s management. Ourresponsibility is to express an opinion on these financial state-ments based on our audits.
We conducted our audits in accordance with auditing standardsgenerally accepted in the United States. Those standards requirethat we plan and perform the audit to obtain reasonable assur-ance about whether the financial statements are free of materialmisstatement. An audit includes examining, on a test basis, evi-dence supporting the amounts and disclosures in the financialstatements. An audit also includes assessing the accountingprinciples used and significant estimates made by management,as well as evaluating the overall financial statement presenta-tion. We believe that our audits provide a reasonable basis forour opinion.
In our opinion, the financial statements referred to above presentfairly, in all material respects, the financial position of FedExCorporation as of May 31, 2001 and 2000, and the results of itsoperations and its cash flows for each of the three years in theperiod ended May 31, 2001, in conformity with accounting princi-ples generally accepted in the United States.
Memphis, TennesseeJune 27, 2001

34
SELECTED CONSOLIDATED FINANCIAL DATA
Years ended May 31, In thousands, except per share amounts and Other Operating Data 2001 2000 1999 1998 1997
OPERATING RESULTS
Revenues $19,629,040 $18,256,945 $16,773,470 $15,872,810 $14,237,892Operating income(1) 1,070,890 1,221,074 1,163,086 1,010,660 507,002Income from continuing operations before income taxes 927,573 1,137,740 1,061,064 899,518 425,865Income from continuing operations 584,371 688,336 631,333 498,155 196,104Income from discontinued operations – – – 4,875 –Net income(1) $ 584,371 $ 688,336 $ 631,333 $ 503,030 $ 196,104PER SHARE DATA
Earnings per share:Basic:
Continuing operations $ 2.02 $ 2.36 $ 2.13 $ 1.70 $ .67Discontinued operations – – – .02 –
$ 2.02 $ 2.36 $ 2.13 $ 1.72 $ .67Assuming dilution:
Continuing operations $ 1.99 $ 2.32 $ 2.10 $ 1.67 $ .67Discontinued operations – – – .02 –
$ 1.99 $ 2.32 $ 2.10 $ 1.69 $ .67Average shares of common stock outstanding 288,745 291,727 295,983 293,401 291,426Average common and common equivalent
shares outstanding 293,179 296,326 300,643 298,408 294,456Cash dividends(2) – – – – –FINANCIAL POSITION
Property and equipment, net $ 8,100,055 $ 7,083,527 $ 6,559,217 $ 5,935,050 $ 5,470,399Total assets 13,340,012 11,527,111 10,648,211 9,686,060 9,044,316Long-term debt, less current portion 1,900,119 1,776,253 1,359,668 1,385,180 1,597,954Common stockholders’ investment 5,900,420 4,785,243 4,663,692 3,961,230 3,501,161OTHER OPERATING DATA
FedEx Express:Operating weekdays 255 257 256 254 254Aircraft fleet 640 663 634 613 584
FedEx Ground:Operating weekdays 254 254 253 256 254
FedEx Freight:(3)
Operating weekdays 107 – – – –Average full-time equivalent employees 176,960 163,324 156,386 150,823 145,995
(1) Asset impairment charges of $102,000,000 ($64,770,000, net of tax) at FedEx Express and reorganization costs of $22,000,000 ($13,530,000, net of tax) at FedEx Supply Chain Serviceswere recorded in 2001. See Notes 15 and 16 of Notes to Consolidated Financial Statements included elsewhere herein. In connection with its 1997 restructuring, Viking recorded apretax asset impairment charge of $225,000,000 ($175,000,000, net of tax).
(2) Caliber declared dividends of $3,899,000 and $28,184,000 for 1998 and 1997, respectively. Caliber declared additional dividends of $10,833,000 from January 1, 1997 to May 25, 1997that are not included in the preceding amounts. FedEx has never paid cash dividends on its common stock.
(3) FedEx Freight results for 2001 include the operations of Viking from December 1, 2000 and American Freightways from January 1, 2001. FedEx Freight statistics for 2001 include theoperations of both Viking and American Freightways from January 1, 2001.

35
BOARD OF DIRECTORS
James L. Barksdale(3)
Managing PartnerThe Barksdale GroupVenture capital firm
Robert L. Cox(1)
PartnerWaring CoxLaw firm
Ralph D. DeNunzio(2 *)
PresidentHarbor Point Associates, Inc.Private investment and consulting firm
Judith L. Estrin(3 *)
President and Chief Executive OfficerPacket Design, Inc.Internet technology company
F. Sheridan GarrisonChairman Emeritus and FounderAmerican Freightways, Inc.
Philip Greer(1 *)
Senior Managing DirectorWeiss, Peck & Greer, L.L.C.Investment management firm
J.R. Hyde, III(2)
ChairmanPittco Management, LLCInvestment management firm
Dr. Shirley A. Jackson(3)
PresidentRensselaer Polytechnic InstituteTechnological university
George J. Mitchell(1)
Special CounselVerner, Liipfert, Bernhard, McPherson and HandLaw firm
Frederick W. SmithChairman, President and Chief Executive OfficerFedEx Corporation
Dr. Joshua I. Smith(1)
Chairman and Managing PartnerCoaching Group, LLCConsulting firm
Paul S. Walsh(2)
Group Chief Executive OfficerDiageo plcConsumer food and beverage company
Peter S. Willmott(1)
Chairman and Chief Executive OfficerWillmott Services, Inc.Retail and consulting firm
(1) Audit Committee(2) Compensation Committee(3) Information Technology Oversight Committee(*) Committee Chair

36
EXECUTIVE OFFICERS
FEDEX CORPORATION
Frederick W. SmithChairman, President andChief Executive Officer
Alan B. Graf, Jr.Executive Vice President andChief Financial Officer
Robert B. Carter Executive Vice President and Chief Information Officer
FEDEX EXPRESS
David J. BronczekPresident and Chief Executive Officer
David F. RebholzExecutive Vice President,Operations and Systems Support
Michael L. DuckerExecutive Vice President,International
FEDEX FREIGHT
Douglas G. DuncanPresident and Chief Executive Officer
Thomas R. GarrisonPresident and Chief Executive Officer,American Freightways, Inc.
Tilton G. GorePresident and Chief Executive Officer,Viking Freight, Inc.
Kenneth R. MastersonExecutive Vice President,General Counsel and Secretary
T. Michael GlennExecutive Vice President,Market Development and Corporate Communications
James S. HudsonCorporate Vice President andChief Accounting Officer
FEDEX GROUND
Daniel J. SullivanPresident and Chief Executive Officer
Ivan T. HofmannExecutive Vice President and Chief Operating Officer
Rodger G. MartickeExecutive Vice President,Administration
FEDEX CUSTOM CRITICAL
John G. PickardPresident and Chief Executive Officer
FEDEX TRADE NETWORKS
G. Edmond ClarkPresident and Chief Executive Officer

CORPORATE INFORMATION
STOCK LISTING: FedEx Corporation’s common stock is listed onthe New York Stock Exchange under the ticker symbol FDX.
STOCKHOLDERS: At July 10, 2001, there were 17,778 stockholdersof record.
MARKET INFORMATION: Following are high and low sale prices,by quarter, for FedEx Corporation common stock in 2001 and 2000.We have not declared any cash dividends.
First Second Third FourthQuarter Quarter Quarter Quarter
FY 2001High $43.44 $49.85 $48.40 $44.24Low 33.38 38.04 36.35 35.50
FY 2000High $57.13 $47.31 $47.94 $42.44Low 38.50 34.88 33.19 30.56
CORPORATE HEADQUARTERS: 942 South Shady Grove Road,Memphis, Tennessee 38120, (901) 818-7500.
ANNUAL MEETING: The annual meeting of stockholders will beheld at the Peabody Hotel, 149 Union Avenue, Memphis, Tennesseeon Monday, September 24, 2001, at 10:00 a.m. Central time.
GENERAL AND MEDIA INQUIRIES: Contact Shirlee M. Clark,Director, Public Relations, FedEx Corporation, 942 South ShadyGrove Road, Memphis, Tennessee 38120, (901) 434-8400.
STOCKHOLDER ACCOUNT INQUIRIES: Contact EquiServe Trust Company, N.A., P.O. Box 2500, Jersey City, New Jersey07303-2500, (800) 446-2617/John H. Ruocco (312) 499-7033.
DIRECT STOCK PURCHASE INQUIRIES: For information on TheDirectServiceTM Investment Program for FedEx Corporation, call(800) 524-3120. This program provides an alternative to traditionalretail brokerage methods of purchasing, holding, and sellingFedEx common stock.
FINANCIAL INFORMATION, INCLUDING FORM 10-K: Copies of FedEx Corporation’s Annual Report on Form 10-K (excludingexhibits), other documents filed with the Securities and ExchangeCommission (SEC) and other financial and statistical informationare available on our Internet Web site at fedex.com. You will bemailed a copy of the Form 10-K upon request to InvestorRelations, FedEx Corporation, 942 South Shady Grove Road,Memphis, Tennessee 38120, (901) 818-7200. Documents filed elec-tronically with the SEC can also be found on the Internet at theSEC’s Web site at www.sec.gov.
INVESTMENT COMMUNITY INQUIRIES: Contact J. H. Clippard, Jr.,Vice President, Investor Relations, FedEx Corporation, 942 SouthShady Grove Road, Memphis, Tennessee 38120, (901) 818-7200, orvisit the Company’s Web site at fedex.com.
AUDITORS: Arthur Andersen LLP, Memphis, Tennessee.
EQUAL EMPLOYMENT OPPORTUNITY: FedEx Corporation isfirmly committed to afford Equal Employment Opportunity to allindividuals regardless of age, sex, race, color, religion, national origin, citizenship, disability, or status as a Vietnam era or specialdisabled veteran. We are strongly bound to this commitmentbecause adherence to Equal Employment Opportunity principles isthe only acceptable way of life. We adhere to those principles notjust because they’re the law, but because it’s the right thing to do.
SERVICE MARKS: FedEx,® the FedEx® logo, FedEx InternationalPriority® and Federal Express® are registered service marks ofFederal Express Corporation. Reg. U.S. Pat. & Tm. Off. and in cer-tain other countries. Used under license. FedEx Insight,SM FedExExtra Hours,SM FedEx Global Trade Manager,SM the FedEx Express,SM
FedEx Ground,SM FedEx Custom Critical,SM Fedex Freight,SM FedExTrade NetworksSM and FedEx ServicesSM logos are service marksof Federal Express Corporation. Used under license. Viking is aservice mark of Viking Freight, Inc. and American Freightways isa service mark of American Freight Corporation.
Portions of this annual report were printed on recycled paper.
Des
ign
byA
ddis
on w
ww
.add
ison
.com
37

FedEx Corporation942 South Shady Grove RoadMemphis, Tennessee 38120fedex.com