federated mdt small cap growth fund · portfolio of investments january 31, 2020 (unaudited) shares...
TRANSCRIPT

Semi-Annual Shareholder Report
January 31, 2020
Share Class | Ticker A | QASGX C | QCSGX Institutional | QISGX
R6 | QLSGX
Federated MDT Small Cap Growth FundFund Established 2005
A Portfolio of Federated MDT Series
IMPORTANT NOTICE REGARDING REPORT DELIVERY
Beginning on January 1, 2021, as permitted by regulations adopted by theSecurities and Exchange Commission, paper copies of the Fund’s shareholderreports like this one will no longer be sent by mail, unless you specifically requestpaper copies of the reports from the Fund or from your financial intermediary,such as a broker-dealer or bank. Instead, the reports will be made available on awebsite, and you will be notified by mail each time a report is posted and providedwith a website link to access the report.
If you already elected to receive shareholder reports electronically, you will not beaffected by this change and you need not take any action. You may elect to receiveshareholder reports and other communications from the Fund or your financialintermediary electronically by contacting your financial intermediary (such as abroker-dealer or bank); other shareholders may call the Fund at1-800-341-7400, Option 4.
You may elect to receive all future reports in paper free of charge. You caninform the Fund or your financial intermediary that you wish to continuereceiving paper copies of your shareholder reports by contacting your financialintermediary (such as a broker-dealer or bank); other shareholders may call theFund at 1-800-341-7400, Option 4. Your election to receive reports in paper willapply to all funds held with the Fund complex or your financial intermediary.
Not FDIC Insured ▪ May Lose Value ▪ No Bank Guarantee

J. ChristopherDonahue
President
Federated MDT SmallCap Growth Fund
Letter from the PresidentDear Valued Shareholder,
I am pleased to present the Semi-Annual ShareholderReport for your fund covering the period fromAugust 1, 2019 through January 31, 2020. This reportincludes a complete listing of your fund’s holdings,performance information and financial statements alongwith other important fund information.
In addition, our website, FederatedInvestors.com, offerseasy access to valuable resources that include timelyfund updates, economic and market insights from ourinvestment strategists, and financial planning tools.
Thank you for investing with us. I hope you find thisinformation useful and look forward to keepingyou informed.
Sincerely,
J. Christopher Donahue, President

CONTENTS Portfolio of Investments Summary Table . . . . . . . . . . . . . . . . . . . . . . . . . . . . . . . . . . . . . . . . . . . . . . . . . . . . . . 1
Portfolio of Investments. . . . . . . . . . . . . . . . . . . . . . . . . . . . . . . . . . . . . . . . . . . . . . . . . . . . . . . . . . . . . . . . . . . . . . . . . . 2
Financial Highlights . . . . . . . . . . . . . . . . . . . . . . . . . . . . . . . . . . . . . . . . . . . . . . . . . . . . . . . . . . . . . . . . . . . . . . . . . . . . . . 11
Statement of Assets and Liabilities. . . . . . . . . . . . . . . . . . . . . . . . . . . . . . . . . . . . . . . . . . . . . . . . . . . . . . . . . . . . . 15
Statement of Operations. . . . . . . . . . . . . . . . . . . . . . . . . . . . . . . . . . . . . . . . . . . . . . . . . . . . . . . . . . . . . . . . . . . . . . . . . 17
Statement of Changes in Net Assets. . . . . . . . . . . . . . . . . . . . . . . . . . . . . . . . . . . . . . . . . . . . . . . . . . . . . . . . . . . 18
Notes to Financial Statements . . . . . . . . . . . . . . . . . . . . . . . . . . . . . . . . . . . . . . . . . . . . . . . . . . . . . . . . . . . . . . . . . . 19
Shareholder Expense Example . . . . . . . . . . . . . . . . . . . . . . . . . . . . . . . . . . . . . . . . . . . . . . . . . . . . . . . . . . . . . . . . . 30
Evaluation and Approval of Advisory Contract . . . . . . . . . . . . . . . . . . . . . . . . . . . . . . . . . . . . . . . . . . . . . . . . 32
Voting Proxies on Fund Portfolio Securities . . . . . . . . . . . . . . . . . . . . . . . . . . . . . . . . . . . . . . . . . . . . . . . . . . . 40
Quarterly Portfolio Schedule . . . . . . . . . . . . . . . . . . . . . . . . . . . . . . . . . . . . . . . . . . . . . . . . . . . . . . . . . . . . . . . . . . . . 40
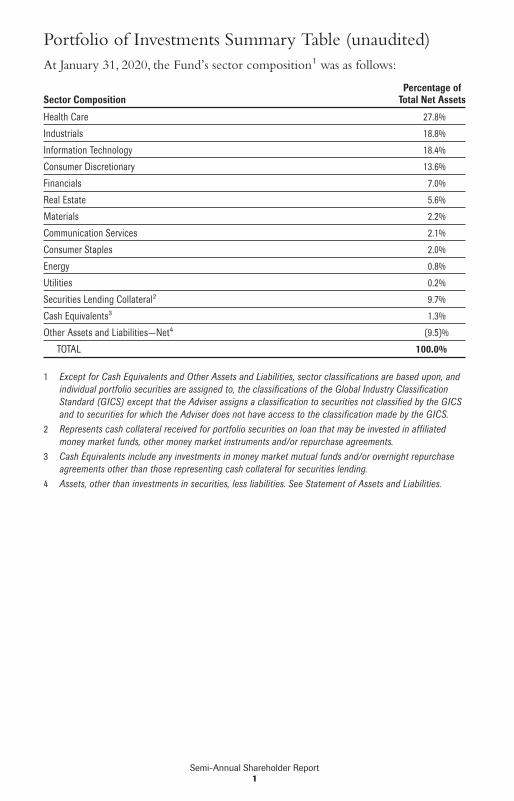
Portfolio of Investments Summary Table (unaudited)At January 31, 2020, the Fund’s sector composition1 was as follows:
Sector CompositionPercentage of
Total Net Assets
Health Care 27.8%
Industrials 18.8%
Information Technology 18.4%
Consumer Discretionary 13.6%
Financials 7.0%
Real Estate 5.6%
Materials 2.2%
Communication Services 2.1%
Consumer Staples 2.0%
Energy 0.8%
Utilities 0.2%
Securities Lending Collateral2 9.7%
Cash Equivalents3 1.3%
Other Assets and Liabilities—Net4 (9.5)%
TOTAL 100.0%
1 Except for Cash Equivalents and Other Assets and Liabilities, sector classifications are based upon, andindividual portfolio securities are assigned to, the classifications of the Global Industry ClassificationStandard (GICS) except that the Adviser assigns a classification to securities not classified by the GICSand to securities for which the Adviser does not have access to the classification made by the GICS.
2 Represents cash collateral received for portfolio securities on loan that may be invested in affiliatedmoney market funds, other money market instruments and/or repurchase agreements.
3 Cash Equivalents include any investments in money market mutual funds and/or overnight repurchaseagreements other than those representing cash collateral for securities lending.
4 Assets, other than investments in securities, less liabilities. See Statement of Assets and Liabilities.
Semi-Annual Shareholder Report1

Portfolio of InvestmentsJanuary 31, 2020 (unaudited)
Shares Value
COMMON STOCKS—98.5%
Communication Services—2.1%
167,369 1Cogent Communications Holdings, Inc. $ 11,871,483
46,124 1,2EverQuote, Inc. 1,692,290
176,359 2Imax Corp. 2,916,978
94,664 1Meredith Corp. 2,844,653
9,856 2TechTarget, Inc. 250,244
TOTAL 19,575,648
Consumer Discretionary—13.6%
98,174 2Asbury Automotive Group, Inc. 9,468,882
74,707 2Boot Barn Holdings, Inc. 3,135,453
7,478 1Brinker International, Inc. 319,236
282,317 2CROCs, Inc. 10,702,637
82,508 2Deckers Outdoor Corp. 15,751,602
237,293 2Denny’s Corp. 4,857,388
471,728 2Everi Holdings, Inc. 5,896,600
72,881 2Installed Building Products, Inc. 5,402,668
125,996 1,2iRobot Corp. 5,928,112
9,008 Johnson Outdoors, Inc., Class A 708,029
60,887 Lithia Motors, Inc., Class A 8,258,713
64,249 M.D.C. Holdings, Inc. 2,707,453
85,833 2MarineMax, Inc. 1,710,652
28,059 2Perdoceo Education Corp. 498,889
263,481 Rent-A-Center, Inc. 7,675,201
20,531 2Scientific Games Corp. 509,990
359,874 1,2SeaWorld Entertainment, Inc. 12,401,258
66,861 2Sleep Number Corp. 3,449,359
71,112 Steven Madden Ltd. 2,742,079
47,156 2TopBuild Corp. 5,399,833
158,723 1Wingstop, Inc. 14,724,733
129,835 1,2YETI Holdings, Inc. 4,720,801
TOTAL 126,969,568
Consumer Staples—2.0%
11,966 1Coca-Cola Bottling Co. 3,240,512
111,332 2elf Beauty, Inc. 1,745,686
57,547 2Freshpet, Inc. 3,618,555
10,322 J&J Snack Foods Corp. 1,711,801
Semi-Annual Shareholder Report2

Shares Value
COMMON STOCKS—continued
Consumer Staples—continued
5,354 MGP Ingredients, Inc. $ 182,357
126,958 2Performance Food Group Co. 6,575,155
2,971 Sanfilippo (John B. & Sons), Inc. 250,455
2,243 2The Boston Beer Co., Inc., Class A 799,360
71,869 Vector Group Ltd. 944,359
TOTAL 19,068,240
Energy—0.8%
232,373 2CONSOL Energy, Inc. 1,889,193
95,920 1CVR Energy, Inc. 3,319,791
852,888 1,2Denbury Resources, Inc. 840,095
66,610 2Par Petroleum Corp. 1,340,193
TOTAL 7,389,272
Financials—7.0%
5,919 2Atlantic Capital Bancshares, Inc. 111,692
94,055 2Enova International, Inc. 2,357,018
206,578 Essent Group Ltd. 10,248,335
50,361 1FB Financial Corp. 1,795,370
343,951 2Green Dot Corp. 10,346,046
40,460 Guaranty Bancshares, Inc. 1,238,076
86,140 Kinsale Capital Group, Inc. 9,838,911
47,578 1Lakeland Financial Corp. 2,257,100
255,404 2NMI Holdings, Inc. 8,152,496
71,439 National Bank Holdings Corp. 2,328,911
528,021 1National General Holdings Corp. 11,495,017
28,658 2Palomar Holdings, Inc. 1,531,770
49,106 Selective Insurance Group, Inc. 3,253,272
9,625 Wesbanco, Inc. 318,780
TOTAL 65,272,794
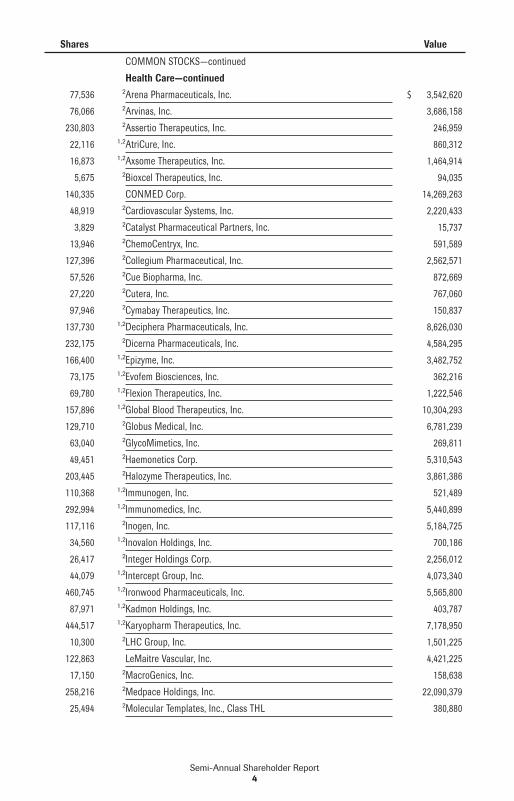
Health Care—27.8%
3,327 2Acceleron Pharma, Inc. 302,025
65,606 1,2Acer Therapeutics, Inc. 249,303
32,817 1,2Addus Homecare Corp. 3,095,956
51,904 2,3Adeptus Health, Inc. 0
132,303 1,2Aimmune Therapeutics, Inc. 4,108,008
42,468 2Alphatec Holdings, Inc. 295,577
28,151 1,2Amedisys, Inc. 4,968,370
272,232 1,2Amneal Pharmaceuticals, Inc. 1,222,322
33,466 1,2Applied Therapeutics, Inc. 1,755,961
Semi-Annual Shareholder Report3
Shares Value
COMMON STOCKS—continued
Health Care—continued
77,536 2Arena Pharmaceuticals, Inc. $ 3,542,620
76,066 2Arvinas, Inc. 3,686,158
230,803 2Assertio Therapeutics, Inc. 246,959
22,116 1,2AtriCure, Inc. 860,312
16,873 1,2Axsome Therapeutics, Inc. 1,464,914
5,675 2Bioxcel Therapeutics, Inc. 94,035
140,335 CONMED Corp. 14,269,263
48,919 2Cardiovascular Systems, Inc. 2,220,433
3,829 2Catalyst Pharmaceutical Partners, Inc. 15,737
13,946 2ChemoCentryx, Inc. 591,589
127,396 2Collegium Pharmaceutical, Inc. 2,562,571
57,526 2Cue Biopharma, Inc. 872,669
27,220 2Cutera, Inc. 767,060
97,946 2Cymabay Therapeutics, Inc. 150,837
137,730 1,2Deciphera Pharmaceuticals, Inc. 8,626,030
232,175 2Dicerna Pharmaceuticals, Inc. 4,584,295
166,400 1,2Epizyme, Inc. 3,482,752
73,175 1,2Evofem Biosciences, Inc. 362,216
69,780 1,2Flexion Therapeutics, Inc. 1,222,546
157,896 1,2Global Blood Therapeutics, Inc. 10,304,293
129,710 2Globus Medical, Inc. 6,781,239
63,040 2GlycoMimetics, Inc. 269,811
49,451 2Haemonetics Corp. 5,310,543
203,445 2Halozyme Therapeutics, Inc. 3,861,386
110,368 1,2Immunogen, Inc. 521,489
292,994 1,2Immunomedics, Inc. 5,440,899
117,116 2Inogen, Inc. 5,184,725
34,560 1,2Inovalon Holdings, Inc. 700,186
26,417 2Integer Holdings Corp. 2,256,012
44,079 1,2Intercept Group, Inc. 4,073,340
460,745 1,2Ironwood Pharmaceuticals, Inc. 5,565,800
87,971 1,2Kadmon Holdings, Inc. 403,787
444,517 1,2Karyopharm Therapeutics, Inc. 7,178,950
10,300 2LHC Group, Inc. 1,501,225
122,863 LeMaitre Vascular, Inc. 4,421,225
17,150 2MacroGenics, Inc. 158,638
258,216 2Medpace Holdings, Inc. 22,090,379
25,494 2Molecular Templates, Inc., Class THL 380,880
Semi-Annual Shareholder Report4

Shares Value
COMMON STOCKS—continued
Health Care—continued
84,359 2Momenta Pharmaceuticals, Inc. $ 2,448,098
56,566 2Natera, Inc. 1,980,376
4,056 National Healthcare Corp. 340,380
171,032 2NeoGenomics, Inc. 5,512,361
6,364 2Neuronetics, Inc. 23,101
55,566 2Nevro Corp. 7,385,277
94,315 2NuVasive, Inc. 7,273,573
6,561 2Omnicell, Inc. 533,278
9,595 1,2Orthofix Medical, Inc. 415,080
26,510 2PDL BioPharma, Inc. 87,218
29,280 2PTC Therapeutics, Inc. 1,507,920
9,990 2Principia Biopharma, Inc. 525,973
434,773 1,2Puma Biotechnology, Inc. 3,417,316
351,556 2R1 RCM, Inc. 4,394,450
110,920 2Radius Health, Inc. 1,947,755
9,577 2Reata Pharmaceuticals, Inc. 2,095,352
311,588 2Recro Pharma, Inc. 5,138,086
189,355 2Repligen Corp. 19,009,348
51,728 1,2Rocket Pharmaceuticals, Inc. 1,059,389
473,236 2Select Medical Holdings Corp. 10,808,710
24,554 Simulations Plus, Inc. 799,969
4,198 2Tandem Diabetes Care, Inc. 319,216
88,483 1,2Teladoc, Inc. 8,999,606
343,787 2Tenet Healthcare Corp. 10,877,421
87,380 1,2Tg Therapeutics, Inc. 1,241,670
4,830 2The Joint Corp. 80,661
78,611 2Theravance Biopharma, Inc. 2,191,675
9,295 2Turning Point Therapeutics, Inc. 543,757
79,250 2Vanda Pharmaceuticals, Inc. 1,010,437
16,956 2Verrica Pharmaceuticals, Inc. 246,032
476,071 2Voyager Therapeutics, Inc. 5,251,063
TOTAL 259,489,873
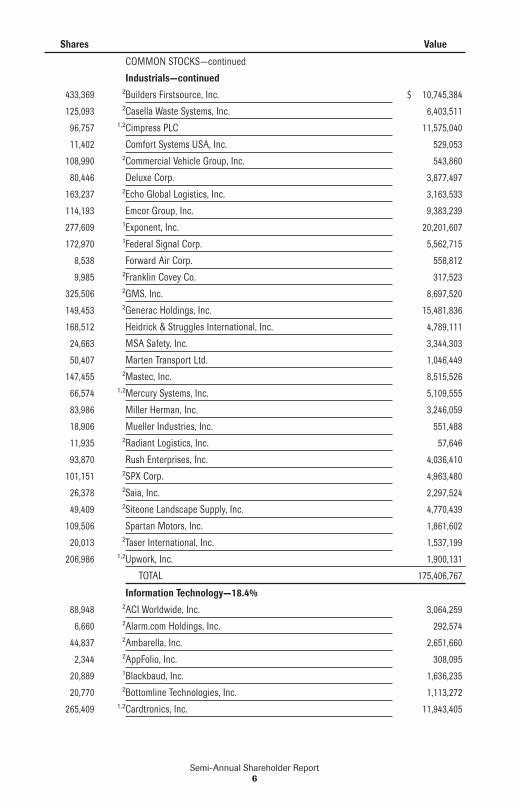
Industrials—18.8%
117,527 1,2Aerovironment, Inc. 7,828,473
19,519 Albany International Corp., Class A 1,361,841
6,921 Allegiant Travel Co. 1,163,005
28,679 Astec Industries, Inc. 1,182,722
473,619 2Atkore International Group, Inc. 18,802,674
Semi-Annual Shareholder Report5
Shares Value
COMMON STOCKS—continued
Industrials—continued
433,369 2Builders Firstsource, Inc. $ 10,745,384
125,093 2Casella Waste Systems, Inc. 6,403,511
96,757 1,2Cimpress PLC 11,575,040
11,402 Comfort Systems USA, Inc. 529,053
108,990 2Commercial Vehicle Group, Inc. 543,860
80,446 Deluxe Corp. 3,877,497
163,237 2Echo Global Logistics, Inc. 3,163,533
114,193 Emcor Group, Inc. 9,383,239
277,609 1Exponent, Inc. 20,201,607
172,970 1Federal Signal Corp. 5,562,715
8,538 Forward Air Corp. 558,812
9,985 2Franklin Covey Co. 317,523
325,506 2GMS, Inc. 8,697,520
149,453 2Generac Holdings, Inc. 15,481,836
168,512 Heidrick & Struggles International, Inc. 4,789,111
24,663 MSA Safety, Inc. 3,344,303
50,407 Marten Transport Ltd. 1,046,449
147,455 2Mastec, Inc. 8,515,526
66,574 1,2Mercury Systems, Inc. 5,109,555
83,986 Miller Herman, Inc. 3,246,059
18,906 Mueller Industries, Inc. 551,488
11,935 2Radiant Logistics, Inc. 57,646
93,870 Rush Enterprises, Inc. 4,036,410
101,151 2SPX Corp. 4,963,480
26,378 2Saia, Inc. 2,297,524
49,409 2Siteone Landscape Supply, Inc. 4,770,439
109,506 Spartan Motors, Inc. 1,861,602
20,013 2Taser International, Inc. 1,537,199
206,986 1,2Upwork, Inc. 1,900,131
TOTAL 175,406,767
Information Technology—18.4%
88,948 2ACI Worldwide, Inc. 3,064,259
6,660 2Alarm.com Holdings, Inc. 292,574
44,837 2Ambarella, Inc. 2,651,660
2,344 2AppFolio, Inc. 308,095
20,889 1Blackbaud, Inc. 1,636,235
20,770 2Bottomline Technologies, Inc. 1,113,272
265,409 1,2Cardtronics, Inc. 11,943,405
Semi-Annual Shareholder Report6

Shares Value
COMMON STOCKS—continued
Information Technology—continued
26,820 2Ciena Corp. $ 1,090,769
32,865 1,2Coda Octopus Group, Inc. 206,721
136,670 2Commvault Systems, Inc. 6,152,883
224,179 2Cornerstone OnDemand, Inc. 13,181,725
71,073 2Diebold Nixdorf, Inc. 818,050
177,220 1,2Digital Turbine, Inc. 1,105,853
3,966 2Envestnet, Inc. 312,798
300,422 Evertec, Inc. 10,085,167
128,659 2Evo Payments, Inc. 3,565,141
51,421 2Exela Technologies, Inc. 19,314
8,271 2Exlservice Holding, Inc. 604,693
79,968 1,2Five9, Inc. 5,736,105
13,676 2I3 Verticals, Inc. 441,598
178,480 1,2Inphi Corp. 13,557,341
65,864 1,2Insight Enterprises, Inc. 4,338,462
15,534 1,2Intelligent Systems Corp. 659,418
111,296 2Itron, Inc. 9,098,448
120,526 1,2j2 Global, Inc. 11,553,622
355,251 2Model N, Inc. 11,080,279
51,917 2OSI Systems, Inc. 4,492,897
39,547 2Paylocity Corp. 5,611,324
408,365 1,2Perficient, Inc. 20,295,740
43,074 Power Integrations, Inc. 4,207,038
18,535 1Progress Software Corp. 836,485
79,642 2Qualys, Inc. 6,828,505
208,090 2SPS Commerce, Inc. 11,825,755
30,827 1,2SVMK, Inc. 544,097
96,425 1,2ShotSpotter, Inc. 2,646,866
20,281 2Unisys Corp. 196,928
20,199 2Viavi Solutions, Inc. 284,806
TOTAL 172,388,328
Materials—2.2%
5,049 1Compass Minerals International, Inc. 292,287
176,631 1,2Forterra, Inc. 2,287,371
107,983 1Fuller (H.B.) Co. 4,989,894
41,244 Kaiser Aluminum Corp. 4,130,587
20,987 2Koppers Holdings, Inc. 658,572
227,295 Myers Industries, Inc. 3,677,633
Semi-Annual Shareholder Report7

Shares Value
COMMON STOCKS—continued
Materials—continued
86,100 2,3Rentech, Inc. $ 0
124,673 2Ryerson Holding Corp. 1,277,898
99,636 Trinseo SA 2,861,546
TOTAL 20,175,788
Real Estate—5.6%
50,034 American Assets Trust, Inc. 2,279,549
157,893 EastGroup Properties, Inc. 21,484,500
39,447 National Health Investors, Inc. 3,328,538
37,501 National Storage Affiliates Trust 1,280,659
232,999 Newmark Group, Inc. 2,742,398
68,147 NexPoint Residential Trust, Inc. 3,325,574
267,204 1QTS Realty Trust, Inc. 15,198,564
37,578 RMR Group, Inc./The 1,731,218
18,779 Urstadt Biddle Properties, Inc., Class A 425,720
47,847 Whitestone Project 626,796
TOTAL 52,423,516
Utilities—0.2%
124,867 TerraForm Power, Inc. 2,258,844
TOTAL COMMON STOCKS(IDENTIFIED COST $855,380,868) 920,418,638
INVESTMENT COMPANIES—11.0%
35,232,745 Federated Government Obligations Fund, Premier Shares, 1.49%4 35,232,745
67,619,832 Federated Institutional Prime Value Obligations Fund, InstitutionalShares, 1.71%4
67,640,117
TOTAL INVESTMENT COMPANIES(IDENTIFIED COST $102,872,519) 102,872,862
TOTAL INVESTMENT IN SECURITIES—109.5%(IDENTIFIED COST $958,253,387)5
1,023,291,500
OTHER ASSETS AND LIABILITIES - NET—(9.5)%6 (88,973,185)
TOTAL NET ASSETS—100% $ 934,318,315
Semi-Annual Shareholder Report8

An affiliated company is a company in which the Fund, alone or in combination with otherfunds, has ownership of at least 5% of the voting shares. Transactions with affiliatedcompanies during the period ended January 31, 2020, were as follows:
ShotSpotter, Inc.
Information Technology
Balance of Shares Held 7/31/2019 —
Purchases/Additions 101,939
Sales/Reductions (5,514)
Balance of Shares Held 1/31/2020 96,425
Value $2,646,866
Change in UnrealizedAppreciation/Depreciation $ 642,009
Net Realized Gain/(Loss) $ 9,934
Dividend Income $ —
Affiliated fund holdings are investment companies which are managed by the Adviser or anaffiliate of the Adviser. Transactions with affiliated fund holdings during the period endedJanuary 31, 2020, were as follows:
FederatedGovernment
Obligations Fund,Premier Shares*
FederatedInstitutionalPrime Value
Obligations Fund,Institutional Shares*
TotalAffiliated
Transactions
Balance of Shares Held 7/31/2019 34,589,446 67,411,680 102,001,126
Purchases/Additions 160,971,917 300,967,150 461,939,067
Sales/Reductions (160,328,618) (300,758,998) (461,087,616)
Balance of Shares Held 1/31/2020 35,232,745 67,619,832 102,852,577
Value $ 35,232,745 $ 67,640,117 $ 102,872,862
Change in UnrealizedAppreciation/Depreciation N/A $ (4,489) $ (4,489)
Net Realized Gain/(Loss) N/A $ 3,910 $ 3,910
Dividend Income $ 326,114 $ 601,917 $ 928,031
* All or a portion of the balance/activity for the fund relates to cash collateral received on securitieslending transactions.
1 All or a portion of these securities are temporarily on loan to unaffiliated broker/dealers.2 Non-income-producing security.3 Market quotations and price evaluations are not available. Fair value determined using significant
unobservable inputs in accordance with procedures established by and under the general supervision ofthe Fund’s Board of Trustees (the “Trustees”).
4 7-day net yield.
Semi-Annual Shareholder Report9
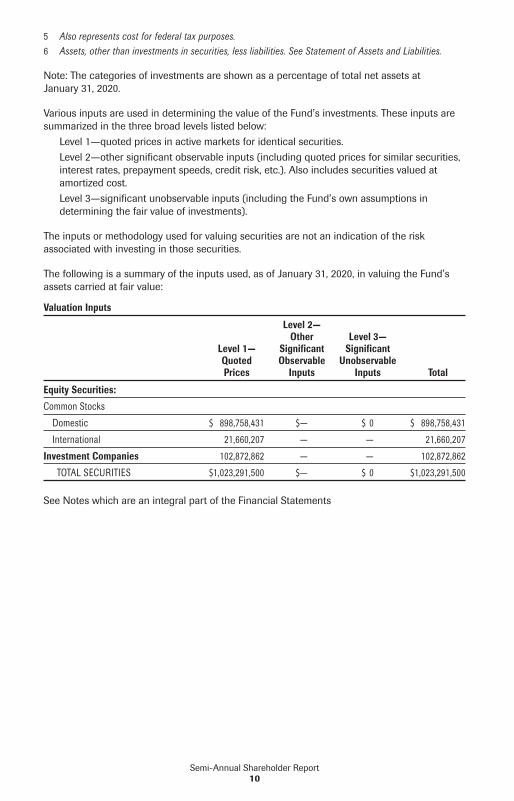
5 Also represents cost for federal tax purposes.6 Assets, other than investments in securities, less liabilities. See Statement of Assets and Liabilities.
Note: The categories of investments are shown as a percentage of total net assets atJanuary 31, 2020.
Various inputs are used in determining the value of the Fund’s investments. These inputs aresummarized in the three broad levels listed below:
Level 1—quoted prices in active markets for identical securities.Level 2—other significant observable inputs (including quoted prices for similar securities,interest rates, prepayment speeds, credit risk, etc.). Also includes securities valued atamortized cost.Level 3—significant unobservable inputs (including the Fund’s own assumptions indetermining the fair value of investments).
The inputs or methodology used for valuing securities are not an indication of the riskassociated with investing in those securities.
The following is a summary of the inputs used, as of January 31, 2020, in valuing the Fund’sassets carried at fair value: Valuation Inputs
Level 1—QuotedPrices
Level 2—Other
SignificantObservable
Inputs
Level 3—Significant
UnobservableInputs Total
Equity Securities:
Common Stocks
Domestic $ 898,758,431 $— $ 0 $ 898,758,431
International 21,660,207 — — 21,660,207
Investment Companies 102,872,862 — — 102,872,862
TOTAL SECURITIES $1,023,291,500 $— $ 0 $1,023,291,500
See Notes which are an integral part of the Financial Statements
Semi-Annual Shareholder Report10

Financial Highlights – Class A Shares(For a Share Outstanding Throughout Each Period)
Six MonthsEnded
(unaudited)1/31/2020
Year Ended July 31,2019 2018 2017 2016 2015
Net Asset Value, Beginning of Period $23.30 $25.67 $21.89 $17.66 $20.49 $17.39Income From Investment Operations:Net investment income (loss) (0.03)1
(0.08)1 (0.11)1
(0.08)1 (0.06)1
(0.12)1
Net realized and unrealized gain (loss) 0.20 (0.84) 5.09 4.63 0.32 3.22TOTAL FROMINVESTMENT OPERATIONS 0.17 (0.92) 4.98 4.55 0.26 3.10
Less Distributions:Distributions from net realized gain — (1.45) (1.20) (0.32) (3.09) —Net Asset Value, End of Period $23.47 $23.30 $25.67 $21.89 $17.66 $20.49Total Return2
0.73% (2.83)% 23.50% 26.00% 2.30% 17.83%
Ratios to Average Net Assets:Net expenses 1.13%3
1.13% 1.14% 1.15% 1.13% 1.54%Net investment income (loss) (0.27)%3
(0.36)% (0.48)% (0.39)% (0.34)% (0.66)%Expense waiver/reimbursement4 0.25%3
0.29% 0.44% 0.70% 1.00% 0.61%Supplemental Data:Net assets, end of period (000 omitted) $105,006 $82,170 $82,953 $47,681 $29,707 $32,136Portfolio turnover 86% 142% 129% 118% 198% 121%
1 Per share numbers have been calculated using the average shares method.2 Based on net asset value, which does not reflect the sales charge, redemption fee or contingent
deferred sales charge, if applicable. Total returns for periods of less than one year are not annualized.3 Computed on an annualized basis.4 This expense decrease is reflected in both the net expense and the net investment income (loss) ratios
shown above.
See Notes which are an integral part of the Financial Statements
Semi-Annual Shareholder Report11

Financial Highlights – Class C Shares(For a Share Outstanding Throughout Each Period)
Six MonthsEnded
(unaudited)1/31/2020
Year Ended July 31,2019 2018 2017 2016 2015
Net Asset Value, Beginning of Period $20.32 $22.77 $19.69 $16.03 $19.03 $16.27Income From Investment Operations:Net investment income (loss) (0.10)1
(0.23)1 (0.26)1
(0.21)1 (0.17)1
(0.25)1
Net realized and unrealized gain (loss) 0.18 (0.77) 4.54 4.19 0.26 3.01TOTAL FROMINVESTMENT OPERATIONS 0.08 (1.00) 4.28 3.98 0.09 2.76
Less Distributions:Distributions from net realized gain — (1.45) (1.20) (0.32) (3.09) —Net Asset Value, End of Period $20.40 $20.32 $22.77 $19.69 $16.03 $19.03Total Return2
0.39% (3.58)% 22.54% 25.08% 1.51% 16.96%
Ratios to Average Net Assets:Net expenses 1.88%3
1.88% 1.89% 1.90% 1.88% 2.31%Net investment income (loss) (1.03)%3
(1.12)% (1.23)% (1.15)% (1.09)% (1.44)%Expense waiver/reimbursement4 0.21%3
0.29% 0.41% 0.66% 1.00% 0.59%Supplemental Data:Net assets, end of period (000 omitted) $21,163 $22,639 $18,008 $10,007 $3,941 $3,571Portfolio turnover 86% 142% 129% 118% 198% 121%
1 Per share numbers have been calculated using the average shares method.2 Based on net asset value, which does not reflect the sales charge, redemption fee or contingent
deferred sales charge, if applicable. Total returns for periods of less than one year are not annualized.3 Computed on an annualized basis.4 This expense decrease is reflected in both the net expense and the net investment income (loss) ratios
shown above.
See Notes which are an integral part of the Financial Statements
Semi-Annual Shareholder Report12

Financial Highlights – Institutional Shares(For a Share Outstanding Throughout Each Period)
Six MonthsEnded
(unaudited)1/31/2020
Year Ended July 31,2019 2018 2017 2016 2015
Net Asset Value, Beginning ofPeriod $24.37 $26.71 $22.67 $18.24 $21.01 $17.79Income From InvestmentOperations:Net investment income (loss) (0.00)1,2
(0.02)1 (0.06)1
(0.03)1 (0.02)1
(0.08)1
Net realized and unrealizedgain (loss) 0.21 (0.87) 5.30 4.78 0.34 3.30
TOTAL FROMINVESTMENT OPERATIONS 0.21 (0.89) 5.24 4.75 0.32 3.22
Less Distributions:Distributions from net realized gain — (1.45) (1.20) (0.32) (3.09) —Net Asset Value, End of Period $24.58 $24.37 $26.71 $22.67 $18.24 $21.01Total Return3
0.86% (2.60)% 23.85% 26.27% 2.56% 18.10%
Ratios to Average Net Assets:Net expenses 0.88%4
0.88% 0.89% 0.90% 0.88% 1.30%Net investment income (loss) (0.03)%4
(0.10)% (0.25)% (0.15)% (0.09)% (0.43)%Expense waiver/reimbursement5 0.18%4
0.25% 0.41% 0.63% 0.99% 0.60%Supplemental Data:Net assets, end of period(000 omitted) $482,685 $455,597 $364,248 $112,742 $43,337 $36,706Portfolio turnover 86% 142% 129% 118% 198% 121%
1 Per share numbers have been calculated using the average shares method.2 Represents less than $0.01.3 Based on net asset value. Total returns for periods of less than one year are not annualized.4 Computed on an annualized basis.5 This expense decrease is reflected in both the net expense and the net investment income (loss) ratios
shown above.
See Notes which are an integral part of the Financial Statements
Semi-Annual Shareholder Report13

Financial Highlights – Class R6 Shares(For a Share Outstanding Throughout Each Period)
Six MonthsEnded
(unaudited)1/31/2020
Year Ended July 31,PeriodEnded
7/31/201612019 2018 2017Net Asset Value, Beginning of Period $24.36 $26.70 $22.67 $18.24 $16.25Income From Investment Operations:Net investment income (loss) (0.00)2,3
(0.02)2 (0.06)2
(0.01)2 (0.07)2
Net realized and unrealized gain (loss) 0.23 (0.87) 5.29 4.76 2.06TOTAL FROM INVESTMENT OPERATIONS 0.23 (0.89) 5.23 4.75 1.99
Less Distributions:Distributions from net realized gain — (1.45) (1.20) (0.32) —Net Asset Value, End of Period $24.59 $24.36 $26.70 $22.67 $18.24Total Return4
0.94% (2.60)% 23.81% 26.27% 12.25%
Ratios to Average Net Assets:Net expenses 0.87%5
0.87% 0.88% 0.88% 0.87%5
Net investment income (loss) (0.03)%5 (0.07)% (0.24)% (0.04)% (0.41)%5
Expense waiver/reimbursement6 0.08%5 0.15% 0.30% 0.42% 0.66%5
Supplemental Data:Net assets, end of period (000 omitted) $325,465 $333,059 $89,307 $24,795 $07
Portfolio turnover 86% 142% 129% 118% 198%8
1 Reflects operations for the period from June 29, 2016 (date of initial investment) to July 31, 2016.2 Per share numbers have been calculated using the average shares method.3 Represents less than $0.01.4 Based on net asset value. Total returns for periods of less than one year are not annualized.5 Computed on an annualized basis.6 This expense decrease is reflected in both the net expense and the net investment income (loss) ratios
shown above.7 Represents less than $1,000.8 Portfolio turnover is calculated at the Fund level. Percentage indicated was calculated for the year
ended July 31, 2016.
See Notes which are an integral part of the Financial Statements
Semi-Annual Shareholder Report14

Assets:
Investment in securities, at value including $85,543,278 of securities loanedand including $102,872,862 of investment in affiliated holdings* (identifiedcost $958,253,387) $1,023,291,500
Cash 138
Income receivable 79,087
Income receivable from an affiliated holding 19,899
Receivable for investments sold 10,986,182
Receivable for shares sold 921,469
TOTAL ASSETS 1,035,298,275
Liabilities:
Payable for investments purchased $ 6,408,512
Payable for shares redeemed 3,747,062
Payable for collateral due to broker for securities lending 90,421,745
Payable to adviser (Note 5) 18,925
Payable for administrative fees (Note 5) 1,701
Payable for distribution services fee (Note 5) 14,036
Payable for other service fees (Notes 2 and 5) 59,379
Accrued expenses (Note 5) 308,600
TOTAL LIABILITIES 100,979,960
Net assets for 38,386,083 shares outstanding $ 934,318,315
Net Assets Consist of:
Paid-in capital $ 858,122,063
Total distributable earnings (loss) 76,196,252
TOTAL NET ASSETS $ 934,318,315
Statement of Assets and LiabilitiesJanuary 31, 2020 (unaudited)
Semi-Annual Shareholder Report15
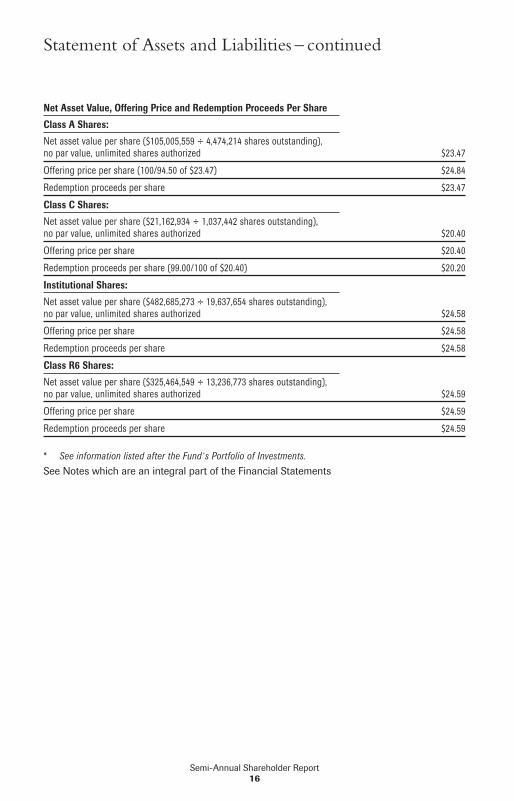
Net Asset Value, Offering Price and Redemption Proceeds Per Share
Class A Shares:
Net asset value per share ($105,005,559 ÷ 4,474,214 shares outstanding),no par value, unlimited shares authorized $23.47
Offering price per share (100/94.50 of $23.47) $24.84
Redemption proceeds per share $23.47
Class C Shares:
Net asset value per share ($21,162,934 ÷ 1,037,442 shares outstanding),no par value, unlimited shares authorized $20.40
Offering price per share $20.40
Redemption proceeds per share (99.00/100 of $20.40) $20.20
Institutional Shares:
Net asset value per share ($482,685,273 ÷ 19,637,654 shares outstanding),no par value, unlimited shares authorized $24.58
Offering price per share $24.58
Redemption proceeds per share $24.58
Class R6 Shares:
Net asset value per share ($325,464,549 ÷ 13,236,773 shares outstanding),no par value, unlimited shares authorized $24.59
Offering price per share $24.59
Redemption proceeds per share $24.59
* See information listed after the Fund’s Portfolio of Investments.
See Notes which are an integral part of the Financial Statements
Statement of Assets and Liabilities – continued
Semi-Annual Shareholder Report16

Investment Income:
Dividends (including $124,171 received from an affiliated holding*and net of foreign taxes withheld of $56) $ 3,368,860
Net income on securities loaned (includes $803,860 earned fromaffiliated holdings related to cash collateral balances*) (Note 2) 571,794
TOTAL INCOME 3,940,654
Expenses:
Investment adviser fee (Note 5) $3,702,201
Administrative fee (Note 5) 364,917
Custodian fees 32,060
Transfer agent fee 473,465
Directors’/Trustees’ fees (Note 5) 3,299
Auditing fees 13,842
Legal fees 4,835
Portfolio accounting fees 78,104
Distribution services fee (Note 5) 78,952
Other service fees (Notes 2 and 5) 138,990
Share registration costs 48,985
Printing and postage 37,436
Miscellaneous (Note 5) 18,501
TOTAL EXPENSES 4,995,587
Waiver and Reimbursements:
Waiver/reimbursement of investment adviser fee (Note 5) $(358,718)
Reimbursement of other operating expenses (Notes 2 and 5) (339,927)
TOTAL WAIVER AND REIMBURSEMENTS (698,645)
Net expenses 4,296,942
Net investment income (loss) (356,288)
Realized and Unrealized Gain (Loss) on Investments:
Net realized gain on investments (including net realized gain of$3,910 on sales of investments in an affiliated holding*) 18,262,895
Net change in unrealized appreciation of investments (includingnet change in unrealized appreciation of $(4,489) on investmentsin an affiliated holding*) (6,662,325)
Net realized and unrealized gain (loss) on investments 11,600,570
Change in net assets resulting from operations $11,244,282
* See information listed after the Fund’s Portfolio of Investments.
See Notes which are an integral part of the Financial Statements
Statement of OperationsSix Months Ended January 31, 2020 (unaudited)
Semi-Annual Shareholder Report17
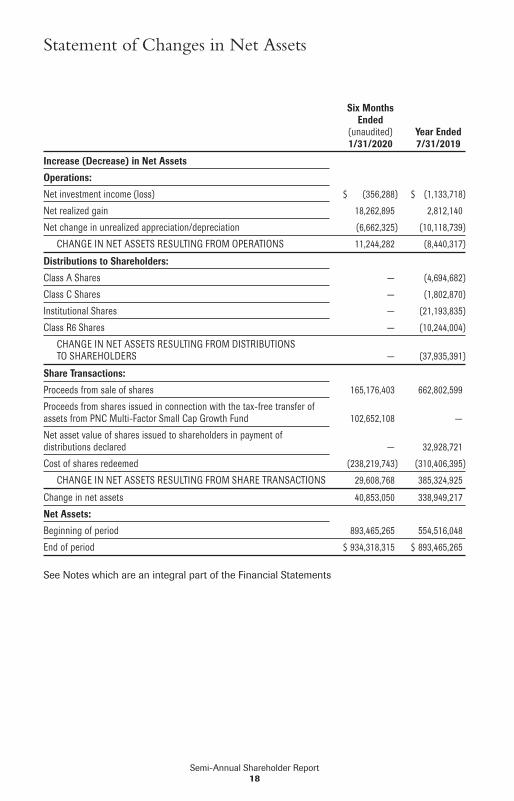
Six MonthsEnded
(unaudited)1/31/2020
Year Ended7/31/2019
Increase (Decrease) in Net Assets
Operations:
Net investment income (loss) $ (356,288) $ (1,133,718)
Net realized gain 18,262,895 2,812,140
Net change in unrealized appreciation/depreciation (6,662,325) (10,118,739)
CHANGE IN NET ASSETS RESULTING FROM OPERATIONS 11,244,282 (8,440,317)
Distributions to Shareholders:
Class A Shares — (4,694,682)
Class C Shares — (1,802,870)
Institutional Shares — (21,193,835)
Class R6 Shares — (10,244,004)
CHANGE IN NET ASSETS RESULTING FROM DISTRIBUTIONSTO SHAREHOLDERS — (37,935,391)
Share Transactions:
Proceeds from sale of shares 165,176,403 662,802,599
Proceeds from shares issued in connection with the tax-free transfer ofassets from PNC Multi-Factor Small Cap Growth Fund 102,652,108 —
Net asset value of shares issued to shareholders in payment ofdistributions declared — 32,928,721
Cost of shares redeemed (238,219,743) (310,406,395)
CHANGE IN NET ASSETS RESULTING FROM SHARE TRANSACTIONS 29,608,768 385,324,925
Change in net assets 40,853,050 338,949,217
Net Assets:
Beginning of period 893,465,265 554,516,048
End of period $ 934,318,315 $ 893,465,265
See Notes which are an integral part of the Financial Statements
Statement of Changes in Net Assets
Semi-Annual Shareholder Report18

Notes to Financial StatementsJanuary 31, 2020 (unaudited)
1. ORGANIZATIONFederated MDT Series (the “Trust”) is registered under the Investment Company Act of1940, as amended (the “Act”), as an open-end management investment company. The Trustconsists of five portfolios. The financial statements included herein are only those of FederatedMDT Small Cap Growth Fund (the “Fund”), a diversified portfolio. The financial statements ofthe other portfolios are presented separately. The assets of each portfolio are segregated anda shareholder’s interest is limited to the portfolio in which shares are held. Each portfolio paysits own expenses. The Fund offers four classes of shares: Class A Shares, Class C Shares,Institutional Shares and Class R6 Shares. All shares of the Fund have equal rights with respectto voting, except on class-specific matters. The investment objective of the Fund is long-termcapital appreciation.
On March 30, 2017, the Fund’s T Share Class became effective with the Securities andExchange Commission (SEC), but is not yet offered for sale.
Effective August 1, 2018, an automatic conversion feature for Class C Shares wasimplemented. Pursuant to this automatic conversion feature, after Class C Shares have beenheld for ten years from the date of purchase, they will automatically convert to Class A Shareson the next monthly conversion processing date.
On November 15, 2019, the Fund acquired all of the net assets of PNC Multi-Factor SmallCap Growth Fund (the “Acquired Fund”), an open-end investment company, in a tax-freereorganization in exchange for shares of the Fund, pursuant to a plan of reorganizationapproved by the Acquired Fund’s shareholders on November 5, 2019. The purpose of thetransaction was to combine two portfolios with comparable investment objectives andstrategies. For financial reporting purposes, assets received and shares issued by the Fundwere recorded at fair value; however, the cost basis of the investments received from theAcquired Fund was carried forward to align ongoing reporting of the Fund’s realized gains andlosses with amounts distributable to shareholders for tax purposes.
For every one share of the Acquired Fund’s Class A Shares exchanged, a shareholderreceived 0.896 shares of the Fund’s Class A Shares.
For every one share of the Acquired Fund’s Class C Shares exchanged, a shareholderreceived 0.971 shares of the Fund’s Class C Shares.
For every one share of the Acquired Fund’s Class I Shares exchanged, a shareholderreceived 0.883 shares of the Fund’s Institutional Shares.
For every one share of the Acquired Fund’s Class R6 Shares exchanged, a shareholderreceived 0.883 shares of the Fund’s R6 Shares.
Semi-Annual Shareholder Report19

The Fund received net assets from the Acquired Fund as the result of the tax-freereorganization as follows:
Shares of theFund Issued
Acquired Fund’sNet Assets Received
UnrealizedAppreciation1
Net Assetsof the Fund
ImmediatelyPrior to
Combination
Net Assetsof the Fund
ImmediatelyAfter
Combination
4,360,352 $102,652,108 $20,727,223 $897,256,665 $999,908,773
1 Unrealized Appreciation is included in the Net Assets Received amount shown above.
Assuming the acquisition had been completed on August 1, 2019, the beginning of the annualreporting period of the Fund, the Fund’s pro forma results of operations for the six monthsended January 31, 2020, were as follows:
Net investment income (loss) $ (324,682)
Net realized and unrealized gain on investments $15,133,143
Net increase in net assets resulting from operations $14,808,461
Because the combined investment portfolios have been managed as a single integratedportfolio since the acquisition was completed, it is not practicable to separate the amounts ofrevenue and earnings of the Acquired Fund that have been included in the Fund’s Statementof Operations and Statement of Changes in Net Assets as of January 31, 2020.
2. SIGNIFICANT ACCOUNTING POLICIESThe following is a summary of significant accounting policies consistently followed by theFund in the preparation of its financial statements. These policies are in conformity withU.S. generally accepted accounting principles (GAAP).
Investment ValuationIn calculating its net asset value (NAV), the Fund generally values investments as follows:� Equity securities listed on an exchange or traded through a regulated market system are
valued at their last reported sale price or official closing price in their principal exchangeor market.
� Shares of other mutual funds or non-exchange-traded investment companies are valuedbased upon their reported NAVs.
� Fixed-income securities are fair valued using price evaluations provided by a pricing serviceapproved by the Trustees.
� Derivative contracts listed on exchanges are valued at their reported settlement or closingprice, except that options are valued at the mean of closing bid and asked quotations.
� Over-the-counter (OTC) derivative contracts are fair valued using price evaluations providedby a pricing service approved by the Trustees.
Semi-Annual Shareholder Report20

� For securities that are fair valued in accordance with procedures established by and underthe general supervision of the Trustees, certain factors may be considered, such as: the lasttraded or purchase price of the security, information obtained by contacting the issuer ordealers, analysis of the issuer’s financial statements or other available documents,fundamental analytical data, the nature and duration of restrictions on disposition, themovement of the market in which the security is normally traded, public trading in similarsecurities or derivative contracts of the issuer or comparable issuers, movement of arelevant index, or other factors including but not limited to industry changes and relevantgovernment actions.
If any price, quotation, price evaluation or other pricing source is not readily available whenthe NAV is calculated, if the Fund cannot obtain price evaluations from a pricing service orfrom more than one dealer for an investment within a reasonable period of time as set forth inthe Fund’s valuation policies and procedures, or if information furnished by a pricing service,in the opinion of the valuation committee (“Valuation Committee”), is deemed notrepresentative of the fair value of such security, the Fund uses the fair value of the investmentdetermined in accordance with the procedures described below. There can be no assurancethat the Fund could obtain the fair value assigned to an investment if it sold the investment atapproximately the time at which the Fund determines its NAV per share.
Fair Valuation ProceduresThe Trustees have ultimate responsibility for determining the fair value of investments forwhich market quotations are not readily available. The Trustees have appointed a ValuationCommittee comprised of officers of the Fund, Federated MDTA LLC (the “Adviser”), and certainof the Adviser’s affiliated companies to assist in determining fair value and in overseeing thecalculation of the NAV. The Trustees have also authorized the use of pricing servicesrecommended by the Valuation Committee to provide fair value evaluations of the currentvalue of certain investments for purposes of calculating the NAV. The Valuation Committeeemploys various methods for reviewing third-party pricing-service evaluations includingperiodic reviews of third-party pricing services’ policies, procedures and valuation methods(including key inputs, methods, models and assumptions), transactional back-testing,comparisons of evaluations of different pricing services, and review of price challenges by theAdviser based on recent market activity. In the event that market quotations and priceevaluations are not available for an investment, the Valuation Committee determines the fairvalue of the investment in accordance with procedures adopted by the Trustees. The Trusteesperiodically review and approve the fair valuations made by the Valuation Committee and anychanges made to the procedures.
Factors considered by pricing services in evaluating an investment include the yields orprices of investments of comparable quality, coupon, maturity, call rights and other potentialprepayments, terms and type, reported transactions, indications as to values from dealers andgeneral market conditions. Some pricing services provide a single price evaluation reflectingthe bid-side of the market for an investment (a “bid” evaluation). Other pricing services offerboth bid evaluations and price evaluations indicative of a price between the prices bid andasked for the investment (a “mid” evaluation). The Fund normally uses bid evaluations for anyU.S. Treasury and Agency securities, mortgage-backed securities and municipal securities. TheFund normally uses mid evaluations for any other types of fixed-income securities and anyOTC derivative contracts. In the event that market quotations and price evaluations are notavailable for an investment, the fair value of the investment is determined in accordance withprocedures adopted by the Trustees.
Semi-Annual Shareholder Report21
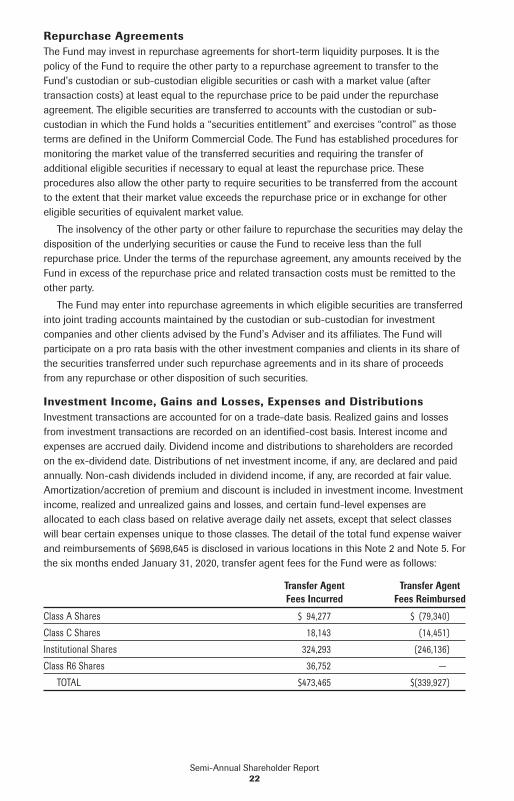
Repurchase AgreementsThe Fund may invest in repurchase agreements for short-term liquidity purposes. It is thepolicy of the Fund to require the other party to a repurchase agreement to transfer to theFund’s custodian or sub-custodian eligible securities or cash with a market value (aftertransaction costs) at least equal to the repurchase price to be paid under the repurchaseagreement. The eligible securities are transferred to accounts with the custodian or sub-custodian in which the Fund holds a “securities entitlement” and exercises “control” as thoseterms are defined in the Uniform Commercial Code. The Fund has established procedures formonitoring the market value of the transferred securities and requiring the transfer ofadditional eligible securities if necessary to equal at least the repurchase price. Theseprocedures also allow the other party to require securities to be transferred from the accountto the extent that their market value exceeds the repurchase price or in exchange for othereligible securities of equivalent market value.
The insolvency of the other party or other failure to repurchase the securities may delay thedisposition of the underlying securities or cause the Fund to receive less than the fullrepurchase price. Under the terms of the repurchase agreement, any amounts received by theFund in excess of the repurchase price and related transaction costs must be remitted to theother party.
The Fund may enter into repurchase agreements in which eligible securities are transferredinto joint trading accounts maintained by the custodian or sub-custodian for investmentcompanies and other clients advised by the Fund’s Adviser and its affiliates. The Fund willparticipate on a pro rata basis with the other investment companies and clients in its share ofthe securities transferred under such repurchase agreements and in its share of proceedsfrom any repurchase or other disposition of such securities.
Investment Income, Gains and Losses, Expenses and DistributionsInvestment transactions are accounted for on a trade-date basis. Realized gains and lossesfrom investment transactions are recorded on an identified-cost basis. Interest income andexpenses are accrued daily. Dividend income and distributions to shareholders are recordedon the ex-dividend date. Distributions of net investment income, if any, are declared and paidannually. Non-cash dividends included in dividend income, if any, are recorded at fair value.Amortization/accretion of premium and discount is included in investment income. Investmentincome, realized and unrealized gains and losses, and certain fund-level expenses areallocated to each class based on relative average daily net assets, except that select classeswill bear certain expenses unique to those classes. The detail of the total fund expense waiverand reimbursements of $698,645 is disclosed in various locations in this Note 2 and Note 5. Forthe six months ended January 31, 2020, transfer agent fees for the Fund were as follows:
Transfer AgentFees Incurred
Transfer AgentFees Reimbursed
Class A Shares $ 94,277 $ (79,340)
Class C Shares 18,143 (14,451)
Institutional Shares 324,293 (246,136)
Class R6 Shares 36,752 —
TOTAL $473,465 $(339,927)
Semi-Annual Shareholder Report22

Dividends are declared separately for each class. No class has preferential dividend rights;differences in per share dividend rates are generally due to differences in separateclass expenses.
Other Service FeesThe Fund may pay other service fees up to 0.25% of the average daily net assets of the Fund’sClass A Shares and Class C Shares to financial intermediaries or to Federated ShareholderServices Company (FSSC) for providing services to shareholders and maintaining shareholderaccounts. Subject to the terms described in the Expense Limitation note, FSSC may voluntarilyreimburse the Fund for other service fees. For the six months ended January 31, 2020, otherservice fees for the Fund were as follows:
Other ServiceFees Incurred
Class A Shares $112,975
Class C Shares 26,015
TOTAL $138,990
Federal TaxesIt is the Fund’s policy to comply with the Subchapter M provision of the Internal Revenue Codeand to distribute to shareholders each year substantially all of its income. Accordingly, noprovision for federal income tax is necessary. As of and during the six months endedJanuary 31, 2020, the Fund did not have a liability for any uncertain tax positions. The Fundrecognizes interest and penalties, if any, related to tax liabilities as income tax expense in theStatement of Operations. As of January 31, 2020, tax years 2016 through 2019 remain subjectto examination by the Fund’s major tax jurisdictions, which include the United States ofAmerica and the Commonwealth of Massachusetts.
When-Issued and Delayed-Delivery TransactionsThe Fund may engage in when-issued or delayed-delivery transactions. The Fund recordswhen-issued securities on the trade date and maintains security positions such that sufficientliquid assets will be available to make payment for the securities purchased. Securitiespurchased on a when-issued or delayed-delivery basis are marked to market daily and beginearning interest on the settlement date. Losses may occur on these transactions due tochanges in market conditions or the failure of counterparties to perform under the contract.
Securities LendingThe Fund participates in a securities lending program providing for the lending of equitysecurities to qualified brokers. The term of the loans within the program is one year or less.The Fund normally receives cash collateral for securities loaned that may be invested inaffiliated money market funds, other money market instruments and/or repurchaseagreements. Investments in money market funds may include funds with a “floating” NAV thatcan impose redemption fees and liquidity gates, impose certain operational impediments toinvesting cash collateral, and, if the investee fund’s NAV decreases, result in the Fundrecognizing losses and being required to cover the decrease in the value of the cash collateral.Collateral is maintained at a minimum level of 100% of the market value of investments loaned,plus interest, if applicable. In accordance with the Fund’s securities lending agreement, themarket value of securities on loan is determined each day at the close of business and anyadditional collateral required to cover the value of securities on loan is delivered to the Fund
Semi-Annual Shareholder Report23
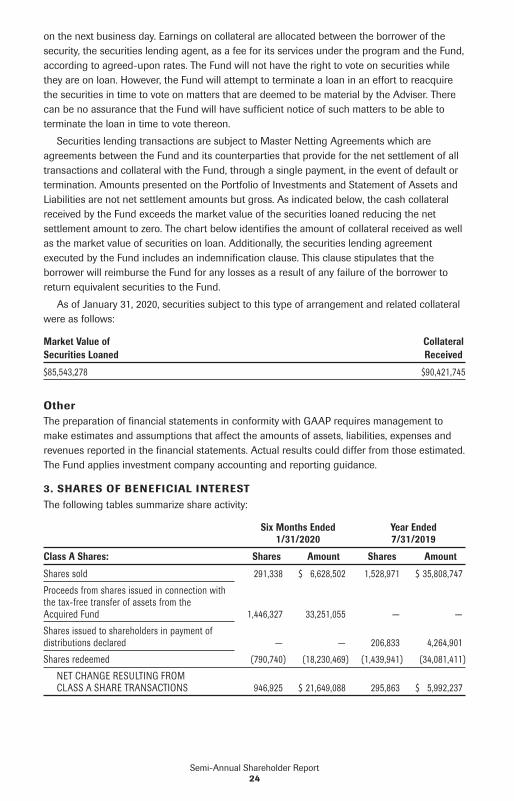
on the next business day. Earnings on collateral are allocated between the borrower of thesecurity, the securities lending agent, as a fee for its services under the program and the Fund,according to agreed-upon rates. The Fund will not have the right to vote on securities whilethey are on loan. However, the Fund will attempt to terminate a loan in an effort to reacquirethe securities in time to vote on matters that are deemed to be material by the Adviser. Therecan be no assurance that the Fund will have sufficient notice of such matters to be able toterminate the loan in time to vote thereon.
Securities lending transactions are subject to Master Netting Agreements which areagreements between the Fund and its counterparties that provide for the net settlement of alltransactions and collateral with the Fund, through a single payment, in the event of default ortermination. Amounts presented on the Portfolio of Investments and Statement of Assets andLiabilities are not net settlement amounts but gross. As indicated below, the cash collateralreceived by the Fund exceeds the market value of the securities loaned reducing the netsettlement amount to zero. The chart below identifies the amount of collateral received as wellas the market value of securities on loan. Additionally, the securities lending agreementexecuted by the Fund includes an indemnification clause. This clause stipulates that theborrower will reimburse the Fund for any losses as a result of any failure of the borrower toreturn equivalent securities to the Fund.
As of January 31, 2020, securities subject to this type of arrangement and related collateralwere as follows: Market Value ofSecurities Loaned
CollateralReceived
$85,543,278 $90,421,745
OtherThe preparation of financial statements in conformity with GAAP requires management tomake estimates and assumptions that affect the amounts of assets, liabilities, expenses andrevenues reported in the financial statements. Actual results could differ from those estimated.The Fund applies investment company accounting and reporting guidance.
3. SHARES OF BENEFICIAL INTERESTThe following tables summarize share activity:
Six Months Ended1/31/2020
Year Ended7/31/2019
Class A Shares: Shares Amount Shares Amount
Shares sold 291,338 $ 6,628,502 1,528,971 $ 35,808,747
Proceeds from shares issued in connection withthe tax-free transfer of assets from theAcquired Fund 1,446,327 33,251,055 — —
Shares issued to shareholders in payment ofdistributions declared — — 206,833 4,264,901
Shares redeemed (790,740) (18,230,469) (1,439,941) (34,081,411)
NET CHANGE RESULTING FROMCLASS A SHARE TRANSACTIONS 946,925 $ 21,649,088 295,863 $ 5,992,237
Semi-Annual Shareholder Report24

Six Months Ended1/31/2020
Year Ended7/31/2019
Class C Shares: Shares Amount Shares Amount
Shares sold 59,137 $ 1,184,448 861,349 $ 19,805,308
Proceeds from shares issued in connection withthe tax-free transfer of assets from theAcquired Fund 182,602 3,655,701 — —
Shares issued to shareholders in payment ofdistributions declared — — 84,088 1,519,470
Shares redeemed (318,234) (6,310,365) (622,248) (12,775,267)
NET CHANGE RESULTING FROMCLASS C SHARE TRANSACTIONS (76,495) $(1,470,216) 323,189 $ 8,549,511
Six Months Ended
1/31/2020Year Ended7/31/2019
Institutional Shares: Shares Amount Shares Amount
Shares sold 4,631,835 $ 110,397,412 13,009,742 $ 313,124,900
Proceeds from shares issued in connection withthe tax-free transfer of assets from theAcquired Fund 2,548,202 61,335,218 — —
Shares issued to shareholders in payment ofdistributions declared — — 906,635 19,519,847
Shares redeemed (6,240,630) (151,534,625) (8,855,829) (217,649,803)
NET CHANGE RESULTING FROMINSTITUTIONAL SHARE TRANSACTIONS 939,407 $ 20,198,005 5,060,548 $ 114,994,944
Six Months Ended
1/31/2020Year Ended7/31/2019
Class R6 Shares: Shares Amount Shares Amount
Shares sold 1,967,025 $ 46,966,041 11,880,605 $294,063,644
Proceeds from shares issued in connection withthe tax-free transfer of assets from theAcquired Fund 183,221 4,410,134 — —
Shares issued to shareholders in payment ofdistributions declared — — 354,134 7,624,503
Shares redeemed (2,584,647) (62,144,284) (1,908,361) (45,899,914)
NET CHANGE RESULTING FROMCLASS R6 SHARE TRANSACTIONS (434,401) $(10,768,109) 10,326,378 $255,788,233
NET CHANGE RESULTING FROMTOTAL FUND SHARE TRANSACTIONS 1,375,436 $ 29,608,768 16,005,978 $385,324,925
Semi-Annual Shareholder Report25
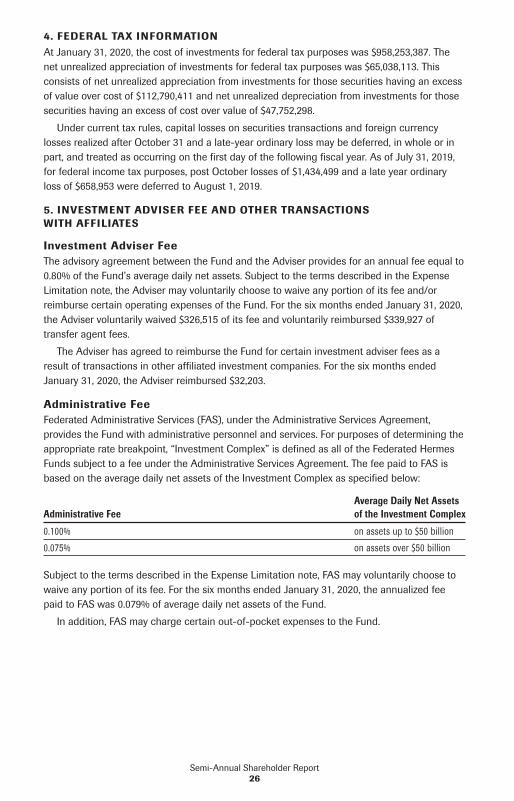
4. FEDERAL TAX INFORMATIONAt January 31, 2020, the cost of investments for federal tax purposes was $958,253,387. Thenet unrealized appreciation of investments for federal tax purposes was $65,038,113. Thisconsists of net unrealized appreciation from investments for those securities having an excessof value over cost of $112,790,411 and net unrealized depreciation from investments for thosesecurities having an excess of cost over value of $47,752,298.
Under current tax rules, capital losses on securities transactions and foreign currencylosses realized after October 31 and a late-year ordinary loss may be deferred, in whole or inpart, and treated as occurring on the first day of the following fiscal year. As of July 31, 2019,for federal income tax purposes, post October losses of $1,434,499 and a late year ordinaryloss of $658,953 were deferred to August 1, 2019.
5. INVESTMENT ADVISER FEE AND OTHER TRANSACTIONSWITH AFFILIATES
Investment Adviser FeeThe advisory agreement between the Fund and the Adviser provides for an annual fee equal to0.80% of the Fund’s average daily net assets. Subject to the terms described in the ExpenseLimitation note, the Adviser may voluntarily choose to waive any portion of its fee and/orreimburse certain operating expenses of the Fund. For the six months ended January 31, 2020,the Adviser voluntarily waived $326,515 of its fee and voluntarily reimbursed $339,927 oftransfer agent fees.
The Adviser has agreed to reimburse the Fund for certain investment adviser fees as aresult of transactions in other affiliated investment companies. For the six months endedJanuary 31, 2020, the Adviser reimbursed $32,203.
Administrative FeeFederated Administrative Services (FAS), under the Administrative Services Agreement,provides the Fund with administrative personnel and services. For purposes of determining theappropriate rate breakpoint, “Investment Complex” is defined as all of the Federated HermesFunds subject to a fee under the Administrative Services Agreement. The fee paid to FAS isbased on the average daily net assets of the Investment Complex as specified below:
Administrative FeeAverage Daily Net Assetsof the Investment Complex
0.100% on assets up to $50 billion
0.075% on assets over $50 billion
Subject to the terms described in the Expense Limitation note, FAS may voluntarily choose towaive any portion of its fee. For the six months ended January 31, 2020, the annualized feepaid to FAS was 0.079% of average daily net assets of the Fund.
In addition, FAS may charge certain out-of-pocket expenses to the Fund.
Semi-Annual Shareholder Report26

Distribution Services FeeThe Fund has adopted a Distribution Plan (the “Plan”) pursuant to Rule 12b-1 under the Act.Under the terms of the Plan, the Fund will compensate Federated Securities Corp. (FSC), theprincipal distributor, from the daily net assets of the Fund’s Class A Shares and Class C Sharesto finance activities intended to result in the sale of these shares. The Plan provides that theFund may incur distribution expenses at the following percentages of average daily net assetsannually, to compensate FSC:
Percentage of Average DailyNet Assets of Class
Class A Shares 0.05%
Class C Shares 0.75%
Subject to the terms described in the Expense Limitation note, FSC may voluntarily choose towaive any portion of its fee. For the six months ended January 31, 2020, distribution servicesfees for the Fund were as follows:
Distribution ServicesFees Incurred
Class C Shares $78,952
For the six months ended January 31, 2020, FSC retained $12,861 fees paid by the Fund.
When FSC receives fees, it may pay some or all of them to financial intermediaries whosecustomers purchase shares. For the six months ended January 31, 2020, the Fund’s Class AShares did not incur a distribution services fee; however, it may begin to incur this fee uponapproval of the Trustees.
Sales ChargesFront-end sales charges and contingent deferred sales charges (CDSC) do not representexpenses of the Fund. They are deducted from the proceeds of sales of Fund shares prior toinvestment or from redemption proceeds prior to remittance, as applicable. For the six monthsended January 31, 2020, FSC retained $947 in sales charges from the sale of Class A Shares.FSC also retained $635 of CDSC relating to redemptions of Class C Shares.
Other Service FeesFor the six months ended January 31, 2020, FSSC received $5,118 of the other service feesdisclosed in Note 2.
Expense LimitationThe Adviser and certain of its affiliates (which may include FSC, FAS and FSSC) on their owninitiative have agreed to waive certain amounts of their respective fees and/or reimburseexpenses. Total annual fund operating expenses (as shown in the financial highlights,excluding interest expense, extraordinary expenses and proxy-related expenses paid by theFund, if any) paid by the Fund’s Class A Shares, Class C Shares, Institutional Shares andClass R6 Shares (after the voluntary waivers and/or reimbursements) will not exceed 1.13%,1.88%, 0.88% and 0.87% (the “Fee Limit”), respectively, up to but not including the later of (the“Termination Date”): (a) December 1, 2020; or (b) the date of the Fund’s next effective
Semi-Annual Shareholder Report27

Prospectus. While the Adviser and its applicable affiliates currently do not anticipateterminating or increasing these arrangements prior to the Termination Date, thesearrangements may only be terminated or the Fee Limit increased prior to the Termination Datewith the agreement of the Trustees.
Directors’/Trustees’ and Miscellaneous FeesCertain Officers and Trustees of the Fund are Officers and Directors or Trustees of certain ofthe above companies. To efficiently facilitate payment, Independent Directors’/Trustees’ feesand certain expenses related to conducting meetings of the Directors/Trustees and othermiscellaneous expenses are paid by an affiliate of the Adviser which in due course arereimbursed by the Fund. These expenses related to conducting meetings of the Directors/Trustees and other miscellaneous expenses may be included in Accrued and MiscellaneousExpenses on the Statement of Assets and Liabilities and Statement of Operations, respectively.
6. INVESTMENT TRANSACTIONSPurchases and sales of investments, excluding long-term U.S. government securities andshort-term obligations, for the six months ended January 31, 2020, were as follows:
Purchases $770,093,193
Sales $835,808,874
7. CONCENTRATION OF RISKThe Fund may invest a portion of its assets in securities of companies that are deemed by theFund’s management to be classified in similar business sectors. Economic developments mayhave an effect on the liquidity and volatility of the portfolio securities.
8. LINE OF CREDITThe Fund participates with certain other Federated Hermes Funds, on a several basis, in an upto $500,000,000 unsecured, 364-day, committed, revolving line of credit (LOC) agreement. TheLOC was made available to finance temporarily the repurchase or redemption of shares of theFund, failed trades, payment of dividends, settlement of trades and for other short-term,temporary or emergency general business purposes. The Fund cannot borrow under the LOCif an inter-fund loan is outstanding. The Fund’s ability to borrow under the LOC also is subjectto the limitations of the Act and various conditions precedent that must be satisfied before theFund can borrow. Loans under the LOC are charged interest at a fluctuating rate per annumequal to the highest, on any day, of (a) (i) the federal funds effective rate, (ii) the one monthLondon Interbank Offered Rate (LIBOR), and (iii) 0.0%, plus (b) a margin. The LOC alsorequires the Fund to pay, quarterly in arrears and at maturity, its pro rata share of acommitment fee based on the amount of the lenders’ commitment that has not been utilized.As of January 31, 2020, the Fund had no outstanding loans. During the six months endedJanuary 31, 2020, the Fund did not utilize the LOC.
Semi-Annual Shareholder Report28

9. INTERFUND LENDINGPursuant to an Exemptive Order issued by the SEC, the Fund, along with other funds advisedby subsidiaries of Federated Hermes, Inc., may participate in an interfund lending program.This program provides an alternative credit facility allowing the Fund to borrow from otherparticipating affiliated funds. As of January 31, 2020, there were no outstanding loans. Duringthe six months ended January 31, 2020, the program was not utilized.
10. SUBSEQUENT EVENTSAn outbreak of respiratory disease caused by a novel coronavirus was first detected in Chinain December 2019 and subsequently spread internationally. As of the date of the issuance ofthese financial statements, this coronavirus has resulted in closing borders, enhanced healthscreenings, healthcare service preparation and delivery, quarantines, cancellations, disruptionsto supply chains, workflow operations and customer activity, as well as general concern anduncertainty. The impact of this coronavirus may be short term or may last for an extendedperiod of time and result in a substantial economic downturn. The impact of this outbreak, andother epidemics and pandemics that may arise in the future, could negatively affect theworldwide economy, as well as the economies of individual countries, individual companies(including Fund service providers) and the market in general in significant and unforeseenways. Any such impact could adversely affect the Fund’s performance.
Effective on or about June 29, 2020, the name of the Trust and Fund will change toFederated Hermes MDT Series and Federated Hermes MDT Small Cap GrowthFund, respectively.
Semi-Annual Shareholder Report29

Shareholder Expense Example (unaudited)As a shareholder of the Fund, you incur two types of costs: (1) transaction costs,including sales charges (loads) on purchase or redemption payments; and(2) ongoing costs, including management fees and to the extent applicable,distribution (12b-1) fees and/or other service fees and other Fund expenses.This Example is intended to help you to understand your ongoing costs (indollars) of investing in the Fund and to compare these costs with the ongoingcosts of investing in other mutual funds. It is based on an investment of $1,000invested at the beginning of the period and held for the entire period fromAugust 1, 2019 to January 31, 2020.
ACTUAL EXPENSES
The first section of the table below provides information about actual accountvalues and actual expenses. You may use the information in this section, togetherwith the amount you invested, to estimate the expenses that you incurred overthe period. Simply divide your account value by $1,000 (for example, an $8,600account value divided by $1,000 = 8.6), then multiply the result by the numberin the first section under the heading entitled “Expenses Paid During Period”to estimate the expenses attributable to your investment during this period.
HYPOTHETICAL EXAMPLE FOR COMPARISON PURPOSES
The second section of the table below provides information about hypotheticalaccount values and hypothetical expenses based on the Fund’s actual expenseratio and an assumed rate of return of 5% per year before expenses, which is notthe Fund’s actual return. Thus, you should not use the hypothetical accountvalues and expenses to estimate the actual ending account balance or yourexpenses for the period. Rather, these figures are required to be provided toenable you to compare the ongoing costs of investing in the Fund with otherfunds. To do so, compare this 5% hypothetical example with the 5%hypothetical examples that appear in the shareholder reports of the other funds.
Semi-Annual Shareholder Report30
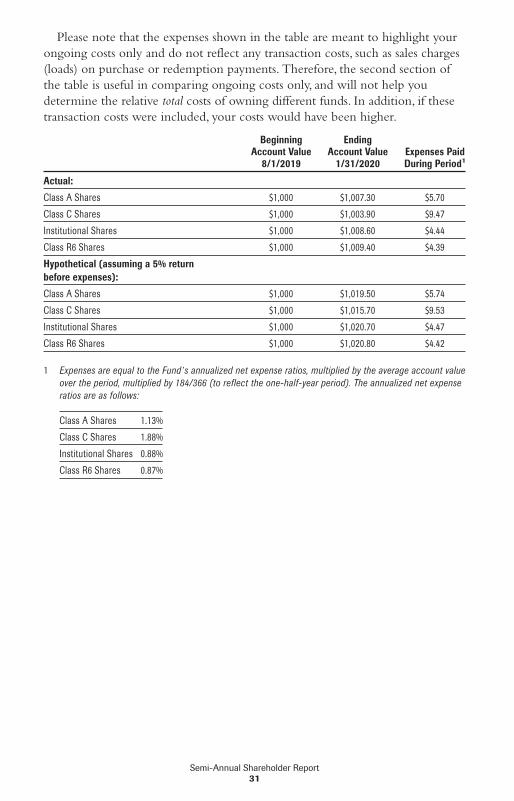
Please note that the expenses shown in the table are meant to highlight yourongoing costs only and do not reflect any transaction costs, such as sales charges(loads) on purchase or redemption payments. Therefore, the second section ofthe table is useful in comparing ongoing costs only, and will not help youdetermine the relative total costs of owning different funds. In addition, if thesetransaction costs were included, your costs would have been higher.
BeginningAccount Value
8/1/2019
EndingAccount Value
1/31/2020Expenses PaidDuring Period1
Actual:
Class A Shares $1,000 $1,007.30 $5.70
Class C Shares $1,000 $1,003.90 $9.47
Institutional Shares $1,000 $1,008.60 $4.44
Class R6 Shares $1,000 $1,009.40 $4.39
Hypothetical (assuming a 5% returnbefore expenses):
Class A Shares $1,000 $1,019.50 $5.74
Class C Shares $1,000 $1,015.70 $9.53
Institutional Shares $1,000 $1,020.70 $4.47
Class R6 Shares $1,000 $1,020.80 $4.42
1 Expenses are equal to the Fund’s annualized net expense ratios, multiplied by the average account valueover the period, multiplied by 184/366 (to reflect the one-half-year period). The annualized net expenseratios are as follows:
Class A Shares 1.13%
Class C Shares 1.88%
Institutional Shares 0.88%
Class R6 Shares 0.87%
Semi-Annual Shareholder Report31

Evaluation and Approval of AdvisoryContract – May 2019FEDERATED MDT SMALL CAP GROWTH FUND (THE “FUND”)
At its meetings in May 2019, the Fund’s Board of Trustees (the “Board”),including a majority of those Trustees who are not “interested persons” of theFund, as defined in the Investment Company Act of 1940 (the “IndependentTrustees”) reviewed and unanimously approved the continuation of the Fund’sinvestment advisory contract for an additional one-year term. The Board’sdecision regarding the contract reflects the exercise of its business judgment afterconsidering all of the information received on whether to continue theexisting arrangements.
At the request of the Independent Trustees, the Fund’s Chief ComplianceOfficer (the CCO) furnished to the Board in advance of its May 2019 meetingsan independent written evaluation presenting on the topics discussed below.The Board considered the CCO’s independent written evaluation (the “CCOFee Evaluation Report”), along with other information, in evaluating thereasonableness of the Fund’s management fee and in deciding to approve thecontinuation of the investment advisory contract. The CCO, in preparing theCCO Fee Evaluation Report, has the authority to retain consultants, experts orstaff as reasonably necessary to assist in the performance of his duties, reportsdirectly to the Board, and can be terminated only with the approval of amajority of the Independent Trustees. At the request of the IndependentTrustees, the CCO Fee Evaluation Report followed the same general approachand covered the same topics as that of the report that had previously beendelivered by the CCO in his capacity as “Senior Officer,” prior to theelimination of the Senior Officer position in December 2017.
The Board also considered judicial decisions concerning allegedly excessiveinvestment advisory fees in making its decision. Using these judicial decisions asa guide, the Board observed that the following factors may be relevant to anadviser’s fiduciary duty with respect to its receipt of compensation from a fund:(1) the nature and quality of the services provided by an adviser to a fund and itsshareholders (including the performance of the fund, its benchmark, andcomparable funds); (2) an adviser’s cost of providing the services (including theprofitability to an adviser of providing advisory services to a fund); (3) the extentto which an adviser may realize “economies of scale” as a fund grows largerand, if such economies of scale exist, whether they have been shared with a fundand its shareholders or the family of funds; (4) any “fall-out” financial benefitsthat accrue to an adviser because of its relationship with a fund (includingresearch services received from brokers that execute fund trades and any feespaid to affiliates of an adviser for services rendered to a fund); (5) comparativefee and expense structures (including a comparison of fees paid to an adviserwith those paid by similar funds both internally and externally as well asmanagement fees charged to institutional and other advisory clients of the
Semi-Annual Shareholder Report32

adviser for what might be viewed as like services); and (6) the extent of care,conscientiousness and independence with which the fund’s board membersperform their duties and their expertise (including whether they are fullyinformed about all facts the board deems relevant to its consideration of anadviser’s services and fees). The Board noted that the Securities and ExchangeCommission (SEC) disclosure requirements regarding the basis for the Board’sapproval of the Fund’s investment advisory contract generally align with thefactors listed above. The Board was aware of these factors and was guided bythem in its review of the Fund’s investment advisory contract to the extent itconsidered them to be appropriate and relevant, as discussed further below.
The Board considered and weighed these factors in light of its substantialaccumulated experience in governing the Fund and working with FederatedMDTA LLC (the “Adviser”) and its affiliates (collectively “Federated”) onmatters relating to the funds advised by Federated (each, a “Federated Fund”).The Independent Trustees were assisted in their deliberations by independentlegal counsel.
In addition to the extensive materials that comprise and accompany theCCO Fee Evaluation Report, the Board received detailed information aboutthe Fund and the Federated organization throughout the year, and inconnection with its May meetings at which the Board’s formal approval of theadvisory and subadvisory contracts occurred. In this regard, Federated providedmuch of this information at each regular meeting of the Board, and furnishedadditional information specifically in connection with the May meetings. In themonths preceding the May meetings, the Board requested and reviewed writtenmaterials prepared by Federated in response to requests on behalf of theIndependent Trustees encompassing a wide variety of topics. At the Maymeetings, in addition to meeting in separate sessions of the IndependentTrustees without management present, senior management of the Adviser alsomet with the Independent Trustees and their counsel to discuss the materialspresented and such additional matters as the Independent Trustees deemedreasonably necessary to evaluate the advisory and subadvisory contracts.Between regularly scheduled meetings, the Board also received information onparticular matters as the need arose.
The Board’s consideration of the investment advisory contract includedreview of the CCO Fee Evaluation Report, accompanying data and additionalinformation covering the following matters, among others: the Adviser’sinvestment philosophy, revenue, profitability, personnel and processes; investmentand operating strategies; the Fund’s short-term and long-term performance (inabsolute terms, both on a gross basis and net of expenses, as well as in termsrelative to its particular investment program and certain competitor or “peergroup” funds and/or other benchmarks, as appropriate) and comments on thereasons for performance; the Fund’s investment objectives; the Fund’s expenses,including the advisory fee and the overall expense structure of the Fund (bothin absolute terms and relative to similar and/or competing funds), with due
Semi-Annual Shareholder Report33

regard for contractual or voluntary expense limitations; the use and allocation ofbrokerage commissions derived from trading the Fund’s portfolio securities (ifany); and the nature, quality and extent of the advisory and other servicesprovided to the Fund by the Adviser and its affiliates. The Board also consideredthe preferences and expectations of Fund shareholders; the entrepreneurial andother risks assumed by the Adviser in sponsoring the Fund; the continuing stateof competition in the mutual fund industry and market practices; the range ofcomparable fees for similar funds in the mutual fund industry; the Fund’srelationship to the Federated Funds which include a comprehensive array offunds with different investment objectives, policies and strategies which aregenerally available for exchange without the incurrence of additional salescharges; compliance and audit reports concerning the Federated Funds and theFederated companies that service them (including communications fromregulatory agencies), as well as Federated’s responses to any issues raised therein;and relevant developments in the mutual fund industry and how the FederatedFunds and/or Federated are responding to them. The Board’s evaluation processis evolutionary. The criteria considered and the emphasis placed on relevantcriteria change in recognition of changing circumstances in the mutualfund marketplace.
While mindful that courts have cautioned against giving too much weight tocomparative information concerning fees charged by other advisers formanaging funds with comparable investment programs, the Board has found theuse of such comparisons to be relevant to its deliberations. In this regard, theBoard was presented with, and considered, information regarding thecontractual advisory fee rates, net advisory fee rates, total expense ratios andeach element of the Fund’s total expense ratio (i.e., gross and net advisory fees,custody fees, portfolio accounting fees and transfer agency fees) relative to anappropriate group of peer funds compiled by Federated using data supplied byindependent fund ranking organizations (the “Peer Group”). The Boardreceived a description of the composition and methodology used to select thePeer Group. The Board focused on comparisons with other similar mutual fundsmore heavily than non-mutual fund products or services because it is believedthat they are more relevant. For example, other mutual funds are the productsmost like the Fund, in that they are readily available to Fund shareholders asalternative investment vehicles. Also, they are the type of investment vehicle, infact, chosen and maintained by the Fund’s investors. The range of their fees andexpenses, therefore, appears to be a relevant indicator of what consumers havefound to be reasonable in the marketplace in which the Fund competes.
The Board reviewed the contractual advisory fee rate, net advisory fee rateand other expenses of the Fund and noted the position of the Fund’s fee ratesrelative to its Peer Group. In this regard, the Board noted that the contractualadvisory fee rate was above the median of the relevant Peer Group, but theBoard noted the applicable waivers and reimbursements, and that the overallexpense structure of the Fund remained competitive in the context of other
Semi-Annual Shareholder Report34

factors considered by the Board. In this regard, the Board had been previouslyadvised that, while comparisons to fund Peer Groups are relevant in judging thereasonableness of advisory fees, the Fund’s quantitative focus makes fee andexpense comparisons particularly difficult. Although the Fund’s advisory fee wasabove the median of the peer range, the Peer Group of funds varied widely intheir complexity, and the Board has been informed that the management of theFund is among the more complex relative to its Peer Group. The Boardconsidered the fact that the Adviser committed to permanently reduce fees ofthe Fund in an agreed upon amount, such reduction to be effective July 1, 2019.
For comparison, the CCO reviewed the fees charged by Federated forproviding advisory services to products other than the Federated Funds(e.g., institutional separate accounts and third-party unaffiliated mutual funds forwhich Federated serves as sub-adviser) (referenced to as “Comparable Funds/Accounts”). With respect to Comparable Funds/Accounts other than third-party mutual funds, the CCO concluded that they are inherently differentproducts. Those differences include, but are not limited to, different types oftargeted investors; different applicable laws and regulations; different legalstructures; different average account sizes and portfolio management techniquesmade necessary by different cash flows and different associated costs; and thetime spent by portfolio managers and their teams, as well as personnel in theFunds Financial Services, Legal, Compliance and Risk Managementdepartments, in reviewing securities pricing, addressing different administrativeresponsibilities, addressing different degrees of risk associated with managementand a variety of different costs. The CCO also reviewed the differences in thenature of the services required for Federated to manage its proprietary mutualfund business versus managing a discrete pool of assets as a sub-adviser toanother institution’s mutual fund, and that Federated generally performssignificant additional services and assumes substantially greater risks in managingthe Fund and other Federated Funds than in its role as sub-adviser to anunaffiliated third-party mutual fund. The CCO did not consider the fees forproviding advisory services to Comparable Funds/Accounts to be determinativein judging the appropriateness of the Federated Funds’ advisory fees.
The CCO noted that the services, administrative responsibilities and risksassociated with such relationships are quite different than serving as a primaryadviser to a fund.
Following such evaluation, and full deliberations, the Board concluded thatthe fees and expenses of the Fund are reasonable and supported renewal of theFund’s investment advisory contract.
The Board considered the nature, extent and quality of the services providedto the Fund by the Adviser and the resources of the Adviser and its affiliatesdedicated to the Fund. In this regard, the Board evaluated, among other things,the Adviser’s personnel, experience, track record, financial resources, overallreputation and willingness to invest in personnel and infrastructure that benefitthe Fund. In addition, the Board reviewed the qualifications, backgrounds and
Semi-Annual Shareholder Report35
responsibilities of the portfolio management team primarily responsible for theday-to-day management of the Fund and the Adviser’s ability and experience inattracting and retaining qualified personnel to service the Fund. The Boardnoted the investment research and company engagement capabilities of theAdviser and its affiliates. The Board also noted the compliance program of theAdviser and the compliance-related resources provided to the Fund by theAdviser, including the Adviser’s commitment to respond to rulemakinginitiatives of the SEC. The Fund’s ability to deliver competitive performancewhen compared to its Peer Group was also deemed to be relevant by the Boardas a useful indicator of how the Adviser is executing the Fund’s investmentprogram. The Adviser’s ability to execute this program was one of the Board’sconsiderations in reaching a conclusion that the nature, extent and quality of theAdviser’s investment management services warrant the continuation of theinvestment advisory contract.
In evaluating the Fund’s investment performance, the Board consideredperformance results in light of the Fund’s investment objective, strategies andrisks, as disclosed in the Fund’s prospectus. The Board considered detailedinvestment reports on the Fund’s performance that were provided to the Boardthroughout the year and in connection with the May meetings. The CCO alsoreviewed information regarding the performance of other mutual funds in thePeer Group, noting the CCO’s view that comparisons to fund peer groups maybe helpful, though not conclusive, in evaluating the performance of the Adviserin managing the Fund. The Board considered, in evaluating such comparisons,that in some cases there may be differences in the funds’ investment objectivesor investment management techniques, or the costs to implement funds, evenwithin the same Peer Group, and that the CCO had specifically noted that theFund’s quantitative focus makes fee and expense comparisons particularlydifficult as the funds in the Peer Group varied widely in their complexity, andthe management of the Fund is among the more complex relative to itsPeer Group.
For the periods covered by the CCO Fee Evaluation Report, the Fund’sperformance for the three-year and five-year periods was above the median ofthe relevant Peer Group, and the Fund’s performance fell below the median ofthe relevant Peer Group for the one-year period. In addition, the Board wasinformed by the Adviser that the Fund outperformed its benchmark index forthe one-year, three-year and five-year periods. The Board discussed the Fund’sperformance with the Adviser and recognized the efforts being taken by theAdviser in the context of other factors considered relevant by the Board.
Following such evaluation, and full deliberations, the Board concluded thatthe performance of the Fund supported renewal of the Fund’sadvisory contract.
Semi-Annual Shareholder Report36

The Board also received financial information about Federated, includinginformation regarding the compensation and ancillary (or “fall-out”) benefitsFederated derived from its relationships with the Federated Funds. Thisinformation covered not only the fees under the investment advisory contracts,but also fees received by Federated’s subsidiaries for providing other services tothe Federated Funds under separate contracts (e.g., for serving as the FederatedFunds’ administrator and distributor). In this regard, the Board considered thatcertain Federated subsidiaries provide distribution and shareholder services tothe Federated Funds, for which they may be compensated through distributionand servicing fees paid pursuant to Rule 12b-1 plans or otherwise. Theinformation also detailed any indirect benefit Federated may derive from itsreceipt of research services from brokers who execute Federated Fund trades. Inaddition, the Board considered the fact that, in order for a Federated Fund to becompetitive in the marketplace, the Adviser and its affiliates frequently waivedfees and/or reimbursed expenses and have disclosed to Federated Fund investorsand/or indicated to the Board their intention to do so in the future. Moreover,the Board receives regular reporting as to the institution, adjustment orelimination of these voluntary waivers. The Board considered Federated’sprevious reductions in contractual management fees to certain Federated Fundsin response to the CCO’s recommendations in the prior year’s CCO FeeEvaluation Report.
In 2016, the Board approved a reduction of 16 basis points in the contractualadvisory fee. In 2018, the Board approved a reduction of 14 basis points in thecontractual advisory fee. This change was intended to more closely align thecontractual fee with the net fee actually charged after the imposition ofapplicable voluntary waivers. In 2019, the Board approved a further reduction of5 basis points in the contractual advisory fee.
Federated furnished information, requested by the CCO, that reportedrevenues on a fund-by-fund basis and made estimates of the allocation ofexpenses on a fund-by-fund basis, using allocation methodologies specified bythe CCO. The CCO noted that, while these cost allocation reports applyconsistent allocation processes, the inherent difficulties in allocating costscontinues to cause the CCO to question the precision of the process and toconclude that such reports may be unreliable, since a single change in anallocation estimate may dramatically alter the resulting estimate of cost and/orprofitability of a Federated Fund and may produce unintended consequences.The allocation information, including the CCO’s view that fund-by-fundestimations may be unreliable, was considered in the evaluation by the Board.
Semi-Annual Shareholder Report37

The Board and the CCO also reviewed information compiled by Federatedcomparing its profitability information to other publicly held fund managementcompanies, including information regarding profitability trends over time. In thisregard, the CCO concluded that Federated’s profit margins did not appear to beexcessive. The CCO also noted that Federated appeared financially sound, withthe resources necessary to fulfill its obligations under its contracts withthe Fund.
The CCO Fee Evaluation Report also discussed the notion of possiblerealization of “economies of scale” as a fund grows larger, the difficulties ofcalculating economies of scale at an individual fund level, and the extent towhich potential scale benefits are shared with shareholders. In this regard, theBoard considered that Federated has made significant and long-term investmentsin areas that support all of the Federated Funds, such as personnel and processesfor the portfolio management, shareholder services, compliance, internal auditand risk management functions, as well as systems technology (includingtechnology relating to cybersecurity) and that the benefits of these investments(as well as any economies of scale, should they exist) were likely to be sharedwith the Federated Fund family as a whole. The Board noted that Federated’sinvestments in these areas are extensive. In addition, the Board considered thatthe Adviser and its affiliates have frequently waived fees and/or reimbursedexpenses and that this has allowed potential economies of scale to be sharedwith shareholders. The Board also considered that such waivers andreimbursements can provide protection from an increase in expenses if aFederated Fund’s assets decline. Federated, as it does throughout the year, andspecifically in connection with the Board’s review of the advisory andsubadvisory contracts, furnished information relative to revenue sharing oradviser-paid fees. Federated and the CCO noted that this information should beviewed to determine if there was an incentive to either not apply breakpoints, orto apply breakpoints at higher levels, and should not be viewed to determine theappropriateness of advisory fees. The Board also noted the absence of anyapplicable regulatory or industry guidelines on this subject, which (as discussedin the CCO Fee Evaluation Report) is compounded by the lack of anycommon industry practice or general pattern with respect to structuring fundadvisory fees with “breakpoints” that serve to reduce the fee as a fund attains acertain size.
The CCO stated that his observations and the information accompanying theCCO Fee Evaluation Report supported a finding by the Board that themanagement fee for the Fund was reasonable. Under these circumstances, nochanges were recommended to, and no objection was raised to the continuationof, the Fund’s investment advisory contract. The CCO also recognized that theBoard’s evaluation of the Federated Funds’ advisory and subadvisoryarrangements is a continuing and on-going process that is informed by the
Semi-Annual Shareholder Report38

information that the Board requests and receives from management throughoutthe course of the year and, in this regard, the CCO noted certain items forfuture reporting to the Board or further consideration by management as theBoard continues its on-going oversight of the Federated Funds.
In its decision to continue an existing investment advisory contract, the Boardwas mindful of the potential disruptions of the Fund’s operations and variousrisks, uncertainties and other effects that could occur as a result of a decision toterminate or not renew an investment advisory contract. In particular, the Boardrecognized that many shareholders have invested in the Fund on the strength ofthe Adviser’s industry standing and reputation and with the expectation that theAdviser will have a continuing role in providing advisory services to the Fund.Thus, the Board’s approval of the investment advisory contract reflected the factthat it is the shareholders who have effectively selected the Adviser by virtue ofhaving invested in the Fund. The Board concluded that, in light of the factorssummarized above, including the nature, quality and scope of the servicesprovided to the Fund by the Adviser and its affiliates, continuation of theinvestment advisory contract was appropriate.
The Board based its decision to approve the investment advisory contract onthe totality of the circumstances and relevant factors and with a view to past andfuture long-term considerations. Not all of the factors and considerationsidentified above were necessarily relevant to the Fund, nor did the Boardconsider any one of them to be determinative. With respect to the factors thatwere relevant, the Board’s decision to approve the continuation of the contractreflects its view that Federated’s performance and actions provided a satisfactorybasis to support the decision to continue the existing arrangement.
Semi-Annual Shareholder Report39

Voting Proxies on Fund Portfolio SecuritiesA description of the policies and procedures that the Fund uses to determinehow to vote proxies, if any, relating to securities held in the Fund’s portfolio isavailable, without charge and upon request, by calling 1-800-341-7400. A reporton “Form N-PX” of how the Fund voted any such proxies during the mostrecent 12-month period ended June 30 is available via the Proxy Voting Record(Form N-PX) link associated with the Fund and share class name atwww.FederatedInvestors.com/FundInformation. Form N-PX filings are alsoavailable at the SEC’s website at sec.gov.
Quarterly Portfolio ScheduleEach fiscal quarter, the Fund will file with the SEC a complete schedule of itsmonthly portfolio holdings on “Form N-PORT.” The Fund’s holdings as ofthe end of the third month of every fiscal quarter, as reported onForm N-PORT, will be publicly available on the SEC’s website at www.sec.govwithin 60 days of the end of the fiscal quarter upon filing. You may also accessthis information via the link to the Fund and share class nameat www.FederatedInvestors.com.
Semi-Annual Shareholder Report40

Mutual funds are not bank deposits or obligations, are not guaranteed by any bank andare not insured or guaranteed by the U.S. government, the Federal Deposit InsuranceCorporation, the Federal Reserve Board or any other government agency. Investment inmutual funds involves investment risk, including the possible loss of principal.
This Report is authorized for distribution to prospective investors only whenpreceded or accompanied by the Fund’s Prospectus, which contains factsconcerning its objective and policies, management fees, expenses andother information.
IMPORTANT NOTICE ABOUT FUND DOCUMENT DELIVERY In an effort to reduce costs and avoid duplicate mailings, the Fund(s) intendto deliver a single copy of certain documents to each household in whichmore than one shareholder of the Fund(s) resides (so-called“householding”), as permitted by applicable rules. The Fund’s“householding” program covers its/their Prospectus and Statement ofAdditional Information, and supplements to each, as well as Semi-Annualand Annual Shareholder Reports and any Proxies or information statements.Shareholders must give their written consent to participate in the“householding” program. The Fund is also permitted to treat a shareholderas having given consent (“implied consent”) if (i) shareholders with the samelast name, or believed to be members of the same family, reside at the samestreet address or receive mail at the same post office box, (ii) the Fund givesnotice of its intent to “household” at least sixty (60) days before it begins“householding” and (iii) none of the shareholders in the household havenotified the Fund(s) or their agent of the desire to “opt out” of“householding.” Shareholders who have granted written consent, or havebeen deemed to have granted implied consent, can revoke that consent andopt out of “householding” at any time: shareholders who purchased sharesthrough an intermediary should contact their representative; othershareholders may call the Fund at 1-800-341-7400.
Semi-Annual Shareholder Report41

Notes
[PAGE INTENTIONALLY LEFT BLANK]

Notes
[PAGE INTENTIONALLY LEFT BLANK]

Notes
[PAGE INTENTIONALLY LEFT BLANK]

Federated MDT Small Cap Growth FundFederated Hermes Funds4000 Ericsson DriveWarrendale, PA 15086-7561
Contact us at FederatedInvestors.comor call 1-800-341-7400.
Federated Securities Corp., Distributor
CUSIP 31421R775CUSIP 31421R767CUSIP 31421R759CUSIP 31421R619
36367 (3/20)
© 2020 Federated Hermes, Inc.