federal climate change programs: funding history … congress of the united states o congressional...
TRANSCRIPT

MARCH 2010
CONGRESS OF THE UNITED STATESCONGRESSIONAL BUDGET OFFICE
CBOFederal
Climate Change Programs:
Funding History andPolicy Issues
© J
upite
rImag
es

Pub. No. 4025
A
S T U D Y
CBO
Federal Climate Change Programs: Funding History and Policy Issues
March 2010
The Congress of the United States O Congressional Budget Office

CBO
Notes
Unless otherwise noted, all budget authority and estimates of revenue losses attributable to tax preferences have been converted to 2009 dollars using the gross domestic product chain-weighted producer price index.
Unless otherwise noted, all years are federal fiscal years, which run from October 1 to September 30.
Numbers in the text and tables might not add up to totals because of rounding.
On the cover: wind turbines, Tehachapi Pass, California, Department of Energy photo; window caulking, JupiterImages; photovoltaic panels near Alamosa, Colorado, National Renewable Energy Laboratory photo by Steve Wilcox.

Preface
As awareness of global climate change has expanded over the past decade, successive Congresses and Administrations have committed resources to studying climate change and reducing emissions of greenhouse gases, most notably carbon dioxide. The effort has included funding science and technology, creating tax preferences, and assisting other countries in their attempts to curtail greenhouse-gas emissions. At the direction of the Congress, successive Administrations have produced annual tabulations of the costs of the federal government’s climate change programs.
This Congressional Budget Office (CBO) study examines the government’s commitment of resources to those purposes. It presents information on current spending and analyzes recent patterns and trends in spending. In keeping with CBO’s mandate to provide objective, impartial analysis, this study makes no recommendations.
The study was written by Philip Webre of CBO’s Microeconomic Studies Division under the supervision of Joseph Kile and David Moore. Mark Booth and Grant Driessen provided data on excise taxes and tax preferences. Mark Booth, Kim Cawley, Terry Dinan, Ron Gecan, Daniel Hoople, Deborah Lucas, John Peterson, Robert Shackleton, and Julie Somers com-mented on various drafts. Jane Leggett of the Congressional Research Service and Gilbert Metcalf of Tufts University also provided useful comments. (The assistance of external reviewers implies no responsibility for the final product, which rests solely with CBO.)
Kate Kelly edited the study and Chris Howlett, Loretta Lettner, and Sherry Snyder proofread it. Jeanine Rees prepared the study for publication and Maureen Costantino designed the cover. Monte Ruffin produced the printed copies, Linda Schimmel coordinated the print distribution, and Simone Thomas and Annette Kalicki produced the electronic version for CBO’s Web site (www.cbo.gov).
Douglas W. ElmendorfDirector
March 2010
CBO


Contents
Summary and Introduction 1
Funding for Federal Climate Change Programs 4
Regular Appropriations from 1998 Through 2009 5
American Recovery and Reinvestment Act of 2009 7
Tax Preferences to Encourage Reductions in Emissions of Greenhouse Gases 10
Related Federal Actions 10
Rationales for Funding Federal Climate Change Programs 12
Social Benefits of Knowledge Exceed Private Benefits 14
Social Costs of Burning Fossil Fuels Are Not Fully Reflected in Market Prices 14
Consumers Have Muted Responses to Price Signals 15
Industry Structure and Regulation Weaken Incentives for Investment 15
Assessing Federal Climate Change Programs 16
Federal Research and Development in Climate Change 16
Technology Demonstration Projects 18
Programs to Foster Energy Efficiency 20
Financing for Electricity Infrastructure 21
Climate-Related Tax Preferences 22
CBO
VI FEDERAL CLIMATE CHANGE PROGRAMS: FUNDING HISTORY AND POLICY ISSUES
CBO
Tables
1.
Box
Budget Authority for Federal Climate Change Programs 5
2.
Budget Authority for Climate Change Technology Programs 73.
Budget Authority for Climate Science Programs 84.
ARRA’s Climate Technology Programs 95.
Estimated Revenue Losses Attributable to Climate-Related Tax Preferences, 2003 to 2009 11Figures
1. Federal Climate Change Funding, by Category 2
2.
New Wind Energy Generating Capacity 231. Other Federal Actions That Can Affect Emissions of Greenhouse Gases 12

Federal Climate Change Programs: Funding History and Policy Issues
Summary and IntroductionIn recent years, the federal government has allocated sev-eral billion dollars annually for projects to expand the understanding of climate change or to reduce carbon dioxide and other greenhouse-gas (GHG) emissions. Most of that spending is done by the Department of Energy (DOE) and by the National Aeronautics and Space Administration (NASA), although a dozen other federal agencies also participate. The work is coordinated by committees in the Executive Office of the President. Successive Administrations have tracked the funding of climate change programs and the cost of tax incentives related to climate change through what is sometimes called the “climate change budget.” That budget typically has included federal efforts in several categories:
B Technology programs that develop, demonstrate, and deploy new products or processes to reduce GHG emissions;
B Scientific research directed toward explaining the processes of climate change and monitoring the global climate;
B Assistance to other countries as they work to reduce GHG emissions; and
B Tax incentives that encourage businesses and house-holds to adopt technologies that curtail the use of fossil fuels and reduce GHG emissions.
Funding for Federal Climate Change Programs From 1998 to 2009, appropriations for agencies’ work related to climate change totaled about $99 billion (in 2009 dollars); more than a third of that sum was
provided in fiscal year 2009. In addition, climate-related tax preferences reduced tax revenues, by a much smaller amount, from what would have been collected in their absence. For most of that period, federal resources devoted to examining and mitigating climate change grew slowly and unevenly when adjusted for inflation. Regular annual appropriations rose from $4.0 billion in 1998 (measured in 2009 dollars) to $7.5 billion in 2009. During that period, the nation’s commitment to climate-related technology development increased significantly, as has the forgone revenue attributable to tax preferences. Funding for climate science and international assistance, by contrast, stayed roughly constant.
Growth in reported funding for climate programs occurred in three ways over the past decade. First, fund-ing increased for some programs that were already in the tabulation of the climate change budget. Second, as dif-ferent Administrations reconsidered what constituted a climate change program, some programs, most notably those in DOE for the development of nuclear power, were included in the tabulation without a change in mis-sion. Third, the focus of some programs has shifted to emphasize climate change, and they were added to the climate change budget. DOE’s program for research and development (R&D) on energy supplied from fossil fuels, for example, evolved from research on converting coal into liquid fuels to finding ways to cut GHG emissions from coal-fired power plants.
A dramatic increase in funding came with the enactment in February 2009 of the American Recovery and Rein-vestment Act of 2009 (ARRA, Public Law 111-5), known as the economic stimulus legislation. Funding available under ARRA totals $35.7 billion for activities that the Congressional Budget Office (CBO) judges are
CBO

2 FEDERAL CLIMATE CHANGE PROGRAMS: FUNDING HISTORY AND POLICY ISSUES
CBO
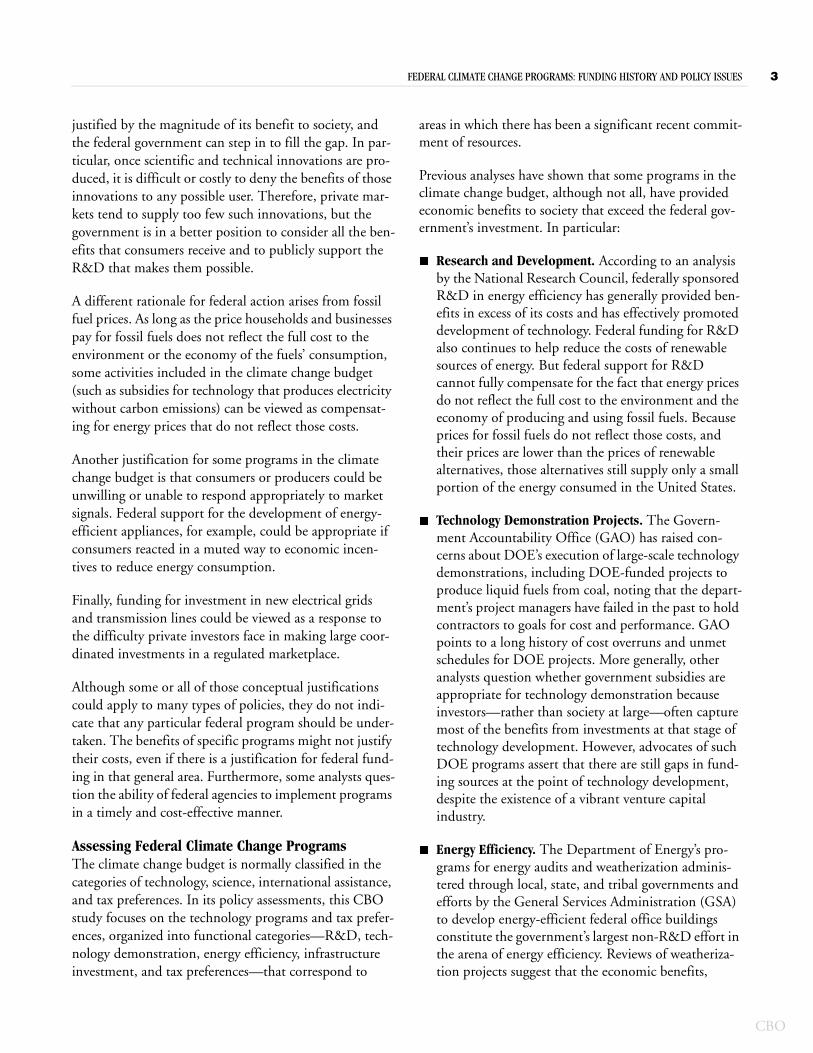
Figure 1.
Federal Climate Change Funding, by Category(Budget authority in billions of 2009 dollars)
Sources: Congressional Budget Office based on Office of Management and Budget, Federal Climate Change Expenditures: Report to Congress (various years); and Government Accountability Office, Climate Change: Federal Reports on Climate Change Funding Should Be Clearer and More Complete, GAO-05-461 (August 2005), www.gao.gov/new.items/d05461.pdf.
Notes: Budget authority is the authority provided by law to incur financial obligations that will result in immediate or future outlays of federal government funds. This figure presents ARRA appropriations and regular 2009 appropriations separately.
ARRA = American Recovery and Reinvestment Act of 2009.
1
1998 1999 2000 2001 2002 2003 2004 2005 2006 2007 2008 2009 ARRA
0
5
10
15
20
25
30
35
40
Technology
Climate Science
International Assistance
related to climate change (see Figure 1). Even though ARRA substantially increased R&D funding, the largest commitments of resources in that bill were for weather-ization and other conservation efforts and for subsidies for new energy generation and electrical transmission facilities in the technology portion of the climate change budget. By contrast, the science programs received very little new funding and international assistance efforts received none.
However, spending ARRA’s funds may prove challeng-ing. Federal agencies face a statutory deadline of September 30, 2010, for obligating most of those funds—that is, for issuing contracts, ordering goods and services, or otherwise committing the agency to pay out the funds. Some analysts have raised questions about the ability of the responsible federal and state agencies to meet the deadline while maintaining program quality. Among other factors, the states are facing severe budget
1. ARRA provided appropriations for 2009 beyond amounts in the year’s regular appropriation acts. This study considers ARRA and the regular appropriations for 2009 separately to illustrate the developments in climate change policy that occurred in that year.
constraints, shortages of trained personnel, and the need to comply with federal regulatory requirements, including those that govern pay rates.
Rationales for Funding Federal Climate Change ProgramsGlobal climate change poses one of the nation’s most sig-nificant long-term policy challenges. Human activities are producing increasingly large quantities of greenhouse gases, especially carbon dioxide. A strong consensus has developed in the expert community that, if allowed to continue unabated, the accumulation of greenhouse gases in the atmosphere will have extensive, highly uncertain, but potentially serious and costly consequences for regional climates around the world.2
A leading argument in favor of federal support for climate science and R&D programs holds that because private developers of scientific and technical innovations do not capture all of the benefits from their discoveries and inventions, private investment is lower than would be
2. See Congressional Budget Office, Potential Impacts of Climate Change in the United States (May 2009).
FEDERAL CLIMATE CHANGE PROGRAMS: FUNDING HISTORY AND POLICY ISSUES 3
justified by the magnitude of its benefit to society, and the federal government can step in to fill the gap. In par-ticular, once scientific and technical innovations are pro-duced, it is difficult or costly to deny the benefits of those innovations to any possible user. Therefore, private mar-kets tend to supply too few such innovations, but the government is in a better position to consider all the ben-efits that consumers receive and to publicly support the R&D that makes them possible.
A different rationale for federal action arises from fossil fuel prices. As long as the price households and businesses pay for fossil fuels does not reflect the full cost to the environment or the economy of the fuels’ consumption, some activities included in the climate change budget (such as subsidies for technology that produces electricity without carbon emissions) can be viewed as compensat-ing for energy prices that do not reflect those costs.
Another justification for some programs in the climate change budget is that consumers or producers could be unwilling or unable to respond appropriately to market signals. Federal support for the development of energy-efficient appliances, for example, could be appropriate if consumers reacted in a muted way to economic incen-tives to reduce energy consumption.
Finally, funding for investment in new electrical grids and transmission lines could be viewed as a response to the difficulty private investors face in making large coor-dinated investments in a regulated marketplace.
Although some or all of those conceptual justifications could apply to many types of policies, they do not indi-cate that any particular federal program should be under-taken. The benefits of specific programs might not justify their costs, even if there is a justification for federal fund-ing in that general area. Furthermore, some analysts ques-tion the ability of federal agencies to implement programs in a timely and cost-effective manner.
Assessing Federal Climate Change ProgramsThe climate change budget is normally classified in the categories of technology, science, international assistance, and tax preferences. In its policy assessments, this CBO study focuses on the technology programs and tax prefer-ences, organized into functional categories—R&D, tech-nology demonstration, energy efficiency, infrastructure investment, and tax preferences—that correspond to
areas in which there has been a significant recent commit-ment of resources.
Previous analyses have shown that some programs in the climate change budget, although not all, have provided economic benefits to society that exceed the federal gov-ernment’s investment. In particular:
B Research and Development. According to an analysis by the National Research Council, federally sponsored R&D in energy efficiency has generally provided ben-efits in excess of its costs and has effectively promoted development of technology. Federal funding for R&D also continues to help reduce the costs of renewable sources of energy. But federal support for R&D cannot fully compensate for the fact that energy prices do not reflect the full cost to the environment and the economy of producing and using fossil fuels. Because prices for fossil fuels do not reflect those costs, and their prices are lower than the prices of renewable alternatives, those alternatives still supply only a small portion of the energy consumed in the United States.
B Technology Demonstration Projects. The Govern-ment Accountability Office (GAO) has raised con-cerns about DOE’s execution of large-scale technology demonstrations, including DOE-funded projects to produce liquid fuels from coal, noting that the depart-ment’s project managers have failed in the past to hold contractors to goals for cost and performance. GAO points to a long history of cost overruns and unmet schedules for DOE projects. More generally, other analysts question whether government subsidies are appropriate for technology demonstration because investors—rather than society at large—often capture most of the benefits from investments at that stage of technology development. However, advocates of such DOE programs assert that there are still gaps in fund-ing sources at the point of technology development, despite the existence of a vibrant venture capital industry.
B Energy Efficiency. The Department of Energy’s pro-grams for energy audits and weatherization adminis-tered through local, state, and tribal governments and efforts by the General Services Administration (GSA) to develop energy-efficient federal office buildings constitute the government’s largest non-R&D effort in the arena of energy efficiency. Reviews of weatheriza-tion projects suggest that the economic benefits,
CBO
4 FEDERAL CLIMATE CHANGE PROGRAMS: FUNDING HISTORY AND POLICY ISSUES
CBO
including energy savings, that accrue from federally sponsored investments in energy efficiency surpass the programs’ costs. Although DOE and GSA have obli-gated a substantial share of their ARRA funds in antic-ipation of the statutory deadline of September 30, 2010, new regulatory requirements imposed by ARRA and state budget constraints have slowed spending for some DOE weatherization projects.
B Electrical Infrastructure. The federal government subsidizes both the development of technology and the investment in facilities that reduce the amount of greenhouse gases emitted in meeting the nation’s demand for electricity. DOE’s programs have contrib-uted to the development of wind and solar technolo-gies, and tax preferences provide incentives for their deployment. ARRA included funding to DOE for matching grants for smart-grid upgrades and for loan guarantees for innovative technology projects. Those programs are subject to two different deadlines. The department is required to obligate smart-grid funds by September 30, 2010; as of February 2010, it had obli-gated 65 percent of the funds for that purpose. The law also specifies that funding for loan guarantees is to be used for projects that begin construction by September 30, 2011; as of February 2010, just 1 percent of those funds had been obligated.
Although the subsidies provided in the climate change budget address a policy objective that was adopted rel-atively recently, subsidies for investment in electrical facilities are not new. Several federal credit programs, notably those that support rural electrification, have existed for decades and sometimes have continued long after their original goal was met. The difficulties in meeting the obligation schedules in ARRA notwithstanding, that experience suggests that, once started, subsidies to the electricity sector can be diffi-cult to stop.
B Tax Preferences. Because tax preferences (generally provided as tax credits or tax deductions) apply only to specific actions, many analysts regard them as ineffi-cient tools for promoting reduced GHG emissions. For example, conserving home heating oil by install-ing solar heating systems is encouraged by a tax credit, but turning thermostats down and wearing sweaters is not, even though doing so could achieve substantial reductions in GHG emissions at a lower cost. Tax preferences that are intended to encourage consumers
and producers of electricity to choose technologies that reduce emissions vary widely in the amount of GHG emissions curtailed per tax dollar forgone. According to one calculation, the subsidy per ton of greenhouse gases not emitted can vary by about 50 percent from the same tax provision, depending on whether it is used for wind or geothermal technology. Most analysts believe that better results might come from increasing the price of GHG emissions because market forces tend to equalize the cost of reducing GHG emissions as consumers and producers respond to price signals. Despite their limitations, tax credits and deductions have helped encourage investment in renewable sources of energy.
Funding for Federal Climate Change Programs For several decades, the federal government has funded programs related to what is now recognized as a global trend toward a warming climate. Among the govern-ment’s programs are climate science efforts to monitor atmospheric concentrations of greenhouse gases and track attendant changes in the Earth’s temperatures and weather. Other research has involved the development of technology for using sources of energy that emit less car-bon dioxide. The government has also provided funding and tax incentives to encourage the development and adoption of products and programs aimed at reducing GHG emissions. In addition, the United States assists other countries’ efforts to curtail emissions. Last year’s enactment of ARRA substantially increased funding for efforts to reduce GHG emissions.
Since 1989, a Cabinet-level committee has coordinated the activities of 14 federal agencies that study climate change or work to mitigate emissions of greenhouse gases, although the bulk of the spending is carried out by DOE and NASA.3 Until 2007, the Office of Management
3. Various Administrations have grouped programs differently and have sometimes given them different names. For the sake of conti-nuity, this study refers to programs in their current configurations, with the recognition that names and composition have changed over time. For a comprehensive history of the various Administra-tions’ groupings of climate change programs, see Jane A. Leggett, Climate Change: Federal Program Funding and Tax Incentives, CRS Report for Congress RL33817 (Congressional Research Service, December 22, 2008), pp. 2–5, www.crs.gov/ReportPDF/RL33817.pdf.

FEDERAL CLIMATE CHANGE PROGRAMS: FUNDING HISTORY AND POLICY ISSUES 5
Table 1.
Budget Authority for Federal Climate Change Programs(Billions of 2009 dollars)
Sources: Congressional Budget Office based on Office of Management and Budget, Federal Climate Change Expenditures: Report to Congress (various years); and Government Accountability Office, Climate Change: Federal Reports on Climate Change Funding Should Be Clearer and More Complete, GAO-05-461 (August 2005), www.gao.gov/new.items/d05461.pdf.
Notes: Budget authority is the authority provided by law to incur financial obligations that will result in immediate or future outlays of federal government funds.
ARRA= American Recovery and Reinvestment Act of 2009; n.a. = not available.
a. The amounts for 2009 exclude budget authority provided by ARRA, which was enacted on February 17, 2009.
1998 1999 2000 2001 2002 2003 2004 2005 2006 2007 2008 2009 a ARRA
Technology 1.6 2.2 2.2 2.0 2.0 3.0 3.3 3.1 3.0 3.7 4.3 5.2 35.2Climate Science 2.2 2.1 2.1 2.1 2.0 2.4 2.3 2.1 1.8 1.9 1.9 2.0 0.5International Aid 0.2 0.4 0.2 0.3 0.3 0.3 0.3 0.3 0.3 0.2 0.2 0.3 0___ ___ ___ ___ ___ ___ ___ ___ ___ ___ ___ ___ ____
Total 4.0 4.5 4.4 4.4 4.2 5.7 5.8 5.4 5.1 5.8 6.4 7.5 35.7
Forgone Revenues fromTax Preferences n.a. n.a. n.a. n.a. n.a. 0.7 0.6 0.4 1.2 1.6 1.9 2.2 n.a.
and Budget (OMB), as a member of the committee, tab-ulated funding for climate change programs and pre-sented the information to the Congress in annual reports on what it called the climate change budget.4 OMB has supplied CBO with tabulations for 2008 and 2009. Except for appropriations under ARRA, the climate change spending and revenue data in this report come from OMB’s recent tabulations and are supplemented with data that summarize earlier annual reports.5
Regular Appropriations from 1998 Through 2009 For most of the period from 1998 to 2009, appropria-tions for all climate change programs were roughly con-stant as a share of total discretionary appropriations.6 Annual funding related to climate change typically was
4. This CBO study updates a CBO memorandum on federal climate spending, Climate Change and the Federal Budget (August 1998).
5. Office of Management and Budget, Federal Climate Change Expenditures: Report to Congress (various years); and Government Accountability Office, Climate Change: Federal Reports on Climate Change Funding Should Be Clearer and More Complete, GAO-05-461 (August 2005), www.gao.gov/new.items/d05461.pdf.
6. Funding for climate change programs usually is provided in the form of budget authority set in annual appropriation acts—that is, discretionary budget authority—in contrast with spending for Social Security, Medicare, or interest payments on the debt, which occurs without specific annual appropriations. Budget authority allows agencies to incur financial obligations that will result in immediate or future outlays of federal government funds.
less than 0.6 percent of discretionary funding during the period. Because of the increased appropriations pro-vided in ARRA, climate change programs accounted for 2.9 percent of all discretionary budget authority for 2009. ARRA’s appropriations accounted for 36 percent of total climate funding from 1998 through 2009, measured in 2009 dollars.
Spending in the climate change budget is targeted to three primary areas of federal concern:
B Development of technologies to reduce GHG emissions;
B Study and monitoring of the global climate; and
B Support for efforts of other countries to reduce GHG emissions.
Most of the real (inflation-adjusted) growth in climate programs after 1998 was in funding for technology devel-opment, demonstration, and deployment. Real spending on climate science was roughly constant. International assistance also was roughly constant and relatively small, compared with the other two categories (see Table 1). In 1998, programs in the climate change budget received a total of $4.0 billion in budget authority (in 2009 dollars). Of that amount, climate science received somewhat more than technology development. By 2009, the amounts and
CBO
6 FEDERAL CLIMATE CHANGE PROGRAMS: FUNDING HISTORY AND POLICY ISSUES
CBO
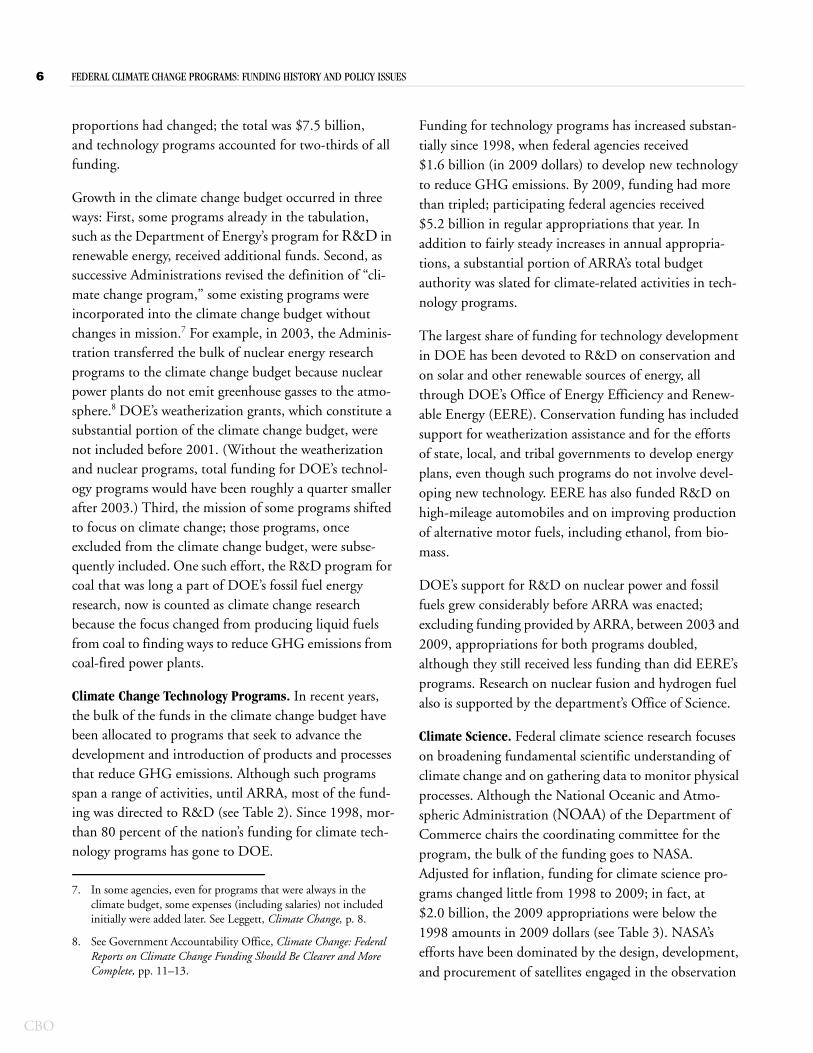
proportions had changed; the total was $7.5 billion, and technology programs accounted for two-thirds of all funding.
Growth in the climate change budget occurred in three ways: First, some programs already in the tabulation, such as the Department of Energy’s program for R&D in renewable energy, received additional funds. Second, as successive Administrations revised the definition of “cli-mate change program,” some existing programs were incorporated into the climate change budget without changes in mission.7 For example, in 2003, the Adminis-tration transferred the bulk of nuclear energy research programs to the climate change budget because nuclear power plants do not emit greenhouse gasses to the atmo-sphere.8 DOE’s weatherization grants, which constitute a substantial portion of the climate change budget, were not included before 2001. (Without the weatherization and nuclear programs, total funding for DOE’s technol-ogy programs would have been roughly a quarter smaller after 2003.) Third, the mission of some programs shifted to focus on climate change; those programs, once excluded from the climate change budget, were subse-quently included. One such effort, the R&D program for coal that was long a part of DOE’s fossil fuel energy research, now is counted as climate change research because the focus changed from producing liquid fuels from coal to finding ways to reduce GHG emissions from coal-fired power plants.
Climate Change Technology Programs. In recent years, the bulk of the funds in the climate change budget have been allocated to programs that seek to advance the development and introduction of products and processes that reduce GHG emissions. Although such programs span a range of activities, until ARRA, most of the fund-ing was directed to R&D (see Table 2). Since 1998, mor-than 80 percent of the nation’s funding for climate tech-nology programs has gone to DOE.
7. In some agencies, even for programs that were always in the climate budget, some expenses (including salaries) not included initially were added later. See Leggett, Climate Change, p. 8.
8. See Government Accountability Office, Climate Change: Federal Reports on Climate Change Funding Should Be Clearer and More Complete, pp. 11–13.
Funding for technology programs has increased substan-tially since 1998, when federal agencies received $1.6 billion (in 2009 dollars) to develop new technology to reduce GHG emissions. By 2009, funding had more than tripled; participating federal agencies received $5.2 billion in regular appropriations that year. In addition to fairly steady increases in annual appropria-tions, a substantial portion of ARRA’s total budget authority was slated for climate-related activities in tech-nology programs.
The largest share of funding for technology development in DOE has been devoted to R&D on conservation and on solar and other renewable sources of energy, all through DOE’s Office of Energy Efficiency and Renew-able Energy (EERE). Conservation funding has included support for weatherization assistance and for the efforts of state, local, and tribal governments to develop energy plans, even though such programs do not involve devel-oping new technology. EERE has also funded R&D on high-mileage automobiles and on improving production of alternative motor fuels, including ethanol, from bio-mass.
DOE’s support for R&D on nuclear power and fossil fuels grew considerably before ARRA was enacted; excluding funding provided by ARRA, between 2003 and 2009, appropriations for both programs doubled, although they still received less funding than did EERE’s programs. Research on nuclear fusion and hydrogen fuel also is supported by the department’s Office of Science.
Climate Science. Federal climate science research focuses on broadening fundamental scientific understanding of climate change and on gathering data to monitor physical processes. Although the National Oceanic and Atmo-spheric Administration (NOAA) of the Department of Commerce chairs the coordinating committee for the program, the bulk of the funding goes to NASA. Adjusted for inflation, funding for climate science pro-grams changed little from 1998 to 2009; in fact, at $2.0 billion, the 2009 appropriations were below the 1998 amounts in 2009 dollars (see Table 3). NASA’s efforts have been dominated by the design, development, and procurement of satellites engaged in the observation
FEDERAL CLIMATE CHANGE PROGRAMS: FUNDING HISTORY AND POLICY ISSUES 7
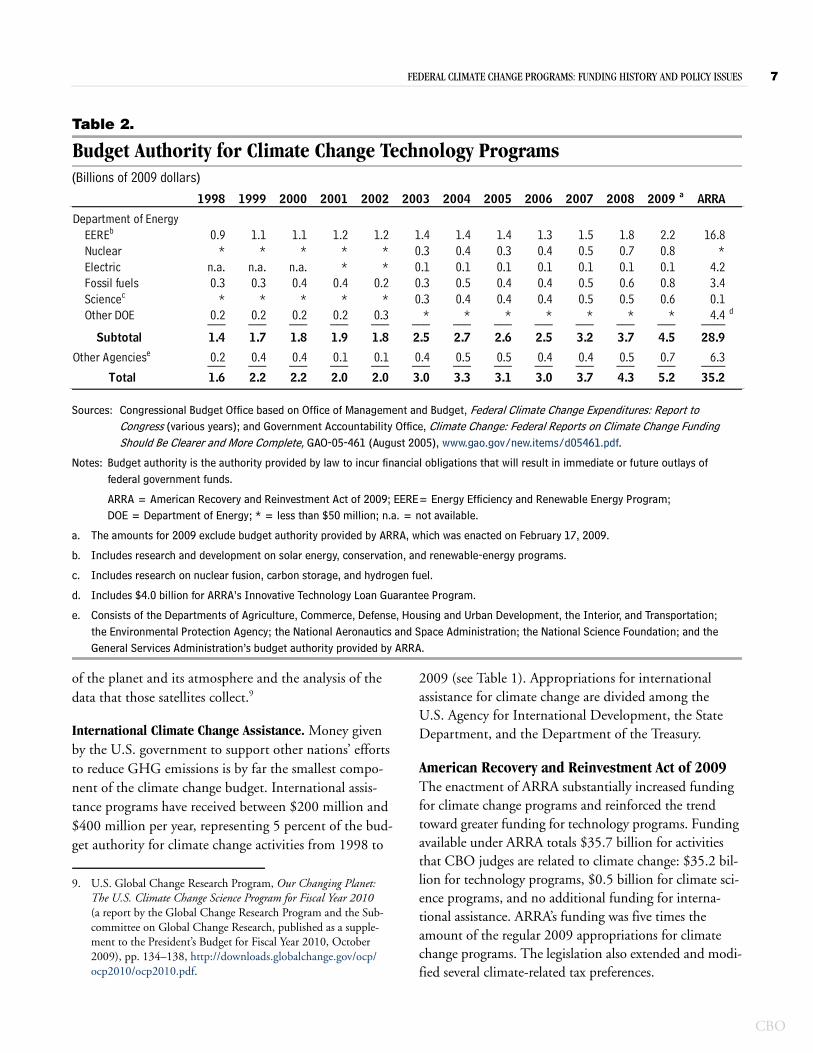
Table 2.
Budget Authority for Climate Change Technology Programs(Billions of 2009 dollars)
Sources: Congressional Budget Office based on Office of Management and Budget, Federal Climate Change Expenditures: Report to Congress (various years); and Government Accountability Office, Climate Change: Federal Reports on Climate Change Funding Should Be Clearer and More Complete, GAO-05-461 (August 2005), www.gao.gov/new.items/d05461.pdf.
Notes: Budget authority is the authority provided by law to incur financial obligations that will result in immediate or future outlays of federal government funds.
ARRA = American Recovery and Reinvestment Act of 2009; EERE= Energy Efficiency and Renewable Energy Program; DOE = Department of Energy; * = less than $50 million; n.a. = not available.
a. The amounts for 2009 exclude budget authority provided by ARRA, which was enacted on February 17, 2009.
b. Includes research and development on solar energy, conservation, and renewable-energy programs.
c. Includes research on nuclear fusion, carbon storage, and hydrogen fuel.
d. Includes $4.0 billion for ARRA’s Innovative Technology Loan Guarantee Program.
e. Consists of the Departments of Agriculture, Commerce, Defense, Housing and Urban Development, the Interior, and Transportation; the Environmental Protection Agency; the National Aeronautics and Space Administration; the National Science Foundation; and the General Services Administration’s budget authority provided by ARRA.
1998 1999 2000 2001 2002 2003 2004 2005 2006 2007 2008 2009 a ARRA
Department of EnergyEEREb 0.9 1.1 1.1 1.2 1.2 1.4 1.4 1.4 1.3 1.5 1.8 2.2 16.8Nuclear * * * * * 0.3 0.4 0.3 0.4 0.5 0.7 0.8 *Electric n.a. n.a. n.a. * * 0.1 0.1 0.1 0.1 0.1 0.1 0.1 4.2Fossil fuels 0.3 0.3 0.4 0.4 0.2 0.3 0.5 0.4 0.4 0.5 0.6 0.8 3.4Sciencec * * * * * 0.3 0.4 0.4 0.4 0.5 0.5 0.6 0.1Other DOE 0.2 0.2 0.2 0.2 0.3 * * * * * * * 4.4 d
___ ___ ___ ___ ___ ___ ___ ___ ___ ___ ___ ___ ____Subtotal 1.4 1.7 1.8 1.9 1.8 2.5 2.7 2.6 2.5 3.2 3.7 4.5 28.9
Other Agenciese 0.2 0.4 0.4 0.1 0.1 0.4 0.5 0.5 0.4 0.4 0.5 0.7 6.3___ ___ ___ ___ ___ ___ ___ ___ ___ ___ ___ ___ ____Total 1.6 2.2 2.2 2.0 2.0 3.0 3.3 3.1 3.0 3.7 4.3 5.2 35.2
of the planet and its atmosphere and the analysis of the data that those satellites collect.9
International Climate Change Assistance. Money given by the U.S. government to support other nations’ efforts to reduce GHG emissions is by far the smallest compo-nent of the climate change budget. International assis-tance programs have received between $200 million and $400 million per year, representing 5 percent of the bud-get authority for climate change activities from 1998 to
9. U.S. Global Change Research Program, Our Changing Planet: The U.S. Climate Change Science Program for Fiscal Year 2010 (a report by the Global Change Research Program and the Sub-committee on Global Change Research, published as a supple-ment to the President’s Budget for Fiscal Year 2010, October 2009), pp. 134–138, http://downloads.globalchange.gov/ocp/ocp2010/ocp2010.pdf.
2009 (see Table 1). Appropriations for international assistance for climate change are divided among the U.S. Agency for International Development, the State Department, and the Department of the Treasury.
American Recovery and Reinvestment Act of 2009The enactment of ARRA substantially increased funding for climate change programs and reinforced the trend toward greater funding for technology programs. Funding available under ARRA totals $35.7 billion for activities that CBO judges are related to climate change: $35.2 bil-lion for technology programs, $0.5 billion for climate sci-ence programs, and no additional funding for interna-tional assistance. ARRA’s funding was five times the amount of the regular 2009 appropriations for climate change programs. The legislation also extended and modi-fied several climate-related tax preferences.
CBO

8 FEDERAL CLIMATE CHANGE PROGRAMS: FUNDING HISTORY AND POLICY ISSUES
CBO
Table 3.
Budget Authority for Climate Science Programs(Billions of 2009 dollars)
Sources: Congressional Budget Office based on Office of Management and Budget, Federal Climate Change Expenditures: Report to Congress (various years); and Government Accountability Office, Climate Change: Federal Reports on Climate Change Funding Should Be Clearer and More Complete, GAO-05-461 (August 2005), www.gao.gov/new.items/d05461.pdf.
Notes: Budget authority is the authority provided by law to incur financial obligations that will result in immediate or future outlays of federal government funds.
ARRA = American Recovery and Reinvestment Act of 2009; DOE = Department of Energy; DOC = Department of Commerce; NASA = National Aeronautics and Space Administration; NSF = National Science Foundation; USDA = Department of Agriculture; * = less than $50 million.
a. The amounts for 2009 exclude budget authority provided by ARRA, which was enacted on February 17, 2009.
b. Consists of the Department of Transportation, the Environmental Protection Agency, the National Institutes of Health, the Smithsonian Institution, the U.S. Agency for International Development, and the U.S. Geological Survey.
1998 1999 2000 2001 2002 2003 2004 2005 2006 2007 2008 2009 a ARRA
DOE 0.1 0.1 0.1 0.1 0.1 0.3 0.3 0.3 0.1 0.1 0.1 0.2 0.1DOC 0.1 0.1 0.1 0.1 0.1 0.1 0.1 0.1 0.3 0.2 0.3 0.4 0.1NASA 1.6 1.5 1.4 1.4 1.3 1.5 1.4 1.2 1.0 1.1 1.1 1.1 0.2NSF 0.2 0.2 0.2 0.2 0.2 0.2 0.2 0.2 0.2 0.2 0.2 0.2 0.1USDA 0.1 0.1 0.1 0.1 0.1 0.1 0.1 0.1 0.1 0.1 0.1 0.1 *Other Agenciesb 0.1 0.1 0.1 0.1 0.1 0.1 0.1 0.1 0.1 0.1 0.1 0.1 *___ ___ ___ ___ ___ ___ ___ ___ ___ ___ ___ ___ ___
Total 2.2 2.1 2.1 2.1 2.0 2.4 2.3 2.1 1.8 1.9 1.9 2.0 0.5
OMB, however, has tabulated ARRA’s climate change funding differently. It included only $25.6 billion of bud-get authority from ARRA in its tally of climate change programs.10 Most of the difference between the two esti-mates can be accounted for by the Administration’s exclu-sion of $4.0 billion in budget authority for the subsidies for DOE’s Innovative Technology Loan Guarantee Pro-gram and $4.5 billion allocated to convert facilities operated by the General Services Administration into energy-efficient “green” buildings.11 CBO believes those
10. In contrast, the Council of Economic Advisers (CEA) has esti-mated ARRA’s clean energy investments at about $90 billion. The CEA tally for investment in clean energy does not replace OMB’s climate change budget but provides a slightly different perspective on federal spending. Because CEA used broader criteria, the two estimates differ in several ways. For example, CEA’s estimate of clean energy funding includes $18 billion in transportation invest-ments that OMB did not count as part of the climate budget. In addition, CEA’s estimate of spending on clean energy includes about $30 billion for tax expenditures authorized by ARRA through 2019. CEA’s analysis of the clean energy budget also con-siders some programs included in CBO’s tally that were not included in OMB’s estimate of the climate budget. See Council of Economic Advisers, Economic Report of the President (February 2010), pp. 243–246, www.whitehouse.gov/administration/eop/cea/economic-report-of-the-President.
programs should be included in any comprehensive mea-sure of how much is being spent related to climate change.
Technology Programs Funded by ARRA. The economic stimulus legislation directed less money toward develop-ing new technology than to weatherization and conserva-tion programs and to financing the modernization of the infrastructure for producing and distributing electricity. The legislation provided $16.8 billion for DOE’s pro-grams in EERE (see Table 4). Within those programs, R&D funding amounted to $2.5 billion, Energy Effi-ciency and Conservation Block Grants received $3.2 bil-lion, $5.0 billion went to the Weatherization Assistance Program (WAP), $3.1 billion was devoted to the State Energy Program, and $2.0 billion went to grants for manufacturers of advanced batteries and battery systems, mainly for motor vehicles.
As a rule, WAP funnels most of its funds to state agencies, which combine that funding with federal funds from the
11. ARRA’s funding of the Innovative Technology Loan Guarantee Program was reduced from $6.0 billion to $4.0 billion as the result of a transfer to the Car Allowance Rebate System, commonly known as Cash for Clunkers.

FEDERAL CLIMATE CHANGE PROGRAMS: FUNDING HISTORY AND POLICY ISSUES 9
Table 4.
ARRA’s Climate Technology Programs(Budget authority in billions of dollars)
Source: Congressional Budget Office.
Notes: Budget authority is the authority provided by law to incur financial obligations that will result in immediate or future outlays of federal government funds.
ARRA = American Recovery and Reinvestment Act of 2009; R&D = research and development; DOE = Department of Energy.
a. Programs that are included in CBO’s climate change tabulation but excluded from the tabulation provided by the Office of Management and Budget.
b. Originally $6.0 billion; $2.0 billion was transferred to the Car Allowance Rebate System.
c. Programs in the Departments of Defense and Transportation, the National Aeronautics and Space Administration, and the National Science Foundation.
Energy Efficiency and Renewable EnergyR&D, including geothermal and biomass 2.5Energy Efficiency and Conservation Block Grants 3.2Weatherization Assistance Program 5.0State Energy Program 3.1Grants for manufacturing advanced batteries and
battery components 2.0Other projects 1.0____
Subtotal, Energy Efficiency and Renewable Energy 16.8
Electricity Delivery and Energy Reliability 4.2Fossil Fuels 3.4Science: Fusion, Sequestration, and Hydrogen Fuel 0.1Advanced Research Projects Agency–Energy 0.4Innovative Technology Loan Guarantee Programa 4.0 b
____Subtotal, DOE's Programs 28.9
General Services Administration"Green buildings"a 4.5Energy-efficient federal motor vehicle fleeta 0.3
Department of Labor ("Green" jobs training)a 0.5Department of Housing and Urban Development
Native American housing block grantsa 0.5Low-income housing weatherizationa 0.3
Other Programsc 0.3____Subtotal, Other Agencies' Programs 6.3
Total 35.2
2009
DOE's Programs
Other Agencies' Programs
Low Income Home Energy Assistance Program and any state funds available for such programs. The money often goes to local (typically nonprofit) weatherization organi-zations that do the work. Organizations active in the field suggest that in 2007 such funding from all sources was about $800 million, but increases before ARRA have brought the total annual funding closer to $1 billion.12 The Department of Energy announced that about $8 bil-lion (about $5 billion from WAP and about $3 billion from the State Energy Program) in ARRA funds would be provided for such activities. That amount is roughly eight times the normal annual funding for such activities.
The tally of climate technology programs funded by ARRA includes $4.2 billion for DOE’s Office of Electric-ity Delivery and Energy Reliability for climate-related activities that in 2009 had received $134 million through its annual appropriation. Some of ARRA’s funding for that office was devoted to energy programs that had been authorized but not funded in previous years. For exam-ple, the Smart Grid Investment Matching Grant Pro-gram, authorized by the Energy Independence and Secu-rity Act of 2007, received its first funding under ARRA.
The $3.4 billion provided by ARRA for technology development projects involving fossil fuels was $2.5 bil-lion more than had been appropriated in 2009. That ARRA funding included $1.5 billion for industrial car-bon capture and energy-efficiency improvement projects; $1.0 billion for unspecified fossil fuel R&D efforts; and $800 million for the Clean Coal Power Initiative, which focuses on ways to reduce carbon emissions while burn-ing coal. ARRA also provided $400 million for the Advanced Research Projects Agency–Energy, a new agency in the Department of Energy that is modeled after the Defense Advanced Research Projects Agency and that focuses on high-risk, high-payoff energy technology.
DOE also has $4.0 billion in funding under ARRA for the Innovative Technology Loan Guarantee Program. The loan guarantees previously had been authorized, but the stimulus law provided the program’s first appropria-tion and extended its authority to electricity transmission
12. See, for example, Economic Opportunity Studies, “How Many Workers Does the Weatherization Assistance Program Employ Now? What Jobs Will the Recovery Act Offer?” (Washington, D.C.: Economic Opportunity Studies, February 2009), www.opportunitystudies.org/repository/File/weatherization/WAP_Workforce_Scenarios.pdf.
CBO

10 FEDERAL CLIMATE CHANGE PROGRAMS: FUNDING HISTORY AND POLICY ISSUES
CBO
projects. According to the conference report accompany-ing the legislation, that program was expected to support more than $60 billion in loans.13
Outside of DOE, the largest appropriation provided by ARRA was $4.5 billion to support GSA’s “green building” effort to improve the energy efficiency of federal build-ings. Unless other action is taken by the Congress and the Administration to extend ARRA’s deadline, all but $550 million of the roughly $16 billion in funding for weatherization and conservation programs of DOE and GSA must be obligated by September 30, 2010; the rest must be obligated by September 30, 2011.14
Climate Science Programs Funded by ARRA. In addition to funding technology programs, ARRA provided almost $500 million for climate science programs (see Table 3). NASA received more than $200 million to accelerate development of climate satellites and increase the agency’s supercomputing capabilities. The National Science Foun-dation received about $100 million. The remainder of ARRA’s climate science funds goes to DOE and NOAA.
Tax Preferences to Encourage Reductions in Emissions of Greenhouse Gases The federal tax code contains preferences that encourage households and businesses to invest in products and proc-esses that are energy efficient or that reduce GHG emis-sions. Over the past few years, new tax incentives have been added, and taxpayers’ use of some existing incentives has increased.15 OMB estimated that such incentives in 2003 resulted in $700 million in revenue forgone by
13. See House of Representatives, “Joint Explanatory Statement of the Committee of the Conference,” Conference Report on H.R. 1, American Recovery and Reinvestment Act of 2009, (February 12, 2009), http://appropriations.house.gov/pdf/Recovery_JS_DivA.pdf.
14. An obligation, such as a signed contract, is a definite commitment that creates a liability for the government to pay for goods and services ordered or received.
15. In some years, the Administration reported current estimated amounts of revenue lost because of tax provisions; in others, proposed changes to tax provisions were reported. CBO reports amounts of revenues lost rather than proposed changes. The Joint Committee on Taxation also estimated the revenue forgone from tax preferences for energy production and conservation, some of which are designed to promote reduced emissions of greenhouse gases. See Joint Committee on Taxation, Tax Expenditures for Energy Production and Conservation, JCX-25-09R (April 21, 2009), www.jct.gov/publications.html?func=startdown&id=3554.
the Treasury. Estimates for 2009 set that amount at $2.2 billion (see Table 5).16 OMB’s estimates for 2009 did not include changes made in ARRA; estimated reve-nue losses are expected to increase when the effects of ARRA are included.
By far the largest tax preference devoted to the reduction of GHG emissions is the new technology credit for a por-tion of the cost of investment in a solar, geothermal, or other renewable-energy facility placed in service to pro-duce electricity. The size of the credit varies by year and technology. The Administration has estimated that, in 2009, $1.1 billion in lost revenue was attributable to the credit, which was designed to encourage reductions in GHG emissions from greater use of energy sources other than advanced-technology coal-fired power plants.
Estimates for tax preferences differ conceptually from and are less certain than are estimates for discretionary spend-ing programs. Budget authority for discretionary spending is set by law, although it can take several years for funds to be obligated and spent, and as noted in the discussion of ARRA, it is not certain when those events will occur. In contrast, subsidies conveyed in the form of tax preferences are decreases in tax revenues relative to what would have been collected in the absence of a par-ticular provision of the tax code. Estimates of revenue for-gone as a result of tax preferences consider the interaction of tax law and rules with economic factors and taxpayers’ propensity to make use of the preferences. Those com-plexities make the estimates of the revenue loss from tax preferences more uncertain than estimates of discretion-ary spending.
Related Federal ActionsThe various Administrations’ tabulations of climate pro-grams and tax preferences typically include programs that are designed to explain or mitigate climate change caused
16. The figures in Table 5 reflect the various Administrations’ esti-mates of the tax preferences in place at the time of each year’s tab-ulation. For example, the estimates for 2003 and 2004 were taken from the April 2006 climate change report to the Congress. See Office of Management and Budget, Federal Climate Change Expenditures: Report to Congress (April 2006), Table 7, p. 23, www.whitehouse.gov/omb/legislative/fy07_climate_change.pdf. CBO took estimates for later years from subsequent years’ climate change reports. (The 2006 estimate came from the 2007 volume, and so forth.) The estimates have not been revised to include newly available data, and there are no estimates for tax preferences before 2003.
FEDERAL CLIMATE CHANGE PROGRAMS: FUNDING HISTORY AND POLICY ISSUES 11
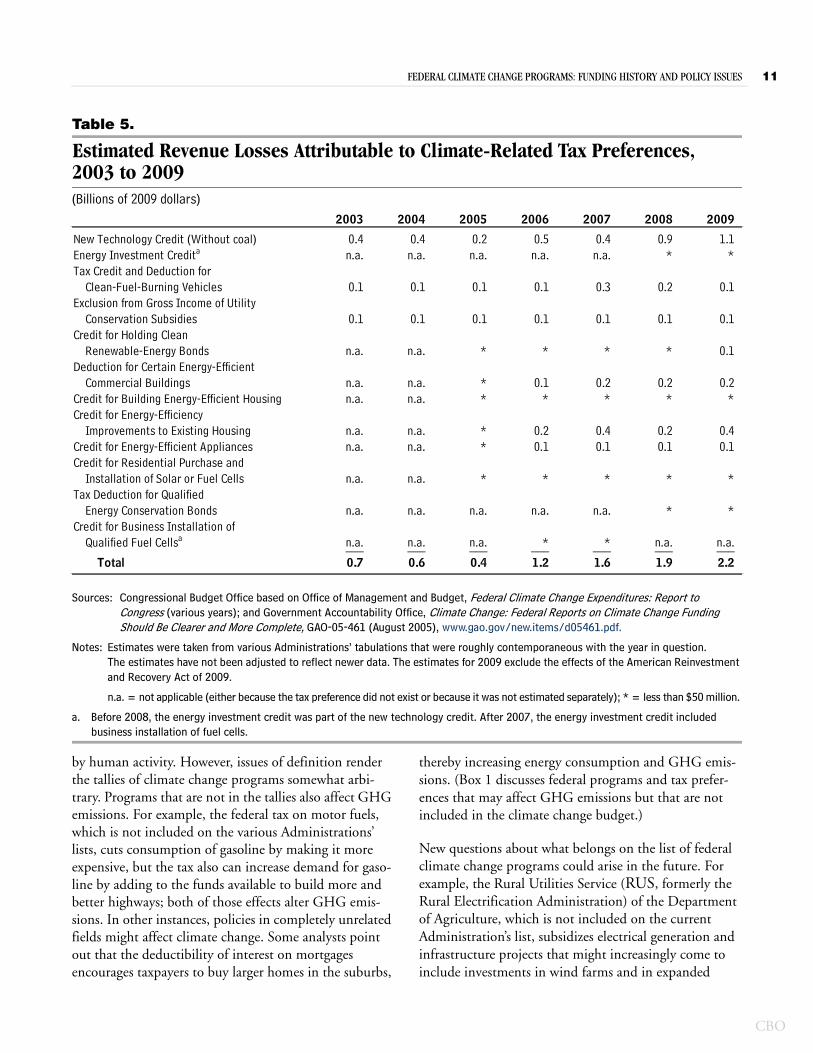
Table 5.
Estimated Revenue Losses Attributable to Climate-Related Tax Preferences, 2003 to 2009(Billions of 2009 dollars)
Sources: Congressional Budget Office based on Office of Management and Budget, Federal Climate Change Expenditures: Report to Congress (various years); and Government Accountability Office, Climate Change: Federal Reports on Climate Change Funding Should Be Clearer and More Complete, GAO-05-461 (August 2005), www.gao.gov/new.items/d05461.pdf.
Notes: Estimates were taken from various Administrations’ tabulations that were roughly contemporaneous with the year in question. The estimates have not been adjusted to reflect newer data. The estimates for 2009 exclude the effects of the American Reinvestment and Recovery Act of 2009.
n.a. = not applicable (either because the tax preference did not exist or because it was not estimated separately); * = less than $50 million.
a. Before 2008, the energy investment credit was part of the new technology credit. After 2007, the energy investment credit included business installation of fuel cells.
2003 2004 2005 2006 2007 2008 2009
New Technology Credit (Without coal) 0.4 0.4 0.2 0.5 0.4 0.9 1.1Energy Investment Credita n.a. n.a. n.a. n.a. n.a. * *Tax Credit and Deduction for
Clean-Fuel-Burning Vehicles 0.1 0.1 0.1 0.1 0.3 0.2 0.1Exclusion from Gross Income of Utility
Conservation Subsidies 0.1 0.1 0.1 0.1 0.1 0.1 0.1Credit for Holding Clean
Renewable-Energy Bonds n.a. n.a. * * * * 0.1Deduction for Certain Energy-Efficient
Commercial Buildings n.a. n.a. * 0.1 0.2 0.2 0.2Credit for Building Energy-Efficient Housing n.a. n.a. * * * * *Credit for Energy-Efficiency
Improvements to Existing Housing n.a. n.a. * 0.2 0.4 0.2 0.4Credit for Energy-Efficient Appliances n.a. n.a. * 0.1 0.1 0.1 0.1Credit for Residential Purchase and
Installation of Solar or Fuel Cells n.a. n.a. * * * * *Tax Deduction for Qualified
Energy Conservation Bonds n.a. n.a. n.a. n.a. n.a. * *Credit for Business Installation of
Qualified Fuel Cellsa n.a. n.a. n.a. * * n.a. n.a.___ ___ ___ ___ ___ ___ ___Total 0.7 0.6 0.4 1.2 1.6 1.9 2.2
by human activity. However, issues of definition render the tallies of climate change programs somewhat arbi-trary. Programs that are not in the tallies also affect GHG emissions. For example, the federal tax on motor fuels, which is not included on the various Administrations’ lists, cuts consumption of gasoline by making it more expensive, but the tax also can increase demand for gaso-line by adding to the funds available to build more and better highways; both of those effects alter GHG emis-sions. In other instances, policies in completely unrelated fields might affect climate change. Some analysts point out that the deductibility of interest on mortgages encourages taxpayers to buy larger homes in the suburbs,
thereby increasing energy consumption and GHG emis-sions. (Box 1 discusses federal programs and tax prefer-ences that may affect GHG emissions but that are not included in the climate change budget.)
New questions about what belongs on the list of federal climate change programs could arise in the future. For example, the Rural Utilities Service (RUS, formerly the Rural Electrification Administration) of the Department of Agriculture, which is not included on the current Administration’s list, subsidizes electrical generation and infrastructure projects that might increasingly come to include investments in wind farms and in expanded
CBO

12 FEDERAL CLIMATE CHANGE PROGRAMS: FUNDING HISTORY AND POLICY ISSUES
CBO
Continued
Box 1.
Other Federal Actions That Can Affect Emissions of Greenhouse Gases
In addition to the activities included in the climate change budget, the federal government intervenes in energy, transportation, and other markets through other tax preferences and spending programs in ways that could have a bearing on climate change. There is significant federal intervention in the form of taxes on fossil fuels and other transportation-related goods and services. The government also acts through other smaller direct spending programs and tax preferences. Some subsidies and other interventions in energy markets could result in increased emissions and oth-ers could have mixed effects.
The tax system’s provisions that encourage domestic production of fossil fuels are estimated to have cost the government $2.7 billion in 2009 in forgone reve-nue.1 Two provisions—one allowing deductions for producers of oil and natural gas in excess of their actual costs and the other allowing the expensing of exploration and development costs from oil and natural gas production—together cost the Treasury $1.6 billion. Other provisions were individually smaller and collectively cost the Treasury $1.1 billion (see the table at right). In addition, tax credits that producers and sellers of ethanol and other biofuels
receive are excluded from the Administration’s tabula-tions of the climate change budget.
On the spending side, federal subsidies for electricity production and distribution result in lower energy bills for consumers and thus could spur increased use of fossil fuels and greater emissions of greenhouse gases.
In some cases, consumer subsidies are direct and targeted toward particular groups, as with the Depart-ment of Health and Human Services’ Low Income Home Energy Assistance Program (LIHEAP), the government’s largest such program. In 2009, LIHEAP received $5.1 billion in budget authority to provide annual grants to states, territories, and tribal governments that fund energy assistance programs for households.2 Although the program provides some help with weatherization, its primary purpose is to subsidize the heating and cooling rates paid by the program’s low-income participants.
In other cases, the effect on consumers is less direct. Federal agencies use various tools to subsidize the production of electricity, which reduces the cost to consumers. And unlike LIHEAP’s benefits, which
1. See Joint Committee on Taxation, Estimates of Federal Tax Expenditures for Fiscal Years 2009–2013, JCS-1-10 (January 11, 2010), pp. 29–31, www.jct.gov/publications .html?func=startdown&id=3642.
2. Department of Energy, Energy Information Administration, Federal Financial Interventions and Subsidies in Energy Markets 2007, SR/CNEAF/2008-01 (April 2008), pp. 36–38, www.eia.doe.gov/oiaf/servicerpt/subsidy2/pdf/subsidy08.pdf.
transmission lines from wind farms to the electrical grid. Those future projects could be designed to mitigate cli-mate change, and decisions will be made about whether to include such subsidies in the climate change tally.
Rationales for Funding Federal Climate Change ProgramsGlobal climate change poses one of the nation’s most sig-nificant long-term policy challenges. Human activities are producing increasingly large quantities of greenhouse
gases, especially carbon dioxide. A strong consensus has developed in the expert community that, if allowed to continue unabated, the accumulation of greenhouse gases in the atmosphere will have extensive, highly uncertain, but potentially serious and costly consequences for regional climates around the world. Those expected and possible harmful effects suggest the potential for social benefits that could result from policy actions aimed at reducing the extent of climate change.
For the programs currently included in the climate change budget, analysts recognize at least four possible

FEDERAL CLIMATE CHANGE PROGRAMS: FUNDING HISTORY AND POLICY ISSUES 13
Box 1. Continued
Other Federal Actions That Can Affect Emissions of Greenhouse Gases
Estimated Revenue Loss fromTax Preferences that Reduce the
Costs of Fossil Fuels
(Billions of dollars)
Source: Joint Committee on Taxation, Estimates of Tax Expenditures for Fiscal Years 2009–2013, pp. 29–31.
Note: * = less than $50 million.
target individual households, the benefits from fed-eral subsidies for electricity go to all customers in a service area. Those benefits arise either from the low interest rates charged by the Rural Utilities Service to the utilities that borrow from it or from the low inter-est rates that power marketing administrations pay for capital. The Energy Information Administration estimated that such interest rate differentials were worth more than $700 million to utilities in 2007.3
Some policies have mixed effects on emissions. Although consumption of fossil fuels is discouraged through taxes that increase the prices consumers pay for gasoline and diesel fuel, the receipts mostly go to the Highway Trust Fund, which pays for construc-tion of more and better highways that encourage fuel consumption. Gasoline, diesel, and related excise taxes accounted for about $35 billion of the $48 bil-lion in such excise taxes collected in 2009, the Con-gressional Budget Office estimates. Federal levies on airline tickets and other aviation-related activities generated another $10 billion for the Airport and Airway Trust Fund in 2009. Those levies have effects that are similar to those of the gasoline tax. The excise tax raises the cost of airline tickets, thus discouraging airline use, but a portion of the revenue is used to fund improvements in airports that would encourage an increase in air travel, thus adding to emissions of greenhouse gases.
Expensing of Exploration and DevelopmentOil and gas 0.3Other fuels *
Excess of Percentage over Cost DepletionOil and gas 1.3Other fuels 0.2
Tax CreditsEnhanced oil recovery *Production of fuel from nonconventional sources 0.1
Small Refiners' Credit and Deduction *Expensing of Property Used in Refining Liquid Fuels 0.5Amortization of Geological Costs for Oil and Gas
Exploration 0.1Coal Production Credits *15-Year Depreciation Recovery for Natural Gas
Distribution Line 0.17-Year Depreciation Recovery for Natural Gas
Gathering Line *___Total 2.7
2009
3. Calculated from Department of Energy, Federal Financial Interventions and Subsidies in Energy Markets, pp. 101–104.
ways in which, without federal funding, market forces might generate less of certain activities than would arise from balancing social benefits and costs. Such so-called market failures might occur when the following conditions apply:
B The social benefits of scientific and technical knowledge exceed private benefits,
B Prices for energy and for carbon emission do not fully reflect environmental and social costs,
B Consumers’ responses to prices appear to have been muted by market structures and limited information, and
B Investors’ incentives to modernize energy infra-structure are weakened by government regulation and industry structure.
Although some or all of those conceptual justifications could apply to a variety of policies, they do not indicate that any particular federal program should be under-taken. The benefits of specific programs might not justify
CBO

14 FEDERAL CLIMATE CHANGE PROGRAMS: FUNDING HISTORY AND POLICY ISSUES
CBO
their costs, even if there is a justification for federal funding in that general area. Furthermore, some analysts question the ability of federal agencies to implement pro-grams in a timely and cost-effective manner.
Social Benefits of Knowledge Exceed Private BenefitsOne rationale for federal support of climate science and technology programs depends on the inability of develop-ers of technical and scientific knowledge to capture all of the benefits from their discoveries and inventions. The innovations that flow from investments in R&D are sometimes imitated by competitors or by businesses in other markets at only a small cost, reducing the innova-tors’ potential profits. Although such diffusion of new technology benefits the economy overall, the benefits to society as a whole are not accounted for in the innovators’ profit calculations and investment decisions. As a conse-quence, private investment in R&D, particularly in basic research, tends to be less than could be most beneficial for the economy overall.17
The pure scientific knowledge produced by climate sci-ence and monitoring programs would also be under-supplied were it not for government support because, like national defense, it is difficult or very costly to exclude people from the benefits provided by the knowledge cre-ated by those programs. Some of the benefits of this type of public good might be supplied by private markets. Yet the decisions made by producers responding to market signals about how much to supply would not take account of the benefits provided to all of those consumers who did not pay for, but benefited from, the knowledge once it was produced. Government is uniquely capable of adding up those benefits and, through taxation and pub-lic spending, of supplying the socially desirable amount of support for climate science and monitoring programs.
Social Costs of Burning Fossil Fuels Are Not Fully Reflected in Market PricesFederal support for the development and deployment of energy-saving technology might be justified because cur-rent prices for fossil fuels do not reflect the damage to the environment and the economy caused by their use. Spe-cifically, current prices do not recognize the future costs
17. Energy markets are not unique in this respect. In most areas, the private incentives to perform R&D are believed to fall short of social incentives because of the inability of innovators to reap all the benefits of their investments. See Congressional Budget Office, Federal Support for Research and Development (June 2007).
that climate change could impose.18 Federal programs can be viewed as compensating for the missing incentives that the market might have provided if market prices fully reflected the social costs of burning fossil fuels. That argument might justify federal subsidies for weatheriza-tion, for the generation of energy from renewable sources, and for establishing the infrastructure necessary to deliver electricity from sources that do not emit greenhouse gases.
Future changes in the pricing of energy could affect the applicability of that rationale. The Congress is currently considering policies, such as a cap-and-trade program, that would attempt to ensure that the prices consumers pay for energy reflect environmental costs.19 If imple-mented, for example, a cap-and-trade policy would make it more costly for utilities to burn coal and other fossil fuels to generate electricity. Correspondingly, prices to consumers and businesses for electricity produced from fossil fuels would go up, thereby reducing demand and lowering GHG emissions. The reduction in demand also would provide a stronger incentive for utilities to cut their investments in and use of coal. In addition, if the cost of carbon emissions were fully incorporated into the prices of goods and services produced with electricity from coal-fired plants, demand for energy-efficient goods and services would rise as they became relatively less expensive. Under those circumstances, private investment in R&D to reduce both energy use and GHG emissions also would be likely to increase. Those private invest-ments in R&D in response to the adoption of new energy pricing policies could make federal funding duplicative of private actions in many areas.
Consumers Have Muted Responses to Price SignalsSome analysts believe that even when prices in energy markets direct consumers toward investments in energy efficiency that would pay off, some consumers will not act as simple economic theory posits they will. Therefore, additional government support for adopting energy- efficient technologies or weatherization could be justified to compensate for the muted consumer response to the price signals originating in energy markets.
18. Congressional Budget Office, The Economics of Climate Change: A Primer (April 2003), pp. 23–25.
19. Cap-and-trade proposals are included in the American Clean Energy and Security Act of 2009 (H.R. 2454) and in the Clean Energy Jobs and American Power Act (S. 1733).
FEDERAL CLIMATE CHANGE PROGRAMS: FUNDING HISTORY AND POLICY ISSUES 15
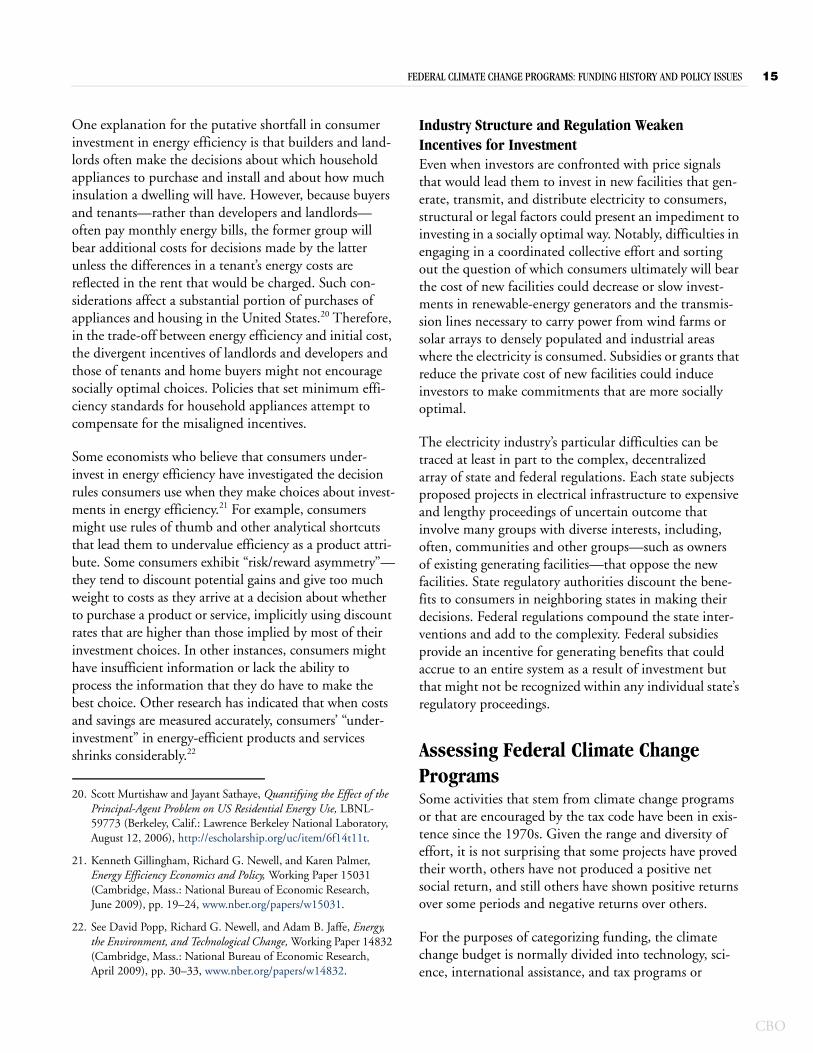
One explanation for the putative shortfall in consumer investment in energy efficiency is that builders and land-lords often make the decisions about which household appliances to purchase and install and about how much insulation a dwelling will have. However, because buyers and tenants—rather than developers and landlords—often pay monthly energy bills, the former group will bear additional costs for decisions made by the latter unless the differences in a tenant’s energy costs are reflected in the rent that would be charged. Such con-siderations affect a substantial portion of purchases of appliances and housing in the United States.20 Therefore, in the trade-off between energy efficiency and initial cost, the divergent incentives of landlords and developers and those of tenants and home buyers might not encourage socially optimal choices. Policies that set minimum effi-ciency standards for household appliances attempt to compensate for the misaligned incentives.
Some economists who believe that consumers under- invest in energy efficiency have investigated the decision rules consumers use when they make choices about invest-ments in energy efficiency.21 For example, consumers might use rules of thumb and other analytical shortcuts that lead them to undervalue efficiency as a product attri-bute. Some consumers exhibit “risk/reward asymmetry”—they tend to discount potential gains and give too much weight to costs as they arrive at a decision about whether to purchase a product or service, implicitly using discount rates that are higher than those implied by most of their investment choices. In other instances, consumers might have insufficient information or lack the ability to process the information that they do have to make the best choice. Other research has indicated that when costs and savings are measured accurately, consumers’ “under-investment” in energy-efficient products and services shrinks considerably.22
20. Scott Murtishaw and Jayant Sathaye, Quantifying the Effect of the Principal-Agent Problem on US Residential Energy Use, LBNL-59773 (Berkeley, Calif.: Lawrence Berkeley National Laboratory, August 12, 2006), http://escholarship.org/uc/item/6f14t11t.
21. Kenneth Gillingham, Richard G. Newell, and Karen Palmer, Energy Efficiency Economics and Policy, Working Paper 15031 (Cambridge, Mass.: National Bureau of Economic Research, June 2009), pp. 19–24, www.nber.org/papers/w15031.
22. See David Popp, Richard G. Newell, and Adam B. Jaffe, Energy, the Environment, and Technological Change, Working Paper 14832 (Cambridge, Mass.: National Bureau of Economic Research, April 2009), pp. 30–33, www.nber.org/papers/w14832.
Industry Structure and Regulation Weaken Incentives for InvestmentEven when investors are confronted with price signals that would lead them to invest in new facilities that gen-erate, transmit, and distribute electricity to consumers, structural or legal factors could present an impediment to investing in a socially optimal way. Notably, difficulties in engaging in a coordinated collective effort and sorting out the question of which consumers ultimately will bear the cost of new facilities could decrease or slow invest-ments in renewable-energy generators and the transmis-sion lines necessary to carry power from wind farms or solar arrays to densely populated and industrial areas where the electricity is consumed. Subsidies or grants that reduce the private cost of new facilities could induce investors to make commitments that are more socially optimal.
The electricity industry’s particular difficulties can be traced at least in part to the complex, decentralized array of state and federal regulations. Each state subjects proposed projects in electrical infrastructure to expensive and lengthy proceedings of uncertain outcome that involve many groups with diverse interests, including, often, communities and other groups—such as owners of existing generating facilities—that oppose the new facilities. State regulatory authorities discount the bene-fits to consumers in neighboring states in making their decisions. Federal regulations compound the state inter-ventions and add to the complexity. Federal subsidies provide an incentive for generating benefits that could accrue to an entire system as a result of investment but that might not be recognized within any individual state’s regulatory proceedings.
Assessing Federal Climate Change Programs Some activities that stem from climate change programs or that are encouraged by the tax code have been in exis-tence since the 1970s. Given the range and diversity of effort, it is not surprising that some projects have proved their worth, others have not produced a positive net social return, and still others have shown positive returns over some periods and negative returns over others.
For the purposes of categorizing funding, the climate change budget is normally divided into technology, sci-ence, international assistance, and tax programs or
CBO
16 FEDERAL CLIMATE CHANGE PROGRAMS: FUNDING HISTORY AND POLICY ISSUES
CBO
preferences. The discussion below focuses on technology programs and tax preferences. In examining the technol-ogy programs, this study focuses on categories that cor-respond to areas in which there has been significant recent spending: R&D, technology demonstration, energy efficiency, and investments in infrastructure.
Federal Research and Development in Climate Change Over the past 30 years, federal energy R&D has often, but not always, yielded benefits greater than its costs. Despite the technical success of a large proportion of government-sponsored R&D focused on renewable sources of energy, such sources today constitute just a small part of the market, mainly because the prices of conventional sources of energy do not reflect the social cost of their carbon emissions.
Because R&D in almost any field can be expected to pro-vide benefits slowly and cumulatively, it works best when funding is stable and available over the long term and when there is a steady supply of researchers to conduct the work. Yet federal funding of energy R&D shows a history of ebb and flow in appropriations. After nearly two decades of decline, R&D funding has increased in the past decade.
Returns on Federal Energy R&D. Different types of energy R&D have produced very different returns. In 2001, a panel of the National Research Council estimated that, between 1978 and 2000, the net economic benefit from some of DOE’s energy-efficiency R&D programs was roughly quadruple the amount of funds devoted to those projects (measured in constant dollars).23 The bene-fit from R&D in fossil fuels was much less; in fact, in the panel’s estimation, for portions of the same 22-year period, the benefit was much smaller than the cost. From 1978 to 1986, the benefit of fossil fuel R&D was just 57 percent of the cost. Between 1986 and 2000, the benefit increased, but at 1.6 to 1, the benefit-to-cost ratio was much lower than the ratio for spending on energy-efficiency research. The spending on energy-efficiency research was less concentrated in specific large projects and technology demonstrations than was fossil
23. National Research Council, Energy Research at DOE: Was It Worth It? Energy Efficiency and Fossil Energy Research, 1978 to 2000 (Washington, D.C.: National Academy Press, 2001), p. 6, www.nap.edu/catalog.php?record_id=10165.
fuel R&D, which encompassed numerous technology demonstration projects.
In its calculations of net economic benefit, the panel included the increased value of economically recoverable natural resources, the reduced cost of finding and extract-ing natural resources, the reduced cost of energy services, the increase in workers’ productivity, and the increased rights to market the resulting intellectual property. Also included in the calculation of a project’s benefit was reve-nue from future sales of technology developed under DOE’s sponsorship, but only for five years ahead because of the assumption that DOE’s R&D funding had acceler-ated the development of existing technology instead of generating innovations that would not have occurred otherwise.
The panel also netted production cost from the calcula-tions and it excluded effects on the economy as a whole, increased tax revenues, or effects on regional growth. Although the analytical framework included the environ-mental and national security benefits of DOE’s R&D, the panel noted that for the most part those benefits could be treated only qualitatively. Similarly, the panel assigned no value to knowledge for its own sake or to the option to use such discoveries in the future. The panel noted that the estimates were imprecise because of technological and economic uncertainties, the many assumptions necessary to its calculations, and the fact that in some areas only qualitative assessments were possible.24
More support for the usefulness of federally sponsored R&D is found in the evidence that energy technology patents resulting from government-sponsored projects are cited more frequently than are patents from other sources.25 Equally important is evidence that transferring knowledge from the government to private industry pro-duces valuable research results; subsequent private patents that derive from those government patents also are cited more frequently. Such widespread use of federal research results is consistent with observations that federally spon-sored R&D is often the foundation of the development of new energy technology.
Federal R&D and Energy Prices. Despite the apparent successes, however, the energy technology produced
24. Ibid., pp. 86–94.
25. Popp, Newell, and Jaffe, Energy, the Environment, and Technological Change, p. 22.

FEDERAL CLIMATE CHANGE PROGRAMS: FUNDING HISTORY AND POLICY ISSUES 17
under federal auspices has, according to one analysis, “failed to emerge as a prominent component of the U.S. energy infrastructure.”26 That analysis of studies and fore-casts of the use of renewable energy from the 1970s and 1980s demonstrated that renewable-energy technologies, which were a focus of federal R&D, largely failed to match projections for their use during the 1980s and 1990s. Except for photovoltaic electric cells, the prices of those technologies declined as predicted by the forecasts and projections. (The prices for photovoltaics declined more slowly than predicted.) However, the use of many renewable-energy devices did not increase as predicted, largely because prices for fossil fuels also declined during the period.
Thus, federal investments in R&D yielded major tech-nological innovations and spurred price decreases in alternative-energy technologies, but as long as consumers did not bear the full social cost of fossil fuel consump-tion, alternative-energy sources could not make large inroads into their target markets. In that sense, climate change R&D is different from R&D devoted to produc-ing goods that are less expensive or better in other private respects than the products they replace. Climate change R&D is devoted largely to developing products that could be more expensive than existing products. Federal research addresses the nation’s underinvestment in R&D, but it does not address the fact that the fossil fuel prices in private markets do not reflect the social cost of GHG emissions.27
Instability in Federal R&D Funding. Technology develop-ment takes time, often decades, to provide benefits. Indi-vidual researchers who invest their careers in work on spe-cific technologies or research topics that might not transfer easily to other areas might be reluctant to pursue work in an area for which the prospect of long-term funding is uncertain. And large fluctuations in funding can drive researchers out of a field. Climate technology funding increased during the period addressed by this study, 1998 to 2009. However, adjusted for inflation,
26. James McVeigh and others, Winner, Loser, or Innocent Victim? Has Renewable Energy Performed as Expected? RFF Discussion Paper 99-28 (Washington, D.C.: Resources for the Future, June 1999), p. ii, www.rff.org/RFF/Documents/RFF-DP-99-28.pdf.
27. Congressional Budget Office, Evaluating the Role of Prices and R&D in Reducing Carbon Dioxide Emissions (September 2006). See also Carolyn Fischer and Richard G. Newell, “Environmental and Technology Policies for Climate Mitigation,” Journal of Environmental Economics and Management, vol. 55, no. 2 (March 2008), pp. 142–162.
federal spending on energy research declined (in constant dollars) by more than three-quarters in the period just before, from 1978 to 1998, and the decline affected all major areas of DOE’s work: nuclear energy, fossil fuels, and renewable sources of energy.28 Without the prospect of sustained funding, many researchers left the field.29 That fluctuation in funding was not conducive to sus-taining a research effort, which requires the kind of long-term investment in and by scientific talent that has brought benefits to other areas of federal R&D, including health and agriculture.30
The types of projects undertaken by research scientists change over time; even scientific disciplines that have experienced constant or increasing funding change their focus as knowledge progresses. Because of that shifting of content, federal funding for the same energy research from the 1970s onward would not have been likely to provide substantial returns. Nevertheless, progress in a field depends to a considerable extent on the number of engineers and scientists continually working on problems in that field, which is most likely not encouraged by ebbs and flows in funding.
Technology Demonstration Projects The National Research Council reported that from 1978 to 1985, when DOE’s fossil fuel energy program was
28. Statement of Jim Wells, Director, Natural Resources and Environ-ment, Government Accountability Office, before the Subcommit-tee on Energy and Water Development of the House Committee on Appropriations, Advanced Energy Technologies: Key Challenges to Their Development and Deployment, GAO-07-550T (February 28, 2007), p. 2, www.gao.gov/new.items/d07550t.pdf. For a more detailed breakdown by DOE program, see Kelly Sims Gallagher and others, “DOE Budget Authority for Energy, Research, Devel-opment, and Demonstration Database,” in Ending the Energy Stalemate: A Bipartisan Strategy to Meet America’s Energy Challenge (Washington, D.C.: National Commission on Energy Policy, December 2004), Appendix to Chapter 6, http://belfercenter.ksg.harvard.edu/files/DOE_EnergyTechSpending1978-FY10R_June22_2.xls.
29. Department of Energy, Scientist and Engineer Energy Employment Expected to Decline During 1994–2000 as DOE Funding Is Reduced, Manpower Assessment Brief 29 (June 1995), www.osti.gov/bridge/servlets/purl/88476-5Hnb4c/webviewable/88476.pdf.
30. For more discussion of the time dimension in R&D payoffs, see Iain M. Cockburn, Scott Stern, and Jack Zausner, “Finding the Endless Frontier: Lessons from the Life Sciences Innovation System for Energy R&D,” in Rebecca Henderson and Richard Newell, eds., Accelerating Innovation in Energy: Insights from Multiple Sectors (Chicago: University of Chicago Press, in press), www.nber.org/chapters/c11749.pdf, especially pp. 37–38.
CBO

18 FEDERAL CLIMATE CHANGE PROGRAMS: FUNDING HISTORY AND POLICY ISSUES
CBO
most heavily dominated by technology demonstration projects, federal spending for the fossil fuel energy programs substantially exceeded the benefits that they produced. The negative results were attributed partly to the pressure for rapid results under which DOE operated during the energy crises of the 1970s and early 1980s. The panel concluded, “In retrospect, technology develop-ment in direct coal liquefaction and other synthetic fuels programs during the 1970s and early 1980s was not handled well by the government or industry. Technolo-gies were targeted for major demonstration expenditures before they were well understood.”31
Complicating that problem, DOE had not fully devel-oped its cost-sharing procedures.32 In many cases, the projects’ industry partners committed no funds. In oth-ers, the contracting organizations were not committed to commercializing the technology once the project was completed, or industry funding would be provided only after the risks had been reduced. A major goal for large technology demonstrations is to show private investors that a project has a good possibility of meeting targets for costs and schedules. Some observers assert that DOE’s lack of consistent oversight diminished confidence in the projects during that period.
Future Large-Scale Demonstrations. DOE is planning large-scale technology demonstration projects that would generate electricity with relatively low carbon emissions. They will differ from older projects involving fossil fuels, which often sought to manufacture liquid fuel from coal and shale. Among the planned demonstrations aimed at reducing GHG emissions are projects that will burn coal to produce electricity but store the resulting carbon dioxide deep underground. Advocates promote federal support for those and other large-scale demonstrations because fossil fuel prices do not currently justify the risky investments of bringing new technology to market. DOE’s participation in such projects raises at least one question for the future: Is the department’s participation likely to increase a project’s chances for success?
Despite the changes in DOE’s management culture over the past three decades—strengthening project manage-ment policies and guidance, developing consistent and objective performance information about ongoing proj-
31. National Research Council, Energy Research at DOE: Was It Worth It? p. 166.
32. Ibid., pp. 46–47.
ects, and improving the quality of federal oversight of contractors and projects—many analysts believe that the department still cannot effectively manage large projects. The Government Accountability Office has long been critical of DOE’s project management, pointing to inadequate oversight of contractors and to projects that failed to meet expectations for costs or schedules. Despite efforts at reform, as recently as 2007, GAO concluded that DOE’s performance suffered from inconsistent application of the new management processes and consequently had not improved substantially.33
Furthermore, DOE could find itself subject to significant time constraints in undertaking technology demonstra-tion projects in the area of climate change. ARRA requires most of its funds to be obligated before Septem-ber 30, 2010. Language in other measures (including H.R. 2454) reflects a similar commitment to move tech-nology demonstration projects rapidly.
Some proposals now before the Congress would place the responsibility for major projects involving the demonstra-tion of energy technology in the private sector. For exam-ple, H.R. 2454 and S. 1733 would establish a research cooperative, the Carbon Storage Research Corporation, as part of the Electric Power Research Institute.34 If approved through an industry referendum and by state utility regulatory boards, the new corporation would assess fees on utilities that distribute power derived from fossil fuels to fund the development and demonstration of technology that would capture and store underground the carbon dioxide produced by fossil fuel combustion at power plants. The corporation would be authorized to raise and spend about $1 billion each year over the next decade. The funds would not be spent on pilot projects but on commercial-scale demonstrations. Whether a new industry consortium created by federal legislation, even if composed of corporate representatives, could avoid the pressures and inefficiencies that have dogged DOE’s past large demonstration projects is unclear. There is no previ-ous experience with providing such a large amount of funding for government–industry research consortia.
33. Government Accountability Office, Department of Energy: Consistent Application of Requirements Needed to Improve Project Management, GAO-07-518 (May 2007), p. 1, www.gao.gov/new.items/d07518.pdf.
34. For CBO’s analysis of the House bill, see Congressional Budget Office, cost estimate for H.R. 2454, the American Clean Energy and Security Act of 2009 (June 5, 2009).

FEDERAL CLIMATE CHANGE PROGRAMS: FUNDING HISTORY AND POLICY ISSUES 19
Federal Involvement in Demonstration Projects. The closer to commercialization a technology gets, the more likely that a developer can capture most of the benefits of additional spending on technology development. The gap between private and public benefits from investing in technology is likely to be substantially smaller at the point of demonstration than it is in earlier phases of technology development. Generally, as products near commercializa-tion, more effort is directed toward design and refinement of prototypes, for example. And because resulting improvements are more likely to be specific to the prod-uct, they can be less likely to transfer to another product or market. Because the technology developer can capture more benefit from investments near commercialization, many economists argue, government support late in the process of technology development is inappropriate, espe-cially given the inefficiencies and distortions that govern-ment participation can engender (including the unwilling-ness to terminate large, expensive projects that are not performing well).35
A counterargument, however, holds that government involvement is needed later in the R&D process as tech-nology progresses toward the marketplace.36 Federal agen-cies and, to a lesser extent, universities, foundations, and other funders are prepared to underwrite the earlier labo-ratory work to develop and prove a research concept. Venture capitalists and other investors often are more willing to fund a start-up once a research concept has been turned into a commercial prototype.37 But, the argument goes, there is a gap between those two sets of well-functioning institutions. Because the process of turning a research concept into a prototype is not well supported by existing institutions, the government has a role in technology demonstrations and other aspects of commercialization, even acting as a source of venture capital for some projects.38
35. Kenneth J. Arrow and others, A Statement on the Appropriate Role for Research and Development in Climate Policy, Related Publica-tion 08-12 (Washington, D.C.: AEI Center for Regulatory and Market Studies, December 2008), http://papers.ssrn.com/sol3/papers.cfm?abstract_id=1313827.
36. Lewis Branscomb and Philip Auerswald, Taking Technical Risks: How Innovators, Managers, and Investors Manage High-Tech Innovations (Cambridge, Mass.: MIT Press, 2001), pp. 11–12.
37. Ibid., pp. 100–102. See also National Research Council, An Assessment of the SBIR Program (Washington, D.C.: National Academies Press, 2008), pp. 29–32.
Nevertheless, the Department of Energy might not have a comparative advantage over other institutions in bridging such financial or institutional gaps. If commercialization is a large and expensive undertaking, the funding proc-ess is likely to introduce political and other pressures that could distort all stages of the effort from site selection through completion of the demonstration.39 Very often, promising technology does not come to fruition, and the process of screening for commercial success is a challenge. The United States has a well-developed venture capital industry, and although there have been cases of federal agencies’ substituting for venture capitalists, the evidence of success is mixed.40 Empirical evidence of a funding gap is not well developed; studies of the venture capital pro-cess have not consistently identified one stage in the process of commercialization at which raising capital is significantly more difficult than at any other.41
Programs to Foster Energy Efficiency Recent federal weatherization programs have exhibited favorable benefit-to-cost ratios. Beginning in the 1990s, advanced energy audits for housing and commercial properties produced weatherization plans particular to a building, instead of relying on generic lists of recom-mended actions. By customizing the improvements to the building, those efforts produced better results.
Past Federal Projects for Weatherization. In 2005, Oak Ridge National Laboratory (ORNL) published a comprehensive review of several years’ worth of data from gas-heated homes in 18 states and the District of Colum-bia that had been weatherized as part of DOE’s
38. L.M. Murphy and P.L. Edwards, Bridging the Valley of Death: Transitioning from Public to Private Sector Financing, NREL/MP-720-34036 (Golden, Colo.: National Renewable Energy Laboratory, May 2003), pp. 11–34, www.cleanenergystates.org/CaseStudies/NREL-Bridging_the_Valley_of_Death.pdf.
39. Linda Cohen and Roger Noll, The Technology Pork Barrel (Wash-ington, D.C.: Brookings Institution Press, 1991), pp. 53–67.
40. Josh Lerner, The Government as Venture Capitalist: The Long-Run Impact of the SBIR Program, Working Paper 5753 (Cambridge, Mass.: National Bureau of Economic Research, September 1996), www.nber.org/papers/w5753.pdf.
41. Josh Lerner, Boulevard of Broken Dreams: Why Public Efforts to Boost Entrepreneurship and Venture Capital Have Failed—And What to Do About It (Princeton, N.J.: Princeton University Press, 2009).
CBO

20 FEDERAL CLIMATE CHANGE PROGRAMS: FUNDING HISTORY AND POLICY ISSUES
CBO
Weatherization Assistance Program.42 ORNL estimated that consumption of natural gas declined by 23 percent per dwelling, on average. Spread out and discounted over 20 years, the total saved per building was about $3,900 (in 2003 dollars). WAP spent about $2,900 (in 2003 dol-lars) to weatherize a home, for a benefit-to-cost ratio of 1.3 to 1. The report noted that actual ratios were likely to be larger “because the expenditures reported in the state-level studies often included the cost of installing measures designed to reduce base load electricity consumption while the savings numbers were for natural gas only.”43 ORNL also considered other benefits of the program, among them the reduced occurrence of house fires, the decreased incidence of some illnesses, and the lower water and sewer bills attributable to use of low-flow plumbing fixtures. Such nonemployment, nonenergy benefits were about $2,400 per dwelling (also calculated over 20 years in 2003 dollars).44 Combining the energy benefits with the nonemployment, nonenergy benefits resulted in an aggregate benefit-to-cost ratio of 2.2 to 1—that is, each dollar spent by WAP produced a total of $2.20 in combined benefits.
The energy savings that ORNL reported were much higher than had been reported for earlier WAP projects. The difference appears to be attributable to changes in installation practices, better assessment techniques, and use of advanced materials. Since the adoption of new methods and materials, the energy savings produced by the program have remained roughly constant.45
42. Martin Schweitzer, Estimating the National Effects of the U.S. Department of Energy’s Weatherization Assistance Program with State-Level Data: A Metaevaluation Using Studies from 1993 to 2005, ORNL/CON-493 (Oak Ridge, Tenn.: Oak Ridge National Laboratory, September 2005), http://weatherization.ornl.gov/pdf/CON-493FINAL10-10-05.pdf.
43. Ibid., p. 13.
44. CBO calculation. For the calculation of such benefits, see Martin Schweitzer and Bruce Tonn, Nonenergy Benefits from the Weatherization Assistance Program: A Summary of Findings from the Recent Literature, ORNL/CON-484 (Oak Ridge, Tenn.: Oak Ridge National Laboratory, April 2002), pp. 22–23, http://weatherization.ornl.gov/download_files/Con-484-april02.pdf. The conversion to 2003 dollars was done by the method discussed by Schweitzer, Estimating the National Effects of the U.S. Department of Energy’s Weatherization Assistance Program, p. 13. CBO also adjusted the calculations to remove a double-counting of the energy savings, which would be incorporated into the value of the house.
45. See Schweitzer, Estimating the National Effects of the U.S. Department of Energy’s Weatherization Assistance Program, p. 16.
Spending of ARRA’s Funds for Weatherization and Other Efficiency Programs. When ARRA was enacted, ques-tions were raised about the ability of DOE and GSA to obligate their ARRA funds for weatherization and conser-vation effectively, given the time limits specified in ARRA. Nevertheless, by mid-February 2010 DOE had obligated 85 percent of the $16.8 billion in funding it received for EERE programs, but expenditures have pro-ceeded more slowly. WAP, for example, had awarded $4.7 billion of its $5.0 billion ARRA appropriation to states and territories (some funds were reserved for administration), but only $368 million (8 percent) had actually been spent.46
Some analysts have suggested several reasons for the slow pace of spending. First, DOE might be experiencing administrative difficulties in meeting ARRA’s require-ments concerning historic preservation and regulations that were new to the weatherization program, notably a rule that workers on federally funded or assisted con-struction projects be paid according to locally prevailing wage rates.
Another factor is the effect of the recession on state gov-ernments. Constraints in state budgets have hampered the ability of those governments to spend weatherization grants quickly. Some states have imposed hiring freezes that prevent them from employing enough project offi-cers to oversee a larger number of weatherization grants and contracts. In some cases, progress has slowed because state employees have been furloughed to make up budget shortfalls. Finally, new federal regulations have increased requirements for training state employees at a time when governments cannot afford to fund the additional train-ing. The severity of many of those problems can be traced to the difficulty of starting up new programs or sharply altering existing projects. DOE’s auditors expressed con-cern “that the understandable desire to spend the Weath-erization funds on a catch-up basis may lead to an envi-ronment conducive to wasteful, inefficient, and, perhaps, even abusive practices.”47
A shortage of trained energy auditors could impede effi-cient use of the stimulus funds. Although there is excess
46. See Department of Energy, Special Report: Progress in Implementing the Department of Energy’s Weatherization Assistance Program Under the American Recovery and Reinvestment Act, OAS-RA-10-04 (February 2010), Appendix I, www.ig.energy.gov/documents/OAS-RA-10-04.pdf.
47. Ibid., p. 5.

FEDERAL CLIMATE CHANGE PROGRAMS: FUNDING HISTORY AND POLICY ISSUES 21
capacity in the market for construction workers overall, it takes six to eight months to train an energy auditor. About 1,000 energy auditors were available to work in the field when ARRA was enacted; one auditor can sup-port three weatherization crews, on average, and capacity exists to train another 600 to 700 auditors per year. The capacity for training auditors could improve, however. ARRA provided $500 million to the Department of Labor to fund training of workers in “green” careers.
Unlike WAP, which had little experience with administer-ing federal pay requirements, GSA has a lengthy back-ground in projects whose workers must be compensated at locally prevailing wages. ARRA’s rules concerning pay rates thus are not the likely cause of any delay in GSA’s obligation of funds under that law.48 By the end of December 2009, GSA reported, it had obligated 37 per-cent of its total appropriation for retrofitting government buildings. It had spent just 1.5 percent of that money, however, by that time. That outcome is not atypical; expenditures for modernizing large office buildings often lag significantly behind the signing of contracts. As of the middle of February 2010, 2.6 percent of the program’s total appropriation had been spent.
Financing for Electricity Infrastructure Stimulus funding includes $4.2 billion for programs to modernize electricity distribution networks and other climate-related electrical infrastructure, primarily through matching grants, and $4.0 billion for the Inno-vative Technology Loan Guarantee Program, including transmission facilities.49 Providing such assistance is con-sistent with a belief that the complicated multistate regu-latory structure has slowed investments in facilities to generate, transmit, and distribute electricity from sources that do not emit greenhouse gases.50
Federal involvement in the financing of electricity infra-structure through ARRA raises opposing short- and long-term concerns. For the short term, it is challenging to
48. See Government Accountability Office, Recovery Act: Project Selection and Starts Are Influenced by Certain Federal Requirements and Other Factors, GAO-10-383 (February 10, 2010), p. 24, www.gao.gov/new.items/d10383.pdf.
49. Although the loan guarantees are not restricted to electricity-generating or transmission facilities, large commitments for such facilities have been made.
50. Peter Behr, “States and Regions Block Federal ‘Superhighway’ for Solar and Wind Power,” ClimateWire, December 15, 2009, www.eenews.net/climatewire/2009/12/15/5.
ramp up spending as rapidly as ARRA’s timetables require. Over the longer term, cutting off established fed-eral subsidy programs for electricity infrastructure, once the purpose of the subsidies is fulfilled, can be difficult.
Short-Term Schedules. The Electricity Delivery and Energy Reliability matching grant program funded by ARRA must obligate all funds by September 30, 2010. As of mid-February 2010, DOE had obligated $2.9 billion, about 65 percent of that program’s total ARRA funding.
DOE faces another timing challenge with regard to the Innovative Technology Loan Guarantee Program. The law specifies that funding for loan guarantees is to be used on projects that begin construction by September 30, 2011. As of February 2010, DOE had obligated just 1 percent of those funds.
Long-Term Objectives. Although subsidies for the trans-mission and distribution of electricity in ways that slow climate change are new, subsidies for electricity distribu-tion and transmission generally are not. The Rural Utili-ties Service has, since the days of the New Deal, subsi-dized credit through loans and loan guarantees for providing access to electricity and telephone service for rural areas. The program’s early accomplishments were remarkable, but the service continued long after most farms and rural communities had electricity.51 The program’s continuation raises questions about the government’s ability to terminate federal subsidy pro-grams after an original goal is met. The continuation of subsidies ensured that funding flowed to groups that were not targets of the program originally. One survey of RUS loans and guarantees made during the late 1990s and early 2000s to 530 electricity distributors revealed that only 24 percent of the counties served by those distri-butors were rural, 29 percent of the counties served by the borrowers were in metropolitan areas, and more than 9 percent of the counties served were in metropolitan areas of more than 1 million people.52
51. Laurence J. Malone, “Rural Electrification Administration,” EH.Net Encyclopedia, http://eh.net/encyclopedia/article/malone.electrification.administration.rural. See also National Rural Electric Cooperative Association, “History of the Rural Electrification Industry,” Entrepreneur Management Quarterly (Winter 1997), www.entrepreneur.com/tradejournals/article/19623930.html.
52. General Accounting Office, Rural Utilities Service: Opportunities to Better Target Assistance to Rural Areas and Avoid Unnecessary Financial Risk, GAO-04-647 (June 2004), p. 12, www.gao.gov/new.items/d04647.pdf.
CBO

22 FEDERAL CLIMATE CHANGE PROGRAMS: FUNDING HISTORY AND POLICY ISSUES
CBO
The infrastructure credit and grant programs developed or expanded under ARRA could have a similar trajectory as they direct resources to expanding energy-saving infra-structure. As with RUS, the absence of a clearly defined target for modernization of the electrical grid could make it difficult to terminate programs after their goals are met.
Climate-Related Tax Preferences Tax provisions that involve climate-related activities typically encourage businesses and consumers to invest in new technology by reducing the cost of investing in products and processes that curtail GHG emissions and thus offsetting some of the price advantage of fossil fuels. Tax provisions also can encourage people to make more energy-efficient choices in building or refurbishing housing.
Most analysts argue that the most direct way to reduce GHG emissions is to tax them or to otherwise increase their price—for example, by imposing a cap-and-trade mechanism.53 Increasing the cost of GHG emissions would encourage reductions in emissions through a vari-ety of means but leave determination of the best method to the individual or business. Tax preferences, by con-trast, usually favor ways of reducing emissions that are specified in legislation. For example, there is a tax credit to encourage people to reduce consumption of home heating oil by installing solar-powered heating units, but there is no similar incentive to turn down the thermostat or put on a sweater, even though doing so could reduce GHG emissions at lower cost than installing solar-powered heating units.
Tax preferences generally are not neutral among the vari-ous technological means of reducing emissions in that they give different sources of energy different subsidies. A price increase in the form of a tax per ton of greenhouse gases emitted would provide an incentive to choose the most cost-effective form of energy, regardless of the tech-nology involved. By contrast, existing tax preferences vary widely in the amount of GHG emissions curtailed per tax dollar forgone. According to one calculation, the forgone tax revenue per ton of avoided greenhouse gas emissions varies by about 50 percent for the same tax provision, depending on whether the taxpayer is using wind or geothermal technology.54 In that instance, the tax revenue forgone per ton of GHG emissions reduced was $8 for
53. Joint Committee on Taxation, Tax Expenditures for Energy Production and Conservation, pp. 114–119.
geothermal facilities and $12 for windmills. By shifting some of the subsidy from wind to geothermal energy, the same reductions could be achieved less expensively. In that sense, such a tax provision is inefficient. Even so, both of those values are less than CBO’s estimate of the price of an allowance to emit a ton of greenhouse gases under the cap-and-trade system that would be established by H.R. 2454.55
The use of tax preferences to reduce GHG emissions also favors some taxpayers over others. Taxes on GHG emis-sions would affect behavior generally because virtually everyone would have to pay the tax (or face higher prices for the goods that incorporated an energy tax). By con-trast, some taxpayers would be unable to take advantage of the tax credit or subsidy. Most notably, some taxpayers do not have sufficient tax liability from other sources to use energy tax credits. Business credits also can be limited for companies with more than $25,000 in tax liability, for example, or for those subject to the corporate alternative minimum tax.
Even when tax liability is below $25,000 and the alterna-tive minimum tax does not apply, companies are able only to reduce their income tax liability to zero with the energy credit, leaving potential credits unclaimed.56 Some commentators point out that such limits especially affect the tax credit for production of energy from renewable sources. One set of tabulations for the tax years 2000 to 2005 suggests that businesses could typically claim about half of the credits to which they were entitled.57 In some years, only a quarter of the credits could be taken.
Some tax preferences allow companies to carry general business tax credits on their books and use them to reduce taxes in future years. However, there is evidence
54. Statement of Gilbert E. Metcalf, Tufts University, before the Senate Committee on Finance, Technology Neutrality in Energy Tax: Issues and Options (April 23, 2009), p. 9, http://finance.senate.gov/hearings/testimony/2009test/042309gmtest.pdf.
55. Congressional Budget Office, cost estimate for H.R. 2454, p. 13.
56. Those credits are nonrefundable; the taxpayer does not receive an immediate refund when the allowable credit exceeds the amount of income tax owed. The excess credits can, however, be used by the taxpayer in later years.
57. Carl Curtis and Gilbert E. Metcalf, Energy Tax Incentives and the Alternative Minimum Tax, Working Paper 14110 (Cambridge, Mass.: National Bureau of Economic Research, June 2008), p. 18, www.nber.org/papers/w14110.pdf.
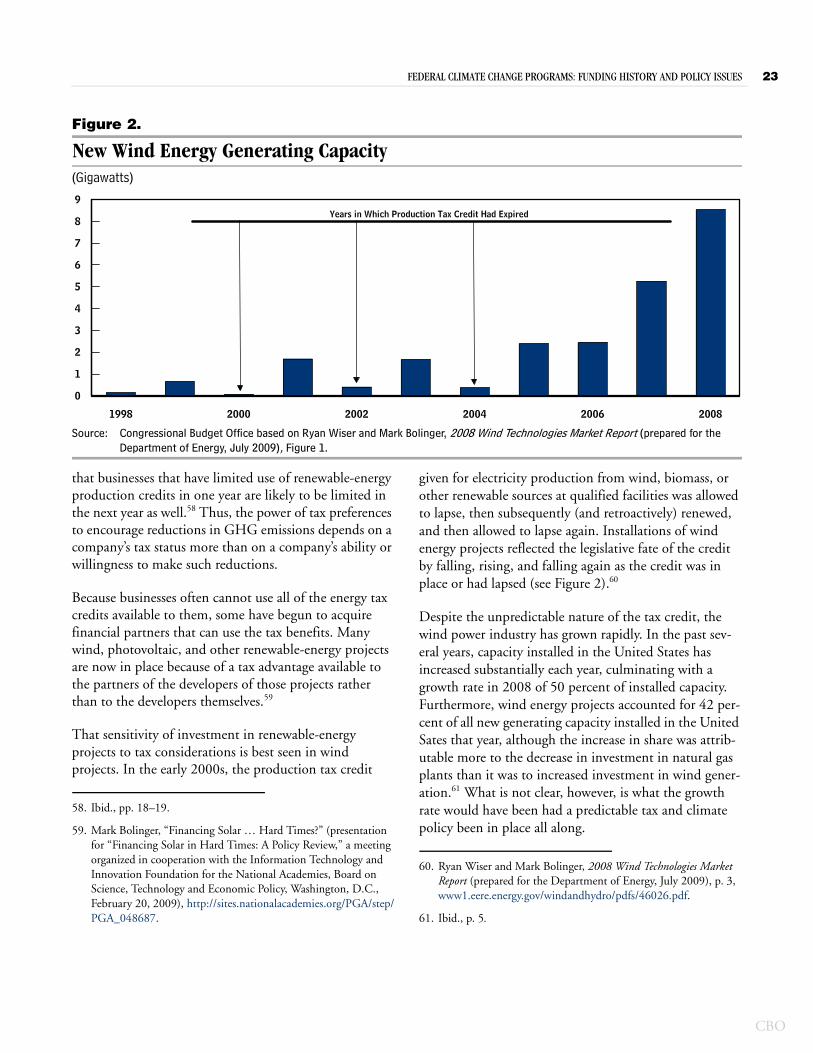
FEDERAL CLIMATE CHANGE PROGRAMS: FUNDING HISTORY AND POLICY ISSUES 23
Figure 2.
New Wind Energy Generating Capacity(Gigawatts)
Source: Congressional Budget Office based on Ryan Wiser and Mark Bolinger, 2008 Wind Technologies Market Report (prepared for the Department of Energy, July 2009), Figure 1.
1998 2000 2002 2004 2006 2008
0
1
2
3
4
5
6
7
8
9Years in Which Production Tax Credit Had Expired
that businesses that have limited use of renewable-energy production credits in one year are likely to be limited in the next year as well.58 Thus, the power of tax preferences to encourage reductions in GHG emissions depends on a company’s tax status more than on a company’s ability or willingness to make such reductions.
Because businesses often cannot use all of the energy tax credits available to them, some have begun to acquire financial partners that can use the tax benefits. Many wind, photovoltaic, and other renewable-energy projects are now in place because of a tax advantage available to the partners of the developers of those projects rather than to the developers themselves.59
That sensitivity of investment in renewable-energy projects to tax considerations is best seen in wind projects. In the early 2000s, the production tax credit
58. Ibid., pp. 18–19.
59. Mark Bolinger, “Financing Solar … Hard Times?” (presentation for “Financing Solar in Hard Times: A Policy Review,” a meeting organized in cooperation with the Information Technology and Innovation Foundation for the National Academies, Board on Science, Technology and Economic Policy, Washington, D.C., February 20, 2009), http://sites.nationalacademies.org/PGA/step/PGA_048687.
given for electricity production from wind, biomass, or other renewable sources at qualified facilities was allowed to lapse, then subsequently (and retroactively) renewed, and then allowed to lapse again. Installations of wind energy projects reflected the legislative fate of the credit by falling, rising, and falling again as the credit was in place or had lapsed (see Figure 2).60
Despite the unpredictable nature of the tax credit, the wind power industry has grown rapidly. In the past sev-eral years, capacity installed in the United States has increased substantially each year, culminating with a growth rate in 2008 of 50 percent of installed capacity. Furthermore, wind energy projects accounted for 42 per-cent of all new generating capacity installed in the United Sates that year, although the increase in share was attrib-utable more to the decrease in investment in natural gas plants than it was to increased investment in wind gener-ation.61 What is not clear, however, is what the growth rate would have been had a predictable tax and climate policy been in place all along.
60. Ryan Wiser and Mark Bolinger, 2008 Wind Technologies Market Report (prepared for the Department of Energy, July 2009), p. 3, www1.eere.energy.gov/windandhydro/pdfs/46026.pdf.
61. Ibid., p. 5.
CBO