fecal sludge management tools data collection...
TRANSCRIPT

Fecal Sludge Management Tools
Data Collection Instruments
November, 2016
Pub
lic D
iscl
osur
e A
utho
rized
Pub
lic D
iscl
osur
e A
utho
rized
Pub
lic D
iscl
osur
e A
utho
rized
Pub
lic D
iscl
osur
e A
utho
rized

ii
Preface / Acknowledgements
This document is supporting material to World Bank Economic and Sector Work on Fecal Sludge
Management: Diagnostics for Service Delivery in Urban Areas (P146128). The task team leaders
were Isabel Blackett and Peter Hawkins the task team members were Zael Sanz Uriarte, Ravikumar
Joseph, Chris Heymans and Guy Hutton.
This document is based on work conducted between January 2014 and February 2016 by Oxford
Policy Management (OPM) in partnership with the Water, Engineering and Development Centre
(WEDC) at Loughborough University. It was authored by Ian Ross (OPM), Rebecca Scott (WEDC),
Ana Mujica (OPM) and Mike Smith (WEDC). The broader research team who contributed to the
original work included Zach White, Rashid Zaman and Simon Brook from OPM, as well as Mike
Smith, Andy Cotton and Sam Kayaga from WEDC. Andy Peal and Pippa Scott (independent
consultants) also contributed to certain aspects of the methodology.
The inputs of many other World Bank staff, consultants and data collection firms are acknowledged
with thanks from the task team. They have contributed to the research, findings, analysis and reviews
but are too numerous to mention.

FSM global study - Data collection instruments
iii
Table of Contents
Preface / Acknowledgements ...................................................................................................... ii
List of tables and figures ............................................................................................................. v
List of abbreviations ................................................................................................................... vi
1 Introduction ..................................................................................................................... 1
1.1 About this document .................................................................................................. 1
2 Data collection instruments.............................................................................................. 2
2.1 Overview ................................................................................................................... 2
2.2 Ethical considerations ................................................................................................ 4
2.3 Data management considerations ............................................................................. 4
3 Data collection protocol: components for each instrument ............................................... 6
3.1 Household survey ...................................................................................................... 6
3.1.1 Introduction and objective .................................................................................... 6 3.1.2 Methodology ........................................................................................................ 6 3.1.3 Sampling .............................................................................................................. 7 3.1.4 Fieldwork ............................................................................................................. 9
3.2 Observation of service provider practices .................................................................. 9
3.2.1 Introduction and objective .................................................................................... 9 3.2.2 Methodology ...................................................................................................... 10 3.2.3 Sampling ............................................................................................................ 12 3.2.4 Fieldwork ........................................................................................................... 12
3.3 Transect walk .......................................................................................................... 13
3.3.1 Introduction and objective .................................................................................. 13 3.3.2 Methodology ...................................................................................................... 13 3.3.3 Sampling ............................................................................................................ 14 3.3.4 Fieldwork ........................................................................................................... 14
3.4 Testing fecal sludge (FS) characteristics ................................................................. 14
3.4.1 Introduction and objective .................................................................................. 14 3.4.2 Methodology ...................................................................................................... 15 3.4.3 Sampling ............................................................................................................ 19 3.4.4 Fieldwork ........................................................................................................... 20
3.5 Key Informant Interviews ......................................................................................... 21
3.5.1 Introduction and objective .................................................................................. 21 3.5.2 Methodology ...................................................................................................... 22 3.5.3 Sampling ............................................................................................................ 23 3.5.4 Fieldwork ........................................................................................................... 24
3.6 Focus Group Discussions ........................................................................................ 28
3.6.1 Introduction and objective .................................................................................. 28 3.6.2 Methodology ...................................................................................................... 28 3.6.3 Sampling ............................................................................................................ 28 3.6.4 Fieldwork model ................................................................................................. 29
Annex A Household Survey questionnaire .......................................................................... 32
A.1 Identification ............................................................................................................ 33 A.2 Consent ................................................................................................................... 33

FSM global study - Data collection instruments
iv
A.3 Survey Information................................................................................................... 34 A.4 End of Interview ....................................................................................................... 48
Annex B Observation of service providers .......................................................................... 50
B.1 Containment ............................................................................................................ 50 B.2 Emptying ................................................................................................................. 52 B.3 Transportation ......................................................................................................... 53 B.4 Treatment ................................................................................................................ 54 B.5 Disposal ................................................................................................................... 56 B.6 End use ................................................................................................................... 58
Annex C Transect walk record sheet................................................................................... 60
Annex D Fecal sludge (FS) characteristics record sheet ..................................................... 70
Annex E Key informant interviews ...................................................................................... 71
E.1 KII indicators and questions ..................................................................................... 71 E.2 Institutional responsibility mapping and stakeholder analysis ................................... 72
Annex F Focus Group Discussion guide ............................................................................. 75

FSM global study - Data collection instruments
v
List of tables and figures
Figure 1 Example sample size calculation ................................................................................... 8
Table 1 The distinction between tools, instruments and terms of reference ................................ 1 Table 2 Research methods and associated instruments ............................................................. 2 Table 3 Research methods and associated instruments ............................................................. 3 Table 4 List of observations ...................................................................................................... 10 Table 8 Observed faecal sludge characteristics........................................................................ 16 Table 9 Solid waste content of faecal sludge ............................................................................ 16 Table 10 Characteristics of fecal sludge to be assessed ............................................................ 17 Table 11 Fecal sludge parameters of importance ....................................................................... 18 Table 12 Preferred tests and test methods to measure characteristics ....................................... 19 Table 13 Sampling for different types of stakeholder .................................................................. 24 Table 14 Phasing of interviews ................................................................................................... 25 Table 15 External agencies: issues to address during interviews ............................................... 26 Table 16 Sampling for focus groups ........................................................................................... 28 Table 17 Topics for Focus Group Discussions with community members................................... 75 Table 18 Topic areas for discussion Theme 1: Current FSM Services ........................................ 76

FSM global study - Data collection instruments
vi
List of abbreviations
FS Fecal Sludge
FSM Fecal Sludge Management
PEA Political Economy Analysis
PSU Primary Sampling Unit
SDA Service Delivery Assessment (conducted at a city level)
SFD Shit Flow Diagram (fecal waste flow diagram)
FSM global study - Data collection instruments
1
1 Introduction
1.1 About this document
This document contains data collection instruments to support data collection, for which the
resulting data will inform diagnostic and decision-making tools for Fecal Sludge Management
(FSM) services. The diagnostic and decision-making tools shown are those developed in a
World Bank global FSM study (2016) that are further described in (i) a Summary Report of the
FSM study (ii) Tools and Guidelines for improving fecal sludge management (FSM) services.
This document accompanies the above documents the World Bank global FSM study. It can
essentially be used as a stand-alone guide for the purpose of data collection in other studies,
but adaptations will be required to account for local circumstances.
To distinguish between the diagnostic tools and the data collection instruments:
the tools are a quantitative and qualitative means of displaying data to support problem
diagnosis and decision-making;
the data collection instruments consist of the data collection formats (such as the
household survey questionnaire) and their associated protocols (which are an instruction
manual and methodology), which provide an input to the tools.
This document sets out the instruments mainly as they were used in the five cities of this study.
Both can and should be adapted to the objectives of whoever is using them, and the specificities
of the city concerned.
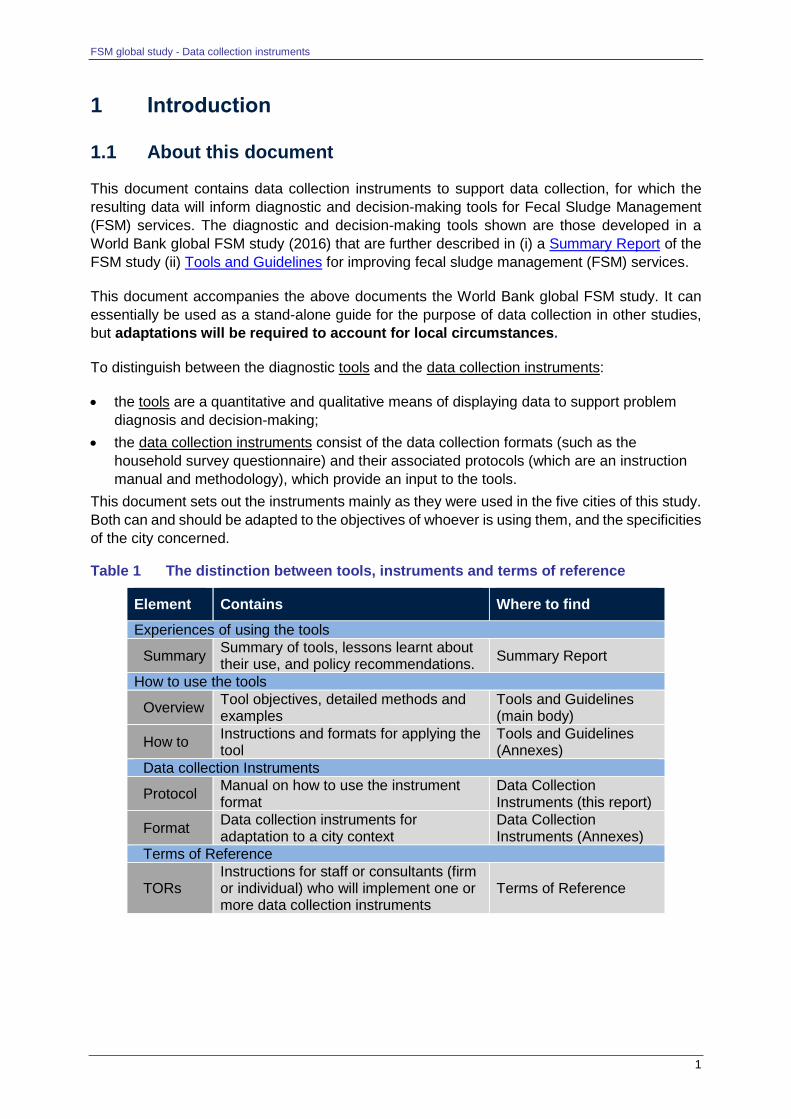
Table 1 The distinction between tools, instruments and terms of reference
Element Contains Where to find
Experiences of using the tools
Summary Summary of tools, lessons learnt about their use, and policy recommendations.
Summary Report
How to use the tools
Overview Tool objectives, detailed methods and examples
Tools and Guidelines (main body)
How to Instructions and formats for applying the tool
Tools and Guidelines (Annexes)
Data collection Instruments
Protocol Manual on how to use the instrument format
Data Collection Instruments (this report)
Format Data collection instruments for adaptation to a city context
Data Collection Instruments (Annexes)
Terms of Reference
TORs Instructions for staff or consultants (firm or individual) who will implement one or more data collection instruments
Terms of Reference
FSM global study - Data collection instruments
2
2 Data collection instruments
2.1 Overview
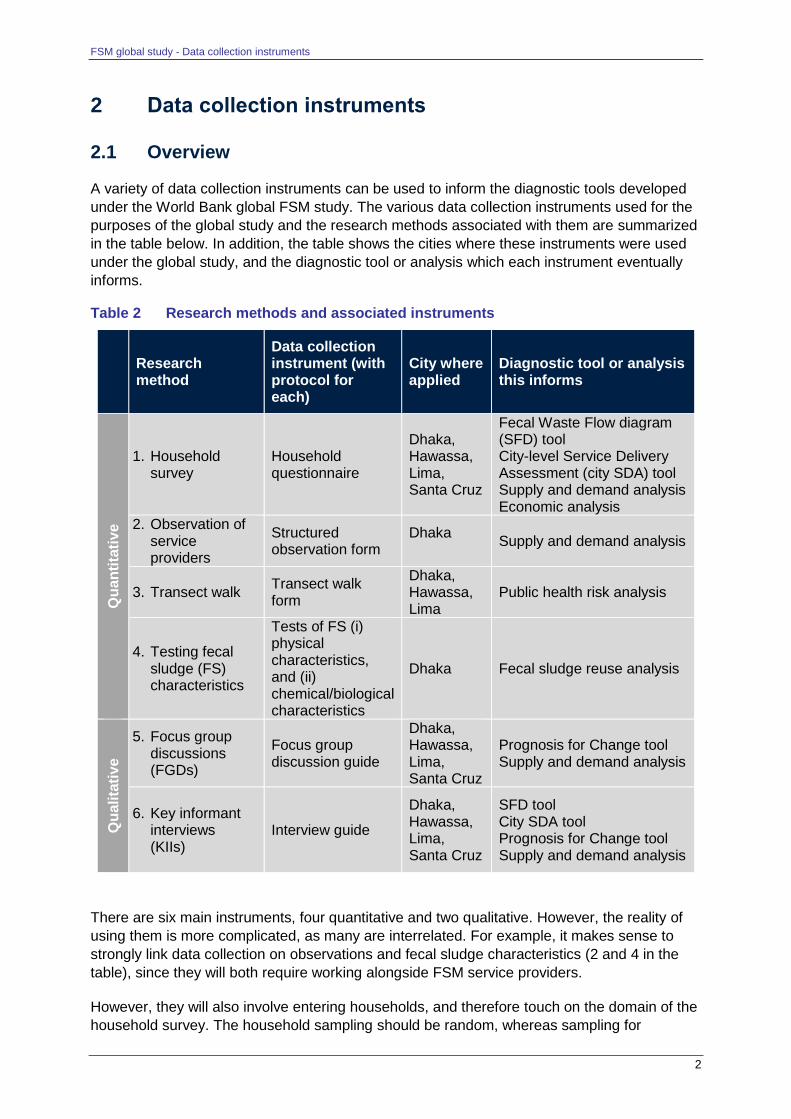
A variety of data collection instruments can be used to inform the diagnostic tools developed
under the World Bank global FSM study. The various data collection instruments used for the
purposes of the global study and the research methods associated with them are summarized
in the table below. In addition, the table shows the cities where these instruments were used
under the global study, and the diagnostic tool or analysis which each instrument eventually
informs.
Table 2 Research methods and associated instruments
Research method
Data collection instrument (with protocol for each)
City where applied
Diagnostic tool or analysis this informs
Qu
an
tita
tiv
e
1. Household survey
Household questionnaire
Dhaka, Hawassa, Lima, Santa Cruz
Fecal Waste Flow diagram (SFD) tool City-level Service Delivery Assessment (city SDA) tool Supply and demand analysis Economic analysis
2. Observation of service providers
Structured observation form
Dhaka
Supply and demand analysis
3. Transect walk Transect walk form
Dhaka, Hawassa, Lima
Public health risk analysis
4. Testing fecal sludge (FS) characteristics
Tests of FS (i) physical characteristics, and (ii) chemical/biological characteristics
Dhaka Fecal sludge reuse analysis
Qu
alita
tiv
e
5. Focus group discussions (FGDs)
Focus group discussion guide
Dhaka, Hawassa, Lima, Santa Cruz
Prognosis for Change tool Supply and demand analysis
6. Key informant interviews (KIIs)
Interview guide
Dhaka, Hawassa, Lima, Santa Cruz
SFD tool City SDA tool Prognosis for Change tool Supply and demand analysis
There are six main instruments, four quantitative and two qualitative. However, the reality of
using them is more complicated, as many are interrelated. For example, it makes sense to
strongly link data collection on observations and fecal sludge characteristics (2 and 4 in the
table), since they will both require working alongside FSM service providers.
However, they will also involve entering households, and therefore touch on the domain of the
household survey. The household sampling should be random, whereas sampling for

FSM global study - Data collection instruments
3
observations/characteristics will necessarily be purposive and driven by the service providers’
availability schedules. This is discussed in more detail below, but serves to demonstrate the
level of planning that needs to go into finalising any fieldwork model. The likely outcome is that
households where service providers are observed may not end up being part of the main
household survey sample.
A related point to that made above is that service providers are identified as key informants to
be interviewed, but the cooperation of service providers is also required to carry out
observations of the sanitation chain and testing of characteristics. In practice, service
providers employ many individuals. For example, in the case of a company operating
desludging trucks, there would be a key informant interview with the manager, but discussions
with his/her colleagues (i.e. the truck operatives) for the observation.
In terms of sampling, the research design should be adapted to each city context, but the
broad overview is shown in Table 3 below as a guide. Sampling was designed so as to allow
conclusions to be drawn about the city-wide situation, as well as the specific context of slums /
informal settlements / low-income areas.
Table 3 Research methods and associated instruments
Instrument Data source n per city
Qu
an
tita
tive
1. Household
survey
Survey of households (i) across the city, (ii) in slums / informal settlements / low-income areas
720
2. Observation of
service provider
practices
Observation of containment, collection, transport/disposal and treatment/disposal
5
3. Transect walk Observation of environmental and public health risks through transect walk
40
4. Testing fecal
sludge
characteristics
Samples from (i) pits/tanks during emptying, (ii) truck/vessel outflow, (iii) final drying bed or outflow
5
Qu
alita
tive
5. Key informant
interviews
(a) Government (e.g. council / utility, ministries)
(b) Service providers along the sanitation chain
(c) Other key FSM agencies
As required
6. Focus group
discussions
FGDs with residents of slum communities, low-income areas and informal settlements
10
The person doing the work would need background information on each instrument, such as:
1. Introduction (e.g. background and objectives of project) 2. Methodology (e.g. components) 3. Sampling (e.g. frame, size calculation) 4. Preparation (e.g. approvals, pre-testing, training & piloting) 5. Fieldwork model (e.g. number/ structure of teams, timeline) 6. Quality control and risk management 7. Ethical considerations 8. Data Management (e.g. entry, cleaning) 9. Data Analysis 10. Reporting and dissemination

FSM global study - Data collection instruments
4
Together, this information comprises a data collection protocol. Such protocols are provided
per instrument in the next Section. Some cross-cutting considerations on ethics and data
management are briefly discussed in Sections 2.2 and 2.3.
2.2 Ethical considerations
The main ethical considerations related to all data collection protocols are:
Informed voluntary participation: Informed written or oral consent must be obtained from
participants before data collection is conducted. Team members and participants are to be
informed about the purpose, methods, risks, benefits and intended possible uses of the results
of the study.
Right to refuse or withdraw: The participants must be informed that they are free to withdraw
from the study at any point, or may refuse to answer any questions. They will also have the right
to ask questions at any point before, during or after the study is completed.
Confidentiality and privacy: No personal identifiers should be used in any form of reporting or
dissemination. Personal identifications will be linked with a unique identifier (e.g. id code) and
kept securely. No information should be published that could identify the respondents. Paper
copies of collected data will be stored for three years in a secure location; only the study team
should be able to access them. While confidentiality cannot always be guaranteed (especially
where data is collected in a group, or public setting), participants are requested not to disclose
details of what was discussed.
Risks and benefits: The risk of participation is considered minimal as there will be no collecting
of sensitive information or biological samples. The respondents will not be directly benefited by
participating, however the information that they will provide inform policy makers to improve the
overall water, sanitation and hygiene condition of their country and they may eventually have
an indirect benefit from that.
Payment: There should be no compensation payment to the participants and nor will they have
to pay to participate in the study. Interview and focus groups should be held close to the homes
of the participants to avoid any transport costs.
2.3 Data management considerations
Tight data collection and quality control must be followed up by sound data management. The
process in any given city will depend on the firms or consultants contracted and their usual
practice, but there are certain practices which should be followed when paper data collection
formats are used. If digital data collection is used, separate guidance will be necessary.
Starting with qualitative data, the consultants will have clear Terms of Reference specifying how
they should record their findings and write them up into transcripts and reports as appropriate.
This will vary by city – the essential thing is that all stakeholders are clear on what is to be
provided in what format before work begins, and that it is in the TOR.
Next considering quantitative data, any data collection firm must have an identified Data
Manager, to supervise Data Entry Operators and Data Editors (assuming paper data collection
is used). Their roles and responsibilities are as follows:

FSM global study - Data collection instruments
5
Data Manager
Development of the Data Entry Programme (e.g. in CSPro or similar)
Recruitment and training of the data entry operators and editors
Overseeing data entry
Data cleaning
Data Entry Operators
Double data entry
Editors
Pre-entry check of the completed questionnaires
Post-entry check; i.e. checking the inconsistencies between two entries
Any quantitative data will be double-entered into a data entry programme specifically designed
for the project. Each data entry operator will be able to enter about 30-40 household
questionnaires per day. Once the data is double-entered, both versions of the datasets will be
checked for consistencies. The data editors will manually check the hardcopy questionnaires
for any inconsistencies between them. In addition, whoever is doing the data analysis should
check internal inconsistencies, outliers, missing data and other data quality issues.
FSM global study - Data collection instruments
6
3 Data collection protocol: components for each instrument
For the six instruments, this section sets out four key protocol elements: (i) introduction and
objective, (ii) methodology, (iii) sampling, (iv) fieldwork. The associated formats themselves
are in the Annexes.
Annex A contains the Household Survey questionnaire
Annex B contains the inspection form for the Observation of Service Providers
Annex C contains the Transect Walk record sheet
Annex D contains the Fecal Sludge (FS) characteristics record sheet
Annex E contains the structure for Key Informant Interviews
Annex F contains the Focus Group Discussion guide
3.1 Household survey
3.1.1 Introduction and objective
A quantitative household survey enables researchers to ask questions of many households
consistently and with the same answering format. Questions can invite answers which are
categories, binary yes/no, and continuous numerical variables, amongst other things. The
household survey proposed here aims to provide information about household perspectives
on the FSM market, emptying practices, etc.
The objective of the household survey is to collect information from people using on-site
sanitation (particularly those living in slums, informal settlements or low-income areas)
regarding their use of FSM services and preferences for future FSM services. The household
survey informs multiple tools and analyses as set out in Section 1. In order to keep the
number of questions manageable, prioritisation is necessary. The questionnaire should be
adapted to fit the objectives of the survey and fit the local context.
A cluster survey is proposed and the necessary sample size may differ across each city.
Sample size calculations are based on the population size, estimated prevalence or the main
indicator of interest, the required confidence level, acceptable margin of error and the design
effect (related to inter-cluster correlation). Informally, it would also be influenced by the budget
available. The proposed indicator of interest is ownership of a latrine not connected to a
sewer, since the tools are primarily focused on FSM services for those with non-networked
sanitation.
3.1.2 Methodology
The World Bank global FSM study was interested in two separate but overlapping groups, (i)
people living in slums, informal or low-income settlements (a geographical area), (ii) people
using on-site sanitation (ownership of a specific asset), some of whom live in slums, informal
or low-income settlements but others elsewhere in middle class or wealthier areas. The aim
was to draw conclusions about these groups by interviewing a sample of them.
Interviewing households at random from across a whole city is not a very reliable way of
drawing such conclusions, and it is also difficult to administer. One of the best ways of
FSM global study - Data collection instruments
7
combining statistical rigour with a workable fieldwork model is a cluster survey. This involves
sampling a defined number of groups of households in areas of a consistent size.
Most cluster surveys are based on primary sampling units (PSUs) made up of 100-250
households depending on the country, from which a cluster of 5-20 households is sampled. In
towns and cities, PSUs are often referred to as ‘urban blocks’ – the list is usually available
from the national statistics office in the country based on the most recent census. They
typically contain between 100 – 500 households depending on the country.
The World Bank global FSM study used a cluster survey approach, and in most cities 720
households across two sub-samples in each city were interviewed. The sampling approach is
detailed in the next Section. The Household Survey questionnaire is in Annex A of this
document.
3.1.3 Sampling
First, the sampling frame needs to be defined, i.e. the geographical or other scope, of all the
households that could be sampled. A dual sub-sample approach can be taken:
A sub-sample of households using on-site sanitation living across the whole city (some
of whom may live in slums / informal settlements)
A sub-sample of households living in slums / informal settlements with boundaries
defined by the study team.
The decision of which approach to use is about representativeness. The key decision is to
define the population which the sample will represent (and the associated level of confidence).
If it is only slums, informal or low-income settlements, then it is appropriate to sample only
these geographically-defined areas. If the scope is beyond such areas, then it will probably be
necessary to sample the whole city.
The sample sizes are influenced by the population size, the prevalence rate for indicators of
interest, the required confidence level, and the design effect (related to inter-cluster
correlation). The generally-accepted minimum number for cluster surveys is 30 clusters.
The approach, as used in the World Bank global FSM study, is generally as follows:
Sub-sample A: 30 primary sampling units (PSUs) from across the city, based on
administrative divisions. For example, if there are 90 wards in a city, the approach
would be to first randomly select 30 wards, and then randomly select 1 PSU per ward.
This sub-sample is designed to be representative of the city as a whole. However,
households within each PSU would be selected using a random walk method.
Sub-sample B: 30 PSUs from geographically-defined slums / informal settlements. For
example, if 15 such areas were defined, 2 PSUs would be randomly selected from the
total number of PSUs in each of those areas. Households would be selected using a
random walk method.
The next decision is the size of the clusters, which needs a power calculation. The best and
easiest to use is the statistical software EpiInfo, developed by US Centres for Disease Control
and Prevention (CDC).

FSM global study - Data collection instruments
8
For the city-wide sample, the indicator of interest is the proportion of households using non-
networked sanitation. For most developing country cities, this is between 60-100% (see
summary report for explanation), so 80% was used.
As shown in the graphic below, the statistical assumptions are population size: infinite,
expected frequency: 80%, margin of error = 5%, design effect = 2, cluster size = 12 and
number of clusters = 30.
Figure 1 Example sample size calculation
This provides a power (confidence level) of 90%. Surveys placing a premium on
representativeness would aim for 95% confidence, but 90% may be sufficient for many
studies.
Selecting 12 households per PSU gives an overall sample size of 720, with 360 households in
each of sub-sample A and B. At this sample size, sub-sample A would not be representative
of the city with very high confidence, but would give an idea of a broader geographical area
than just slums. Sub-sample B would give relatively high confidence about the defined
geographical area (though the areas selected would be purposive and not give statistical
representativeness’).
This approach balances the need for a focus on slums / informal settlements (however
defined) but also the need for users of non-networked sanitation in lower-middle and middle
class areas to be part of a city wide FSM service. If areas known to be wealthy and connected
to sewers are randomly selected in sub-sample A, these can be replaced by another draw,
with little risk to the integrity of the methodology. However, a sampling expert should be
consulted. Within each PSU, the sampling of households (secondary sampling units) could be
done in the field, i.e. by random walk or a similar method to be determined. This is the lowest
cost method when representativeness is not the highest priority.

FSM global study - Data collection instruments
9
3.1.4 Fieldwork
The fieldwork model (e.g. size of enumerator team, which drives cost) is determined by the
number of households sampled per PSU. Assuming the questionnaire is 45 minutes long,
then a maximum of 6 households can be completed by one enumerator per day, though this
could be ambitious. If it is practical, then 12 households per day (i.e. one cluster) could be
achieved with 2 enumerators in the team plus a supervisor.
With 60 clusters and only 1 team, that would mean 60 working days of fieldwork, which would
be too long. A better model could be 4 teams, which would then take 15 days to complete.
Alternatively, there could be 3 teams, which would mean 20 days to complete.
3.2 Observation of service provider practices
3.2.1 Introduction and objective
Observation is a useful tool for triangulation to confirm the reliability and consistency of
information collected from other studies, including from questionnaires and interviews. It is
applicable to both quantitative and qualitative data collection.
For this instrument, observation requires making visual inspections about fecal sludge
management from containment in a pit or tank, to final disposal. It requires identification of
hazards, hazardous events, and an assessment of possible risks at each stage (containment,
emptying, transport, treatment and end-use or disposal) of the fecal sludge management
chain.
Three types of observation can be carried out:
1. Structured observation of service providers, to identify risks to the environment associated with procedures, state of equipment and actions taken (by households and workers) in relation to containment, emptying, transport/conveyance, treatment, disposal or end-use of fecal sludge
2. Characteristics of fecal sludge removed from sanitary facilities, using tests to identify the solid/liquid state of the sludge and other aspects – see separate section on fecal sludge (FS) Characteristics
3. Environmental conditions in the neighbourhood, using Transect Walks
The fill list of issues to observe is shown in Table 4.

FSM global study - Data collection instruments
10
Table 4 List of observations
Stage of FSM service chain
Issues to observe
Containment
- Risks from storage or containment of fecal sludge at the household level. - Risks within a local district from containment facilities (to be identified
during transect walks).
Emptying
- Practices, and equipment, used to remove fecal sludge from pits, septic tanks, etc. in different parts of the city. (Whether collection services serve particular districts, and whether different income groups use different emptying services.)
- Risks associated with removal of fecal sludge (to households and/or local district).
- Access for emptying services to pits, septic tanks, etc. requiring emptying. - Procedures used for on-site disposal of fecal sludge. - Use of documentation to record details for removal of fecal sludge. - Does the sludge contain significant quantities of solid waste (plastics, glass,
etc.)?
Transport
- Types and capacities of vehicles used to transport fecal sludge from pits, septic tanks, etc.
- Destinations of vehicles used to transport fecal sludge. - Cleanliness and condition of vehicles used to transport fecal sludge. - Use of documentation to record details for transport of fecal sludge. - Risks associated with transport practices (to households and/or local
district).
Treatment
- Location of facilities used to treat fecal sludge (these could be dedicated fecal sludge treatment plants or may be combined with wastewater treatment facilities).
- Quantities of fecal sludge received for treatment at each location. - Risks associated with the treatment process (to operators or environment) - Use of documentation to record details of fecal sludge received for
treatment. - Capacity (design and operating), type and condition of facilities used to
treat fecal sludge. - Destination of fecal sludge following treatment. - Use of documentation to record details of fecal sludge removed following
treatment.
Disposal
- Locations and scale of official and unofficial disposal sites. - Risks associated with disposal sites (to operators, public or the
environment) - Destinations of vehicles used to transport fecal sludge after treatment. - Destinations of vehicles used to transport fecal sludge that is not treated. - Use of documentation to record details for disposal of fecal sludge.
End-use (resource recovery)
- Evidence of the nature of resource recovery practices. - Scale of resource recovery practices. - Risks associated with end-use processes/practices (to operators, public or
environment)
3.2.2 Methodology
Using a set of developed check-lists (see Annex B) helps to identify and capture the key risks
associated with practices carried out during stages of the FSM service chain.
Completing the structured observation
While observations are ideally made unannounced, to observe full containment facilities, as
well as emptying and transport practices, visits need to be planned, agreed and carried out as
and when containment systems are being emptied. Specific skill sets will be needed for

FSM global study - Data collection instruments
11
observation, with at least one observer being a sanitation expert, trained to be aware of
relevant details.
A prepared checklist helps the observers identify the main risks associated with all stages of
the FSM service chain (from containment to disposal/ end-use). Training in use of the
checklist will be needed, as well as an opportunity for enumerators to pilot them, to ensure
good understanding in how to use them effectively and any adjustments required before
conducting final observations.
Having gained approval to conduct the structured observations (e.g. from householders,
emptiers, operators/managers of treatment facilities, etc.), the enumerators should observe
the household sanitation facility (containment), the practices of the service provider handling
the fecal sludge (emptying, transportation and disposal), and the facilities handling the fecal
sludge (treatment and/or end-use).
As each observation is conducted, the enumerator must complete the appropriate checklists
to the fullest extent possible. To do this, the enumerator places a clear and consistent mark
(such as X or ) against the appropriate response to each question. If no answer can be
identified, the mark can be made against the answer “DK” (representing don’t know). If the
enumerator needs to provide a different response to any of those suggested, it must be clearly
stated. There is also space on the checklists for additional comments to be made.
The questions are not to be asked out loud, but rather the enumerators ask each question to
themselves (or perhaps quietly to each other, as a prompt) as they complete the check list.
General household information must also be completed, as indicated on page 1 of the form.
Recording results of the structured observation
Observation will generate both quantitative and qualitative data. All information collected
should be recorded in note form and eventually transferred into an excel file. Each location at
which observations are made should have a unique identification code. It is important that the
report form provides detailed information for identification (city, PSU, GPS coordinates and
date of observation, as a minimum).
One set of survey sheets are to be completed for any one observation: i.e. a containment and
emptying observation, plus – to the extent possible – observing transportation, disposal and
treatment/ end-use facilities for the emptied fecal sludge. If only containment and emptying
practices can be observed in one event, then separate observations of transportation,
disposal, treatment and/or end-use may need to be arranged.
The results taken on paper, for each set of observations, must be accurately transferred into
an excel spreadsheet format. One page of the spreadsheet is used to record results for
observations at each stage of the FSM service chain.
In the excel file, the results noted in the field (paper copy) must be accurately transferred into
the corresponding cell for each question addressed. Each excel file must have a uniquely
coded file name, to identify the specific location and time in which the structured observations
were conducted.

FSM global study - Data collection instruments
12
3.2.3 Sampling
Fully recorded observations are to be made at a minimum of 5 different locations, through all
stages (if possible) of the sanitation chain. The chosen observations should reflect existing
fecal sludge management practices as much as possible, considering both manual and
mechanical emptying methods.
To achieve a purposive sample (covering a range of types of sanitary facilities, income groups
and procedures), the following need to be taken into account:
To obtain as representative a range of observations as possible, discuss emptying
schedules with emptiers (both mechanical and manual operators) and identify a
range of customers, income groups and types of facilities emptied. This may require
discussions with a number of service providers, to achieve a suitable range.
Observations need to coincide with a household having their facility (pit latrine, septic
tank, etc.) emptied. Information will need to be sought from emptiers, or households,
to know when emptying will take place and time visits accordingly. Note that
observations of manual emptying procedures may need to be done at night.
Timing and locations of visits will need to be finally agreed in advance, in consultation
with the emptiers. Permission to observe must be sought from the emptiers before
the visit and from households prior to, or at the time of, visits.
Where possible, the structured observations should observe the full procedure of a
“shift” by the emptiers – following them through the stages of emptying, transporting
and disposing of the fecal sludge – to the extent that is possible.
The visits will require careful thought and preparation, to avoid significant down-time
of observers. It may benefit to identify, in consultation with emptiers, the times of day/
days of the week that they are busiest, and then match this against the stage of work
to be observed.
It is estimated that a minimum of 30 minutes will be required per recording, depending on the
extent of the service providers’ “shift” that can be observed and the length of any shift to
follow-through the procedures. Where long, or congested, transportation routes are involved,
that stage of the observation may require significantly more time.
3.2.4 Fieldwork
Each observation should be carried out by two members of the survey team to make
observations and record details, with at least one person being a sanitation expert. Both will
have been trained in use of the checklists.
The structured observations can be completed at the same time, and by the same team, as
carries out observations of fecal sludge (FS) Characteristics (see below). If and when
possible, they could be conducted while household visits are happening in the same area, but
given the need to follow the activities of the emptying service providers, this may not always
be possible.

FSM global study - Data collection instruments
13
Quality control and risk management
The Quality Control officer is unlikely to carry out quality checks either during or following the
structured observations – and they are not able to re-observe practices. They should therefore
interview the enumerators to discuss a sub-set of recorded information, ask what happened at
the time of the recording and check that the recorded observations are appropriate.
Those conducting the observations should use protective clothing (gloves, safety glasses,
face masks, etc.) if there are identified risks. This is particularly the case as and when they
take samples of fecal sludge to identify its characteristics at the time of emptying (see
separate Protocol).
3.3 Transect walk
3.3.1 Introduction and objective
A transect walk enables participants to make a subjective and qualitative assessment of
conditions within a community. During the walk, participants make systematic observations,
discuss their observations, and record their findings. The information collected complements
information collected from household questionnaires, observations, and sample collection and
analysis.
For the purposes of this instrument, a transect walk provides information about the broad
environmental risks to public health, in particular with respect to the presence of fecal material
and solid waste, and the proximity of these wastes to drainage channels and water sources.
3.3.2 Methodology
A transect walk is not an intrusive activity, but ideally local authorities should be informed
about survey work within a community, and permission obtained in advance. If possible, two
male and two female adult volunteers living in the community should be asked to participate in
a transect walk, so that the information collected can benefit from both local knowledge and
outside knowledge. Local participants should be briefed at the start, so that they know what a
transect walk is, and what information it provides.
The route for a transect walk should not be imposed upon the participants, but an agreed
route should be identified and agreed. The route followed should include areas that are
generally representative of the PSU.
The route taken for each transect walk should be planned and recorded using a map and/or
GPS data. The route should cross the PSU, following a winding route to include a variety of
areas. Those planning the route should try to include residential areas from across the
income range, and examples of areas that may pose risks to public health, such as river or
streams, drainage channels, back streets, open wasteland, food markets and local waste
dump-sites.
Qualitative information from observations made during the transect walk should be
summarised, using a report form such as included in Annex C. When using the report form,
different examples of risk may be observed during a single transect walk. Classification
should be based on what is observed in the majority of places, and representing the general
local conditions.

FSM global study - Data collection instruments
14
Photographs may be taken of any relevant and significant details, but the locations of areas
photographed should be identified, together with brief comments about what each photograph
shows.
The final set of questions should be answered at the end of the walk, and asked of the four
community members who have participated in the walk (see below). They are slightly different
from the rest of the instrument in that they will provide quantitative data on certain aspects.
This consists of some questions asking about the general conditions within the community
relating to open defecation, fecal sludge contamination and awareness of associated risk,
from the community perspective. The questions are asked to the group as a whole, who can
discuss their opinions before offering a single response.
3.3.3 Sampling
Up to 40 transect walks will provide a good data set of conditions within a range of areas and
information about the environmental public health risks to the communities. This can comprise
a transect walk in all of the 30 PSUs from Sub-Sample A, and 10 randomly selected from Sub-
Sample B. This allows the study to draw conclusions about health risks in the city as a whole,
by carrying out a transect walk in all 30 sub-sample A PSUs.
3.3.4 Fieldwork
Each transect walk team should include two members of the survey team, including a
sanitation specialist, to make observations and record details. In addition it should include two
male and two female community members to create a mixed team to provide information and
insights from different perspectives that contribute to creating a complete picture of the
environmental health risks in the area.
Each transect walk should be arranged during the household survey period, complementing
information collected from household surveys. A standard report form should be used, so that
information collected for the same categories on the form can be compared directly for
different PSUs.
A draft report form should be completed during each transect walk, with a final version
updated as soon as possible afterwards, before information becomes vague or is forgotten.
The two members of the survey team, and one member of the community who has
participated in the walk, should sign the form after completion to confirm that they agree with
the information reported. A copy of the report, with a brief explanation of what has been
observed should be given to the member of the community who signs the completed form. It
is important that the report form provides detailed information for identification (city, PSU and
GPS coordinates).
3.4 Testing fecal sludge (FS) characteristics
3.4.1 Introduction and objective
The characteristics of fecal sludge will vary, depending on factors such as the length of time
for which it has been stored, the season, and the storage conditions (e.g. whether the sludge
was in a lined or unlined pit). Assessment of the characteristics is required at three stages,
and for the following reasons:

FSM global study - Data collection instruments
15
1. During removal, as this will influence the removal methods that could be used; and 2. After removal, as this will influence how the faecal sludge can be transported and
treated, and possible resource recovery options. 3. After treatment, as this will determine the resource value of the end product
derived from the faecal sludge.
Data collection to assess and measure the characteristics of fecal sludge will use the
components of both (a) observation and (b) sampling and analysis. This will require
observation of the sludge during removal from a pit or tank, and collection of sludge samples
from three points along the sludge flow pathway.
The three points from which sludge samples should be collected are:
(i) at pits or tanks during emptying, (ii) from trucks, vehicles or vessels during discharge to treatment, and (iii) at the outlet or following the final stage of any treatment
3.4.2 Methodology
Observation
The physical appearance and characteristics of fecal sludge will vary, depending on the length
of time for which it has been stored, the storage conditions (e.g. whether the sludge was in a
lined or unlined pit), and whether solid wastes have been added to the faecal matter.
Observation of the fecal sludge during removal from pits or tanks is necessary to determine
whether the fecal sludge will behave as a fluid or a solid, and which removal methods may be
appropriate. The top layer of the sludge may be unrepresentative, so a more representative
sample should be collected in a bucket part-way through the emptying operation. Observation
will also reveal what solid wastes may be present in addition to faecal matter.
Tables Table 5 and Table 6 should be used to describe the sample collected during emptying.
Table 5 shows five categories, from dry solid to liquid, for fecal sludge based on observations;
and Table 6 shows five categories for fecal sludge based on the solid waste content. Where
possible, a photograph should be taken of the fecal sludge sample collected during removal
from a pit or tank, and a record kept to identify the location and date for the photograph.
Collection and testing of samples
Physical and chemical characteristics of fecal sludge will vary, depending on factors such as
the length of time for which it has been stored, the season, the storage conditions (e.g.
whether the sludge was in a lined or unlined pit) and removal practices (e.g. whether water is
added to the sludge to make it behave as a fluid).

FSM global study - Data collection instruments
16
Table 5 Observed faecal sludge characteristics
Description Behaviour
Dry Solid Crumbles easily. A deep vertical cut, widened to create a triangular wedge-shaped cut in the FS, holds its shape, with the cut edges appearing dry.
Wet Solid Cohesive, with no evidence of free liquids.
A deep vertical cut, widened to create a triangular wedge-shaped cut in the FS, holds its shape, with the cut edges appearing damp but with no free liquid visible.
Solid and liquid mix A mixture of solids and liquids.
A deep vertical cut, widened to create a triangular wedge-shaped cut in the FS, holds its shape, with liquids draining into the cut.
Viscous liquid Liquid, but flowing slowly A deep vertical cut, widened to create a triangular wedge-shaped cut in the FS, closes up after a few seconds.
Liquid Liquid, flowing easily. The FS is so liquid that it is not possible to widen a deep vertical cut and create a triangular wedge-shaped cut.
Table 6 Solid waste content of faecal sludge
Classification Description
Very high solid waste content Contains more solid wastes than faecal material.
High solid waste content Contains significant amounts of miscellaneous solid wastes.
Medium solid waste content Contains small amounts of miscellaneous solid wastes. Low solid waste content Contains some paper materials used for anal cleansing.
No solid waste content Contains no solid wastes.
Sample collection for analysis to assess fecal sludge characteristics is required at four stages,
as shown in Table 7, which also includes the requirement for observation:
1. Before removal from individual pits or tanks, to ascertain whether the fecal sludge will behave as a fluid and the extent of solid (non-fecal) waste content. These both have implications for the removal techniques and equipment required.
2. During removal from individual pits or tanks, to obtain a variety of fecal sludge characteristics and indicate the nutrient content and calorific values, and whether the FS is of high or low strength.
3. During discharge from the truck, vehicle or vessel (at the tipping point or treatment plant), as this will provide a composite sample from more than one pit or tank. These characteristics will also indicate the nutrient content and calorific values, and whether the FS is of high or low strength. The characteristics may influence how the fecal sludge can be transported and treated, and help to identify possible resource recovery options;
4. After treatment, as this will determine the safety and resource value of the end product derived from the fecal sludge. Important characteristics at this stage include the nutrient content and calorific values.

FSM global study - Data collection instruments
17
Table 7 Characteristics of fecal sludge to be assessed
Stage Assessment method
Characteristics to be assessed
Before removal (just prior to emptying)
Observation
A subjective assessment of the sludge before removal will indicate whether the sludge will behave as a fluid or as a solid.
If the sludge is characterised as being solid, removal can be by excavation. Alternatively, it may be possible to mix the sludge with water in-situ until it becomes sufficiently liquid for pumping to be possible.
Approximate solid (non-fecal) waste content
During removal
Sampling and analysis (individual pits or tanks)
More detailed analysis of FS is needed once it has been removed. FS can be classified as being either high strength or low strength, with the term “strength” referring to the oxygen demand (BOD/COD), rather than to any physical characteristics.
High strength FS is highly concentrated, mostly fresh FS that has been stored for a relatively short time (days or weeks). Low strength FS is older, less concentrated and more stabilized. It has usually been stored for several years.
Tests for calorific and nutrient values could help identify potential for end-use following treatment that is not currently available (to be taken if considered appropriate in the context of the City).
After removal (at point of discharge/ disposal)
Sampling and analysis (composite sample from several pits or tanks)
After treatment
Sampling and analysis
Further analysis of the FS is needed following treatment (primary and/or secondary), to assess the suitability of the end product (liquid and or solid products) as a resource for potential end-use options. Tests will identify calorific value, nutrient value and helminth egg contamination.
Parameters of importance The quality parameters of importance for characterisation of fecal sludge are listed below in Table 8, together with a brief explanation of the reasons for their relevance.

FSM global study - Data collection instruments
18
Table 8 Fecal sludge parameters of importance
Parameter Units Significance
COD
(Chemical Oxygen demand)
mg/L This provides an indication of how much oxygen is needed to convert materials in the FS into stable end-products.
BOD
(Biological Oxygen Demand)
mg/L This provides an indication of how much oxygen is needed by bacteria to convert materials in the FS into stable end-products.
NH4 –nitrogen
(free and saline ammonia)
Percentage by weight
Free and saline ammonia provides a measurement of the organic nitrogen content of the FS, and its value as a soil conditioner or fertilizer.
Total nitrogen Percentage by weight
Total nitrogen, together with measurements of free and saline ammonia, provides an indication of what proportion of the nitrogen in FS is organic nitrogen.
Total phosphorus Percentage by weight
The total phosphorus provides a measurement of value of the FS, especially if dried, as a soil conditioner or fertilizer.
TS
(Total solids) mg/L
This provides an indication of the ratio of water to solids. Even for sludges that appear dry, there is likely to be a high water content.
SS
(Suspended solids) mg/L
These are the solids that can be removed physically. The remaining solids will be dissolved within the water contained in the sludge.
Helminth eggs (viable) Number/L
Helminth eggs are the eggs of parasitic worms. They can survive for long periods, and have greater health significance than bacteria if sludge is to be used in agriculture.
E.coli Number/100 mL
E.coli are indicator organisms, the presence and concentration of which indicate the likelihood of fecal pathogens being present.
Calorific value MJ/kg TS The calorific value is a measure of the energy that can be obtained from using FS as a fuel.
As explained below, samples for analysis should be taken from pits or septic tanks at the time
when emptying is due to take place, during discharge from tanks/ containers on arrival at
treatment facilities or disposal sites and after treatment (primary and/or secondary stages).
Additional samples may also be appropriate from any transfer stations used in the city.
Test methods The preferred tests and test methods to be followed are summarised in the Table:

FSM global study - Data collection instruments
19
Table 9 Preferred tests and test methods to measure characteristics
Parameter Units * Recommended Test method
During removal
During discharge
After treatment
COD
(Chemical Oxygen demand)
mg/L Using any one of the APHA/AWWA Standard Methods (5-6 to 5-9).
Required Required Required
BOD
(Biological Oxygen Demand)
mg/L Using any one of the APHA/AWWA Standard Methods (5-1 to 5-3).
Required Required Required
NH4 –nitrogen
(free and saline ammonia)
Percentage by weight
Using a Hach spectrophotometer (such as a DR 2000 or DR 3900). The Kjeldahl method is an acceptable alternative.
Required Required
Total nitrogen Percentage by weight
Using any one of the APHA/AWWA Standard Methods (5-1 to 5-3).
Required Required
Total phosphorus
Percentage by weight
Using any one of the APHA/AWWA Standard Methods (5-1 to 5-3).
Required Required
TS
(Total solids) mg/L
Using the APHA/AWWA Standard Method (2-54).
Required Required Required
SS
(Suspended solids)
mg/L Using the APHA/AWWA Standard Method (2-56).
Required Required Required
Helminth eggs (viable)
Number viable eggs/L
Direct microscopic examination, following concentration of eggs by flotation or sedimentation and 3 weeks of incubation.
Required Required
E.coli Number/ 100 mL
Membrane filtration using a suitable nutrient medium such as M-FC broth. (Membrane Lauryl Sulphate broth is another option.)
Required Required
Calorific value MJ/kg TS
Using a bomb calorimeter to measure calorific value, using benzoic acid as a standard for calibrating the heat capacity.
Required
* For fecal sludge, weights may be used instead of volumes, depending on whether the fecal sludge behaves as a solid or liquid.
3.4.3 Sampling
Within each city the following numbers of fecal sludge samples and sampling positions are recommended;

FSM global study - Data collection instruments
20
Observation of the fecal sludge from each of five separate pits or tanks shortly during removal from pits or tanks to determine the physical appearance and characteristics of the fecal sludge, and whether it will behave as a fluid or a solid. The pits or tanks should be selected following discussions with a range of pit emptiers, with the aim of collecting samples from a variety of pits or tanks from different income groups. They would only be from slums and informal settlement areas in sub-sample B, but would not necessarily overlap with our PSUs, with the priority being cooperation of the service providers.
One 1 litre sample from each of the same five separate pits or tanks being emptied. (Each sample to be divided to provide duplicate results.)
A good mixed composite sample, consisting of three 1 litre samples, preferably from five different trucks, vehicles or vessels, at the inlet structure of the fecal sludge treatment facility, during discharge of fecal sludge. The first 1 litre sample should be taken at the start of discharge, the second approximately mid-way through discharge, and the third towards the end of discharge. (Each sample to be divided to provide duplicate results.)
Five 1 litre samples, collected at different times during one day, from the outlet or following the final stage of each treatment facility. (Each sample to be divided to provide duplicate results.)
It is recommended that, when collecting samples during discharge of fecal sludge from
vehicles, some fecal sludge is collected in a bucket, and a 1 litre sample taken from the
bucket.
3.4.4 Fieldwork
Each sample collection team should consist of two people from the survey team, and including
a sanitation specialist, to make observations, take samples, and record details. Samples
should be collected during the household survey period, when information can be collected to
identify households for which the pit or tank is about to be emptied. The exact timing for
sample collection will be determined by the survey teams in discussion with pit emptiers.
Prior to collecting samples, the city teams need to identify suitable certified laboratories
capable of conducting the various tests required. Arrangements need to be made with the
laboratory or laboratories about:
identification of samples;
costs for sample analysis;
delivery of samples;
storage of the fecal sludge in appropriate conditions prior to analysis;
confirmation of the sample size required;
the choice of sample bottles to be used; and
how and when results will be provided.
In addition, each city team needs to purchase suitable sterilized bottles for transport and
storage of fecal sludge samples, labels for identification of sample bottles, and protective
clothing (gloves, eye-protectors, masks, overalls and boots) for each member of the sample
collection teams. Sample collection teams need to receive some basic training, and gain
practical experience, in how to collect representative samples safely at each stage.

FSM global study - Data collection instruments
21
Quality control and risk management
To minimise risks to the members of the sample collection team, each team member should
wear the protective clothing provided (gloves, eye protection, mask, overalls and boots).
Samples should be placed in sterile and secure sample bottles, correctly labelled for
identification. After collection, samples should be stored at below 4°C and analysed within 4-6
hours. If the time between collection and analysis exceeds 6 hours, the report of the analysis
should include information on the condition and duration of sample transport.
Each sample should be divided to provide duplicate results. Analyses of duplicate samples
are used to validate the precision, variation and repeatability of the analytical methods within a
laboratory. Results from the duplicate samples can be compared, and explanations sought for
any significant inconsistencies in the results obtained. Preparation of duplicate samples also
provides reassurance that a back-up sample is available in the event that one of the
duplicates is accidentally spilled, contaminated, or mistakes are made during analysis.
Data Management and analysis
Results from analysis of samples should be compiled using Excel spreadsheets. A separate
spreadsheet page should be used for data at each stage within a city. All observation results
would be on one spreadsheet page; all results for FS samples taken during emptying of a pit
would be on another spreadsheet page, etc.
All sampling points should be readily identifiable, with unique identification labels and
recorded GPS coordinates. If the laboratory has not been used before, it may be worth
sending initial samples for analysis to check that the laboratory staff and facilities are familiar
and able to handle all of the required procedures.
3.5 Key Informant Interviews
3.5.1 Introduction and objective
Key informant interviews (KIIs) are the way in which primary information will be sought to
address key questions about how both the ‘enabling environment’ and the operating
environment affects FSM services (past, current and future). KIIs with stakeholders having
responsibility or interest in FSM services at city-level and beyond will allow the enabling and
operating environments to be better understood in relation to the influence within the city, or to
wider spheres of influence – such as State or National legislation.
KIIs are also means to engage stakeholders in other aspects of the research process,
including to:
clarify the purpose, objectives and interests of each stakeholder, in relation to current
FSM services and the likely outcomes of changes to those services;
facilitate further data collection, including: providing specific documents/ ‘grey
literature’, granting access to localities, approving the sampling arrangements,
making contacts with other organizations/ individuals.

FSM global study - Data collection instruments
22
3.5.2 Methodology
KIIs will be held with a range of stakeholders who have a role or interest in FSM services
within the city. In summary, they are likely to include:
City council/ Municipality/ Utility
Government Ministries/ Departments with responsibility for: urban sanitation/ sewerage
(liquid waste), urban solid waste collection, urban water supply, urban planning,
environmental health/ protection, finance, economic development and agriculture.
Service providers (private and/or public) covering: manual and mechanised emptying and
transportation services, public sector operation of FS treatment and disposal sites, private
sector operation of FS end-use sites (including re-use for agriculture and industry)
NGOs and other ‘external’ agencies providing support to FS services. In this context,
‘external’ refers to individuals and agencies that are not service providers but have
interests related to FSM management and service delivery. In addition, key informants
could include those who are not key stakeholders (i.e. those with a direct interest or ‘stake’
in FSM services) but perhaps more ‘neutral’ or ‘objective’ observers of the sector,
including academics or researchers with expertise and relevant knowledge in FSM or, in
some cases, even the media.
Key Government staff: It is likely that key staff within a range of units/ offices with the
Municipality and different Directorates within government Ministries/ Departments will need to
be consulted, to ensure those met are in a position to respond to questions relating to the
different components of the research (and possibly to specific issues within them). Careful
identification and selection of individuals will need to be undertaken, to ensure reliable
information can be sought wherever possible, as well as diverse perspectives if relevant.
Service providers: Service providers will be interviewed as a means to identify both
qualitative and quantitative data relating to the provision of FSM services through the FS
service chain: from containment to end-use/ disposal.
While it would be ideal to interview all service providers operating within the city, up to a maximum of 10 emptiers and a maximum of 5 providers of services for each of the other stages (i.e. operators driving/ managing transport services, treatment/ disposal sites and end-use facilities) may be more realistic. It is likely that manual emptiers – particularly those that operate under informal conditions – will be identified through information gained during household surveys and possibly from secondary reports already conducted in those, or similar, neighbourhoods. Interviews with a range of both formal and information emptiers will be sought.
A combination of open-ended and closed questions can be asked during the interview, to gain better understanding of:
qualitative aspects of the enabling environment, including: quality of services, engagement
with other stakeholders (regulation, reporting procedures), availability of technical options,
cost-recovering mechanisms and supporting facilities.
quantitative aspects of service provision, including: demand, pricing, disposal locations,
obstacles, transport to disposal, volumes, equipment, staffing, investment plans, etc.
Further guidance on stakeholder mapping as a way to inform which questions to ask to which
stakeholders is included in Annex EE.

FSM global study - Data collection instruments
23
Box 1 Discussions or interviews with emptiers and transporters of fecal sludge
Emptiers and drivers of vehicles are not necessarily the same people as the "owners" of those vehicles (who are more likely to be engaged in the interviews). They have different interests, opinions and knowledge, which is often missed during standard research processes.
Interviews (formal or less formal) are to be arranged and held with those directly involved in the emptying and transportation of fecal sludge serving the informal settlements/ slum communities sampled during the data collection. Manual emptiers, as well as those who operate mechanised emptying equipment should be interviewed. Such discussions can help to ensure that all stakeholders are consulted on questions of direct relevance and purpose to the services they provide.
The topics that could specifically be discussed during these interviews are shown in the tables in the Annex.
NGOs and other ‘external’ agencies: A range of ‘external’ agencies may be engaged in
FSM services within the city, such as academic institutions, donors, private investors or
consultants. In this context, ‘external’ refers to agencies that are not service providers, but
have interests related to FSM management and service delivery. They may be well placed to
contribute views on a range of issues affecting FSM services.
More ‘neutral’ key informants – i.e. those without a direct ‘stake’ or interest in FSM – are also
likely to be in a good position to help with an initial stakeholder mapping exercise. This can
both help identify key stakeholders to talk to in subsequent interviews as well as form the
basis to identify which specific components, sub-components and questions can be asked to
which public or private sector stakeholder, on issues where they have particular interest
and/or influence in relation to current and future FSM services.
3.5.3 Sampling
Key informants and stakeholders with different positions and perspectives bring their own sets
of interpretive biases and analysis. For some of the research questions, and particularly in
relation to the political economy analysis, there may be no single absolute truth and difference
of opinion (rather than standardisation) can be useful to understand. Trustworthiness in
interpretation can nonetheless be strengthened by cross-checking – or triangulating – the
views and analysis of different key informants (and focus groups). It is important to remember
that these may include people who might not normally be talked to, in order to ensure multiple
and different perspectives are gathered. It is critical that women are also interviewed and that
gender is recorded on all interview reports.
The total number of interviews required, as well as the range and extent of questioning, will
also be influenced by the availability of current and reliable data from other sources, as well as
constraints on time and resources.
The likely maximum number of interviews required, to gain all information sought, is
considered to be 40 interviews. The actual range of stakeholders and interviewees should be
determined following an initial stakeholder mapping activity and information gained during the
household survey.
The final list of stakeholders and proposed interviews should ensure appropriate
representation from a range of government ministries and service providers, as well as
external agencies. Representation of service providers through the FSM service chain should
reflect the percentage of roles and responsibilities that each plays in FSM for the study city

FSM global study - Data collection instruments
24
(e.g. in a city where manual emptiers are the dominant providers of emptying services, they
must account for the majority of those observed and interviewed during emptying and
transportation procedures; likewise, where private companies carry out mechanised emptying
and transportation services for most areas of the city, they should account for the majority of
providers observed and interviewed during emptying and transportation procedures).
The list of stakeholders may include the types of stakeholder outlined in Table 10, with an
indication of the sampling process.
Table 10 Sampling for different types of stakeholder
Stakeholder Sampling
City council / Municipal authority / Utility Purposive, at beginning (Interview staff from offices of service delivery/ operations and planning/ strategy)
Ministry in charge of urban sanitation and sewerage
Purposive, at beginning (Interview staff from offices of service delivery/ operations and planning/ strategy)
Ministry in charge of urban solid waste Purposive, at beginning (Interview staff from offices of service delivery/ operations and planning/ strategy)
Ministries in charge of urban planning, environmental protection/ health, finance and economic development, agriculture
Purposive, at beginning (Interview staff from offices of service delivery/ operations and planning/ strategy)
Containment SPs - Latrine / septic tank installers
Purposive, based on advice of government key informants and households (i.e. after HH survey)
Emptying/transport SPs - Manual emptiers / tanker truck drivers
Purposive, based on advice of key informants (government, NGOs, individual experts) and households (possibly only after HH survey)
Treatment SPs - treatment plant manager/operator
Purposive, based on advice of government key informants and households (i.e. after HH survey)
End-use/disposal SPs – current re-use market participants, solid waste dump manager
Potential re-use market participants
Purposive, based on advice of government key informants and households (i.e. after HH survey)
External agencies associated with FSM services: e.g. academic institutions, donors, private investors, consultants
Purposive.
In this context, ‘external’ refers to individuals and agencies that are not service providers but have interests related to FSM management and service delivery.
3.5.4 Fieldwork
It is anticipated that one individual consultant, with experience in conducting interviews with a
broad range of stakeholders, will carry out the work. However, it is possible that on occasion it
may be deemed appropriate to have two people involved – one to facilitate the questions and
the other (or both) to take notes.
The length of interviews will vary, but on average may take approximately 1 hour.

FSM global study - Data collection instruments
25
It may help to phase the timing of interviews, to build-up the level of understanding about the
context and extent of FSM services in the City. This will depend to some extent on the existing
experience of the consultant and the existing relationships developed with the stakeholders
involved.
A proposed phasing of interviews, assuming no or little pre-existing knowledge and
relationship with the range of stakeholders, is outlined in the table.
Table 11 Phasing of interviews
1st set External agencies associated with FSM (to also feed into sampling of other sets of key informants and stakeholders)
2nd set City council/ Municipality/ Utility Ministry responsible for FSM (or urban sanitation and sewerage if no specific ownership of FSM services) Ministry responsible for solid waste management
3rd set Ministries responsible for:
urban planning,
environmental protection,
health,
finance and economic development,
agriculture
4th set Emptying / transportation service providers (following household interviews) Treatment plant / end-use / disposal site service providers
At the end of the interviews, if time and resources allow, it would be useful to cross check and
validate initial findings and analysis based on all the interviews to the 1st set of interviewees.
As outlined above, the identification, prioritisation and sampling of respondents (from
government, FSM service providers, etc.), will be based on an initial analysis of institutional
responsibilities and stakeholders using information from more ‘neutral’ FSM sector observers
– e.g. potentially academics, the media, researchers, etc. This will help identify key city (and
other) level stakeholders and the potential perspectives they may have, together with issues in
the FSM service chain that might be relevant to particular stakeholders. Use this analysis to
focus questions for particular respondents appropriately.

FSM global study - Data collection instruments
26
Table 12 External agencies: issues to address during interviews
Component Issue Topics for discussion
Political Economy Analysis (PEA)
- What are considered to be ‘appropriate’ FSM services within the City and how this influences demand
- National/ City level factors affecting FSM services - Institutional factors affecting public and private investment in
FSM services - Institutional responsibilities for, and relationships affecting,
FSM services - Stakeholders' interests, incentives and influence support/
constrain investment in FSM - Decision-making processes that support/ constrain
appropriate FSM
Mapping customer demand
What affects existing demand
- Actions taken by government in relation to demand creation (promotional/ educational campaigns, subsidies, etc.), stimulating the private sector, enforcement of policy and standards
Intervention options
Potential solutions
- Requirements to address improved services – given current and future scenarios and FS characteristics – through the service chain
Effective options
- What has previously worked well, or not worked well (in the community)?
- Satisfaction with current end-use options
Quality control
KIIs should follow commonly adopted good practice, including:
pre-arrange interviews, to ensure the most appropriate interviewee is available;
select questions to ask, and ask them in such a way, that the interviewee is in a position to answer ;
interviews may be voice-recorded, but only with prior knowledge and permission of the interviewee;
follow-up the interview, to obtain further detail/ clarity if appropriate;
provide a write-up of the interview, if requested.
If the interviewee invites other participants to join the interview, be aware of their
appropriateness to the subject matter and any possible disruption this may cause to the
exchange of information. If they have valid contributions to make to the interview, incorporate
these into the notes and clearly identify in the write-up who else participated in a broader
discussion, or observed the interview.
Comprehensive notes should be captured electronically – either during the interview itself
(typed directly into word document or similar), or within 24 hours of interview.
Key points relating to the main topic areas of the interview should be identified and
summarised, as soon as possible following the interview.

FSM global study - Data collection instruments
27
Ethical considerations The following points should be addressed, to ensure the collection of data meets with ethical standards:
State the purpose of the interview and use of findings, before starting.
Offer anonymity – and ensure it is followed if requested.
Only use a voice-recorder with prior knowledge and permission of the interviewee.
Gain verbal permission to start the interview and note this on the interview write-up.
Allow the interviewee to “pass” on specific questions.
Provide a write-up of the interview, if requested.
Indicate next steps, or possible follow up, if appropriate. Data Management A separate word document should be developed for each interview write-up. The document file name and any original interview forms (hand-written) should have a unique code that identifies the document. It could use for example, a coding for the City, type of Stakeholder (e.g. Government/ Private Sector/ NGO/ Donor), if appropriate the Organization interviewed (name of the institution, not the individual), date of the interview and, if necessary required a unique number to distinguish the document from others. Data Analysis
This will vary greatly depending on the objectives of the study. If developing a prognosis for
change, research questions will need to be developed before commencement of data
collection. Analysis would then aim to use the collected data to answer those questions. For
example, there may need to be an initial institutional mapping of responsibilities or a
stakeholder mapping of interests and influence in relation to FSM, undertaken early in the
process..
After the completion of all the interviews, the mappings can be revisited to ensure any
presentation or summary they present is an accurate reflection of the information from all
respondents (i.e. not just the initial information from external actors / agencies, or from a
particular set of other stakeholders).
A further institutional responsibility mapping should be completed to show the responsibilities
as they are actually undertaken – i.e. not the theoretical formal responsibilities but the
stakeholders who actually takes responsibility for FSM at the local level. This should also
include any stakeholders who do not have formal responsibilities but in practice undertake
particular activities of tasks.
Further stakeholder analysis should also be completed in more detail based on the
information from the whole range of key informants. It might be necessary to note and include
different perspectives in this in order to ensure readers are aware of any multiple perspectives
and the rational for each.
Process mapping can also be used to outline both how processes are meant to be undertaken
or implemented in theory, and how they actually occur in practice, together with reasons why
this is the case.

FSM global study - Data collection instruments
28
3.6 Focus Group Discussions
3.6.1 Introduction and objective
The objective of Focus Group Discussions (FGDs) with residents of informal settlements/ slum
communities is to gather qualitative data that will compliment, validate, or perhaps challenge
responses made during the household survey. Questions will focus on obtaining information
relating to household practices (particularly identifying the practices of “others” as individuals
are reluctant to talk honesty about their own, or their family, practices), service levels, past
interventions, risks and other issues associated with FSM services that affect their community.
Topics to be covered during the FGDs and a proposed set of questions to be asked are
included in Annex FF.
Gender-disaggregated groups and information is required – which must be accounted for
during planning, running and collecting results from the FGDs.
3.6.2 Methodology
A draft FGD guide (including proposed questions to be asked) is included inAnnex F. The
questions should be adapted and reworded into appropriate vocabulary, as well as being
translated into the appropriate language to suit the local context and aid understanding.
Once translated, the questions should be pre-tested. This allows for the suitability and
acceptability of questions to be checked – as well as ensuring those running the FGDs clearly
understand the nature of each question. Appropriate modifications to the FGD questions can
then be made.
Team members must have appropriate experience and skills to both facilitate and write-up the
discussion during the FGDs (anticipated to be done separately by a team of 2 – see next
section). In most countries, women interviewers are required to interview women-only
FGDs, to enable women to talk more freely, about for example the issue of disposal of
menstrual hygiene products, who makes decisions on sanitation within the household, etc.
Appropriate approvals to conduct the FGDs should be sought, prior to running them. This will
be with individuals invited to participate as a minimum, but may also require approval from
officials representing affected communities and households (if deemed necessary).
3.6.3 Sampling
It is proposed that up to 10 FGDs are held with households from 10 randomly selected PSUs.
These may all be from ‘sub-sample B’ PSUs (from the total of 30 PSUs) which have been
purposively sampled from informal settlements / slum areas in the city, or from PSUs in both
sub-samples A and B.
Table 13 Sampling for focus groups
Activity Nº Sampling
FGDs with residents of slum/ low-income/ informal communities only, or from PSUs in sub-samples A and B
10
Purposive, accounting for gender-segregation of participants as a minimum (A small number of these FGDs may be conducted with users of non-networked sanitation in higher and middle-income areas)

FSM global study - Data collection instruments
29
A range of perceptions, priorities, practices and challenges will face different residents,
depending on various factors. FGDs are a means by which participants can be selected for a
specific reason, as a way to help draw-out from the group issues particularly affecting different
‘types’ of residents in informal settlements.
As a minimum, at least half of the FGDs should be gender-segregated, to allow responses to
be disaggregated by gender. Other groups may be focused around different socio-economic
factors, to suit the characteristics of the population within the PSUs. For example:
- Vulnerability: all participants are elderly, disabled, or less able-bodied
- Household characteristics: all participants are tenants, or all are owner-occupiers,
or all are landlords
- Presence of a household latrine: all participants own a private household latrine, or
all manage a latrine that is shared by a number of families
- Use of shared, community, community or public toilets on a daily basis.
- Use of service providers for emptying: all participants have their latrines emptied by
manual operators, or all rely on mechanised services
- Type of latrine: all participants have simple pits, or all have septic tanks
3.6.4 Fieldwork model
FGDs can be run by teams of two people. One person will facilitate the discussion, while the
other person takes notes and observes non-verbal communication. Both team members
should have previous experience and suitable skills in running and/or documenting FGDs, as
well as technical knowledge in urban sanitation.
FGDs should only take place once household surveys and observational instruments have
been conducted, so that relevant individuals or groups can be identified and invited to
participate. Any ‘group selection’ would need careful discussion and agreement in advance, to
ensure it is appropriate and will be effective to the needs of the study.
FGDs should take place in a convenient, quiet and comfortable location for participants. The
availability and accessibility of women and other vulnerable groups must be considered when
planning all locations and times at which to hold the FGDs. FGDs typically last an hour or
more but the duration of each discussion may vary depending on the dynamic of the group
and number of participants. Participants should be notified of the expected duration and the
facilitator should ensure not to run over this time.
Focus groups are typically 5-10 participants however researchers need to anticipate likely ‘no-
shows’ and recruit accordingly, aiming for no more than 10 participants.
Quality control and risk management
The management of FGDs should follow commonly adopted good practice, including:
- pre-plan: select and invite the right participants;
- set an appropriate venue, time and duration;
- (re-) explain the purpose of the FGD at the start and gain approval from participants to
continue;

FSM global study - Data collection instruments
30
- seek agreement of ground rules with participants (one person speaks at a time,
everyone’s views are important, there are no right or wrong answers, etc.);
- only voice-record the FGD with prior knowledge and granted permission of ALL
participants;
- allow participants to opt-out or leave at any time;
- allow everyone the opportunity to participate and no-one to dominate;
- summarise key messages received with participants before ending;
- re-state what will happen to the data they have supplied.
As well as direct questioning, a range of participatory tools activities could be considered, to
facilitate good discussion during FGDs. These include: pocket-chart voting, mapping, buzz-
groups, using pictures/ diagrams, story-telling, matrix-ranking, process mapping, etc. Be
aware however that these activities take more time, need to be planned in advance and
careful facilitation to make them effective. A wide range of guidelines and notes are available
to help select appropriate activities.
Comprehensive notes should be captured electronically – either during the FGD itself (typed
directly into word document or similar), or within 24 hours of FGD. Where different languages
are used for the group discussion, note-taking and final write-up, the team needs to have
adequate language skills to ensure the quality and meaning of information being said,
captured and reported is maintained through the process.
Ethical considerations The important ethics issues related to this study are described below. Informed voluntary participation: Informed oral consent must be obtained from participants before FGDs are run. Team members and FGD participants are to be informed about the purpose, methods, risks, benefits and intended possible uses of the FGD results. Right to refuse or withdraw: The participants will be informed that they are free to leave the FGD at any point, or may refuse to answer any questions. They will also have the right to ask questions at any point before, during or after the FGD is completed. Confidentiality and privacy: No personal identifiers will be used in any form of reporting or dissemination. Personal identifications will be linked with a unique identifier (e.g. id code) and kept securely. No information will be published that could identify the respondents. Paper copies of FGDs will be stored for three years in a secure location; only the study team should be able to access them. Confidentiality cannot be guaranteed as it is a group setting but participants are requested not to disclose details of what was discussed. Risks and benefits: The risk of participation in the FGD is considered minimal as there will be no collecting of any sensitive information or biological samples. The respondents will not be directly benefited by participating, however the information that they will provide us may give some important information to the policy makers to improve the overall water, sanitation and hygiene condition of their country and they may eventually have an indirect benefit from that. Payment: There will no compensation payment to the participants and nor will they have to pay us to participate in the study. FGDs should be held in the target PSU to avoid any participant transport costs.

FSM global study - Data collection instruments
31
Data management and analysis
All details relating to the FGD, together with the discussion during each FGD, will be
adequately recorded by the note-taker. This may be done in hard copy or soft copy format.
A word document is to be prepared using a reporting template, to consistently capture the
significant issues raised during the FGDs against the main topic areas. This write-up should
include, where relevant, quotations, indication of strength of feeling around certain topics
(identify by, for example, a show-of-hands, or secret ballot), any ranking of significance of
issues conducted during the FGD.
All word documents are to be allocated a unique identification name/label that will clearly
identify the location of the FGD and nature of the group. Copies of original FGD write-ups (in
soft and/or hard copy) must be kept securely throughout the duration of the study.

FSM global study - Data collection instruments
32
Annex A Household Survey questionnaire
[This Annex contains the generic household survey questionnaire used in the five-city study. It was
adapted to each city. Certain key questions which will definitely need adaptation are flagged in this
annex, with discussion of key things to think about.]
Diagnostics for Fecal Sludge
Management Services in Urban Areas
HOUSEHOLD SURVEY
Head of Household Name _______________________________________________________________ Address (Complete) ____________________________________________________________________ _____________________________________________________________________________________
Survey Component
PSU number HH Number
1
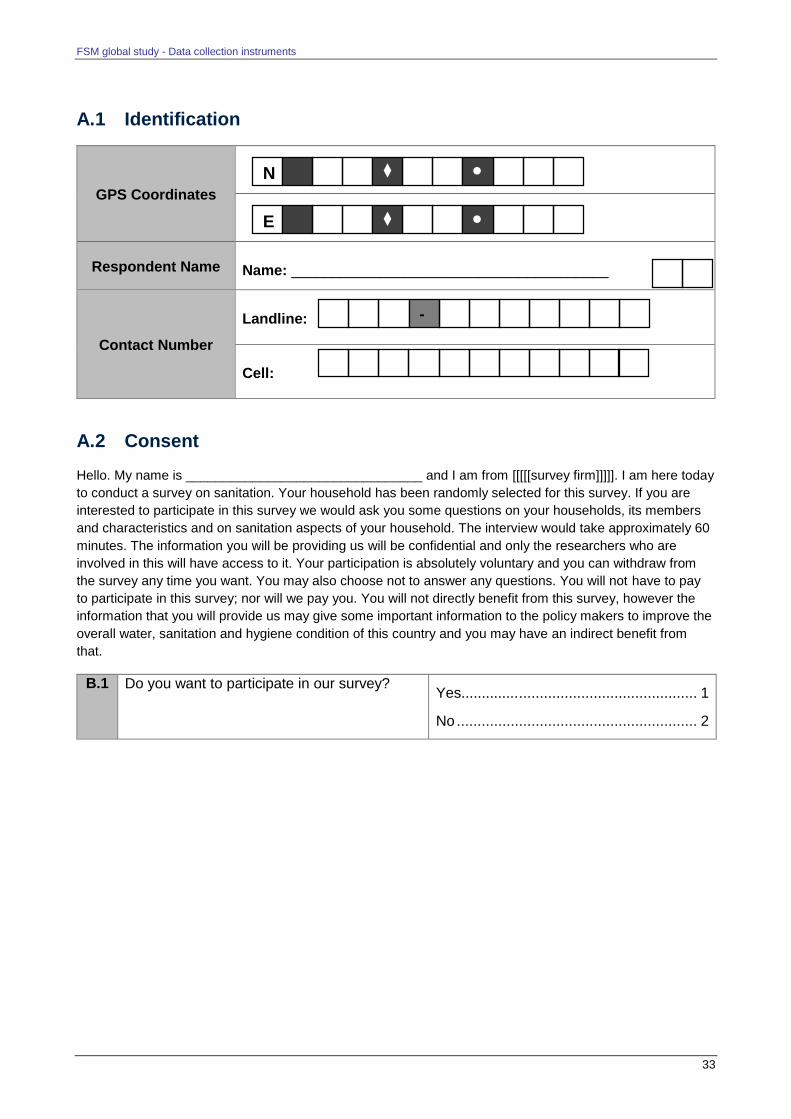
FSM global study - Data collection instruments
33
A.1 Identification
GPS Coordinates
Respondent Name
Name: _______________________________________
Contact Number
Landline:
Cell:
A.2 Consent
Hello. My name is ________________________________ and I am from [[[[[survey firm]]]]]. I am here today
to conduct a survey on sanitation. Your household has been randomly selected for this survey. If you are
interested to participate in this survey we would ask you some questions on your households, its members
and characteristics and on sanitation aspects of your household. The interview would take approximately 60
minutes. The information you will be providing us will be confidential and only the researchers who are
involved in this will have access to it. Your participation is absolutely voluntary and you can withdraw from
the survey any time you want. You may also choose not to answer any questions. You will not have to pay
to participate in this survey; nor will we pay you. You will not directly benefit from this survey, however the
information that you will provide us may give some important information to the policy makers to improve the
overall water, sanitation and hygiene condition of this country and you may have an indirect benefit from
that.
B.1 Do you want to participate in our survey?
Yes.............. ........................................... 1
No .......................................................... 2
N
E
-

FSM global study - Data collection instruments
34
A.3 Survey Information
C.1 Interviewer
Name ___________________________________ Code
Signature ________________________________
C.2 Date of
Interview Day Month Year
C.3 Interview Start
Time In 24 Hours Format _____:_____
C.4 Supervisor
Name ___________________________________ Code
Signature ________________________________
C.5 Data Editor Name ___________________________________ Code
C.6 Data Editing
Date Day Month Year
C.7 Data Entry Name ___________________________________ CODE
C.8 Data Entry Date Day Month Year
2014
1420
2014

FSM global study - Data collection instruments
35
D – Household members
1. Please list the people who usually live and eat in your household and their ages, starting from the youngest child.
age Number of persons
<1
1-5
5-15
15-50
>50
2. What is the gender of the household head?
a. Male – the respondent is head
b. Male – not the respondent
c. Female – the respondent is head
d. Female – not the respondent
3. What is the highest level of education of the household head?
a. No formal education 00
b. Class 1 01
c. Class 2 02
d. Class 3 03
e. Class 4 04
f. Class 5 05
g. Class 6 06
h. Class 7 07
i. Class 8 08
j. Class 9 09
k. Class 10 10
l. Class 12 12
m. Graduate 13
n. Masters 16
o. Don’t know 98
4. (Enumerator explains what diarrhoea is, using local terms) Have children under five in the household had diarrhoea in the past 2 weeks?
# Circle answer
Child A Yes No n/a
Child B Yes No n/a
Child C Yes No n/a
Child D Yes No n/a

FSM global study - Data collection instruments
36
5. For any of these occurrences of diarrhoea in children in the last 2 weeks, did you seek advice or treatment from any source?
• Yes, hospital or health centre
• Yes, shop or pharmacy
• Yes, traditional healer
• No
6. (Enumerator explains what an episode is) Have you yourself had any episodes of diarrhoea in the past 2 weeks?
• None
• One
• Two
• Three
• More than three
7. How much did you spend in total on treatment for diarrhoea for all household members during the last 2 weeks, in each of these categories?
Fees Medicines Transport to facility
Expenditure in local currency
8. Do you consider that any household members have disabilities?
a. Yes
b. No --> skip
9. How would you describe the main disability of the most disabled household member?
c. 01 = Hearing impairment
d. 02 = Deafness
e. 03 = Visual impairment
f. 04 = Blindness
g. 05 = Mobility Impairment
h. 06 = Housebound
i. 07 = Upper Limb Impairment
j. 08 = Speech Impairment
k. 09 = Learning Difficulties
l. 10 = Mental Impairment

FSM global study - Data collection instruments
37
E - Household Characteristics
[Many of these variables in this section are used in the construction of a wealth index (i.e. wealth quintiles) if such an analysis is required. The variables used in the most recent Demographic and Health Survey should be taken as a guide, and the same methodology ideally followed as the gold standard.]
E 01 How many rooms in this household are used for sleeping?
Enter the Number of Rooms that are used for Sleeping
E 02 What kind of building does the household occupy?
private residence (single-storey) ..... 1 private residence (multi-storey) ........ 2
shared residence (in single-storey building) ........................................... 3
shared residence ( in multi-storey building) ........................................... 4 Other (specify) ................................. 5
E 03 Is this house/residence owned, rented, rent-free, or mortgaged by a member of the household?
Owned ............................................. 1
Rented ............................................. 2
Rent Free ......................................... 3
Mortgaged ........................................ 4
Others (Specify) .............................. 7
E 04 If rented, how much is the rent, calculated per calendar month? WORK IT OUT IF NECESSARY
Don’t know......................................9998
E 05 How long have you/ members of your household been living on this location/plot?
Record in Completed Years
If under one year write 00
E 06 What is the main material of / on the floor in the main room? RECORD OBSERVATION
Earth/ sand/ mud ............................ 01
Stone chips in concrete (terrazzo) .. 02
Ceramic tiles .................................. 03
Marble ............................................ 04
Cement .......................................... 05
Carpet ............................................ 06
Bricks ............................................. 07
Mats ............................................... 08
Others (Specify) ............................. 77
E 07 What is the main material of the roof? RECORD OBSERVATION
Thatch/ bamboo/ wood/ mud .......... 01
Cardboard/ plastic .......................... 02
Iron sheets/ asbestos ..................... 03
T-iron/ wood/ brick .......................... 04
Reinforced brick/ cement ................ 05
Others (Specify) ............................. 77

FSM global study - Data collection instruments
38
E 08 What is the main material of the walls? RECORD OBSERVATION
Mud/ stones ................................... 01
Bamboo/ stick/ mud ........................ 02
Unbacked bricks/ mud ................... 03
Plywood sheets .............................. 04
Carton/ plastic ................................ 05
Stone blocks .................................. 06
Baked bricks .................................. 07
Cement blocks/ cement .................. 08
Tent ................................................ 09
Others (Specify) ............................. 77
E 09 Does your household have the following?
Item Yes……No
a. Electricity 1 ..........2
b. Radio 1 ..........2
c. Television 1 ..........2
d. Refrigerator 1 ..........2
e. Telephone (Landline) 1 ..........2
f. Room Cooler 1 ..........2
g. Air Conditioner 1 ..........2
h. Washing Machine 1 ..........2
i. Water Pump 1 ..........2
j. Bed 1 ..........2
k. Chairs 1 ..........2
l. Cabinet 1 ..........2
m. Clock 1 ..........2
n. Sofa 1 ..........2
o. Sewing Machine 1 ..........2
p. Camera 1 ..........2
q. Personal Computer 1 ..........2
r. Watch 1 ..........2
s. Bicycle 1 ..........2
t. Motorcycle / Scooter 1 ..........2
u. Animal Drawn Cart 1 ..........2
v. Car 1 ..........2

FSM global study - Data collection instruments
39
w. Truck 1 ..........2
x. Boat with Motor 1 ..........2
E 10 What type of fuel does your household mainly use for cooking?
Electricity .............................................. 01
Cylinder gas .......................................... 02
Natural gas ........................................... 03
Solar power ........................................... 04
Biogas ................................................... 05
Kerosene .............................................. 06
Charcoal ............................................... 07
Wood .................................................... 08
Straw/ Shrubs/ Grass............................ 09
Agricultural crop .................................... 10
Animal dung .......................................... 11
No food cooked in household ............... 12
Others (Specify) .................................... 77
E 11 Does any member of this household have a bank account?
Yes................................................... 1
No .................................................... 2

FSM global study - Data collection instruments
40
F - Use of water and sanitation infrastructure
1. What is the main source of drinking-water for members of your household? o Piped into dwelling o Piped to yard/plot o Public tap/ standpipe o Tube well/ borehole o Protected dug well o Unprotected dug well o Protected spring o Unprotected spring o Rainwater collection o Bottled water /gallon container and dispenser o Refilled bottled water o Cart with small tank/ drum o Tanker-truck o Surface Water (river, dam, lake, pond, stream, canal, irrigation channels) o Others (specify)
[F1 should ideally follow the latest guidance of the WHO/UNICEF Joint Monitoring Programme, adapted to the country if necessary but still allowing combination or separation of categories so as to be reconciled to the JMP categories. This is crucial for ease of comparison to other data (e.g. DHS, MICS, census)]
2. On average, how long does it take to travel to this water point? [Record time to travel (one way) to WP in minutes]
[skipped if on premises]
3. On average, how long do you / the household member have to wait in the queue to get water? [Record waiting time in minutes] [skipped if on premises]
4. What kind of toilet facility do members of your household usually use?
o Automatic cistern Flush o Pour/manual flush o Ventilated improved pit latrine o Pit latrine with slab o Pit latrine without slab/open pit o Composting toilet o Bucket o Hanging toilet/hanging latrine o Others (specify) o No facilities or bush or field, --> skip to xx
[See note on question F1. In addition, skipping patterns are to be devised by the survey designer in each city]
5. Where do the contents of this toilet discharge to? o Piped sewer system o Fully-lined septic tank with soakaway o Fully-lined septic tank with overflow to drain / open ground / other o Partially-lined septic tank (bottom and/or sides unlined) o Fully-lined pit o Pit with unlined bottom or sides

FSM global study - Data collection instruments
41
o Directly to open drain / ditch o Directly to sea, lake or river o Directly to open ground o Others (specify) o DK
[F5 is the most crucial question in the survey. It aims to establish two things: (i) whether the technology is “emptiable” (e.g. toilets which discharge directly to drains do not contain excreta and are not emptiable), and (ii) whether the technology safely contains excreta or allows it to leach into the environment via unlined bottom/sides or an overflow. It is highly context-specific as to which categories are seen as acceptable/unacceptable in a given city, depending on many variables (e.g. population density, groundwater levels, whether anyone is drinking groundwater etc.)The categories used will be highly context-specific, depending on the prevalent septic tank or pit technologies in the city. It will be important not to have too many categories, however, to avoid confusing the enumerators, who are unlikely to be sanitation experts. Extensive debate within the study team should take place about how different categories are to be interpreted, with use of pictures, before the enumerators are trained.]
6. At home, where do you dispose of waste water from kitchen, bathing and/or laundry? a. Piped sewer system b. Fully-lined septic tank with soakaway c. Fully-lined septic tank with overflow to drain / open ground / other d. Partially-lined septic tank (bottom and/or sides unlined) e. Fully-lined pit f. Pit with unlined bottom or sides g. Directly to open drain / ditch h. Directly to sea, lake or river i. Directly to open ground j. Others (specify) k. DK
[this should be the same categories as the previous question]
7. How are the stools of children < 3 years usually disposed of? o Child used toilet/latrine o Put/rinsed into toilet or latrine o Put/rinsed into drain or ditch o Thrown into garbage o Buried o Left in the open o Others (Specify) o No Child under-3 / Don’t Know
G – Use of the toilet
1. Consider the toilet you mentioned in the last section, do you share this toilet with other households?
o Yes o No o Open Defecation --> skip
2. How many other households share this toilet?
o [enter number] o DK

FSM global study - Data collection instruments
42
3. How many people use this toilet regularly?
o 1-5 o 6-10 o 11-15 o 16-20 o 21-30 o >30 o DK
4. Can any member of the public use this toilet?
o Yes o No
5. Where is this toilet located?
o Inside the household or compound o Outside the household or compound
6. Do you have to pay to use this toilet? o No --> skip o Yes, pay per use (public) o Yes, weekly payment (communal not public) o Yes, monthly payment (communal not public) o Others (specify)
7. How much do you pay in this frequency?
[Insert number]
8. How long does it take on average, to use the toilet (walk there, queue, use, walk back)?
o [insert time in minutes]
9. How many times do you do this per day? o [insert number]
10. Who manages this toilet?
o This Household
o Neighbour
o Landlord
o NGO / CBO
o Private provider
o Government
o Nobody in charge
o Other
o DK
11. Enumerator - place the toilet in one of these categories based on the answers
o On plot – Household private --> carry on
o On plot – Shared --> carry on
o Off plot – Communal --> skip to X o Off plot – Public --> skip to X

FSM global study - Data collection instruments
43
H – Usability and observation
1. Is it currently operational / useable? o Yes o No
2. If no, why is it not operational / useable?
o Full / waiting to be emptied
o Collapsed (fully or partially)
o Blocked
o Other o DK
3. May I see the toilet?
o Yes o No --> skip o Public/neighbour’s toilet --> skip
4. OBSERVATION (ask Q if not possible) – Is the toilet operational / useable?
o Yes o No --> skip to xx
5. OBSERVATION (ask Q if not possible) – Does it have a water seal? o Yes/no
6. OBSERVATION (ask Q if not possible) – Does it have a cleanable slab? o Yes/no
7. OBSERVATION (ask Q if not possible) – What is the material of the superstructure?
o Brick – or other permanent material o Wood / bamboo / cloth – or other semi-permanent materials o No superstructure
8. OBSERVATION (ask Q if not possible) – Does it have a roof?
o Yes/no
9. OBSERVATION (ask Q if not possible) – Does it have a curtain, door or other materials that provides privacy?
o Yes/no 10. OBSERVATION (ask Q if not possible) – Is the floor or slab contaminated with faeces
or urine? o Feces only, or feces and urine, visible o Urine only visible (no feces) o No feces or urine visible
11. OBSERVATION (ask Q if not possible) – Can emptying equipment get access?
o Poor access, only accessible to hand-carried emptying equipment o Reasonable access for small (manual or mechanised) emptying equipment o Good access for medium/large size (mechanised) emptying equipment
12. OBSERVATION (ask Q if not possible) – Is there an access point/hatch for emptying? o Yes, purpose built hatch for easy access o Yes, but squatting plate must be removed o No, slab must be broken for access

FSM global study - Data collection instruments
44
[for toilets no longer in use] 13. OBSERVATION (ask Q if not possible) – has the pit been sealed and covered?
o Yes o No o DK
I - Satisfaction and planning 1. Please rate your satisfaction level for the following aspects of the sanitation facilities of
your household?
Very satisfied Satisfied Dissatisfied
Very dissatisfied
Quality of construction
Ease of access
Privacy
Cleanliness
2. Are you planning to improve your sanitation arrangements in the next 1 year?
o No, we have no plans o Yes, plan to build a new toilet o Yes, plan to upgrade a toilet o Yes, others (Specify) o DK
3. What is the biggest challenge to improving your sanitation arrangements in this way?
o Lack of finance o Lack of knowledge on how to do this o Lack of interest of other household members o Lack of skilled people to construct o Landlord does not want to invest o Others (Specify) o Don’t Know
4. How many years ago was this toilet built?
o [Enter Number of Years] o DK
5. If your household spent money to build the toilet, how much did you spend at the time
when it was built? (include materials and labour) o [Enter amount in local currency] o No expenses o DK
J – Payment for other services
1. Do you pay for your water supply? o Yes o No --> skip o DK
2. Whom do you pay for water?
o Local government

FSM global study - Data collection instruments
45
o Utility company o Standpipe manager o Tanker truck manager o Water vendor o Neighbour o Others (Specify)
3. How often do you pay for water?
o Daily / On delivery o Weekly o Monthly o Quarterly o Biannually o Yearly o Others (Specify)
4. How much do you usually pay for water in this frequency?
o [Enter Amount in Local Currency] o [if on delivery, e.g. by the jerry can, then put the total paid per day, on average]
5. How would you rate the cost of the water for your household?
o Very cheap o Inexpensive o Expensive o Very expensive o DK/ No comment
6. In the last year, did your household have expenses to pay in relation to the toilet
discussed in the previous section? o Yes o No o DK
7. What were the expenses for?
o Repairs to toilet bowl / mechanism / plumbing / slab o Repairs to toilet room / superstructure o Fixing drainage problems o Emptying of septic tank/pit o Others (specify) o DK
8. How much were total expenses during the last 12 months?
o [amount in local currency]
9. What is the primary means of solid waste disposal for your household? o Stored at household and collected by a company, the community or others o Stored at a public place and collected by a company, the community or others o Kept within the compound – put in a hole o Kept within the compound – put on the ground o Kept within the compound – put into pit latrine o Burned within or outside the compound o Taken outside the compound to a disposal site by household members o Taken outside the compound to river/stream/canal/pond o Taken outside the compound to gutter/ditch/along the road o Taken outside premise elsewhere

FSM global study - Data collection instruments
46
10. If any, how much do you pay per month for solid waste collection? o [enter local currency] – put zero if nothing o DK
11. Coming back to your toilet, we have questions about where the faeces and urine go,
and pit/tank emptying – can you answer these or can someone else?
o Me --> continue to next section
o Someone else who is nearby --> go and find the person accompanied by
respondent
o Someone else who is not nearby --> END
K – Filling up and emptying 1. Who is now responding?
a. Same respondent b. Neighbour c. Landlord d. Caretaker of building e. Other (specify)
2. If this toilet empties to a pit or septic tank, has it ever filled up?
o Yes o No --> skip o DK --> skip o N/A --> skip
3. In the last 5 years, how many times has it filled up?
o [enter number] o DK
4. Has the toilet ever overflowed?
o Yes o No o DK
5. If yes, what was the reason for this? (circle all that apply)
o Blocked o Flooded with rising water table (from below ground) o Flooded by surface water / storm water (from above ground) o No money to empty o Emptiers not available when needed o Others o DK
6. What did you do when the pit or septic tank filled-up last time?
o Emptied and reused pit/tank o Abandoned and pit/tank unsealed --> skip to xx o Abandoned with sealed cover on pit/tank o Covered and used alternative pit --> skip to xx o Others (Specify) --> skip to xx o DK--> skip to xx

FSM global study - Data collection instruments
47
7. Has the pit or septic tank been emptied in the last 5 years? o Yes o No --> skip to xx o DK --> skip to xx
8. On average, how many years does it take for the emptied toilet to be full again?
o [Enter number, 0 for less than 1 year, 99 for DK]
9. Next time the toilet fills up, what do you intend to do? o Empty by member of household o Empty by private individual or company o Cover and seal pit o Abandon toilet without covering / seal
L - Last time emptying
1. Last time it was emptied, who did the emptying? o Member of household o Neighbour o Informal provider (individual) o Formal provider (company / NGO) o Formal provider (utility) o Others (specify)
2. How was it emptied?
o By hand, using buckets or similar o By hand, using manual pump o Mechanically, using small machine o Mechanically, using tanker truck
3. What was it emptied into? o Directly into drain / water body / field o Into a pit on the compound that is then covered o Into a pit on the compound that is left open o Directly into drum / open container o Directly into machine / tanker
4. Please rate your satisfaction level with that service provider in terms of:
Very satisfied Satisfied Dissatisfied
Very dissatisfied
Price
Overall service quality
Safety
Ease of obtaining service
5. Did you pay for the pit to be emptied? o Yes o No o DK
6. How much did you pay in total?
o [Insert number]

FSM global study - Data collection instruments
48
7. How was the payment calculated?
o Flat rate o Cost per volume removed
8. Did you pay in instalments?
o No, paid full amount o Yes, two o Yes, three o Yes, more than three
9. Was this was a fair price?
o Too high o About fair o Quite cheap
10. Did the emptier face difficulties in getting their equipment to your toilet, such as lack of
space, poor road conditions etc.? o Yes o No --> skip o DK
11. What kind of difficulties did they face? [circle all that apply]
Reason
Street o Lack of space
o Poor road condition
o Night-time working
o Others
Compound o Entrance / gate too narrow
o Lack of space for equipment once inside
o Poor surface conditions
o Night-time working
o Others
Toilet o Distance too far for equipment to reach the toilet
o Access point too small to get equipment into the pit
o Had to break/damage the slab to gain access
o Had to remove/damaged latrine pan, or seat
o Collapsed pit
o Others
A.4 End of Interview
O.1
Interview End Time In 24 Hours Format _____:_____

FSM global study - Data collection instruments
49
O.2
Interview Result
Completed .......................................................... 1
Incomplete .......................................................... 2
Refused .............................................................. 3
No household member at home ......................... 4
Household not found .......................................... 5
Others (Specify) ................................................. 7
O.3
Interviewer’s Comments

FSM global study - Data collection instruments
50
Annex B Observation of service providers
General household information
General household information
City: Location: Date:
GPS coordinates:
Economic status: High-income Type of service
provided: Mechanised
Middle-income Manual
Low-income
Condition of access to the property:
Accessible to hand-carried emptying equipment only
Type of latrine /
containment: Dry latrine with pit
Latrine with septic tank
Reasonable access for small (manual or mechanised) emptying equipment
Pour-flush latrine with pit
WC connected to sewer
Good access for medium/large size (mechanised) emptying equipment
Twin-pit: Other (specify):
B.1 Containment
Risks associated with storage or containment of fecal sludge at the household level
Identifying Code:
City: Location:
GPS coordinates: Date:
Nº Question Response Comment
1 Are there flying or crawling insects (e.g. flies, maggots) in the super structure?
Many insects visible
Only a few insects visible
No insects visible
Other (specify):
DK
2 Are there flying or crawling insects (e.g. flies, maggots) visible outside of the latrine - in the compound?
Many insects visible
Only a few insects visible
No insects visible
Other (specify):
DK
3 Is feces or urine visible on the ground around the latrine?

FSM global study - Data collection instruments
51
Feces only, or feces and urine, visible around the latrine
Urine only visible (no feces), around the latrine
No feces or urine visible around the latrine
Other (specify):
DK
4 Is the pit/ tank/ soakaway covered and the cover slab sealed well?
Not covered
Covered but not sealed well
Covered and sealed well
Other (specify):
DK
5 Is the pit/ tank/ soakaway full, overflowing or allowing waste to leak onto the ground?
Overflowing or leaking
Full, but not overflowing or leaking
Not full or leaking
Other (specify):
DK
6
Is the discharge from the latrine pan contained (e.g. in a pit/ tank/ soakaway), or is there visible discharge in the immediate environment (e.g. on open land in the property, or in an open channel)?
Discharge not contained - visible discharge on the property
Discharge not contained - visible discharge to an open channel
Discharge contained - no visible discharge
Other (specify):
DK
7
Is the connecting pipework blocked or damaged, with signs of effluent leaking into the immediate environment (e.g. on open land in the property, or in an open channel)?
Pipework damaged or blocked and signs of leaking
Pipework damaged or blocked but no sign of leaking
Pipework not damaged or blocked and no sign of leakage
Other (specify):
DK
8 Is there evidence that the septic tank needs desludging?
Septic tank full/ overflowing and in need of desludging immediately
Septic tank not full/overflowing but likely to need desludging soon

FSM global study - Data collection instruments
52
Septic tank not full/overflowing and unlikely to need desludging soon
Other (specify):
DK
9 Is there evidence that the latrine has overflowed before?
Strong evidence of overflow, with excreta still visible
Some evidence of overflow, but excreta not that visible
No evidence of overflow
Other (specify):
DK
B.2 Emptying
Risks associated with removing fecal sludge
Identifying Code:
City: Location:
GPS coordinates: Date:
Nº Question Response Comments
1 Does the emptying procedure leave fresh fecal sludge exposed in the compound?
Getting access results in significant amounts of fecal contamination of the surrounding area
Getting access results in small amounts of fecal contamination of the surrounding area
Getting access does not result in fecal contamination of the surrounding area
Other (specify):
DK
2 How close are the emptying activities to a groundwater source?
Close enough (less than 5 metres) to present a direct risk from any spillages
Close enough (between 5 and 10 metres) to present an indirect risk from any spillages
Far enough (more than 10 metres) to present negligible or no risk, or no source present
Other (specify):
DK

FSM global study - Data collection instruments
53
3
If fecal sludge is not transported away (e.g. it is buried on-site or discharged into a drain), how safely is this done?
Fecal sludge is disposed on-site, with direct exposure (e.g. to an open pit, blocked drain)
Fecal sludge is disposed on-site, with possible re-exposure (e.g. to a partially covered pit, damaged drain, watercourse)
Fecal sludge is disposed on-site, with no direct risk of re-exposure (e.g. to a fully covered/ sealed pit, covered drain)
Other (specify):
DK
B.3 Transportation
Risks associated with transport practices
Identifying Code:
City: Location:
GPS coordinates: Date:
Nº Question Response Comments
1 During the transport of fecal sludge, does sludge spill into the surrounding environment?
Sludge spillage occurs along the route at various times
Slight sludge spillage occurs at specific times (e.g. going down slopes or over rough ground)
No spillage occurs: equipment contains all of the sludge during transport
Other (specify):
DK
2 If spillage occurs, does it contaminate a water source?
Spillage occurs directly into, or immediately next to, a water source
Spillage occurs within 10m of a water source
Spillage occurs more than 10m from a water source
Other (specify):
DK

FSM global study - Data collection instruments
54
3 If spillage contaminates a water source: what type of water source is it?
River
Drain
Well (used as a water source)
Pond
Other (specify):
DK
B.4 Treatment
Risks associated with the treatment process
Identifying Code:
City: Location:
GPS coordinates: Date:
Nº Question Response Comments
1
During discharge or unloading at the treatment works, does the fecal sludge splash or spill onto the surrounding environment?
Splashing or spillage of sludge occurs frequently during discharge or unloading
Splashing or spillage of sludge occurs occasionally during discharge or unloading
Splashing or spillage of sludge does not occur during discharge or unloading
Other (specify):
DK
2 How close are the emptying activities to a groundwater source?
Close enough (less than 5 metres) to present a direct risk from any spillages
Close enough (between 5 and 10 metres) to present an indirect risk from any spillages
Far enough (more than 10 metres) to present negligible or no risk, or no source present
Other (specify):

FSM global study - Data collection instruments
55
DK
3 How close are the emptying activities to a stormwater drainage channel?
Close enough (less than 5 metres) to present a direct risk from any spillages
Close enough (between 5 and 10 metres) to present an indirect risk from any spillages
Far enough (more than 10 metres) to present negligible or no risk, or no source present
Other (specify):
DK
4
Are precautions in place to contain liquid or solid wastes (e.g. leachate or dust) from FS treatment, and to prevent their release into the surrounding environment?
No precautions in place to contain liquid and/or solid wastes, or to prevent their release into the environment.
Some precautions in place to contain liquid and/or solid wastes. Release into the environment may occur.
Precautions in place to contain liquid and/or solid wastes, and to prevent their release into the environment.
Other (specify):
DK
5
Could treatment result in liquid or solid wastes (e.g. leachate or dust) being released into the surrounding environment?
Liquid and/or solid wastes may regularly be discharged into the environment.
Liquid and/or solid wastes may occasionally be discharged into the environment.
Liquid and/or solid wastes cannot be discharged into the environment.
Other (specify):
DK

FSM global study - Data collection instruments
56
B.5 Disposal
Risks associated with disposal sites
Identifying Code:
City: Location:
GPS coordinates: Date:
Nº Question Response Comments
1
If fecal sludge is disposed of without treatment, (e.g. it is buried or discharged into a drain), how is this done?
Fecal sludge is disposed with direct risk of re-exposure (e.g. to an open pit, blocked drain)
Fecal sludge is disposed with possible re-exposure (e.g. to a partially covered pit, damaged drain, watercourse)
Fecal sludge is disposed with no direct risk of re-exposure (e.g. to a fully covered/ sealed pit, covered drain)
Other (specify):
DK
2 Do people, animals or insects come into direct contact with fecal sludge following disposal?
People, animals and insects come into direct contact with fecal sludge
People, animals and insects may come into contact with fecal sludge - but limited
No people, animals or insects are likely to come into contact with faecal sludge
Other (specify):
DK
3 How close is the disposal area to a groundwater source or waterpoint?
Close enough (less than 5 metres) to present a direct risk from the disposal point
Close enough (between 5 and 10 metres) to present an indirect risk from the disposal point
Far enough (more than 10 metres) to present negligible or no risk, or no groundwater source/waterpoint present
Other (specify):
DK
4 How close is the disposal area to a river or stream?
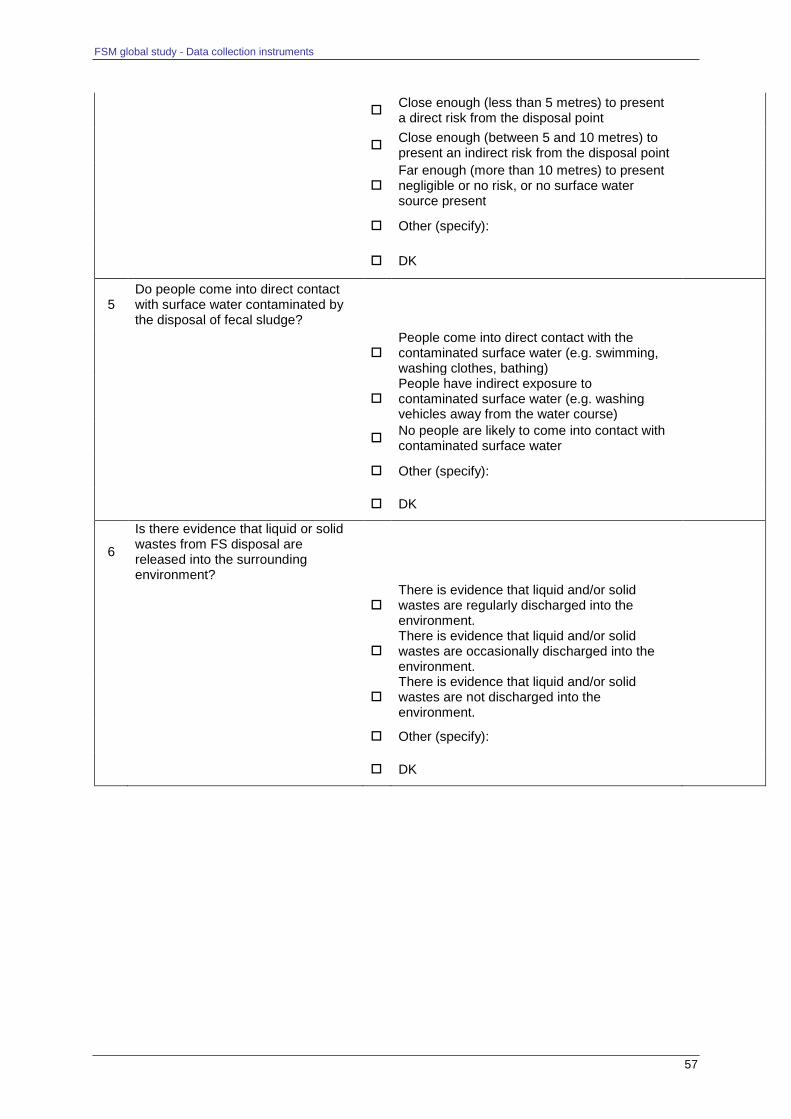
FSM global study - Data collection instruments
57
Close enough (less than 5 metres) to present a direct risk from the disposal point
Close enough (between 5 and 10 metres) to present an indirect risk from the disposal point
Far enough (more than 10 metres) to present negligible or no risk, or no surface water source present
Other (specify):
DK
5 Do people come into direct contact with surface water contaminated by the disposal of fecal sludge?
People come into direct contact with the contaminated surface water (e.g. swimming, washing clothes, bathing)
People have indirect exposure to contaminated surface water (e.g. washing vehicles away from the water course)
No people are likely to come into contact with contaminated surface water
Other (specify):
DK
6
Is there evidence that liquid or solid wastes from FS disposal are released into the surrounding environment?
There is evidence that liquid and/or solid wastes are regularly discharged into the environment.
There is evidence that liquid and/or solid wastes are occasionally discharged into the environment.
There is evidence that liquid and/or solid wastes are not discharged into the environment.
Other (specify):
DK

FSM global study - Data collection instruments
58
B.6 End use
Risks associated with end-use processes/practices
Identifying Code:
City: Location:
GPS coordinates: Date:
Nº Question Response
1 If fecal sludge is applied to agricultural land, is it treated first?
Fecal sludge is fully treated before being applied to land
Fecal sludge is partially treated before being applied to land
Fecal sludge is not treated before being applied to land
Other (specify):
DK
2 If fecal sludge is applied to agricultural land, how is it applied?
The treated sludge is spread over the ground surface
The treated sludge is spread over the ground surface, and then ploughed into the soil
The treated sludge is applied below the ground surface, or covered over with a layer of soil
Other (specify):
DK
3 If fecal sludge is applied to agricultural land, what type of crops are grown?
Salad crops that are eaten uncooked
Vegetable crops that are cooked before eating
Fruit trees, cereal crops, and crops not for human consumption (e.g. flowers, grass, crops for animal feed)
Other (specify):
DK
4
If fecal sludge is applied to agricultural land, at what stage during the growing season is it applied?

FSM global study - Data collection instruments
59
Shortly before crops are harvested
During the crop growing period
Shortly before or just after the crop is planted
Other (specify):
DK

FSM global study - Data collection instruments
60
Annex C Transect walk record sheet
In Table 1, the final “score” for each of the categories will be the average of the general conditions found in the community. As you walk around, place ticks against the descriptions that best describe examples of what you see. At the end of the transect walk, decide what the average of all the ticks should be for each of the categories and mark this clearly with a score of 1 to 5. When a particularly high risk situation (conditions 4 or 5) is seen, make a note of this in Table 1 (column on the right) for relevant categories (1, 4, 5a, 5b and 8). In each case, ask local people how frequently this situation occurs. Make a note of the frequency in Table 1 (far right column) and complete details in Table 2 for the most significant locations and risks. When you have finished the transect walk, ask some community members the questions in Table 3.
City: ______________________ Location: __________________
GPS coordinates at start: ______________________ Date: __________________
Economic status (Tick the appropriate response) High-income 1
of the area Middle-income 2
Low-income 3
Is the area at risk of flooding? __________________________________ Weather conditions on the day: ________________
Brief description of the community 1
1 In less than 100 words, summarise:
- relatively recent changes (in the last 10 years) in the development of the area, - the extent of residential, commercial/private and public infrastructure (i.e. residential housing, shops, businesses, schools, mosques, markets, etc.), - the main types of housing found in the area, - the main types of economic activity that take place in the area and the main employment of people living in the area.

FSM global study - Data collection instruments
61
Table 1: General conditions
Category Description of observed risks Score
Location(s) where high risk
is seen
Complete details
in Table 2
How often does this risk occur?
(Ask the community for information)
Annually = 1 Monthly = 2 Weekly = 3 Daily = 4
1. Drainage (storm water and greywater¹). Describe the condition of the drainage structure
Limited drainage infrastructure. Standing storm water and/or greywater is visible on the ground, close to homes or water points
5
Limited drainage infrastructure, with signs of storm water and/or greywater having overflowed recently close to homes or water points
4
Limited drainage infrastructure,, but with no signs of having overflowed close to homes or water points
3
Drainage channels in a poor condition directing storm water and/or greywater away from homes and water points
2
Drainage channels, well maintained and adequate to take flows. 1
¹ Note: Greywater is domestic wastewater that does not include toilet wastes, and does not contain visible fecal materials.
2. Sewerage (blackwater²) Describe where you see, or identify, that blackwater is entering into the environment
Limited sewer infrastructure with visible standing blackwater close to homes or water points.
5
Broken sewer pipes close to homes or water points, with signs of having overflowed recently.
4
Broken sewer pipes close to homes or water points, but with no signs of having overflowed 3
Piped sewers with signs of some leakage or blockages. 2
Adequate and well maintained piped sewers, with no signs of leakage or blockages. 1
² Note: Blackwater is domestic wastewater that includes toilet wastes, and contains visible fecal materials.

FSM global study - Data collection instruments
62
3. Access to water points
No piped water supply to households or public water points are identified 5
No piped water supply to households, but water is available from public standposts, vendors, private wells or boreholes.
4
Some piped water supply to households, or boreholes. Other water is available from public standposts or vendors.
3
Intermittent piped water supply to all or most households. Water from vendors may also be available.
2
Continuous piped water supplies to public standposts, on-plot or in-house. Water from vendors may also be available.
1
4. Evidence of solid wastes
Piles of solid waste are accumulating in many sites, close to where people live and work, and at times are obstructing drainage or irrigation channels.
5
Piles of solid waste are accumulating in three or more sites, close to where people live and work, but are not obstructing drainage or irrigation channels.
4
Piles of solid waste are accumulating in one or two sites, but away from where people live and work.
3
Waste bins or enclosures are provided for solid waste collection, but the number of bins is inadequate and overflow is evident.
2
An adequate number of waste bins or enclosures are provided, with no overflow evident. 1
5a. Evidence of human fecal materials – through open defecation4
Frequent visible, widespread evidence of human feces is seen. 5 If people will be offended by this
question, do not ask it
Visible evidence of human feces is seen, but limited to a few locations. 4 If people will be offended by this
question, do not ask it
Human feces are seen one or two times, but in places away from the population. 3
Possible evidence of human feces is seen, mixed with solid waste. 2
No visible evidence of human feces through open defecation is seen. 1
4 Note: Open defecation is when people defecate directly in the environment, rather than defecating in a latrine with a pit or septic tank.

FSM global study - Data collection instruments
63
5b. Evidence of human fecal materials – through dumped fecal sludge5
Frequent visible and widespread evidence of dumped fecal sludge is seen. 5
Visible evidence of dumped fecal sludge is seen, but limited to a few locations. 4
Dumped fecal sludge is seen one or two times, but in places away from the population. 3
Possible evidence of fecal sludge is seen, mixed with solid waste. 2
No visible evidence of dumped fecal sludge is seen. 1
5 Note: Fecal sludge may be dumped into the environment when the contents of septic tank/ pit waste is emptied manually.
6. Evidence of animal fecal materials
Frequent visible and widespread evidence of animal feces is seen. 5
Visible evidence of animal feces is seen, limited to a few locations. 4
Animal feces are seen one or two times, but in places away from the population. 3
Possible evidence of animal feces is seen, mixed with solid waste. 2
No visible evidence of animal feces is seen. 1
7. Coverage of household toilets (individual, or shared with known families)
(You will need to ask people for information to be able to complete the correct response)
Less than 25% of households have access to a household toilet. The majority (more than 75%) appear to be poorly maintained.
5
Between 25% to 75% of households have access to a household toilet. Most (more than 50%) appear to be poorly maintained.
4
Between 25% to 75% of households have access to a household toilet. Most (more than 50%) appear to be well maintained.
3
More than 75% of households have access to a household toilet. They are in various conditions of maintenance and cleanliness.
2
More than 75% of households have access to a household toilet. Most (more than 75%) appear to be clean and well-maintained.
1

FSM global study - Data collection instruments
64
8. Presence of public sanitation facilities Note: This category includes “pay-per-use” facilities (including at markets, bus stations, etc.) but does not include institutional facilities at schools, offices, etc.
Where public facilities are present, they are all poorly maintained with evidence of fecal contamination in the local environment.
5
Where public facilities are present, most (more than 50%) are poorly maintained with some evidence of fecal contamination in the local environment.
4
Where public facilities are present, they are in various conditions of maintenance and cleanliness.
3
Where public facilities are present, most (more than 50%) are generally clean and well-maintained.
2
Where public facilities are present, they are in frequent use, clean and well-maintained. OR There are no public facilities present.
1
Note: You may need to ask people for information to be able to complete the correct response.
9. Presence of wastewater and/or fecal sludge treatment facilities³ inside the area
Wastewater and/or fecal sludge treatment facilities (e.g. composting of wastes) are present, poorly-maintained and insecure.
5
Wastewater and/or fecal sludge treatment facilities are present, poorly-maintained, secure but with possible direct risks –such as from overflow
4
Wastewater and/or fecal sludge treatment facilities are present, and are well-maintained, but with some possible indirect risks – such as from scavenging animals or waste pickers
3
Wastewater and/or fecal sludge treatment facilities are present, and are well-maintained with no evident risks
2
No wastewater and/or fecal sludge treatment facilities present. 1
³ Note: In many cities, it is very unlikely that you will see any treatment facilities.
10. Housing and public space arrangement
Less well or poorly organized development, with highly restricted access for public service vehicles and no clearly defined public spaces.
5
Less well organized development, with mostly temporary housing, limited access for public service vehicles and very few clearly defined public spaces.
4
Well organized development, with semi-permanent and/or temporary properties, limited access for public service vehicles and only a few clearly defined public spaces.
3
Well organized development, with permanent and/or semi-permanent properties, but restricted access for public service vehicles and public spaces, including some open spaces
2

FSM global study - Data collection instruments
65
Well organized development, with permanent and/or semi-permanent properties, good access for public service vehicles and public spaces, including open spaces.
1
11. Paths Routes wide enough for pedestrians and possibly motorbikes
Very narrow paths that can be used by pedestrians only (too narrow for motorbikes) 5
Poorly maintained dirt paths wide enough for motorbikes 4
Well-maintained dirt paths wide enough for motorbikes 3
Gravel or paved paths, in poor condition, wide enough for motorbikes 2
Gravel or paved paths, in good condition, wide enough for motorbikes 1
12. Roads Routes wide enough for vehicles (cars, 3-wheelers, donkey carts, etc.)
Unsurfaced roads, wide enough for small carts or 3-wheeler, but not for car access. 5
Unsurfaced roads wide enough for cars to pass 4
Gravel or paved roads, wide enough for small carts or 3-wheeler, but not for car access 3
Gravel or paved roads, wide enough to allow two cars to pass 2
Well maintained gravel or paved road, wide enough for two cars to pass 1

FSM global study - Data collection instruments
66
Table 2: High-risks observed - for categories 1, 4, 5a, 5b and 8 in Table 1
Where areas of high-risk of contamination are identified (scoring 4 or 5), complete further details as appropriate and to the extent possible
Category
Type of contamination seen
Source of risk
Briefly state the problem that you have seen
Complete for each category (1, 4, 5a, 5b and 8) scoring 4 or 5 in Table 1
Human interaction
State how humans are interacting (coming into contact) with the contamination (e.g. washing, playing, walking, scavenging)
Route of contamination
State the main routes of contamination (e.g. hands, feet, flies, food, fields/crops, soil)
Who is exposed?
Comment on who is exposed to the contamination (e.g. all people, adults only, children only, or identified vulnerable groups)
GPS coordinates
Photo-graphs
Details of any photos taken
1. Drainage (stormwater and/or greywater)
4. Solid waste pile
5a. Open defecation
5b. Dumped fecal sludge

FSM global study - Data collection instruments
67
Category
Type of contamination seen
Source of risk
Briefly state the problem that you have seen
Complete for each category (1, 4, 5a, 5b and 8) scoring 4 or 5 in Table 1
Human interaction
State how humans are interacting (coming into contact) with the contamination (e.g. washing, playing, walking, scavenging)
Route of contamination
State the main routes of contamination (e.g. hands, feet, flies, food, fields/crops, soil)
Who is exposed?
Comment on who is exposed to the contamination (e.g. all people, adults only, children only, or identified vulnerable groups)
GPS coordinates
Photo-graphs
Details of any photos taken
8. Public latrines
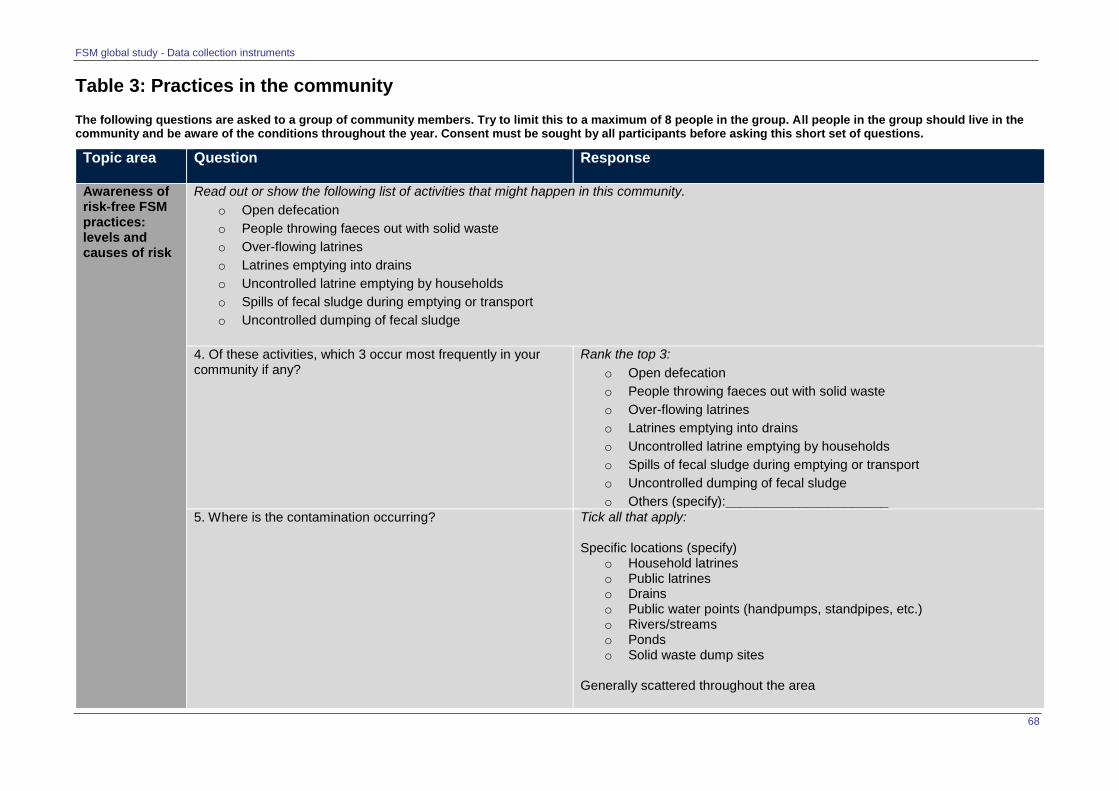
FSM global study - Data collection instruments
68
Table 3: Practices in the community The following questions are asked to a group of community members. Try to limit this to a maximum of 8 people in the group. All people in the group should live in the community and be aware of the conditions throughout the year. Consent must be sought by all participants before asking this short set of questions.
Topic area Question Response
Awareness of risk-free FSM practices: levels and causes of risk
Read out or show the following list of activities that might happen in this community.
o Open defecation
o People throwing faeces out with solid waste
o Over-flowing latrines
o Latrines emptying into drains
o Uncontrolled latrine emptying by households
o Spills of fecal sludge during emptying or transport
o Uncontrolled dumping of fecal sludge
4. Of these activities, which 3 occur most frequently in your community if any?
Rank the top 3:
o Open defecation
o People throwing faeces out with solid waste
o Over-flowing latrines
o Latrines emptying into drains
o Uncontrolled latrine emptying by households
o Spills of fecal sludge during emptying or transport
o Uncontrolled dumping of fecal sludge
o Others (specify):______________________
5. Where is the contamination occurring? Tick all that apply: Specific locations (specify)
o Household latrines o Public latrines o Drains o Public water points (handpumps, standpipes, etc.) o Rivers/streams o Ponds o Solid waste dump sites
Generally scattered throughout the area

FSM global study - Data collection instruments
69
Topic area Question Response
Other (specify):______________________________ DK (Don’t Know)
5. How often does the most significant of these happen? Tick one: o Every day (i.e. All the time) o Most weeks (i.e. Most of the time) o During certain months (i.e. Some of the time)Seasonally o During the rainy season(s) o During the dry season o Other seasons (specify):_________________ o Other (specify):____________________________ o DK
7. Has there been a diarrhoeal outbreak affecting large numbers of people in the past 1 year?
Yes No -> End DK -> End
8. In which month did this start? Jan Feb Mar Apr May Jun Jul Aug Sep Oct Nov Dec (circle the month)
Names and signatures of participants:
Name Signature Date

FSM global study - Data collection instruments
70
Annex D Fecal sludge (FS) characteristics record sheet
Date:
Time:
Sample bottle identification number:
Location (description):
Stage of handling fecal sludge (tick one):
During removal
During discharge
After treatment
Location (GPS co-ordinates):
Name of sample collector:
Name of latrine emptying service provider:
See excel spreadsheet: FS observed characteristics
Table 1. Observed faecal sludge characteristics
Description Behaviour Tick box
Dry Solid Crumbles easily. A deep vertical cut, widened to create a triangular wedge-shaped cut in the FS, holds its shape, with the cut edges appearing dry.
Wet Solid Cohesive, with no evidence of free liquids.
A deep vertical cut, widened to create a triangular wedge-shaped cut in the FS, holds its shape, with the cut edges appearing damp but with no free liquid visible.
Solid and liquid mix
A mixture of solids and liquids.
A deep vertical cut, widened to create a triangular wedge-shaped cut in the FS, holds its shape, with liquids draining into the cut.
Viscous liquid Liquid, but flowing slowly
A deep vertical cut, widened to create a triangular wedge-shaped cut in the FS, closes up after a few seconds.
Liquid Liquid, flowing easily.
The FS is so liquid that it is not possible to widen a deep vertical cut and create a triangular wedge-shaped cut.
Table 2. Solid waste content of faecal sludge
Classification Description Tick box
Very high solid waste content Contains more solid wastes than faecal material.
High solid waste content Contains significant amounts of miscellaneous solid wastes.
Medium solid waste content Contains small amounts of miscellaneous solid wastes.
Low solid waste content Contains some paper materials used for anal cleansing.
No solid waste content Contains no solid wastes.
Signature: Date:

FSM global study - Data collection instruments
71
Annex E Key informant interviews
E.1 KII indicators and questions
Before developing the set of interview questions, a preliminary “mapping exercise” may need
to be carried out. This mapping can help identify which stakeholders/institutions and specific
interviewees can address which topic-areas (and/or specific questions) from the full set of
possible questions.
This mapping can also identify the extent to which relevant, adequate and reliable
information is already available from other sources. For example, recent past studies or
official reports addressing FSM services may be available, meaning certain questions do not
need to be asked during interviews. However, it is important to consider whether gaining
additional information on a given point will help to verify the existing information, or ensure
different perspectives on a given issue are gathered.
Once this initial mapping has been done, tables can be drawn-up to indicate which
questions, or topic-areas, should be asked to each of the selected key interviewees. This will
help to build-up the full matrix of questions against stakeholders/interviewees and be the
basis of developing interview question guides.
It is important to remember that for some questions, there may not be a ‘correct’ answer or
information but it will be important to gather potentially different perspectives on the same
question from different stakeholders and key informants. For these, and many other of the
proposed example questions set out below, it will be important to ask “why” respondents
have a particular perspective and probe into these issues.

FSM global study - Data collection instruments
72
E.2 Institutional responsibility mapping and stakeholder analysis
Initial institutional responsibility mapping As a first step in the process, data for this will come primarily from more neutral observers and key informants, the researchers own knowledge, and secondary sources.
Identify which actors / agencies have formal institutional responsibilities for particular aspects
of FSM (e.g. containment, emptying, transport, etc.) as well as local FSM policy and strategy.
Categorise these within broader groupings – e.g. national government ministries; local
government agencies; private sector; etc.
For each actor or agency, indicate whether they have formal responsibilities for particular
aspects of FSM in the following table. This should be the formal responsibilities they have, not
what actually happens in practice.
Where there are any stakeholders who do not have formal responsibilities but in practice
undertake particular activities of tasks, not these down for inclusion in subsequent mappings
but also decide whether they should also be interviewed.
Institutional mapping of formal responsibilities for local FSM
Local policy and strategy
FSM infrastructure development and service delivery
Co
nta
inm
ent
Emp
tyin
g
Tran
spo
rt
Trea
tmen
t
End
-use
/
dis
po
sal
National government departments
Local government departments
Local government enterprises
Non-government stakeholders
Private enterprises
NGOs/CBOs/community groups
Individuals / households
This will feed into the initial stakeholder analysis below, and help identify key informants and stakeholders for subsequent interviews. Initial stakeholder analysis
Using the list of actors / agencies with formal responsibilities identified above, establish whether
there are particular individuals or groups within each broader category who have particular
responsibilities or levels of influence over FSM. Ensure that these stakeholder groups are broken
down sufficiently in order to understand potentially different and competing interests and influence

FSM global study - Data collection instruments
73
within broader stakeholder groups. It is important that the analysis unpacks broad terms such as
‘government’, ‘civil society’, ‘community’ or ‘private sector’ and identifies relevant actors (individuals
as well as groups or organisations) within these.
Use the template below to present an initial stakeholder analysis. For each relevant stakeholder,
outline the key points under each heading and the reasons respondents have stated particular
points.
For this initial analysis, data will come from interviews with external key informants.
Refer to the Table on the following page.
Using these initial analyses or responsibilities, interests, characteristics and influence, etc.,
prioritise which individuals and/or agencies it will be most important to interview. The rationale for
selecting an individual might include, for instance, high levels of responsibilities or high level of
influence over a particular element of FSM, etc.
The particular responsibilities or interests will also help select questions that are relevant and also
identify further questions to probe into the issues in more depth.
Based on these two stages and an analysis of data collected during interviews, the further stages
of building-up a Stakeholder Matrix and the Process mapping can follow, to complete the PEA.

FSM global study - Data collection instruments
74
Stakeholder mapping template
Stakeholder categories
Relevant stakeholders
Characteristics
(social, geographical, organisational)
Influence
(power to facilitate or impede FSM poor-inclusive policy and service provision)
Interest
(what they gain or lose, how this affects their commitment to status quo / openness to change)
Importance
(degree of priority needs and interests)
National government
Ministry of Public Works
Ministry of Finance
Ministry of Public Housing
National Legislators
Local level government
Mayors
Local legislators
Local government department A
Local government department B
Civil society Consumer groups and advocacy NGOs
Media
Poor households
Better-off households
Private sector Septic tank contractors and emptiers
Large sewerage / treatment plant engineers (foreign and domestic)
International organisations or projects
WSP
WB
Source: Adapted from Holland (2007).

FSM global study - Data collection instruments
75
Annex F Focus Group Discussion guide
FGDs provide an opportunity to gather qualitative data that will compliment, validate, or perhaps challenge responses made during the household survey. Questions are likely to focus on obtaining information relating to:
the household sanitation practices of “others” – especially as individuals may not talk openly or
honesty about their own, or their family, practices;
peoples’ understanding of the risks associated with poor FSM services;
issues affecting the community as a whole (service standards and costs, choice of technical
and service options available, pollution, impacts of legal issues (insecurity of tenure), etc.);
levels of support received/ perceived as being focused on the needs of poor areas of the city;
what interventions have been conducted before – and the extent to which they have worked/
not worked, responded/ not responded to the needs of the community;
what actions the community could take to improve FSM services;
willingness-to-pay for improved services (see the note below the following table).
The full list of topics that can be discussed in FGDs members are shown in Table 14. Table 14 Topics for Focus Group Discussions with community members
Component Issue Topics for discussion
Service Delivery Assessment (SDA)
Equity - Range of technical options: available, etc. (formally offered
vs. informal self-build solutions)
Quality
- Extent to which risk-free and functioning services are provided: containment, emptying, transport
Political Economy Analysis (PEA)
Contextual factors affecting FSM services Stakeholder interests Equity
- What people consider to be appropriate services (focussing on containment and emptying) and how this influences demand
- Socio-cultural drivers for/ constraints to appropriate FSM services
- Electoral returns to FSM investments - What motivates communities or households to demand
and use more appropriate FSM - Existence of subsidies/ effectiveness of targeting for the
poor
Current FS Flows Pathways of FS - Population practicing open defecation
Public Health Risk
Risk-free FSM practices
- Awareness of risk-free FSM practices: levels and causes of risk
Intervention options
Potential solutions - What has previously worked well, or not worked well (in
the community)?
Effective options
- What could households/ communities do to improve FSM? - What could the city council/Municipality/Utility do to
improve FSM? - What could other stakeholders do in response?
As the number of topic areas is too many to cover in any one FGD, they will be divided into 2 sets of broad ‘themes’ to gather qualitative information during FGDs with specific focus areas. Each FGD will focus on one of the themes, which will address:
FGD theme 1: Current FSM Services (and associated risks)
FGD theme 2: Past, current and possible future improvements to services

FSM global study - Data collection instruments
76
These themes are to be allocated to the group types (indicated in section 3.6.3) to ensure
representativeness while addressing practicalities, opportunities and limitations in the city context.
A number of questions that will result in quantitative data have been identified for use during the
Transect Walk (see Annex C, Table 3 for more details).
Table 15 Topic areas for discussion Theme 1: Current FSM Services
Suggested primary questions and ‘probing’ questions: to stimulate
discussion
Topic areas for discussion
Primary questions Secondary questions Tertiary questions
Range of technical options available, etc. (formally offered vs. informal self-build solutions)
What types of latrines do people have that are formally provided in this area?
Who provides these latrines?
How much are formal latrines used by people in this area?
What types of latrines do people have that are built by households themselves in this area?
Who, if anyone, helps families to build their own latrines?
How much are self-build toilets used by people in this area?
Are the different types used differently by women and men, or other groups of people, in this area?
Can you explain what these differences are and why they occur?
What people consider to be appropriate services (focussing on containment and emptying) and how this influences demand
What do you consider to be 'appropriate' ways to help households have good latrines at home?
Who do you think should be responsible for providing this help?
If more help was provided, do you think people would want to invest more in their own latrine? Please explain.
What do you consider are 'appropriate' services that do, or could, help households manage the removal of fecal sludge from their homes?
Who do you think should be responsible for providing this help?
If emptying services improved, do you think people would be prepared to pay more for them? Please explain.
Extent to which risk-free and functioning services are provided: containment, emptying, transport
Can families in this area of the city find suitable latrine emptying services, when they want to have their latrine emptied?
Do these emptying services introduce any risks?
If so, what are those risks, when and where do they occur?
What are the functioning FS transport services available in this area of the city?
Do they introduce any risks?
If so, what are those risks, when and where do they occur?
What motivates communities or households to demand and use more appropriate emptying services
What motivates people to demand and use appropriate latrine emptying services?
For what proportion of households do these factors apply?
Trade-offs for households from increased investment in FSM services
Where people pay more for emptying services, how does this affect
Are some financial needs more affected than others?
If so, which?

FSM global study - Data collection instruments
77
other financial needs in their household?
Existence of subsidies/ effectiveness of targeting for the poor
What subsidies (financial support) are available if a household needs help to improve their sanitation facilities (e.g. to build, repair or empty a latrine)?
Who are subsidies available for?
Who decides who can, or cannot, receive subsidies?
Topic areas for FGD theme 2: Past, current and possible future improvements to services
Suggested primary questions and ‘probing’ questions: to stimulate
discussion
Topic areas for discussion
Primary questions Secondary questions Tertiary questions
Extent to which city's FSM systems serve low-income communities (containment, emptying, transport only)
Do families in this area get support to build, or improve, household latrines?
How is that support provided and to whom?
What are the benefits, if any, of getting this support? What are the disadvantages, if any, of this support?
Do families in this area get support to empty latrines?
How is that support provided and to whom?
What are the benefits, if any, of getting this support? What are the disadvantages, if any, of this support?
Availability of funds, plans and measure to ensure FSM serves all users, specifically the urban poor
Are you aware of any recent improvements made to pit/septic tank emptying services in this area of the city?
If so, what has happened? What difference has this made to the services you see provided?
If not, are any improvements planned?
What has previously worked well, or not worked well (in the area)?
What previous actions to improve fecal sludge handling have worked well in your area?
Who was responsible for these actions?
How were local residents involved?
What previous actions to improve fecal sludge handling have not worked well in your area?
Who was responsible for these actions?
How were local residents involved?
What could households/ communities do to improve FSM?
What do you think households could do to improve the management of fecal sludge in your area?
What could the city council/ Municipality/ Utility do to improve FSM?
What do you think the City authorities could do to improve the management of fecal sludge in your area?
What could other stakeholders do in response?
Could others be involved in improving the management of fecal sludge in your area?
Who do you suggest and what could they do?

FSM global study - Data collection instruments
78
Electoral returns to FSM investments
Do politicians mention issues of sanitation/sludge handling during their campaigns?
Why do you think they do or don’t?
Does it affect people's voting decisions if they do (or if the currently don’t, would it if they did in the future)?
Evidence of willingness/ ability to pay for FSM services (formal or informal)
Ask suitable questions to identify how much people are willing or able to pay for latrine emptying services
Ask suitable questions to identify how this varies depending on the type of service provided (formal or informal)