february 2019 - iabm · repor t is to enable iabm member companies to benchmark their own...
TRANSCRIPT

IABM Supply Trends Report
February 2019
About this ReportThe IABM Supply Trends Report biannually tracks �nancial performance and trends in the media technology sector. The purpose of this report is to enable IABM member companies to benchmark their own performance within the industry and track emerging trends in the supply side of media technology.
Report MethodologyThe information analyzed in this report is derived from both quantitative and qualitative research carried out by IABM. The primary sources used in this report are:o Quantitative Evidence: Public and private �nancial data of media technology supplier companies gathered and analyzed by IABM o Qualitative Evidence: Survey evidence on sector trends and issues gathered and analyzed by IABM We produce indices and statistics based on this primary evidence. These can be divided into two pools:o The IABM Supply Trends Index: a monthly tracker of sales and pro�ts in the media technology sector - this data is mostly used in the �rst section of the reporto The IABM Supply Trends Survey: a biannual survey of trends and opinions in the media technology sector - this data is mostly used in sections 2-7 We use both these pools of information as well as variety of secondary sources - including interviews, news, announcements, earnings calls, technology material etc. - to provide users with a comprehensive account of the status of the media technology market.
IABM Supply Trends Report
IABM Copyright © 2019 All Rights Reserved
Report Content
Executive Summary
Financial Performance
Business Sentiment
Demand & Revenue Models
Costs & Prices
Investment
Skills & Training
Industry Outlook
Appendix
IABM Copyright © 2019 All Rights Reserved
Executive Summary
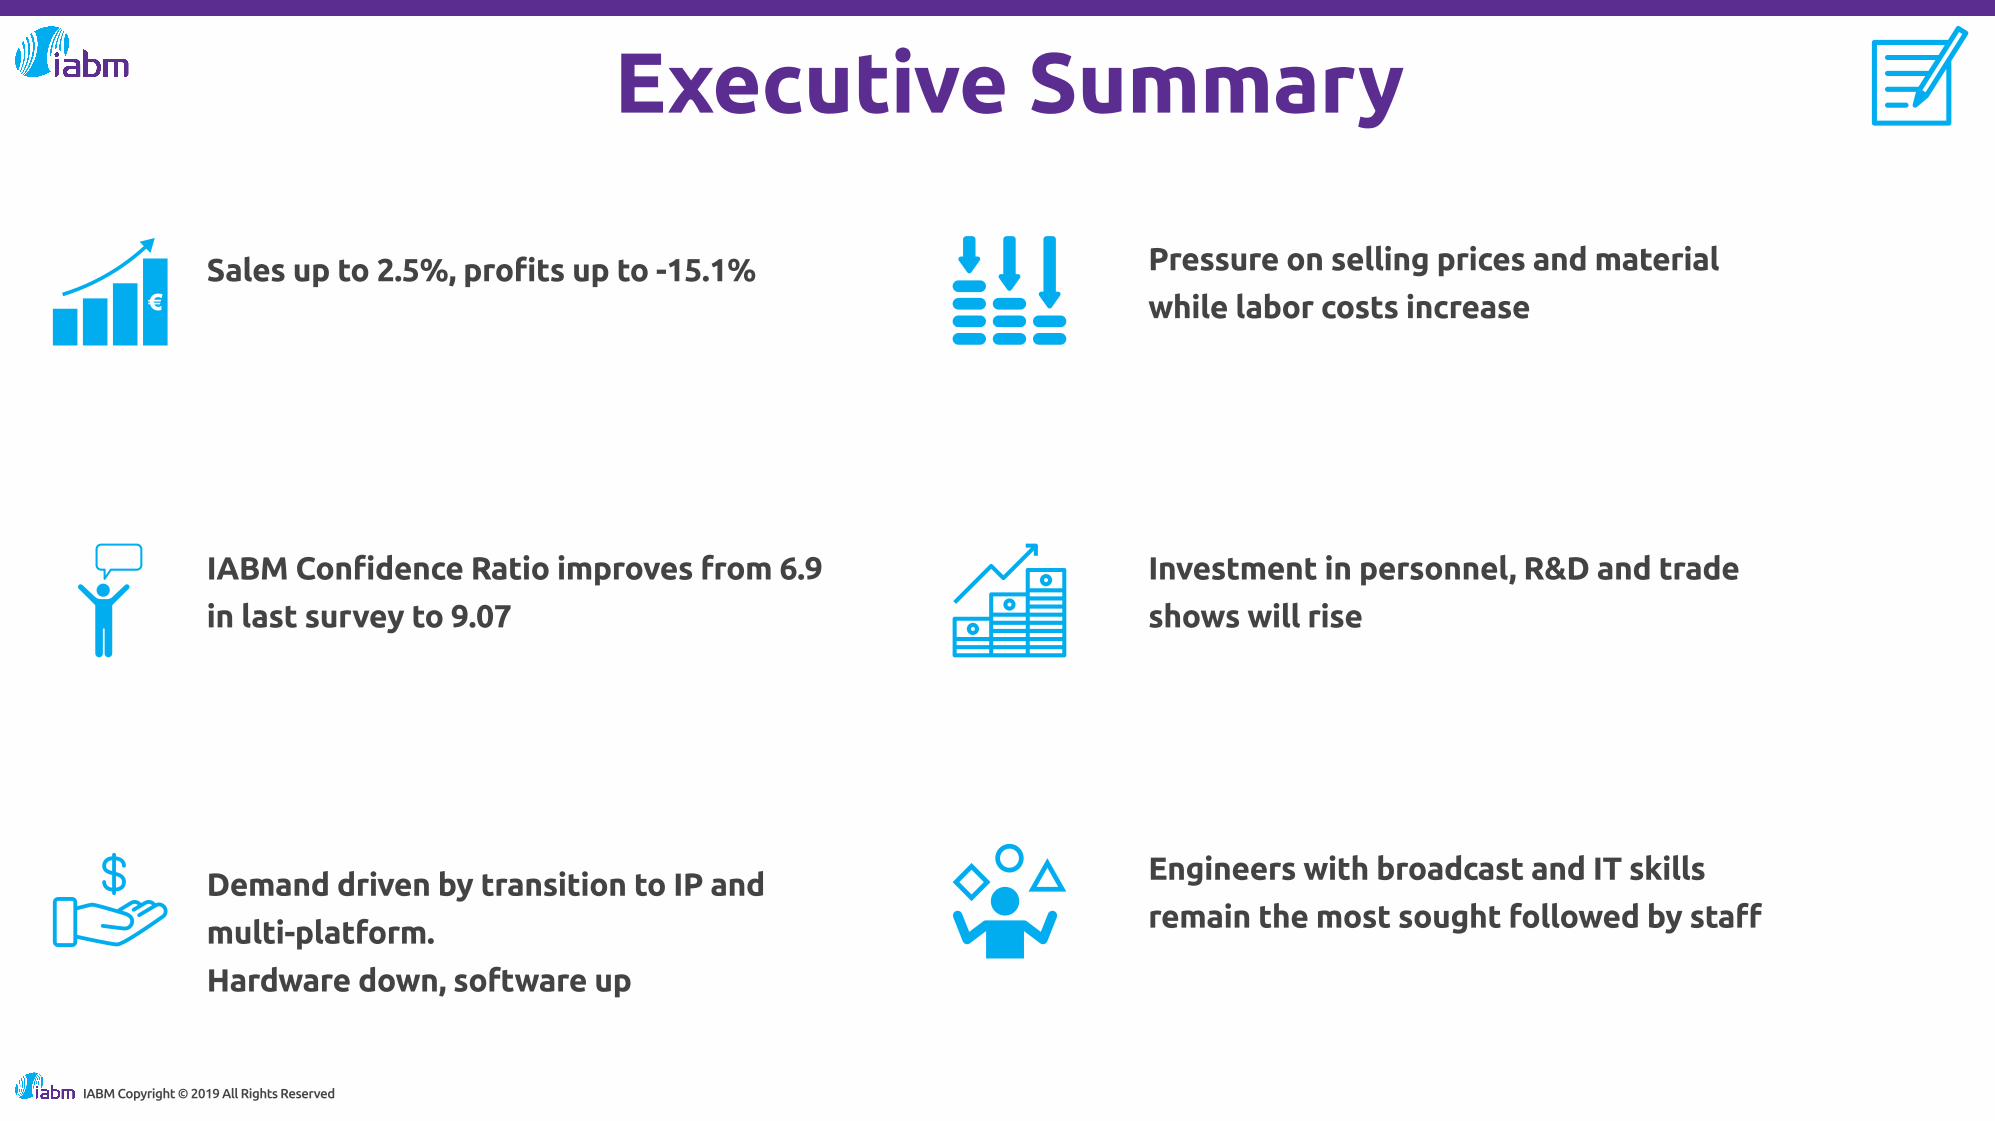
Sales up to 2.5%, pro�ts up to -15.1%
IABM Con�dence Ratio improves from 6.9
in last survey to 9.07
Demand driven by transition to IP and
multi-platform.
Hardware down, software up
Pressure on selling prices and material
while labor costs increase
Investment in personnel, R&D and trade
shows will rise
Engineers with broadcast and IT skills
remain the most sought followed by sta�
IABM Copyright © 2019 All Rights Reserved

Executive SummaryThese results show that the supply industry is still in �ux, with changing business models and buyers’ purchasing behavior having a signi�cant impact on its general performance and sentiment.
The transition to new revenue models continues and this was evident from recent �nancial results that showed an improvement in both sales and pro�ts. Sales were positively impacted by major sporting events in the second part of 2018 while pro�ts continued to improve as more suppliers moved to subscription-based offerings and reduced investment in areas such as R&D and trade shows. These results have translated into an additional increase in con�dence - the IABM Con�dence Ratio has increased compared to our last survey. However, change is everywhere, from demand to revenue models. Our analysis of demand shows that each block of the content supply chain is being disrupted by a new transition, be it the move to IP or virtualization. Most of the demand is concentrated on content management systems as buyers streamline their content supply chain. Although hardware remains the primary source of revenues, reliance on it is decreasing (albeit slightly). The revenue outlook shows that software subscriptions continue to be the fastest growing category of revenues, particularly for software vendors. Service providers continued to forecast a decrease in product sales in favor of services.
Hardware vendors continue to be hit by product commoditization while software and service providers face different challenges such as skills and staff – as the industry continues to transition to IT technology – and customer demand for consumption-based services. Despite the immense change in the market the overall outlook from this report is positive as both �nancial and survey data point to an improvement in the sector.
IABM Copyright © 2019 All Rights Reserved

Financial PerformanceThis section includes an analysis of sales and pro�t growth in the media technology sector. The data used in this section is derived from the monthly analysis of media technology businesses’ accounts by the IABM Business Intelligence Unit – The IABM Supply Trends Index. The latest analysis was carried out up to the end of December 2018 and includes 110 companies with aggregate sales amounting to US$4.5bn.
SalesYear-on-year sales in the broadcast and media technology market grew by 2.5% in H2 2018, which is up from 0.8% in H1 2018. This improvement was led by progress in the transition to new technology offerings at major supplier organizations as well as the impact of events. In fact, as shown by the rest of this report, media technology vendors are transitioning to subscription-based offerings.
Compared to 2017, sales grew more slowly (on average) in 2018 although, in the second part of the year, revenue growth was driven by the effect of major sporting events like the FIFA World Cup.
End of January 2019 185
Results up to No. of companies included
Latest Supply Trends Index
Sales in the industry 4.5
4.0
3.5
3.0
2.5
2.0
1.5
1.0
0.5
0
H1 2014 H2 2014 H1 2015 H2 2015 H1 2016 H2 2016 H1 2017 H2 2017 H1 2018 H2 2018
Source: IABMIABM Copyright © 2019 All Rights Reserved

Financial Performance
It is worth remembering that the �gures in this report refer to the conditions of the overall industry – growth varies greatly from one segment to another.
Pro�tsOverall pro�ts in the market have continued to decline but have signi�cantly improved from the trough of -24.5% experienced in H1 2018 to -15.1% in H2 2018. The decline in pro�ts, which started at the end of 2015, has continued throughout the industry affecting all companies, regardless of their size.
There are many forces behind this decline in pro�ts, some of which will be analyzed in detail later in this report.
Generally, investment has decreased, and this has had a positive impact on pro�ts. Our analysis of investment in R&D and trade shows, shows that this is true for most companies although R&D levels remain high in the industry.
Pro�ts in the Industry
Source: IABM
15
10
5
0
-5
-10
-15
-20
-25
H1 2014 H2 2014 H1 2015 H2 2015 H1 2016 H2 2016 H1 2017 H2 2017 H1 2018 H2 2018
IABM Copyright © 2019 All Rights Reserved

Financial Performance
Cost reduction, �nancial transition and market expansion have positively contributed to pro�t rates as shown by the improvement in the last six months. We have also seen more companies move to new offerings and diversify their portfolios to appeal to emerging and adjacent market segments. Parallel markets are discussed in more detail later in this report.
The snapshot of pro�tability as of December 2018 shows that most companies (78%) remain in pro�t. This percentage is signi�cantly up compared to recent months and consistent with the improvement in pro�ts. This change was primarily driven by the decrease in the percentage of companies in loss both years.
Our �nancial data generally points to an improvement of media technology suppliers' performance as all our indicators positively progressed compared to our previous report.
Pro�ts
In pro�t both years Moving from loss to pro�t In loss both years
Moving from pro�t to loss
Source: IABMIABM Copyright © 2019 All Rights Reserved

Business Sentiment
The data used hereafter is derived from a biannual IABM survey of trends and opinions of media technology suppliers’ senior decision makers – The IABM Supply Trends Survey. The latest survey was carried out between December 2018 and January 2019, receiving 330 responses.The �rst section looks at business sentiment in the media technology industry.
Business SentimentYear-on-year con�dence has improved over the last six months. This can be read in conjunction with the �nancial performance data showing a slight improvement (although still negative) in pro�tability among media technology suppliers which was reported in the previous section on �nancial performance. Software suppliers continued to have a rosier outlook compared to hardware vendors although service providers emerged as the most optimistic category of respondents. This is consistent with the industry’s transition to software, virtualization and services highlighted in various parts of this report. The geographical analysis of the data did not yield signi�cant differences between territories although North American respondents reported a more optimistic outlook.
December 2018 - January 2019 185
Survey period No. of responses
Latest Supply Trends Survey
Business Sentiment
Very positive Quite positive Neutral Quite negative Very Negative
Source: IABMIABM Copyright © 2019 All Rights Reserved

Business Sentiment
The IABM Con�dence Ratio increased from 6.9 to 9 as a result of a rise in the percentage of companies with increased con�dence - which was driven by software suppliers and service providers. The current value of the ratio is consistent with historical standards.
Anecdotal FeedbackAnecdotal feedback to this question showed growth, market and competition as the main words for the future.
“Market is transforming. There are many challenges to compete with like transform or shut down business.”“There is lot of business potential in the market due to rapid change in technology. So we are able to introduce new trends and adopt technology worldwide and pitch in our country.” Some comments continued to highlight that the competition is growing and the market is seeing new growth and change. Many markets are mentioned, including China, North America and Europe. The overall outlook seems to be positive and the companies appear to be ready for the disruption and transition.
Con�dence Ratio
Anecdotal Feedback - Word Cloud
Source: IABM
2
3
4
5
6
7
8
9
10
11
12
13
H2 2012
H1 2013
H2 2013
H1 2014
H2 2014
H1 2015
H2 2015
H1 2016
H2 2016
H1 2017
H2 2017
H1 2018
H2 2018
IABM Copyright © 2019 All Rights Reserved

Demand & Revenue ModelsThis section contains an analysis of demand as well as revenue and pro�t sources of the companies that participated in this edition of the survey. We also discuss regional sales and trends in non-broadcast revenues.
Supply Chain Demographics & DemandResearch participants were �rst asked which product and service categories they supply to their user base. These categories are drawn from the new IABM BaM Content Chain® model and are hereafter called supply chain blocks. More info on the BaM Content Chain® can be found here. Most respondents said that they serve the Manage category. Produce and Support were close followers.
In terms of demand in these categories, respondents also forecast Manage to be the fastest growing supply chain block, followed by Connect and Monetize. The last survey saw Connect as the supply chain block with the largest decrease in demand. Now, Store has been predicted to experience the largest decrease in demand. As media companies go direct-to-consumer, their demand is focusing on improving content management work�ows.
Supply Chain Blocks
Source: IABM
55
50
45
40
35
30
25
20
15
10
5
0
Create Produce Manage Publish Monetize Consume Connect Support Store
Create
Produce
Manage
Publish
Monetize
Consume
Connect
Support
Store
0 10 20 30 40 50 60 70 80 90 100
Will increase signi�cantly Will increase Will stay the same Will decrease
Will decrease signi�cantly Don't know / Not applicable
Supply Chain Demand
IABM Copyright © 2019 All Rights Reserved

Demand & Revenue ModelsWe also asked respondents to select the most important demand drivers – both positive and negative – in each of their respective supply chain blocks. In Connect, most respondents indicated the transition to IP as the most important demand driver. This is acting as a revenue driver for some vendors but also as a force disrupting demand for others. The transition to IP was also the most important demand driver in Create and Support. In Manage, respondents rated work�ow automation as the most important demand driver as media companies strive to make their operations more e�cient. As in the previous survey, virtualization was ranked as the most important demand driver in the Store category. In Publish and Consume, our respondents rated multi-platform as the most important demand driver – this is again consistent with media companies' move to direct-to-consumer offerings. In Monetize, multi-platform delivery came out on top while in the last survey the most important demand driver for this supply chain block was programmatic advertising.
Readers can use the graphic available in the interactive version of this report to evaluate what is driving demand in each supply chain block.
Most Important Demand Drivers
Source: IABM
SDI to IP Transition
Work�ow Automation
Asset Optimization
Commoditization
Remote Production
Customer Consolidation
BIY
Multi-Platform Content Delivery
Adoption of AI/Machine Learning
Virtualization
Upgrade to Immersive Formats
Upgrade to Next-Generation Terrestrial
Standards
5G
Adoption of Programmatic / Targeted
Advertising
Other
0% 10% 20% 30% 40% 50% 60% 70% 80% 90% 100%
Create Produce Manage Publish Monetize Consume Connect Support Store
IABM Copyright © 2019 All Rights Reserved

Demand & Revenue ModelsFinally, we asked respondents to provide us with more information on the trends in Manage, Publish and Store categories. In Manage, the rise of OTT was rated by far as the most important trend . This is consistent with the increase in multi-platform functionalities in content management systems, particularly in news applications. Product price de�ation came second while cloud-based and microservices deployments came third in the ranking. As in the previous survey, other important trends such as AI and supply chain e�ciency and agility came lower in the list.
In Publish, most respondents told us that their customers are focusing their investment on internet distribution of content – this is again consistent with the move to direct-to-consumer offerings. In Store, on-premise storage came on top, closely followed by cloud storage. The position of these two products/service categories has switched compared to the past survey. The high percentage of respondents selecting on-premise storage indicates that the future may consist of a balance between this and the cloud. However, the move to the cloud in Store is in�uencing vendors in this category as also shown by our previous demand analysis.
Most Important Trends in Manage
Source: IABM
Rise of Arti�cial Intelligence
Rise of New Platforms (OTT & Social Media)
Cloud-Based & Microservices Deployments
Customer In-house Deployments
Product De�ation / Commoditization
Supply Chain E�ciency/Agility
0 10 20 30 40 50 60 70 80 90 100
1 2 3
Customers' Budget Focus in Publish and Store
Most Important Trends in Manage
Internet Distribution (including mobile)
Terrestrial Distribution Cable Distribution
IPTV Distribution Satellite Distribution
IABM Copyright © 2019 All Rights Reserved
VTRs & DVRs Video Servers
Portable Storage On-Premise Storage
Cloud Storage
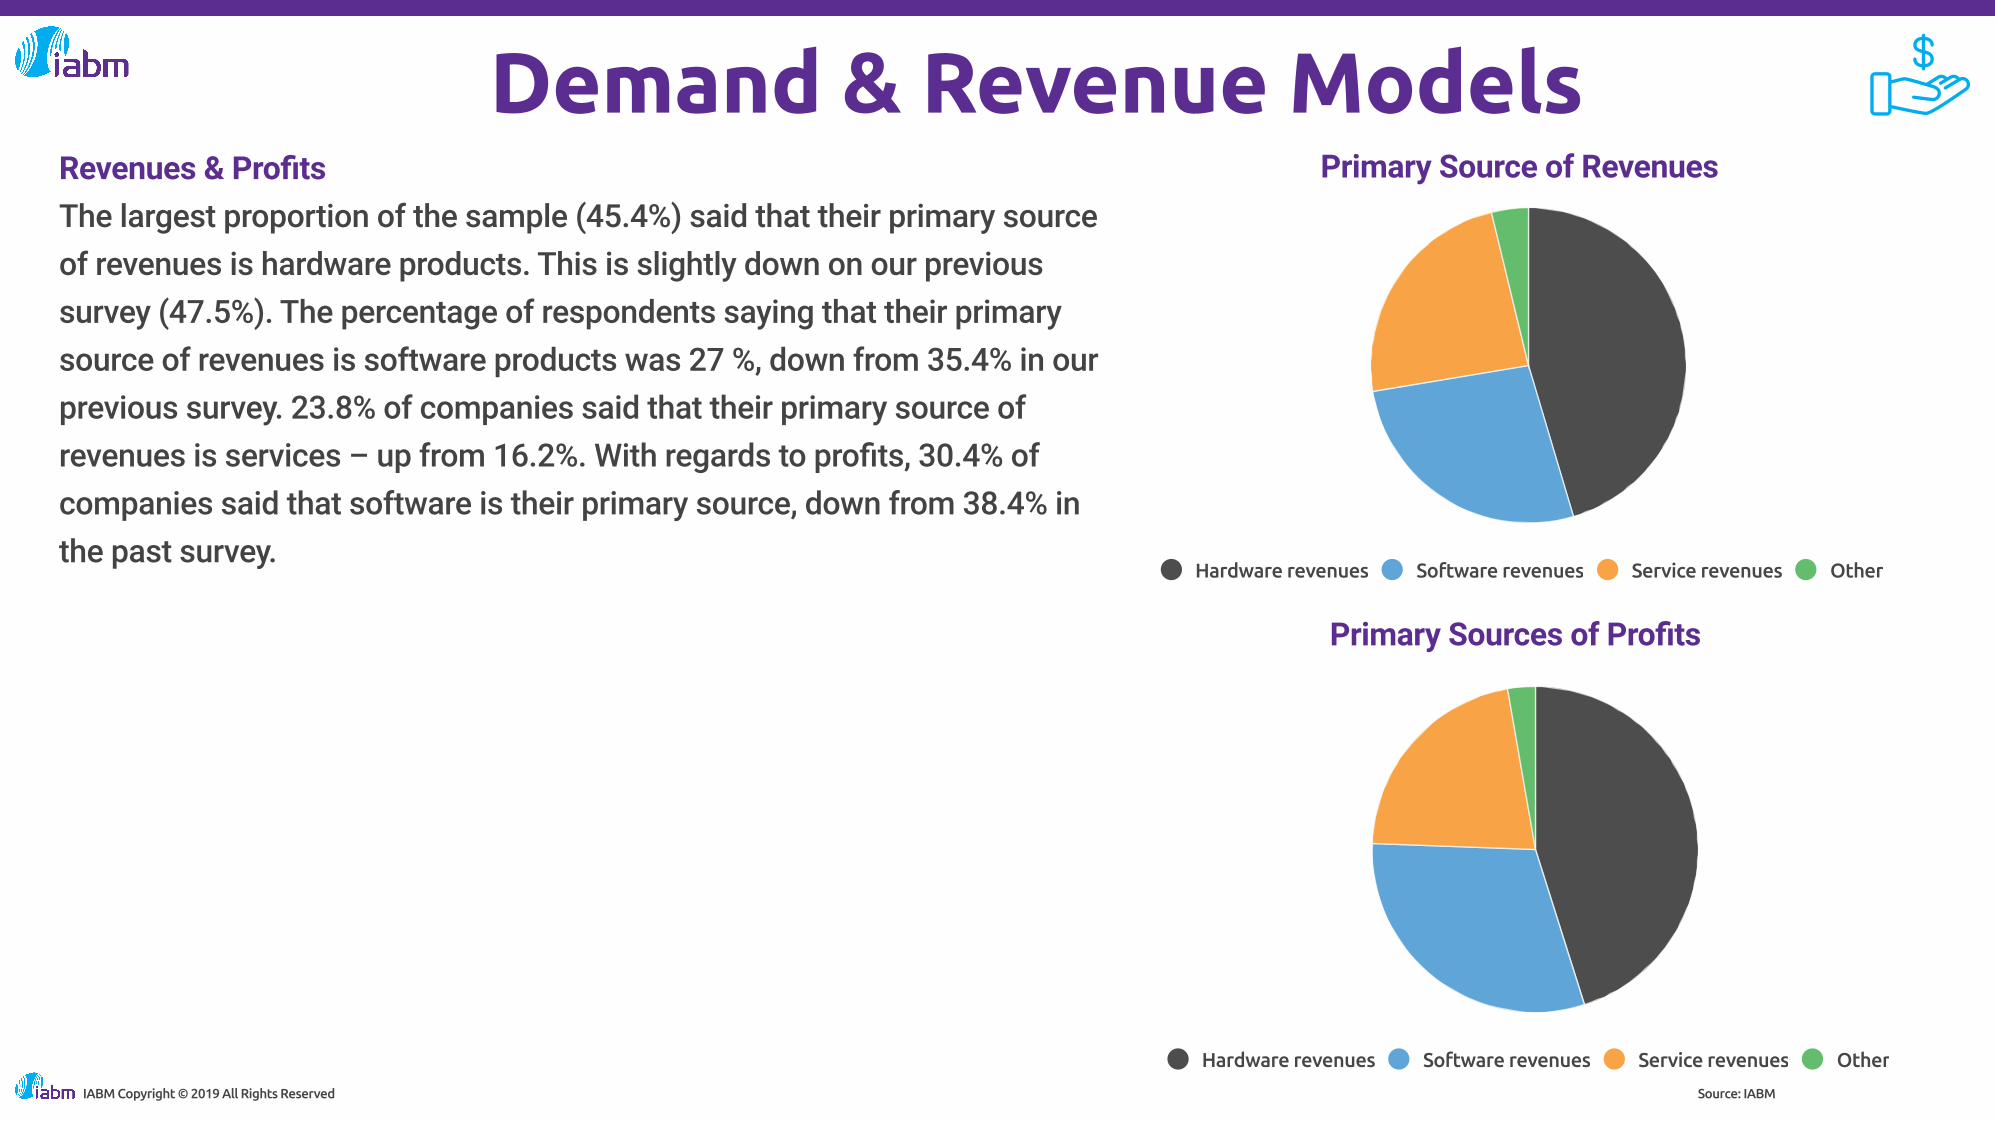
Demand & Revenue ModelsRevenues & Pro�tsThe largest proportion of the sample (45.4%) said that their primary source of revenues is hardware products. This is slightly down on our previous survey (47.5%). The percentage of respondents saying that their primary source of revenues is software products was 27 %, down from 35.4% in our previous survey. 23.8% of companies said that their primary source of revenues is services – up from 16.2%. With regards to pro�ts, 30.4% of companies said that software is their primary source, down from 38.4% in the past survey.
Source: IABM
Primary Source of Revenues
Hardware revenues Software revenues Service revenues Other
Primary Sources of Pro�ts
IABM Copyright © 2019 All Rights Reserved
Hardware revenues Software revenues Service revenues Other
Demand & Revenue ModelsRevenues & Pro�ts
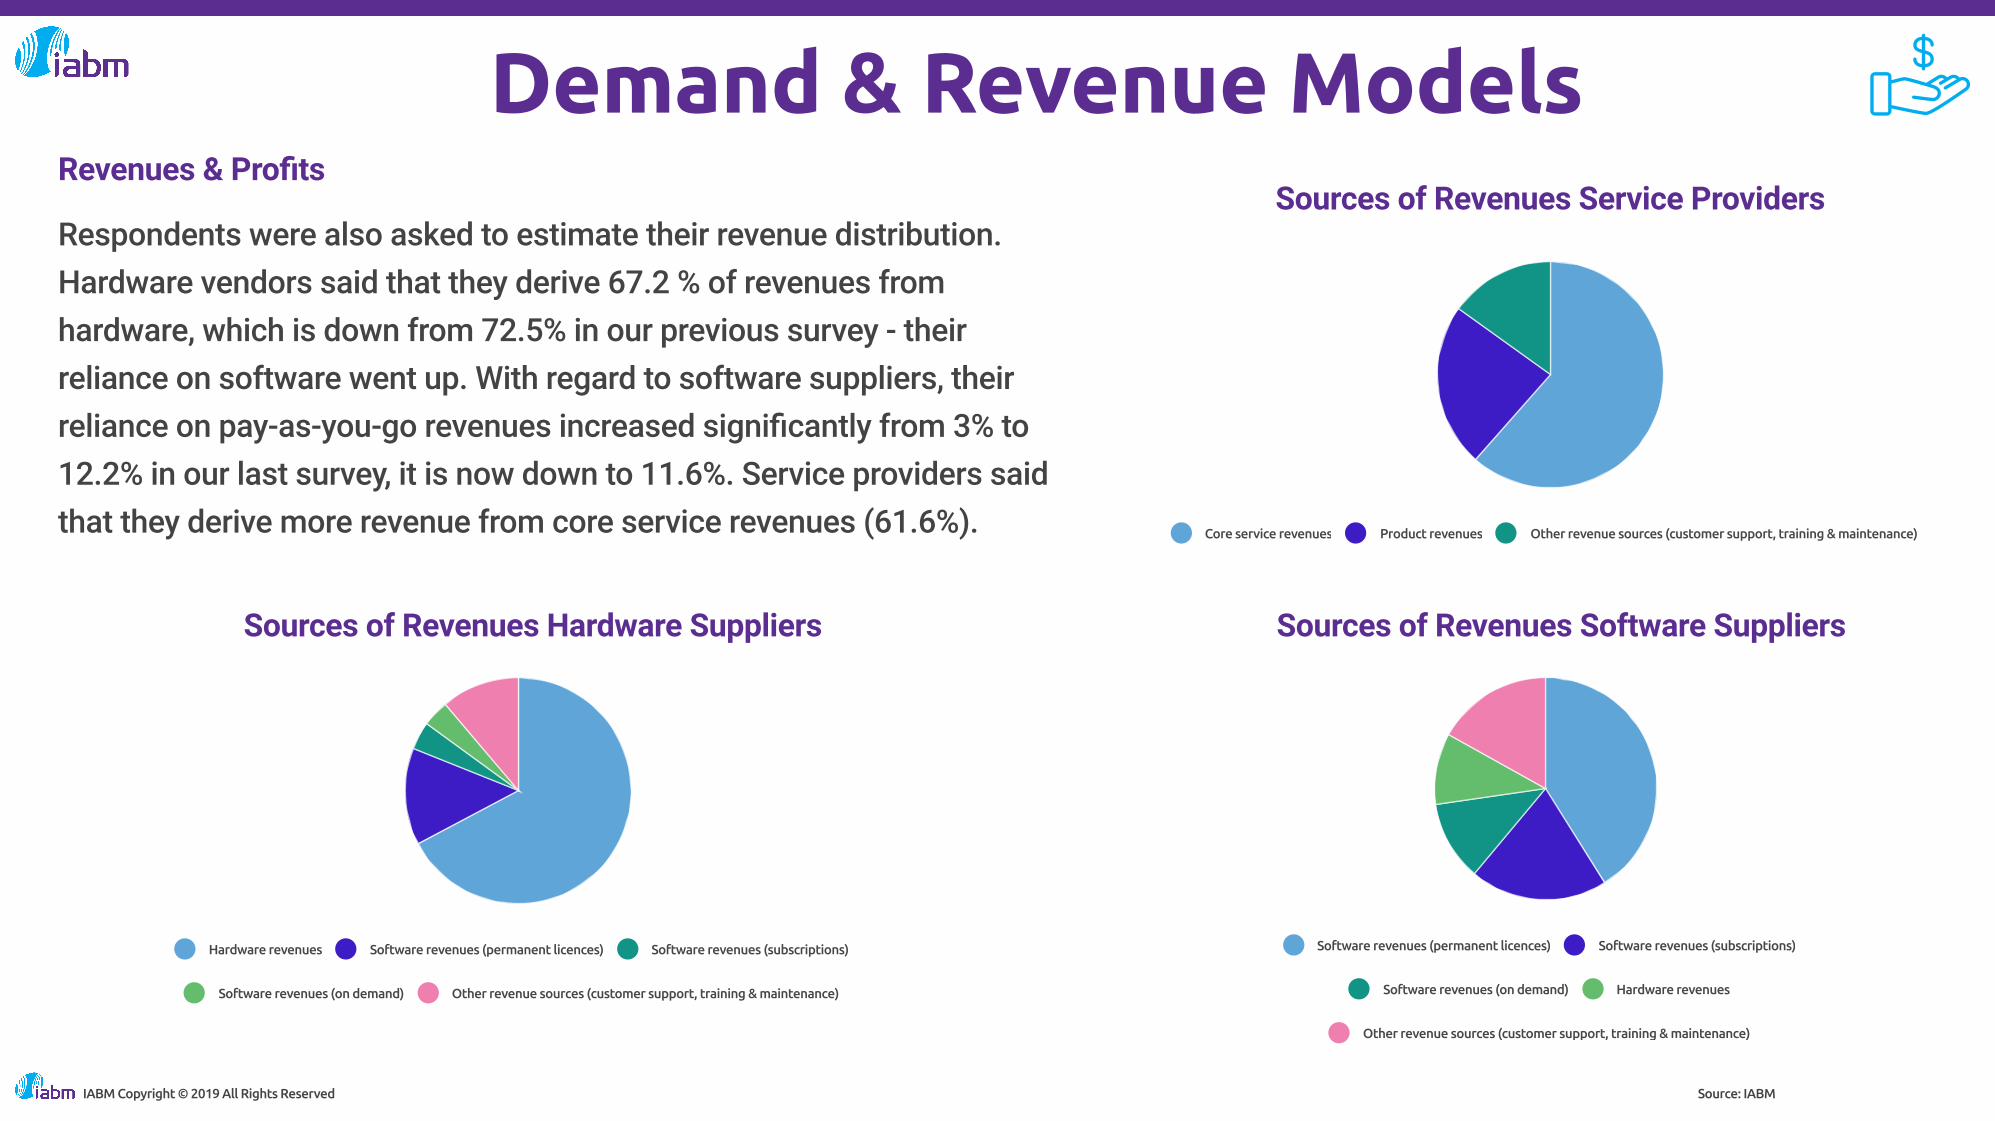
Respondents were also asked to estimate their revenue distribution. Hardware vendors said that they derive 67.2 % of revenues from hardware, which is down from 72.5% in our previous survey - their reliance on software went up. With regard to software suppliers, their reliance on pay-as-you-go revenues increased signi�cantly from 3% to 12.2% in our last survey, it is now down to 11.6%. Service providers said that they derive more revenue from core service revenues (61.6%).
Source: IABM
Core service revenues Product revenues Other revenue sources (customer support, training & maintenance)
Sources of Revenues Hardware Suppliers
IABM Copyright © 2019 All Rights Reserved
Hardware revenues Software revenues (permanent licences) Software revenues (subscriptions)
Software revenues (on demand) Other revenue sources (customer support, training & maintenance)
Software revenues (permanent licences) Software revenues (subscriptions)
Software revenues (on demand) Hardware revenues
Other revenue sources (customer support, training & maintenance)
Sources of Revenues Software Suppliers
Sources of Revenues Service Providers

Demand & Revenue ModelsWith regards to revenue outlook, hardware vendors predicted the highest increase in hardware revenues and other revenue sources (customer support, training and maintenance) while software suppliers predicted the largest increase in subscriptions and on-demand revenues to the detriment of permanent licences. Compared to the previous survey, service providers are less bullish with regards to their outlook for core service revenues. Now there is a small percentage of respondents that sees a future decrease in core service revenues.
Source: IABM
Revenue Outlook - Hardware Suppliers
Software revenues (permanent licences)
Software revenues (subscriptions)
Software revenues (on-demand)
Hardware revenues
Other revenue sources (customer support,
training & maintenance)
0 10 20 30 40 50 60 70 80 90 100
Will increase signi�cantly Will increase Will stay the same Will decrease
Will decrease signi�cantly Dont know / Not applicable
IABM Copyright © 2019 All Rights Reserved
Core service revenues
Product revenues
Other revenue sources
0 10 20 30 40 50 60 70 80 90 100
Will increase signi�cantly Will increase Will stay the same Will decrease
Will decrease signi�cantly Don't know / Not applicable
Revenue Outlook - Service Providers
Revenue Outlook - Software Suppliers
Software revenues (permanent licences)
Software revenues (subscriptions)
Software revenues (on-demand)
Hardware revenues
Other revenue sources (customer
support, training & maintenance)
0 10 20 30 40 50 60 70 80 90 100
Will increase signi�cantly Will increase Will stay the same Will decrease
Will decrease signi�cantly Dont know / Not applicable

Demand & Revenue ModelsRegional GrowthRespondents were asked to rank the three most active regions in terms of sales, both in the last and next 12 months. The top regions were Western Europe, North America, Australasia and Asia - consistent with the number of respondents coming from these regions. With regard to the last twelve months, Asia was rated as the fourth most important region. Respondents expect the importance of the Middle East to increase in the next twelve months. Eastern Europe is also predicted to become the fourth most important territory overall. While the importance of Asia in suppliers’ growth plans is not a surprise, South America is also becoming a fertile market – particularly for Spanish and Portuguese vendors. Long-standing transitions such as the move to digital broadcasting are still important in this region.
Source: IABM
Regional Growth - Ranking Last Twelve Months
Western Europe
North America
Asia
Middle East
Eastern Europe
Africa
Australasia
South America
0 10 20 30 40 50 60 70 80 90 100
IABM Copyright © 2019 All Rights Reserved
Western Europe
North America
Asia
South America
Africa
Eastern Europe
Middle East
Australasia
0 10 20 30 40 50 60 70 80 90 100
Regional Growth - Ranking Next Twelve Months

Demand & Revenue ModelsGrowth ChallengesRespondents were asked to rank the three most important challenges they face in growing their businesses.
Hardware suppliers ranked price/competitive position, supply chain issues and selling capacity as their most important challenges. This is consistent with the comments highlighted in the second section of this report on customers’ uncertainty. The importance of price/competitive position can be traced back to product de�ation as IT technology becomes more pervasive in the industry - this will be analyzed in more detail later in this report. Software suppliers reported that skills and staff, selling capacity and project deferral are their most important challenges. This is coherent with the R&D investment that they make in specialized staff. Service providers rated customer demand for �exible payment models as the most important challenge, followed by selling capacity and political/economic climate.
Source: IABM
Growth Challenges - Software Suppliers
Manufacturing / Development Capacity
Customer Demand for Flexible Payment
Models
Selling Capacity
Restructuring for Technology Change
Supply Chain Issues
Political / Economic Climate
Prices / Competitive Position
Skills & Sta�
Credit & Finance Issues
Regulatory & Compliance Issues
Project Deferral
0 20 40 60 80 100
1 2 3
IABM Copyright © 2019 All Rights Reserved

Demand & Revenue Models
Source: IABMIABM Copyright © 2019 All Rights Reserved
Manufacturing / DevelopmentCapacity
Customer Demand for FlexiblePayment Models
Selling Capacity
Restructuring for TechnologyChange
Supply Chain Issues
Political / Economic Climate
Prices / Competitive Position
Skills & Sta�
Credit & Finance Issues
Regulatory & Compliance Issues
Project Deferral
0 20 40 60 80 100
1 2 3
Growth Challenges - Hardware Suppliers
Growth Challenges - Service Providers

Demand & Revenue ModelsParallel MarketsResearch participants were asked what percentage of their revenues is derived from broadcast customers (broadcasters, media organizations, content distributors etc.) vs non-broadcast customer types. This is important to know as an increasing share of broadcast and media technology suppliers’ customer base comes from a non-media background. The results show that, on average, research participants’ reliance on traditional customers stood at 69%, which is more than in previous editions of this survey.
Finally, we asked respondents to rate their growth in non-media segments compared to broadcast and media. While 71% told us that broadcast and media was stable or declining (48% and 23% respectively), all the non-media segments were reported as high-growth. This was particularly true for eSports (91%) and Security Monitoring (92%) where respondents indicated a growing trend. After these, Mobile/Telecom, Signage and Sports were close followers. The non-media segment showing the lowest growth was Government/Military at 57%.
Source: IABM
% Of Revenues From Traditional Customers - H2 2018
100
80
60
40
20
0
Broadca
st &
Media
Educatio
n / Tra
inin
g
Corpora
te
Mark
eting /
Media
Other
Governm
ent / M
ilita
ry
Sports
Mobile
/ Tele
com
eSports
Wors
hip
Securit
y Monito
ring
Signage
Gamin
g
Growing Stable Declining
Parallel Markets
0% 100%
IABM Copyright © 2019 All Rights Reserved

Costs & PricesThis section tracks the movements in selling prices and costs, including material and labor costs, in the last and next six months.
In the last six months, pressure on selling prices decreased with a higher percentage of companies saying that they have risen or stayed the same. This data can also be read in conjunction with our �nancial performance �gures showing a slight improvement in pro�tability.
With regard to material costs, we have observed a rise in the percentage of respondents saying that they have increased or stayed the same. Labor costs have continued to increase as a result of skills shortages. The in�ation in labor prices is consistent with the increasing importance of skills as a growth challenge for suppliers. In the next six months, most respondents expect selling prices, material costs and labor costs to stay the same.
Last Six Months - Selling Prices
Source: IABM
Last Six Months - Labor Costs
IABM Copyright © 2019 All Rights Reserved
60
50
40
30
20
10
0
H1 2017 H2 2017 H1 2018 H2 2018
Increased Stayed the same Reduced
60
50
40
30
20
10
0
H1 2017 H2 2017 H1 2018 H2 2018
Increased Stayed the same Reduced

Costs & Prices
Source: IABMIABM Copyright © 2019 All Rights Reserved
80
60
40
20
0
H1 2017 H2 2017 H1 2018 H2 2018
Increased Stayed the same Reduced
Last Six Months - Material Costs
Next Six Months - Selling Prices
60
50
40
30
20
10
0
H1 2017 H2 2017 H1 2018 H2 2018
Will increase Will stay the same Will reduce
70
60
50
40
30
20
10
0
H1 2017 H2 2017 H1 2018 H2 2018
Will increase Will stay the same Will reduce
70
60
50
40
30
20
10
0
H1 2017 H2 2017 H1 2018 H2 2018
Will increase Will stay the same Will reduce
Next Six Months - Labor Costs
Next Six Months - Material Costs

Investment
This section analyzes how media technology suppliers’ investment is changing and on which technologies they are focusing their spending.
Personnel InvestmentRecruitment of new personnel has signi�cantly decreased in the last six months, with 21% of companies saying that they have decreased headcount. With regards to the next six months, a higher percentage of companies (53%) expect to increase recruitment of personnel.
Personnel Investment - 6 months' time compared to now
Source: IABM
Personnel Investment - Now compared to 6 months ago 60
50
40
30
20
10
0
H1 2017 H2 2017 H1 2018 H2 2018
Higher The same Lower
IABM Copyright © 2019 All Rights Reserved
60
50
40
30
20
10
0
H1 2017 H2 2017 H1 2018 H2 2018
Higher The same Lower
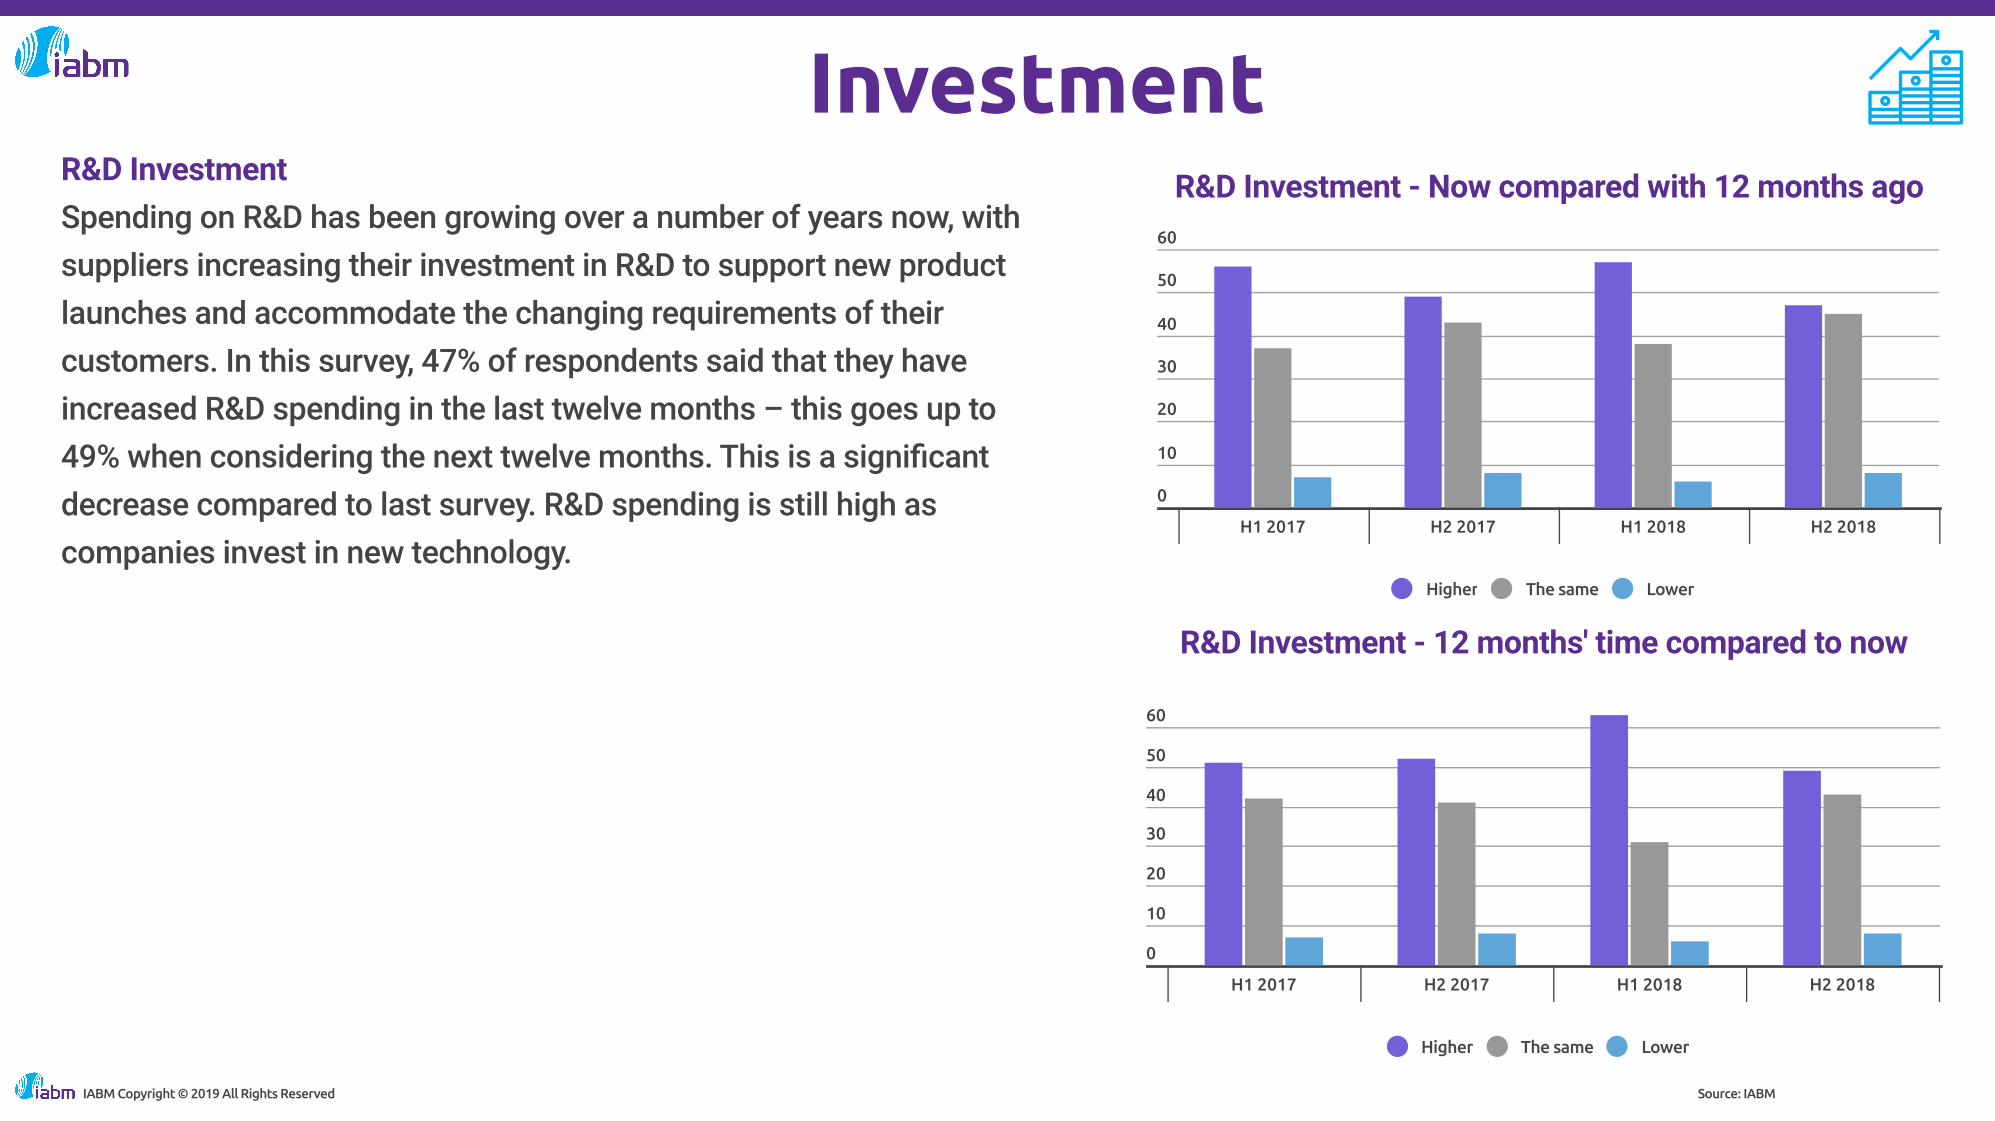
InvestmentR&D InvestmentSpending on R&D has been growing over a number of years now, with suppliers increasing their investment in R&D to support new product launches and accommodate the changing requirements of their customers. In this survey, 47% of respondents said that they have increased R&D spending in the last twelve months – this goes up to 49% when considering the next twelve months. This is a signi�cant decrease compared to last survey. R&D spending is still high as companies invest in new technology.
R&D Investment - 12 months' time compared to now
Source: IABM
60
50
40
30
20
10
0
H1 2017 H2 2017 H1 2018 H2 2018
Higher The same Lower
R&D Investment - Now compared with 12 months ago
IABM Copyright © 2019 All Rights Reserved
60
50
40
30
20
10
0
H1 2017 H2 2017 H1 2018 H2 2018
Higher The same Lower

InvestmentWe asked respondents to report their R&D spending as a percentage of annual sales. On average, respondents reported that their companies spend 25% of their annual sales on R&D, signi�cantly up from 18% in our previous survey. Hardware and software suppliers spend respectively 19.6% and 37.1% of their sales on R&D.
Research participants were also asked which emerging technologies were the focus of their R&D strategy going forward. Similar to last survey, IP is on top with cloud/virtualization and UHD following closely. This indicates an increasing importance of IP and the cloud and virtualization in suppliers’ R&D plans as their customers invest in these technologies going forward.
The primary focuses for hardware and software suppliers were IP and cloud/virtualization respectively. Compared to last survey, it is important to highlight that the importance of AI/machine learning has decreased by 4% and UHD has remained the same.
R&D Investment Focus H2 2018
Source: IABM
R&D as % of Sales
0% 100%
IP Technology
Cloud/Virtualization
UHD
AI/Machine Learning
Advanced Advertising Technology
VR/AR
Other
Blockchain
0 5 10 15 20 25 30 35 40 45 50 55 60
IABM Copyright © 2019 All Rights Reserved
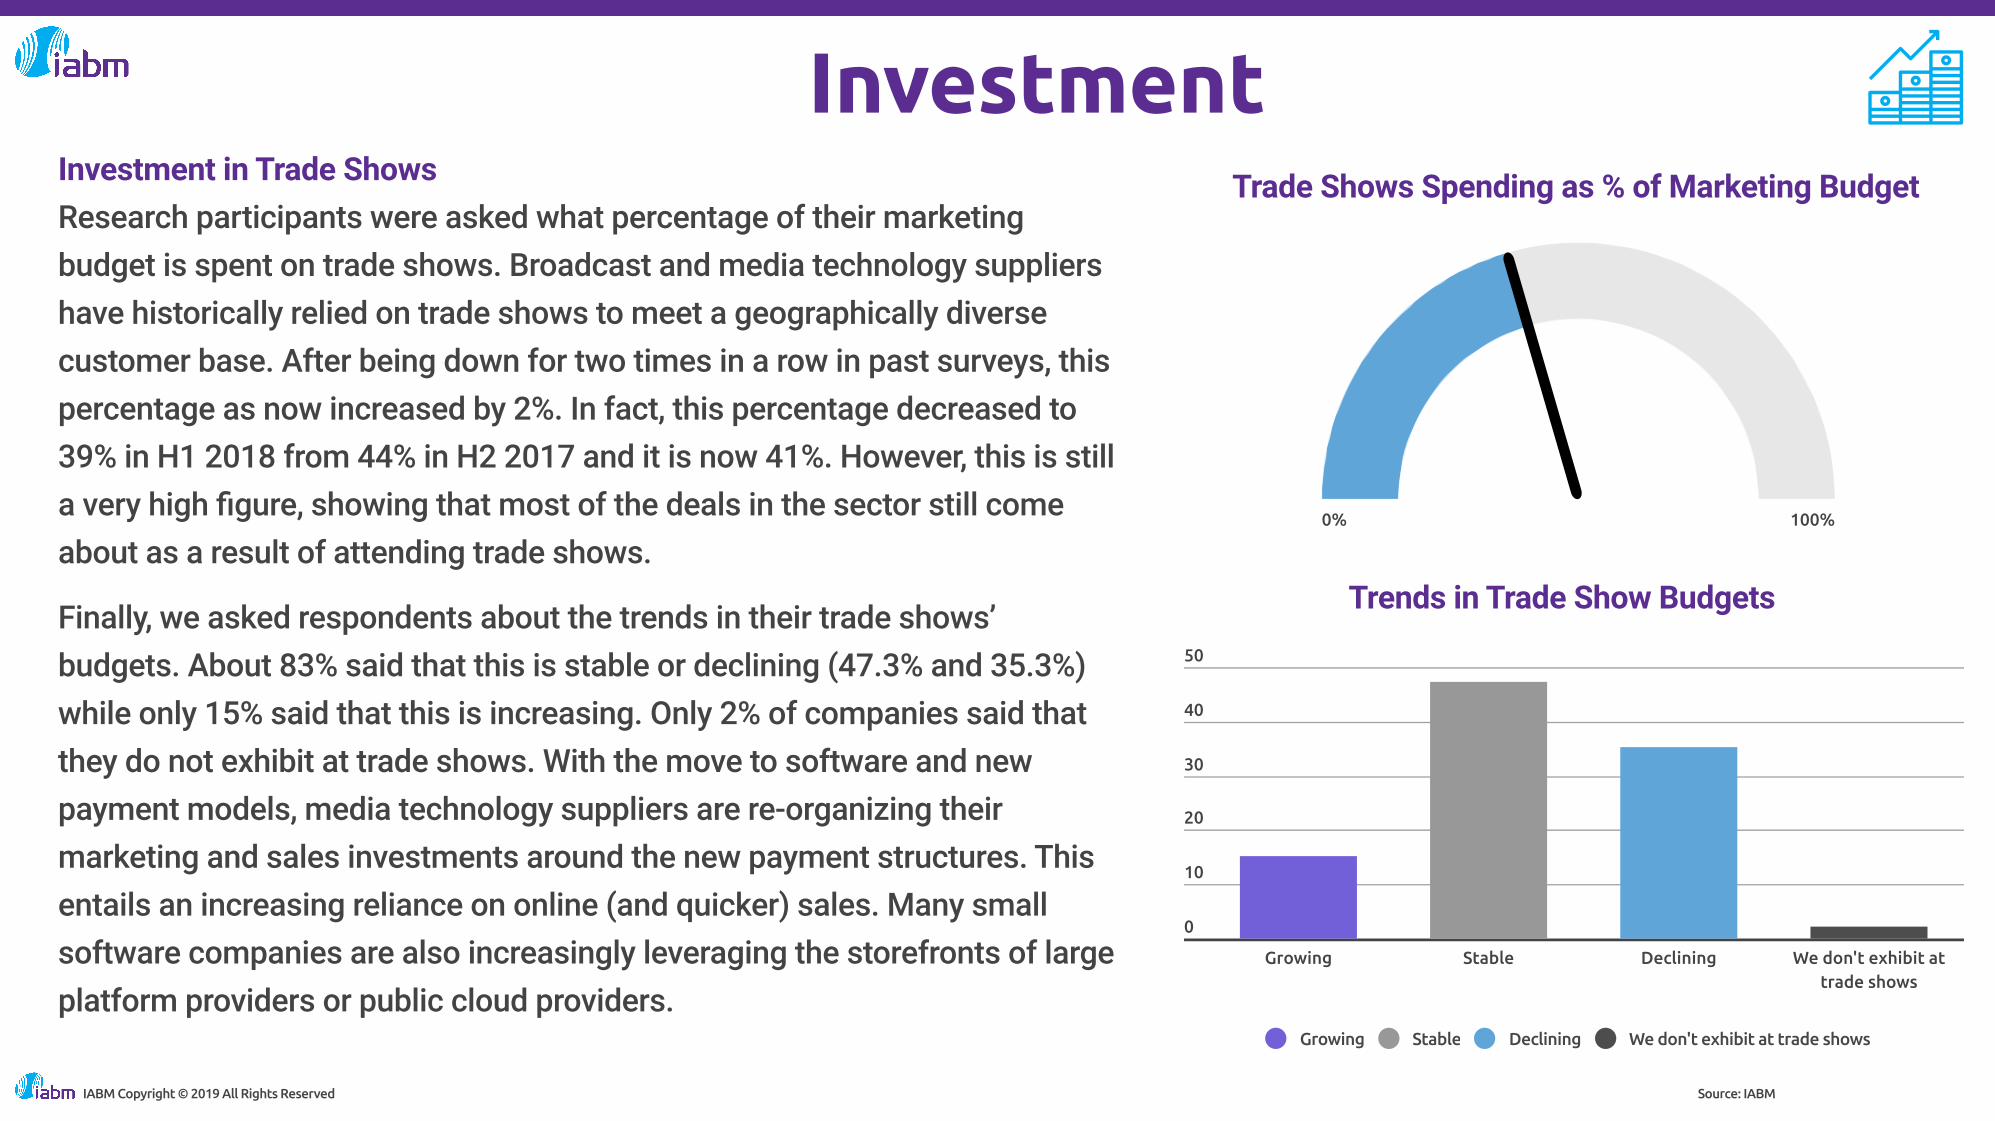
InvestmentInvestment in Trade ShowsResearch participants were asked what percentage of their marketing budget is spent on trade shows. Broadcast and media technology suppliers have historically relied on trade shows to meet a geographically diverse customer base. After being down for two times in a row in past surveys, this percentage as now increased by 2%. In fact, this percentage decreased to 39% in H1 2018 from 44% in H2 2017 and it is now 41%. However, this is still a very high �gure, showing that most of the deals in the sector still come about as a result of attending trade shows.
Finally, we asked respondents about the trends in their trade shows’ budgets. About 83% said that this is stable or declining (47.3% and 35.3%) while only 15% said that this is increasing. Only 2% of companies said that they do not exhibit at trade shows. With the move to software and new payment models, media technology suppliers are re-organizing their marketing and sales investments around the new payment structures. This entails an increasing reliance on online (and quicker) sales. Many small software companies are also increasingly leveraging the storefronts of large platform providers or public cloud providers.
Source: IABM
Trade Shows Spending as % of Marketing Budget
0% 100%
50
40
30
20
10
0
Growing Stable Declining We don't exhibit attrade shows
Growing Stable Declining We don't exhibit at trade shows
Trends in Trade Show Budgets
IABM Copyright © 2019 All Rights Reserved

Skills & TrainingSkills shortages is a widely recognized issue in the media technology industry. In this section, we aim to investigate which jobs and skills are the most sought after in the industry.
Engineering and other technical staff remain the most di�cult to recruit or train for 63% of respondents; this is marginally up from 59% in the last survey. With almost 80% of companies saying that engineering/technical and sales staff are the most di�cult to recruit or train, the industry is still coping with the change in skillset caused by the transition to IT technologies. IP adoption at broadcast organizations is rising and broadcast engineers at both technology supplier and user organizations are now required to understand the complexity of making IP work in broadcast. This is shown by the fact that engineers with both broadcast and IT skills remain the most sought after, followed by software IT engineers. Traditional broadcast engineers were chosen by only 7% of respondents. With regards to sales staff, technical sales remained the most sought after. Sales staff with a deep technical knowledge of company products/services are still considered to be harder to �nd and train than non-technical sales staff.
Most Di�cult Staff to Recruit/Train
Source: IABM
Marketing skills/sta� Engineering & other technical skills/sta� Sales skills/sta�
Finance skills/sta� Management skills/sta� Other
IABM Copyright © 2019 All Rights Reserved

OutlookThese results show that the supply side of the industry is still in �ux, with changing business models and buyers’ purchasing behavior having a signi�cant impact on its general performance and sentiment.
Although sales and pro�ts have continued to be disappointing in the second half of 2018, they have shown a notable improvement compared to previous reports. Pro�ts, particularly, have continued to improve as media technology suppliers have reduced costs and expanded into new markets. The progress in the transition to new offerings such as software subscriptions also positively impacted pro�ts. Sales growth continued to be positive although the growth rate remains scant (still below 3%). This rate is much lower than the high growth experienced by large emerging industry players such as cloud service providers. The positive impact of sporting events (e.g. FIFA World Cup) in the second part of the year lifted the general level of sales but not as much as some might have thought. Signi�cant drivers of change such as the adoption of cloud technology are playing an important role in undermining this historical cyclicality of media technology sales.
Sales Growth
Source: IABM
4.5
4.0
3.5
3.0
2.5
2.0
1.5
1.0
0.5
0
H1 2014 H2 2014 H1 2015 H2 2015 H1 2016 H2 2016 H1 2017 H2 2017 H1 2018 H2 2018
15
10
5
0
-5
-10
-15
-20
-25
H1 2014 H2 2014 H1 2015 H2 2015 H1 2016 H2 2016 H1 2017 H2 2017 H1 2018 H2 2018
Pro�ts Growth
IABM Copyright © 2019 All Rights Reserved
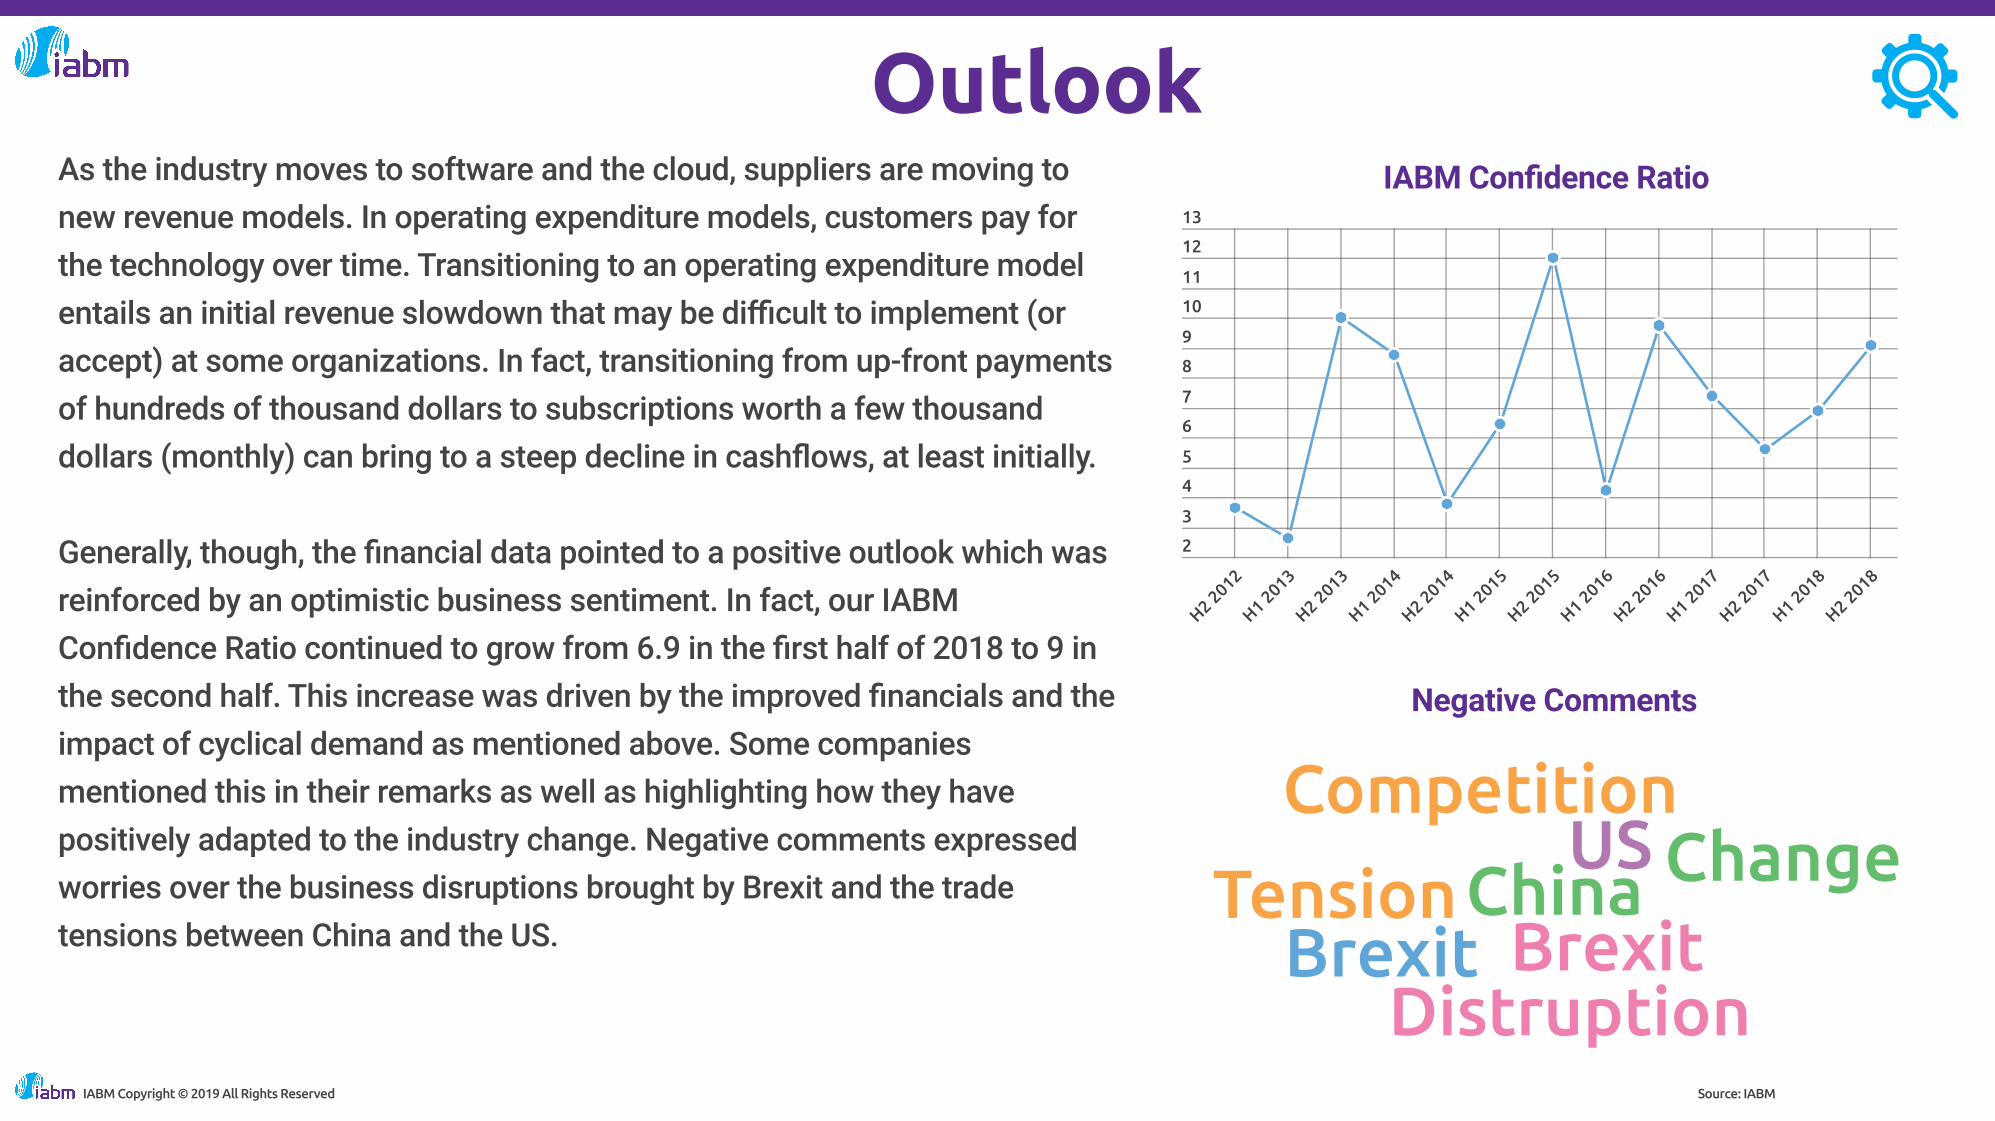
OutlookAs the industry moves to software and the cloud, suppliers are moving to new revenue models. In operating expenditure models, customers pay for the technology over time. Transitioning to an operating expenditure model entails an initial revenue slowdown that may be di�cult to implement (or accept) at some organizations. In fact, transitioning from up-front payments of hundreds of thousand dollars to subscriptions worth a few thousand dollars (monthly) can bring to a steep decline in cash�ows, at least initially. Generally, though, the �nancial data pointed to a positive outlook which was reinforced by an optimistic business sentiment. In fact, our IABM Con�dence Ratio continued to grow from 6.9 in the �rst half of 2018 to 9 in the second half. This increase was driven by the improved �nancials and the impact of cyclical demand as mentioned above. Some companies mentioned this in their remarks as well as highlighting how they have positively adapted to the industry change. Negative comments expressed worries over the business disruptions brought by Brexit and the trade tensions between China and the US.
IABM Con�dence Ratio
Source: IABM
Negative Comments
2
3
4
5
6
7
8
9
10
11
12
13
H2 2012
H1 2013
H2 2013
H1 2014
H2 2014
H1 2015
H2 2015
H1 2016
H2 2016
H1 2017
H2 2017
H1 2018
H2 2018
ChinaBrexit
USCompetition
BrexitTension Change
DistruptionIABM Copyright © 2019 All Rights Reserved

OutlookComing back to the industry change, the increase in the adoption of emerging technologies is shown by our Buying Trends data. For some technologies, adoption has been lower than expected (e.g. UHD and IP) despite suppliers’ high investment in developing offerings to enables these. This is changing as the average share of revenues derived from the sales of IP-based systems rose signi�cantly in this survey, from 24% to 38%. This is consistent with companies in Connect reporting a signi�cant increase in demand compared to our previous survey – the transition to IP is the most important driver of sales in Connect. UHD adoption grew as well as evidenced by the number of UHD deployments at the recent FIFA World Cup. However, UHD remains the exception rather than the norm, particularly in content distribution. In fact, in Publish, technology suppliers see multi-platform delivery and work�ow automation as more important revenue drivers than immersive formats such as UHD (and VR). Most of the Publish suppliers also continue to see a shift in demand from linear to internet distribution of content, as one would expect.
Source: IABM
Most Important Demand Drivers
38%IP-based systems rose signi�cantly. It is the most important driver of sales in Connect.
IABM Copyright © 2019 All Rights Reserved
SDI to IP Transition
Work�ow Automation
Asset Optimization
Commoditization
Remote Production
Customer Consolidation
BIY
Multi-Platform Content Delivery
Adoption of AI/Machine Learning
Virtualization
Upgrade to Immersive Formats
Upgrade to Next-Generation Terrestrial Standards
5G
Adoption of Programmatic / Targeted Advertising
Other
0% 10% 20% 30% 40% 50% 60% 70% 80% 90% 100%
Create Produce Manage Publish Monetize Consume Connect Support Store

OutlookAlthough IP and UHD remain important topics, our demand analysis shows that most investment is going into Manage, which is being driven by different priorities such as work�ow automation and asset optimization. This is consistent with the continued focus of buyers on e�ciency. Also, this shows how content management and orchestration systems are seen by media companies as key to becoming content factories capable of delivering video to any platform – the rise of OTT is the most important trend in Manage. The second fastest-growing content chain block was Monetize followed by Connect, as mentioned above.
In terms of demand drivers, our data has continued to show a divide between different content chain blocks. Some like Create, Produce and Connect continue to be driven by the transition to IP while others like Manage, Publish, Monetize and Consume seem more focused on work�ow automation and programmatic advertising.
Source: IABM
Create, Produce & Connect continue to be driven by the transition to IP
Manage, Publish, Monetize & Consume are more focused on workflow automation and programmatic advertising
Rise of OTT is the most important trend in Manage
IABM Copyright © 2019 All Rights Reserved

OutlookAnother divide shown by our data is the one between hardware and software suppliers. The latter category continues to be more positive and to predict a larger increase in revenues. The challenges faced by hardware suppliers are also completely different as most of them cite competitive pressures as the most important constraint preventing them from growing. As noted earlier, some of these suppliers have diversi�ed their offerings to compensate for that. Software suppliers cite selling capacity and skills and staff as the most important growth challenges. In fact, to be able to help media technology users transition to next-generation infrastructures running mostly on IT technology, software vendors need to have a workforce that understands both the tools of IT and the requirements of broadcast.
Source: IABM
Manufacturing /Development Capacity
Customer Demand forFlexible Payment Models
Selling Capacity
Restructuring forTechnology Change
Supply Chain Issues
Political / EconomicClimate
Prices / CompetitivePosition
Skills & Sta�
Credit & Finance Issues
Regulatory & ComplianceIssues
Project Deferral
0 20 40 60 80 100
1 2 3
Growth Challenges Software Suppliers
IABM Copyright © 2019 All Rights Reserved

Outlook
The transition to new media offerings continues and our latest data brings good news about it. However, it is important to note how we are still in the midst of this shift and that change is accelerating on the demand-side as well. In 2019, more media companies will launch direct-to-consumer offerings in what looks like a digital war with streaming players.
Source: IABM
Growth Challenges Hardware Suppliers
IABM Copyright © 2019 All Rights Reserved
Manufacturing / Development Capacity
Customer Demand for Flexible Payment Models
Selling Capacity
Restructuring for Technology Change
Supply Chain Issues
Political / Economic Climate
Prices / Competitive Position
Skills & Sta�
Credit & Finance Issues
Regulatory & Compliance Issues
Project Deferral
0 20 40 60 80 100
1 2 3
Growth Challenges Service Providers

AppendixIABM Supply Trends IndexThe IABM Supply Trends Index tracks year-on-year change in overall sales and pro�tability for the media technology sector worldwide by examining the latest reported �nancial data. Only data from organizations or divisions trading exclusively or almost exclusively in broadcast and media technology products and/or services are included. It should be noted that this is a wide scope and is not just restricted to the “traditional broadcast” market.
Sales and pro�t indices are based on the aggregation of the latest published 12-month period per company compared to the prior 12-month period. These indices look at overall company performance across a wide range of company types and diverse products and services. The situation within a single category or in multiple product categories may be materially different. The �gures we report in the analysis are six-month moving averages. A six-month moving average (6MA) is commonly used in time-series analysis to extract the seasonal component from the data. It is calculated by dividing the values of interest (i.e. sales, pro�ts) of the last six months by six. The Index includes a mix of companies, private and public, small to large, predominantly from North America and Western Europe.
IABM Copyright © 2019 All Rights Reserved

AppendixIABM Supply Trends SurveyThe IABM Supply Trends Survey is a biannual survey of trends and opinions of media technology executives. This latest survey was taken between December 2018 and January 2019.The sample of this survey is made up of 330 responses of which 185 were complete and 145 were partial. 24
22
20
18
16
14
12
10
8
6
4
2
0
Less than 20 employees Between 21 and 50employees
Between 51 and 100employees
Between 101 and 250employees
Between 251 and 500employees
Between 501 and 1000employees
Between 1001 and 5000employees
Over 5000
IABM Copyright © 2019 All Rights Reserved Source: IABM
Organizations' Size
AppendixDe�nitions
Sales growth: the sum of sales for all companies compared to the sum for the prior period Pro�tability growth: aggregate market – the sum of operating pro�t (or loss) before interest and tax for all the companies, compared to the prior year IABM Con�dence Ratio: a ratio of the percentage of respondents with increased con�dence over the percentage of respondents with decreased con�dence. This ratio does not account for neutral respondents
R&D Investment: R&D investment is reported as a percentage of total annual sales Trade Shows Investment: Trade shows investment is reported as a percentage of the total annual marketing budget
IABM Copyright © 2019 All Rights Reserved

About IABM Business Intelligence Unit
Lorenzo Zanni, Head of Insight & Analysis
Riikka Koponen, Principal Analyst
Chiara Raucci, Research Analyst
Contact us at:
IABM Copyright © 2019 All Rights Reserved

About IABM
IABM is the international trade association for suppliers of broadcast and media technology. IABM facilitates the important networking and interaction between suppliers that shape and de�ne the unique ecosystem of the broadcast and media technology industry.IABM supports member companies with a comprehensive range of services across market intelligence, training, events, technology, exhibitions, business standards and best practices. We hold the interests of member companies as paramount, and strive to provide strong guidance and support at every level in all geographies.We understand that in today’s rapidly changing media landscape, our members have never had a greater need for timely, relevant and effective advice and support. IABM’s mission is to be an ever more powerful beacon illuminating the way forward, highly responsive to all our members’ needs and helping them to successfully navigate change and prosper.Further information about IABM and its activities can be found at www.theiabm.org.
IABM Copyright © 2019 All Rights Reserved