february 2010 temporary assistance for needy … · the decline in the number of poor families...
TRANSCRIPT

GAO United States Government Accountability Office
Report to the Chairman, Subcommittee on Income Security and Family Support, Committee on Ways and Means, House of Representatives
TEMPORARY ASSISTANCE FOR NEEDY FAMILIES
Fewer Eligible Families Have Received Cash Assistance Since the 1990s, and the Recession’s Impact on Caseloads Varies by State
February 2010
GAO-10-164

What GAO Found
United States Government Accountability Office
Why GAO Did This Study
HighlightsAccountability Integrity Reliability
February 2010 TEMPORARY ASSISTANCE FOR NEEDY
FAMILIES
Fewer Eligible Families Have Received Cash Assistance Since the 1990s, and the Recession's Impact on Caseloads Varies by State
Highlights of GAO-10-164, a report to the Chairman, Subcommittee on Income Security and Family Support, Committee on Ways and Means, House of Representatives
Following sweeping changes made to federal welfare policy in 1996 with the creation of the Temporary Assistance for Needy Families (TANF) program, the number of needy families who received cash assistance fell by more than half to 1.7 million in 2008. Poverty among children also fell from about 21 percent in 1995 to about 16 percent in 2000, rising again to 19 percent in 2008. The current recession deepened in 2008, raising questions about state TANF programs’ response to increased needs. GAO was asked to provide Congress with information on the (1) factors contributing to the decline in the number of families receiving assistance; (2) characteristics of participating and nonparticipating eligible families; (3) impact of higher participation in TANF cash assistance on child poverty; and (4) changes states are experiencing in caseloads and spending in the current recession. GAO’s methodologies included using microsimulation analyses; reviewing relevant research and federal laws; interviewing TANF officials in 21 selected states; analyzing state cash assistance data; and interviewing researchers, federal officials, and other experts.
What GAO Recommends
GAO is not making recommendations in this report. Inits comments, the Department of Health and Human Services noted that the report was informativdid not disagree with GAO’s findings. GAO also addressed
The decline in the number of poor families receiving cash assistance from 1995 to 2005 reflects declines in both the number of eligible families and in eligible families’ participation. The strong economy of the 1990s, TANF’s focus on work, and other factors contributed to increased family incomes and a decline in the number of eligible families. However, most of the caseload decline—about 87 percent—resulted from fewer eligible families participating in the program, perhaps in response to TANF work requirements, time limits, and sanction and diversion policies. Compared to TANF families, eligible nonparticipating families worked more and had higher incomes and educational levels. However, among eligible families who did not participate, 11 percent did not work, did not receive means-tested disability benefits, and had very low incomes. 800,000 fewer children would live in extreme poverty—below half the federal poverty threshold—if participation increased from 40 percent to 84 percent of eligible families, the level it reached in 1995, the year before TANF was created. While TANF benefits would generally increase incomes, higher participation would not significantly change the number of children in poverty overall, partly because many children in poverty are not poor enough to be eligible for TANF and because TANF cash benefits are typically low. From June 2008 to June 2009, the number of families receiving TANF cash assistance rose in 12 of the 21 states GAO surveyed, although the recession’s impact on cash assistance caseloads varied by state. To offset higher costs of cash assistance, few states reported reducing TANF-related spending on family- and/or work-supports during this time period. Instead, states paid for increases by using funding sources such as 2009 emergency stimulus funds.
Families Estimated as Eligible for and Participating in AFDC or TANF Cash Assistance Programs, Monthly Average, by Calendar Year, 1995 through 2005
e and
technical comments as appropriate.
View GAO-10-164 or key components. For more information, contact Kay E. Brown at (202) 512-7215 or [email protected].

Page i GAO-10-164
Contents
Letter 1
Background 5 Factors Contributing to the Decline in Cash Recipients Include
Declines in the Number of Eligible Families and in Eligible Families’ Participation 10
Eligible Nonparticipating Families Generally Had Higher Incomes Than TANF Recipients, but a Portion of Eligible Nonparticipants Had Very Low Incomes 24
Increased TANF Participation Would Reduce the Number of Children in Extreme Poverty, but Would Not Significantly Change the Number in Poverty 35
In the Current Recession, Changes in Cash Assistance Caseloads Varied Widely in States We Surveyed While Few States Reduced Spending for Family and/or Work Supports 41
Agency Comments and Our Evaluation 50
Appendix I Objectives, Scope, and Methodology 52
Appendix II Comments from the Department of Health and Human
Services 60
Appendix III GAO Contact and Staff Acknowledgments 63
Related GAO Reports 64
Tables
Table 1: Cash Assistance Caseload Changes and Unemployment Information in Selected States, June 2008 through June 2009 46
Table 2: Disposition of Spending for Family and/or Work Supports by States That Increased Spending on Cash Assistance, Selected States, June 2008 through June 2009 48
TANF Cash Assistance

Table 3: Sources of Funding Used by States to Offset Increased Spending on TANF-related Cash Assistance, June 2008 through June 2009 49
Figures
Figure 1: Families Estimated as Eligible for and Participating in Cash Assistance through the AFDC or TANF Cash Assistance Programs, Monthly Average, by Calendar Year, 1995 through 2005 16
Figure 2: Estimated Impact of Monthly TANF Cash Assistance Receipt on the Net Income of a Working Parent Who Receives Other Supports 21
Figure 3: TANF Cash Assistance: Estimates of Participating and Eligible Nonparticipating Families in 2005, Annual Basis 26
Figure 4: Estimated Median Annual Incomes of TANF-Eligible Families in 2005 27
Figure 5: Receipt of Other Public Supports among Estimated TANF-Eligible Families in 2005, Annual Basis 29
Figure 6: Race and Ethnicity of Estimated TANF-Eligible Families in 2005, Annual Basis 30
Figure 7: Family Structure of Estimated TANF-Eligible Families in 2005, Annual Basis 31
Figure 8: Estimated Eligible Nonparticipating Families as a Share of Total Eligible Families in 2005, Annual Basis 32
Figure 9: Receipt of Other Public Supports among Estimated TANF-Eligible Families in 2005, by Eligible Family Type, Annual Basis 34
Figure 10: Estimated Impact of Monthly TANF Cash Assistance Receipt on a Family in Extreme Poverty in Illinois in 2005: A Working Single Parent with One or Two Children 37
Figure 11: Estimated Impact of Monthly TANF Cash Assistance Receipt on a Family in Poverty in Illinois in 2005: A Working Single Parent with One or Two Children 40
Figure 12: Percent Change in the Number of Families Receiving TANF Cash Assistance, by State, June 2008 through June 2009 42
Figure 13: For States with a Solely State-Funded Program, Percent Change in the Number of Families Receiving Cash Assistance from TANF and from TANF and Solely State-Funded Programs Combined, June 2008 through June 2009 45
Page ii GAO-10-164 TANF Cash Assistance
Abbreviations
ACF Administration for Children and Families AFDC Aid to Families with Dependent Children ARRA American Recovery and Reinvestment Act of 2009 ASEC Annual Social and Economic Supplement BLS U. S. Bureau of Labor Statistics CCDF Child Care and Development Fund CPS Current Population Survey EITC Earned Income Tax Credit HHS Department of Health and Human Services MOE maintenance of effort PRWORA Personal Responsibility and Work Opportunity
Reconciliation Act of 1996 SNAP Supplemental Nutrition Assistance Program SSBG Social Services Block Grant SSDI Social Security Disability Insurance SSI Supplemental Security Income SSP separate state program TANF Temporary Assistance for Needy Families TRIM3 Transfer Income Model, version 3 UI Unemployment Insurance WIC Special Supplemental Nutrition Assistance Program for
Women, Infants, and Children
This is a work of the U.S. government and is not subject to copyright protection in the United States. The published product may be reproduced and distributed in its entirety without further permission from GAO. However, because this work may contain copyrighted images or other material, permission from the copyright holder may be necessary if you wish to reproduce this material separately.
Page iii GAO-10-164 TANF Cash Assistance

Page 1 GAO-10-164
United States Government Accountability Office
Washington, DC 20548
February 23, 2010
The Honorable Jim McDermott Chairman Subcommittee on Income Security and Family Support Committee on Ways and Means House of Representatives
Dear Mr. Chairman:
Following sweeping changes made to federal welfare policy in 1996 with the creation of the Temporary Assistance for Needy Families (TANF) program, the number of needy families receiving cash assistance fell significantly, from 4.8 million families on average each month in 1995—just prior to the creation of TANF—to 1.7 million on average each month in 2008.1 With the creation of TANF, welfare changed from a program entitling eligible families to monthly cash payments to a capped block grant that emphasized employment and work supports for most adult participants who receive such assistance. Since 1996, the decline in the number of families receiving cash assistance has been cited as evidence of welfare reform’s success in reducing families’ dependency on government benefits—a chief program goal. The extent of the decline, however, was deeper and faster—especially in the late 1990s—than analysts and others had anticipated, and the number of low-income families who were eligible for TANF cash assistance but who did not participate in the program increased.
During this period, poverty among all children initially fell, from about 21 percent in 1995 to about 16 percent in 2000—the lowest level since the late 1970s, according to U.S. Census data. Poverty for all children then rose thereafter until it reached 19 percent in 2008. Most families receiving cash assistance are single mothers with children, and children in such families have historically experienced high rates of poverty. The recession that began in late 2007 deepened nationally in 2008, putting additional pressures on families living in poverty, especially families with children, who are particularly vulnerable. The growing recession also raised
1These data are from the Department of Health and Human Services (HHS) for the average monthly caseload for families receiving cash assistance in calendar years 1995 and 2008.
TANF Cash Assistance

questions about how states, which provide cash assistance to families through TANF, would address any increases in need.
In light of the decline in the number of low-income families who receive cash assistance, especially given the current recession, you asked us to examine what is known about the factors contributing to this decline and its implications. More specifically, you asked us to address the following questions:
1. What factors have contributed to the decline in families receiving TANF cash assistance since the 1990s?
2. Among eligible families, how do the characteristics of families who do not receive TANF cash assistance compare with families who do receive TANF cash assistance?
3. How does the participation of eligible families in TANF affect the number of children in extreme poverty and poverty?
4. In the current recession, what changes are states experiencing in their cash assistance caseloads and what changes, if any, have states made in their TANF–related spending to date to respond to any increases?
To determine which factors contributed to the decline in caseload, we conducted a literature review of relevant research; interviewed TANF experts, as well as officials at the Department of Health and Human Services (HHS); reviewed TANF caseload and other data; and reviewed relevant federal laws and regulations. In conducting our literature review, we searched various databases for peer-reviewed journals and other publications; obtained recommendations from TANF researchers and policy experts, including HHS officials; and reviewed policy and research organization Web sites for relevant studies. We cited studies that at least two social scientists had reviewed and assessed for the adequacy of their methodologies. We also contracted with the Urban Institute to conduct analyses—using the Transfer Income Model, version 3, known as TRIM3—of changes in families’ TANF eligibility and receipt of TANF cash
Page 2 GAO-10-164 TANF Cash Assistance

assistance.2 These analyses helped us estimate the extent to which changes in eligibility rules under TANF affected the number of families eligible for cash assistance after welfare reform.3 For this analysis, we applied TANF eligibility rules for 2005, including rules established by states,4 to all families in 1995, which was the year prior to welfare reform under the Personal Responsibility and Work Opportunity Reconciliation Act of 1996 (PRWORA).5 We also contacted state-based social service and other organizations in selected states regarding state TANF practices and policies that could affect a family’s decision to participate in the program.6 To determine how TANF cash recipients compare to eligible nonrecipients and to estimate the impact of TANF cash assistance on child poverty and extreme poverty, we requested additional analyses using TRIM3. For our analysis of the characteristics of cash recipients and eligible nonrecipients, we used 2005 data, the most recent publicly available TRIM3 data when we conducted our work. In comparing the characteristics of cash recipients and eligible nonrecipients, differences are statistically significant at the 95 percent confidence level unless otherwise noted. For our analysis of the
2TRIM3 is maintained and developed at the Urban Institute under primary funding from HHS, Office of the Assistant Secretary for Planning and Evaluation. Using TRIM3 for these analyses required our input on assumptions and/or interpretations about economic behavior and the rules governing federal programs. Therefore, the conclusions presented in this report are attributable only to GAO.
3Throughout this report, welfare reform refers to the creation of TANF through the enactment of the Personal Responsibility and Work Opportunity Reconciliation Act of 1996 (PRWORA).
4GAO did not conduct a legal analysis of state laws or requirements for state cash assistance programs. The TRIM3 model uses the U.S. Census Bureau’s Current Population Survey (CPS) and the Welfare Rules Database (maintained at the Urban Institute under HHS funding) to simulate eligibility based on state-specific program rules and information on income and other eligibility criteria. The Welfare Rules Database provides a longitudinal account of the changes in welfare rules in all 50 states and the District of Columbia.
5Pub. L. No. 104-193 (1996). Although the total cash assistance caseload peaked in 1994 at 5.03 million families (average monthly numbers for calendar year 1994), we chose 1995 as a comparison year partly because it was the year before welfare reform. For a more detailed explanation of why 1995 was chosen as a comparison year, as well as further details about other aspects of our methodology in this report, see appendix I.
6To identify state-level organizations that could provide the perspective of families on applying for and receiving TANF cash assistance, we requested the names and contact information from TANF officials that we interviewed in 21 states. For more information on our objectives, scope, and methodology, see appendix I. (For information on how we selected states for telephone interviews of TANF administrators, see the description of our methodology for obtaining information on state caseload changes in the current recession.)
Page 3 GAO-10-164 TANF Cash Assistance

impact of higher rates of TANF cash assistance on child poverty and extreme poverty, we compared data from 2005 to data from 1995, the year prior to welfare reform. To determine how the number of families receiving cash assistance changed and how states have changed their use of block grant funds in response to the most recent recession, we conducted semi-structured telephone interviews with TANF officials in 21 states and obtained the most recent data available on their cash assistance caseloads. In analyzing caseload changes, we included families receiving cash assistance through both federally funded TANF block grants as well as through separate state programs (SSP), which use state funds that count towards qualifying for the federal TANF block grant and which are subject to certain federal TANF requirements. In addition, we obtained data on cash assistance caseloads that states funded through newer programs funded only by states—known as “solely state-funded programs”—which are not subject to federal work requirements or federal reporting. The 21 states we selected had a range of child poverty rates, unemployment rates, cash assistance caseloads, approaches to sanctions and monthly earnings limits, and geographic diversity. Collectively these states represent more than half the families receiving TANF cash assistance nationally. Our analysis focused on the period between June 2008—6 months after the official start of the current recession—and June 2009. We assessed the data we received from TRIM3 and from state agencies for data reliability. On the basis of these assessments, we concluded that the data were sufficiently reliable for the purposes of our report. We also provided our draft report to three external reviewers who have conducted research and published on welfare reform issues and whose work reflects a variety of approaches to this work. We incorporated their comments as appropriate.
We conducted our work from November 2008 to February 2010 in accordance with all sections of GAO’s Quality Assurance Framework that are relevant to our objectives. The framework requires that we plan and perform the engagement to obtain sufficient and appropriate evidence to meet our stated objectives and to discuss any limitations in our work. We believe that the information and data obtained, and the analysis conducted, provide a reasonable basis for any findings and conclusions in this product.
Page 4 GAO-10-164 TANF Cash Assistance

Background
TANF Goals, Structure, and Requirements
The TANF program represented a significant departure from Aid to Families with Dependent Children (AFDC), the federal welfare program it replaced—in program goals, funding structure, and program requirements. Under the TANF block grant program, created by PRWORA and reauthorized in 2006,7 states receive federal funds to design and operate their own welfare programs within federal guidelines. In addition to providing cash benefits to eligible families, as AFDC did, the TANF program, instead, focuses on, among other things, ending the dependence of needy parents on government benefits by promoting job preparation, work, and marriage. HHS administers the TANF program, which provides states with up to about $16.5 billion each year in TANF block grant funds. To qualify to receive its portion of the available TANF funds, each state must contribute a specified level of its own funds, which is referred to as the state’s maintenance of effort (MOE).8 In addition to providing cash assistance, states may use these TANF and MOE funds to finance a wide range of benefits, services, activities, or programs, such as child care and other activities that further TANF program goals.
In addition to the new goals and funding structure of the TANF program, PRWORA established more stringent work requirements; credits to states for reducing caseloads; time limits; and restrictions on immigrant receipt of assistance.9 The act also established that eligible families were no longer entitled to receive cash assistance from states, as they had been under AFDC. States must involve a minimum percentage of their adult TANF and MOE cash assistance recipients in work activities for a required
7Pub. L. No. 109-171 (2006).
8The state’s MOE amount is based on a percentage of expenditures made by the state in fiscal year 1994 on some of TANF’s predecessor programs. 42 U.S.C. § 609(a)(7).
9For work requirements, see 42 U.S.C. § 607. For time limits, see 42 U.S.C. § 608(a)(7). For restrictions on immigrant receipt of assistance, see Pub. L. No. 104-193, Title IV (1996).
Page 5 GAO-10-164 TANF Cash Assistance

number of hours each week.10 Under PRWORA, states are allowed to reduce their required work participation rates by earning credit for reducing their cash assistance caseloads.11 All states have received such caseload reduction credits, thereby reducing the work participation rate they must meet. The caseload reduction credit also introduced an incentive for states to contain or reduce the number of families receiving cash assistance, since states that fail to meet the target work participation rates face financial penalties. To emphasize the temporary nature of assistance, states must restrict most families to a lifetime limit of 60 months of federally funded TANF cash assistance, although states can implement shorter time limits.12 A few states have chosen to terminate benefits only for the adults in the family unit; otherwise benefits are terminated for the entire family after the lifetime limit expires, although some states may continue serving families using state funds. PRWORA also limited the eligibility of immigrants for means-tested benefits—including TANF—to those who have been in the country legally for 5 years.13 While federal law generally limits TANF cash welfare to low-
1042 U.S.C. § 607. For a state to meet its work participation rate, 50 percent of all families—minus its caseload reduction credit—must participate in a work activity for an average of 30 or more hours per week. Similarly, 90 percent of two-parent families must participate in a work activity for a minimum of 35 hours per week in order for a state to meet its work participation rate. States may exempt adults and minors from work requirements for reasons such as having a child under the age of 1 year. Families without adult recipients—known as child-only cases—are also sometimes exempt from work requirements and time limits. Nationally, in fiscal year 2006, about 47 percent of TANF households were “child-only” cases, such as those in which the parent is an ineligible noncitizen, or is disabled and receiving disability insurance.
11To receive credit, caseload reductions must be for reasons other than a state changing its eligibility requirements. 42 U.S.C. § 607(b)(3)(B). In addition, during TANF reauthorization in 2006, the base year for calculating the caseload reduction credit was changed from fiscal year 1995 to fiscal year 2005. Since the caseload was lower in all states in 2005 than in 1995, the credit received was also smaller. As a result, since TANF reauthorization, states have likely had to meet a higher work participation rate than required in previous years.
12States can exempt recipients from the 60-month limit on federally funded TANF assistance in cases that involve hardship or domestic violence. 42 U.S.C. § 608(a)(7)(C). It is up to each state to define hardship, and states can extend this exemption to no more than 20 percent of their TANF caseload.
13Means-tested programs are restricted to families or individuals who meet specified financial requirements and certain other eligibility criteria established for each program. Nonfinancial requirements may restrict eligibility to specified categories of beneficiaries, such as pregnant women, children, or individuals with disabilities. TANF, Medicaid, and the Supplemental Nutrition Assistance Program (SNAP) are examples of means-tested programs.
Page 6 GAO-10-164 TANF Cash Assistance

income families with either a child under the age of 18 (or under the age of 19 if the child is in school) or a pregnant woman, states set their own eligibility limits and benefit levels for cash recipients.
In designing and implementing their TANF programs, states focused more than ever before on helping welfare recipients and other low-income parents find jobs. Many states implemented work-focused programs that stressed moving parents quickly into jobs and structured the benefits to allow more parents to combine welfare and work. States use TANF and MOE funds to provide child care subsidies, education and training, and other services, for TANF cash recipients as well as other low-income families. In addition, TANF funds are also transferred to the Child Care and Development Fund (CCDF) to help fund subsidized child care and to the Social Services Block Grant (SSBG) program to help fund child welfare agencies. According to 2006 figures, TANF spending on support services and transfers exceeded spending on cash assistance. In fiscal year 2006, states spent approximately $10 billion on cash assistance and $11 billion on support services and transfers.14
States also imposed financial consequences, or sanctions, on families that did not comply with TANF work or other requirements as well as implemented strategies to divert families from cash assistance. States have implemented partial sanctions, in which benefits are reduced, and full-family sanctions, in which benefits are ended for the entire family for a period of time or until compliance if an adult failed to meet TANF program requirements. Often states increase the severity of the sanction based on the number of times or the amount of time the individual is noncompliant. As of July 2008, nearly all states had policies ending cash benefits for the whole family or closing cases as their most severe sanction for an adult’s noncompliance with work requirements.15 Many states have also implemented programs or strategies intended to divert families from cash assistance. One diversion strategy was to provide one-time, non-recurring benefits instead of monthly TANF cash assistance to families who face temporary hardships. Families who receive certain non-recurring short-term benefits are not required to participate in federally mandated work
14Figures include federal TANF and state MOE spending.
15Gretchen Rowe and Mary Murphy, The Urban Institute, Welfare Rules Databook: State TANF Policies as of July 2008 (Washington, D.C.: August 2009).
Page 7 GAO-10-164 TANF Cash Assistance

activities, and their receipt of these benefits does not count towards the family’s 60-month lifetime limit.
Cash assistance may be funded by the TANF block grant, MOE funds, or state-only funds, and the source of the money determines which TANF requirements apply to the recipient. With certain exceptions, recipients of cash assistance funded by the TANF block grant are subject to work participation requirements, the 60-month lifetime limit on receipt of cash assistance, and immigration restrictions. Some states provide cash assistance through SSP programs using MOE funds. Recipients of cash assistance funded through SSPs are subject to TANF work participation requirements, but not the time limits or immigrant restrictions. SSP recipients began to be counted in the calculation of the TANF work participation rate beginning in fiscal year 2007 as a result of TANF reauthorization. In response to the changes made in reauthorization, some states chose to provide cash assistance funded with the state’s own funds that are not counted towards the MOE requirement. Recipients of assistance from these solely state-funded programs are not subject to TANF requirements.
TANF and Recessions To help states in the event of an economic downturn, PRWORA created a
TANF contingency fund of up to $2 billion. To qualify for access to the contingency fund, states must meet a test of economic need. In addition, states may draw upon unused portions of their own federal TANF grants from previous years—often referred to as carry-over or reserve funds. Most recently, the American Recovery and Reinvestment Act of 2009 (ARRA) made an additional $5 billion available to states for fiscal years 2009 and 2010 through a new Emergency Contingency Fund.16 This fund reimburses states for 80 percent of their increased expenditures for cash assistance, provided there is also an increase in caseload; non-recurrent short term benefits; or subsidized employment in a quarter in fiscal year 2009 or fiscal year 2010, as compared with the comparable quarter in fiscal year 2007 or fiscal year 2008.
Poverty Measurement in the United States
Poverty is measured in the United States using the federal poverty threshold, which is calculated annually by the U.S. Census Bureau. The
16Pub. L. No. 111-5, § 2101 (2009).
Page 8 GAO-10-164 TANF Cash Assistance

threshold reflects estimates of the amount of money individuals and families of various sizes need to purchase goods and services deemed minimally adequate based on 1960s living standards, and is adjusted each year using the consumer price index. Persons or families having income below this amount are, for statistical purposes, considered to be living in poverty. The poverty threshold varies by family size and composition but does not vary by geographic location. Extreme or deep poverty is defined as income below 50 percent of the federal poverty threshold for a given family. For example, for a single parent with two children the poverty threshold in 2008 was $17,346; for that family type, the extreme poverty threshold was $8,673. Over the years, the official Census measure of poverty has been criticized for, among other things, not fully capturing the value of public supports and benefits, such as SNAP or the Earned Income Tax Credit (EITC), and for not considering health care and work-related costs.17 In 1995, a National Academy of Sciences panel recommended that changes be made to the threshold to count noncash benefits, tax credits, and taxes; deduct certain expenses from income such as child care and transportation; and adjust income levels according to an area’s cost of living. In recent years, such noncash benefits and supports have comprised larger portions of the assistance package for families with low incomes.18 In response to these issues, several pieces of legislation have been proposed to update the federal poverty measure, although none has been passed as of the date of this report.
Poverty in the United States is also measured through the poverty guidelines, which are published annually by HHS and are used by some federal programs in determining the income eligibility of individuals and families for need-based assistance.19 The poverty guidelines are a simplified version of the Census poverty thresholds. Although the guidelines reflect variations in family size, the poverty guidelines—unlike the thresholds—do not reflect variations in the age group of the family
17The estimates presented in this report are based on the official federal measure of poverty.
18GAO, Poverty in America: Economic Research Shows Adverse Impacts on Health Status and Other Social Conditions as well as the Economic Growth Rate, GAO-07-344 (Washington, D.C.: January 2007).
19HHS updates the poverty guidelines at least annually as required by 42 U.S.C. § 9902(2) and publishes the guidelines in the Federal Register. See, e.g., 74 Fed. Reg. 4199 (Jan.23, 2009).
Page 9 GAO-10-164 TANF Cash Assistance

members. Alaska and Hawaii have higher federal poverty guidelines than the rest of the country.
Since the 1990s, the decline in the number of families receiving cash assistance reflects declines not only in the number of eligible families but also in eligible families’ participation in the program in response to TANF policies.20 From 1995 to 2005, the number of families who were eligible for cash assistance fell from about 5.69 million families on average each month under AFDC to about 5.27 million families eligible on average each month under TANF—a decline of about 420,000 families eligible for cash assistance overall, according to our TRIM3 analysis.21 Factors that contributed to the decline in the number of families eligible for TANF cash assistance include families’ higher incomes, which reflect TANF’s focus on work and the strong economy of the 1990s, and changes to eligibility rules. However, a much larger portion of the caseload decline from 1995 to 2005 reflects sharp declines in eligible families’ participation in the program. Research suggests that changes in participation resulted from, among other things, the dynamics of family decision-making in response to TANF policies, including mandatory work activities, state diversion strategies, time limits, and sanctions for non-compliance with work and other program requirements.
Factors Contributing to the Decline in Cash Recipients Include Declines in the Number of Eligible Families and in Eligible Families’ Participation
20This discussion focuses on cash assistance programs under TANF and not on services and other supports for low-income families that are also funded through TANF funds. As we noted in 2002 testimony, TANF caseload data do not provide a complete picture of the number of families receiving benefits and services through TANF. GAO, Welfare Reform: States Provide TANF-Funded Work Support Services to Many Low-Income Families Who Do Not Receive Cash Assistance, GAO-02-615T (Washington, D.C.: Apr. 10, 2002).
21These are average monthly estimates from HHS’s Indicators of Welfare Dependence: Annual Report to Congress for 2008 (Washington, D.C.: 2008), based on analyses using the TRIM3 microsimulation model.
Page 10 GAO-10-164 TANF Cash Assistance

The requirement to engage in work activities in order to receive TANF cash benefits changed the culture of cash assistance, leading more low-income families towards employment and raising their earned incomes. During this period of declining caseloads, labor force participation increased among single mothers, the population most affected by TANF. According to the Bureau of Labor Statistics (BLS), the labor-force participation of single mothers with children rose from 58 percent in 1995–the year prior to the creation of TANF—to 71 percent in 2007, with most of this increase occurring immediately following the passage of PRWORA. In addition, as we noted in a 2005 report, most of the parents who left cash welfare found employment, and some families who left cash welfare were better off than they were on welfare.22 However, our report also found that earnings were typically low, and many families who left cash welfare worked in unstable, low-wage jobs with few benefits and advancement opportunities. A more recent study found that, in general, former TANF recipients in three cities, especially those who had left TANF prior to 2001, had higher employment rates and average income levels than they had while they were receiving TANF benefits. Although former recipients experienced some declines in their employment rates and income levels after 2001, both measures were nevertheless at the same level or higher in 2005 than in 1999.23
Higher Employment Rates and Earnings Reduced the Number of Families Eligible for Cash Assistance More than Changes in Eligibility Rules
Wage increases—due in part to increases in the minimum wage in 1996 and 1997 as well as the 1990s expansions in the Earned Income Tax Credit (EITC)—contributed to the decline in the number of families who were eligible for TANF cash assistance. Wages for low-wage workers increased from 1994 to 2000. During these 6 years, the 10th percentile of the hourly wage rate distribution rose 12.4 percent, in contrast to declines in previous years, while the middle—the 50th percentile—rose about 9 percent, based on numbers in a study by the Congressional Budget Office.24 Expansions in the EITC for low-income working families in effect provide a subsidy that increases the incentive to work. A number of studies found that the EITC
22GAO, Welfare Reform: More Information Needed to Assess Promising Strategies to Increase Parents’ Incomes, GAO-06-108 (Washington, D.C.: December 2005).
23Bianca Frogner, Robert Moffitt, and David Ribar, Income, Employment, and Welfare Receipt After Welfare Reform: 1999-2005 Evidence from the Three-City Study, Johns Hopkins University, Working Paper 09-02 (May 2009).
24Congressional Budget Office, Changes in Low-Wage Labor Markets Between 1979 and 2005 (Washington, D.C.: December 2006).
Page 11 GAO-10-164 TANF Cash Assistance

increased labor-force participation among single women.25 According to one study, as well as experts we interviewed, the EITC also played an important role in the decline in the TANF caseload,26 because higher incomes made families ineligible.
The strong economy of the late 1990s facilitated the movement towards work by creating jobs and reducing unemployment, thereby reducing the need for cash assistance.27 The annual U.S. unemployment rate for workers ages 16 and over declined from 5.6 percent in 1995—before TAwas created—to 4.0 percent in 2000, according to BLS data. In the same period from 1995 to 2000, the annual unemployment rate for single women with children fell from 16.6 percent in 1995, to 11.0 percent in 2000, according to BLS data. Starting in 2001, the unemployment rate for singlwomen rose for several years, reaching 15.1 percent in 2005. During this time, the number of TANF-eligible families increased, while the participation rate remained stable or fell. Researchers do not agree on the extent to which a strong economy relative to TANF work requirements and other changes affected TANF eligibility. Nevertheless several studies as well as experts we interviewed agreed that the strong economy played amajor role in the decline, making it easier for single mothers and oth
NF
e
ers to
find jobs.
themselves—accounted for a small portion of the caseload decline. Using
Changes to welfare eligibility rules that occurred under PRWORA, such astime limits for receiving cash assistance and restrictions on eligibility for legal immigrants, also contributed to the decline in families’ eligibility for cash assistance. However, we found that these kinds of rules changes—by
25See Rebecca M. Blank, “Evaluating Welfare Reform in the United States,” Journal of Economic Literature (December 2002).
26Jeffrey Grogger, “The Effects of Time Limits, the EITC, and Other Policy Changes on Welfare Use, Work, and Income Among Female-Headed Families,” The Review of Economics and Statistics (May 2003).
27GAO, Welfare Reform: Better Information Needed to Understand Trends in States’ Uses of the TANF Block Grant, GAO-06-414 (Washington, D.C.: March 2006) and GAO, Welfare Reform: More Information Needed to Assess Promising Strategies to Increase Parents’ Incomes, GAO-06-108 (Washington, D.C.: December 2005).
Page 12 GAO-10-164 TANF Cash Assistance

the TRIM3 microsimulation model, we applied certain 2005 TANF rules to the families estimated as eligible for cash assistance in 1995 under AFDC.28
According to our TRIM3 analysis, had 2005 TANF eligibility-related rules on time limits and immigrant restrictions been in place in 1995, 1.6 percent fewer families overall would have been eligible for cash assistance in 1995.29 We obtained similar results when we applied a more comprehensive range of eligibility-related rules to the 1995 population. This more comprehensive analysis included—in addition to rules on time limits and immigrant restrictions—rules for two-parent families and teen parents; caps on benefits if a family’s size increases; and financial eligibility rules.30 These rules varied in their impact on eligibility. Some rules contributed to increases in the number of families who would have been eligible, while other rules contributed to reductions in eligible
28TRIM3 does not model certain aspects of program eligibility, such as sanctions from a family’s failure to comply with work rules or child support rules. It also does not model state diversion strategies such as the use of one-time, non-recurring benefits, or families’ behavioral responses to TANF program rules, such as staying off TANF to conserve eligibility for time-limited assistance.
29These estimates are based on analyses conducted for our study by the Urban Institute, using the TRIM3 microsimulation model; they reflect averaged monthly estimates by calendar year. For this TRIM3 analysis, to apply rules on time limits and immigrant restrictions from PRWORA on the 1995 data, we assumed that the rules were actually changed 10 years prior to the timing of the actual legislation–in August 1986—so that the analysis would be able to identify families who would be affected by federal and state TANF time limits and immigrant restrictions. We also assumed that states would make the same choices about time limits in this hypothetical 1995 world that they made in 2005, such as using shorter time limits, or providing extensions and exemptions.
30The 2005 TANF rules used in this expanded TRIM 3 analysis included rules on immigrant restrictions; time limits; eligibility rules for two-parent families and teen parents; caps on benefits if family size increases; 2005 asset limits; and other financial rules, such as those for disregarding a certain amount of earned income in determining eligibility—called earned income disregards—and income tests. Because TRIM3 incorporates information from states through the Urban Institute’s Welfare Rules Database—an HHS-funded database maintained at the Urban Institute—this analysis reflects variations in state rules as well as federal rules in these areas. The overall results mask variations at the state level. In some states, the 2005 rules would increase eligibility, while in other states the 2005 rules would decrease eligibility.
Page 13 GAO-10-164 TANF Cash Assistance

families.31 In this analysis, had this wider range of 2005 TANF eligibility-related rules been in place in 1995, about 1 percent fewer families overall would have been eligible for cash assistance. Overall, although these analyses cannot definitively establish the portion of the caseload change from 1995 to 2005 that was due solely to a particular rule change, they suggest that the net effect was small.32
Following welfare reform, there was some concern that the number of eligible families would decline because of competition among states to make their policies more stringent and less attractive to low-income families—such as by lowering the maximum income a family could earn and still be eligible for TANF.33 However, from 1996 to 2006, very few states reduced their maximum cash assistance benefits for a family of three—the money families receive if they have no other income. A 2002 review analyzed a range of state policy changes enacted by states, including policies on earned income and assets disregards, work activities, and sanctions. The study found little evidence that states competed to expand restrictive policies while also decreasing policies to enhance access. Instead, it found that states adopted both types of policies in varying combinations, leading to substantial variation among the states.34
Factors Affecting Eligible Families’ Participation Played a Larger Role in the Decline than Changes in Families’ Eligibility
While declines in the number of families eligible for cash assistance accounted for some of the caseload decline, the preponderance of the decline reflects changes in eligible families’ participation in the program.
31For example, according to our TRIM3 analysis, 2005 rules that increased the number of eligible families included those concerning the eligibility of two-parent units, which are more generous than the 1995 AFDC rules, and rules on the use of earned income disregards, which may enable some families to be eligible under 2005 rules who would not have been in 1995. On the other hand, rules that reduced the number of eligible families included time limits and income eligibility thresholds that were not adjusted for inflation, according to our TRIM3 analysis.
32The analysis cannot be definitive because of the potential interrelationships among program rules; changes in the population (such as the incidence of single-parent families) and in families’ economic circumstances; and behavioral issues such as families’ responses to program requirements, such as whether to apply for TANF.
33Some observers believed that families would move to other states take advantage of state policies that were more generous, and that states would attempt to offset this possibility of increased caseloads by competing to have policies more stringent than neighboring states.
34Thomas Gais and R. Kent Weaver, State Policy Choices Under Welfare Reform, Brookings Policy Brief No. 21 (Washington, D.C.: April 2002).
Page 14 GAO-10-164 TANF Cash Assistance

From 1995 to 2005, the number of families eligible for cash assistance declined by about half a million families, but the decline in the share of eligible families participating in AFDC/TANF cash assistance has been dramatic—from about 84 percent of eligible families receiving cash assistance in 1995 (4.8 million) to about 40 percent of eligible families in 2005 (2.13 million).35 In that period, the number of eligible families who did not participate in cash assistance climbed from an estimated 890,000 in 1995 under the AFDC entitlement program to about 3.14 million eligible families in 2005 under the TANF cash assistance program, according to HHS data.36 The change in the participation rate from 1995 to 2005 accounted for about 87 percent of the decline in cash recipients in that period.37 (See fig. 1.)
35This analysis of the share of eligible and participating families is based on trend data for an average month by calendar year in HHS’s Indicators of Welfare Dependence: Annual Report to Congress, 2008 (Washington, D.C.: 2008), which uses TRIM3 to model estimates of the TANF participation rate. In reporting participants, the data includes families receiving cash assistance through both TANF and separate state programs (SSP) using state MOE funds. As noted earlier, TRIM3 does not model certain aspects of program eligibility, such as sanctions from a family’s failure to comply with work rules or child support rules. It also does not model state diversion strategies such as the use of one-time, non-recurring benefits, or families’ behavioral responses to TANF program rules, such as staying off TANF to conserve eligibility for time-limited assistance.
36This TANF participation rate is within the range experienced by other non-entitlement programs. In a previous report, we found that participation in non-entitlement programs—including TANF—ranged from less than 10 percent to about 50 percent, while participation in entitlement programs such as SNAP (formerly known as food stamps) —designed to support all those who apply and qualify—was higher, ranging from 50 percent to more than 70 percent. See GAO, Means-Tested Programs: Information on Program Access Can Be an Important Management Tool, GAO-05-221 (Washington, D.C.: Mar. 11, 2005).
37Declines in eligibility and in participation are not necessarily mutually exclusive and may interact. For example, policies such as time limits can affect a family’s eligibility for cash assistance but it can also affect decisions about when or whether to apply for assistance, depending on a family’s circumstances.
Page 15 GAO-10-164 TANF Cash Assistance
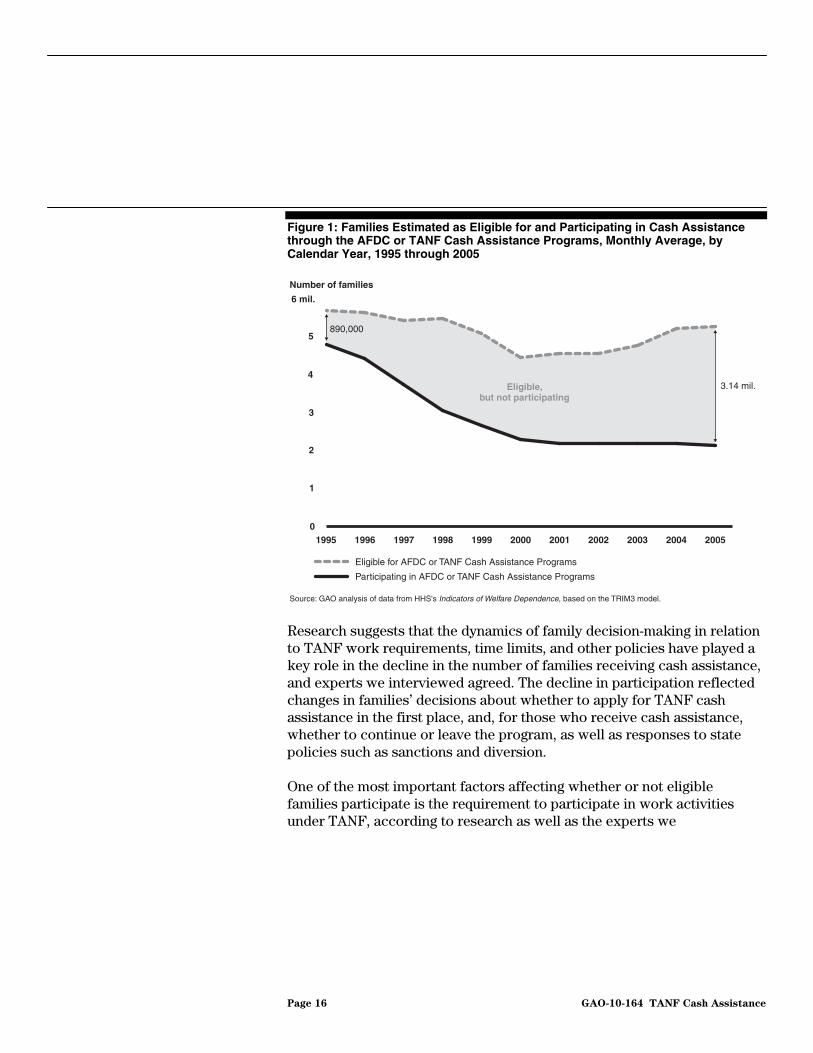
Figure 1: Families Estimated as Eligible for and Participating in Cash Assistance through the AFDC or TANF Cash Assistance Programs, Monthly Average, by Calendar Year, 1995 through 2005
Number of families
0
1
2
3
4
5
6 mil.
20052004200320022001200019991998199719961995
890,000
3.14 mil.Eligible,but not participating
Eligible for AFDC or TANF Cash Assistance Programs
Participating in AFDC or TANF Cash Assistance Programs
Source: GAO analysis of data from HHS's Indicators of Welfare Dependence, based on the TRIM3 model.
Research suggests that the dynamics of family decision-making in relation to TANF work requirements, time limits, and other policies have played a key role in the decline in the number of families receiving cash assistance, and experts we interviewed agreed. The decline in participation reflected changes in families’ decisions about whether to apply for TANF cash assistance in the first place, and, for those who receive cash assistance, whether to continue or leave the program, as well as responses to state policies such as sanctions and diversion.
One of the most important factors affecting whether or not eligible families participate is the requirement to participate in work activities under TANF, according to research as well as the experts we
Page 16 GAO-10-164 TANF Cash Assistance

interviewed.38 To receive cash benefits, TANF recipients must generally participate in work activities such as job search, job skills training, and employment for a minimum number of hours per week—with the hours varying depending on family type and the age of the youngest child. Such mandated work activities under TANF have been well studied, and according to a research synthesis conducted for HHS, multiple studies have provided compelling evidence that these work activities may cause declines in the caseload,39 as families choose not to apply rather than be expected to fulfill the work requirement or find it difficult to apply or continue participation in the program. As we noted in an earlier report, studies have shown that families who are eligible for TANF, including cash recipients, often have characteristics that make employment difficult, such as substance abuse, poor mental or physical health, disability, low educational attainment, limited work experience, limited English proficiency, low basic skills, or exposure to domestic violence. Many recipients have two or more of these characteristics, making it especially difficult for them to get and keep jobs.40
Eligible families may also not participate in TANF because they view the TANF application and eligibility determination process as too burdensome and not worth the effort. With its focus on work and temporary assistance, the TANF application process can include pre-application interviews and assessments of employability. It can also include non-work-related requirements for school attendance, meetings and cooperation with other agencies, or fingerprinting. Some states also added questions to cash assistance applications after 1996 on assets, living situations, or household characteristics.41 According to a 2003 study of low-income families, non-
38Not all TANF families are subject to work requirements. TANF law allows states to exclude single custodial parents caring for a child under the age of 1, for example. Families without adult recipients—child-only cases—are sometimes exempt from work requirements and time limits. States also have the option to consider some parents not “work eligible,” such as those on SSI or Social Security Disability Insurance.
39Jeffrey Grogger et al., Consequences of Welfare Reform: A Research Synthesis, RAND Labor and Population Program. Prepared for the Administration for Children and Families, U.S. Department of Health and Human Services (July 2002).
40GAO, Welfare Reform: Moving Hard-to-Employ Recipients Into the Workforce, GAO-01-368 (Washington, D.C.: March 2001).
41Abt Associates Inc., Study of the TANF Application Process, Final Report, Volume 1: Survey of States, Prepared for Department of Health and Human Services, Administration for Children and Families Office of Planning, Research and Evaluation (April 2003).
Page 17 GAO-10-164 TANF Cash Assistance
applicants who visited a TANF office but chose not to apply cited as important reasons for their decisions the effort, or “hassle” to do so, as well as discouragement by a caseworker or poor treatment.42 Two researchers we interviewed also emphasized that implementation practices and procedures in local welfare offices affect participation. Several legal and social service organizations that we contacted in 21 states reported that, in their view, eligible families do not participate in TANF partly because of their difficulties with the application process. Additional difficulties they cited included documentation requirements; literacy and language barriers, which interfered with the completion of application forms; the number of required trips to the TANF office; poor treatment by caseworkers; and inconvenient business hours and/or locations of TANF offices.
Eligible families may also not apply for TANF cash assistance—or complete the application process—because of state policies and practices on diversion. As part of their process for assessing eligibility for TANF cash assistance, nearly all states also have at least one type of strategy for diverting applicants from cash assistance, according to a 2008 report.43 Diversion strategies states use include requiring applicants to complete a job search, program orientation, or employment plan as a condition of eligibility. Many states provide a one-time payment to families to meet immediate needs—most often for applicants with a job or job offer.44 In return for one-time cash assistance, states usually initiate a period of TANF ineligibility that keeps families off the caseload. Some research indicates that families who received such one-time assistance are less likely to ever participate in TANF, even if they remain eligible for assistance.45
42Robert Moffit, “The Role of Nonfinancial Factors in Exit and Entry in the TANF Program,” The Journal of Human Resources, Vol. 38 (2003).
43Rosenberg et al., A Study of States’ TANF Diversion Programs. Final Report, Mathematica Policy Research Institute (Dec. 8, 2008).
44States’ diversion strategies are determined by the states and not federal law. In most states, they are also considered “non-assistance” and, because of this, states can use them to provide temporary assistance without being affected by federal work requirements for states. Most states also do not count one-time payments toward the federal 60-month lifetime limit. States also have incentives for controlling or reducing their TANF caseloads because they are required to meet federal work participation rates for providing cash assistance to families when they use federal or MOE funds.
45Andrea Hetling et al., “Do Welfare Avoidance Grants Prevent Cash Assistance?” Social Service Review, University of Chicago (December 2007).
Page 18 GAO-10-164 TANF Cash Assistance

The 60-month lifetime limit for families established under PRWORA represented a fundamental change to cash assistance, and this time limit is generally viewed as contributing to the decline in families receiving cash assistance as well. Nationally, many TANF households—about 47 percent in fiscal year 2006—are not subject to federal or state time limits because they are “child-only” cases in which a child lives with a relative or families in which the parent is not eligible for benefits. Time limits—which are shorter in some states than the federal limit—make some families ineligible for TANF, but such limits may also lead eligible families to consider alternatives if they think they will need TANF cash benefits in the future. According to researchers and other experts we interviewed, families may hold off on applying for TANF—and “bank their time” for when they may have greater needs. Research suggests that such banking of time occurs, especially among families with young children who may be concerned about how much time they would have left on welfare, and that it contributes to the decline in the use of cash assistance.46
An additional element is that the value of TANF cash benefits—which are determined by states—has fallen over time, which could affect families’ participation. Our TRIM3 analysis estimates that average cash benefits under 2005 rules were 17 percent lower than they were under 1995 rules.47 This reduction occurred because cash benefit levels in many states have not been updated or kept pace with inflation—24 states had maximum cash benefits set at the same levels in 2006 as in 1996, and 6 states had maximum cash benefit levels that were lower than in 1996. Several legal and social service providers in 21 states we contacted agreed that low benefit levels contributed to the non-participation of eligible families. In 2006, the maximum cash benefit levels among the states ranged from $170 per month to $723 per month for a family of three,48 while the median for all states was $396 per month for a family of three—less than a third of the poverty threshold for this type of family.
46Grogger et al. (July 2002).
47This analysis is based on TRIM3 estimates in which we applied all 2005 TANF rules, with dollars deflated to 1995, to the 1995 cash assistance population, and compared potential aggregate cash benefits to that population under the 2005 rules with deflated dollars to the potential aggregate benefits to that population under the 1995 rules. The overall results of this analysis mask variations at the state level. Some states show small increases in potential aggregate benefits under the 2005 rules, while the majority of states show reductions of various magnitudes.
48These maximum benefit levels are for the continental United States.
Page 19 GAO-10-164 TANF Cash Assistance

Another factor that may affect family decisions is that the TANF cash welfare system is no longer the main “gateway” into other supports and services, as AFDC was. PRWORA severed the link between cash assistance and Medicaid benefits for health care. As a result, post-PRWORA, TANF recipient families are not automatically eligible to receive Medicaid benefits. Independent of TANF, low-income families who are not eligible for Medicaid can also apply for benefits under the State Children’s Health Insurance Program, which was established in 1997 to cover additional low-income children. Child care subsidies were consolidated under PRWORA for low-income families, and families do not need TANF as a gateway to these subsidies. Although SNAP (formerly food stamps) was available to low-income families before TANF was created, federal legislation after PRWORA created options for states to simplify application and eligibility determination processes and increase enrollment in SNAP. Some researchers have suggested that families may decide to take up other supports and benefits in lieu of TANF, partly because they do not entail requirements such as regular visits by social workers and are not subject to time limits, among other reasons.
A related issue is that some families may be less inclined to take up TANF cash assistance because participation in TANF could reduce their benefits from other programs, leaving them with little, if any, net increase in family resources. TANF cash assistance is counted as cash income by some other assistance programs. As a result, having a higher income because of TANF could reduce a family’s benefits from SNAP or increase the amount the family must pay for subsidized child care or housing.49 Most families who receive TANF benefits would see increases in their annual net income. However, the greater the number of other supports a TANF family receives, the smaller the relative increase in annual net income that they gain from participating in TANF. According to our estimates—using Illinois, the state with the median maximum TANF cash benefit, as an example—if a single parent with two children received child support; tax credits; SNAP benefits; benefits under the Special Supplemental Nutrition Program for Women, Infants, and Children (WIC), a federal nutritional program; and a housing subsidy in addition to having monthly earnings, the family would have an overall monthly net income of $1,743–or an
49In some cases, the receipt of TANF can also work in the opposite direction, increasing the other benefit (e.g., exempting TANF recipients from having to pay a co-payment for child care). For the purpose of this discussion, we are including non-cash supports such as SNAP as part of net income. However, in discussing poverty among children, we exclude non-cash supports, so as to be consistent with the federal definition of poverty.
Page 20 GAO-10-164 TANF Cash Assistance

annual net income of about $20,916.50 If the family also received TANF cash benefits of $185 monthly, adjustments to the other benefits they received would result in a $53 net increase. (See fig. 2.)
Figure 2: Estimated Impact of Monthly TANF Cash Assistance Receipt on the Net Income of a Working Parent Who Receives Other Supports
Source: GAO analysis of TRIM3 microsimulation model data.
Monthly earnings
Child support payment income
Net taxes (including federal EITC and tax credits)
Other non-cash benefits (SNAP, WIC, and Housing Subsidy)
Monthly TANF cash assistance payments
WithoutTANF
WithTANF
Single parentwith twochildren
50 $185$213
$213
$222
$263
$455
$49639$100
SNAP WIC Housing subsidy
SNAP WIC Housing subsidy
$632
$632 $1,796
$1,743
39
$798
$716
Note: Each family was assumed to have one working adult, earning $632 per month. This is the median earnings of TANF families containing one adult and two children, according to our analysis of 2005 participants. It is also the amount one would earn by working 18 hours per week at the Illinois minimum wage of $8 per hour.
Although few families receive as many benefits and supports as in this example, we found in another analysis we conducted using TRIM3 that an estimated 19 percent of families receiving four types of supports—in addition to TANF cash benefits—would see their net income rise by the full amount that they gained from participating in TANF, but 17 percent of
50The maximum TANF benefit, which varies by state, refers to the highest amount of cash benefits that a state pays to a family per month. Here we are referring to the median of this cash payment across the states.
Page 21 GAO-10-164 TANF Cash Assistance

these families would actually lose annual net income.51 Whether families gain or lose net income may reflect the choice of supports, families’ demographics and income, relevant state rules, and level of benefits.
Finally, according to some studies as well as researchers we interviewed, full sanctions for families’ noncompliance—those that cut off all benefits for a period of time—are associated with declines in the number of families receiving cash assistance, although more research is needed to validate this association.52 Eligible families who receive cash assistance but do not comply with TANF program requirements may face financial consequences, or sanctions.53 Under state sanction policies, families may lose all or part of their TANF cash benefits, and possibly other public benefits as well, if they do not comply with TANF’s work and other requirements.54 In addition to being sanctioned for noncompliance with work activities, TANF families may also be sanctioned for failing to comply with behavioral requirements, such as obtaining drug treatment, cooperating with establishing paternity, or ensuring that children are immunized and attend school. In one study, TANF recipients who reported having been sanctioned cited missing an appointment or failing to file required paperwork as the most common reasons for their loss of
51This TRIM3 analysis uses a slightly different benefit mix than in the Illinois example. In this analysis, the four benefits are child support retained by the family, CCDF child care subsidies, SNAP (formerly food stamps), and a housing subsidy. The net income includes all cash income (including TANF and any child support retained by the family), plus the value of SNAP and the value of housing subsidy, plus refundable tax credits, minus income tax and payroll tax liability, and minus child care expenses. Using calendar year 2005 Current Population Survey data, this analysis examined the families estimated to begin receiving TANF for at least part of the year if participation was at the same rate as in 1995–about 3.3 million families.
52See Grogger et al. (2002); LaDonna Pavetti, et al., Review of Sanction Policies and Research Studies: Final Literature Review, Mathematica Policy Research, Inc. (Washington, D.C.: Mar. 10, 2003), and Jacob Alex Klerman and Caroline Danielson, Why Did the Welfare Caseload Decline? RAND Labor and Population Working Paper (June 2004).
53Federal law requires a reduction or termination in benefit if a family does not comply with work requirements, but states determine the specific sanction policies for failing to comply with work requirements. 42 U.S.C. § 607(e)(1).
54In a 2000 report, we estimated that far more families have their benefits reduced because of rules violations than have their benefits cut off. GAO, Welfare Reform: State Sanctions Policies and Number of Families Affected, GAO/HEHS-00-44 (Washington, D.C.: Mar. 31, 2000).
Page 22 GAO-10-164 TANF Cash Assistance

benefits.55 Such work and behavioral requirements may be particularly challenging for families with physical or mental impairments.56 As we noted in an earlier GAO report, impairments were relatively common among TANF recipients, and, while recipients with impairments may sometimes be exempted from work requirements and time limits, they may be at risk of having their benefits reduced or terminated through sanctions.57
Overall, according to researchers and other experts we interviewed, there is a general consensus that these factors—including TANF policies, the strong economy, and family decision-making processes—played a role in contributing to the decline in the number of families receiving TANF cash assistance. However, there is not agreement on the relative weight of each factor. This is partly because many policy changes were implemented around the same time period that TANF was created—such as increases in the minimum wage, expansions of the EITC, and the de-linking of Medicaid from cash welfare—and are difficult to isolate from each other and from the economic climate. It is also because several of these factors have moved in the same direction—such as TANF, with its emphasis on work, initially being implemented during a strong economy when more low-wage jobs were available—so it is hard to disentangle their effects.58 Furthermore, as we have discussed, TANF policies—including mandatory work activities, state diversion strategies, time limits, and sanctions for non-compliance with work and other program requirements—can influence participation, including family decisions about whether to apply, remain on cash assistance, or leave.
55Andrew Cherlin et al., “Operating within the Rules: Welfare Recipients’ Experiences with Sanctions and Case Closings,” Social Service Review, University of Chicago (September 2002).
56By impairments, we mean both mental and physical conditions. For instance, impairments could be physical conditions that hinder movement or require a cane or other mobility device, cognitive impairments, or mental conditions such as chronic depression.
57GAO, Welfare Reform: Former TANF Recipients with Impairments Less Likely to be Employed and More Likely to Receive Federal Supports, GAO-03-210 (Washington, D.C.: December 2002).
58A September 2009 report similarly noted that declines in the TANF cash assistance caseload were likely attributable to factors that are not easy to disentangle. See LaDonna Pavetti et al., Understanding Temporary Assistance for Needy Families Caseloads After Passage of the Deficit Reduction Act of 2005, Final Report, Mathematica Policy Research, Inc.(Washington, D.C.: Sept. 21, 2009).
Page 23 GAO-10-164 TANF Cash Assistance

Although they are similar in many ways, families participating in TANF and eligible nonparticipating families differed in their incomes, education, and use of other public supports in 2005, according to our TRIM3 analysis.59 Eligible families who did not participate in TANF generally had relatively higher incomes and higher education levels than TANF families. However, among eligible nonparticipants, 11 percent of nonparticipating families did not work or receive Supplemental Security Income (SSI)—a cash assistance program for people with disabilities. This subgroup of nonparticipating families also had very low incomes compared with other nonparticipants, and a larger portion of them received SNAP and subsidized housing.
Eligible Nonparticipating Families Generally Had Higher Incomes Than TANF Recipients, but a Portion of Eligible Nonparticipants Had Very Low Incomes
59In this section, whenever we discuss eligible participating and nonparticipating families, we mean those simulated (estimated) by the TRIM3 micreosimulation model to be eligible participants and nonparticipants. TRIM3 relies on the Annual Social and Economic Supplements (ASEC) to the Current Population Survey, as well as information from the Urban Institute’s Welfare Rules Database to estimate eligibility based on state specific program rules and information on income and other eligibility criteria. The most recent data available were for 2005. In this section, estimates cited are on an annual basis. Any family that contains a TANF unit that was simulated by TRIM3 to receive benefits during any month of the year is considered to be participating in TANF, and each family receiving or eligible for TANF is counted once. In comparing the characteristics of TANF participants and eligible nonparticipants, differences are statistically significant at the 95 percent confidence level unless otherwise noted. See appendix I for details.
Page 24 GAO-10-164 TANF Cash Assistance
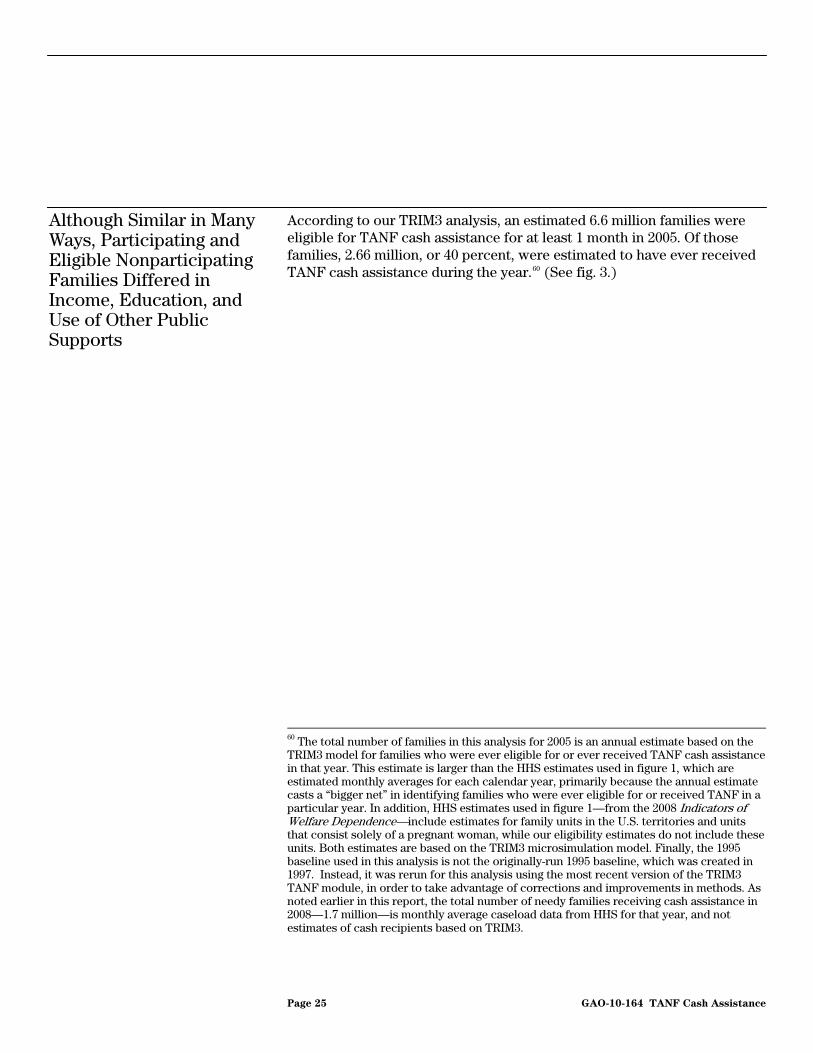
According to our TRIM3 analysis, an estimated 6.6 million families were eligible for TANF cash assistance for at least 1 month in 2005. Of those families, 2.66 million, or 40 percent, were estimated to have ever received TANF cash assistance during the year.60 (See fig. 3.)
Although Similar in Many Ways, Participating and Eligible Nonparticipating Families Differed in Income, Education, and Use of Other Public Supports
60 The total number of families in this analysis for 2005 is an annual estimate based on the TRIM3 model for families who were ever eligible for or ever received TANF cash assistance in that year. This estimate is larger than the HHS estimates used in figure 1, which are estimated monthly averages for each calendar year, primarily because the annual estimate casts a “bigger net” in identifying families who were ever eligible for or received TANF in a particular year. In addition, HHS estimates used in figure 1—from the 2008 Indicators of Welfare Dependence—include estimates for family units in the U.S. territories and units that consist solely of a pregnant woman, while our eligibility estimates do not include these units. Both estimates are based on the TRIM3 microsimulation model. Finally, the 1995 baseline used in this analysis is not the originally-run 1995 baseline, which was created in 1997. Instead, it was rerun for this analysis using the most recent version of the TRIM3 TANF module, in order to take advantage of corrections and improvements in methods. As noted earlier in this report, the total number of needy families receiving cash assistance in 2008—1.7 million—is monthly average caseload data from HHS for that year, and not estimates of cash recipients based on TRIM3.
Page 25 GAO-10-164 TANF Cash Assistance

Figure 3: TANF Cash Assistance: Estimates of Participating and Eligible Nonparticipating Families in 2005, Annual Basis
Note: The estimates for the number of participants and eligible nonparticipants in this analysis are different from those used in figure 1 (which shows trends from 1995-2005 in participating and eligible nonparticipating families) because HHS estimates in the 2008 Indicators of Welfare Dependence reflect estimates for an average month, by calendar year and include estimates for family units in the U.S. territories and units that consist solely of a pregnant woman, while our eligibility estimates reflect annual estimates and do not include these units. Both estimates are based on the TRIM3 microsimulation.
Participants
Eligible nonparticipants
40%2.66 million 60%
3.97 million
Source: GAO analysis of TRIM3 microsimulation model data.
While all families who were eligible to receive TANF cash assistance in 2005 had low incomes, about the same proportions of both participants and eligible nonparticipants (44 percent compared to 41 percent) were headed by an adult without earnings,61 and hardships such as not having enough to eat were common among families in poverty.62
61In this analysis, the term adult without earnings refers to adults in the eligible TANF unit. In comparing the characteristics of participants and nonparticipants, data cited are statistically significant to the 95 percent confidence level unless otherwise noted.
62See Mark Nord, et al., Household Food Security in the United States, 2008, U.S. Dept. of Agriculture, Economic Research Service (Washington, D.C.: November 2009). We were not able to identify studies on hardships distinguishing between TANF recipients and non-recipients.
Page 26 GAO-10-164 TANF Cash Assistance

However, eligible families who did not participate in TANF cash assistance had relatively higher incomes than TANF recipients.63 Overall, nonparticipating eligible families had median incomes about $5,000 higher than TANF families. According to our estimates, in 2005 the median annual income for eligible nonparticipating families was roughly $15,000 compared to $9,600 annually for families receiving TANF. (See fig. 4.)
Figure 4: Estimated Median Annual Incomes of TANF-Eligible Families in 2005
Median annual income
Source: GAO analysis of TRIM3 microsimulation model data.
0 $3,000 $6,000 $9,000 $12,000 $15,000
Eligible familiesnot participating
in TANF
Familiesparticipating
in TANF
$15,000
$9,606
Note: Income is defined here as all gross cash income except for means-tested benefits. In order to be consistent with the Census Bureau’s standard poverty methodology, each family’s income is calculated based on all related persons living in the household. Consequently, both the primary family and the related subfamily are considered to have the same income. This is not the case for determining TANF eligibility, however. For example, a 20-year-old parent living with her parents would be considered as having the same income as her parents for the purposes of this figure. However, for purposes of TANF eligibility, only the 20-year-old parent’s income is considered.
Eligible families who did not participate in the TANF cash assistance program also had higher rates of full-time employment (44 percent) compared to TANF cash recipients (33 percent) and lower rates of work-limiting disabilities (11 percent) compared to TANF recipients (18 percent). While approximately the same proportion of both groups—less than 10 percent—had income from an unmarried partner, the median amount contributed by that partner was considerably greater in the eligible nonparticipating families.
Eligible families who did not participate in TANF generally had higher education levels than TANF families. Eligible adults not receiving TANF
63When we analyzed median incomes, median income was based on all related persons living in the household, not solely the eligible TANF unit. In this analysis, the distinction between participants and nonparticipants reflects one point in time—the year 2005. Nonparticipating eligible families may at some time apply for cash assistance, and TANF families may also leave cash assistance for personal or other reasons, such as being sanctioned for noncompliance.
Page 27 GAO-10-164 TANF Cash Assistance

were more likely to have graduated from high school than adults receiving TANF cash assistance (40 percent compared to 33 percent). A larger proportion of nonparticipating families also had some education beyond high school (36 percent compared to 32 percent).
In addition, eligible families who did not participate in TANF cash assistance were much less likely to receive SNAP benefits than TANF cash recipients, and eligible nonparticipants were also less likely to receive subsidized housing and child care subsidies. According to our estimates, 59 percent of eligible families who did not participate in TANF received SNAP in 2005 compared to 88 percent of TANF families.64
Similarly, our estimates show that 13 percent of eligible families not participating in TANF received subsidized housing compared to 22 percent of TANF participants. The differences in the two groups’ receipt of subsidized child care were not as large, with 8 percent of eligible families not participating in TANF receiving child care subsidized by CCDF compared to 11 percent of TANF participants.65 (See fig. 5.)
64Families are counted as receiving a particular type of income or benefit if at least one person in the family is simulated by TRIM3 to be receiving that type of income or benefit at any point during the year.
65Only child care subsidies funded by CCDF are captured by TRIM3. These estimates do not reflect families receiving child care subsidies from other sources of funding.
Page 28 GAO-10-164 TANF Cash Assistance

Figure 5: Receipt of Other Public Supports among Estimated TANF-Eligible Families in 2005, Annual Basis
Source: GAO analysis of TRIM3 microsimulation model data.
0
20
40
60
80
100%
Percent of families participating
Families participating in TANF
Eligible for TANF, but not participating in TANF
SNAP CCDF-subsidizedchild care
Subsidizedhousing
SSI Any one ofthese public
supports
88
59
91
66
118
22
13
2218
Note: In this figure, the SSI column reflects the SSI participation of individuals in the family unit. While there is no federal prohibition against receiving both TANF and SSI, individuals who receive SSI do not qualify for TANF in nearly all states. Other members who are not receiving SSI would continue to be eligible for TANF. Only child care subsidies funded by the Child Care and Development Fund are captured in these figures, and SSI is the only cash benefit besides TANF that is simulated by TRIM3.
According to our TRIM3 analyses, a greater proportion of eligible nonparticipating families were White and a smaller proportion were Black than for TANF cash recipients, while there were not significant differences with other racial groups. (See fig. 6.)
Page 29 GAO-10-164 TANF Cash Assistance

Figure 6: Race and Ethnicity of Estimated TANF-Eligible Families in 2005, Annual Basis
Source: GAO analysis of TRIM3 microsimulation model data.
0
20
40
60
80
100%
Percent of families
Race of head of household
Families participating in TANF
Eligible for TANF, but not participating
White Asian aBlack Hispanic a Other a
35
46
3 43 3
32
2326 24
aValues for TANF participants and nonparticipants are not statistically different from each other at the 95% confidence level.
A greater proportion of eligible families who did not receive TANF in 2005 were married than TANF families (27 percent compared to 16 percent) and a smaller proportion of eligible non-recipients were headed by a single mother (50 percent compared to 61 percent), according to our analysis. (See fig. 7.)
Page 30 GAO-10-164 TANF Cash Assistance

Figure 7: Family Structure of Estimated TANF-Eligible Families in 2005, Annual Basis
Source: GAO analysis of TRIM3 microsimulation model data.
0
20
40
60
80
100%
Percent of families
Family type
Families participating in TANF
Eligible for TANF, but not participating
Singlemother
No parentsa
(Guardians only)Married Single
father aSingle teen
parent a
61
50
3 3
13 1316
27
7 7
aValues for TANF participants and nonparticipants are not statistically significantly different from each other.
Among Eligible Nonparticipants in 2005, a Portion of Families Did Not Work and Had Very Low Incomes, but Received Public Supports
While many eligible families who did not participate in TANF had higher incomes than families on TANF, a portion of nonparticipating families had very low incomes. According to our estimates, of the nearly 4 million families who were eligible for TANF cash assistance for 1 or more months in 2005 but did not participate that year, 732,000 were neither working nor receiving Supplemental Security Income (SSI), a cash assistance program for people with disabilities. This subgroup of more disadvantaged nonparticipants accounted for 11 percent of all families who were eligible
Page 31 GAO-10-164 TANF Cash Assistance

for TANF cash assistance in 2005, according to our TRIM3 analysis.66 (See fig. 8.)
Figure 8: Estimated Eligible Nonparticipating Families as a Share of Total Eligible Families in 2005, Annual Basis
Note: In this figure, SSI receipt refers to the SSI participation of individuals in the family unit. While there is no federal prohibition against receiving both TANF and SSI, individuals who receive SSI do not qualify for TANF in nearly all states. Other family members who are not receiving SSI would continue to be eligible for TANF. SSI is the only cash benefit besides TANF that is simulated by TRIM3.
Participating in TANF
Not participating in TANF, not employed,and not receiving SSI
Not participating in TANF, but employedor receiving SSI
40%2.7 million 49%
3.2 million
11%732,000
Source: GAO analysis of TRIM3 microsimulation model data.
This subgroup of nonparticipating eligible families also had very low incomes.67 The median annual income for eligible families who were not working or receiving TANF or SSI was $7,020—compared to $16,316 for
66A considerable body of work discusses such families, who are often described as “disconnected” from the workforce. In addition to GAO-01-368 and GAO-03-210, see, for example, Rebecca Blank and Brian Kovak, The Growing Problem of Disconnected Single Mothers (Ann Arbor, Mich.: University of Michigan, National Poverty Center Working Paper Series #07-28, revised January 2008), and Sheila R. Zedlewski, et al., Families Coping without Earnings or Government Cash Assistance (Washington, D.C.: The Urban Institute, February 2003).
67While there is no federal prohibition against receiving both TANF and SSI, individuals who receive SSI do not qualify for TANF in nearly all states. However, other family members who do not receive SSI would continue to be eligible for TANF.
Page 32 GAO-10-164 TANF Cash Assistance

other eligible nonparticipating families—an amount equal to about 45 percent of the federal poverty threshold for a family consisting of one adult and two children. The median income for this subgroup of eligible nonparticipants was also lower than the median income for TANF cash recipients.
parent
tion or less compared with 63 percent for other nonparticipants.
lly received public supports at lower rates than TANF families. (See fig. 9.)
Twelve percent of this subgroup of families was also headed by awho reported having a work-limiting disability—similar to other nonparticipants.68 Families in this subgroup also had low levels of education, with 70 percent having a high school educa
This subgroup of eligible nonparticipating families who were not working and not receiving SSI were slightly more likely than other nonparticipants to be receiving SNAP and public housing, with 63 percent receiving SNAPand 18 percent receiving subsidized public housing. However, they were less likely than other nonparticipants to receive child care subsidies. They were similar to other nonparticipants in that they genera
68SSI is the only disability-related cash assistance program simulated by TRIM3. Some families may receive disability-related payments from other programs the model does not simulate, such as Workers Compensation. In an earlier report, we found that families who left TANF cash assistance who had impairments were more likely than leavers without impairments to report having no income—from personal earnings, household earnings, or SSI benefits—in their first month after exiting TANF. See GAO-03-210.
Page 33 GAO-10-164 TANF Cash Assistance

Figure 9: Receipt of Other Public Supports among Estimated TANF-Eligible Families in 2005, by Eligible Family Type, Annual Basis
Source: GAO analysis of TRIM3 microsimulation model data.
0
20
40
60
80
100%
Percent of families participating
Families participating in TANF
Eligible for TANF, but not participating in TANF
Not participating in TANF, not employed, and not receiving SSI
SNAP CCDF-subsidizedchild care
Subsidizedhousing
SSI Any one ofthese public
supports
88
6358
91
66 66
11 94
2218
12
22 22
n/a
Note: In this figure, the SSI column reflects the SSI participation of individuals in the family unit. While there is no federal prohibition against receiving both TANF and SSI, individuals who receive SSI do not qualify for TANF in nearly all states. Other members who are not receiving SSI would continue to be eligible for TANF. Only child care subsidies funded by the Child Care and Development Fund are captured in these figures, and SSI is the only cash benefit besides TANF that is simulated by TRIM3.
Page 34 GAO-10-164 TANF Cash Assistance

Increased TANF Participation Would Reduce the Number of Children in Extreme Poverty, but Would Not Significantly Change the Number in Poverty
Fewer Children Would Be in Extreme Poverty If TANF Participation Increased
Increased TANF participation would reduce the number of children in extreme poverty—those below half the poverty threshold—according to our analyses.69 According to our TRIM3 analysis, an estimated 4.8 million children were in extreme poverty for at least one month in 2005.70 If the percent of eligible families participating in TANF in 2005 was 84 percent—the rate of participation in AFDC in 1995—rather than about 40 percent—800,000 fewer children would have been in extreme poverty.71 This higher participation would reduce the share of children in extreme poverty by close to 17 percent because the gain in income from TANF benefits would raise some families’ incomes above the extreme poverty threshold.72 The
69In this section, whenever we discuss eligible participating and nonparticipating families, we mean those simulated (estimated) by the TRIM3 model to be eligible participants and nonparticipants. See appendix I for details.
70This estimate for the number of children in extreme poverty is an annual figure.
71To impose the 1995 AFDC participation rate of 84 percent on the 2005 population, we started from each family’s probability of participation as produced by TRIM3’s baseline simulation. We applied an additional across-the-board adjustment factor to increase each family’s probability of participation until the desired participation rate was reached. For this high participation rate scenario, we did not modify cash benefit levels. We kept the population and the TANF rules, including monthly benefit levels, at their 2005 levels. At this higher participation rate, we estimated that 4.0 million children in the United States would have been in extreme poverty in 2005.
72A substantial portion of TANF-eligible families was in extreme poverty in 2005. According to our TRIM3 analysis, at least 35 percent of families who were eligible for TANF in at least one month of 2005—but who did not participate in the program—were in extreme poverty. Not all children who are in extreme poverty live in families that are eligible for TANF, because of varying eligibility standards for TANF among the states.
Page 35 GAO-10-164 TANF Cash Assistance

median income for families with children in extreme poverty in 2005 was $5,400. If TANF participation were higher, families in extreme poverty would have median incomes of $5,964—10 percent higher on average.73 For those families who would gain TANF cash assistance at the 1995 participation rate, the average increase in TANF annual income is estimated to be $2,554 per family.
According to our estimates—using Illinois, the state with the median maximum TANF benefit, as an example—a TANF-eligible family in extreme poverty, consisting of a working single parent with two children that applied for and received cash assistance, would gain enough in TANF benefits to be just above the extreme poverty threshold.74 In this scenario, this family has estimated monthly earnings of $346, which is roughly half the median for families participating in TANF.75 Before receiving TANF cash assistance, this family has an estimated income of $446 per month, including child support, which would provide an income equal to 34 percent of the poverty threshold. After receiving TANF, this family’s income would increase to $676 per month–equal to 52 percent of poverty.76 A family with one child would similarly benefit. (See fig. 10.)
73The median income of families in extreme poverty includes eligible families who are not participating in TANF as well as those who are. Therefore, the income gained due to TANF cash assistance is averaged across all families in extreme poverty.
74Earnings are based on the assumption that families in extreme poverty work 10 hours a week at the Illinois minimum wage of $8 per hour, roughly half of median earnings of TANF families containing one adult and two children according to our analysis of 2005 TANF participants. Families participating in the TANF program must assign their rights to child support to the state and do not receive the full amount of child support paid by the absent parent.
75The income figures in this analysis of extreme poverty differ from the income figures in the previous analysis discussing the 11 percent of nonparticipating families who were not employed and not receiving SSI. The income figures in the previous analysis were based on a small subset of TANF-eligible, but nonparticipating families in 2005. The estimates we use in discussing the impact of increased TANF participation on poverty represent potential earnings for two types of TANF-eligible families in extreme poverty—a single parent with one child and a single parent with two children.
76The effect of the EITC and non-cash benefits such as SNAP and housing subsidies are not presented in these calculations because they are not included in the official measure of poverty.
Page 36 GAO-10-164 TANF Cash Assistance

Figure 10: Estimated Impact of Monthly TANF Cash Assistance Receipt on a Family in Extreme Poverty in Illinois in 2005: A Working Single Parent with One or Two Children
Source: GAO analysis of TRIM3 microsimulation model data.
0 100 200 300 400 500 600 700
Monthly earnings
Child support payment income
Monthly TANF cash assistance payments
WithoutTANF
WithTANF
WithoutTANF
WithTANF
Single parentwith twochildren
Single parentwith onechild
$100$346
$50
$50
$176
$280
$346
$100$346
$346
$115
$11
$210
Extreme poverty threshold($656)
Extreme poverty threshold($561)
$20
Note: The $346 in estimated monthly earnings is roughly half the median for families receiving TANF cash assistance.
However, some families would remain in extreme poverty even with TANF benefits—those with no earned income or with low earned incomes who receive the maximum cash benefit in their state. For example, in Illinois, a single parent with two children who had no earned income would receive $396 per month in TANF benefits—an amount that would be $260 below the extreme poverty threshold for that type of family.
Page 37 GAO-10-164 TANF Cash Assistance

Although the median income of eligible families would rise if TANF participation increased, neither the number of children in poverty nor the poverty rate would significantly change if families who were eligible for TANF cash assistance in 2005 participated at the higher 1995 rate.77 Nearly all of the estimated 3.3 million families in our TRIM3 analysis who would gain TANF benefits at the higher 1995 participation rate would experience an increase in their annual net income. However, these benefits would not be enough to lift a significant portion of them above the poverty threshold.78
If More Eligible Families Participated in TANF, the Number of Children in Poverty Would Not Significantly Change
One reason for this is that many children in poverty are not eligible for TANF, since the majority of states set their TANF eligibility standards at less than half of the federal poverty guidelines.79 States have the flexibility to determine how high or low to set their eligibility standards relative to the federal poverty guidelines. For example, in Alabama, a family of three must have earnings below $269 per month to be eligible for TANF cash assistance—an income that represents about 19 percent of the poverty guideline for this family size in 2006. Alabama has the lowest income eligibility threshold.80 In 2006, 56 percent of children in poverty lived in states that set their eligibility standards for TANF cash assistance below half of the federal poverty guidelines. Because of this, increasing TANF participation would not affect child poverty among children in states with very low eligibility standards.
Another reason is that TANF benefits are typically too low to raise children in poverty above the federal poverty threshold. These benefits range from $170 per month in Mississippi to $723 per month in California
77According to our TRIM3 analysis, an estimated 12.5 million children were in poverty in 2005. Although reducing child poverty is not a formal goal of the TANF program, TANF cash assistance is designed for low-income families, and TANF recipient families typically have incomes below poverty.
78Some families may not see a net increase in their annual income by the full amount of the TANF benefit because other programs such as SNAP count TANF benefits in determining income eligibility, as discussed earlier in this report.
79Published by HHS, the poverty guidelines are used for determining the income eligibility of individuals and families for need-based assistance in some federal programs. Although the guidelines reflect variations in family size, the poverty guidelines—unlike the poverty thresholds—do not reflect variations in the age group of the family members.
80Income eligibility thresholds incorporate monthly earnings limits and limits on assets and depend on a number of different factors associated with a family’s circumstances.
Page 38 GAO-10-164 TANF Cash Assistance

for a family of three.81 The median income for all families in poverty in 2005 was approximately $10,500. If TANF participation were higher, families in poverty would have median incomes of about $11,100. This income is below the federal poverty threshold for a family of three.82 According to our estimates, TANF-eligible families consisting of one working adult and one or two children in Illinois—the state that has the median maximum TANF benefit—would still be in poverty after receiving TANF cash assistance.83 In this example, prior to participating in TANF, the income of the family with one child would fall $390 short of the federal poverty threshold and the income of the family with two children would fall $579 below poverty. After receiving TANF cash assistance, the incomes of both types of families would rise, but not enough to reach the poverty threshold. (See fig. 11.)
81This range represents the continental United States. Alaska and Hawaii have higher federal poverty guidelines than the rest of the country.
82The median income of families in poverty includes families who are not participating in TANF as well as those who are. Therefore, the income gained by TANF cash assistance is averaged across all families in poverty.
83Each family was assumed to have one working adult, earning $632 per month. This is the median earnings of TANF families containing one adult and two children according to our analysis of 2005 participants. It is also the amount one would earn by working 18 hours per week at the Illinois minimum wage of $8 per hour. Families participating in the TANF program must assign their rights to child support to the state and do not receive the full amount of child support paid by the absent parent.
Page 39 GAO-10-164 TANF Cash Assistance

Figure 11: Estimated Impact of Monthly TANF Cash Assistance Receipt on a Family in Poverty in Illinois in 2005: A Working Single Parent with One or Two Children
Source: GAO analysis of TRIM3 microsimulation model data.
0 $200 $400 $600 $800 $1,000 $1,200
Monthly earnings
Child support payment income
Monthly TANF cash assistance payments
WithoutTANF
WithTANF
WithoutTANF
WithTANF
Single parentwith twochildren
Single parentwith onechild
Povertythreshold($1,311)
Poverty threshold($1,122)
$100$632
$50
$50
$81
$185
$632
$100$632
$632
$390
$359
$579
$444
Finally, higher TANF participation would not significantly affect child poverty because some TANF families already have incomes above the federal poverty threshold. As of 2005, seven states have policies that allow a family of three with an income just above the federal poverty threshold to retain their TANF eligibility for at least 2 months. These states are Alaska, California, Connecticut, Delaware, Hawaii, Texas, and Virginia. In these states higher TANF participation could result in more families above poverty receiving benefits, which would not result in a reduction of the poverty rate. Twenty-eight percent of all children in poverty and 35 percent of children receiving cash assistance lived in these states in 2005.
Page 40 GAO-10-164 TANF Cash Assistance

In the Current Recession, Changes in Cash Assistance Caseloads Varied Widely in States We Surveyed While Few States Reduced Spending for Family and/or Work Supports
TANF and Solely State-Funded Cash Assistance Caseloads Increased to Varying Degrees in the Majority of States We Surveyed
Between June 2008—6 months after the start of the current recession—and June 2009, the number of families receiving TANF cash assistance increased in 12 of the 21 states we reviewed, decreased in 6 states and remained relatively unchanged in 3 states, according to state-provided data.84 The magnitude of these caseload changes, however, varied widely across states. For instance, over the same time period, the number of families receiving TANF cash assistance increased by 22 percent in Nevada and decreased by 9 percent in Texas. (See fig. 12.)
84In this discussion of caseload changes during the recession, the TANF caseload numbers include participants in states’ separate state programs (SSP), which are funded with state MOE dollars.
Page 41 GAO-10-164 TANF Cash Assistance

Figure 12: Percent Change in the Number of Families Receiving TANF Cash Assistance, by State, June 2008 through June 2009
Source: GAO analysis of state-provided data.
WV VA
SC
AL
AR
MO
IN
WI
MN
NE
ID
MT
WY
OR
UT
NM
SD
ND
KS
OK TN
KY
LA
ME
LALA
WA+18%
NV+22%
CA+12%
AZ+7%
NCNC+10%+10%
NC+10%
FLFL+14%+14%
FL+14%
CO+15%
IA+7%
IL+2%
OH+17%
TX-9%
MS-1%
GA-3%
PA+1%
NH+38%
MA-3%
MI-3%
NJ-3%
NY-1%
Not surveyed
■ RI-10%
■ D.C.+19%
-10%-20% +10%0 +20%
Increase in caseloadDecrease in caseload
During the current recession, more of the states we surveyed85 saw increases in the number of two-parent families receiving cash assistance than in the number of single-parent families or child-only cases.86 Between June 2008 and June 2009, the number of two-parent families receiving cash assistance increased in 17 of the states we surveyed, while the number of single-parent families increased in 15 states and the number of child-only
85Pennsylvania and Rhode Island could not provide comparable caseload numbers for this analysis.
86Child-only cases are those in which there is no adult recipient of assistance. There are four main categories of “child-only” cases: (1) the parent is disabled and receiving SSI; (2) the parent is a noncitizen and therefore ineligible; (3) the child is living with a nonparent relative; and (4) the parent has been sanctioned and removed from cash assistance for failing to comply with program requirements, and the family’s benefit has been correspondingly reduced. Guardians in child-only cases are not subject to work requirements.
Page 42 GAO-10-164 TANF Cash Assistance

cases increased in 12 states. The median percent change in the number of two-parent families receiving cash assistance was an increase of 27 percent—far more than for other types of eligible families. While the number of two-parent families as a portion of all families receiving assistance was small, the increase in this population of cash assistance recipients is notable because they are the least common type of recipient group. Further, several state officials and representatives of social service organizations noted the increase in two-parent families associated with the current recession, which, according to unemployment data, has had a greater impact on men than women and might result in the need for two-parent families to seek assistance.
While many of these two-parent families received assistance through their state’s TANF program, about 20 percent of these families received assistance through their state’s solely state-funded programs. Most of these programs also grew to varying degrees during the recession. Of the states we contacted, 13 maintained solely state-funded programs during the time period we examined and 9 of these experienced caseload increases between June 2008 and June 2009. These increases ranged from a 2 percent increase in the District of Columbia to a 10-fold increase in Colorado.87 Some state officials we surveyed explained that their assessment of their ability to meet federal work participation rates determined which families would be served through the solely state-funded program.88 Specifically, officials in the 13 states with solely state-funded programs explained that these programs, in whole or part, served two-parent families because the state was concerned that it would not be able to meet the federally established 90 percent work participation rate for two-parent families. In seven of the states with a solely state-funded program, the state’s entire two-parent family caseload was served through
87The three states in which the solely state-funded program’s caseload declined were New Jersey, where the TANF caseload also declined and at roughly the same rate; New Hampshire, which eliminated a portion of its solely state-funded program because of state budget constraints; and Rhode Island, which discontinued benefits to children whose parents had reached their time limit in October 2008 and eliminated the program as of June 2009. The caseloads for solely state-funded programs in Mississippi and Pennsylvania remained relatively unchanged. For the purposes of this report, we refer to the District of Columbia as a state.
88Prior to the reauthorization of TANF in 2006, states had used SSPs for this purpose. However, after reauthorization, SSP/MOE-funded programs became subject to TANF requirements and recipients were subject to the same work participation requirements as TANF recipients.
Page 43 GAO-10-164 TANF Cash Assistance

this program. In a few states, solely state-funded programs also served families with disabilities who similarly may have been unable to meet mandatory work participation rates, particularly requirements for a minimum number of hours in a work activity, according to state officials.
In order to understand more fully the extent to which families are receiving cash assistance in the current recession, including those families who are in solely state-funded programs in caseloads provides a more comprehensive picture of these changes.89 Because these programs are funded only by states and are not counted toward state maintenance-of-effort requirements, HHS lacks authority to require that their caseload data be reported to HHS, according to HHS officials. In some states, including families from these solely state-funded programs in the state’s total cash assistance caseload provided a more accurate picture of increases or decreases in states’ programs in the current recession.90 For instance, in Colorado, the number of families receiving TANF cash assistance increased by 15 percent. However, the solely state-funded program experienced a large amount of growth, and overall the state’s cash assistance caseload increased by more than 33 percent. In Rhode Island, the number of families receiving TANF cash assistance decreased by 10 percent. However, in October 2008 the state discontinued benefits to children it had been serving through the solely state-funded program whose parents had received 5 years of assistance, so overall the state’s cash assistance caseload decreased by more than 20 percent. In other states, including the solely state-funded caseload reveals a more modest degree of change than the TANF caseload might indicate. For example, New Hampshire eliminated part of its solely state-funded program due to budget concerns and moved families receiving benefits into the TANF program. As a result, the number of families receiving TANF cash assistance increased by almost 38 percent, while overall the state’s cash assistance caseload increased by a substantial, but more modest, 23 percent. (See fig. 13.)
89Analyses of cash assistance caseload data for 2005 in the previous three sections of this report provide a comprehensive characterization of the cash assistance caseload because they reflect both TANF cash assistance and SSP caseload data combined for 2005. Solely state-funded programs were not implemented until fiscal year 2007.
90Omitting solely state-funded families in calculating the number of families receiving cash assistance could lead to underestimating the extent of caseload growth or overestimating the extent of caseload decline.
Page 44 GAO-10-164 TANF Cash Assistance

Figure 13: For States with a Solely State-Funded Program, Percent Change in the Number of Families Receiving Cash Assistance from TANF and from TANF and Solely State-Funded Programs Combined, June 2008 through June 2009
Source: GAO analysis of state-provided data.
0
10
20
30
40
50%
Percentage of families
Colo. D.C. Ill. N.H. Penn.
N.J. N.Y. R.I.Ga. Mass. Mich. Miss. Texas
14.9
-8.9
19.3
-2.5 -2.5
1.6
-2.9 -3.0-0.8 -0.8
37.9
-2.7-1.1
0.8
-10.4-8.5
33.3
8.4
3.8
-1.9 -1.7
23.4
-2.6-0.3
0.7
-21.3
TANF and SSP
TANF, SSP, and SSF
In the time period we examined, there was no clear association between the change in the number of families receiving cash assistance in a state and either the unemployment rate or the change in unemployment rate in that state. (See table 1.) For instance, Illinois, the District of Columbia, Florida, and Georgia all had unemployment rates of between 10 and 11 percent in June 2009. However, caseloads increased 4 percentage points in Illinois, 8 percentage points in the District of Columbia, and 14 percentage points in Florida, and decreased 3 percentage points in Georgia, between June 2008 and June 2009. Similarly, both New Jersey and Washington experienced a 4 percentage point increase in unemployment rates between June 2008 and June 2009. However, caseloads decreased 3 percentage points in New Jersey and increased 18 percentage points in Washington over the same period of time. This does not mean that there is no relationship between unemployment and cash assistance caseloads, but
Page 45 GAO-10-164 TANF Cash Assistance

rather that unemployment is one of many factors—including the state’s eligibility and asset limits, the state’s application process, and other state-specific program characteristics—that may affect a state’s caseload.
Table 1: Cash Assistance Caseload Changes and Unemployment Information in Selected States, June 2008 through June 2009
Percent change in caseload (TANF+ SSP+
solely state-funded programs) June 2008 to
June 2009Unemployment rate June 2009
Change in unemployment rate June 2008
to June 2009
Arizona 7.25 8.7 3.2
California 11.51 11.6 4.5
Colorado 33.29 7.6 2.8
District of Columbia 8.44 10.9 4.1
Florida 14.25 10.7 4.7
Georgia -2.50 10.1 4.0
Illinois 3.82 10.3 3.7
Iowa 6.65 6.2 2.1
Massachusetts -1.91 8.6 3.5
Michigan -1.71 15.2 7.1
Mississippi -0.83 9.1 2.2
Nevada 21.66 11.9 5.5
New Hampshire 23.39 6.8 3.1
New Jersey -2.61 9.2 4.0
New York -0.28 8.7 3.4
North Carolina 9.96 11.0 4.9
Ohio 16.54 11.1 4.7
Pennsylvania 0.68 8.4 3.1
Rhode Island -21.27 12.4 4.7
Texas -8.51 7.5 2.7
Washington 17.76 9.2 4.0
Source: GAO analysis of state-provided data and data from U.S. Bureau of Labor Statistics.
Since June 2009, state and local fiscal conditions have continued to deteriorate, and the effect of the changes in the economic climate on TANF and solely state-funded cash assistance programs is unknown. For example, the impact of expiring extensions of unemployment insurance (UI) on state caseloads is hard to predict. Officials from eight states believed that the number of families receiving cash assistance in their
Page 46 GAO-10-164 TANF Cash Assistance

states had not increased, or had not increased as much as might have been expected, because families were still collecting UI benefits.91 If jobs are still not available when UI benefits end, these families may turn to TANF for cash assistance. However, two experts we interviewed questioned the extent to which UI has lessened or delayed the need for cash assistance. Eligibility for UI is generally conditional on meeting certain state-imposed qualifications, including having a minimum amount of wages and employment over a defined period of time as well as having become unemployed for good cause under state law. According to two experts we interviewed, many TANF-eligible single-mothers would not likely meet the criteria for receipt. Still, UI benefit extensions may be delaying the need for cash assistance for some two–parent families that do qualify for UI benefits.
Few States We Surveyed Reduced Spending on Family and Work Supports during the Current Recession to Offset Increased Spending on Cash Assistance
Few states we surveyed reported that they had reduced TANF block grant and MOE spending for family and work supports, such as child care and subsidized employment programs, to offset increased expenditures for growth in their cash assistance caseloads.92 When a state’s spending on cash assistance increases, it has several options to address this need for additional resources. The state can use reserve funds, if available, to defray costs; use state funds to augment the TANF program; access the TANF contingency fund; access the Emergency Contingency Fund created under ARRA; shift resources from work support programs; or cut services. In a previous GAO report, we found that when cash assistance caseloads and related spending increased in the states we reviewed, there was an associated contraction in the spending for other forms of aid and services.93 However, we did not observe this trend in the time period we explored. According to state officials, 11 of the 21 states we surveyed increased spending on cash assistance between June 2008 and June 2009. Of these 11 states, 7 either maintained or increased the amount of TANF-
91Unemployment benefits had been extended, in some states, to 79 weeks. UI recipients often cannot qualify for TANF until their UI benefits have been fully expended, since monthly UI benefits often exceed the maximum income that states allow to be eligible for TANF.
92TANF block grant and MOE spending are two components of federal, state, and local spending on a range of programs aimed at serving low-income and needy populations. In this section, we will refer to them collectively as TANF-related spending.
93GAO, Welfare Reform: Better Information Needed to Understand Trends in States’ Uses of the TANF Block Grant, GAO-06-414 (Washington, D.C.: March 2006).
Page 47 GAO-10-164 TANF Cash Assistance
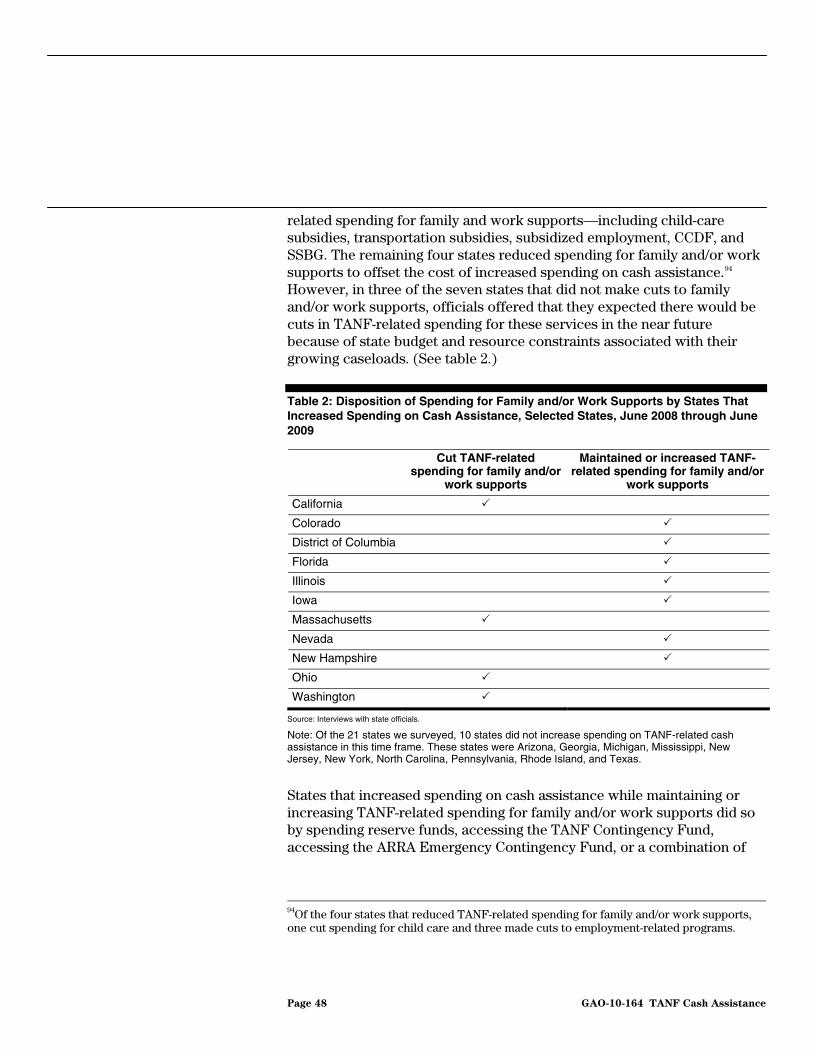
related spending for family and work supports—including child-care subsidies, transportation subsidies, subsidized employment, CCDF, and SSBG. The remaining four states reduced spending for family and/or work supports to offset the cost of increased spending on cash assistance.94 However, in three of the seven states that did not make cuts to family and/or work supports, officials offered that they expected there would be cuts in TANF-related spending for these services in the near future because of state budget and resource constraints associated with their growing caseloads. (See table 2.)
Table 2: Disposition of Spending for Family and/or Work Supports by States That Increased Spending on Cash Assistance, Selected States, June 2008 through June 2009
Cut TANF-related spending for family and/or
work supports
Maintained or increased TANF-related spending for family and/or
work supports
California
Colorado
District of Columbia
Florida
Illinois
Iowa
Massachusetts
Nevada
New Hampshire
Ohio
Washington
Source: Interviews with state officials.
Note: Of the 21 states we surveyed, 10 states did not increase spending on TANF-related cash assistance in this time frame. These states were Arizona, Georgia, Michigan, Mississippi, New Jersey, New York, North Carolina, Pennsylvania, Rhode Island, and Texas.
States that increased spending on cash assistance while maintaining or increasing TANF-related spending for family and/or work supports did so by spending reserve funds, accessing the TANF Contingency Fund, accessing the ARRA Emergency Contingency Fund, or a combination of
94Of the four states that reduced TANF-related spending for family and/or work supports, one cut spending for child care and three made cuts to employment-related programs.
Page 48 GAO-10-164 TANF Cash Assistance

the three. (See table 3.) Under PRWORA, states can save portions of their TANF block grant to use in the future for cash assistance to families. According to state officials, four of the seven states accessed these reserve or carry-over funds accumulated from previous years to increase cash assistance expenditures and maintain or increase expenditures on the family supports. Officials in one of these states, though, told us that projections show that it will have expended all of its reserve funds within the next 2 years.
Table 3: Sources of Funding Used by States to Offset Increased Spending on TANF-related Cash Assistance, June 2008 through June 2009
Used Reserve
Fund Used TANF
Contingency Fund Used Emergency
Contingency Fund
Californiaa
Colorado
District of Columbia
Florida
Illinois
Iowa
Massachusettsa
Nevada
New Hampshire
Ohioa
Washingtona
Source: Interviews with state officials and HHS-provided documentation.
Note: Of the 21 states we surveyed, 10 states did not increase spending on TANF-related cash assistance in this time frame. These states were Arizona, Georgia, Michigan, Mississippi, New Jersey, New York, North Carolina, Pennsylvania, Rhode Island, and Texas. aThis table also includes the four states that cut TANF-related spending for family and/or work supports in this time frame—California, Massachusetts, Ohio, and Washington.
Until recently, states may also have been eligible to use the TANF Contingency Fund, but these funds are now depleted. Of the seven states in our survey that increased spending on cash assistance while maintaining TANF-related spending on family and work supports, all seven were eligible to apply for access to the Contingency Fund, according to HHS, and in fiscal year 2009, two of these states had drawn money from this fund. At the end of the fiscal year in September 2009, there was about $212 million left in the contingency fund. For the first quarter of the 2010 fiscal year, New York had applied for more than half the remaining sum, according to state officials. Anticipating the exhaustion of the Contingency
Page 49 GAO-10-164 TANF Cash Assistance
Fund, officials from one state we surveyed questioned the state’s ability to continue funding their TANF programs at current levels. According to HHS officials, final payments from the TANF Contingency Fund were distributed in December 2009.
In addition, states used or planned to use money drawn from the Emergency Contingency Fund created by ARRA to allow them to increase spending on cash assistance without cutting TANF-related spending for family and work supports. According to HHS data, as of October 2009, all 21 of the states we surveyed applied for money from the Emergency Contingency Fund, including all 7 of the states that increased spending on cash assistance but did not reduce TANF-related spending for family and work supports.95 Most states we surveyed that had applied for Emergency Contingency Funds plan to use them to cover the growing number of families receiving cash assistance, according to state officials. In addition, officials in some states told us that these funds may allow them to continue providing family and work supports at the current level and expand subsidized employment programs.96 However, one state official explained that caseloads and spending could increase or remain high beyond fiscal year 2010, the time when Emergency Contingency Funds will no longer be available to supplement funding.
We provided a draft of this report to HHS for its review, and a copy of the agency’s written response is in appendix II. In its comments, HHS said that the report was informative and did not disagree with our findings. HHS noted that the report provided useful insights into a range of factors that help account for declines in TANF participation, the extent to which increased participation in TANF among eligible families could reduce the severity of poverty, and the challenges facing states as they respond to increased need during the economic downturn. The agency also noted several useful areas for additional work, for example, on the extent and
Agency Comments and Our Evaluation
95Six of these states applied for Emergency Contingency Fund on the basis of increases in cash assistance spending due to caseload increases. One of these states also applied because of spending increases for non-recurring benefits and two applied because of spending increases for subsidized employment.
96One state said that TANF-related spending on certain family and work supports, particularly child care, may decrease in the coming year because additional ARRA funds are available for this specific purpose. Using ARRA child care funds would free up TANF funds to address increases in families receiving cash assistance in this state.
Page 50 GAO-10-164 TANF Cash Assistance

nature of disability among eligible nonparticipants and how participation may change over the course of the recession. With regard to our finding on the characteristics of participants and nonparticipants, HHS suggested that more could be learned by examining subgroups of nonparticipants rather than examining nonparticipants broadly as a group. The agency also suggested that we discuss our findings about nonparticipants in the context of the research literature on this subject. Our study was designed to describe the characteristics of both participants and eligible nonparticipants, as requested, and we further identified the characteristics of one important subgroup of nonparticipating eligible families. While we agree that further analyses of subgroups of nonparticipants could be useful, conducting such analyses was beyond the scope of our engagement. Finally, HHS also provided technical comments on the draft, and in response to these comments, we made changes where appropriate.
We also provided the draft report to external reviewers with expertise in welfare reform and TANF and incorporated their comments as appropriate.
As agreed with your office, unless you publicly announce its contents
earlier, we plan no further distribution of this report until 30 days after its issue date. At that time, we will send copies of this report to the Secretary of Health and Human Services, appropriate congressional committees, and other interested parties. The report is also available at no charge on the GAO Web site at http://www.gao.gov.
If you or your staff have any questions about this report, please contact me at (202) 512-7215 or [email protected]. Contact points for our Offices of Congressional Relations and Public Affairs may be found on the last page of this report. Key contributors to this report are listed in appendix IV.
Sincerely yours,
Director, Education, Workforce, ecurity Issues
Kay E. Brown
and Income S
Page 51 GAO-10-164 TANF Cash Assistance

Appendix I: Objectives, Scope, and
Methodology
Page 52 GAO-10-164
Appendix I: Objectives, Scope, and Methodology
We designed our study to provide information on (1) the factors that contributed to the decline in families receiving TANF cash assistance since the 1990s, (2) how the characteristics of eligible families who participate in TANF compare to eligible families who do not receive TANF cash assistance, (3) how the participation of eligible families in TANF affects the number of children in extreme poverty and poverty, and (4) the changes states are experiencing in the number of families receiving cash assistance in the current recession and what changes, if any, states have made in their TANF–related spending to respond to any increases.
Overall, to address these objectives, we contracted with the Urban Institute for analyses using the Transfer Income Model, version 3—a microsimulation model known as TRIM3—which simulates major governmental tax, transfer, and health programs, including TANF;1 reviewed literature and relevant federal laws and regulations; interviewed TANF experts and officials at HHS; interviewed state TANF officials in 21 selected states and obtained state TANF data; and contacted state-based social services organizations in the selected states.
We conducted our work from November 2008 to February 2010 in accordance with all sections of GAO’s Quality Assurance Framework that are relevant to our objectives. The framework requires that we plan and perform the engagement to obtain sufficient and appropriate evidence to meet our stated objectives and to discuss any limitations in our work. We believe that the information and data obtained, and the analysis conducted, provide a reasonable basis for any findings and conclusions in this product.
1The TRIM3 model uses the U.S. Census Bureau’s Current Population Survey (CPS) and the Welfare Rules Database (maintained at the Urban Institute under HHS funding) to simulate eligibility based on state-specific program rules and information on income and other eligibility criteria. The Welfare Rules Database provides a longitudinal account of the changes in welfare rules in all 50 states and the District of Columbia. The database organizes the detailed information on welfare rules across states, time, and geographic areas within states and different types of assistance units. Caseworker manuals and state regulations provide the data from 1997 to the present, while AFDC State Plans and Waiver Terms and Conditions provide the data for years prior to 1997. GAO did not conduct a legal analysis of state laws or requirements for state cash assistance programs.
TANF Cash Assistance

Appendix I: Objectives, Scope, and
Methodology
Analyses Using the Transfer Income Model, Version 3 (TRIM3)
To identify factors contributing to the caseload decline (for question 1), compare the characteristics of TANF participants and non-participants (for question 2), and analyze the impact of TANF participation on child poverty and extreme poverty (for question 3), we contracted with the Urban Institute for analyses—using the Transfer Income Model, version 3, known as TRIM3. TRIM3 is maintained and developed at the Urban Institute under primary funding from HHS, Office of the Assistant Secretary for Planning and Evaluation. TRIM3 simulates major governmental tax, transfer, and health programs, including TANF. TRIM3 can be used to estimate the effect of rule changes, such as restrictions on eligibility for legal immigrants, on the number of eligible families; compare the income and other characteristics of participating and nonparticipating families; and estimate the effect of higher TANF participation rates on child poverty and extreme child poverty, with incomes below 50 percent of the federal poverty level. Using TRIM3 for these analyses required our input on assumptions and/or interpretations about economic behavior and about the rules governing federal programs. Therefore, the conclusions presented in this report are attributable only to GAO.
The TRIM3 microsimulation model was used to estimate the number of families who would be eligible for TANF and the amount of their potential benefits. The model simulates the process a caseworker would go through to determine eligibility based on each family’s state of residence, household composition, income, and other factors. TRIM3 relies on the Annual Social and Economic Supplement (ASEC) to the Current Population Survey (CPS), as well as information from the Welfare Rules Database, to simulate eligibility based on state specific program rules and information on income and other eligibility criteria.
The model was also used to estimate the number of families who participate in the TANF program. While the ASEC includes information on whether a family received TANF, the benefit is substantially under-reported. Among TANF-eligible families who did not report receipt of TANF, a family’s likelihood of TANF participation is estimated based on the family’s demographic characteristics and the level of potential benefit. Simulated participation decisions are aligned to bring the simulated caseload acceptably close to the actual caseload in overall size and by key characteristics. TRIM3 does not model certain aspects of program eligibility, such as sanctions from failing to comply with work rules or child support rules, diversion strategies, or adherence to behavioral requirements such as school attendance and immunizations. The fact that TRIM3 does not model sanctions means that the model may overestimate eligibility and underestimate participation rates.
Page 53 GAO-10-164 TANF Cash Assistance

Appendix I: Objectives, Scope, and
Methodology
In this study, we used both “baseline” simulations and “alternative” simulations of TANF cash assistance. TRIM3 baseline simulations are simulations that apply the actual policies that were in place in a particular year to the CPS survey data for that year. In a baseline simulation, the initially-estimated probabilities of participation are modified in order to bring the size and characteristics of the simulated caseload sufficiently close to the size and characteristics of the actual caseload in that year. We used TRIM3 baseline estimates for TANF cash assistance for our analyses of the characteristics of participants and nonparticipants in 2005, and as the point of comparison for the alternative simulations—using 1995 participation rates—for our analyses of the effect of TANF 2005 rules on the 1995 AFDC population and our analyses of TANF participation on child poverty.
Our TRIM3 analyses are based on data from 2005 because it was the most recent publicly available data when we conducted our work. We chose 1995 as a comparison year partly because it was the year prior to the creation of TANF under PRWORA. Researchers at the Urban Institute also advised us that 1996 data was not likely to be reliable because of data system transitions from the prior program, AFDC, to TANF. Furthermore, Urban Institute researchers told us they could not use 1996 data to analyze the impact of PRWORA rules on families’ eligibility because non-citizens’ legal status (e.g., whether legal permanent resident, undocumented, refugee, or temporary resident) had not been imputed for that year’s data. Given these technical limitations, we agreed that 1995 data was best and that it also provided a 10-year spread for comparison.
To provide insight into the impact of the immigrant restrictions, time limits, and other PRWORA rules on TANF eligibility, we applied the PRWORA changes to the 1995 caseload data, assuming that the rules had been imposed 10 years before they were actually imposed. In cases of state options with regard to policies, states were assumed to make the same choices as they made in 2005. It is important to note that this type of analysis cannot definitively establish the portion of caseload change from 1995 to 2005 that is due solely to a particular rules change, due to the potential inter-relationships between rules, population characteristics, and participation behavior.
To compare the characteristics of eligible families who participate in TANF to eligible families who do not receive TANF cash assistance, we analyzed differences in demographic characteristics, such as race, age, family type; income differences, such as median income and poverty status; and the receipt of other public supports such as SNAP, subsidized
Page 54 GAO-10-164 TANF Cash Assistance

Appendix I: Objectives, Scope, and
Methodology
child care, or subsidized housing. For this analysis we used 2005 data, the most recent available. Estimates in this analysis are based on annual data, so as to capture longer term characteristics of these families, and the distribution of the annual caseload by some characteristics could be different from the distribution of the monthly-snapshot caseload. When looking at income differences between groups, we compared all gross cash income, such as earnings and child support, and excluded means-tested benefits such as TANF or Supplemental Security Income (SSI), a cash assistance program for low-income people who are elderly or who have disabilities. We also examined the characteristics of a subgroup of eligible nonparticipants who during the year were neither working nor receiving SSI. In comparing the characteristics of participants and nonparticipants, differences are statistically significant at the 95 percent confidence level unless otherwise noted.
To estimate how the participation of eligible families in TANF affects the number of children in extreme poverty and poverty, we imposed the 1995 AFDC participation rate of 84 percent on the 2005 population. To do this, we started from each family’s probability of participation as produced by TRIM3’s baseline simulation—the result of the statistical equation, adjusted by adjustment factors established during the baseline alignment process—but we applied an additional across-the-board adjustment factor to increase each family’s probability of participation. This has the effect of bringing in the “next most likely” families until the desired participation rate is reached. Some families are technically eligible for TANF but are financially better off without taking TANF, due to the fact that the amount of child support that would be retained by the state exceeds the TANF benefit they would receive. These families were simulated to remain nonparticipants; all the new TANF participants were selected from families who would receive more in TANF than they would lose in child support income.
To estimate the impact of TANF receipt on examples of families in extreme poverty and poverty, we chose Illinois because it is the state with the median TANF benefit. Earnings for families in poverty were set at $632 per month. This is the median earnings of TANF families containing one adult and two children, according to our analysis of 2005 participants. It is also the amount one would earn by working 18 hours per week at the Illinois minimum wage of $8 per hour. Earnings for families in extreme poverty were set at $346, based on the assumption that families in extreme poverty work 10 hours a week at the Illinois minimum wage of $8 per hour, and about half of median earnings of TANF families containing one adult and two children.
Page 55 GAO-10-164 TANF Cash Assistance

Appendix I: Objectives, Scope, and
Methodology
We assessed the reliability of the TRIM3 modeling procedures by reviewing extensive documentation on the TRIM3 model and input data sources, having several conversations with staff from the Urban Institute who were responsible for the work provided under our contract, reviewing the Urban Institute’s internal quality control procedures, and having extensive discussions about the underlying assumptions used in specifying the models. We identified data limitations in the CPS that we reconciled with the Urban Institute through meetings and acquiring additional documentation. In addition to the estimates presented in the report, the Urban Institute calculated standard errors and performed statistical tests of significance for all estimates and pairwise comparisons. We verified that those calculations were correct by reviewing the CPS technical documentation. We evaluated other TRIM3 estimates, particularly those illustrating hypothetical scenarios, on the basis of substantive significance rather than statistical significance. To this end, we considered the size and direction of the effect rather than whether the statistic differed from zero to assess the validity of the estimate. We determined that none of the data limitations or modeling assumptions affected or compromised the analysis for this report and the data are considered to be sufficiently reliable for our purposes.
Review of Literature and Legislation
To analyze the factors that contributed to the decline in families receiving TANF cash assistance since the 1990s, we conducted a review of relevant literature by researchers by obtaining recommendations for studies from internal GAO and external TANF researchers and policy experts, including HHS officials; searching various databases for peer-reviewed journal articles and other publications; and reviewing policy and research organization websites for relevant studies. We used the relevant research to analyze the factors researchers have identified as contributing to the declining number of families receiving cash assistance. At least two social scientists or statisticians with specialized training in the evaluation of research methodology reviewed each study to assess its methodology. Our conclusions about the factors contributing to the decline in the number of cash recipients are based, in part, on our assessment of the evidence presented in these studies. We also reviewed relevant federal laws and regulations. We did not conduct a legal analysis of state laws of state cash assistance programs for this report. As noted elsewhere, references to state laws or rules were based on the Welfare Rules Database, which is maintained at the Urban Institute under HHS/ACF funding and is used by the TRIM3 model in its simulations.
Page 56 GAO-10-164 TANF Cash Assistance

Appendix I: Objectives, Scope, and
Methodology
We also interviewed researchers and policy analysts at academic centers and other organizations to obtain their perspectives on factors that contributed to the decline in cash assistance caseloads since the 1990s and any information they may have had on state experiences during the current recession. In selecting experts for our interviews, we sought researchers and organizations who have conducted work on welfare issues and who could provide us with a range of perspectives. We interviewed TANF researchers and officials at the Department of Health and Human Services (HHS) as well as researchers and policy analysts at the American Enterprise Institute for Public Policy Research, The Brookings Institution, Center on Budget and Policy Priorities, Center for Law and Social Policy, Congressional Research Service, Johns Hopkins University, Mathematica Policy Research, Inc., the Urban Institute, and the University of Michigan (National Poverty Center).2 We also interviewed officials at the American Public Human Services Association, the National Conference of State Legislatures, and the National Governors Association.
Interviews with Researchers and Policy Analysts
Interviews with State Officials
To determine if and how the number of families receiving cash assistance and the use of TANF-related funds have changed during the current recession, we conducted semi-structured telephone interviews with TANF officials in 21 states and obtained data on their TANF programs, and where applicable, SSPs and solely state-funded programs. In addition, we reviewed TANF data on the number of families receiving cash assistance and other administrative data available through HHS. We pre-tested our questions in California, Iowa, New York, and Rhode Island. In our interviews, we asked questions about changes in the number of families receiving cash assistance, in the uses of the TANF block grant and MOE funds, and in other polices that might affect the number of applicants or recipients. We also asked about state’s plans for use of ARRA stimulus funding.
The 21 states we selected to interview represent a range of child poverty rates, unemployment rates, cash assistance caseloads, approaches to sanctions and monthly earnings limits, and geographic diversity. Collectively these states represent more than half the families receiving TANF cash assistance nationally. Our analysis focused on the period
2After we initiated our interviews, the researcher who was affiliated with the American Enterprise Institute moved to the University of Maryland (School of Public Policy).
Page 57 GAO-10-164 TANF Cash Assistance
Appendix I: Objectives, Scope, and
Methodology
between June 2008 and June 2009, beginning 6 months after the official start of the current recession. The 21 states included in our analysis were: Arizona, California, Colorado, Florida, Georgia, Illinois, Iowa, Massachusetts, Michigan, Mississippi, New Hampshire, New Jersey, New York, Nevada, North Carolina, Ohio, Pennsylvania, Rhode Island, Texas, Washington, and the District of Columbia.3
Analysis of Caseload Data We collected data on the number of families receiving cash assistance
from June 2008 and June 2009 for the 21 states we selected. This includes federal TANF data as well as data from separate state programs and solely state-funded programs for states that had such programs.4 We analyzed these data for changes in the number of families receiving cash assistance as well as the types of families receiving cash assistance.
We assessed the reliability of data obtained through our 21 state agency surveys by asking questions on the survey that helped us gauge the agency’s processes and procedures for collecting and maintaining data of reasonable quality and reliability. We asked questions pertaining to data entry procedures, training, edit checks, written documentation of procedures, supervisory or other internal and external reviews of data, and known limitations of the data. The answers were analyzed for concerns and states were re-contacted as necessary to gain clarity about the concern and assess the degree to which the concern would limit data quality. We determined that none of these concerns or limitations affected or compromised the data submitted for this review and the data are considered to be sufficiently reliable for our purposes.
State-Based Social Service Organizations
To understand why eligible families may not participate in TANF and to learn more about families’ experiences with the TANF application process, we contacted state-level social service and other organizations in selected states regarding state TANF practices and policies. To identify state-level organizations that could provide the perspective of families on the
3For the purposes of this report, we refer to the District of Columbia as a state.
4Prior to the 2006 reauthorization of TANF, the families served by SSPs were not subject to TANF work requirements. During that time, SSPs often served families that states believed were unable to meet mandatory work requirements, such as parents with disabilities. This was changed in reauthorization, when families in these programs became subject to federal TANF work requirements.
Page 58 GAO-10-164 TANF Cash Assistance

Appendix I: Objectives, Scope, and
Methodology
experience of applying for and receiving cash aid, we requested the names and contact information from TANF officials that we interviewed in 21 states.5 In these interviews, we asked officials to identify state-level organizations in their states that could address issues such as application processes, benefit levels, and sanctions as they affect families. In some cases, these social services groups referred us to alternative organizations for our review, and in those cases we contacted these additional organizations. In one case, we identified and contacted a state-level service provider organization for a state that did not provide us with a contact initially. We e-mailed questions to the organizations we identified in these ways to obtain their perspective on possible reasons why eligible families would not participate in TANF, the ability of families to navigate the application process in their state, and other issues. We obtained written responses to these questions from state organizations and used them in this report solely for illustrative purposes.
5For information on how we selected states for telephone interviews of TANF administrators, see the description of our methodology for obtaining information on state caseload changes in the current recession.
Page 59 GAO-10-164 TANF Cash Assistance

Appendix II: Comments from the Department
of Health and Human Services
Appendix II: Comments from the Department of Health and Human Services
Page 60 GAO-10-164 TANF Cash Assistance

Appendix II: Comments from the Department
of Health and Human Services
Page 61 GAO-10-164 TANF Cash Assistance
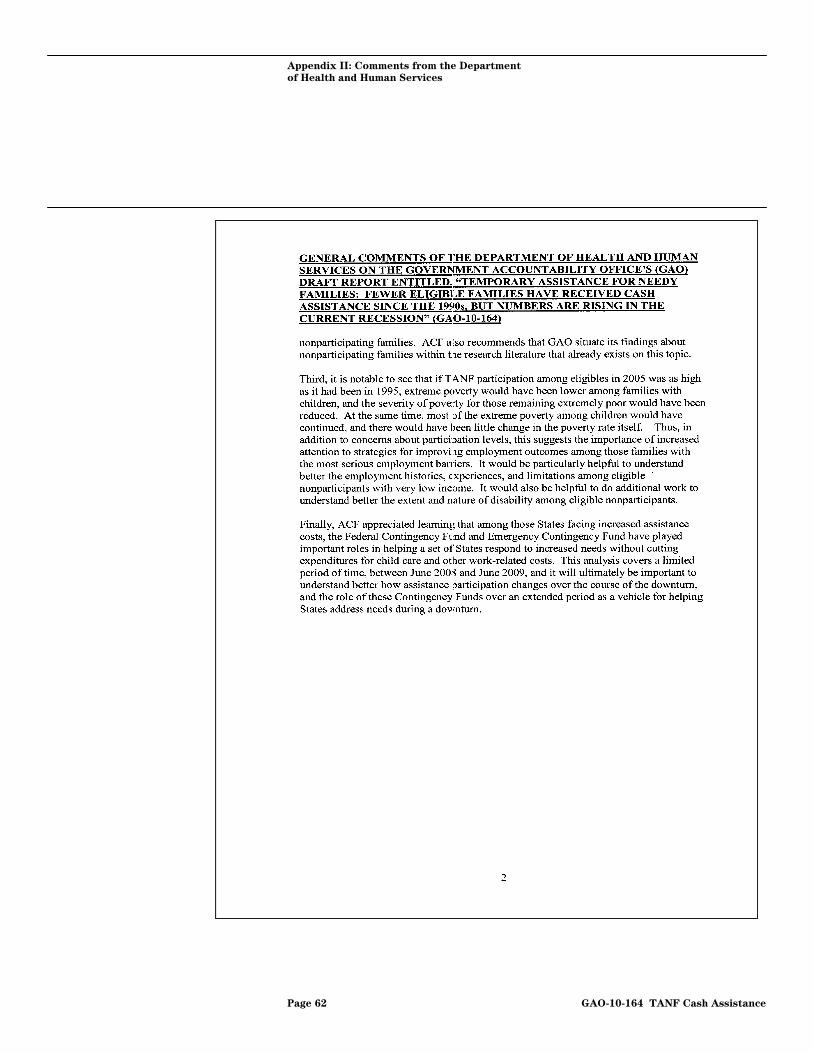
Appendix II: Comments from the Department
of Health and Human Services
Page 62 GAO-10-164 TANF Cash Assistance

Appendix III: GAO
A
Contact and Staff
cknowledgments
Page 63 GAO-10-164
Appendix III: GAO Contact and Staff Acknowledgments
Kay E. Brown, Director (202) 512-7215 or [email protected] Contact Heather McCallum Hahn, Assistant Director; Kathryn A. Larin, Assistant Director; and Deborah A. Signer, Analyst-in-Charge, managed this assignment and made significant contributions to all aspects of this report. Hedieh Rahmanou Fusfield and Jessica R. Wintfeld, Analysts, also made important contributions to this report. Katya Melkote assisted with data collection and analysis, and Susannah Compton and James Bennett provided writing and graphics assistance. In addition, Susan Offutt, Chief Economist, and Max Sawicky provided assistance with economic aspects of this study; Shana B. Wallace and Monique B. Williams provided design and methodological assistance; Russell C. Burnett provided additional methodological assistance; and Alexander G. Galuten provided legal assistance.
Acknowledgments
TANF Cash Assistance

Related GAO Reports
Page 64 GAO-10-164
Related GAO Reports
Poverty in America: Consequences for Individuals and the Economy. GAO-07-343T. Washington, D.C.: January 24, 2007. T
Welfare Reform: Better Information Needed to Understand Trends in States’ Uses of the TANF Block Grant. GAO-06-414. Washington, D.C.: March 3, 2006.
Welfare Reform: More Information Needed to Assess Promising Strategies to Increase Parents’ Incomes. GAO-06-108. Washington, D.C.: December 2, 2005.
Welfare Reform: HHS Should Exercise Oversight to Help Ensure TANF Work Participation Is Measured Consistently across States. GAO-05-821. Washington, D.C.: August 19, 2005.
Means-Tested Programs: Information on Program Access Can Be an Important Management Tool. GAO-05-221. Washington, D.C.: April 11, 2005.
TANF AND SSI: Opportunities Exist to Help People with Impairments Become More Self-Sufficient. GAO-04-878. Washington, D.C.: September 15, 2004.
Welfare Reform: Information on Changing Labor Market and State Fiscal Conditions. GAO-03-977. Washington, D.C.: July 15, 2003.
Welfare Reform: Former TANF Recipients with Impairments Less Likely to Be Employed and More Likely to Receive Federal Supports. GAO-03-210. Washington, D.C.: December 6, 2002.
Welfare Reform: Outcomes for TANF Recipients with Impairments. GAO-02-884. Washington, D.C.: July 8, 2002.
Welfare Reform: With TANF Flexibility, States Vary in How They Implement Work Requirements and Time Limits. GAO-02-770. Washington, D.C.: July 5, 2002.
Welfare Reform: States Provide TANF-Funded Work Support Services to Many Low-Income Families Who Do Not Receive Cash Assistance. GAO-02-615T. Washington, D.C.: April 10, 2002. T
TANF Cash Assistance

Related GAO Reports
Welfare Reform: States Are Using TANF Flexibility to Adapt Work Requirements and Time Limits to Meet State and Local Needs. GAO-02-501T. Washington, D.C.: March 7, 2002. T
Welfare Reform: Progress in Meeting Work-Focused TANF Goals. GAO-01-522T. Washington, D.C.: March 15, 2001. T
Welfare Reform: Moving Hard-to-Employ Recipients into the Workforce. GAO-01-368. Washington, D.C.: March 15, 2001.
Unemployment Insurance: Role as Safety Net for Low-Wage Workers Is Limited. GAO-01-181. Washington, D.C.: December 29, 2000.
(130900) Page 65 GAO-10-164 TANF Cash Assistance

GAO’s Mission The Government Accountability Office, the audit, evaluation, and investigative arm of Congress, exists to support Congress in meeting its constitutional responsibilities and to help improve the performance and accountability of the federal government for the American people. GAO examines the use of public funds; evaluates federal programs and policies; and provides analyses, recommendations, and other assistance to help Congress make informed oversight, policy, and funding decisions. GAO’s commitment to good government is reflected in its core values of accountability, integrity, and reliability.
The fastest and easiest way to obtain copies of GAO documents at no cost is through GAO’s Web site (www.gao.gov). Each weekday afternoon, GAO posts on its Web site newly released reports, testimony, and correspondence. To have GAO e-mail you a list of newly posted products, go to www.gao.gov and select “E-mail Updates.”
Obtaining Copies of GAO Reports and Testimony
Order by Phone The price of each GAO publication reflects GAO’s actual cost of production and distribution and depends on the number of pages in the publication and whether the publication is printed in color or black and white. Pricing and ordering information is posted on GAO’s Web site, http://www.gao.gov/ordering.htm.
Place orders by calling (202) 512-6000, toll free (866) 801-7077, or TDD (202) 512-2537.
Orders may be paid for using American Express, Discover Card, MasterCard, Visa, check, or money order. Call for additional information.
Contact:
Web site: www.gao.gov/fraudnet/fraudnet.htm E-mail: [email protected] Automated answering system: (800) 424-5454 or (202) 512-7470
Ralph Dawn, Managing Director, [email protected], (202) 512-4400 U.S. Government Accountability Office, 441 G Street NW, Room 7125 Washington, DC 20548
To Report Fraud, Waste, and Abuse in Federal Programs
Congressional Relations
Chuck Young, Managing Director, [email protected], (202) 512-4800 U.S. Government Accountability Office, 441 G Street NW, Room 7149 Washington, DC 20548
Public Affairs
Please Print on Recycled Paper