feature extraction of eeg and epilepsy...
TRANSCRIPT
International Journal of Research in Engineering and Applied Sciences(IJREAS) Available online at http://euroasiapub.org/journals.php Vol. 7 Issue 6 , June-2017, pp. 265~272 ISSN (O): 2249-3905, ISSN(P): 2349-6525 | Impact Factor: 7.196
International Journal of Research in Engineering & Applied Sciences
Email:- [email protected], http://www.euroasiapub.org
An open access scholarly, online, peer-reviewed, interdisciplinary, monthly, and fully refereed journal
265
FEATURE EXTRACTION OF EEG AND EPILEPSY DETECTION
S.Rinu Sam
Sivaji College of Engineering and Technology,
Manivila, Tamil Nadu, India
Abstract
Many brain disorders are diagnosed by analyzing the EEG signals. EEG refers to the recording of the brain's spontaneous electrical activity over a short period of time. In this paper an efficient approach for detecting the presence of epileptic seizures in EEG signals is presented. Epilepsy is a disease due to temporary alternation in brain functions due to abnormal electrical activity of a group of brain cells and is termed as seizure. The analysis is performed in three stages. In the first step EEG signal is preprocessed to remove the artifacts from the EEG signal. In the second step the statistical features are extracted from each sub band and finally classification of the EEG signal that is epileptic seizure exists or not has been done using artificial Neural Network. Keywords: EEG, Epilepsy, seizures, artificial Neural Network
I.INTRODUCTION
Brain is one of the most important organs of humans, for controlling t he coordination o f human muscles and nerves. The transient and unexpected electrical disturbances of the brain results in an acute disease called Epileptic seizures. Numbers of researchers have presented automated [1-4] computational m e t h o d s for detecting epileptic seizures from EEG signals. The word ‘epilepsy’ is derived from the Greek word epilambanein, which means ‘to seize or attack’. Seizures are the result of sudden brief, excessive electrical discharges in a group of brain cells called neurons. Transient symptoms can occur, such as loss of awareness or consciousness and disturbances of movement, sensation (including vision, hearing, and taste), mood, or mental function. The seizures occur at random to impair the normal function of the brain [5].
In recent years, a few attempts have been reported on seizure detection and prediction from EEG analysis using two different approaches: 1)Examination of the waveforms in the pre-ictal EEG to find events or changes in neuronal activity such as spikes, which may be pre cursors to seizures.2) Analysis of the nonlinear spatio-temporal evolution of the EEG signals to find a governing rule as the system moves from a seizure-free to seizure state .Some work has also been reported using artificial neural networks for seizure prediction with wavelet pre-processing. Many algorithms for spike detection have been proposed, including mimetic- and rule-based approaches, frequency-domain methods, ANNs, independent component analysis, data mining, template matching, and topographic classification. For seizure detection, t-f distributions are widely used [6-8]. Markos G.Tsipouras and Dimitrios used various time frequency distributions for extracting the features from the EEG signals and classify the signals based on artificial neural network. This method offers the ultimate classification of the EEG segments regarding the presence of seizures or not.

International Journal of Research in Engineering and Applied Sciences(IJREAS) Vol. 7 Issue 6 , June-2017 ISSN (O): 2249-3905, ISSN(P): 2349-6525 | Impact Factor: 7.196
International Journal of Research in Engineering & Applied Sciences
Email:- [email protected], http://www.euroasiapub.org
An open access scholarly, online, peer-reviewed, interdisciplinary, monthly, and fully refereed journal
266
2. Experimental EEG-based epilepsy detection system will use a moving-window analysis (Fig 1) for calculating the characterizing measure(s) from a window of EEG data with a pre-defined length. Then the subsequent window of EEG will be analyzed, and so forth. The analysis of each window will consist of three steps 1. Pre-processing 2. Feature extraction 3. Classification. The duration of these analysis windows typically would range between 3 and 10 seconds. 2.1 Flow Chart The fig(2) shows that the flow chart f the proposed method and it will gives the detailed procedure of the work. 2.2 Data Acquisition and Pre-processing EEG signal required for analysis is acquired from hospital and physionet. It is first converted to excel format which is supported by MATLAB. Then it is given to a pre-processing block. The main aim of pre-processing block is to remove various noises from EEG signal like line noise, eye blink, base line wondering, power line interference etc. which gets added to EEG signal during EEG recording. Among these noises, the power line interference and the baseline wandering are most significant and can strongly affect EEG signal analysis. The power line interference is a narrow-band noise centered at 60 Hz (or 50 Hz), usually removed easily by the hardware itself. However the baseline wandering and other wideband noises are not easy to be suppressed by hardware equipments. Instead, the software scheme is more powerful and feasible for offline EEG signal processing. In general digital filtering methods as well as wavelet based methods are used to remove baseline wandering and the other wideband noise. The noise may be complex stochastic processes within a wideband, so it is not able to remove them by using traditional digital filters. To remove noise effectively, wavelet denoising (wden) is done in MATLAB. De-noised signal and 1st level approximation coefficients of de-noised one are subtracted to remove base line wandering. 2.3 Feature Extraction
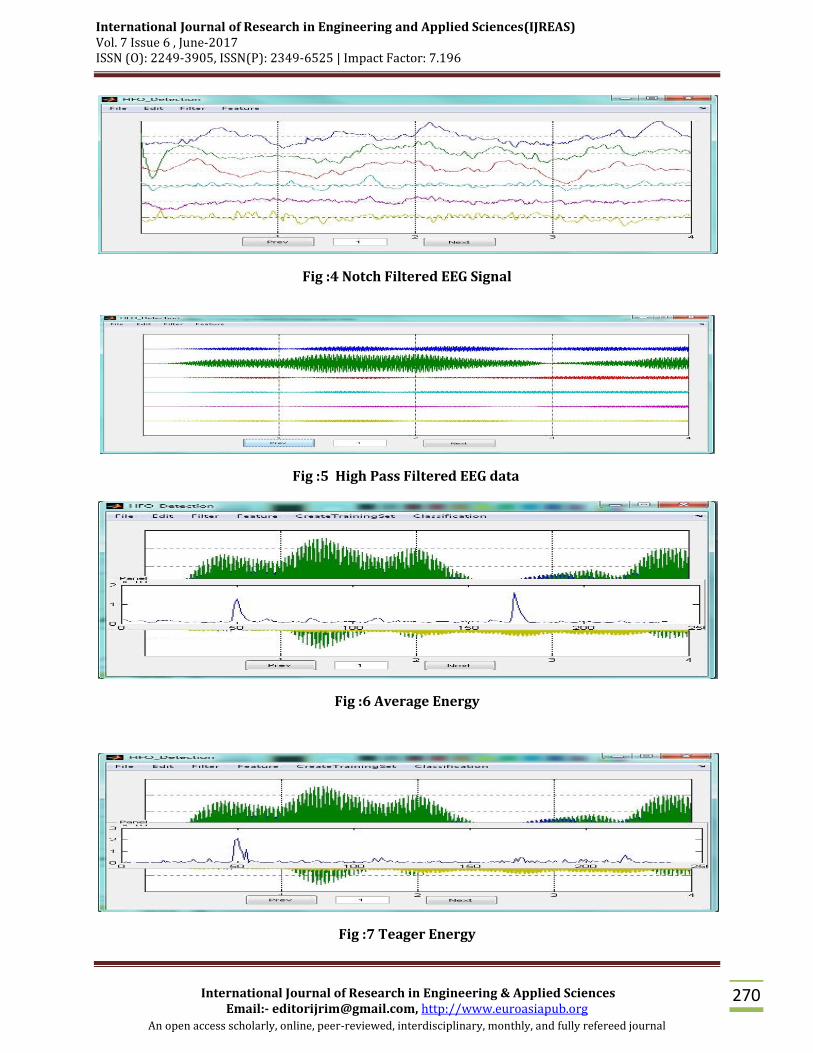
The purpose of feature extraction is to reduce the original data by measuring certain features that distinguish one input pattern from another. When the input data to an algorithm is too large to be processed and it is suspected to be notoriously redundant (much data, but not much information) then the input data will be transformed into a reduced representation set of features (also named feature vector). Transforming the input data into the set of features is called feature extraction. If the features extracted are carefully chosen it is expected that the features set will extract the relevant information from the input data in order to perform the desired task using this reduced representation instead of the full size input. Feature Selection is the most important part of EEG signal analysis. Features will be selected after thorough study for the purpose of classifying EEG data into ictal(seizure region) and interictal (normal region). These selected features will be extracted at different levels from the pre-processed EEG data. Following features are used in our analysis. 2.3.1Teager Energy Using Teager energy analysis, it is able to detect high frequency, low-amplitude components that conventional energy measurements would miss. Teager energy is an ideal measure because unlike conventional energy it takes into account the frequency component of the signal as well as signal amplitude. In continuous-time, the TEO is defined as Ψc[s(t)]=[ �̇� (t)]2-s(t)�̈�(t) ................(a)

International Journal of Research in Engineering and Applied Sciences(IJREAS) Vol. 7 Issue 6 , June-2017 ISSN (O): 2249-3905, ISSN(P): 2349-6525 | Impact Factor: 7.196
International Journal of Research in Engineering & Applied Sciences
Email:- [email protected], http://www.euroasiapub.org
An open access scholarly, online, peer-reviewed, interdisciplinary, monthly, and fully refereed journal
267
where s(t) is a continuous-time signal and . In discrete-time, the TEO can be approximated by Ψd[s(n)]=s(n)2-s(n+1)s(n-1)...................... (b) where s(n) is a discrete-time signal.
Teager analysis allows one to pick out the HFO as well as providing a resolution high enough to make out individual features of the HFO and seizures present.
2.3.2 Root Mean Square
RMS is a statistical measure of the magnitude of a varying quantity. It can be calculated for a series of discrete values or for a continuously varying function. RMS is one of the most commonly used methods that measure the amplitude of a bio - signal, e.g. audiological signals and electromyographic signals. The amplitude of a bio-signal expresses the magnitude of the power (energy per time) of that particular signal[3]. Measurement of RMS in different conditions affecting a biological system can give an index of the changes related to that particular effect, e.g. the effect of fatigue on EMG signals[9]. The RMS for a collection of N values {x1, x2, ... , xN} is:
Xrms=√𝑥12+𝑥22 +⋯+𝑥𝑁2
𝑁.........(c)
The aim of this study is to determine the level of EEG signals power changes associated with maximum voluntary muscular contraction before and after peripheral muscle fatigue. The root mean square (RMS) of EEG amplitude is measured as an index of the power content of EEG recorded from the motor cortical area.
2.3.3 Variance It describes how far the values lie from the mean. The Variance of each decomposed sub band is estimated and form a feature Vector .The Variance of Seizure signal is higher than normal signals. Using this as one feature value the SVM is trained to classify the signal. Let us assume a random variable X that have the sample values of each EEG sub band signal .Let the sample value of X is Xi={ x1,x2,………xn } .Where i represent any one of the sample set from the sub bands delta, theta, alpha, beta, and gamma. The corresponding variance can be expressed as
σ2=∑(𝑋−μ)2
𝑁 ..............................(d)
Where μ is the mean value of the set X and N is the number of samples. 2.3.4 Average Energy The energy of the signal is defined as the sum of squared modulus of the sample values. The energy of various sub bands such as delta, theta, alpha beta and gamma are calculated. The energy of the signal is expressed as E=∑ |𝑋𝑛|2𝑁−1
𝑛=0 ......................... (e) Where Xn is the samples values in each sub bands and N is the total number of samples. Average Energy of the signal is expressed as
Eaverage =1
𝑁∑ |𝑋𝑛|2𝑁−1
𝑛=0 ......................... (f)
The algorithm measures the energy of each EEG channel by a sliding window and calculates some features of each patient signal to detect the epileptic seizure. 3. Data Classification Machine learning techniques such as Support Vector Machine (SVM) or Artificial Neural Network (ANN) based classifiers will be used for classification [10,11]. The input to the classifier will be the calculated characterizing measure(s) and the classifier would predict, for each given

International Journal of Research in Engineering and Applied Sciences(IJREAS) Vol. 7 Issue 6 , June-2017 ISSN (O): 2249-3905, ISSN(P): 2349-6525 | Impact Factor: 7.196
International Journal of Research in Engineering & Applied Sciences
Email:- [email protected], http://www.euroasiapub.org
An open access scholarly, online, peer-reviewed, interdisciplinary, monthly, and fully refereed journal
268
input, which of the two possible classes the input data belongs to (ictal, interictal). Based on the result, an alert will be raised indicating detection of epilepsy [12,13]. 4. RESULTS AND DISCUSSION MATLAB is a high-level technical computing language and interactive environment for algorithm development, data visualization, data analysis and numerical computation. Using MATLAB we can solve technical problems faster than with traditional programming languages such as C, C++, and Fortan. In the present work, the signal input is from physionet. The algorithm used for detection of abnormality in EEG signal is implemented using MATLAB and the results are shown below from the fig(3-9).
5. CONCLUSION
In this study we have investigated the characterization ability of linear feature such as variance, average energy, teager energy, rms. They are tested by assessing their ability to differentiate between different classes of EEG data. Considering the fact that the research on linear EEG analysis is still at a preliminary level, the results obtained so far are promising.. This demonstrates that the utilised linear measures are independent and complementary features that quantify different properties of the EEG signals, thus providing a further characterization of these signals

International Journal of Research in Engineering and Applied Sciences(IJREAS) Vol. 7 Issue 6 , June-2017 ISSN (O): 2249-3905, ISSN(P): 2349-6525 | Impact Factor: 7.196
International Journal of Research in Engineering & Applied Sciences
Email:- [email protected], http://www.euroasiapub.org
An open access scholarly, online, peer-reviewed, interdisciplinary, monthly, and fully refereed journal
269
Fig :1 Moving Window Analysis
Fig: 2. Flow Chart of the proposed method
Fig: 3 EEG Signal
Input EEG Signal
Statistical Features
ANN/SVM
Feature Extraction
Classification of EEG Data
Classified EEG Data
International Journal of Research in Engineering and Applied Sciences(IJREAS) Vol. 7 Issue 6 , June-2017 ISSN (O): 2249-3905, ISSN(P): 2349-6525 | Impact Factor: 7.196
International Journal of Research in Engineering & Applied Sciences
Email:- [email protected], http://www.euroasiapub.org
An open access scholarly, online, peer-reviewed, interdisciplinary, monthly, and fully refereed journal
270
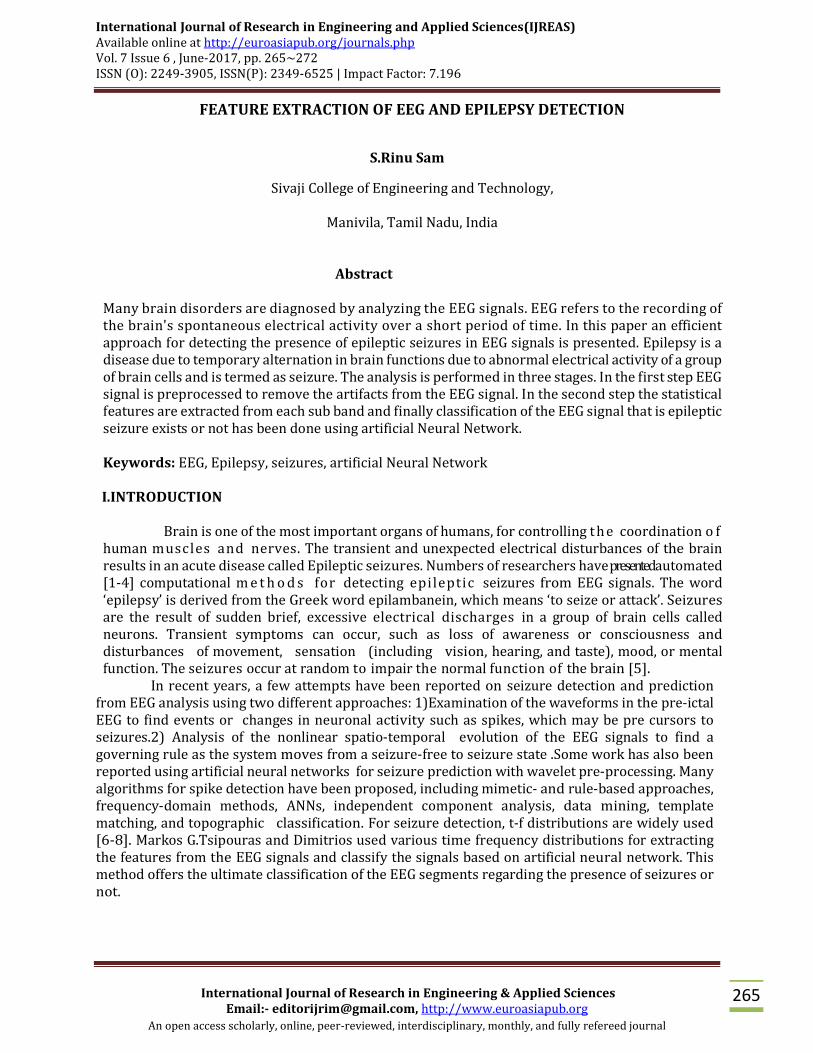
Fig :4 Notch Filtered EEG Signal
Fig :5 High Pass Filtered EEG data
Fig :6 Average Energy
Fig :7 Teager Energy

International Journal of Research in Engineering and Applied Sciences(IJREAS) Vol. 7 Issue 6 , June-2017 ISSN (O): 2249-3905, ISSN(P): 2349-6525 | Impact Factor: 7.196
International Journal of Research in Engineering & Applied Sciences
Email:- [email protected], http://www.euroasiapub.org
An open access scholarly, online, peer-reviewed, interdisciplinary, monthly, and fully refereed journal
271
Fig :8 Variance
Fig : 9 Data classification
REFERENCE [1] L. D. Iasemidis, L. D. Olson, J. C. Sackellares, and R. S. Savit (1994) “Time dependencies in the occurrences of epileptic seizures: A nonlinear approach,”Epilepsy Res., vol. 17, pp. 81–94. [2] Engel, Jr, J. and Pedley, T. A (1997) Epilepsy: ‘A Comprehensive Text-book’, Lippinottc Ravon, Philadelphias,Pennsylvania [3] H. Adeli and S. L. Hung, Machine Learning (1995) ‘Neural Networks, Genetic Algorithms, and Fuzzy Sets’ New York: Wiley [4] J. Gotman and P. Gloor, “Automatic recognition and quantification of interictal epileptic activity in the human scalp EEG,” vol 110, pp 210-222 [5] Annegers, J. F (1993) ‘The epidemiology of epilepsy’, in The Treatment of Epilepsy, Ed. E. Wyllie, Lea and Febiger, Philadelphia, Pennsylvania: pp. 157–164. [6] H H. Adeli, Z. Zhou, and N. Dadmehr (2003) ‘Analysis of EEG records in an epileptic patient using wavelet transform’ J. Neurosci. Meth., vol. 123, no. 1, pp. 69–87, [7] W. R. Webber, B. Litt, K. Wilson, and R. P. Lesser (1994) “Practical detection of epileptiform discharges (EDs) in the EEG using an artificial neural network: A comparison of raw and parameterized EEG data,” Electroencephalogr. Clin. Neurophysiol., vol. 91, pp. 194–204. [8] Alexandros T. Tzallas, Markos G. Tsipouras, and Dimitrios I. Fotiadis ‘Epileptic Seizure Detection in EEGs Using Time– Frequency Analysis’ IEEE transactions on information technology in biomedicine, vol. 13, no. 5. [9] L. D. Iasemidis, L. D. Olson, J. C. Sackellares, and R. S. Savit (1994) “Time dependencies in the occurrences of epileptic seizures: A nonlinear approach,”Epilepsy Res., vol. 17, pp. 81–94.

International Journal of Research in Engineering and Applied Sciences(IJREAS) Vol. 7 Issue 6 , June-2017 ISSN (O): 2249-3905, ISSN(P): 2349-6525 | Impact Factor: 7.196
International Journal of Research in Engineering & Applied Sciences
Email:- [email protected], http://www.euroasiapub.org
An open access scholarly, online, peer-reviewed, interdisciplinary, monthly, and fully refereed journal
272
[10] N. Acir and C. Guzelis (2004) “Automatic spike detection in EEG by a two stage procedure based on support vector machines,” Comput. Biol. Med., vol. 34, pp. 561–575 [11] Petrosian, D. Prokhorov, R. Homan, R. Dascheiff, and D. Wunsch, II (2000) “Recurrent neural network based prediction of epileptic seizures in intra- and extracranial EEG,” Neurocomputing, vol. 30, no. 1–4, pp. 201–218. [12] K. Kobayashi, I. Merlet, and J. Gotman (2001) “Separation of spikes from Background by independent component analysis with dipole modelingand comparison to intracranial recording,” Clin. Neurophysiol., vol. 112, pp. 405–413. [13] S. B. Wilson, C. A. Turner, R. G. Emerson, and M. L. Scheuer (1999) “Spike detection II: Automatic, perception-based detection and clustering,” Clin.Neurophysiol., vol. 110, pp. 404–411.