feasibility study on implementation of medium...
TRANSCRIPT

FEASIBILITY STUDY ON IMPLEMENTATION OF MEDIUM
TEMPERATURE SOLAR THERMAL ENERGY IN INDUSTRIAL
PROCESSES - A CASE STUDY IN MALAYSIA
CHIN CHUAN KONG
DISSERTATION SUBMITTED IN PARTIAL FULFILMENT OF
THE REQUIREMENTS FOR THE DEGREE OF MASTER OF
ENGINEERING
FACULTY OF ENGINEERING
UNIVERSITY OF MALAYA
KUALA LUMPUR
2012

ABSTRACT
A case study on the feasibility of implementing medium temperature solar
thermal energy in industrial processes in Malaysia is conducted. The objective is to
determine if it is technically and economically viable to utilize the solar thermal
renewable energy at a temperature range of 80-250°C as a substitute to conventional
means of generating thermal energy. Solar energy is the source of most other renewable
energies, and Malaysia being situated at the equator makes us geographically favorable
to harness this free energy. Almost half of the industrial processes use thermal energy
rather than electrical energy, and the output of a solar thermal system can fit in nicely as
a contributor to the industries’ energy mix. Literature reviews are conducted on the
climatology of Malaysia, in particular, the solar irradiance, the technologies involved
and the various industries in Malaysia are then studied to identify potential candidates to
utilize this renewable energy. Also, different types of solar collector technologies are
studied and explored. After that, a particular industry and its industrial process are
chosen for a case study. A solar thermal system is designed and sized to fulfill needed
energy requirements for the process. Then, a simulation is performed to determine the
overall output of the system based on Malaysian meteorological data. Based on the
results, the contribution of solar thermal energy in supplementing the plant’s energy
requirement, i.e. solar fraction is determined. A cost and benefit analysis is done on the
system, taking into account of initial investment and consumption cost for a period of
10 years, without consideration of maintenance cost. The results are compared with
other means of generating heat, namely boiler, heat pump, electric heater and solar PV
powered electric heater. It is determined that solar thermal energy provides the greatest
saving. However, due to the large fuel oil subsidy by the Government currently, solar
thermal system is attractive for only low temperature ranges.

iii
ABSTRAK
Satu kajian kes mengenai kebolehlaksanaan melaksanakan tenaga terma suria
suhu sederhana dalam proses perindustrian di Malaysia telah dijalankan. Objektif
kajian ini adalah untuk menentukan jika ia berdaya maju dari segi teknikal dan ekonomi
untuk menggunakan tenaga terma suria yang boleh diperbaharu pada julat suhu daripada
80-250C sebagai pengganti kepada cara konvensional seperti dandang dan pemanas
elektrik untuk menjanakan tenaga terma. Tenaga suria merupakan sumber kepada
kebanyakan tenaga boleh diperbaharui yang lain. Lokasi geografi Malaysia yang
terletak di khatulistiwa memanfaatkan kita untuk menggunakan tenaga percuma ini.
Hampir separuh daripada proses industri menggunakan tenaga haba daripada tenaga
elektrik. Output sistem terma suria boleh digunakan sebagai penyumbang kepada
sumber tenaga industri. Kajian literature telah dijalankan ke atas iklim Malaysia,
khususnya, sinaran suria, tecknologi tenaga haba suria dan pelbagai industri di Malaysia
akan dikaji untuk mengenal pasti calon-calon yang berpotensi untuk menggunakan
tenaga boleh diperbaharui ini. Pelbagai jenis teknologi pengumpul suria juga dikaji dan
diterokai. Selepas itu, industri tertentu dan proses industrinya telah dipilih untuk
menjalankan kajian kes. Satu sistem terma suria direka bentuk untuk memenuhi
keperluan tenaga yang diperlukan untuk proses industri tersebut. Kemudian, simulasi
dilakukan untuk menentukan output keseluruhan sistem berdasarkan data meteorologi
Malaysia. Berdasarkan keputusan simulasi, sumbangan tenaga terma suria dalam
memenuhi keperluan tenaga kilang, seperti pecahan suria ditentukan. Satu analisis kos
dan faedah dilakukan ke atas system ini untuk tempoh 10 tahun menggunakan kos
system and pemasangan. Keputusan ini telah berbanding dengan cara menjana haba
yang lain. Kesimpulannya tenaga haba suria paling jimat. Tetapi kenara subsidi
kerajaan, ianya jimat hanya untuk suhu rendah.

iv
ACKNOWLEDGEMENT
First of all, I would like to use this opportunity to thank my supervisor,
Associate Professor Ir. Dr. Yau Yat Huang for giving me guidance and advices
throughout the completion of this thesis.
Secondly, my deepest appreciation to Ms Annie Wang from Himin Ltd, Mr.
Khalid from Zamatel Sdn Bhd and Mr. Chin from Kemac Sdn Bhd for the industrial
information and insights.
Lastly, I would like to give my appreciation to my family and in particular to
my wife and baby daughter for the help and mental support during the preparation of
this dissertation.

v
CONTENTS
Abstract ......................................................................................................................... ii
Abstrak ......................................................................................................................... iii
Acknowledgement........................................................................................................ iv
Contents ........................................................................................................................ v
List of Figures ............................................................................................................. vii
List of Tables................................................................................................................ xi
Nomenclature ............................................................................................................. xiii
List of Appendices ...................................................................................................... xv
CHAPTER 1:Introduction ............................................................................................. 1
1.1 Background ........................................................................................................ 1
CHAPTER 2: Research Objectives ............................................................................... 3
2.1 Objective ............................................................................................................ 3
CHAPTER 3: Literature Review .................................................................................. 4
3.1 Solar Thermal Energy ........................................................................................ 4
3.2 Thermal Energy Usage in Industrial Processes .................................................. 8
3.3 Malaysia Energy Usage Pattern........................................................................ 12
3.4 Energy Consumption and Renewable Energies ............................................... 15
3.5 Solar Energy and its potential .......................................................................... 18
3.6 Malaysia – Solar Energy Perspective ............................................................... 24
3.7 Solar Thermal Collectors .................................................................................. 31
3.8 Solar Evacuated Tubes Collector ..................................................................... 36
3.8.1 Evacuated Heat Pipe Collectors ................................................................ 38
3.8.2 Evacuated U-pipe Collectors..................................................................... 39
3.9 Medium Temperature Solar Thermal System .................................................. 40
CHAPTER 4: Methodology ........................................................................................ 42
4.1. Overview .......................................................................................................... 42
4.2. Theory and Calculations ................................................................................... 44
4.3. Solar Collector Performance ............................................................................ 44
4.4. Heat Exchanger ................................................................................................ 48
4.5. Design and Sizing for Open loop Direct System ............................................. 50
4.6. Design and Sizing for Closed Loop Drain Back System ................................. 51
4.7. Software Assisted Analysis .............................................................................. 53

vi
CHAPTER 5: Project Background and Sizing Description ........................................ 55
5.1 Solar Collector Selection .................................................................................. 56
5.2 System Description ........................................................................................... 63
5.3 Open-Loop Direct Systems .............................................................................. 63
5.4 Closed-Loop Drainback Systems ..................................................................... 64
CHAPTER 6: Results & Discussions ......................................................................... 67
6.1 Open Loop Direct System ................................................................................ 68
6.2 Closed Loop Drainback System ....................................................................... 70
6.3 Comparison of Open Loop and Closed Loop Drainback System .................... 72
6.4 Cost and Benefit Analysis ................................................................................ 74
CHAPTER 7: Conclusions .......................................................................................... 77
Bibliography ................................................................................................................ 78
Appendix A - Tenaga Nasional Electrical Pricing and Tariff – Industrial ................. 85
Appendix B – Boiler Thermal Energy Generation Cost ............................................. 89
Appendix C – Electric Heater ..................................................................................... 92
Appendix D – Solar PV Thermal Energy Generation Cost ........................................ 94
Appendix E – Heat Pump Energy Generation Cost .................................................... 97
Appendix E – Solar Thermal Energy Generation Cost ............................................... 98
Open Loop ................................................................................................................... 98
Closed Loop ................................................................................................................ 99

vii
LIST OF FIGURES
Figure Content Page
3.1 Solar industrial process heat plants - distribution by industry sector.
Source: IEA SHC Task 33, 2007
5
3.2 Solar industrial process heat plants - distribution by country. Source:
IEA SHC Task 33, 2007
5
3.3 Market shares of SWH products in China and EU. Source: Han et. al.,
2007.
6
3.4 Block diagram of a typical industrial energy system. Source:
Schnitzer, 2007.
8
3.5 A typical energy usage pattern for a dyehouse. Source: Plant
Engineers Handbook, 2001.
9
3.6 Processes and temperature ranges. Source: Kalogirou, 2003. 10
3.7 Final Energy Demand by Sector (ktoe), 2010. Source: MEIH, 2012. 12
3.8 Final Electricity Consumption (ktoe), 2010. Source: MEIH, 2012. 13
3.9 Final Energy use of the EU-Industry. Source: ESTIF, 2010. 13
3.10 Global industrial sector energy consumption trend 2006-2030. Source:
Abdelaziz et al, 2011.
14
3.11 Global energy requirements by energy sources. Source: Exxon Mobil 16
3.12 Solar energy distribution. Source: Four Peaks Technologies, 2010. 18
3.13 Solar radiation and energy requirements. Source: Technology Guide,
2009.
19
3.14 Typical Solar Radiation Spectrum. Source: ASTM, 2003. 20
3.15 Yearly variation of the solar constant. Source: Ahmad, 2011. 21
3.16 Worldwide direct normal solar irradiation. Source: DLR, 2008. 22

viii
Figure Content Page
3.17 A Solarimeter, also refer to as a “Pyranometer” 23
3.18 Suitability for solar thermal power plants. Source: Schott Ltd. 25
3.19 Annual average solar radiation (MJ/m2/day). Source: Maliman, M.N.,
2005.
26
3.20 Monthly average daily solar radiation. Source: Azhari et. al, 2008. 28
3.21 Daily mean dry-bulb temperature for equal weightings test reference
years. Source: I.A. Rahman et. al, 2006.
29
3.22 Daily global solar radiation for equal weightings test reference years.
Source: I.A. Rahman et. al, 2006.
29
3.23 Daily mean relative humidity for equal weightings test reference
years. Source: I.A. Rahman et. al, 2006.
30
3.24 Daily mean wind speed for equal weightings test reference years.
Source: I.A. Rahman et. al, 2006.
30
3.25 Area definitions of a solar collector. 32
3.26 Solar Angles with Respect to a Tilted Surface. Source: ASHRAE,
2007.
32
3.27 Processes at a solar collector. Source: Renewable Energy World, 2004 33
3.28 Optical processes for evacuated tube. Source: advthermalsolar.com,
2012
36
3.29 Sydney Tube. Source: B&ES, 2012 36
3.30 Heat pipe evacuated tube collector. Source: B&ES, 2012 38
3.31 Picture of an U-pipe cross section 39
3.32 A U-pipe solar collector 39
3.33 Basic components in a solar thermal system. 40

ix
Figure Content Page
3.34 Integration of solar collectors to an industrial thermal powered system.
Source: Kalogirou, 2003.
41
4.1 Methodology flow chart. 42
4.2 Evacuated tube cross section 44
4.3 Relevant heat transfer processes for an evacuated tube collector.
Source: Incropera, 2007.
45
4.4 Effectiveness of a single-pass, cross-flow heat exchanger with both
fluids unmixed. Source: Incropera, 2007.
48
4.5 Schematics for Open Loop Direct System 50
4.6 Schematic of closed loop drainback system and temperature profile of
heat exchanger.
52
4.7 Excel block diagram. 53
5.1 Efficiency of solar collector as the collector temperature rises. Source:
Renewable Energy World, 2004.
57
5.2 Comparison of flat plate and evacuated tube collector. 57
5.3 Distribution of the total installed capacity in operation by collector
type in 2009. Weiss and Mauthner, 2011.
58
5.4 Solar ray angle. Source: Himin Ltd, 2012 60
5.5 Himin u-pipe collector. Source: Himin Ltd, 2012. 62
5.6 Open-Loop Direct Systems. Source: Homepower.com, 2012. 64
5.7 Closed loop drain back systems. Source: Homepower.com, 2012. 65
5.8 Plate type heat exchanger. Source: Tranter PHE, Inc. 66
6.1 Open Loop Direct System Solar fraction and average insolation
(80°C)
69

x
Figure Content Page
6.2 Closed Loop Direct System Solar fraction and average insolation
(80°C)
71
6.3 Open loop and closed loop system performance at various output
temperatures.
73
B1 Diesel price for industrial use. Source: Department of Statistics
Malaysia
89
C1 Immersion heater datasheet. Source: rs-component.com.my 93
D1 Malaysia Average BIPV Price/kWp from 2005 to 2010. Source:
www.mbipv.net.my
95
E1 Heat pump datasheet 97
xi
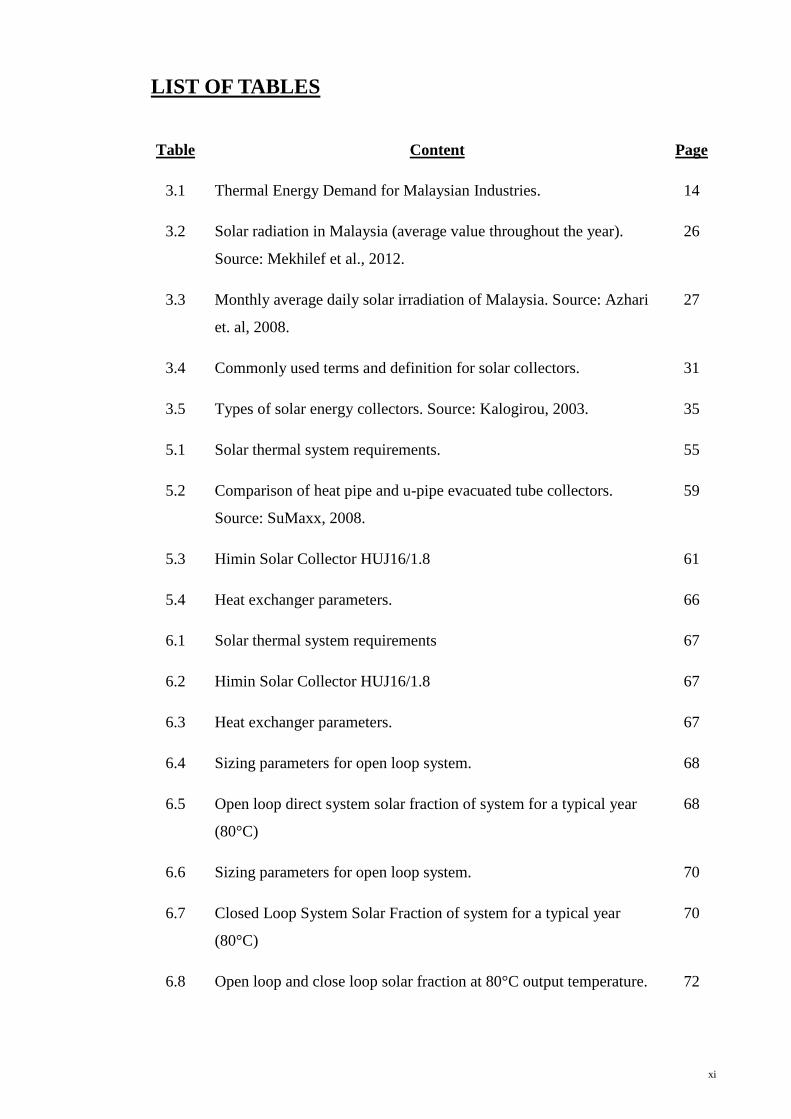
LIST OF TABLES
Table Content Page
3.1 Thermal Energy Demand for Malaysian Industries. 14
3.2 Solar radiation in Malaysia (average value throughout the year).
Source: Mekhilef et al., 2012.
26
3.3 Monthly average daily solar irradiation of Malaysia. Source: Azhari
et. al, 2008.
27
3.4 Commonly used terms and definition for solar collectors. 31
3.5 Types of solar energy collectors. Source: Kalogirou, 2003. 35
5.1 Solar thermal system requirements. 55
5.2 Comparison of heat pipe and u-pipe evacuated tube collectors.
Source: SuMaxx, 2008.
59
5.3 Himin Solar Collector HUJ16/1.8 61
5.4 Heat exchanger parameters. 66
6.1 Solar thermal system requirements 67
6.2 Himin Solar Collector HUJ16/1.8 67
6.3 Heat exchanger parameters. 67
6.4 Sizing parameters for open loop system. 68
6.5 Open loop direct system solar fraction of system for a typical year
(80°C)
68
6.6 Sizing parameters for open loop system. 70
6.7 Closed Loop System Solar Fraction of system for a typical year
(80°C)
70
6.8 Open loop and close loop solar fraction at 80°C output temperature. 72
xii
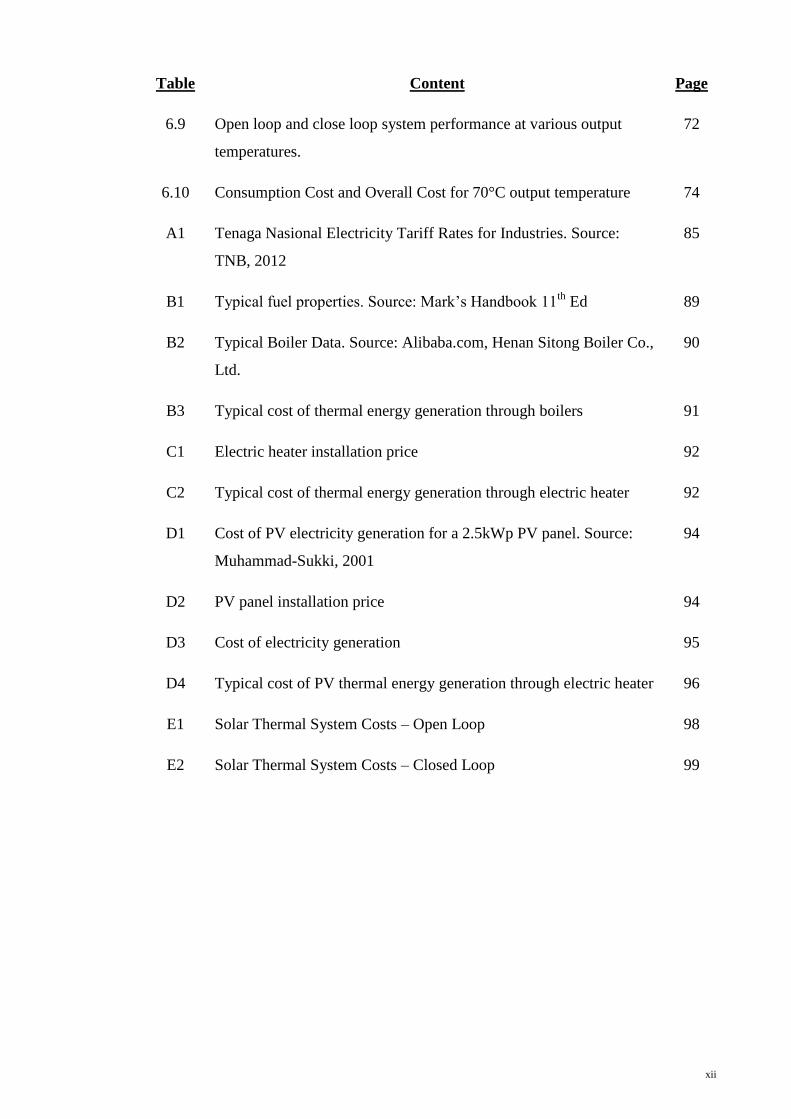
Table Content Page
6.9 Open loop and close loop system performance at various output
temperatures.
72
6.10 Consumption Cost and Overall Cost for 70°C output temperature 74
A1 Tenaga Nasional Electricity Tariff Rates for Industries. Source:
TNB, 2012
85
B1 Typical fuel properties. Source: Mark’s Handbook 11th
Ed 89
B2 Typical Boiler Data. Source: Alibaba.com, Henan Sitong Boiler Co.,
Ltd.
90
B3 Typical cost of thermal energy generation through boilers 91
C1 Electric heater installation price 92
C2 Typical cost of thermal energy generation through electric heater 92
D1 Cost of PV electricity generation for a 2.5kWp PV panel. Source:
Muhammad-Sukki, 2001
94
D2 PV panel installation price 94
D3 Cost of electricity generation 95
D4 Typical cost of PV thermal energy generation through electric heater 96
E1 Solar Thermal System Costs – Open Loop 98
E2 Solar Thermal System Costs – Closed Loop 99

xiii
NOMENCLATURE
Nomenclature Description Unit
SIPH Solar Process Industrial Heat -
kWth Kilo Watt Thermal kW
G Solar Irradiation/ Insolation/ Incident Radiation kW/m2
SF Solar Fraction %
α Absorptivity -
ρ Reflectivity -
τ Transmissivity -
Gabs Absorbed Radiation kW/m2
Gref Reflected Radiation kW/m2
Gtr Transmitted Radiation kW/m2
%η Solar Collector Efficiency %
η0 Optical Efficiency %
a1 Liner Loss Co-efficient W/m2.K
a2 Quadratic Loss Co-efficient W/m2K
2
Tm Mean Temperature of Solar Collector °C
Ta Surrounding Ambient Temperature °C
Net Solar Irradiation Absorbed kW
Solar Collector Aperture Area m2
Mass Flow Rate kg/s
Specific Heat Capacity J/kg.K
Temperature of Fluid from Collector °C
Temperature of Fluid into Collector °C
Heat Capacity Ratio -

xiv
Nomenclature Description Unit
Lower Heat Capacity Rate W/K
Higher Heat Capacity Rate W/K
Cc Cold Fluid Heat Capacity Rate W/K
Ch Hot Fluid Heat Capacity Rate W/K
Number of Transfer Unit -
Heat Transfer Effectiveness %
Overall Heat Transfer Co-efficient W/m2.K
Heat Transfer Area m2
Thot,in Fluid Temperature out from Heat Exchanger on
Hot side
°C
Thot,out Fluid Temperature into Heat Exchanger on Hot
side
°C
Tcollector,in Temperature of Fluid into Collector °C
Tcollector,out Temperature of Fluid from Collector °C
Tprocess,in Temperature of Fluid for Process °C
Tprocess,out Temperature of Fluid Returned from Process °C

xv
LIST OF APPENDICES
Appendix A - Tenaga Nasional Electrical Pricing and Tariff – Industrial
Appendix B – Boiler Thermal Energy Generation Cost
Appendix C – Electric Heater
Appendix D – Solar PV Thermal Energy Generation Cost
Appendix E – Heat Pump Energy Generation Cost
Appendix E – Solar Thermal Energy Generation Cost

1
CHAPTER 1:INTRODUCTION
1.1 Background
Solar Thermal is a technology for harnessing solar energy for thermal energy. The
temperature of the working fluid or carrier fluid classifies the different thermal systems,
namely High, Medium and Low temperature systems. Low temperature systems are
where water does not reach the boiling point, being less than 80°C, usually through a
flat plate collector. Medium temperature systems is in the region of 80°C to 250°C,
achievable through technologies such as evacuated heat pipes with or without the need
of concentrators. Finally, working fluid with temperature more than 250°C are High
Temperature Systems, where concentrators is necessary to be employed to bring the
working fluid to such high temperatures.
With the push for renewable energy, Malaysia being geographically stationed in the
equator gives overwhelming advantage in receiving high solar irradiation. To leverage
our advantage, our government through the Economic Transformation Programme has
identified solar photovoltaic technology to be the predominant method of harnessing the
energy of the sun.
However, with Malaysia still as an industrious nation, there are a lot of demand for
thermal energy, rather than electricity for various manufacturing processes. Citing a
report from the EU, electricity consists of 33% while the rest of 67% are thermal energy,
and a substantial portion is located in the Medium temperature systems. In the report,
there are even breakdowns of the various industries which will benefit much from the
“free” thermal energy.
Europe is a country with 4 seasons. Solar irradiation is cyclical and on average lower
than Malaysia. However, with so much effort from the EU to research on solar thermal,

2
and to find it economically feasible and widely implemented, it brings into mind that
why not Malaysia also follow suit?
This research report is motivated by this premise.
Widely available findings from the around the world is localized to fit the Malaysian
context and decided upon on implementation feasibility. Theoretical information is
translated to a customized solution to a particular process for a plant in Malaysia.
Subsequently, a cost and benefit analysis is performed.

3
CHAPTER 2: RESEARCH OBJECTIVES
2.1 Objective
To identify the potential and feasibility of solar thermal energy application for use in
industries in Malaysia, through evaluation of:-
1. Malaysia’s Solar Energy Potential,
2. Potential of applying in industrial processes,
3. The technology availability,
4. Proposed system design, and
5. Cost and Benefit analysis using 10 year payback period comparing with other
conventional means of thermal energy generation.
4
CHAPTER 3: LITERATURE REVIEW
3.1 Solar Thermal Energy
Solar thermal energy is an innovative technology for harnessing solar energy for
thermal energy (heat) and is achieved through use of solar thermal collectors. Solar
thermal collectors can be classified into three types as low-, medium-, or high-
temperature collectors, depending on the working fluid output temperature achievable
by the United States Energy Information Administration with Low being below 100°C,
medium being between 100°C - 400°C and High for beyond 400°C.
The potential for solar thermal collectors to supplement the energy needs of industrial
sector, known as Solar Industrial Process Heating (SIPH), is huge, which is detailed in
the following sections. The formation of Task 33 (Solar Heat for Industrial Processes)
by the International Energy Agency Solar Heating and Cooling (IEA SHC) Programme
in 2003 is the demonstration of the seriousness of European countries in the push for
higher utilization of this technology. Since the completion of the task force in October
2007, a comprehensive report was prepared which provides a good understanding of the
technologies involved and the potential for implementation in Europe.
The report provides the result of studies carried out in two industrial sectors from
Germany and Greece and overall potential review on Belgium, Australia, Austria, the
Iberian Peninsula (Spain and Portugal), and Italy. It found that 90 operating solar
thermal plants for process are reported throughout the world, where the
total capacity is approximately 25 MWh (35,000 m2). The plants distribution by sector
and country are shown in Figure 3.1 and Figure 3.2.

5
Figure 3.1 Solar industrial process heat plants - distribution by industry sector. Source: IEA SHC Task 33,
2007
Figure 3.2 Solar industrial process heat plants - distribution by country. Source: IEA SHC Task 33, 2007
The analysis of the countries studied shows that solar thermal could provide the
industrial sector with 3-4% of its heat demand. An extrapolation of the national figures
to the European level shows that solar thermal could provide 258 PJ/year of thermal
energy to the EU25 industrial sector or an installed capacity of 100-125 GWth (143-180
Million m2) (IEA SHC, 2007). It has been concluded that there is a relevant, promising,
suitable and so far almost unexploited market sector for applying solar thermal
technology. Support from policy makers are needed to promote this untapped resource.
10000
1000
100
Cap
acit
y I
nst
alle
d (
kW
h)
Food Wine &
Beverage
Paper Tanning Malt Transport
Equipment
Chemistry Other Desalination Textile
10
1
Nu
mber
o
f P
lants
25
20
10
5
0
15
10000
1000
100
10
1
Cap
acit
y I
nst
alle
d (
kW
h)
Nu
mber
o
f P
lants
25
20
10
5
0
15
Austria
B. Faso
Czech
Egypt
France
Germany
Greece India
Indonesia
Italy Jordan
Mexico Pakistan
Netherlands Portugal
S.Korea
Spain
Switzerland
U.S.A
Wales
Capacity Installed (kWh) Number of Plants
Capacity Installed (kWh) Number of Plants

6
In another study, 35 solar thermal companies from around the globe were surveyed and
the result shows that many large solar thermal energy systems are installed around the
globe (Meyer, 2009); unlike the limited number reported by the IEA SHC report. There
are around 9000 in China, 200 in India and 320 in Turkey. Majority of systems installed
are between 50m2 to 500m
2. Of the companies surveyed, only three have installed
systems larger than 500m2. Most large scale projects are similar in the fact that most are
designed and built since 2005 (Fuller, 2010).
In China, Solar thermal technologies have been rigorously studied in China since the
1980s (Wang, 2009). In terms of solar water heating for domestic uses, the country has
an installed capacity of 108 million m2 collector area in 2007, consisting of 60% of
SWHs market globally (Luo, 2008). A breakdown of the market share of SWH collector
market share in the world is shown in Figure 3.3.
Figure 3.3 Market shares of SWH products in China and EU. Source: Han et. al., 2007.
100%
80%
60%
40%
20%
0% Flat Plate Vacuum Tube Others
7
It can be seen that China is the market leader for vacuum tube. This fact is kept in mind
during sourcing for evacuated heat tube manufacturers. Kulkarni (2008) has various
models for solar thermal design. However, a more simplistic approach is utilized here,
to be explained in Chapter 4.
Globally there are many literatures available on the topic of SIPH. However, there are
few on this topic in Malaysia. Most of the current studies highlight the potential but
there are no comparison of dollars and cents to it. This knowledge gap is to be cleared
in this dissertation.

8
3.2 Thermal Energy Usage in Industrial Processes
A typical industrial energy system can be split into 4 functional parts, as below:-
1. A power supply as the source of the motive force is needed. It can be derived
from electricity, gas, oil or biomass. These primary sources of power are then
converted to desired usable energy form, such as electricity, steam, compressed
air or hot water to feed into the process.
2. A production plant, where various industrial process is applied to inputs for a
desired output products.
3. An energy recovery system, where its presence is to optimize and further utilize
the remaining energy present after the power plant or production plant.
4. A cooling system. Most production process would need to bring down the
temperature for the final product. Thermodynamically, cooling is required for
the power plant for a continuous cycle to exist.
The block diagram shown in Figure 3.4 represents a typical conventional industrial
energy system, as explained
Figure 3.4 Block diagram of a typical industrial energy system. Source: Schnitzer, 2007.

9
Solar thermal can be applied for the production of power supply in electricity form or
the heat energy to be applied directly to bring up the temperature of the process. In
industrial processes, thermal energy is a major source of energy used as for example
evident from studying a typical Sankey diagram for a dyehouse, shown in Figure 3.5.
Hot water constitutes almost half of the energy used.
Figure 3.5 A typical energy usage pattern for a dyehouse. Source: Plant Engineers Handbook, 2001.
A large number of industrial applications utilized heat with temperature
ranging from 80°C to 240°C (Proctor, 1977 & Kalogirou, 2003). Studies into the
industrial energy usage pattern demonstrate that solar thermal energy has many usages
in the medium temperature levels (i.e. 80–240°C) (Kalogirou, 2003). Process heat of
less than 100°C is required by 13% of industrial thermal applications while
approximately 27% consists of processes up to 200°C (Goyal, 1999).
Solar thermal applications in industrial sectors can be classified as below (Mekhilef et al,
2010):
1. Hot water or steam demand
processes
2. Drying and dehydration
processes
3. Preheating
4. Concentration
5. Pasteurization, sterilization
8. Industrial space heating
9. Textile
10. Food
11. Buildings
12. Chemistry
13. Plastic

10
6. Washing, cleaning
7. Chemical reactions
14. Business establishments
The temperature range of common industrial processes is given by Figure 3.6
(Kalogirou, 2003).
Figure 3.6 Processes and temperature ranges. Source: Kalogirou, 2003.
As an example of SIPH application in real life, we turn to China, the world’s leader in
evacuated tube solar collectors. For current industrial usage in China, most are used for
drying of agricultural products. Solar drying is gaining traction because of the flexibility
of the drying process allows it to be done at a lower temperature for a longer time,
which coincidently is beneficial to the quality of the product. For these purposes, more
than 100 sets of solar dryers are distributed across China (Xiao et. al., 2004). As an
example of successful applications, in Guangdong Province a 620 m2 aperture area
large-scale solar assisted dryer for sausage drying was built in 2000 (Liu, 2000). The
system was found to reduce coal consumption by 30%. Another example of industrial
application can be found in Shangshu Dongfang Yinran Factory. It is a large scale solar-
roof heating system with a total aperture area of 10,000 m2 (Zhiqiang Liu et. al., 2011).

11
In Australia, the awareness of SIPH was already present 30 years ago. Through the
active promotion of the government bodies, at least 16 systems were installed around
the continent. The systems installed range from 75m2 to 3855m
2, using mostly flat plate
collectors. However, there are few, if any of those remnants in operation (Fuller, 2010).
It was believed at that moment that low energy price were the cause of the low
acceptability of SIPH. At the turn of the century, things changed. Industries for example
food processing have adopted evacuated tube solar collector offered by Solahart,
Australian’s biggest solar thermal collector manufacturer (AGO, 2006). Now, the
largest reported installation is in a hospital in South Australia consisting of 296 solar
panels. Despite the huge potential (Beath, 2012), the adoption in industrial process
heating is still few, if any (Fuller, 2010).
SIPH acceptance by the global market is still lukewarm, although there are vast
improvements at the turn of the century. Malaysia has recognized the potential of solar
energy, in the form of a great push by the government for solar energy technology
implementation through the Economic Transformation Programme, Entry Point Project
10 (ETP, 2010). However, the focus was on solar generated electricity and solar thermal
for process heat have not received the attention that it should.
To get a full appreciation of the solar aspect of SIPH, an overview of harnessing solar
energy and its potentials is provided in the following sections.

12
3.3 Malaysia Energy Usage Pattern
The energy demand of Malaysia in 2009 is 16,132 MW, compared to 10 years before
the demand of electricity is just 9690 MW (The Malaysia Economic in Figures, 2010).
This constitutes a rising in electricity demand from 1999 of about 66.5%. In the year
2000, the major user of energy in Malaysia is by the transport sector. However, in the
year 2009, there is a shift in the trend of energy usage. The prime consumption of total
energy is the industrial sector at 43%, surpassing the transport sector which stands at
36%. A further look in the usage pattern in the industrial sector reveals that the main
form of energy consumed were generated from gas and electricity. Industrial energy
consumption has dominated more than 50% of total global energy consumption
(Mekhilef et al, 2010). From the statistics provided by Malaysia Energy Information
Hub, the final energy demand by sector and final electricity consumption by sector for
the country in the year 2010 is plotted in Figure 3.7 and Figure 3.8.
Figure 3.7 Final Energy Demand by Sector (ktoe), 2010. Source: MEIH, 2012.
Industrial 31%
Transport 40%
Agriculture 3%
Non-Energy 9%
Residential and Commercial
17%
Final Energy Demand by Sectors (ktoe), 2010
Total Energy Demand = 41,477ktoe
12,928 ktoe
13
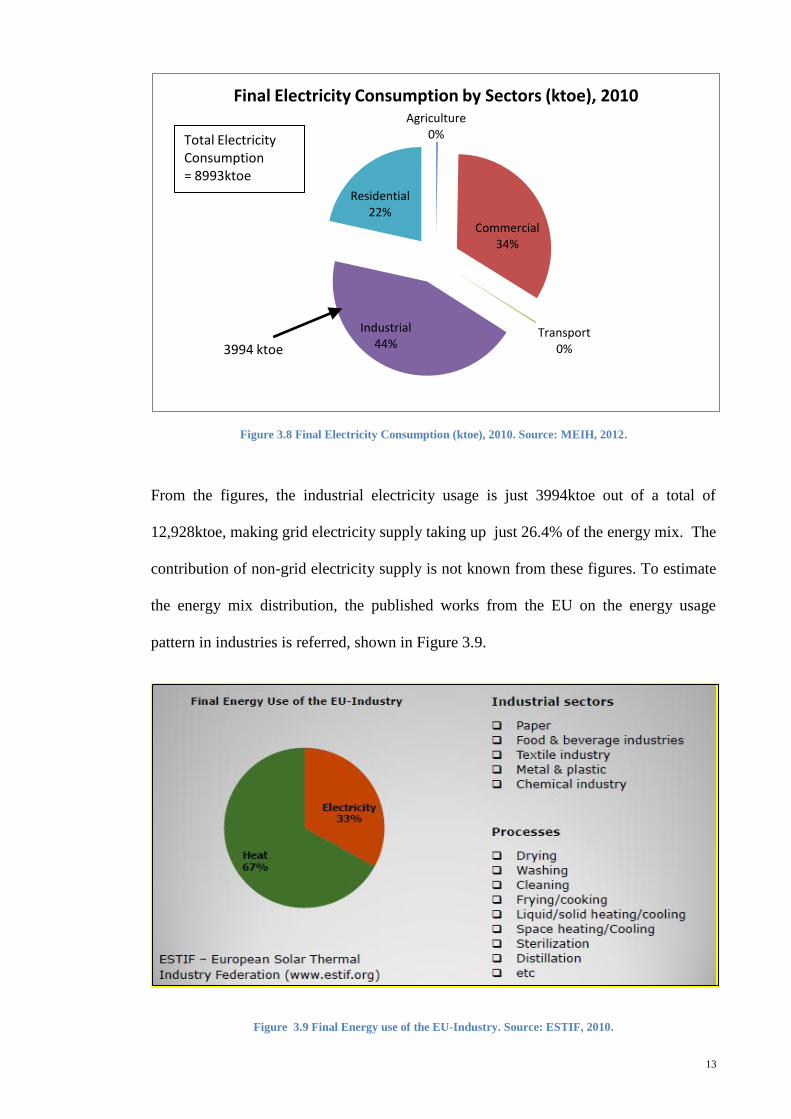
Figure 3.8 Final Electricity Consumption (ktoe), 2010. Source: MEIH, 2012.
From the figures, the industrial electricity usage is just 3994ktoe out of a total of
12,928ktoe, making grid electricity supply taking up just 26.4% of the energy mix. The
contribution of non-grid electricity supply is not known from these figures. To estimate
the energy mix distribution, the published works from the EU on the energy usage
pattern in industries is referred, shown in Figure 3.9.
Figure 3.9 Final Energy use of the EU-Industry. Source: ESTIF, 2010.
Agriculture 0%
Commercial 34%
Transport 0%
Industrial 44%
Residential 22%
Final Electricity Consumption by Sectors (ktoe), 2010
Total Electricity Consumption = 8993ktoe
3994 ktoe
14
Using Figure 3.9 as a guideline, it should be safe to assume that mostly the rest of the
energy is in the form of thermal energy (74.6%, 8934ktoe, 104TWh) and the non grid
electrical consumption is still marginal as compared to thermal energy.
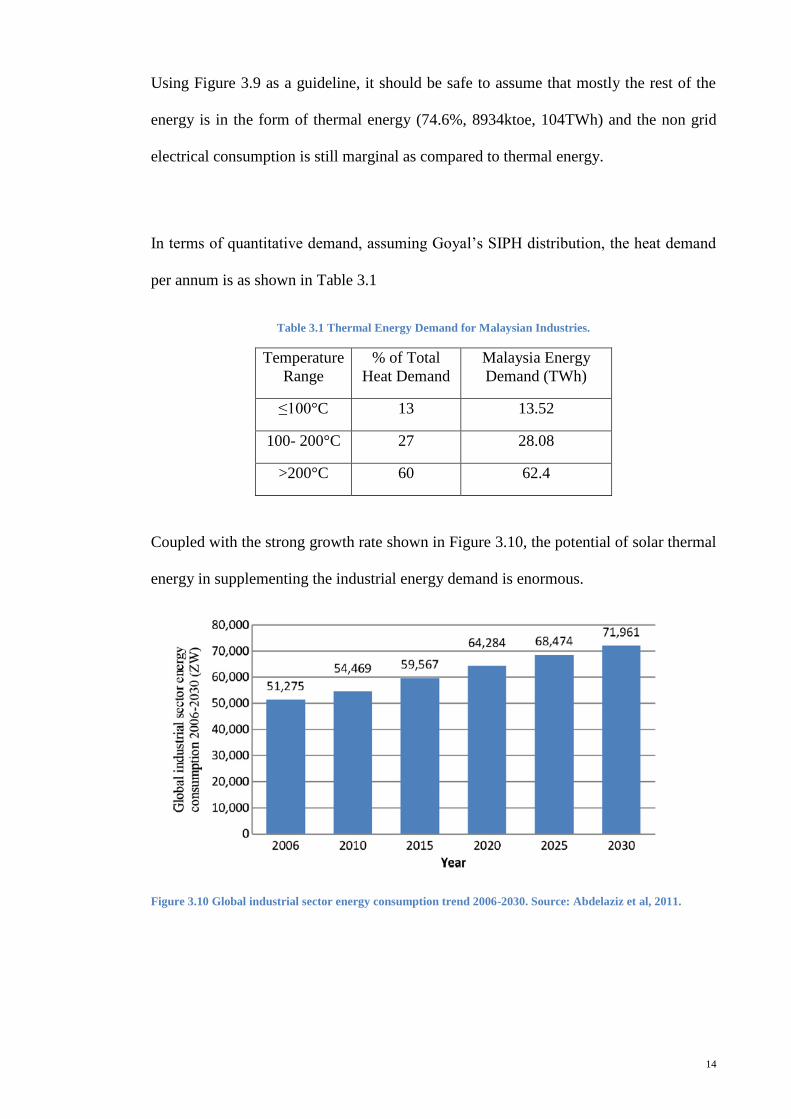
In terms of quantitative demand, assuming Goyal’s SIPH distribution, the heat demand
per annum is as shown in Table 3.1
Table 3.1 Thermal Energy Demand for Malaysian Industries.
Temperature
Range
% of Total
Heat Demand
Malaysia Energy
Demand (TWh)
≤100°C 13 13.52
100- 200°C 27 28.08
>200°C 60 62.4
Coupled with the strong growth rate shown in Figure 3.10, the potential of solar thermal
energy in supplementing the industrial energy demand is enormous.
Figure 3.10 Global industrial sector energy consumption trend 2006-2030. Source: Abdelaziz et al, 2011.

15
3.4 Energy Consumption and Renewable Energies
We are all creatures of energy. Energy is our life sustenance. There will be no world as
we know it without energy. As it stands today, world energy requirements is currently at
107,000 TWh/annum. It is predicted that global energy requirements will increase
annually by 1.3 % until 2030. We consume around 13 billion litres of crude oil and
approximately 14.7 million tonnes of hard coal and brown coal daily on this earth, most
of this for the generation of electricity and heat, and for motor vehicles, airplanes and
trains. Burning these fossil fuels causes approximately 25 billion tonnes of the
greenhouse gas, carbon dioxide (CO2), to be released each year into the earth’s
atmosphere (Technology Guide, 2009). Renewable energy sources will increase
disproportionately, particularly wind and solar energy. However, as these currently only
make up a small proportion of the primary energy supply, fossil energies will continue
to dominate (Technology Guide, 2009), as shown in Figure 3.11. The environmental
impact and scarce availability of fossil energy caused a shift for increased renewable
energy utilization (IEA, 2006). Consumption of fossil fuels causes air and water
pollution and also global warming. On the other hand, renewable energy can avoid these
adverse impacts. Renewable energies do have their own negative influence to the
environment but the magnitudes are much smaller and localized than fossil and nuclear
energies (Union of Concerned Scientists, 2005).

16
Figure 3.11 Global energy requirements by energy sources. Source: Exxon Mobil
From the International Energy Agency (2002), it is said that “Renewable energy is
derived from natural processes that are replenished constantly. In its various forms, it
derives directly from the sun, or from heat generated deep within the earth. Included in
the definition is electricity and heat generated from solar, wind, ocean, hydropower,
biomass, geothermal resources, and biofuels and hydrogen derived from renewable
resources”. The above statement stated two main direct sources of renewable energies,
which are solar power and geothermal power, while other renewable energies are
derivatives of them. Not forgetting tidal power is also a main direct source, but its
contribution in relation to the other 2 main types is much smaller. Derivatives of solar
energy go through at least one level of energy conversion state, increasing exergy and
generating entropy in the process. Take for example biomass energy. Plant absorbs the
solar energy and turns it into biological materials – branches, fruits and leaves.
Unwanted materials are then collected and acted upon by bacteria, releasing
combustible gasses. Another example would be fossil fuels. It is a form of energy

17
converted from dead animals or plants compressed in the earth crust over a period more
than millions of years ago, through anaerobic decomposition. Solar energy is faced with
the limitation of low exergy in the beginning. However, with the advent of different
solar collection technologies able to produce high temperature outputs, low exergy is no
longer an issue and its potential is very great, as demonstrated in the subsequent section.

18
3.5 Solar Energy and its potential
About 1000 PW of energy from the sun is received by earth every year which is 1000
times enough to cover the global energy demand (Amin, 2009). The sun is made of hot
gaseous matter in a sphere with a diameter approximately of 1,390,000km, where
continuous fusion of hydrogen into helium gives the sun an effective blackbody
temperature of 5762K. Although the distance of the sun is 1.5 x 10¹¹
m away from earth,
its energy reaches our planet in 8 min and 20s. Energy output from the sun is 3.8 x 10²⁰
MW, equivalent to 63 MW/m2, radiating in all directions. Earth is only able to intercept
a tiny fraction of 1.7 x 10¹⁴
kW, of the total radiation emitted (Kreith and Kreider, 1978).
However, not all of the suns energy reaches the surface, as shown in Figure 3.12. Some
of them are deflected and lost.
Figure 3.12 Solar energy distribution. Source: Four Peaks Technologies, 2010.

19
Figure 3.13 Solar radiation and energy requirements. Source: Technology Guide, 2009.
Figure 3.13 shows the power generation of the sun and the potential of solar energy in
perspective. Assuming a 12% efficiency solar cell used in the Sahara, the big rectangle
shows the surface area required to fulfill the energy demands throughout the world
where the large square is approximately 910 km in length, medium size square for
Europe’s requirement and the smallest square for Germany (Technology Guide, 2009).
The electromagnetic radiation emitted by the sun is composed of a wide range of
wavelengths which can be split into two major regions; ionizing radiation such as
gamma and X-rays and non-ionizing such as infrared, visible light, and ultraviolet
radiation. The damaging gamma and X-rays radiation is unable to penetrate the earth's
atmosphere and can only be experienced in outer space. The solar energy imparted on
earth consists of 8% ultraviolet, 47% visible light and 45% infrared (Arca, 1990). The

20
non-ionizing radiation is attenuated by our atmosphere before reaching Earth’s surface.
Through reflection, scattering, and absorption, our atmosphere changes or eliminates
part of the incident energy by the sun. Almost all ultraviolet radiation and certain
wavelengths in the infrared region are removed by our atmosphere (Encyclopedia of
Science & Technology, 2001)
Figure 3.14 Typical Solar Radiation Spectrum. Source: ASTM, 2003.
Figure 3.14 displays the solar radiation spectrum for direct light at both the top of the
Earth's atmosphere and at sea level. These curves are known as Terrestrial Reference
Spectra from the American Society for Testing and Materials (ASTM, 2003) and are the
standard test condition used by the photovoltaic industry. The red field in the figure
shows the wavelengths that reaches sea level while wavelengths of energy that reach the
top of the atmosphere is shown by the yellow field. These radiations from the sun is
filtered and reduced by different gases in specific wavelengths. Gases with specific
absorption band residing in our atmosphere absorb some of the light. Additional light is
redistributed by Rayleigh scattering, which gives our atmosphere the blue color sky.

21
Oxygen reduces infrared while our ozone filters out the ultraviolet rays in the shortest
wavelength, known as UVB (Wikibooks, 2011).
Solar radiation can also be divided into two components, namely direct or diffuse
radiation. Direct solar radiation can be concentrated with the optical devices while
diffuse solar radiations are scattered direct solar radiation, which cannot be concentrated
by with reflectors or lenses. During cloudy days, diffuse radiation predominates
(Technology Guide, 2009). The amount of atmospheric absorption and scattering of
solar radiation is a function of the effective distance (depending on atmospheric
thickness and content) through which the radiation travels. At the outer atmosphere of
Earth, the energy received is 1368W/m2 and deviates in the region of ±1.7% because of
the distance changes between the Earth and Sun, as shown in Figure 3.15 (Ahmad,
2011).
Figure 3.15 Yearly variation of the solar constant. Source: Ahmad, 2011.
The light of the Sun directly overhead at a 90° solar altitude, or zenith, at sea level
provides an average peak intensity of 1 kW/m2. As the Earth circles around the sun, the

22
angle between the Earth-Sun line and Earth’s equatorial plane, known as solar
declination varies accordingly, which affects the solar radiation coming to Earth.
Intensity weakens at Sun angles approaching the horizon since the rays have more
atmospheres to penetrate. Distributions of the solar irradiation depending on
geographical locations are shown in Figure 3.16. The amount of solar energy incident
on a horizontal surface at sea level ranges up to 7 kWh/m2-day. At latitudes between
35°N and 35°S, the sites are exposed to around 2000 to 3500h of sunshine each year. At
higher latitudes the solar energy imparted is less than on sea level (Encyclopedia of
Science & Technology, 2007)
Figure 3.16 Worldwide direct normal solar irradiation. Source: DLR, 2008.
It can be seen that solar energy is also a relatively “fair” form of renewable energy.
Most renewable energies are highly geographically dependent. For instances, wind
energy works well offshore or near shore but weaken abruptly when we move towards
inland; hydro energy needs rivers and dams at preferably higher level to have good
0° 20°E 40°E 60°E 80°E 100°E 120°E 140°E 160°E 180° 160°W 140°W
120°W
100°W
80°W
60°W
40°W
20°W
0° 20°E 40°E 60°E 80°E 100°E 120°E 140°E 160°E 180° 160°W 140°W
120°W
100°W
80°W
60°W
40°W
20°W
70°N
50°N
30°N
10°N
10°S
30°S
50°S

23
potential energy. While on the other hand, solar energy is best readied near the equator
but through careful system design, it is available even in winter of seasonal countries.
On a side note, data collection of solar irradiation is normally done using solarimeters as
illustrated in Figure 3.17. This device consists of a spherical glass cover under which
contains thermoelectric elements as sensors. The total incident light energy will produce
a proportional voltage from the thermoelectric element which is then recorded
electronically (Everett, 2004).
Figure 3.17 A Solarimeter, also refer to as a “Pyranometer”

24
3.6 Malaysia – Solar Energy Perspective
Malaysia is positioned on the South China Sea and lies between 1° and 7° in North
latitude and 100° and 120° in East longitude (Nugroho, 2010). The total land area is
approximately 330,000km2, of which 60% is made of Sabah and Sarawak and the
remaining 40% Peninsular Malaysia. Malaysia is situated at the equator, surrounded by
the sea. This results in a hot, high humidity and a relatively uniform climate all year
round, typical of a tropical climate. The average daily is 26.5°C and ranges between
22°C to 33°C throughout the year. Winds are generally light. There are 2 monsoon
winds seasons in Malaysia. The Southwest Monsoon starts from May to September and
the Northeast Monsoon is between November and March. The rainfall distribution
pattern is determined by the monsoon winds and the local topographic features. In
general, rainfall in Malaysia can be described as copious for the annual rainfall exceeds
2000mm. Heavy rainfall usually happens between the two monsoons. Rainfall usually
happens in the afternoon or early evening, as compared to mornings. On average,
Malaysia experiences more than 170 rainy days (Azhari, et al. 2008)
Heavy rains are experienced by exposed areas facing directly to the monsoon winds
such as the east coast of Peninsular Malaysia, Western Sarawak and the northeast coast
of Sabah. Whereas sheltered areas protected by mountain ranges are relatively
independent from its influence. Most of the precipitation occurs as thunderstorm, with
heavy falls in a short period of time. This indicates that western Peninsular Malaysia,
Eastern Sarawak and Southwest coast of Sabah are better suited for solar energy
utilization in comparison to the rest.
It is very unlikely to experience a completely clear sky for a full day or a few days with
completely no sunshine, with the exception of during the northeast monsoon seasons
(MMD, 2012). Solar radiation is closely related to the sunshine duration. Substantial

25
amount of sunshine and thus solar radiation is cut off by the ever changing presence of
cloud. 6 hours of sunshine per day is the average expected in Malaysia (MMD, 2012).
Due to the constant cloud shading and frequent rainfall, the potential of Malaysia in
terms of solar energy is not as good as compared to arid desserts but still relatively good,
as shown by Figure 3.18.
Figure 3.18 Suitability for solar thermal power plants. Source: Schott Ltd.
A distribution of the average solar radiation in Malaysia is shown in Figure 3.19. More
than 10 years of measured data of direct and diffuse solar radiation exists only for Kuala
Lumpur and Penang. The data shows that for Penang the amount of direct radiation as
compared to the global values is normally less than 60% resulting in reduction in
performance of solar concentrator, limiting the benefits of concentrators. East coast
experiences a large standard deviation of daily global radiation while the peninsula
experience more stable daily solar radiation variations (Shafiq, 2010).

26
Figure 3.19 Annual average solar radiation (MJ/m2/day). Source: Maliman, M.N., 2005.
The average solar energy in Malaysia varies from paper to paper. Mekhilef et al. (2012)
states that with an average of 12 hours of sunshine daily, the average solar energy
received is between 1400 and 1900kWh/m2 annually. Harris (2008) states that the solar
insolation average at about 1643kWh/m2 per year. Amin et.al (2009) finds that the sun
hours in a day are more than 10. Yearly average solar radiation in various towns in the
country is given by Table 3.1.
Table 3.2 Solar radiation in Malaysia (average value throughout the year). Source: Mekhilef et al., 2012.

27
This works out to the monthly solar radiation in Malaysia to be around 400-600Mj/m2
(Mekhilef, 2012). S.M. Shafie (2011) on the other hand states that Malaysia is exposed
to an average daily solar radiation of 4500kWh/m2 and average daily sunshine duration
of about 12h, with an ambient temperature of between 27°C and 33°C. Accordingly it
was justified that the development of solar energy are favourable since the average daily
solar insolation is 5.5kW/m2. A.W.Azhari (2008) states that the range of annual average
daily solar irradiance is from 4.21kWh/m2 to 5.56kWh/m
2. 6.8kWh/m
2 is the highest
estimated solar irradiation to be found in August and November. On the other hand, the
lowest was estimated to be 0.61kWh/m2 in December. These values were estimated
from MTSAT-1R geostationary satellite images covering Malaysia, utilizing part of a
system called RADMAP developed by Islam and Exell (1996). The results were
correlated with data collected from several ground measuring stations in Malaysia and
are found to be within acceptable limits. The monthly average daily solar irradiation of
Peninsula Malaysia and Sabah and Sarawak are tabulated in Table 3.2 and plotted in
Figure 3.20.
Table 3.3 Monthly average daily solar irradiation of Malaysia. Source: Azhari et. al, 2008.
Month Min (kWh/m2) Max (kWh/m
2) Average (kWh/m
2)
January 4.21 5.56 4.96
February 4.67 6.62 6.23
March 4.33 6.51 5.02
April 2.63 5.11 4.11
May 3.69 6.84 4.83
June 2.98 6.71 5.14
July 4.41 5.86 5.17
August 2.15 6.81 5.25
September 3.95 5.53 4.89
October 4.68 6.43 5.43
November 4.68 6.43 5.43
December 0.61 5.34 3.00

28
Figure 3.20 Monthly average daily solar radiation. Source: Azhari et. al, 2008.
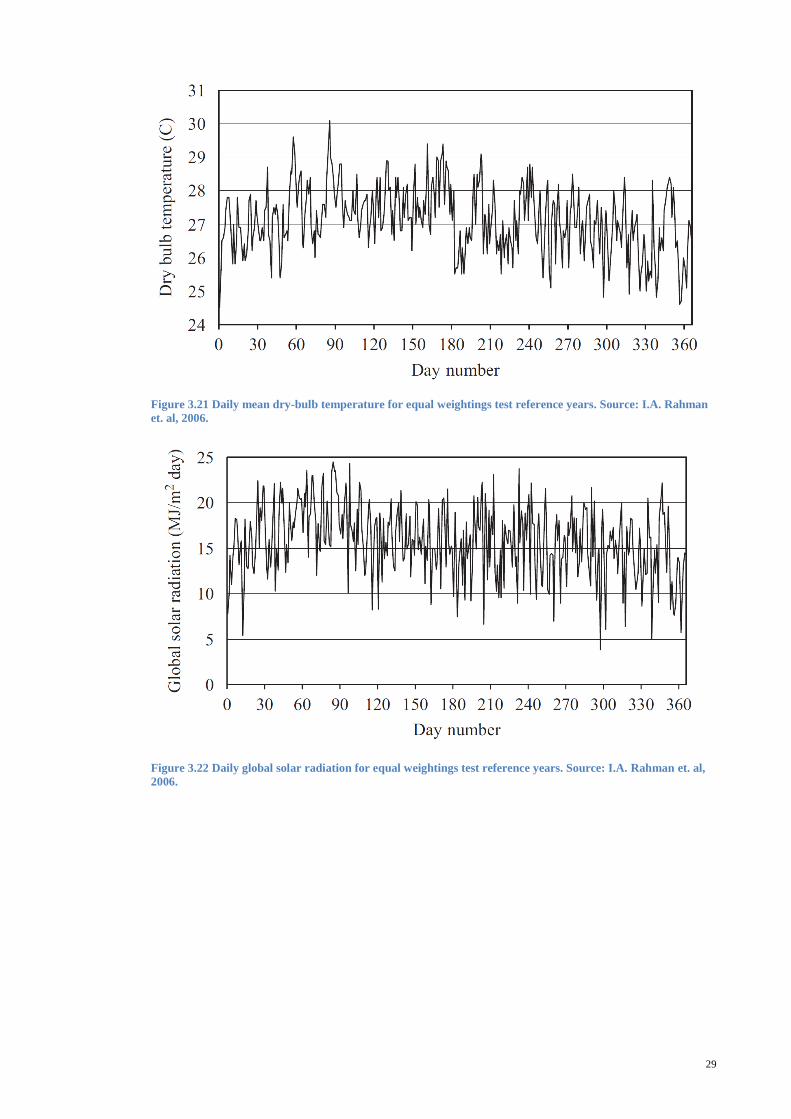
A daily and preferably hourly variation of solar radiation is needed to have a better
estimation of the performance of a solar thermal system. The Malaysian Meteorological
Services do provide such data for weather stations distributed across Malaysia.
However, typical performance or long-term average of a system would require many
years of data, which results in long computational time. To overcome this, the
simulation can be performed using 1 year of typical weather data (TWD), which
produces faster results. Employing Finkelstein-Schafer statistics and 19 years of
meteorological data, I.A.Rahman (2007) has complied a set of typical weather data as
the test reference year for Subang, Malaysia. The data are shown in Figures 3.21, 3.22,
3.23 and 3.24.
29
Figure 3.21 Daily mean dry-bulb temperature for equal weightings test reference years. Source: I.A. Rahman
et. al, 2006.
Figure 3.22 Daily global solar radiation for equal weightings test reference years. Source: I.A. Rahman et. al,
2006.

30
Figure 3.23 Daily mean relative humidity for equal weightings test reference years. Source: I.A. Rahman et. al,
2006.
Figure 3.24 Daily mean wind speed for equal weightings test reference years. Source: I.A. Rahman et. al, 2006.

31
3.7 Solar Thermal Collectors
To begin the introduction to solar collectors, it is helpful to keep the following terms
and explanation shown in Table 3.3 in mind to ease in the comprehension of the subject
matter.
Table 3.4 Commonly used terms and definition for solar collectors.
Terms Description
Irradiation /Insolation, G Radiation flux incident on a surface from all directions.
Direct Irradiance Sunshine directly coming from the sun, without being
blocked by clouds.
Diffuse Irradiance Scattered light that appears to come from the whole sky and
cannot be concentrated by lenses or reflectors.
Black body A perfect emitter and absorber of radiation.
Emissivity The ratio of the radiation emitted by the surface at a given
temperature as compared to a same temperature blackbody.
32
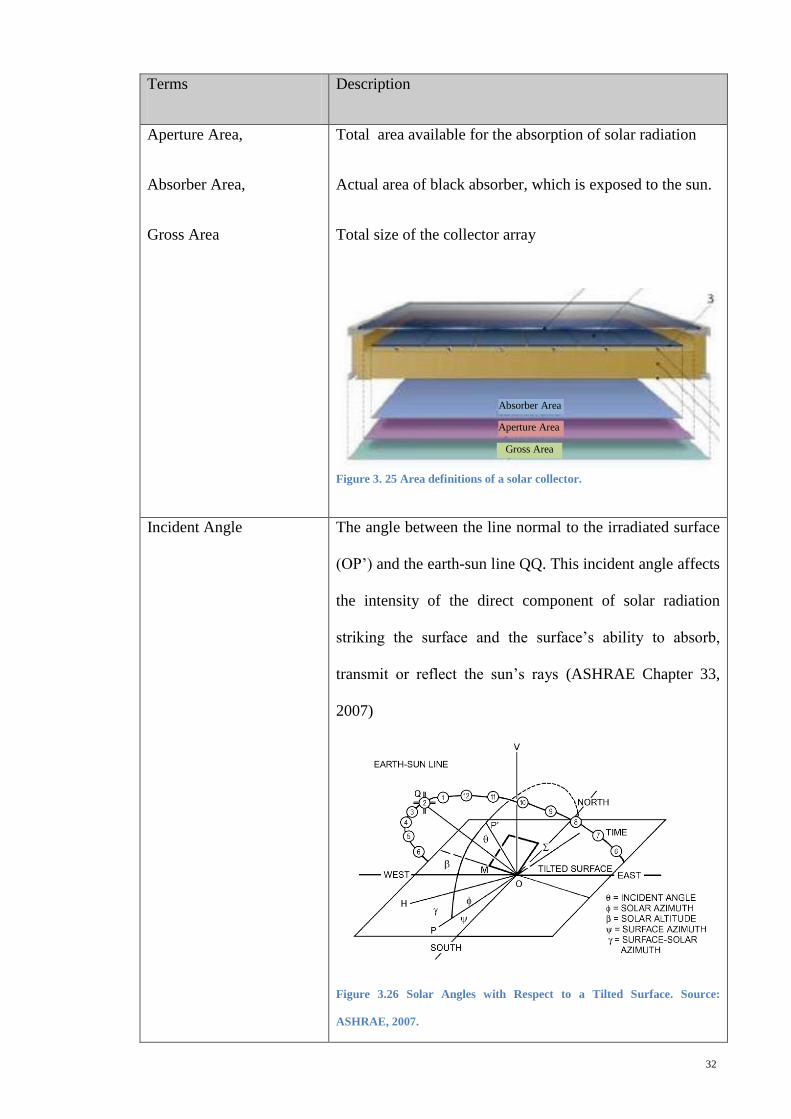
Terms Description
Aperture Area,
Absorber Area,
Gross Area
Total area available for the absorption of solar radiation
Actual area of black absorber, which is exposed to the sun.
Total size of the collector array
Figure 3. 25 Area definitions of a solar collector.
Incident Angle The angle between the line normal to the irradiated surface
(OP’) and the earth-sun line QQ. This incident angle affects
the intensity of the direct component of solar radiation
striking the surface and the surface’s ability to absorb,
transmit or reflect the sun’s rays (ASHRAE Chapter 33,
2007)
Figure 3.26 Solar Angles with Respect to a Tilted Surface. Source:
ASHRAE, 2007.
Absorber Area
Aperture Area
Gross Area
33
Terms Description
IAM (Incidence Angle
Modifier)
Output performance variance of a solar collector as the
angle between the collector and of the sun changes.
Solar Fraction (%) Measures the percentage of energy consumption being
fulfilled by solar renewable energy.
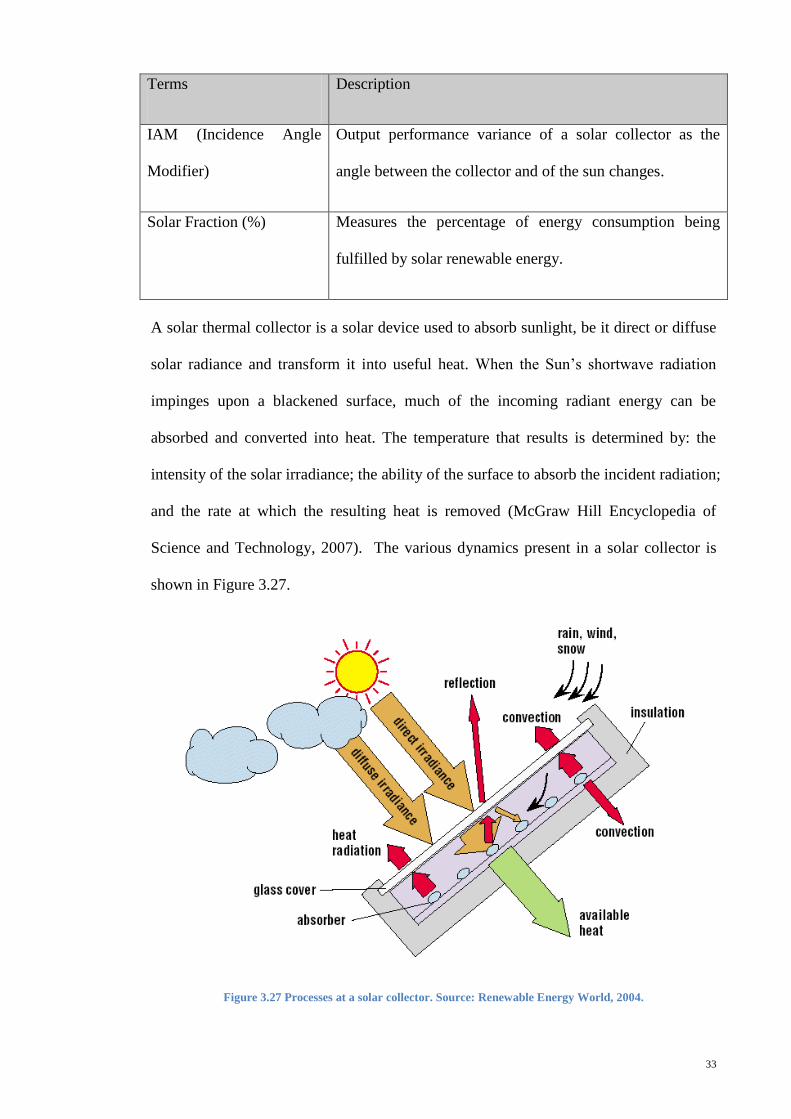
A solar thermal collector is a solar device used to absorb sunlight, be it direct or diffuse
solar radiance and transform it into useful heat. When the Sun’s shortwave radiation
impinges upon a blackened surface, much of the incoming radiant energy can be
absorbed and converted into heat. The temperature that results is determined by: the
intensity of the solar irradiance; the ability of the surface to absorb the incident radiation;
and the rate at which the resulting heat is removed (McGraw Hill Encyclopedia of
Science and Technology, 2007). The various dynamics present in a solar collector is
shown in Figure 3.27.
Figure 3.27 Processes at a solar collector. Source: Renewable Energy World, 2004.

34
The energy inputs are denoted by the yellow arrows, namely direct irradiance and
diffuse irradiance; the useful thermal energy is denoted by the green arrow while the
various losses by the red arrow, namely reflection, convection, conduction and radiation
losses.The fraction of irradiation absorbed by the surface is called the absorptivity α, the
fraction reflected by the surface is called the reflectivity ρ, and the fraction transmitted
is called the transmissivity τ (Cengel, 2004) That is,
Absorptivity:
(3.1)
Reflectivity:
(3.2)
Absorptivity:
(3.3)
Where G is the radiation energy incident on the surface, and , and are the
absorbed, reflected and transmitted portion of it, respectively. From the 1st Law of
thermodynamics,
(3.4)
And
(3.5)
For opaque surfaces, τ=0 and thus
(3.6)
The selective coating on the evacuated tubes possesses a high absorptivity up to 94%.
Combined with the low emissivity and good insulation, it is very efficient in harnessing
the energy of the sun. This is the reason why all solar collectors are opaque and black.

35
The efficiency and temperature obtained of a solar thermal system are determined by
the following factors:
1. Intensity of solar radiation
2. Location and orientation of the collectors
3. Aperture area of solar collectors
4. Efficiency of the solar collectors
5. Type of system to which it is connected (size of water heater etc)
6. Rate at which heat is removed, either for useful work or as losses.
To suit the various requirement of the industry, a myriad of systems or type of
collectors are devised to cater for different needs, as shown in Table 3.4. The major
differences in the systems are the means used to concentrate the solar rays to achieve
higher solar irradiation per unit area.
Table 3.5 Types of solar energy collectors. Source: Kalogirou, 2003.
Motion Collector type Absorber
type
Concentration
ratio
Indicative
temperature
range (ºC)
Stationary
Flat plate collector
(FPC) Flat 1 30 – 80
Evacuated tube
collector (ETC) Flat 1 50 – 200
Compound
parabolic collector
(CPC)
Tubular
1 – 5 60 – 240
5 – 15 60 – 300
Single-
axis
tracking
Linear Fresnel
reflector (LFR) Tubular 10 – 40 60 – 250
Parabolic trough
collector (PTC) Tubular 15 – 45 60 – 300
Cylindrical trough
collector (CTC) Tubular 10 – 50 60 – 300
Two-axes
tracking
Parabolic dish
reflector (PDR) Point 100 – 1000 100 – 500
Heliostat field
collector (HFC) Point 150 – 2000 150 – 2000

36
3.8 Solar Evacuated Tubes Collector
Evacuated tubes collector refers to the housing and the method it uses to minimize
radiation loss. A cross section of the tube and optical processes is shown in Figure 3.28.
Figure 3.28 Optical processes for evacuated tube. Source: advthermalsolar.com, 2012
The vacuum inside each tube gives good insulation for conductive and convective heat
transfer and therefore limits the losses of the system from outside influences, such as
low temperature, high wind or high humidity. The most popular type are the Sydney
tube, or commonly known as “thermos flask tube”, shown in Figure 3.29.
Figure 3.29 Sydney Tube. Source: B&ES, 2012

37
Each tube is normally made from borosilicate glass and consists of one glass tube inside
of another glass tube, fused at the top. The free air in the space between the two tubes
evacuated giving a Thermos flask similar vacuum-tube jacket. The transparent outer
tube houses while the inner tube which is coated with a selective coating optimized to
absorb the solar radiation and turns it into heat (REIA, 2007). The absorbed heat is
transferred by an aluminium fin to a central piping, where the working fluid flows
through. The working fluid carries the thermal energy and converges into a manifold on
the top of the solar collector.
Often a CPC reflector is placed under the tube to utilize the absorber area not facing
directly to the sun and to capture the sunlight which was passed between each collector
tube. If damaged, each tube can be removed individually for easy replacement. There
are 2 major competing technologies in transporting out the absorbed thermal energy
from evacuated tubes, namely heat pipe or U-pipe (IEA SHC, 2008).

38
3.8.1 Evacuated Heat Pipe Collectors
A heat pipe consists of a hollow pipe with a low pressure inside. The low pressure is to
lower the temperature required to alter the state of the liquid into gaseous state. Purified
water in a small amount with some additives is sealed inside the tube. The water
vapourizes when the heat pipe is heated above an adjustable temperature, rising to the
top of the heat pipe. The top of the heat pipe is also known as a condenser and possesses
a much larger diameter than the providing for a larger surface over which heat can be
transferred to the working fluid. The vapour transfers its thermal energy to the working
fluid and condenses back to its liquid form, which flows back to the bottom of the heat
pipe. The process repeats in a loop. To ensure circulation, a heat pipe collector has to be
tilted at a minimum angle of operation, typically about 20°. The quality and quantity of
the fluid residing in a heat pipe is very crucial. Water scale and tube exposition will not
happen as no water flows in the evacuated tube (IEA SHC, 2008). A schematic is
shown in Figure 3.30.
Figure 3.30 Heat pipe evacuated tube collector. Source: B&ES, 2012

39
3.8.2 Evacuated U-pipe Collectors
A U pipe collector differs in its mechanism in transporting useful thermal energy out. It
is comprised of a manifold and many vacuum tubes each containing one U-shaped
copper pipe. Aluminium fins transfer the heat absorbed to the copper pipes and working
fluid are pumped through it to obtain hot water. A pictorial representation is shown in
Figure 3.31 and Figure 3.32.
Figure 3.31 Picture of an U-pipe cross section
Figure 3.32 A U-pipe solar collector

40
3.9 Medium Temperature Solar Thermal System
A typical solar thermal system shall consist of an array of collector, a heat transfer
circuit which includes the heat exchanger, the pump and circulation fluid and lastly a
storage system, usually a tank filled with liquid and a heat exchanger, as shown in
Figure 3.33.
Figure 3.33 Basic components in a solar thermal system.
It is clear that this is a very simple system. The simplicity involved is an advantage of
this kind of system.

41
The integration of solar collectors to an industrial thermal powered system can be as a
pre-heater for make-up water in boiler operations, directly for a process, or to generate
steam by itself, as shown in Figure 3.34.
Figure 3.34 Integration of solar collectors to an industrial thermal powered system. Source: Kalogirou, 2003.
It is important before the deployment of the solar thermal system to take note of the
following criteria before deployment, namely orientation, angle of inclination and
shading. These are parameters that would affect the output of the collector. Orientation
and angle of inclination is related to the collector’s angle to the moving sun, which
should be optimized to achieve the highest output year round. Shading is to avoid any
shadows casting on the collectors at any time of the year. This is to ensure maximum
output and to avoid any thermal stress imbalance.
42
CHAPTER 4: METHODOLOGY
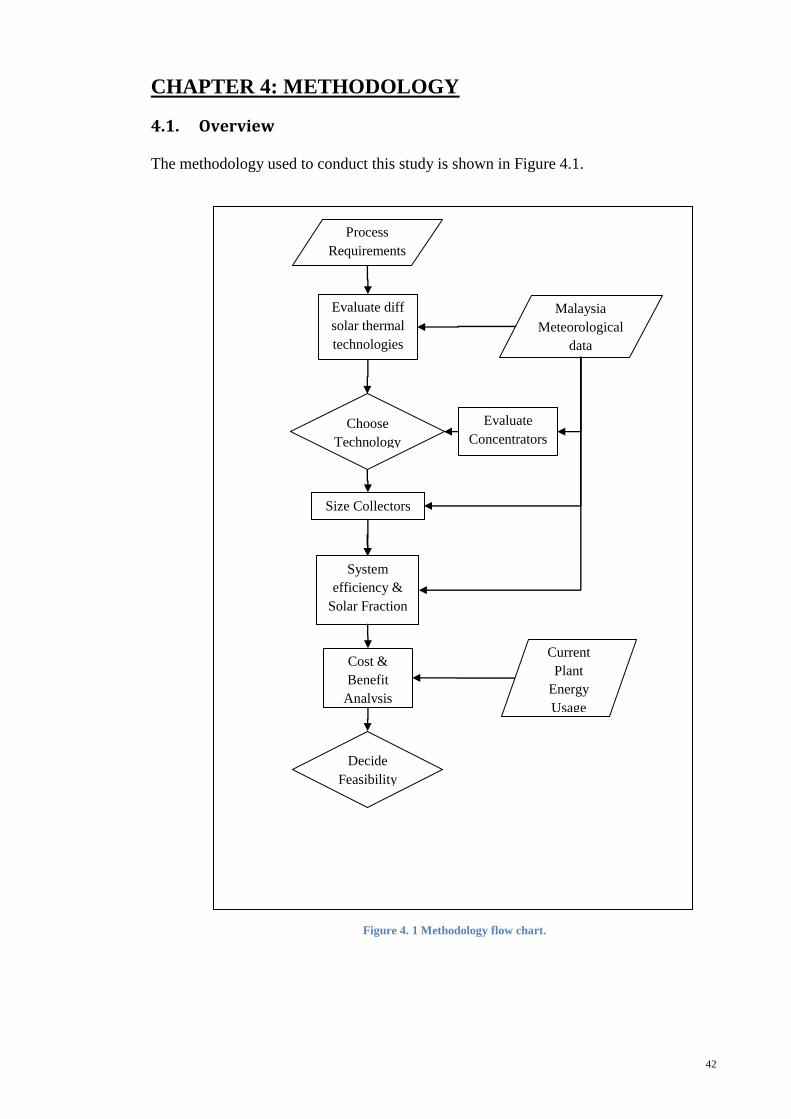
4.1. Overview
The methodology used to conduct this study is shown in Figure 4.1.
Process
Requirements
Evaluate diff
solar thermal
technologies
Choose
Technology
Malaysia
Meteorological
data
Evaluate
Concentrators
Size Collectors
System
efficiency &
Solar Fraction
Current
Plant
Energy
Usage
Cost &
Benefit
Analysis
Decide
Feasibility
Figure 4. 1 Methodology flow chart.

43
The study is initiated by a choosing a process relevant to most industrial processes, such
as boiler feed water pre-heater or high pressure wash down system. Using the
Malaysian meteorological data, different solar thermal technologies are evaluated and
decided on one. Then, the system is sized based on the collectors that are available in
the market. A simulation is carried out on the system output using Malaysia typical
weather year data with the solar fraction as the final output. Various case scenarios are
then carried out to study the sensitivity and reaction of the system .This solar thermal
system is then compared with other means of generating thermal energy and a cost &
benefit analysis done.
The various calculations involved are explained subsequently.

44
4.2. Theory and Calculations
Different theoretical evaluation of the long-term performance is studied (Oliveira, 2007).
A more simplistic approach is selected as to be explained subsequently. The calculation
of the system performance is divided into 4 parts:
a) Solar collector performance and output
b) Heat Exchanger output
c) Design and Sizing for Open loop Direct System
d) Design and Sizing for Closed Loop Drain Back System
4.3. Solar Collector Performance
A cross section of an evacuated tube and its associated parts is shown below in Figure
4.2.
Figure 4. 2 Evacuated tube cross section
Working
fluid
Copper
tubing
Fins
Evacuated
tube
Evacuated
space
45
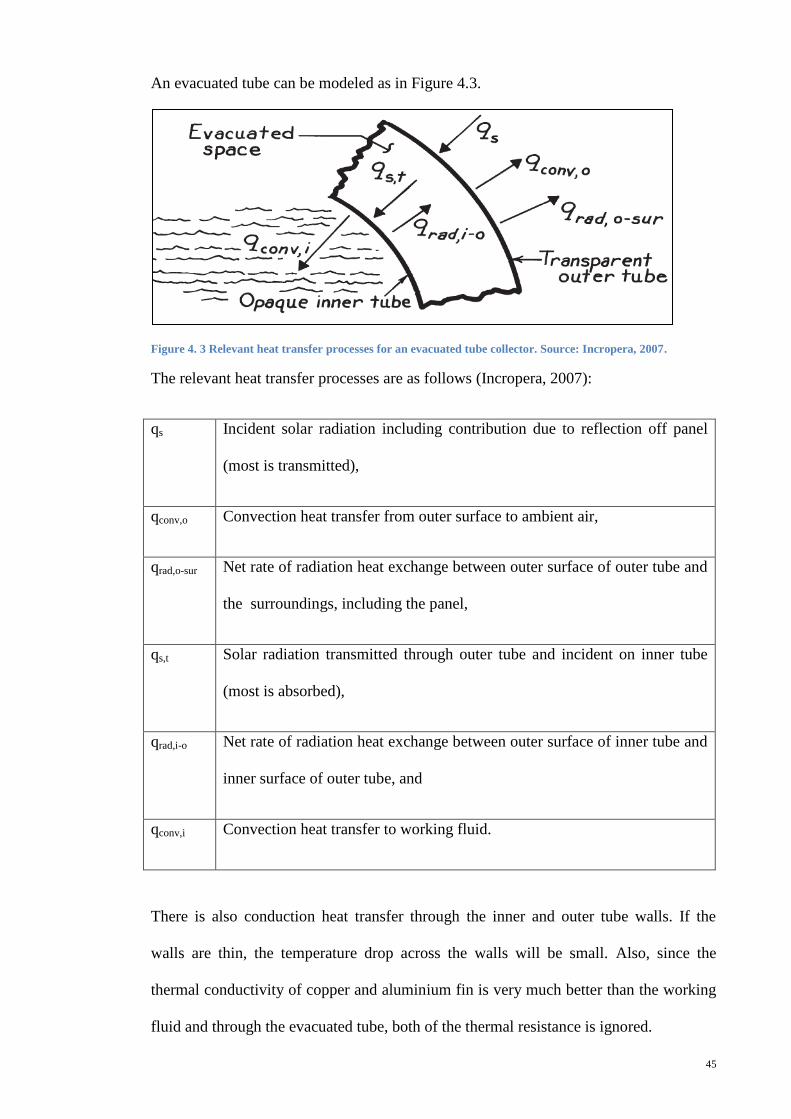
An evacuated tube can be modeled as in Figure 4.3.
Figure 4. 3 Relevant heat transfer processes for an evacuated tube collector. Source: Incropera, 2007.
The relevant heat transfer processes are as follows (Incropera, 2007):
qs Incident solar radiation including contribution due to reflection off panel
(most is transmitted),
qconv,o Convection heat transfer from outer surface to ambient air,
qrad,o-sur Net rate of radiation heat exchange between outer surface of outer tube and
the surroundings, including the panel,
qs,t Solar radiation transmitted through outer tube and incident on inner tube
(most is absorbed),
qrad,i-o Net rate of radiation heat exchange between outer surface of inner tube and
inner surface of outer tube, and
qconv,i Convection heat transfer to working fluid.
There is also conduction heat transfer through the inner and outer tube walls. If the
walls are thin, the temperature drop across the walls will be small. Also, since the
thermal conductivity of copper and aluminium fin is very much better than the working
fluid and through the evacuated tube, both of the thermal resistance is ignored.

46
It can be seen that is not a simple equation to solve, especially when radiative heat
transfer is involved. Recognizing the difficulty in achieving an exact solution to the
above heat transfer processes, an experimental method is employed, as the equation
shown below.
(3.7)
Where,
Symbol Description Unit
= Solar Collector Efficiency %
=
Optical efficiency of the collector. It measures
the ability of the collector is at absorbing
sunshine.
%
=
Liner loss co-efficient. It is a measure of how
much heat is lost mainly by conduction as the
collector temperature rises relative to ambient
temperature.
=
Quadratic loss co-efficient. It is a measure of
how much heat is lost mainly by convection and
radiation as the collector temperature rises
relative to ambient temperature.
= Mean temperature of the collector °C
= Surrounding ambient temperature °C
47
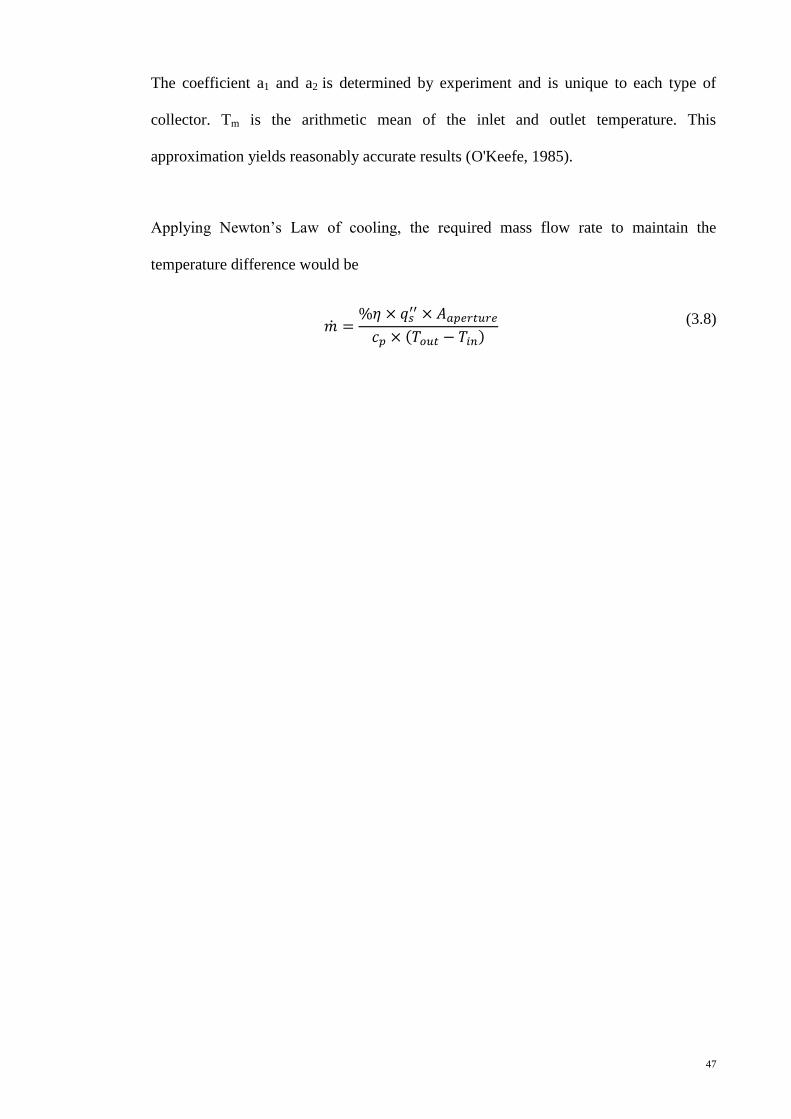
The coefficient a1 and a2 is determined by experiment and is unique to each type of
collector. Tm is the arithmetic mean of the inlet and outlet temperature. This
approximation yields reasonably accurate results (O'Keefe, 1985).
Applying Newton’s Law of cooling, the required mass flow rate to maintain the
temperature difference would be
(3.8)

48
4.4. Heat Exchanger
For the performance calculation, the number of transfer units, NTU and heat capacity
ratio, Cr value will need to be computed and subsequently the heat exchanger
effectiveness, ε is then determined, either from the equation below
(3.9)
or from the chart in Figure 4.4 for single pass, cross flow flat plate heat exchanger with
both fluid unmixed.
Figure 4. 4 Effectiveness of a single-pass, cross-flow heat exchanger with both fluids unmixed. Source:
Incropera, 2007.

49
Determination of NTU is given by
(3.10)
Where Uh is the Overall Heat Transfer Co-efficient, Cmin is equal to Cc or Ch, whichever
is smaller. Cc and Ch are the cold and hot fluid heat capacity rates, respectively, given
by the formulation:
(3.11)
Also,
(3.12)
With the obtained effectiveness, ε, the heat transfer rate is given by
(3.13)
The heat transfer rate of the heat exchanger will be the determining factor in sizing the
temperature of collector input and output.

50
4.5. Design and Sizing for Open loop Direct System
A fixed ΔT condition is imposed on the system, which is 75°C outlet temperature of the
solar collector and 27°C as the water inlet temperature to the collector. It is sized to
provide 100% solar fraction for the sunniest day in Malaysia. It is designed without
taking into consideration of any heat storage facility and the transient behavior of the
system due to changes in solar insolation. With these constraints, the panels required are
determined.
With the designed arrangement, the Malaysia typical weather data is used to calculate
the solar fraction in a year. This is achieved by first computing the mass flow rate
required to maintain the desired differential temperature in the inlet and outlet of the
collector, followed by the power output of the system.
Figure 4. 5 Schematics for Open Loop Direct System
Fixed, 25°C
Fixed, 70°C
Mass flow rate varies
51
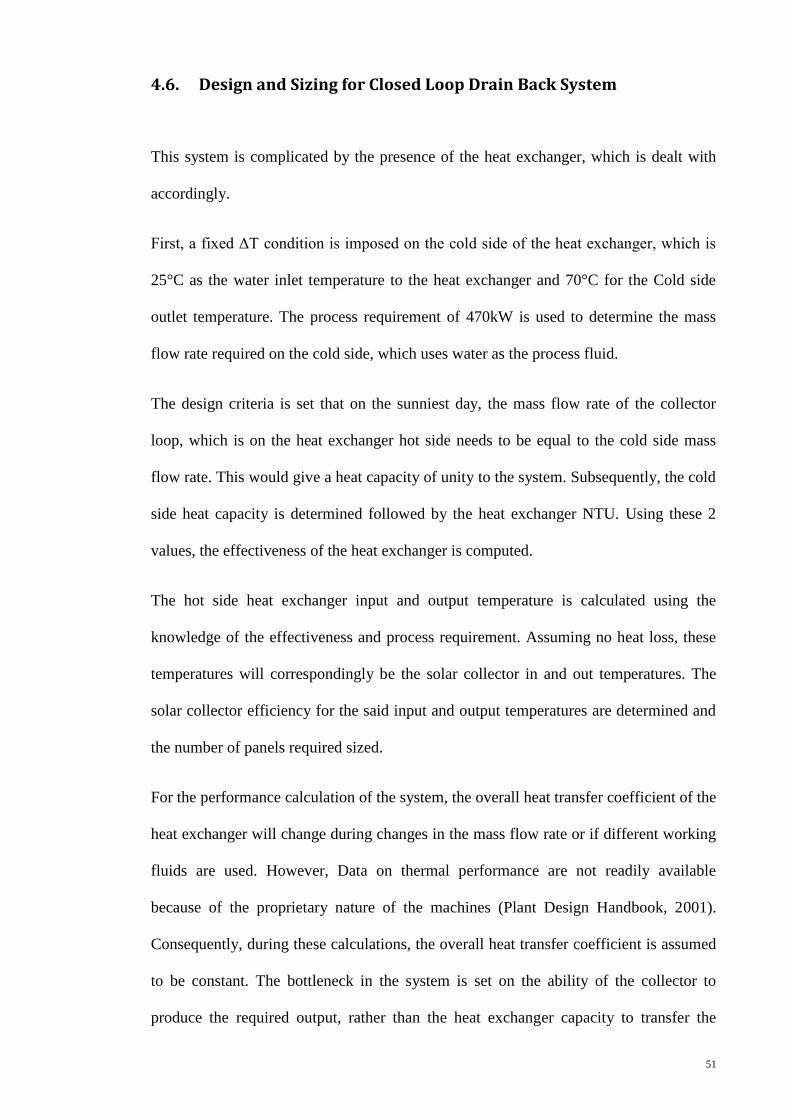
4.6. Design and Sizing for Closed Loop Drain Back System
This system is complicated by the presence of the heat exchanger, which is dealt with
accordingly.
First, a fixed ΔT condition is imposed on the cold side of the heat exchanger, which is
25°C as the water inlet temperature to the heat exchanger and 70°C for the Cold side
outlet temperature. The process requirement of 470kW is used to determine the mass
flow rate required on the cold side, which uses water as the process fluid.
The design criteria is set that on the sunniest day, the mass flow rate of the collector
loop, which is on the heat exchanger hot side needs to be equal to the cold side mass
flow rate. This would give a heat capacity of unity to the system. Subsequently, the cold
side heat capacity is determined followed by the heat exchanger NTU. Using these 2
values, the effectiveness of the heat exchanger is computed.
The hot side heat exchanger input and output temperature is calculated using the
knowledge of the effectiveness and process requirement. Assuming no heat loss, these
temperatures will correspondingly be the solar collector in and out temperatures. The
solar collector efficiency for the said input and output temperatures are determined and
the number of panels required sized.
For the performance calculation of the system, the overall heat transfer coefficient of the
heat exchanger will change during changes in the mass flow rate or if different working
fluids are used. However, Data on thermal performance are not readily available
because of the proprietary nature of the machines (Plant Design Handbook, 2001).
Consequently, during these calculations, the overall heat transfer coefficient is assumed
to be constant. The bottleneck in the system is set on the ability of the collector to
produce the required output, rather than the heat exchanger capacity to transfer the

52
required power output. The heat exchanger performance is assumed to be able to handle
the system requirements, regardless of the flow rate.
Figure 4. 6 Schematic of closed loop drainback system and temperature profile of heat exchanger.
Fixed, 25°C
Fixed, 70°C Fixed
variable.
Varies depending on
heat exchanger
efficiency
Mass flow rate varies
depending on collector
output
53
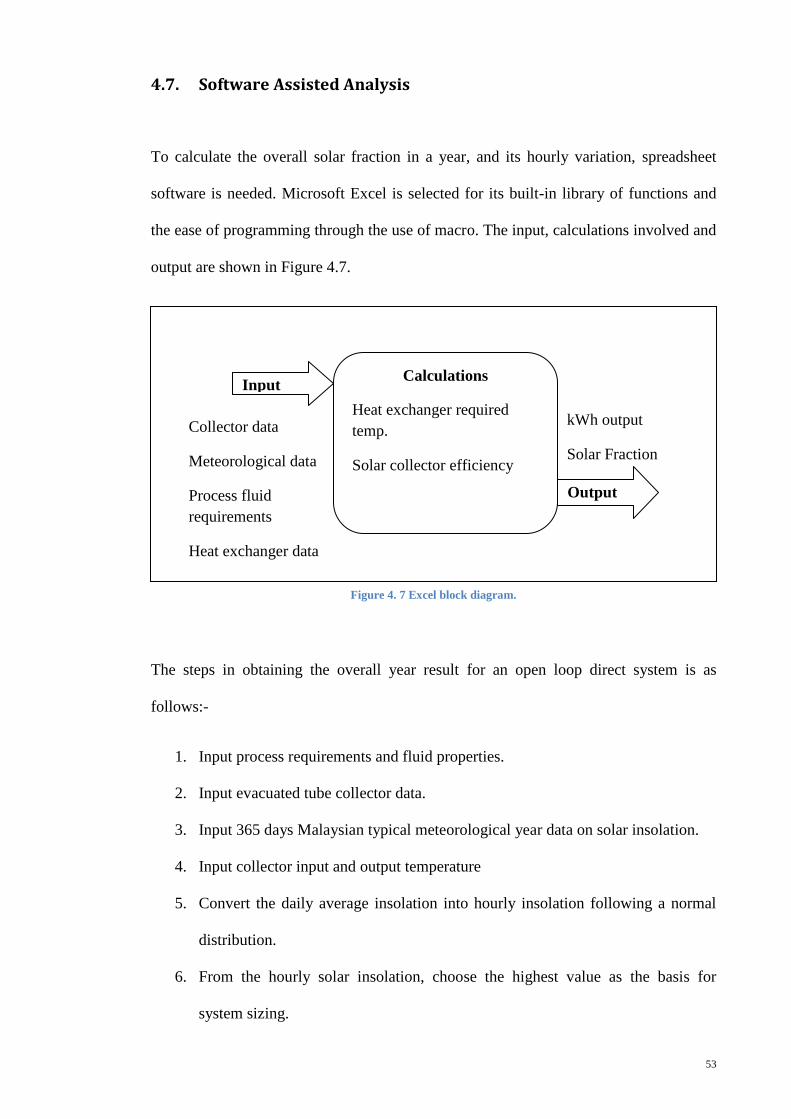
4.7. Software Assisted Analysis
To calculate the overall solar fraction in a year, and its hourly variation, spreadsheet
software is needed. Microsoft Excel is selected for its built-in library of functions and
the ease of programming through the use of macro. The input, calculations involved and
output are shown in Figure 4.7.
The steps in obtaining the overall year result for an open loop direct system is as
follows:-
1. Input process requirements and fluid properties.
2. Input evacuated tube collector data.
3. Input 365 days Malaysian typical meteorological year data on solar insolation.
4. Input collector input and output temperature
5. Convert the daily average insolation into hourly insolation following a normal
distribution.
6. From the hourly solar insolation, choose the highest value as the basis for
system sizing.
Input Calculations
Heat exchanger required
temp.
Solar collector efficiency
Output
Collector data
Meteorological data
Process fluid
requirements
Heat exchanger data
kWh output
Solar Fraction
Figure 4. 7 Excel block diagram.

54
7. Calculate the efficiency of the collector panel at that hour.
8. Determine the mass flow rate of working fluid through the panel.
9. Calculate the number of panels required to produce 100% solar fraction for that
hour.
10. Using the number of panels obtained, calculate the output from the panels on
each and every hour.
11. Get monthly average solar fraction.
For a closed loop drain back system, the only difference is the existence of a heat
exchanger, which raises the solar collector input and output temperature in order to
maintain the process fluid requirements. The calculation steps are the same as previous
with an additional step to first determine the raised temperature required. The
prerequisite steps are:-
1. Input heat exchanger active area, overall heat exchanger efficiency.
2. Input working fluid heat capacity.
3. Calculate solar collector input and output temperature.

55
CHAPTER 5: PROJECT BACKGROUND AND SIZING
DESCRIPTION
To study the applicability of medium solar thermal technology, a particular process in
the industry is chosen. Since most plants would have long operating hours and a
preferred production flow, it is unrealistic to depend solely on solar insolation for a
particular process’s thermal energy needs. It is a requirement that energy is supplied on
demand. To overcome this, a solar thermal system would need to be supplemented by
another system, such as electrical heater, heat pumps or boilers.
Subang is the location with the most meteorological data availability as it is where our
nation’s first airport is situated. Incidentally, there are a few industrial estates in Subang.
For these reasons, the factory chosen is situated within Subang area.
One process which is mostly used in all industries is high pressure wash down systems.
This system is used for cleaning purposes. The system requirements are listed in Table
5.1.
Table 5.1 Solar thermal system requirements.
Criteria Value Unit
Power 470 kW
Fluid Out temperature 80 °C
Fluid In Temperature 25 °C
Fluid used Water -
Fluid heat capacity 4.18 kW/m2.K
Required flow rate 2.044 kg/s

56
5.1 Solar Collector Selection
As the collector heats up, more heat is loss to the surrounding. The main mechanism are
Conduction loss at the front, side and back of the panel, Convective losses at the front
of the panel and most importantly radiative loss at the front of the panel., described by
the equation below, repeated for convenience:-
(3.7)
Where,
Parameter Description Unit
= Solar Collector Efficiency %
= Optical efficiency of the collector. It is a measure
of how good the collector is at absorbing solar
energy.
%
= Liner loss co-efficient. It is a measure of how
much heat is lost mainly by conduction as the
collector temperature rises relative to ambient
temperature.
= Quadratic loss co-efficient. It is a measure of
how much heat is lost mainly by convection and
radiation as the collector temperature rises
relative to ambient temperature.
= Mean temperature of the collector,
(Toutlet+Tinlet)/2
°C
= Surrounding ambient temperature °C

57
The equation above would yield an efficiency graph as in Figure 5.1.
Figure 5.1 Efficiency of solar collector as the collector temperature rises. Source: Renewable Energy World,
2004.
Generally, flat plate collector has a lower linear loss coefficient but higher quadratic
loss co-efficient as compared to an evacuated tube collector. This would result in a
higher heat loss when the difference in collector and ambient temperature is higher, as
shown in Figure 5.2
Figure 5.2 Comparison of flat plate and evacuated tube collector.

58
Due to our intention of utilizing the solar thermal energy for industrial usage, which is
in the medium temperature region, and the simplicity of a stationary collector, the
evacuated tube collector is chosen for this study since it yields a higher efficiency. This
would be
the reason why evacuated tubes are more popular, as show in Figure 5.3 of the market
share of various solar collectors.
Figure 5.3 Distribution of the total installed capacity in operation by collector type in 2009. Weiss and
Mauthner, 2011.
In general, the two collectors have nearly identical efficiency ratings and the
differentiating advantages of U-pipes are:
• Lower price
• Installation versatility – there are no requirements on inclination of the panels.
• Smaller size for easier placement in tight locations.
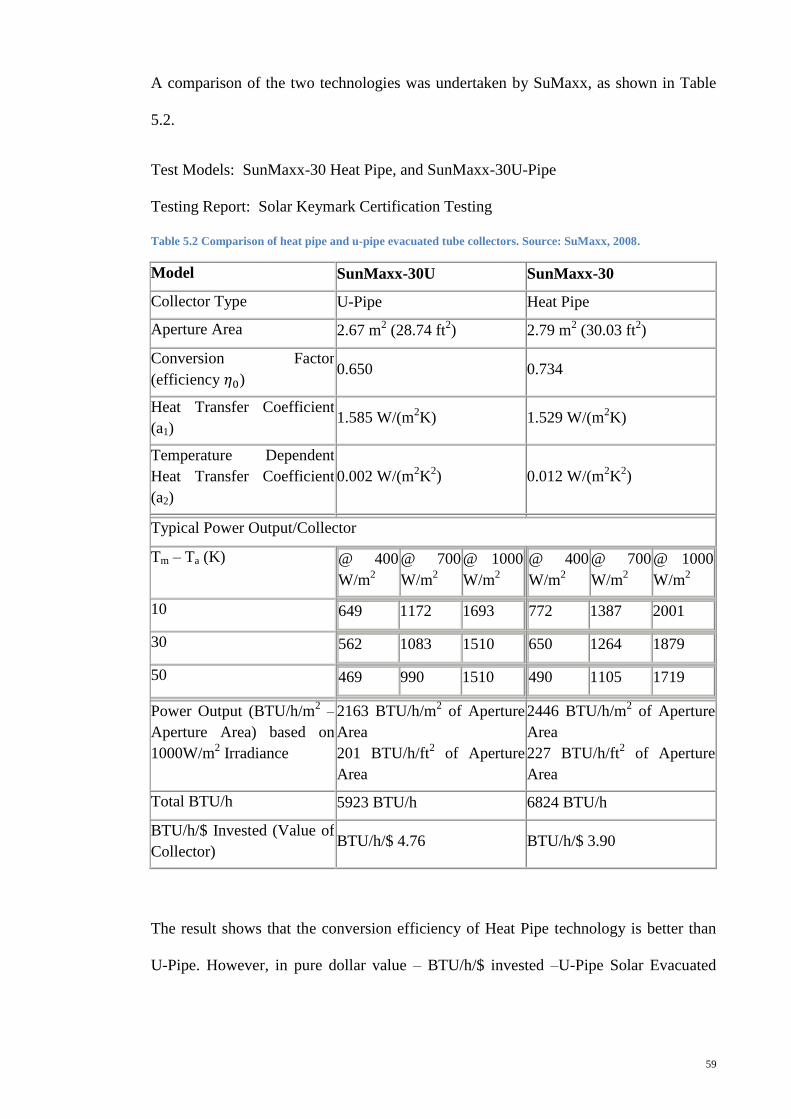
59
A comparison of the two technologies was undertaken by SuMaxx, as shown in Table
5.2.
Test Models: SunMaxx-30 Heat Pipe, and SunMaxx-30U-Pipe
Testing Report: Solar Keymark Certification Testing
Table 5.2 Comparison of heat pipe and u-pipe evacuated tube collectors. Source: SuMaxx, 2008.
Model SunMaxx-30U SunMaxx-30
Collector Type U-Pipe Heat Pipe
Aperture Area 2.67 m2 (28.74 ft
2) 2.79 m
2 (30.03 ft
2)
Conversion Factor
(efficiency ) 0.650 0.734
Heat Transfer Coefficient
(a1) 1.585 W/(m
2K) 1.529 W/(m
2K)
Temperature Dependent
Heat Transfer Coefficient
(a2)
0.002 W/(m2K
2) 0.012 W/(m
2K
2)
Typical Power Output/Collector
Tm – Ta (K) @ 400
W/m2
@ 700
W/m2
@ 1000
W/m2
@ 400
W/m2
@ 700
W/m2
@ 1000
W/m2
10 649 1172 1693
772 1387 2001
30 562 1083 1510
650 1264 1879
50 469 990 1510
490 1105 1719
Power Output (BTU/h/m2 –
Aperture Area) based on
1000W/m2 Irradiance
2163 BTU/h/m2 of Aperture
Area
201 BTU/h/ft2 of Aperture
Area
2446 BTU/h/m2 of Aperture
Area
227 BTU/h/ft2 of Aperture
Area
Total BTU/h 5923 BTU/h 6824 BTU/h
BTU/h/$ Invested (Value of
Collector) BTU/h/$ 4.76 BTU/h/$ 3.90
The result shows that the conversion efficiency of Heat Pipe technology is better than
U-Pipe. However, in pure dollar value – BTU/h/$ invested –U-Pipe Solar Evacuated

60
Tube Solar Collectors is more cost effective because of their lower price and
comparable performance rating.
Also, compared to the flat solar panel, solar tube is designed to collect the energy from
the daylight at all angles, as illustrated in Figure 5.4. The rays are all absorbed
perpendicularly to the tube. Therefore, solar tube collector is more efficient in
absorbing solar energy.
Figure 5.4 Solar ray angle. Source: Himin Ltd., 2012

61
Due to the simplicity and the proven nature of the technology used in a U-pipe solar
collector, it is chosen for further study for the higher possibility of implementation in
the industrial world.
From the market, a solar collector vendor is chosen, which is Himin Ltd from China.
The solar collector used has the parameters listed in Table 5.3. The parameters are
tested by German Fraunhofer research institute and are obtained directly from the
manufacturer.
Table 5.3 Himin Solar Collector HUJ16/1.8
Paramater Value Unit
D_tube 58 mm
D_Copper 8 mm
U-pipe thickness 0.5 mm
Length 1800 mm
Collector Joint 15 mm
Outline Dimension 1978x1636x134 mm x mm x mm
No of tubes 16 -
Weight 61.65 kg
Rated working pressure 0.6 MPa
a1 2.103 W/(m2K)
a2 0.0107 W/(m2K
2)
n_0 0.779 -
Aperture Area 1.51 m2
Gross Area 3.24 m2

62
Figure 5.5 Himin u-pipe collector. Source: Himin Ltd, 2012.

63
5.2 System Description
The philosophy of design is that this system is meant to be a secondary system. Its
function is to supplement a primary system, which is able to supply the full heat load
requirement by itself. It is the intent to avoid thermal overload in the system. As such,
the solar thermal system is sized such that the solar fraction will be 1 for the sunniest
day. Two systems are evaluated, namely the Open-Loop Direct and Closed Loop Drain
Back system.
5.3 Open-Loop Direct Systems
This is the simplest of the active systems. The transfer fluid acts also as the intended
working fluid for a process and is passed through the collector, gaining heat energy in
the process. A solar storage tank acts as an expansion tank and is the reservoir of the
heated fluid. The heated fluid is then passed to a secondary heater where if the
temperature is insufficient, it will be heated by other means such as boiler or electrical
heater. An air vent is required at the high point of the solar thermal collector for initial
air purging. A pump is used to circulate the working fluid and can be thermostatically
controlled to give a variable flow rate to maintain the output temperature.

64
Figure 5.6 Open-Loop Direct Systems. Source: Homepower.com, 2012.
5.4 Closed-Loop Drainback Systems
The closed-loop drainback system is attractive because of the least amount of routine
service required of any active system. The heat-transfer working fluid is circulated in a
closed loop, making no direct contact with the outer environment and thus eliminating
the risk of contamination. When the system is not in use, either because of over capacity
or maintenance, the solar collector is emptied of the working fluid which is stored in a
reservoir tank.

65
The operation of the system is when the pump is running; the working fluid is pumped
from the reservoir to the collector and then the heat exchanger, transferring heat energy
to the process fluid in the solar tank. If the pump is off, the working fluid will drain
back by gravity to the reservoir. As such, there must be a continuous slope in the piping
for efficient draining and the collector must therefore always be situated above the
storage tank. Drainback systems are able to avoid overcapacity and freezing and are
effective and reliable. They can operate twenty years without servicing typically.
Figure 5.7 Closed loop drain back systems. Source: Homepower.com, 2012.

66
A plate type heat exchanger is used in the simulation and have the specifications as
shown in Table 5.4. The Overall Heat Transfer Co-efficient obtained for the rated heat
transfer rate is assumed to be constant for the whole range of different mass flow rate of
fluid across the heat exchanger.
Table 5.4 Heat exchanger parameters.
Paramater Value Unit
Type Plate -
Channels x Pass
(Hot & Cold) 25 x 1
-
Total Active Area, Ah 19.11 m2
Overall Heat Transfer
Coefficient, Uh
3000 W/(m
2K)
Heat Exchanger Rate 470 kW
Net Weight 584 kg
Figure 5.8 Plate type heat exchanger. Source: Tranter PHE, Inc.

67
CHAPTER 6: RESULTS & DISCUSSIONS
The requirement and component properties used for the simulations are repeated here
for reader convenience purposes.
Table 6. 1 Solar thermal system requirements
Criteria Value Unit
Power 470 kW
Fluid Out temperature 80 C
Fluid In Temperature 25 C
Fluid used Water -
Fluid heat capacity 4.18 kW/m2.K
Required flow rate 2.044 kg/s
Table 6. 2 Himin Solar Collector HUJ16/1.8
Paramater Value Unit
D_tube 58 mm
D_Copper 8 mm
U-pipe thickness 0.5 mm
Length 1800 mm
Collector Joint 15 mm
Outline Dimension 1978x1636x134 mm x mm x mm
No of tubes 16 -
Weight 61.65 kg
Rated working pressure 0.6 MPa
a1 2.103 W/(m2K)
a2 0.0107 W/(m2K
2)
n_0 0.779 -
Aperture Area 1.51 m2
Gross Area 3.24 m2
Table 6. 3 Heat exchanger parameters.
Paramater Value Unit
Type Plate -
Channels x Pass (Hot
& Cold) 25 x 1
-
Total Active Area, Ah 19.11 m2
Overall Heat Transfer
Coefficient, Uh 3000
W/(m2K)
Heat Exchanger Rate 470 kW
Net Weight 584 Kg

68
6.1 Open Loop Direct System
The open loop direct system is sized with parameters shown in Table 6.4 below:-
Table 6. 4 Sizing parameters for open loop system.
Paramater Value Unit
Max solar insolation 1304.1 W/m2
Collector input temperature 25 °C
Collector output temperature 80 °C
Panels required 323
Each panel efficiency at max
solar insolation
73.86 %
With the application of Malaysia Typical Weather Year data, the resulting output and
solar fraction is shown in Figure 6.1 and Table 6.5.
Table 6. 5 Open loop direct system solar fraction of system for a typical year (80°C)
Month Min
(kWh/m2)
Max
(kWh/m2)
Average
(kWh/m2)
Average
kW Output
Solar
Fraction, %
January 4.21 5.56 4.96 134,117 28.54
February 4.67 6.62 6.23 152,868 32.53
March 4.33 6.51 5.02 174,584 37.15
April 2.63 5.11 4.11 152,262 32.40
May 3.69 6.84 4.83 141,180 30.04
June 2.98 6.71 5.14 137,755 29.31
July 4.41 5.86 5.17 139,457 29.67
August 2.15 6.81 5.25 134,493 28.62
September 3.95 5.53 4.89 127,682 27.17
October 4.68 6.43 5.43 133,376 28.38
November 4.68 6.43 5.43 121,804 25.92
December 0.61 5.34 3.00 115,809 24.64

69
Figure 6. 1 Open Loop Direct System Solar fraction and average insolation (80°C)
This first attempt from the outset would give a false impression that the solar thermal
system is unable to provide a good enough solar fraction, of just 37.97% maximum.
However, this is due to our sizing intention of no overloading at any day in a year.
Instead, we should look at how the variation in solar fraction behaves in a year, rather
than the total contribution it has to the system. The variation in this case is 12.46%
using 323 panels. If 960 panels are used, the maximum solar fraction would be 114.28%
and gives a variation of 37.5%. Despite the multitude of equation used, the result is just
a direct scaling of the original 323 panels. This also demonstrates that it is unrealistic to
rely on solar alone as the provider of process heat, due to the huge variation in output,
unless clever ways of solar storage is designed.
Since it is the intent that the solar thermal system is used as a fuel saver, it should be
sized with no wastage at anytime. If the design is to maximize solar fraction, during
periods of over capacity, the excess thermal energy will have to be discarded, which can
be seen as a waste. Due to this, the original design philosophy of no overload in any one
day is retained.
0
1
2
3
4
5
6
7
8
9
10
0
5
10
15
20
25
30
35
40
45
50
1 2 3 4 5 6 7 8 9 10 11 12
Sola
r Fr
acti
on
%
Month
Solar fraction & average insolation
Solar Fraction, %
Average (kWh/m2)
Ave
rage
Inso
lati
on
kW
h/m
2

70
6.2 Closed Loop Drainback System
The closed loop drainback system is sized with parameters shown in Table 6.6 below:-
Table 6. 6 Sizing parameters for open loop system.
Paramater Value Unit
Process Flow Output & Input
Temperature
25 & 80 °C
Max solar insolation 1304.1 W/m2
Collector input temperature 40.76 °C
Collector output temperature 95.76 °C
Panels required 338 -
Each panel efficiency at max
solar insolation
70.53% %
With the application of Malaysia Typical Weather Year data, the resulting output and
solar fraction is shown in Figure 6.2 and Table 6.7.
Table 6. 7 Closed Loop System Solar Fraction of system for a typical year (80°C)
Month Min
(kWh/m2)
Max
(kWh/m2)
Average
(kWh/m2)
Average
kW Output
Solar
Fraction, %
January 4.21 5.56 4.96 122,180 26.00
February 4.67 6.62 6.23 141,175 30.04
March 4.33 6.51 5.02 163,301 34.74
April 2.63 5.11 4.11 140,582 29.91
May 3.69 6.84 4.83 129,418 27.54
June 2.98 6.71 5.14 125,836 26.77
July 4.41 5.86 5.17 127,606 27.15
August 2.15 6.81 5.25 122,380 26.04
September 3.95 5.53 4.89 115,548 24.58
October 4.68 6.43 5.43 121,565 25.86

71
Month Min
(kWh/m2)
Max
(kWh/m2)
Average
(kWh/m2)
Average
kW Output
Solar
Fraction, %
November 4.68 6.43 5.43 109,601 23.32
December 0.61 5.34 3.00 103,636 22.05
Figure 6. 2 Closed Loop Direct System Solar fraction and average insolation (80°C)
0
1
2
3
4
5
6
7
8
9
10
0
5
10
15
20
25
30
35
40
45
50
1 2 3 4 5 6 7 8 9 10 11 12
Sola
r Fr
acti
on
%
Month
Solar fraction & average insolation
Solar Fraction, %
Average (kWh/m2)
Ave
rage
Inso
lati
on
kW
h/m
2

72
6.3 Comparison of Open Loop and Closed Loop Drainback System
The two systems results are tabulated in Table 6.8.
Table 6. 8 Open loop and close loop solar fraction at 80°C output temperature.
Parameter Open Loop
Direct System
Closed Loop
Drainback System
Maximum Solar Fraction 37.15 34.74
Minimum Solar Fraction 24.64 22.05
The difference between open loop and closed loop is around 2.4%, coming to
approximately 11.33kW. A further sensitivity analysis on output temperature on system
efficiency is done. A summary of different output temperature, between open loop and
closed loop system is shown in Table 6.9.
Table 6. 9 Open loop and close loop system performance at various output temperatures.
Outp
ut
Tem
p
Open Loop Closed Loop Difference %
between Closed
and Open Loop
Aver
age
Sola
r
Fra
ctio
n, O
pen
Loop
Aver
age
Coll
ecto
r
Eff
icie
ncy
, O
pen
Loop
Pan
els
use
d
Aver
age
Sola
r
Fra
ctio
n, C
lose
d
Loop
Aver
age
Coll
ecto
r
Eff
icie
ncy
, C
lose
d
Loop
Pan
els
Use
d
Sola
r F
ract
ion
Aver
age
Coll
ecto
r
Eff
icie
ncy
,
70 31.19 57.43 319 28.86 44.92 332 8.07 27.85
80 30.32 52.10 323 27.8 41.00 338 9.06 27.07
90 29.55 47.87 328 26.8 37.18 346 10.26 28.75
100 28.70 44.50 332 25.65 33.56 353 11.89 32.60
110 27.98 41.46 338 24.61 30.30 362 13.69 36.83
120 27.12 38.46 343 23.54 27.4 371 15.21 40.36
130 26.27 35.51 349 22.52 24.86 381 16.65 42.84
140 25.38 32.71 355 21.46 22.53 391 18.27 45.18
150 24.53 30.17 362 20.43 20.31 403 20.07 48.55
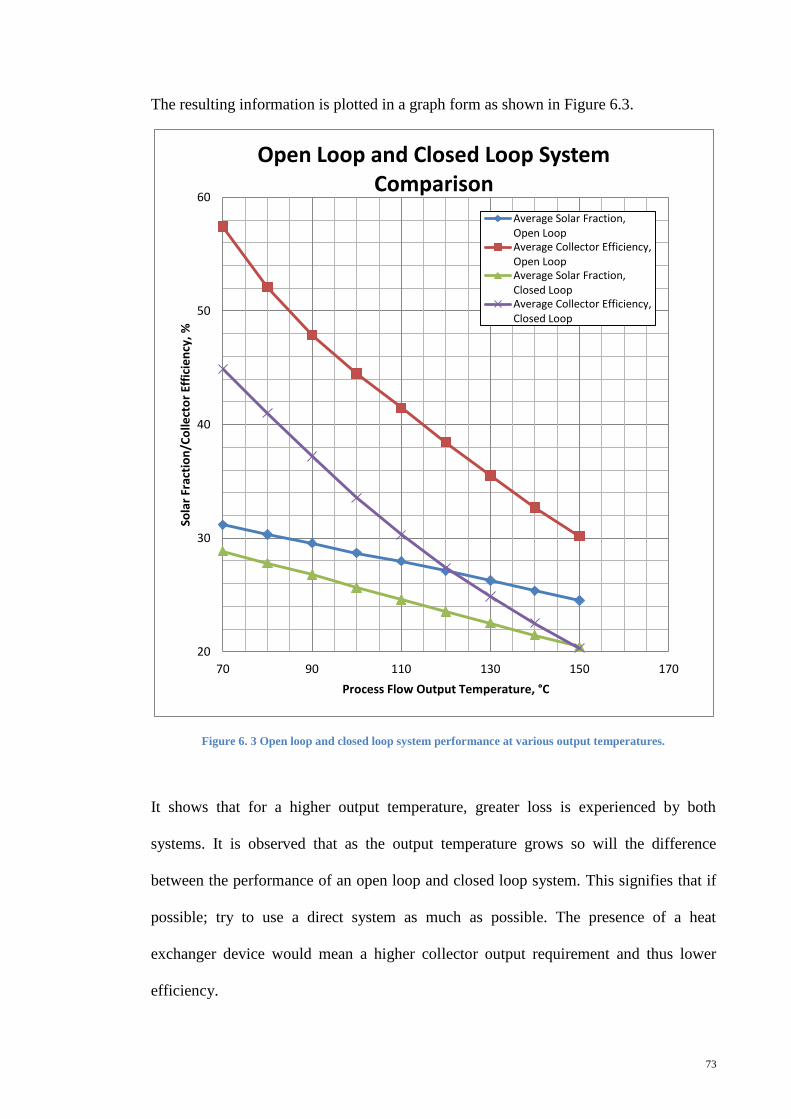
73
The resulting information is plotted in a graph form as shown in Figure 6.3.
Figure 6. 3 Open loop and closed loop system performance at various output temperatures.
It shows that for a higher output temperature, greater loss is experienced by both
systems. It is observed that as the output temperature grows so will the difference
between the performance of an open loop and closed loop system. This signifies that if
possible; try to use a direct system as much as possible. The presence of a heat
exchanger device would mean a higher collector output requirement and thus lower
efficiency.
20
30
40
50
60
70 90 110 130 150 170
Sola
r Fr
acti
on
/Co
llect
or
Effi
cie
ncy
, %
Process Flow Output Temperature, °C
Open Loop and Closed Loop System Comparison
Average Solar Fraction, Open Loop Average Collector Efficiency, Open Loop Average Solar Fraction, Closed Loop Average Collector Efficiency, Closed Loop

74
6.4 Cost and Benefit Analysis
The system for output of 70°C hot water is used for the cost analysis. This is because to
give a fair comparison, the performance comparison was downgraded to the limitation
of the heat pump sourced which can only go to a maximum of 70°C. Table 6.10
summarizes the cost of various methods in generating thermal energy.
Table 6. 10 Consumption Cost and Overall Cost for 70°C output temperature
No Method Consumption Cost
RM cents /kWhth
Overall Cost /Profit
RM Cents/kWhth
1 Medium Temperature Solar
Thermal System (Open Circuit)
0 3.54
2 Medium Temperature Solar
Thermal System (Closed
Circuit)
0 (5.27)
3 Electric Heater (28.3) (28.76)
4 Steam Boiler (24.565) (25.11)
5 Solar PV driven electric heater 94.7 0
6 Heat Pump (8.09) (10.63)
Consumption cost refers to the cost of fuel. Overall cost takes into consideration of the
installation cost of the systems. The economical analysis is done for an assumed useful
life of 10 years, although it can be reasonable expected that the well maintained
equipment will be able to be in service for 20 years or more. There are no
considerations of maintenance costs in the calculation. Refer Appendixes for detailed
calculations.
From the cost and benefit analysis, it can be seen that open circuit solar thermal system
is the most attractive, giving a return of 3.54¢ per kWhth. This is followed by Solar PV

75
driven electric heater breaking even the investment cost at the 10th
year through selling
the electricity generated to TNB and using the proceeds to purchase grid electricity for
heaters, giving 0¢ per kWhth. Subsequently, closed circuit solar panel system is at the 3rd
position, costing 5.27¢ per kWhth followed by Heat pump system at 10.63¢ per kWhth;
Steam Boiler at 25.11¢ per kWhth and finally pure electric heater, at 28.76 kWhth.
Solar PV system is ranked high because of the heavy subsidies the Government has
provided through the Feed-in-Tariff. The other alternatives such as diesel and grid
electricity are also subsidized by the government. Even without subsidies, the return of
solar thermal system can be on par, making it an economically viable solution. The
attractiveness of this system will be greatly felt when the subsidies for fuel is removed
by the government and mass adoption by the industry pushes down component and
installation cost.
The downside of solar thermal system is the real estate needed for the deployment of the
panels, which in this case stands at around 34m x 34m of space. Part of the solar panels
can be integrated into the building roof, generating useful energy while acting as an
insulator to lower radiative heat gain to the building, reducing cooling cost. Also, the
system is limited to low temperature applications, given the government subsidized
cheap alternatives available currently in Malaysia.
The big initial cost would be a deterrent for implementation of solar thermal as
compared to conventional boilers. It is observed that a big chuck of the system cost is
spent on transportation of collector panels from China. If there is a manufacturing plant
in Malaysia, we can expect that the cost to be lower and would make the system more
acceptable to the industry.

76
Maintenance cost for the different system is not included into the cost and benefit
analysis. The inclusion of these costs would provide a better estimate of the
attractiveness of solar thermal systems. Qualitatively, it should be noted that solar
thermal system involves minimal moving parts. It is foreseen that the maintenance
involved would be much less than boiler/heat pump technologies.

77
CHAPTER 7: CONCLUSIONS
Malaysia’s solar energy potential and SIPH demand has been explored and found
attractive. Technology to achieve SIPH is available and improving. Also, installed
system around the globe is a good source for reference for deployment in Malaysia.
Finally, the cost and benefit analysis has shown that SIPH is the cheapest among the
other alternatives. It is demonstrated that Solar Industrial Process Heat is technically
feasible and economically feasible. The research objectives have been achieved.
Policy makers in Malaysia should have a closer look at the benefits of SIPH as a means
to achieve greater renewable energy utilization. Support and direction from the
government is always a good catalyst for wider acceptable by the industry.
Lastly, in my opinion there should be a common glass screen for each collector panel,
rather than having each evacuated tube exposed to the environment by its own. This is
because with the frequent rain in Malaysia, the glass surface of the tubes will be easily
dirtied by the elements. A common glass screen will ease the cleaning of the panels and
is much more practical.

78
BIBLIOGRAPHY
A. Acra, M. Jurdi, H. Mu'allem, Y. Karahagopian, and Z. Raffoul,1990. Water
Disinfection by Solar Radiation, Assessment and Application. [Online] Available
at: <http://almashriq.hiof.no/lebanon/600/610/614/solar-water/idrc/01-09.html.>
[Accessed 11 May 2012]
Abdelaziz EA, Saidur R, Mekhilef S. A review on energy saving strategies in industrial
sector. Renewable and Sustainable Energy Reviews 2011;15(1): 150–68.
Advanced Thermal Solar, LLC, 2012. Sizing your system. [Online] Available at:
<http://www.advthermalsolar.com/sizing-your-system.php> [Accessed 15 April
2012]
AGO. (2006). Vacuum tube solar thermal collector. Fact Sheet No 05, Solar Thermal.
Canberra, Australia Greenhouse Office.
Amin, N.,Lung,C.W.,Sopian,K. 2009. A practical field study of various solar cells on
their performance in Malaysia. Renewable Energy, 34(8), 1939–1946.
Appleyard D. 2009. Action Plan for 50% :how solar thermal can supply Europes
energy. Renewable Energy World, March-April 2009: 100-5.
Aschoff Solar, 2012. Solar Energy-easy and efficient. [Online] Available at:
<http://www.terramar.com.vn/aschoff_solar.html>[Accessed 1 May 2012]
Ayu Wazira Azhari, Kamaruzzaman Sopian, Azami Zaharim, Mohamad Al Ghoul.
2008. A new approach for predicting solar radiation in tropical environment
using satellite images – case study of Malaysia. WSEAS Transaction on
Environmental Development 2008, 4, 373-378.

79
Beath A.C. (2012). Industrial energy usage in Australia and the potential for
implementation of solar thermal heat and power. Energy, 43, 261-272.
Building and Engineering Services Association (B&ES). Solar Thermal. [Online]
Available at :<http http://www.b-es.org/sustainability/solar-thermal-guidance/>
[Accessed 15 April 2012]
Chandran VGR, Sharma S, Madhavan K. Electricity consumption-growth nexus: the
case of Malaysia. Energy Policy 2010;38:606–12.
Claudia Vannoni, Riccardo Battisti and Serena Drigo (2008). Potential for Solar Heat
in Industrial Processes. CIEMAT, Madrid.
EarthTrends. Energy and resources; 2010. Malaysia.earthtrends.wri.org.
Economic Transformation Programme: A roadmap for Malaysia. (2010). PEMANDU.
Encyclopedia Article. (2008). Solar Energy. McGraw-Hills Access Science
Encyclopedia of Science and Technology Online.
Everett, B. (2004). Solar Thermal Energy. In Renewable Energy – Power for A
Sustainable Future (2nd
ed.) (pp. 17-64). New York: Oxford University Press.
Firdaus Muhammad-Sukki, Roberto Ramirez-Iniguez,Siti Hawa Abu-Bakar,Scott G.
McMeekin,Brian G.Stewart. (2011). An evaluation of the installation of solar
photovoltaic in residential houses in Malaysia: Past, present, and future. Energy
Policy, 39, 7975–7987.
Fuller R.J. (2010). Solar industrial process heating in Australia – Past and current
status. Renewable Energy, 36, 216-221.
Goyal R.K., Tiwari G.N. (1999). Performance of a reverse flat plate absorber cabinet
dryer: a new concept. Energy Conversion Management 1999;40(4):385–92.
80
Hans-Jörg Bullinger (Editor) (2009). Technology Guide - Principles, Applications,
Trends. Springer-Verlag Berlin Heidelberg, 316.
Harris, A.H. (2008). MBIPV Project: Catalyzing Local PV Market, Finance &
Investment Forum on PV Technolgy, Kuala Lumpur, Malaysia.
IEA. (2006). International energy annual 2004. Energy Information Administration
IEA SHC. (2008). Process Heat Collectors State of the Art within Task 33/IV .AEE
INTEC, Gleisdorf, Feldgasse 19, Austria.
Islam, MD. Radiqul & Exell, R.H.B. (1996). Solar radiation mapping from satellite
image using a low cost system. Solar Energy 56(3):225-237.
Jingyi Han, Arthur P.J. Mol, Yonglong Lu. (2009). Solar water heaters in China: A new
day dawning. Energy Policy, 38, 383–391
Kalogirou Soteris A. (2004) Solar thermal collectors and applications. Progress in
Energy and Combustion Science, 30(3), 231–95.
Kalogirou, S. (2003). The potential of solar industrial process heat applications.
Applied Energy, 76(4), 337–361.
Keong CY. (2005) Energy demand, economic growth, and energy efficiency – the
Bakun dam-induced sustainable energy policy revisited. Energy Policy, 33, 679–
89.
Koh SL, Lim YS. (2010) Meeting energy demand in developing economy without
damaging the environment – a case study in Sabah, Malaysia, from technical,
environment and economic perspectives. Energy Policy , 38, 4719–28.
81
Kulkarni Govind N, Kedare Shireesh B, Bandyopadhyay Santanu. (2008). Design of
solar thermal systems utilizing pressurized hot water storage for industrial
applications. Solar Energy, 82, 686–99.
Liu SY, Li LD. (2000). Application researches of solar drying and their applications in
industry and agriculture. New Energy Res, 22(1):9–15 [in Chinese].
Luo, Z. (2008). China solar water heater market report. Solar Thermal Utilization
Committee in China Association of Rural Energy Industry,Beijing.
Malaysian Meteorological Department. General Climate of Malaysia [Online] Available
at :<http://www.met.gov.my/index.php?option=com_content&task=view&id=75
&Itemid=1089&lang=English> [Accessed 15 April 2012]
Nancy Cannon. (2007). Encyclopedia of Science & Technology, 10th Edition, Volume
16 (S-SON), McGraw-Hill.
Malaysia Energy Information Hub. Statistics of Energy Usage [Online] Available at: ,
http://meih.st.gov.my/statistics;jsessionid=D46B33627FBB560232814BE4809A3
69F> [Accessed 3rd
April, 2012]
Meyer J.P. (2009). Solar thermal: large scale installations- gaining ground across the
globe. Sun and Wind Energy, 5, 68-81.
Mohd Zainal Abidin Ab Kadir, Yaaseen Rafeeu, Nor Mariah Adam. (2010).
Prospective scenarios for the full solar energy development in Malaysia.
Renewable and Sustainable Energy Reviews, 14, 3023-3031.
Shafiq, Nik Mohd Qamarul. (2010). Performance Evaluation of Solar Flat Plate
Collector. University Malaysia Pahang.

82
Nowshad Amin, Chin W.L. & K. Sopian. (2009) A practical field study of various solar
cells on their performance in Malaysia. Renewable Energy. 34, 1939-1946.
Nugroho AM. (2010). The impact of solar chimney geometry for stack ventilation in
Malaysia’s single storey terraced house. Malaysia’s Geography
2010;(January):163–77.
Oliveria A.C. (2007). A new look at the long-term performance of general solar thermal
systems. Solar Energy, 81, 1361-1368.
Pacheco, J.E. (2001). Demonstration of solar-generated electricity on demand: The
Solar Two project. Journal of Solar Energy Engineering-Transactions of the
ASME, 123(1), 5-5.
Patterson, John, n.d. Solar hot water basics. [Online] Available
at:<http://homepower.com/basics/hotwater/> [Accessed 13 April 2012]
Proctor D, Morse RN. (1977). Solar energy for the Australian food processing industry.
Solar Energy 1977;19:63–72.
Qamarul Shafiq, N.M. (2010). Performance Evaluation of Solar Flat Plate Collector.
Faculty of Mechanical Engineering, Universiti Malaysia Pahang
R. Keith Mobley Ed. (2001). Plant Engineer’s Handbook. Butterworth-Heinemann
Rahman I.A., J. Dewsbury. (2007). Selection of typical weather data (test reference
years) for Subang, Malaysia. Building and Environment, 42, 3636–3641.
Renewable Energy Industries Academny. (2007) Solar Hot Water version 2.0, Installer
Training Manual.
Renewable Energy World 02/2004 pp. 95-99

83
S. Mekhilef, A. Safari, W.E.S. Mustaffa, R. Saidur, R. Omar, M.A.A. Younis. (2012).
Solar energy in Malaysia: Current state and prospects. Renewable and
Sustainable Energy Reviews, 16, 386-396.
Saidur R, Ahmed JU, Masjuki HH. (2010). Energy, exergy and economic analysis for
industrial boilers for Malaysia. Energy Policy 2010;38(5):2188–97.
Saidur, R., Leong, K.Y., & Mohammad, H.A. (2011). A review on applications and
challenges of nanofluids. Renewable and Sustainable Energy Reviews, 15, 1646-
1668.
Salsabila Ahmad, Mohd Zainal Abidin Ab Kadir, Suhaidi Shafie. (2011). Current
perspective of the renewable energy development in Malaysia. Renewable and
Sustainable Energy Reviews, 15, 897-904.
Schnitzer H, Christoph B, Gwehenberger G. (2007). Minimizing greenhouse gas
emissions through the application of solar thermal energy in industrial processes.
Approaching zero emissions. Journal of Cleaner Production 2007;15(September
(13–14)):1271–86.
Tenaga Nasional Berhad. (2012). Tenaga Nasional Electricity Tariff Rates for Industries.
The Malaysia Economic in Figures 2010. Economic planning unit. Prime Minister
Department, 2011. [Online] Available at:
<http://www.epu.gov.my/malaysianeconomyfigures2009>[Accessed 5 May 2012]
UK Solar Energy, n.d. How does my new solar system works?. [Online] Available
at:<http://www.uksolarenergy.org.uk/solar-system.html> [Accessed 30 April 2012]

84
Union of Concerned Scientists, 2005. Benefits of renewable Energy Use. [Online]
Available at:<www.ucsusa.org/clean_energy/our-energy-choices/renewable-
energy/public-benefits-of-renewable.html> [Accessed 10 May 2012]
Wang Zhifeng. (2009). Prospectives for China’s solar thermal power technology
development. Energy, 35, 4417-4420.
Xiao C, Luo H, Tang R, Zhong H.(2004).Solar thermal utilization in China. Renew
Energy, 29, 1549–56.
Yunus A. Cengel. (2004). Heat Transfer; A practical approach. 2nd ed. New York:Mc
Graw Hill.
Zhi-qiang Liu, Ai-xiang Xu, Yuan-yuan Lv, Xiao-xiao Wang. (2011). Promoting the
development of distributed concentrated solar thermal technology in China.
Renewable and Sustainable Energy Reviews, 16, 1174– 1179

85
APPENDIX A - TENAGA NASIONAL ELECTRICAL
PRICING AND TARIFF – INDUSTRIAL
Table A1 Tenaga Nasional Electricity Tariff Rates for Industries. Source: TNB, 2012
TARIFF CATEGORY UNIT RATES
1 Tariff D - Low Voltage Industrial Tariff
For Overall Monthly Consumption Between 0-200
kWh/month
For all kWh sen/kWh 34.5
The minimum monthly charge is RM7.20
For Overall Monthly Consumption More Than 200
kWh/month
For all kWh (From
1kWh onwards)
sen/kWh 37.7
The minimum monthly charge is RM7.20
Tariff Ds – Special Industrial Tariff (for consumers who
qualify only)
For all kWh sen/kWh 35.9
The minimum monthly charge is RM7.20
2 Tariff E1 - Medium Voltage General Industrial Tariff
For each kilowatt of
maximum demand
per month
RM/kW 25.3
For all kWh sen/kWh 28.8
The minimum monthly charge is RM600.00
Tariff E1s – Special Industrial Tariff (for consumers
who qualify only)
For each kilowatt of
maximum demand
per month
RM/kW 19.9
For all kWh sen/kWh 28.3
The minimum monthly charge is RM600.00

86
TARIFF CATEGORY UNIT RATES
3 Tariff E2 - Medium Voltage Peak/Off-Peak Industrial
Tariff
For each kilowatt of
maximum demand
per month during
the peak period
RM/kW 31.7
For all kWh during
the peak period
sen/kWh 30.4
For all kWh during
the off-peak period
sen/kWh 18.7
The minimum monthly charge is RM600.00
Tariff E2s – Special Industrial Tariff (for consumers
who qualify only)
For each kilowatt of
maximum demand
per month during
the peak period
RM/kW 27.7
For all kWh during
the peak period
sen/kWh 28.3
For all kWh during
the off-peak period
sen/kWh 16.1
The minimum monthly charge is RM600.00
4 Tariff E3 - High Voltage Peak/Off-Peak Industrial
Tariff
For each kilowatt of
maximum demand
per month during
the peak period
RM/kW 30.4
For all kWh during
the peak period
sen/kWh 28.8
For all kWh during
the off-peak period
sen/kWh 17.3
The minimum monthly charge is RM600.00
Tariff E3s – Special Industrial Tariff (for consumers
who qualify only)
For each kilowatt of
maximum demand
per month during
the peak period
RM/kW 24.4

87
For all kWh during
the peak period
sen/kWh 26.7
For all kWh during
the off-peak period
sen/kWh 14.7
The minimum monthly charge is RM600.00
Notes: SIT has a 2% higher increase than normal Industrial tariff in line with the
Government's effort to gradually phase out the SIT subsidy
Top-Up and Standby
“Co-generator” means a generator who uses a single primary energy source to
generate sequentially two different forms of useful energy for its own use at an
efficiency rate of more than 70%. Services offered to co-generators are:
Top-up supply:
The additional supply required by a Co-generator who does not produce sufficient
electricity for its own use.
Standby supply:
The supply that TNB provides to a Co-generator in the event that the Co-generator does
not generate electricity due to plant failure or planned shutdown for maintenance. The
Co-generator has a choice of firm or non-firm supply. Non-firm standby means that
TNB does not guarantee that supply can be given when the Co-generator fails or is
shutdown for maintenance.
Notes:
This new Standby rate (as of 1 June 2011) is applicable to the following customers:
All new co-generation customers; and
Existing co-generation customers who wish to migrate to this new Standby rate

88
For existing co-generation customers who wish to maintain the previous Standby (Firm
& Non-Firm) rates, the previous Standby (Firm & Non-Firm) rates together with the
new Top-Up rate (as of 1 June 2011) will be applicable
1% as Feed-in-Tariff (FiT) for RE Fund will be imposed on consumers' monthly bill
(excluding Domestic consumers with monthly consumption of 300kWh and below)
effective 1st December 2011.
The industrial tariff rate used in the comparison is based on “Tariff E1-Medium Voltage
General Industrial Tariff”. The tariff rate for each kilowatt of maximum demand per
month is not included.
As such, the tariff rate for each kWh is 28.8¢.

89
APPENDIX B – BOILER THERMAL ENERGY
GENERATION COST
Typical fuel properties are listed as below:
Table B1 Typical fuel properties. Source: Mark’s Handbook 11th Ed
Fuel Typical
Density
High
Calorific
Value
Low
Calorific
Value
Fuel Pump
Prices
Price
¢/kWh
(HCV)
Petrol
(RON95)
740kg/ m3 46.89MJ/kg 43.71MJ/kg RM1.90/litre 19.71
Diesel 860kg/ m3 45.97MJ/kg 43.17MJ/kg RM2.49/litre* 22.67
Diesel
(Automotive)
860kg/ m3 45.97MJ/kg 43.17MJ/kg RM1.80/litre 16.39
Natural Gas 36.38MJ/m3
32.75MJ/m3
RM0.62/ m3 6.14
The price for industrial use diesel is obtained through the Department of Statistics
Malaysia, as shown in Figure B1.
Figure B1 Diesel price for industrial use. Source: Department of Statistics Malaysia

90
A typical boiler is obtained through the widely used industrial yellow pages
“Alibaba.com”. The boiler chosen is shown in Table B2.
Table B2 Typical Boiler Data. Source: Alibaba.com, Henan Sitong Boiler Co., Ltd.
Items WNS0.5-0.7-Y(Q)
Nominal Capacity (t/h) 0.5
Nominal Working Pressure (Mpa) 0.7
Saturated Steam Temperature (°C) 170
Thermal Efficiency of Boiler (%) 92
Nominal Oil and Gas Consumption
(Nm3/h) 34.5/42
Power Consumption (KW) 2.96
Applicable Fuel Light oil or heavy oil Natural gas or city gas
Power Supply (AC) 380v 50Hz
Weight and Size of maximum
transport thing (m) 3.1×1.9×1.9
Approx. Weight of maximum
transpoirting kg 4000
Exhaust Gas Temperature (°C) 230
Combustion way Pressure atomized Micro positive pressure
combustion
Regulating mode Automatic

91
The displayed price is USD 10,000, FOB. It is estimated that the price should be around
USD 15,000 DDP + Installation + Startup & Commissioning. The total Estimated Price
= RM105, 000.00.
Knowing that the heat of vaporization of steam is 2257kJ/kg, the boiler chosen is able to
output 1,128.5kW of thermal energy. This is suitable for our requirement of 470kW.
Ignoring the power consumption since it is small relative to the output and utilizing the
thermal efficiency given, the cost of thermal energy generation through a boiler is
tabulated in Table B3.
It is assumed the useful life is 10 years and without consideration of maintenance cost.
Assuming again an average utilization of 10 hours per day, 365 days a year, the overall
cost of boiler output is tabulated in Table B3.
Table B3 Typical cost of thermal energy generation through boilers
Fuel Price
¢/kWh (HCV)
Boiler Output
¢/kWh
Boiler Ouput
(Including cost of
ownership)
Diesel 22.67 24.65 25.11
Natural Gas 6.14 6.67 7.14

92
APPENDIX C – ELECTRIC HEATER
Price quote was obtained from rs-component for a domestic usage immersion tank
heater. The datasheet is as below. The price is RM137.50 including delivery for a
3000kW unit. It is assumed that an industrial unit will need to be of a higher quality of
construction and as such will command double the price. A calculation of the final price
is shown in Table C1.
Table C1 Electric heater installation price
Item RM
Unit Price for domestic use 137.50
Unit Price for industrial use 275.00
Total price for 470kW 44,000.00
Total price including
installation & startup
103,125.00
The efficiency is chosen to be 1. It is assumed the useful life is 10 years and without
consideration of maintenance cost. Assuming again an average utilization of 10 hours
per day, 365 days a year, the overall cost of electrical heater output is tabulated in Table
C2.
Table C2 Typical cost of thermal energy generation through electric heater
Fuel Price
¢/kWh
Heater Output
¢/kWh
Heater Ouput
(Including cost of
ownership)
Electric 28.3 28.3 28.76

93
Figure C1 Immersion heater datasheet. Source: rs-component.com.my

94
APPENDIX D – SOLAR PV THERMAL ENERGY
GENERATION COST
The cost of implementing solar PV is available abundantly, although mostly dealt with
domestic usage. The works of Firdaus Muhammad-Sukki, et al. (2011) is shown in
Table D1.
Table D1 Cost of PV electricity generation for a 2.5kWp PV panel. Source: Muhammad-Sukki, 2001
It is assumed that the scaling up to 470kW is directly proportional. A calculation of the
price of installation is shown in Table D2.
Table D2 PV panel installation price
Item RM
Unit Price a 2.5kWp PV
panel system
47,800
Price for a 470kWp PV
panel system
8,986,400
The output of the 470kWp PV system is scaled to be 772,210 kWh per year. It is
assumed the useful life is 10 years and without consideration of maintenance cost and
the feed-in tariff rate from Kettha for a system of 75kWp – 1MWp is RM1.14. The

95
output from the PV is assumed to be sold back to the grid and using the proceeds to pay
for the thermal energy generation. The useful life of the whole system is 21 years. The
cost of output of this system is tabulated in TableD3.
Figure D1 Malaysia Average BIPV Price/kWp from 2005 to 2010. Source: www.mbipv.net.my
Table D3 Cost of electricity generation
Item Value Unit
Feed-in Tariff Price
1.23 RM/kWh
TNB Electricity Price 0.283 RM/kWh
Net Profit 0.947 RM/kWh
Total Electricity Generation 722,210 kWh
Payback period 10 Years
Cost of Electricity generation for
10 years 0.283 RM
Since the payback period is 10 years, the first 10 years when the system is installed is
used to payback for the cost of the system itself, and the cost of electricity is the same as
using the electricity straight from TNB grid. As such, the cost of a system out of the
picture and only the consumption cost is of concern, as tabulated in Table D4.
Au
g-0
5
Ap
r-0
6
Jun
-06
Oct
-06
No
v-0
6
Maa
r-0
7
May
-07
Jun
-07
Sep
-07
Oct
-07
Mar
-08
Ap
r-0
8
May
-08
Sep
-08
Oct
-08
Dec
-08
Ap
r-0
9
Jun
-09
Jul-
09
Au
g-0
9
Oct
-09
Mar
-10
Procurement Date
RM
/kW
p
33,000
31,000
29,000
27,000
25,000
23,000
21,000
19,000
17,000

96
Table D4 Typical cost of PV thermal energy generation through electric heater
Fuel Price
¢/kWh
Electricity bought from TNB while
PV generated is sold back. 28.3

97
APPENDIX E – HEAT PUMP ENERGY GENERATION
COST
Figure E1 Heat pump datasheet
A reference price from Alibaba.com indicates that the cost is around USD 150/kW.
For 470kW = USD 70,500
= RM 218,550
Per kWh = RM218,550/(470kW × 10 hours × 365 days/yr × 10 years)
ownership = RM 0.0127/ kWh × 2 (including installation etc)
cost = RM 0.0254
Assuming a COP of 3.5,
Cost per kWh = RM0.283/kWh /4 + RM 0.0254 = RM 0.1063

98
APPENDIX E – SOLAR THERMAL ENERGY
GENERATION COST
Open Loop Table E1 Solar Thermal System Costs – Open Loop
Item RM
Solar Collector/unit 1240
Solar Collector Transportation/unit 2464
Total Units required 319 Nos
Containers required 8 Nos
Estimated Transportation Cost 250,000
Collectors cost 400,000
Other components, Installation,
Commissioning and etc
450,000
Total Cost 1,100,000
The savings incurred by using this system is translated to boiler fuel saving, which
stands at RM0.2465/kWh. Although there needs to be input to keep the circulating fluid
moving, the pump used is less than 5kW. As such, the pump presence is ignored.
System total kWh per year = 521,184kWh/year
Cost Saving per year = 521,184kWh × RM 0.2465/kWh
= RM 128,471
10 years service = RM 1,284,717
Payback period = 9 years
ROI, 10 years = 1.68%
Per kWh cost/ profit = (RM 1,284,717 – RM 1,100,000)/5,211,848kWh
= 3.54 cents

99
Closed Loop Table E2 Solar Thermal System Costs – Closed Loop
Item RM
Solar Collector/unit 1240
Solar Collector Transportation/unit 2464
Total Units required 332 Nos
Containers required 9 Nos
Estimated Transportation Cost 300,000
Collectors cost 420,000
Other components, Installation,
Commissioning and etc (including HE)
720,000
Total Cost 1,440,000
The savings incurred by using this system is translated to boiler fuel saving, which
stands at RM0.2465/kWh. The inclusion of the flat plate heat exchanger has increased
the cost of the system by RM270,000.
System total kWh per year = 481,228kWh/year
Cost Saving per year = 481,228kWh × RM 0.2465/kWh
= RM 118,623
10 years service = RM 1,186,230
Payback period = 13 years
ROI, 10 years = -1.76%
Per kWh cost/profit = (RM 1,186,230 – RM 1,440,000)/4,812,288kWh
= -5.27 cents