feasibility study of using subgrade moisture content as...
TRANSCRIPT
Feasibility study of using subgrade moisture content as key parameter to evaluate HMA roads performance under different drying/wetting cycles
Submit Manuscript | http://medcraveonline.com
BackgroundBased on a Texas Department of Transportation (TxDOT)
district-wide survey1 the most prevailing Farm-to-Market (FM) HMA pavement distresses are: longitudinal cracking, followed by fatigue cracking, subgrade rutting, subgrade shear failure, excessive differential volumetric change and roughness. The response rate was 92% of all TxDOT districts. Among those responses, 78% reported highly variable properties of the expansive subgrade soil, as well as moisture fluctuations throughout the year were considered the main causes for above-mentioned distresses. Subgrade differential volume changes combined with large strength and stiffness variations make light structures such as HMA pavement sitting on top of the problematic subgrade soil highly susceptible to environmental variations despite
of the overly conservative design widely recommended and used. The consensus among researchers and practitioners with considerable experience in the area of high-PI clay is to implement different preventative and remedial strategies to minimize subgrade moisture content (MC) variations. The need for an easy-to-use procedure to quantify critical MC thresholds for above-mentioned distresses led to the effort described in this manuscript. The MC approach was not only used to describe subgrade soil properties but also linked directly to pavement performance. Both the district survey and literature review shown the longitudinal cracking is the predominant mode of failure for flexible pavements, especially low-volume roads. Much effort has been made to study pavement longitudinal cracking, from cracking initiation and propagation mechanism to process simulation and prediction. This is due to the difficulties and high variabilities of
MOJ Civil Eng. 2018;4(2):66–73.
Volume 4 Issue 2 - 2018
Yachi Wanyan,1 Imad Abdallah,2 Soheil Nazarian,2 Anand J Puppala3
1Department of Engineering, Texas Southern University, USA2Department of Engineering, The University of Texas at El Paso, USA3The University of Texas at Arlington, USA
Correspondence: Yachi Wanyan, Department of Engineering, Texas Southern University, Technology Building Rm 107, 3100 Cleburne Street, Houston, Texas 77004, Fax 713- 313-448-6, Tel 713-313-711-2, Email [email protected]
Received: November 13, 2017 | Published: March 19, 2018
Abstract
The desire for a deep understanding of premature failure of HMA pavements led to the study presented in this paper. In spite of the redundant pavement designs recommended and widely used in Texas, these pavements often fail prematurely. This failure occurs primarily because of the highly variable properties of the clayey subgrade throughout the year due to environmental induced moisture fluctuations. The study presented here applied a new methodology of using moisture content (MC) as key parameter, together with easily obtainable soil index properties to describe subgrade constitutive models. As pointed out by many researchers different drying/wetting paths of unsaturated soil has major effect on subgrade mechanical properties, especially problematic clayey subgrade. When soil specimens undergo different drying or wetting paths, the correlations between
MC fluctuations and soil mechanical property parameters such as shrinkage stress ( tσ ),
shrinkage strain ( sε ) and modulus (E) all change. In the drying case, for example, same
expansive subgrade soil has bigger E but smaller sε values at same moisture content when comparing drying from optimal (DFO) to drying from saturation (DFS). Robust yet accurate subgrade constitutive models are needed for numerical modeling. Compared to the prevailing suction-based approach, the MC-based approach offers more flexibility of incorporating different drying/wetting paths into numerical modeling to analyze, predict and evaluate the following most frequent distress experienced on low-volume HMA roads such as longitudinal shrinkage cracking, fatigue cracking, rutting, subgrade shear failure, excessive differential volumetric change and roughness. Extensive laboratory tests and field measurements were performed to collect needed information and verify numerical modeling results. A case study was presented to further discuss the feasibility of using MC approach in evaluating HMA pavement performance. It is believed using MC as key parameter is feasible in HMA pavement performance evaluation, evaluation and prediction results matched very well with baseline sites field measurements. It was also noted that the most crucial steps in improving the overall performance of light structures such as HMA pavements built over problematic soils are to enhance subgrade mechanical properties and to minimize subgrade moisture fluctuations, as opposed to an overly conservative HMA mix design or pavement structure.
Keywords: expansive soil; longitudinal shrinkage cracking; fatigue and rutting, subgrade shear failure, soil index properties; moisture content; swelling; roughness
© 2018 Wanyan et al. This is an open access article distributed under the terms of the Creative Commons Attribution License, which permits unrestricted use, distribution, and build upon your work non-commercially.
66
MOJ Civil Engineering
Research Article Open Access

Citation: Wanyan Y, Abdallah I, Nazarian S,et al. Feasibility study of using subgrade moisture content as key parameter to evaluate HMA roads performance under different drying/wetting cycles. MOJ Civil Eng. 2018;4(2):66–73. DOI: 10.15406/mojce.2018.04.00099
Feasibility study of using subgrade moisture content as key parameter to evaluate HMA roads performance under different drying/wetting cycles
Copyright:©2018 Wanyan et al. 67
measured shrinkage strain potentials and predicted shrinkage induced pressures. As pointed out by many researchers different drying/wetting paths of unsaturated soil has major effect on subgrade mechanical properties, especially problematic clayey subgrade. When soil specimens undergo different drying or wetting paths, the correlations between MC fluctuations and soil mechanical property parameters such as shrinkage stress ( tσ ), shrinkage strain ( sε ) and modulus (E) all change. The suction-based model by Alonso et al.2, generally referred to as the Barcelona Basic Model (BBM), remains as one of the fundamental models for unsaturated soils. Although a number of constitutive models for unsaturated soils exist in the literature, some fundamental questions have not been fully answered. In the drying case, for example, same expansive subgrade soil has bigger E but smaller sε values at same moisture content when comparing drying from optimal (DFO) to drying from saturation (DFS). Robust yet accurate subgrade constitutive models are needed for numerical modeling. Moreover, the measurement of total or matric suction is a challenging task due to limitations such as long equilibrium/response times (several days up to couple of weeks), highly susceptible to environmental changes, laborious installation, test procedures, cost of currently available sensors and the magnitudes of suctions that they can measure in the field.3‒5 Currently there is no moisture-content based material model available. To address these problems the researchers studied the feasibility of developing MC-based constitutive models that can be easily linked to different subgrade wetting/drying conditions. Compared to the prevailing suction-based approach, the MC-based approach offers more flexibility of incorporating different drying/wetting paths into numerical modeling to analyze, predict and evaluate some of the most frequently experienced distressed on low-volume HMA roads such as longitudinal shrinkage cracking, fatigue cracking, rutting, subgrade shear failure, excessive differential volumetric change and roughness. Numerical modeling was applied to five highly representative test sites. Longitudinal cracking prediction results showed very good correlations with field measurements.6
MethodologyThree major steps were taken to develop MC based constitutive
models:
I. Extensive laboratory testing and field measurements were carried out under a number of different drying/wetting cycles (namely DFO, SFO, and DFS);
1. Generalized mathematical relationships for subgrade shrinkage strain ( sε ), tensile strength ( tσ ) and elastic modulus (E) as a function of moisture content were obtained using samples retrieved from five high PI sites6,7
The fitted parameters of those empirical relationships were carefully evaluated and then correlated to the index properties of the same soil sample being tested. Samples from the sixth test site were used as validation. The constitutive model results have shown satisfactory accuracy. This simple process can be readily used in practice. This research effort confirmed for the first time, the possibility of predicting important soil properties such as moduli and shrinkage induced strain by moisture content directly (as opposed to suction). All mathematical relationships showed reasonably good prediction capabilities within Plasticity Index (PI) range from 15 to 40. Typical results from Fort Worth samples (PI=29) are used for demonstration in this manuscript.
Laboratory testing and field measurements
Extensive laboratory tests were conducted using six different clay materials including five high Plasticity Index clays (PI greater than 25) and one low-PI clay to develop and validate the MC-based constitutive material models. The high PI clays were brought from Houston, Forth Worth, San Antonio, Paris and Bryan, Texas whereas the low PI-clay was from El Paso. Several soil index property tests, consisting of hydrometer and Atterberg limits, were carried out on the clay materials. Moisture density tests were also performed on all materials to obtain their optimum moisture contents (OMC) and maximum dry densities (MDD). Strength tests performed include unconfined compressive strength (UCS) tests, indirect tensile strength (IDT) tests and the flexural test (four-point bend test).7 The free-free resonant column tests (FFRC)8, resilient modulus (RM) tests and permanent deformation (PD) tests were carried out to quantify the stiffness properties of each clay material. Volumetric shrinkage tests were conducted from predetermined initial moisture content to a completely dry state. A test method developed by Puppala et al.9 was used. At least three samples were prepared for each moisture condition.
Three moisture-conditioning regimes were used for above tests, all specimens were first prepared and compacted at their corresponding OMC, then conditioned as
a) Drying from optimum (DFO) which were dried to constant weight;
b) Saturate from optimum (SFO) which were wetted to reach complete saturation; and
c) Drying from saturation (DFS): which were first wetted to saturation and then dried to constant weight.
The IDT, flexural and RM/PD tests on saturated specimens could not be carried out because the specimens were too soft to withstand the loads. Field observations including moisture content, matric suction, topographic surveys and visual inspection of HMA pavement distresses were carried out at five representative test sites in Houston, San Antonio, Paris, Fort Worth and Atlanta.
These sites were selected based on the following preferred attributes:
I. Reasonably newly constructed;
II. Design records are available:
III. Construction records are reasonably completed;
IV. Contain some areas with typical distresses encountered due to high-PI clay and
V. Clay subgrade is reasonably uniform. To ascertain the soil properties, soils from field instrumentation sites were also sampled and shipped to laboratories for above mentioned laboratory tests.
Generalized mathematical relationships
While developing the appropriate relationships between moisture contents (MC), seismic moduli, shrinkage and expansion strains, MC and moduli were first normalized for different types of clay materials. Moduli were normalized by dividing the individual modulus by the modulus at OMC. Three different approaches were followed to

Citation: Wanyan Y, Abdallah I, Nazarian S,et al. Feasibility study of using subgrade moisture content as key parameter to evaluate HMA roads performance under different drying/wetting cycles. MOJ Civil Eng. 2018;4(2):66–73. DOI: 10.15406/mojce.2018.04.00099
Feasibility study of using subgrade moisture content as key parameter to evaluate HMA roads performance under different drying/wetting cycles
68Copyright:
©2018 Wanyan et al.
normalize the moisture content. For the DFO process, the moisture contents were normalized by dividing the individual moisture content by the OMC (Eq. 1); whereas, for the SFO process the OMC values were subtracted from the individual moisture contents and then divided by the OMC (Eq. 2). Similar approach was followed for the DFS process as employed for the SFO process. However, a factor of 1 was added to the normalized values to make sure that all values were positive (Eq. 3) for easier model development
. DFO
Individual MCNMC =
OMC (1)
DFO
Individual MC OMCNMC
OMC
−= (2)
DFO
Individual MC OMCNMC 1
OMC
−= + (3)
Figure 1 & 2 shows typical tests results relating shrinkage strains ( så ) and normalized modulus ( nE ) to NMC for one specimen when drying from optimal (DFO). The mechanical parameters of interest ( så , nE ) and moisture content seem well correlated. In Figure 1, a NMC of unity corresponds to OMC, and theoretically a NMC of zero corresponds to a completely dry soil. Shrinkage strains increase rapidly until NMC is decreased to 0.4 after which, it is almost constant. A number of mathematical relationships can describe the relationships between the three shrinkage strains (vertical, lateral and volumetric in Figure 1) and the NMC. Based on extensive curve fitting analysis the relationship shown below (Eq. 4) was selected with R2 value better than 0.95:
( )* 2 2DFO : [A 1 - NMC ] (R2=0.98, 0.96 and 0.99 for vertical,
lateral and volumetric sε ) (4)
Where A* is a curve-fitted parameter, which can be calculated based on four index properties of the same soil: PI, Liquid Limit (LL), OMC and MDD, Shrinkage strain)
Similarly subgrade stiffness increases when losing moisture (Figure 2), a relationship between normalized subgrade modulus ( nE ) and NMC was also obtained using same approach as for sε :
( )* * 2nDFO : E = exp B - C × NMC (R2=0.99) (5)
Where nE is the normalized modulus, the best curve-fitted parameters B* and C* can be estimated using index properties similar to A*.
Figure 3 depicts the typical subgrade modulus variation with respect of NMC for the same soil sample as in Figure 2, but dried from saturation (DFS). It was noted that different drying/wetting paths of unsaturated soil has major effect on subgrade mechanical properties, especially problematic clayey subgrade. Thus a quick way to test and predict such effects is needed.
When the same soil sample was dried from saturation (DFS), following relationships were obtained
( )* 3s = exp(D . 1-NMCε (R2=1.00, 0.99 and 0.96 for vertical,
lateral and volumetric så ) (6)
( )* * 2
nE = exp E - F .NMC (R2=0.97) (7)
Same process was performed to obtain relationship of expansion strain (εe) when the same soil sample was saturated from optimal
(SFO), in the form of expansion strain and normalized subgrade modulus (En):
( )*e
2= G .NMC 1-NMC
ε (R2=0.90, 0.97 and 0.98 for vertical,
lateral and volumetric ) (8)
n * 1.5 * 2.5
1E =
1 - H NMC + NMC.I.(R2=0.95) (9)
Figure 1 Typical variations in shrinkage strains with NMC (DFO process).
Figure 2 Typical variations in modulus with NMC (DFO process)
Figure 3 Typical variations in modulus with NMC (DFS process).Constitutive model development
In order to develop robust and accurate constitutive models for different soil samples, the steps to obtain curve-fitted parameters A* to G* used in Equations (4) through (9) need to be explained and validated. Only parameter A* used in Equation (4) is presented here

Citation: Wanyan Y, Abdallah I, Nazarian S,et al. Feasibility study of using subgrade moisture content as key parameter to evaluate HMA roads performance under different drying/wetting cycles. MOJ Civil Eng. 2018;4(2):66–73. DOI: 10.15406/mojce.2018.04.00099
Feasibility study of using subgrade moisture content as key parameter to evaluate HMA roads performance under different drying/wetting cycles
Copyright:©2018 Wanyan et al. 69
with details for brevity. Figure 4 represents a typical soil lateral strain (expansion or shrinkage) vs. moisture content relationship trends under different drying/wetting paths.
Figure 4 Typical lateral shrinkage strain variations under different moisture conditioning paths
Firstly, correlation analysis among the readily available index properties and A* in Equation (4) was performed to estimate the shrinkage strains at a particular moisture contents for the DFO process. All clay materials except Houston were used. The results from the Houston clay were excluded for validation. In this study the correlation coefficients (CC) between 0.8 and 1.0 were considered correlated. When the CC was between 0.6 and 0.8, the two parameters were considered marginally correlated. All fitted parameter A* were correlated or marginally correlated to the plasticity index (PI), liquid limit (LL), optimum moisture content (OMC) and maximum dry density (MDD), whereas the plastic limit (PL) and seismic modulus at OMC were poorly or marginally correlated. As such, only the PI, LL, OMC and MDD were further considered in the development of the models. Secondly, best-fit linear relationships were developed for parameter Ai vs. PI, LL, OMC and MDD, respectively. Since PI, LL, OMC and MDD are commonly known, the weighted average of Ai estimated from each index property was used to combine the characteristic information of soil samples from all four index properties as shown below:
* PI PI LL LL OMC OMC MDD MDD
PI LL OMC MDD
A × W + A × W + A × W + A × WA =
W + W + W + W(10)
Where Ai is estimated from index property i, (i refers to PI, LL, OMC and MDD) respectively by linear trend line ii iA = ax + bx is the index property value of the particular soil. Wi is the weighting factor for the index parameter i based on correlation studies. Table 1 summarizes the slopes (a), intercepts (b) and weights (Wi) for these trend lines for drying from optimal (DFO). Same processes were replicated to obtain parameter B* to G* for all three drying/wetting paths.
IDT tests were performed on two specimens of each clay type at six different moisture content levels from optimum to dry conditions. For moisture level beyond optimum towards saturation soil samples were too soft and IDT test was not performed. The variations in the average IDT strengths and normalized moisture contents for all soils are shown in Figure 5. All soils, except Bryan, follow a unique trend with approximately 25 psi peak strength under dry condition decrease
smoothly to approximately 5 psi at OMC. Given the number of soil tested, and to build in conservatism in the model, the results from Bryan were excluded from curve-fitting process. The curve-fitted mathematical relationship to estimate tó from NMC is in the form of:
( )t = -11.54.In NMC + 1.59σ (R2=0.90) (11)
Table 1 Empirical Constants for A* calculation (DFO process, reproduced after Sabnis et al.)7
Index Property
Mode of Shrinkage
Parameter Ai=axi+bSlope (a)
Intercept (b) R2 W
PI
Vertical 0.25 -2.46 0.82 4
Lateral 0.06 0.55 0.92 4
Volumetric 0.58 -3.16 0.85 4
LL
Vertical 0.13 -2.24 0.79 2
Lateral 0.03 0.65 0.85 4
Volumetric 0.3 -2.45 0.83 4
OMC
Vertical 0.48 -5.43 0.84 4
Lateral 0.14 -0.58 0.87 4
Volumetric 1.12 -9.96 0.89 4
MDD
Vertical -0.15 19.45 0.57 1
Lateral -0.04 6.32 0.68 2
Volumetric -0.35 48.25 0.62 2
Figure 5 IDT strengths of clays at different normalized moisture content
HMA performance evaluation using MC based constitutive models
MC based constitutive models provide great flexibility in numerical modeling since MC and index properties of soil are readily available. These known characteristic parameters can be used with aforementioned relationships to obtain shrinkage strain ( sε ) and subgrade modulus ( nE ) regardless of the saturation state and drying path. Any suitable governing stress/strain relationship can be used to obtain só . In this manuscript the simplest linear elastic relationship was used for demonstration:
s n s= E .σ ε (12)

Citation: Wanyan Y, Abdallah I, Nazarian S,et al. Feasibility study of using subgrade moisture content as key parameter to evaluate HMA roads performance under different drying/wetting cycles. MOJ Civil Eng. 2018;4(2):66–73. DOI: 10.15406/mojce.2018.04.00099
Feasibility study of using subgrade moisture content as key parameter to evaluate HMA roads performance under different drying/wetting cycles
70Copyright:
©2018 Wanyan et al.
Longitudinal shrinkage cracking (LSC) model
Finite element analysis (FEA) models were developed to simulate shrinkage caused stress ( só ), if it was less than the predicted strength ( tσ )estimated based on Equation (11), that is: s tσ ≤ σ , MC is further reduced (subgrade continued to dry out). The simulation was repeated until the threshold was reached. The locations of the top fifty most critical stress points and critical MC thresholds are flagged. A typical low-volume HMA pavement section, consisting of a thin asphalt layer over base, sub base, lime-stabilized subgrade and natural subgrade was used. Each pavement layer was assumed to be homogenous, isotropic, and fully bonded to the underlying layer. Pavement shoulder was modeled as a uniform block fully bounded at the pavement interface. Because of symmetry, a half-wide pavement (12-ft wide) with shoulder (4-ft wide) was studied to reduce calculation efforts. As few as three layers and as many as five layers were introduced to the FEA program. Once the crack was onsite ( s t≥σ σ ), the fracture toughness
( ICK ) and the stress intensity factor ( IK ) for Mode I fracture10,11 was used as crack propagation criterion to further examine whether the initial shrinkage crack is stable or whether it will propagate through the pavement structure.
(13)
Where f(a/W) is a dimensionless parameter which is also referred to as geometric factor. As its name implies, f(a/W) depends on the geometries of both the specimen and the crack. Parameter 2á is the through-thickness crack length; σ is the (remotely, not on crack tip) applied stress. To simplify calculation, initial crack is assumed to be very small (a = 1 in.) and applied linear tensile stress is uniform. Parameters KI and KIC were with different applied linear tensile stresses ( ts vs. σσ ) and different geometry factors (semi-infinite vs. laboratory set up dimensions according to four point bending test) respectively. When I ICK K< the crack was assumed stable and would not grow. On the other hand however, when I ICK K≥ , the crack would start to propagate up. The progression of the initial shrinkage crack was critical to the development of the surface longitudinal crack. Again, moisture content was used as the controlled input. Final outputs of LSC model include the two moisture thresholds MCi (crack initiation) and MCp (crack day lighting) and the coordinates of critical locations for longitudinal cracking.
Fatigue and rutting
A layered linear elastic model that computes pavement responses under static loads is incorporated to check for the pavement fatigue cracking and subgrade rutting. The Asphalt Institute12 & Shell13 design methods, which relate the strains to the allowable number of load repetitions, are selected as shown in the following:
( ) ( )t
-f -f2 3f 1 1N = f Eε (14)
( )c
-f5d 4N = f ε (15)
Where fN and dN = allowable number of load repetitions (remaining life in ESALs) for fatigue and rutting respectively, tå = horizontal tensile strain at the bottom of the HMA, cå = vertical compressive strain on top of the subgrade, E1 = HMA modulus, f1 to f5 are empirically-derived coefficients. In this study, values of 0.0796, 3.291, 0.854, 1.365 x 10⁻⁹, and 4.477 were used for f1 through f5, respectively. The linear elastic multi-layer program MODULUS 6.014
was adopted and modified to conduct the evaluation. The required include: total number of layers, modulus, thickness and Poisson’s ratio for each layer.
Subgrade shear failure
On many low volume HMAC roads where the expected traffic is low, it is very common to expect higher percentage of heavy trucks with wheel loads that exceed the standard 18-kip single axle load. These occasional overloads could give rise to subgrade shear failure, particularly under conditions where the pavement is build on problematic expansive soils and the subgrade is wet. To ensure that the pavement provides adequate cover to protect the subgrade against overstressing, TxDOT utilizes the Texas triaxial design method to establish the depth of cover required (Dcover) to avoid shear failure. Fernando et al.15 also recommended the modified triaxial method (MTRX) to check required base thickness (Dbase).
Swelling and roughness
To select the most feasible volumetric change prediction model, laboratory test results and field measurements were compared for seven empirical relationships. Based on results, the potential vertical rise (PVR) method was selected to estimate the differential movements. As per TxDOT specifications, soil properties including PI, LL, MC and percentage of soil particles passing sieve #40 (P40) are used to estimate the PVR value at both the top and bottom of each subgrade stratum and the total PVR value for the subgrade. To accurately automate PVR estimates in this study, the charts provided in TxDOT specifications were digitized and curve-fitted to develop the following equation to calculate PVR based on volumetric swell:
21 2PVR = C P + C .P. (16)
Where P is the average load of the analyzed subgrade stratum layer (psi), C1 and C2 are curve-fitted constants that are a function of percentage volumetric swell ( á ) as reported in Wanyan et al. [1].
International roughness index (IRI) was used to define characteristic of the longitudinal profile. The IRI model proposed by Lytton et al. [16] was used. The model has the following format:
( )i
0
i
0
âñ
IRI = IRI + 4.2 - IRI exp -t
(17)
Where 0IRI is the initial IRI; iñ and iâ are roughness parameters based on both traffic and total vertical movements (ΔH). In roughness model, the PVR value predicted using Equation (16) is used as total vertical movement (ΔH) in Equation (17). This value only takes into consideration the maximum possible heaving.
Results and discussionLaboratory testing and field measurement results
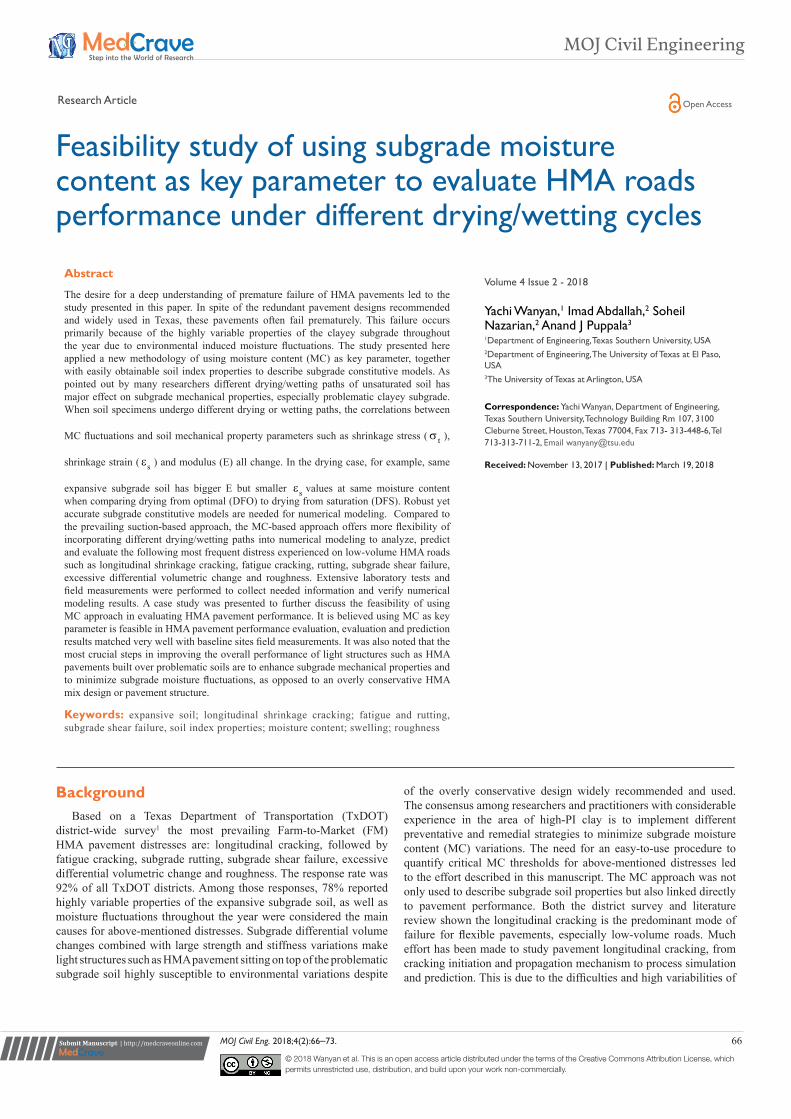
The clay material from Houston was not used in the development of the constitutive material models aforementioned in Equations (4) through (9), but rather used as validation. The composite parameters A* through G* are site specific which can be calculated as a function of soil index properties and best-fit R2 as explained earlier. Figure 6 compares the predicted and measured shrinkage strain with moisture variations for three Houston specimens. The results compared favorably with approximately 90%, 70% and 75% of the values within 20% margin of error for vertical, lateral and volumetric strains
I
a= f × aW
σ π
K
Citation: Wanyan Y, Abdallah I, Nazarian S,et al. Feasibility study of using subgrade moisture content as key parameter to evaluate HMA roads performance under different drying/wetting cycles. MOJ Civil Eng. 2018;4(2):66–73. DOI: 10.15406/mojce.2018.04.00099
Feasibility study of using subgrade moisture content as key parameter to evaluate HMA roads performance under different drying/wetting cycles
Copyright:©2018 Wanyan et al. 71
respectively. Different drying/wetting paths were studied. When soil specimens are dried through different path, the correlations between moisture content and soil mechanical property parameters (such as
så , E, tó ) change. As shown in Figure 7, trend changes in subgrade modulus with moisture variation were also studied and compared with Figure 4. In the drying case, for example, same expansive soil has bigger nE but smaller så values at same moisture content when comparing DFO to DFS. When DFO is used it yields more optimistic results.
Figure 6 Comparison of measured and predicted shrinkage strain with moisture content variation for three specimen of the houston clay material.
Figure 7 Typical subgrade modulus variations under different moisture conditioning paths.
HMA pavement performance evaluation results
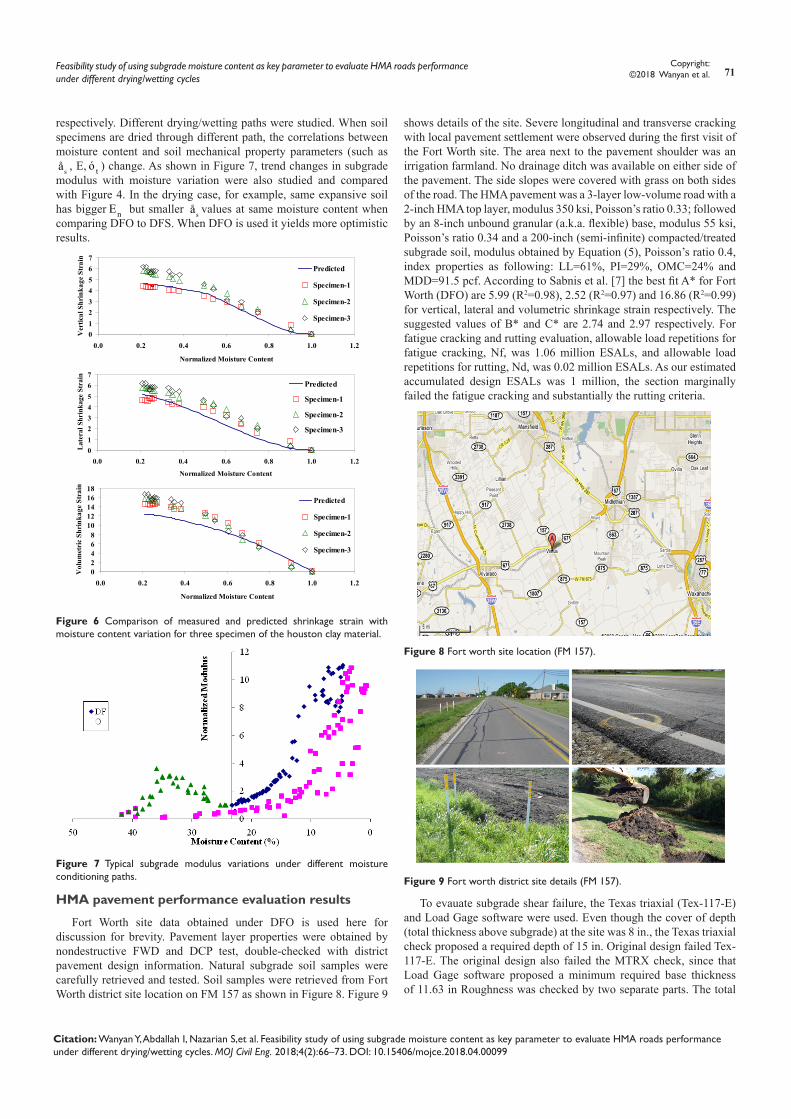
Fort Worth site data obtained under DFO is used here for discussion for brevity. Pavement layer properties were obtained by nondestructive FWD and DCP test, double-checked with district pavement design information. Natural subgrade soil samples were carefully retrieved and tested. Soil samples were retrieved from Fort Worth district site location on FM 157 as shown in Figure 8. Figure 9
shows details of the site. Severe longitudinal and transverse cracking with local pavement settlement were observed during the first visit of the Fort Worth site. The area next to the pavement shoulder was an irrigation farmland. No drainage ditch was available on either side of the pavement. The side slopes were covered with grass on both sides of the road. The HMA pavement was a 3-layer low-volume road with a 2-inch HMA top layer, modulus 350 ksi, Poisson’s ratio 0.33; followed by an 8-inch unbound granular (a.k.a. flexible) base, modulus 55 ksi, Poisson’s ratio 0.34 and a 200-inch (semi-infinite) compacted/treated subgrade soil, modulus obtained by Equation (5), Poisson’s ratio 0.4, index properties as following: LL=61%, PI=29%, OMC=24% and MDD=91.5 pcf. According to Sabnis et al. [7] the best fit A* for Fort Worth (DFO) are 5.99 (R2=0.98), 2.52 (R2=0.97) and 16.86 (R2=0.99) for vertical, lateral and volumetric shrinkage strain respectively. The suggested values of B* and C* are 2.74 and 2.97 respectively. For fatigue cracking and rutting evaluation, allowable load repetitions for fatigue cracking, Nf, was 1.06 million ESALs, and allowable load repetitions for rutting, Nd, was 0.02 million ESALs. As our estimated accumulated design ESALs was 1 million, the section marginally failed the fatigue cracking and substantially the rutting criteria.
Figure 8 Fort worth site location (FM 157).
Figure 9 Fort worth district site details (FM 157).
To evauate subgrade shear failure, the Texas triaxial (Tex-117-E) and Load Gage software were used. Even though the cover of depth (total thickness above subgrade) at the site was 8 in., the Texas triaxial check proposed a required depth of 15 in. Original design failed Tex-117-E. The original design also failed the MTRX check, since that Load Gage software proposed a minimum required base thickness of 11.63 in Roughness was checked by two separate parts. The total
01234567
0.0 0.2 0.4 0.6 0.8 1.0 1.2
Normalized Moisture Content
Ver
tical
Shr
inka
ge S
trai
n
Predicted
Specimen-1
Specimen-2
Specimen-3
02468
1012141618
0.0 0.2 0.4 0.6 0.8 1.0 1.2
Normalized Moisture Content
Vol
umet
ric
Shri
nkag
e St
rain
Predicted
Specimen-1
Specimen-2
Specimen-3
01234567
0.0 0.2 0.4 0.6 0.8 1.0 1.2
Normalized Moisture Content
Lat
eral
Shr
inka
ge S
trai
n
Predicted
Specimen-1
Specimen-2
Specimen-3

Citation: Wanyan Y, Abdallah I, Nazarian S,et al. Feasibility study of using subgrade moisture content as key parameter to evaluate HMA roads performance under different drying/wetting cycles. MOJ Civil Eng. 2018;4(2):66–73. DOI: 10.15406/mojce.2018.04.00099
Feasibility study of using subgrade moisture content as key parameter to evaluate HMA roads performance under different drying/wetting cycles
72Copyright:
©2018 Wanyan et al.
potential vertical rise (PVR) was estimated to be 2.1 in. When the general recommended PVR limit value of 2-inch be used, the PVR was considered marginally failed. The IRI check gave 1.37 m/km, which passed the criteria for farm to market HMA road. Longitudinal shrinkage cracking evaluation (DFO) suggested that the subgrade will start to develop longitudinal shrinkage cracks when moisture content drops below 21.6%, and the cracks will day light on top of the pavement within 5 ft of the edge when the moisture content reaches about 17%. It was safe to assume that after just one typical drying cycle (typically a few weeks according to local rainfall history data) this bottom-up shrinkage cracking will start causing problems. The two critical locations were the shoulder-pavement interface and near the 5.15.3 ± ft range from pavement edge. Figure 10 depicts a plot of top 50 maximum tensile stress points in subgrade with these two critical zones. Field measurements (Figure 11) indicate that the highest moisture content was around 35% and the lowest around 11%. The largest moisture fluctuation occurred during mid-July to mid-October in 2007 when the mean moisture changed by more than 20%. New longitudinal cracks were observed following the dry season in the late September. The dry cycle has a mean moisture content of 15%. It can be concluded from the field measurements when subgrade moisture dropped below 15%, shrinkage cracks became visible on surface. This number corresponded well with the estimated 17% critical MC. Figure 12 shows pictures of site conditions right after the conclusion of the research. The longitudinal cracking was developed near outer-wheel lane towards pavement edge. The distressed area is about 3 feet wide. These field observations also correspond pretty well with our model estimation. To summarize, the MC controlled constitutive subgrade models were used into different HMA performance evaluations. Results compared reasonably well to field measurements.
Figure 10 Sample plot of longitudinal shrinkage cracking check results (50 top largest tensile stress points in subgrade and shoulder).
Figure 11 Summary of field data measurements for fort worth site (by UTA).
Figure 12 Fort worth site conditions
ConclusionThe results of this research evaluated the feasibility of using MC
approach to evaluate HMA roads performance under different drying/wetting cycles. Moisture content as one of the key parameters greatly affect expansive clay subgrade properties. Conditions of subgrade and environmental factors were proved to be the controlling factors of HMA road performance. For strength/stiffness related pavement distresses, such as fatigue cracking and rutting, or subgrade shear failure, rainy season is more critical. On the other hand, for shrink/swell related pavement distresses, such as longitudinal cracking and excessive roughness, drought season needs more attention. During the study period there was no major flooding occurrence and such the authors believed it is preferable to use constitution models developed with DFO conditioning. However, for other situations like the 2017 hurricane Harvey, MC approach described herein could become a very useful. It could become a flexible tool with reasonable accuracy for numerical analysis and simulation of pavement and other light structures, subgrade responses before and after flooding. (Saturated from optimal then dried form saturation condition). For low-volume HMA roads (generally thin asphalt pavement) subgrade properties have major influence on both short- and long-term performance. On the other hand, there was no firm evidence to show that thicker layers were more effective than thin layers in reducing such distresses and improving overall pavement performance.
AcknowledgmentsThe successful progress of this study could not have happened
without the help and support from Texas Department of Transportation (TxDOT). The authors acknowledge Mr. Anup Sabnis, Dr. Thammanoon Manosuthkij and Ms Lourdes Pacheco for their valuable contribution in laboratory and field testing.
Conflict of interestThere is no conflict of interest.
References1. Wanyan Y, Manosuthkij T, Abdallah I, et al. Expert System Design
Guide for Lower Classification Roads over High PI Clays. Texas Department of Transportation, USA: Publication FHWA/TX-08/0-5430-2; 2008.
2. Alonso EE, Gens A, Josa AA. Constitutive Model for Partially Saturated Soils. Geotechnique. 1990;40(3):405‒430.
3. Vanapalli SK, Nicotera MV, Sharma RS. Axis Translation and Negative Water Column Techniques for Suction Control. Geotechnical and Geological Engineering. 2008;26(6):645‒660.

Citation: Wanyan Y, Abdallah I, Nazarian S,et al. Feasibility study of using subgrade moisture content as key parameter to evaluate HMA roads performance under different drying/wetting cycles. MOJ Civil Eng. 2018;4(2):66–73. DOI: 10.15406/mojce.2018.04.00099
Feasibility study of using subgrade moisture content as key parameter to evaluate HMA roads performance under different drying/wetting cycles
Copyright:©2018 Wanyan et al. 73
4. Pan H, Qing Y, Pei-yong L. Direct and Indirect Measurement of Soil Suction in the Laboratory. Electron Journal of Geotechnical Engineering (EJGE). 2010;(15):1‒14.
5. Puppala AJ, Manosuthkij T, Nazarian S, et al. Threshold Moisture Content and Matric Suction Potentials in Expansive Clays Prior to Initiation of Cracking in Pavements. Canadian Geotechnical Journal. 2011;48(4):519-531.
6. WanyanY, Abdallah I, Nazarian S, et al. Moisture content-based longitudinal cracking prediction and evaluation model for low-volume roads over expansive soils. Journal of Materials in Civil Engineering. 2014;27(10).
7. Sabnis A, Manosuthkij T, Abdallah I, et al. Impact of Moisture Variation on Strength and Deformation of Clays. Department of Transportation Publication, USA: FHWA/TX-08/0-5430-1. FHWA; 2008.
8. Nazarian S, Yuan D, Tandon V, et al. Quality Management of Flexible Pavement Layers with Seismic Methods: Test Methods.. Texas Department of Transportation, USA: Publication FHWA/TX-03/5-1735-01-P5; 2006.
9. Puppala AJ, Katha B, Hoyos LR. Volumetric Shrinkage Strain Measurements in Expansive Soils Using Digital Imaging Technology. Geotechnical Testing Journal. 2004;(27):6.
10. Griffith AA. The Phenomena of Rupture and Flow in Solids. Philosophical transactions of the Royal society of London. 1920;(A221):163‒198.
11. Irwin G. Analysis of Stresses and Strains Near The End of A Crack Traversing A Plate. Journal of Applied Mechanics 1957;(24):361-364.
12. Asphalt Institute. Thickness Design-Asphalt Pavements for Highways and Streets. No.1.9th Edition, Asphalt Institute, ISBN: 9781934154014, USA; 2001.
13. Shell Pavement Design Manual-Asphalt Pavements and Overlays for Road Traffic. Shell International Petroleum Company, Ltd., London. England; 1978.
14. Liu, Wenting, Tom Scullion. MODULUS 6.0 for Windows: User’s Mmanual. No. FHWA/TX-05/0-1869-2. Texas Transportation Institute, Texas A & M University System,USA; 2001.
15. Fernando, Emmanuel G, Wenting Liu, et al. The Texas Modified Triaxial (MTRX) Design Program. Texas Transportation Institute for the Texas Department of Transportation, 2001:1‒2.
16. Lytton, Robert, Charles Aubeny, Rifat Bulut. Design procedure for pavements on expansive soils. Texas Transportation Institute, Texas A & M University System, 2005;(3).