feasibility analysis of system dynamics for inland
TRANSCRIPT
Feasibility Analysis of System Dynamics for
Inland Maritime Logistics
by
Long, Suzanna Nachtmann, Heather Oztanriseven, Furkan Pérez-Lespier, Lizzette
A National University Transportation Center at Missouri University of Science and Technology
NUTC R356

Disclaimer
The contents of this report reflect the views of the author(s), who are responsible for the facts and the
accuracy of information presented herein. This document is disseminated under the sponsorship of
the Department of Transportation, University Transportation Centers Program and the Center for
Transportation Infrastructure and Safety NUTC program at the Missouri University of Science and
Technology, in the interest of information exchange. The U.S. Government and Center for
Transportation Infrastructure and Safety assumes no liability for the contents or use thereof.
NUTC ###

Technical Report Documentation Page
1. Report No.
NUTC R356
2. Government Accession No. 3. Recipient's Catalog No.
4. Title and Subtitle Feasibility Analysis of System Dynamics for Inland Maritime Logistics
5. Report Date
February 2014
6. Performing Organization Code 7. Author/s
Suzanna Long
8. Performing Organization Report No.
Project # 00043194
9. Performing Organization Name and Address
Center for Transportation Infrastructure and Safety/NUTC program Missouri University of Science and Technology 220 Engineering Research Lab Rolla, MO 65409
10. Work Unit No. (TRAIS) 11. Contract or Grant No.
DTRT06-G-0014
12. Sponsoring Organization Name and Address
U.S. Department of Transportation Research and Innovative Technology Administration 1200 New Jersey Avenue, SE Washington, DC 20590
13. Type of Report and Period Covered
Final
14. Sponsoring Agency Code
15. Supplementary Notes 16. Abstract In the last decades, a number of factors have re-shaped the shipping industry, including the growth of international trade, the emergence of new markets, and the development of multimodal supply chains. This has led maritime transportation system, which includes ocean and coastal routes, and inland waterways, along with other modes of transportation such as, railways, roads, and air-freight to become a critical part of the global supply chains and freight transportation systems. Due to the complexity of such a system: a growing number of systems that are interconnected and working together to achieve a purpose; a system dynamics approach is used in the literature to simulate maritime transportation system and its integration within the supply chain, into the U.S. surface transportation system modes of truck and rail. In the initial phase of this research, an integrative literature review of applications of system dynamics in the maritime transportation system was conducted. The results of this early research provides an overview of system dynamics model applicability in the maritime transportation system and can prosper future research in the field, such as developing a systems dynamic framework model to aid with decision-making strategies that will lead to the improvement of the efficiency of the system.
17. Key Words
Inland Hub; Multimodal Transportation System; System Dynamics; Maritime Logistics
18. Distribution Statement
No restrictions. This document is available to the public through the National Technical Information Service, Springfield, Virginia 22161.
19. Security Classification (of this report)
unclassified
20. Security Classification (of this page)
unclassified
21. No. Of Pages
43
22. Price
Form DOT F 1700.7 (8-72)

i
Feasibility Analysis of System Dynamics for Inland Maritime Logistics
Long, Suzanna. Nachtmann, Heather. Oztanriseven, Furkan. Pérez-Lespier, Lizzette.
ABSTRACT
In the last decades, a number of factors have re-shaped the shipping industry, including the
growth of international trade, the emergence of new markets, and the development of
multimodal supply chains. This has led maritime transportation system, which includes ocean
and coastal routes, and inland waterways, along with other modes of transportation such as,
railways, roads, and air-freight to become a critical part of the global supply chains and
freight transportation systems. Due to the complexity of such a system: a growing number
of systems that are interconnected and working together to achieve a purpose; a system
dynamics approach is used in the literature to simulate maritime transportation system and its
integration within the supply chain, into the U.S. surface transportation system modes of
truck and rail. In the initial phase of this research, an integrative literature review of
applications of system dynamics in the maritime transportation system was conducted. The
results of this early research provides an overview of system dynamics model applicability in
the maritime transportation system and can prosper future research in the field, such as
developing a systems dynamic framework model to aid with decision-making strategies that
will lead to the improvement of the efficiency of the system.

ii
TABLE OF CONTENTS Page
ABSTRACT ...................................................................................................................... i LIST OF ILLUSTRATIONS ............................................................................................. iv LIST OF TABLES ...............................................................................................................v ABBREVIATION LIST .................................................................................................... vi SECTION
1. INTRODUCTION ..............................................................................................1 1.1. MOTIVATION OF RESEARCH ...............................................................2 1.2. MARITIME TRANSPORTATION SYSTEM OVERVIEW ....................3
1.3. SYSTEM DYNAMICS IN MTS ................................................................7
2. LITERATURE REVIEW ...................................................................................9 2.1. MTS STUDIES USING SD........................................................................9 2.1.1. Maritime Disruption SD Studies ........................................................9 2.1.2. Port-Related SD Studies ..................................................................10 2.1.3. Vessel-Related SD Studies ..............................................................10 2.1.4. Other MTS SD Studies ....................................................................11 2.1.5. Summary ..........................................................................................11 2.2. CLASSIFICATION OF THE MST SD LITERATURE ..........................12 2.2.1. MTS SD Application Classification ................................................12 2.2.1.1. Study Region ..........................................................................12 2.2.1.2. Port Type ................................................................................12 2.2.1.3. Intermodal Transportation Consideration ..............................13 2.2.1.4. Causal Relation Variables ......................................................13 2.2.1.5. Variable Type .........................................................................14
iii
2.2.1.6. Sensitivity and Scenario Analysis ..........................................15 2.2.2. MTS SD Methodology Classification ..............................................15 2.2.2.1. Model Integration...................................................................15 2.2.2.2. Simulation Period Employed .................................................16 2.2.2.3. Software Utilized ...................................................................16 2.2.2.4. Modeling Challenges .............................................................17 2.2.2.5. Validation/Verification Technique ........................................17
3. CONCEPTUAL REPRESENTATION OF MTS USING SD .........................18
3.1. INTRODUCTION TO THE SD MODELING PROCESS ......................20
3.2. PRELIMINARY MODEL REPRESENTATION ....................................25 4. CONCLUSIONS AND FUTURE WORK .......................................................29
ACKNOWLEDGEMENTS ...............................................................................................30
BIBLIOGRAPHY ..............................................................................................................31

iv
LIST OF ILLUSTRATIONS
Figures Page
1.1 U.S.’s Marine Highway Route: Corridors, Connectors and Crossings.................... 5
1.2 National Highway System Estimated Peak Period Congestion in 2020 .................. 7
1.3 Consequences of Capacity Shortages at Seaports .................................................... 8
3.1 Representation Model of Maritime Freight Transportation System ...................... 19
3.2 S.D. Steps on the Modeling Process ...................................................................... 21
3.3 MTS’s Dynamic Hypothesis .................................................................................. 23
3.4 MTS’s Causal Loop Diagram ................................................................................ 27
v
LIST OF TABLES
Table Page
1.1 Comparison of U.S. Domestic Transportation Modes ............................................. 4
2.1 Study Regions Classifications................................................................................ 12
2.2 Causal Relations Variables .................................................................................... 13
2.3 Variable Classification ........................................................................................... 14
2.4 Sensitivity and Scenario Analysis .......................................................................... 15
2.5 Integration of SD with Other Models .................................................................... 16
2.6 Simulation Period Employed ................................................................................. 16
2.7 Software Utilized ................................................................................................... 16
2.8 Modeling Challenges ............................................................................................. 17
2.9 Validation/Verification Techniques ....................................................................... 17
vi
ABBREVIATION LIST
MTS – Maritime Transportation System NUTC – National University Transportation Center SD – System Dynamics USACE - U.S. Army Corps of Engineers U.S. DOT – U.S. Department of Transportation

1
1. INTRODUCTION
The research in this report focuses on the study and comprehension of a vital part of
the global supply chain and freight transportation system: the maritime transportation system
(MTS). Because of MTS’s logistic network, which is essential to a sustainable growth of
local, regional, and national economies, it is vital to understand this transportation mode and
its system in order to be able to suggest decision-making strategies that will improve MTS’s
performance over time being able to enhance customer’s and stakeholders’ satisfaction.
The ability of North American ports to efficiently manage the emerging cargo
volumes that currently take place and those forecasted is really important, since it has a major
effect on the trading capabilities and economies of the region as a whole. America’s ports are
a gateway to the world and a significant component on the nation’s economic health. Some
issues identified by the U.S. DOT that lead to inefficiency in the MTS, include: overcapacity
and congestion due to lack of land available for expansion, congested local markets, and
increasing costs due to energy, safety, and environmental issues (U.S. DOT, 2006). The
significant number of issues and the economic importance of finding solutions to these
problems illustrate the need for this research, which is aimed at transportation infrastructure
and modal connectivity. With the foundation of well-positioned, super logistics terminals,
America can provide an excellent mechanism for addressing issues affecting the optimality of
maritime transportation infrastructures needed to support the country’s future and help
maintain competitive advantage in a global economy.
North America’s transportation infrastructure is heavily dependent on multimodal
connectivity. As such, the efficient transition of goods between modes is very important to
the flow of freight. Inefficiencies at the connectivity points can severely impact the overall
freight management process hence need to be addressed. This research explored the
feasibility of using systems dynamics methodology to forge vital multimodal alliances as part
of the US Inland Maritime logistics operations. The major research tasks performed include:
1. An Integrated Literature Review: Multiple levels of literature review were conducted and
common themed studies and model attributes were identified and categorized. Also, this
review examined the feasibility of studying the inland maritime logistics system within a
system dynamics environment and identified necessary data sources and categorizations that
would aid in the representation of the maritime logistics system with a system dynamics
modeling methodology.

2
2. A Logistics System Model Development: Designed a preliminary model, which examined the
efficacy of utilizing system dynamics to study the inland maritime logistics and multimodality
impacts.
1.1. MOTIVATION OF RESEARCH
The Nation’s “marine highways” are an important component of the nation’s
transportation system, which carry one-twelfth of the total national freight volume (Stern,
2013). The ability of North American ports to efficiently handle growing cargo volumes has a
major impact on the trading capabilities and economies of the region as a whole. U.S. ports
handle $5.5 billion worth of goods every day and 2.5 billion tons of cargo every year. This
volume is expected to double in the next fifteen years (American Association of Port
Authorities, 2007). Therefore, an efficient and effective maritime transportation system can
have widespread economic and societal impacts. Thus, the aim of this research is to explore
the feasibility of using SD to study and support an efficient MTS.
Developed by Jay Forrester in the late 1950s, SD is “a methodology for studying and
managing complex feedback systems.” Forrester (1961) describes an information feedback
system existing whenever “…the environment leads to a decision that results in action which
affects the environment and thereby influences future decisions” (p. 14). Moving away from
the conventional approach of viewing system performance and behavior as merely the result
of events and their causes, SD emphasizes the interactions between components of a system
(Kirkwood, 1998). As an application of systems thinking, SD seeks to identify the underlying
structure of a system to gain insight into patterns of behavior, focusing on how components
of a system interact and understanding the roles each component plays rather than
concentrating on specific events. This allows stakeholders to design policies that seek to
eliminate unwanted patterns of behavior through modifying the underlying system structure,
rather attempting to mitigate the events themselves, which can lead to a host of other
unintended consequences (Kirkwood, 1998). We anticipate that this system structure exists in
the maritime logistics system.
This literature review is the result of a pilot study designed to evaluate methodologies
and mechanisms for creating a long-term, sustainable MTS. This work seeks to advance the
SD body of knowledge in logistics infrastructure design and implementation. Existing models
have been criticized for maintaining the status quo; new approaches to infrastructure

3
development are considered essential in order for the U.S. to remain competitive in the global
economy (Urban Land Institute, 2008).
1.2. MARITIME TRANSPORTATION SYSTEM OVERVIEW
With international trade becoming a big part of the world’s economic activity,
efficient freight transportation systems are becoming even more significant in any supply
chain’s success. A transportation system moves goods from one location to another as they
move from the very beginning of the supply chain to the downstream customer (Chopra,
2007). On average 90 per cent of global goods are transported via international shipping to
people and communities all over the world (IMO, 2013). Maritime transportation is the most
efficient and cost-effective method of international transportation of freight, hence providing
a reliable, low-cost mean of transportation. This is because of maritime’s transportation
unparalleled physical capacity and ability to carry freight over long distances and at low
costs. Therefore, an efficient maritime transportation system plays an essential role when
trying to compete in global markets in the 21st century.
Five modes of transportation, each with advantages and disadvantages, carry freight in
the U.S.: water, air, rail, road and pipeline (Table 1.1). But it is maritime transport the one that
remains the dominant mode for international trade because of its bulk transport of
commodities and containerized-bulk cargo, and also because it has transformed its
technologies, national registries, and labor resources over the past decades to serve the
demands of globalization (Corbett & Winebrake, 2008). Millions of people all around the
globe rely on maritime transportation to deliver goods and services. Quoting Nijkamp,
Vleugel, Maggi, and Masser (1994), maritime transportation has served as the ‘blood
circulation’ of the global economy through linking marine corridors into complex shipping
networks (especially freight) and made different regions around the world more proximate to
each other (Hall & Jacobs, 2010). For that reason, maritime transportation is recognized as an
enabler of globalization and being a vital part of the global supply chain.

4
Table 1.1: Comparison of U.S. Domestic Transportation Modes (Stock, James and Lambert, Douglas, 2001)
Historical patterns show how a nation’s economic strength and competitiveness
depend on an efficient, sustainable and secure freight transportation system. More than 13
billion tons of freight, valued at $11.8 trillion, were transported nearly 3.5 trillion ton-miles
in the United States during 2007, according to preliminary estimates from the 2007
Commodity Flow Survey (CFS) (Margreta et al., 2009). That continuous economic
globalization, the growing demand for speed-to-market product delivery, and need to manage
global supply chains more effectively, has led to the sustained increase in demand towards
efficient transportation systems. For that same reason, the Marine Highway Program works
relentlessly to incorporate these waterways into the greater U.S. transportation system,
especially where marine transportation services are the most efficient, effective, and
sustainable transportation option (Maritime Administration: U.S. DOT, 2013). In today’s
globalized world, multimodal transportation forms the backbone of world trade. Therefore, as
the demand for MTS grows and becomes more significant to logistics and efficient supply
chain, there is need of heightening the significance of multimodal transportation systems,
understanding its elements and how to manage them effectively. Multimodal transportation
system refers to the modal coordination or integrated use of two or more modes of
transportation for delivering freight from origin to destination in a seamlessly linked and
efficiently coordinated flow. Multimodality has grown considerably in the last decades
making it an essential constituent of the whole global distribution process. Currently, the
Nation’s Marine Highway System entails over 29,000 nautical miles of navigable waterways
5
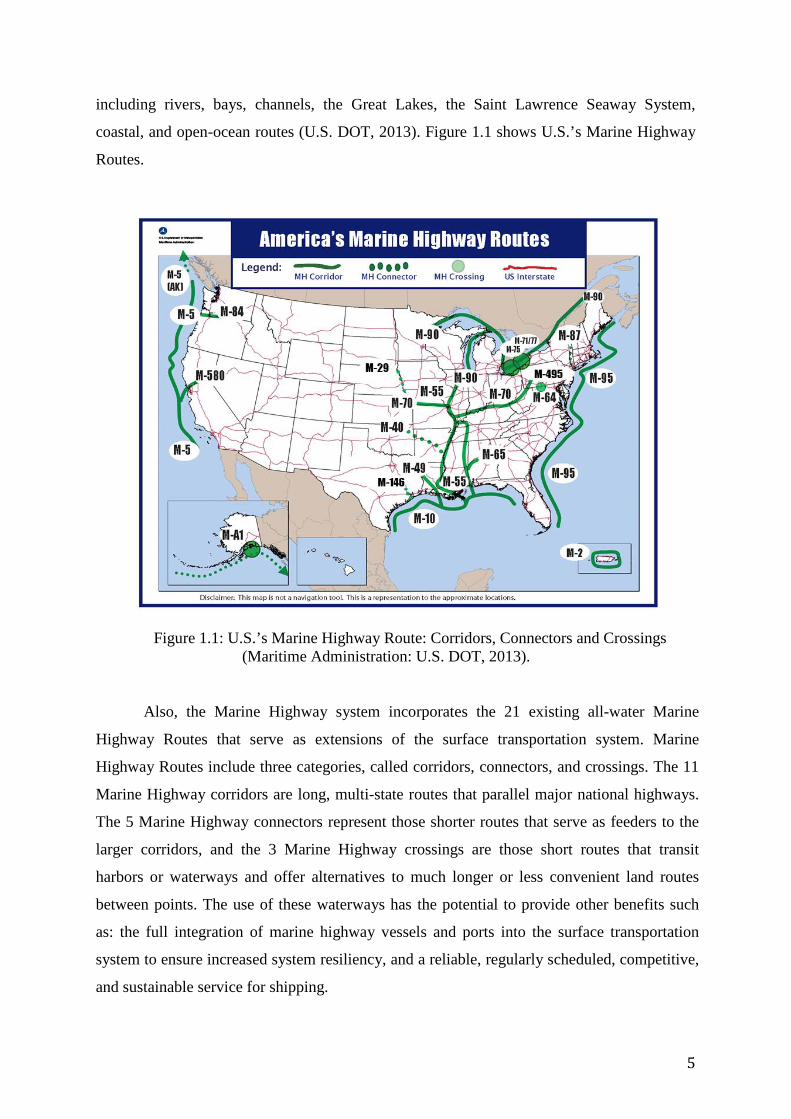
including rivers, bays, channels, the Great Lakes, the Saint Lawrence Seaway System,
coastal, and open-ocean routes (U.S. DOT, 2013). Figure 1.1 shows U.S.’s Marine Highway
Routes.
Figure 1.1: U.S.’s Marine Highway Route: Corridors, Connectors and Crossings
(Maritime Administration: U.S. DOT, 2013).
Also, the Marine Highway system incorporates the 21 existing all-water Marine
Highway Routes that serve as extensions of the surface transportation system. Marine
Highway Routes include three categories, called corridors, connectors, and crossings. The 11
Marine Highway corridors are long, multi-state routes that parallel major national highways.
The 5 Marine Highway connectors represent those shorter routes that serve as feeders to the
larger corridors, and the 3 Marine Highway crossings are those short routes that transit
harbors or waterways and offer alternatives to much longer or less convenient land routes
between points. The use of these waterways has the potential to provide other benefits such
as: the full integration of marine highway vessels and ports into the surface transportation
system to ensure increased system resiliency, and a reliable, regularly scheduled, competitive,
and sustainable service for shipping.
6
The U.S. Maritime Administration, on their 2009 report, explains how every year
Americans lose 3.7 billion hours and 2.3 billion gallons of fuel just by sitting in traffic jams
(U.S. Maritime Administration, 2009). Serious capacity challenges and hence congestion are
already existent in today’s freight transportation system’s flow and are foreseen to be an even
greater challenge in the future too. The Department of Transportation’s “Freight Analysis
Framework” has forecasted a 70% increase in freight traffic by 2020 (U.S. DTOP, 2002).
Figure 1.2 looks at the DOT’s 2020 projections. The projections not only show that there will
be more congestion in the major metropolitan areas, but in the smaller markets as well. Such
drastic growth will result in the taxing of the capabilities of all domestic modes of transport,
since time, age, wear and tear will reduce their reliability and their efficiency. Therefore, by
increasing the use of marine transportation on the commercially navigable waterways can
offer relief to landside corridors that suffer from traffic congestion, excessive air emissions or
other environmental concerns and challenges.
The U.S. maritime transportation system has managed to accommodate the rising
levels of trade in the last couple of years. However, this has had its repercussions and has
strained U.S.’s waterways, ports and key corridors. The MTS was already showing its age,
since the average age of the 192 commercially active locks in the U.S. exceed 50 years old
(U.S. House of Representatives, 2012), and due to the strenuous use, it’s deteriorating
quickly. Fifty-seven percent of U.S.A’s inland system is more than 50 years old, and 37
percent of that system is more than 70 years old. It is literally falling apart and the MTS is
falling behind. MTS is critical to the national economy and therefore, action need to be taken
upon since this entire aging in the infrastructure and lack of investments and maintenance,
ultimately affects the reliability of the system as a whole. Without some rehabilitation and
rebuilding, we can expect, to pay more each year for an increasingly unreliable system.
Investments in maintenance and major rehabilitations, with some capacity and modernization
improvements are needed in the maritime transportation system in order to maintain its
reliability and efficiency when it comes to transporting goods and for U.S.A to keep
competing in global markets.

7
Figure 1.2: National Highway System Estimated Peak Period Congestion in 2020 (U.S. DTOP, 2002).
1.3. SYSTEM DYNAMICS IN MTS
System Dynamics (SD) simulation is a methodology for analyzing complex systems
and problems with the help of computer modeling and simulation software. In order for SD to
be effective, a deep look at the possible interactions between the subsystems taking part in a
broader system needs to take place to create a better understanding of that big picture. Unlike
other traditional analysis methods, SD aims to enhance that understanding of a system and
the relationships between different system components.
The interest of this report was to find a method that would maximize freight service
by addressing obstacles preventing optimal transportation infrastructure required, to compete
in today’s global economy. Therefore, a SD model was built to measure the total throughput
of the system, so the impact on all modes of transportation system and towards the MTS
when addressing the issues of capacity shortage and congestion in the maritime system, could

8
be seen. By understanding the different alternatives and scenarios one would be able to
determine what is the best alternative in order to maximize freight service (throughput).
Islam and Olsen (2013) explore the importance of water mode transport system’s
performance from a supply chain perspective. They discuss how capacity shortages and its
consequences are one of the limiting problems that many seaports of the world currently face.
Figure 1.3 breaks down the consequences of capacity shortages that have led the maritime
transport industry to compel and consider the building of new facilities and infrastructure
expansions, along with the improvement of multimodal connectivity and transshipments. The
figure 1.3 figuratively explains how capacity shortages create congestion problems, and
congestion problems has its consequences as well such as, time delays, which result in cost
increases. The capacity shortage problem, along with the ones it creates, need to be addressed
in order for maritime transport system terminal to work efficiently and minimize its impact
towards inefficiencies of the whole supply chain (other modes) and port service cost increase.
Figure1.3. Consequences of Capacity Shortages at Seaports (Islam and Olsen, 2013)
9
2. LITERATURE REVIEW
Evidence that SD can be used to study and improve the MTS is found in the literature.
Our literature review focuses on the applicability of SD in the field of maritime transportation
and indicates that SD is applied to many components of the MTS including maritime
disruption studies, port-related studies, and vessel-related studies among others.
2.1. MTS STUDIES USING SD
2.1.1. Maritime Disruption SD Studies
Disruptive events such as the 9/11 terrorist attacks, 2002 Los Angeles/Long Beach
lockout, and Hurricane Katrina increased the awareness of policy makers and researchers
about the importance of maritime security. Lattila and Saranen (2011) showed that SD could
be used to study the impact of general disruptive events in the MTS. More specifically, the
authors used SD to investigate potential risk scenarios on the Gulf of Finland and illustrated
that a disruption results in export loss (in tons) (Lattila & Saranen, Multimodal
Transportation Risk in Gulf of Finland Region, 2011).
When a disruption occurs in the MTS, the system needs to recover to the pre-
disruption throughput level. This process is described as the resiliency of a system. In
general, resiliency has two dimensions, vulnerability and adaptive capacity (Dalziell &
McManus, 2004). Omer et al. (2012) and Croope and McNeil (2011) used SD to study the
resiliency of the MTS. Constructing a resilient MTS can minimize potential losses. Research
shows that maritime ports are vulnerable against disruptions due to their strategic geographic
locations, and a disruption will result in negative local and global impacts (Omer et al.,
2012). In a similar vein, Croope and McNeil (2011) used SD to study the resiliency of critical
infrastructures and disruption-related costs. Transportation systems in general and
specifically the MTS are comprised of critical infrastructure (Clinton, 1996). Critical
infrastructures are the core elements of the Nations’ economic and societal assets (Croope &
McNeil, 2011).
To decrease vulnerability and increase resiliency; security policies are established by
governments and private entities. Yeo, Pak, and Yang (2013) investigated the impacts of
security policy changes. Their research illustrated that new security measures can have both
positive and negative impacts on cost and port efficiency (Yeo et al., 2013). To summarize,

10
disruptions have negative impacts the MTS. The literature shows that SD has been used to
model disruption complexities and uncertainties in the MTS.
2.1.2. Port-Related SD Studies
A portion of the maritime transportation system system dynamics (MTSSD) literature
focuses on the implementation of SD to conduct port-related studies. Dundovic et al. (2009),
Dvornik et al. (2006), and Munitic et al. (2003) applied a SD model to study port-handling
processes. These studies considered loading and unloading operations from ship to shore,
transfer operations from shore to wagons and trucks, and warehouses. Similarly, Cheng et al.
(2010) focused on the berth and yard operations, which are complex, and handled separately
in terms of planning and decision-making. Their research used SD to analyze these two
interdependent subsystems and their respective impacts on the overall port performance.
Overall, SD simulation is a powerful tool to handle the complex port transshipment
processes, but only a limited number of SD studies have been conducted for ports (Cheng, et
al., 2010).
Another extension of port-related SD studies is the investigation of the port economics.
For instance, Ho et al. (2008) studied port expansion decision and its economic outcomes.
Their study showed that if the expected revenue and throughput cannot be generated, the
expansion decision will lead to a financial dilemma. In addition, their study showed that
simply increasing the number of ports in a specific region may not result in a positive
economic impact because ports need to be supported by other infrastructures such as
warehouses and shipping connectivity (Ho, et al. 2008). Mingming (2011) illustrated the
relationships between port investments, port capacity, economic contribution of ports, and
aggregate economy relationship through SD modeling. Li and Wang (2013) analyzed the
economic contribution of ports to the regional economy. The authors also integrated an input-
output analysis and an econometrics model with their SD simulation. Their integrated
methodology is shown to be a powerful tool to analyze port economics (Li & Wang, 2013).
2.1.3. Vessel-Related SD Studies
System dynamics has been used to study the global shipping market in the MTS to
understand the behavior of shipping freight rates (Randers & Göluke, 2007). Their model
successfully explained the behavior of the tanker market since 1950 by only considering fleet
size and fleet utilization data (Randers & Göluke, 2007). Engelen et al. (2009) researched the
11
arbitrage between different vessel types, such as handy, Panamax, and capsize, and explained
the correlation of freight rates for different ship segments. Dikos et al. (2006) developed a SD
model to use as a decision support tool for freight rates and risk management for the tanker
industry. Wijnolst (1975) focused on the relations between national fleet development and
national objectives in developing countries. Wijnolst (1975) considered productivity of ships
and investment in new ships.
2.1.4. Other MTS SD Studies
Other studies have utilized SD to study the MTS. Schade and Schade (2005) and Fiorello
et al. (2010) developed a holistic SD approach. Schade and Schade (2005) integrated five
models (transportation, macroeconomic, regional economic, policy, and environmental) into
one aggregated model titled ESCOT. The authors developed a sub-model for transportation
including water, rail, road, and air that aims to reach a sustainable transportation system and
estimates the economic impacts of the German transportation system. Fiorello et al. (2010)
built their SD model upon the ESCOT model (Schade & Schade, 2005). Fiorello et al. (2010)
considered road, rail, and maritime transportation in their ASTRA (Assessment of Transport
Strategies) model and measured investments, capacities, and their respective economic
outcomes. Videira et al. (2012) also used a qualitative SD approach for maritime policy
development which indicates that cooperation between policy-makers and stakeholders is
crucial to selecting the best policy.
2.1.5. Summary
Our review of the MTSSD literature shows that SD is applicable to studying MTS.
Engelen et al. (2009) claimed that SD has a potential of applications in a variety areas of
maritime transportation research. In addition, SD has the ability of overcoming the
drawbacks of time-series and statistical models (Dikos, et al., 2006). SD modeling also takes
causality into account, allows what-if scenario analysis, and can be adapted to study
fundamental changes in the system. Furthermore, sensitivity analysis can be conducted within
the model, which can help policy makers to better analyze the outcomes of MTS policy
changes (Dikos, et al., 2006).
12
2.2. CLASSIFICATION OF THE MTS SD LITERATURE
In this section, we classify the literature review findings to clarify the current body of
knowledge and identify future research questions. We classify the literature into study region,
types of ports studied, intermodal transportation considered, types of causal relations
considered, variable classifications, stock and flow diagram elements, and sensitivity and
scenario analysis considerations.
2.2.1. MTS SD Application Classification
2.2.1.1. Study Region
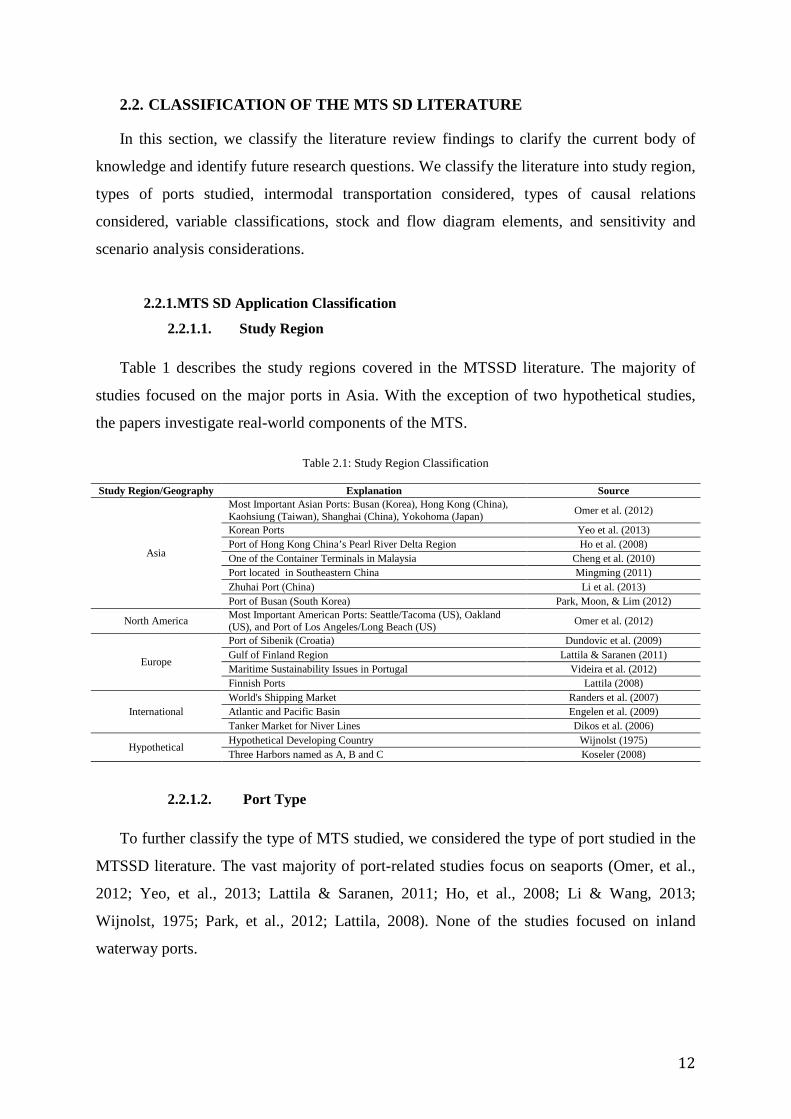
Table 1 describes the study regions covered in the MTSSD literature. The majority of
studies focused on the major ports in Asia. With the exception of two hypothetical studies,
the papers investigate real-world components of the MTS.
Table 2.1: Study Region Classification
Study Region/Geography Explanation Source
Asia
Most Important Asian Ports: Busan (Korea), Hong Kong (China), Kaohsiung (Taiwan), Shanghai (China), Yokohoma (Japan) Omer et al. (2012)
Korean Ports Yeo et al. (2013) Port of Hong Kong China’s Pearl River Delta Region Ho et al. (2008) One of the Container Terminals in Malaysia Cheng et al. (2010) Port located in Southeastern China Mingming (2011) Zhuhai Port (China) Li et al. (2013) Port of Busan (South Korea) Park, Moon, & Lim (2012)
North America Most Important American Ports: Seattle/Tacoma (US), Oakland (US), and Port of Los Angeles/Long Beach (US) Omer et al. (2012)
Europe
Port of Sibenik (Croatia) Dundovic et al. (2009) Gulf of Finland Region Lattila & Saranen (2011) Maritime Sustainability Issues in Portugal Videira et al. (2012) Finnish Ports Lattila (2008)
International World's Shipping Market Randers et al. (2007) Atlantic and Pacific Basin Engelen et al. (2009) Tanker Market for Niver Lines Dikos et al. (2006)
Hypothetical Hypothetical Developing Country Wijnolst (1975) Three Harbors named as A, B and C Koseler (2008)
2.2.1.2. Port Type
To further classify the type of MTS studied, we considered the type of port studied in the
MTSSD literature. The vast majority of port-related studies focus on seaports (Omer, et al.,
2012; Yeo, et al., 2013; Lattila & Saranen, 2011; Ho, et al., 2008; Li & Wang, 2013;
Wijnolst, 1975; Park, et al., 2012; Lattila, 2008). None of the studies focused on inland
waterway ports.
13
2.2.1.3. Intermodal Transportation Consideration
The third literature classification considers whether or not intermodal transportation is
studied. Intermodal transportation studies generally investigate the advantages and
disadvantages of the various transportation modes. For instance, bulk freight can be first
transported by vessel or barge and then transferred directly to rail car and delivered to the
customer. Based on our review, there is limited work that utilizes SD in maritime
transportation within an intermodal context (Lattila & Saranen, 2011; Dvornik, et al., 2006;
Koseler, 2008).
2.2.1.4. Causal Relation Variables
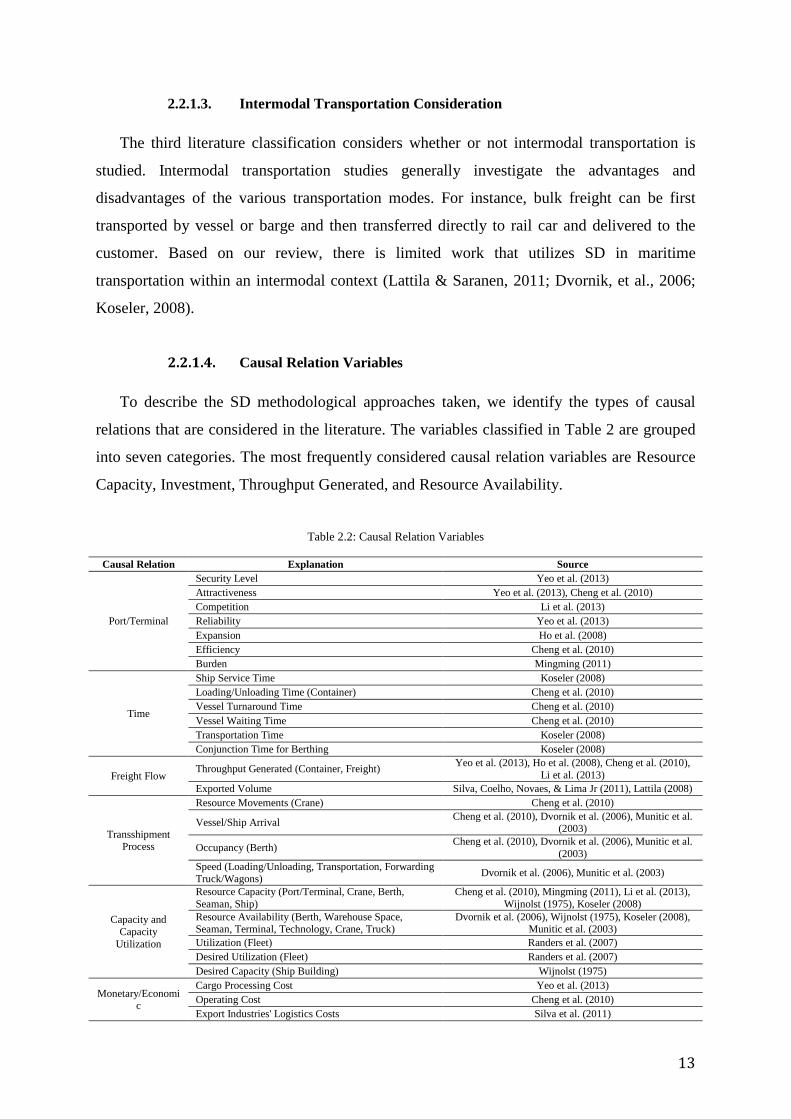
To describe the SD methodological approaches taken, we identify the types of causal
relations that are considered in the literature. The variables classified in Table 2 are grouped
into seven categories. The most frequently considered causal relation variables are Resource
Capacity, Investment, Throughput Generated, and Resource Availability.
Table 2.2: Causal Relation Variables
Causal Relation Explanation Source
Port/Terminal
Security Level Yeo et al. (2013) Attractiveness Yeo et al. (2013), Cheng et al. (2010) Competition Li et al. (2013) Reliability Yeo et al. (2013) Expansion Ho et al. (2008) Efficiency Cheng et al. (2010) Burden Mingming (2011)
Time
Ship Service Time Koseler (2008) Loading/Unloading Time (Container) Cheng et al. (2010) Vessel Turnaround Time Cheng et al. (2010) Vessel Waiting Time Cheng et al. (2010) Transportation Time Koseler (2008) Conjunction Time for Berthing Koseler (2008)
Freight Flow Throughput Generated (Container, Freight) Yeo et al. (2013), Ho et al. (2008), Cheng et al. (2010),
Li et al. (2013) Exported Volume Silva, Coelho, Novaes, & Lima Jr (2011), Lattila (2008)
Transshipment Process
Resource Movements (Crane) Cheng et al. (2010)
Vessel/Ship Arrival Cheng et al. (2010), Dvornik et al. (2006), Munitic et al. (2003)
Occupancy (Berth) Cheng et al. (2010), Dvornik et al. (2006), Munitic et al. (2003)
Speed (Loading/Unloading, Transportation, Forwarding Truck/Wagons) Dvornik et al. (2006), Munitic et al. (2003)
Capacity and Capacity
Utilization
Resource Capacity (Port/Terminal, Crane, Berth, Seaman, Ship)
Cheng et al. (2010), Mingming (2011), Li et al. (2013), Wijnolst (1975), Koseler (2008)
Resource Availability (Berth, Warehouse Space, Seaman, Terminal, Technology, Crane, Truck)
Dvornik et al. (2006), Wijnolst (1975), Koseler (2008), Munitic et al. (2003)
Utilization (Fleet) Randers et al. (2007) Desired Utilization (Fleet) Randers et al. (2007) Desired Capacity (Ship Building) Wijnolst (1975)
Monetary/Economic
Cargo Processing Cost Yeo et al. (2013) Operating Cost Cheng et al. (2010) Export Industries' Logistics Costs Silva et al. (2011)

14
Time Charter Rate Randers et al. (2007)
Investment (Port/Terminal, Ship Building Capacity) Cheng et al. (2010), Mingming (2011), Li et al. (2013), Wijnolst (1975)
Foreign Trade (Export, Import) Mingming (2011), Wijnolst (1975), Lattila (2008) Maritime Carrier Profit Silva et al. (2011) Port Economic Contribution (GDP, Employment) Mingming (2011), Li et al. (2013) Exchange Rates Lattila (2008) Inflation Lattila (2008)
Disruption Possibility of Security Incident Yeo et al. (2013) Congestion (Port, Yard, Berth) Ho et al. (2008), Cheng et al. (2010)
2.2.1.5. Variable Type
We classify the variable types employed grouped into endogenous, exogenous, and
excluded variables as shown in Table 3. In SD modeling, the researcher develops a
hypothesis which can explain the phenomena endogenously (Sterman, 2000). The exogenous
variables are the ones that are out of the boundaries of the model. Exogenous variables in a
SD model are not part of the feedback structure but do impact the system behavior. There are
also excluded variables that are not considered in the model. In Table 3, we also illustrate the
types of stock, flow rate, and delay variables that are utilized in the MTSSD literature.
Table 2.3: Variable Classification
Variable Type Explanation Source
Endogenous Variables Considered
Domestically Generated Throughput Ho et al. (2008) Travel Cost and Time Fiorello et al. (2010)
Supply Function Engelen et al. (2006), Dikos et al. (2006)
Container Inventories Koseler (2008) Capacity (Crane, Ocean Carrier) Koseler (2008) Empty Container Flows Koseler (2008) Loading/Unloading Crane Capacity Koseler (2008) Harbor Productivity Koseler (2008)
Exogenous Variables Considered
Container Capacity Lattila (2011) Throughput that originate from Mainland China and from Taiwan Ho et al. (2008) Ship Arrival Dvornik et al. (2006) Demand Dikos et al. (2006), Koseler (2008) Export of the Bulk Commodity Wijnolst (1975) Price of the Commodity Wijnolst (1975) Freight Rate Wijnolst (1975)
Excluded Variables Considered
Urban Public Expenditure Policies on Roads and Rail Ho et al. (2008) Berthing Conjunction Time Koseler (2008) Total Number of Ocean Carriers Koseler (2008) Profit Koseler (2008) Labor Koseler (2008) Transportation Costs Koseler (2008) Investment in Technology Koseler (2008) Ship Service Time Koseler (2008)
Stock/Level/State Variables
Empty Container Inventories Koseler (2008) Container Volume Yeo et al. (2013) GDP Aggregate Mingming (2011), Li et al. (2013) Hinterland Backlog Lattila & Saranen (2011) Port Throughput/Transshipment Ho et al. (2008), Park et al. (2012) Cargo on Board and Cargo Delivered Engelen et al. (2006) Capacity moved from Another Port Lattila & Saranen (2011) Port Capacity Mingming (2011), Li et al. (2013) Ships, Lay-up, Scrap Dikos et al. (2006) Ships at Ports Omer et al. (2012)
Flow/Rate/Derivative Variables Ships/Vessels Omer et al. (2012), Cheng et al. (2010),

15
Engelen et al. (2006) Containers Yeo et al. (2013) Empty Containers Koseler (2008)
Capacity (Cranes, Port) Lattila & Saranen (2011), Mingming (2011)
Freight Lattila & Saranen (2011),
Ho et al. (2008), Li et al. (2013), Park et al. (2012)
Money Mingming (2011), Li et al. (2013) New Ship Rate Dikos et al. (2006) Lay-up Rate Dikos et al. (2006) Scraping Rate Dikos et al. (2006)
Delay/Lag Variables
Demand Lag to Capacity Expansion Ho et al. (2008)
Between the Ordering and the Delivery of the Vessel Engelen et al. (2006), Dikos et al. (2006)
Between Port Investment and Port Capacity Increase Mingming (2011)
2.2.1.6. Sensitivity and Scenario Analysis
The MTSSD literature is classified in terms of the employment of sensitivity and scenario
analysis grouped into disruption-related, capacity-related, and other analyses in Table 4.
Table 2.4: Sensitivity and Scenario Analysis
Sensitivity and Scenario Analysis Explanation Source
Disruption-related
Security Level Yeo et al. (2013) Disaster Response Time Croope et al. (2011) Probability of Disruption Occurrence Croope et al. (2011) Different Port Closures due to Oil Spillage Lattila & Saranen (2011)
Capacity-related
Warehouse Capacity Dundovic et al. (2009)
Ship Capacity Dundovic et al. (2009), Koseler (2008)
Hinterland Capacity Lattila & Saranen (2011) Different Level of Port Expansions Ho et al. (2008)
Other Demand Change Randers et al. (2007), Dikos et al. (2006), Lattila (2008)
Quay Crane Moves per Hour Cheng et al. (2010)
2.2.2. MTS SD Methodology Classification
Since we are investigating SD as a methodological approach to studying the MTS, we
also classify the MTSSD literature in the context of methodology descriptors. We grouped
the relevant literature into six methodology descriptors including sub-model consideration,
model integration, simulation period, software selection, modeling challenges and
difficulties, and validation and verification techniques.
2.2.2.1. Model Integration
First, we identify the literature that considered subsystems. Several papers (Yeo et al.,
2013; Croope et al., (2011), Fiorello et al., (2010); Cheng et al., 2010; Dvornik et al., 2006;

16
Videira et al., 2012; Dikos et al., 2006; Koseler, 2008; Park et al. 2012; and Munitic et al.,
2003) considered MTS subsystems that are interconnected with each other.
Some scholars considered another type of model integrated with their SD model to
analyze their problem of interest. The list of integrated models and corresponding studies are
listed in Table 5. Table 2.5: Integration of SD with Other Models
Integration with Other Model Source Network Optimization Omer et al. (2012) Input-Output Li et al. (2013) Econometrics Li et al. (2013) Regression Park et al. (2012), Lattila (2008)
2.2.2.2. Simulation Period Employed
The MTSSD literature in Table 6 is classified according to the simulation period
employed.
Table 2.6: Simulation Period Employed
Simulation Period Explanation Source Hours 720 and 1500 Hours Lattila & Saranen (2011)
Days 2 and 4 Days Croope et al. (2011) 360,750, and 1500 Days, Time Step=1day Koseler (2008) 250 and 730 Days Lattila & Saranen (2011)
Months 170 Months, Time Step=1 Month Engelen et al. (2006) 72 Time Periods (i.e. Months), Time Step=0.25 (i.e. weeks) Engelen et al. (2009)
Years
1970 - 2020, Time Step=1 Year Yeo et al. (2013) 10 Years Ho et al. (2008) 1990-2050 Fiorello et al. (2010) 2007-2009, Time Step=1 Year Mingming (2011) 2007-2025 Li et al. (2013) 1950-2010, Time Step=1 Year Randers et al. (2007) 1980-2002, Time Step=1 Quarter Dikos et al. (2006) 1970-2010, Time Step=1 Year Wijnolst (1975) 1998-2007 Park et al. (2012) 2010-2030 Lattila (2008)
2.2.2.3. Software Utilized
The list of software products utilized in the reviewed MTSSD literature is shown in Table
7.
Table 2.7: Software Utilized
Software Source
Vensim Omer et al. (2012), Yeo et al. (2013), Fiorelloet al. (2010), Engelen et al. (2006), Santella, Steinberg, & Parks (2009), Li et al. (2013), Lattila O. L. (2008)
Powersim Dundovic et al. (2009), Dvornik et al. (2006), Dikos et al. (2006), Park et al. (2012), Munitic et al. (2003) Stella Croope et al. (2011) iThink Cheng et al. (2010) DYNAMO Wijnolst (1975)

17
2.2.2.4. Modeling Challenges
We identified two major classifications of modeling challenges found in the literature as
data-related and complexity-related challenges shown in Table 8,
Table 2.8: Modeling Challenges
Challenge Explanation Source
Data-related Availability
Santella et al. (2009), Videira et al. (2012), Engelen et al. (2009), Dikos et al. (2006),
Lattila (2008) Accuracy/Reliability Ho et al. (2008), Dikos et al. (2006) Transformations Lattila (2008)
Complexity-related
Keep the Model Size Manageable Fiorelloet al. (2010), Randers et al. (2007) Define Metric(s) to Capture System Performance Omer et al. (2012), Croope et al. (2011)
Identify Various Types of Interdependencies/Feedbacks Croope et al. (2011), Lattila & Saranen (2011), Santella et al. (2009), Li et al. (2013)
Quantify the Dependencies between the Variables Ho et al. (2008), Engelen et al. (2006), Santella et al. (2009)
Many Assumption Requirements Croope et al. (2011) Capture Changes in the System Over Time Croope et al. (2011) Entities Possess Characteristic of Heterogeneity Silva et al. (2011) Involve Broad Stakeholder Groups and Lack of Information Management Videira et al. (2012)
2.2.2.5. Validation/Verification Techniques
Table 9 classifies the validation/verification techniques that are utilized in the MTSSD
literature. The most common validation/verification technique is comparing model outputs
with historical data and implementing a case study.
Table 2.9: Validation/Verification Techniques
Validation/Verification Technique Source
Compare with Historical Data and Implement a Case Study
Yeo et al. (2013), Dundovic et al. (2009), Croope et al. (2011), Cheng et al. (2010), Engelen, Dullaert, & Vernimmen (2009),
Santella et al. (2009), Mingming (2011), Li et al. (2013), Randers et al. (2007), Dikos et al. (2006), Lattila (2008)
Sensitivity Analysis Ho et al. (2008), Santella et al. (2009), Koseler (2008), Park et al. (2012) Expert Reviews Santella et al. (2009)

18
3. CONCEPTUAL REPRESENTATION OF MTS USING SD
Naylor et al. (1996) define simulation as the process of designing a mathematical
or logical model of a real system and then accompanying it with computer-based
experiments. These experiments are the ones that help to describe, explain, and predict the
behavior of the real system over an anticipated period of time. System dynamics (SD)
modeling, as intended by its precursor Jay Forrester, is concerned with the dynamic
behavior of systems. In other words: SD focuses on the behavior of systems over time. In
system dynamics modeling, the modeler attempts to identify the patterns of behavior being
exhibited by important system variables; and then builds a model that can mimic these
patterns. Once a model has this capability, it can be used as a laboratory for testing
policies aimed at altering a system's behavior in desired ways (Sterman, 2000).
Previous studies that have applied the system dynamics approach in the
transportation field are: Towill (1996) when analyzed how the supply chain responded to
various improvements within the system to enhance business performance, Dimitrios et al.
(2007) when built an SD model to evaluate dynamic capacity planning of remanufacturing
in closed-loop supply chains, and Disney et al. (1997) when established policies to
understand how supply chain would respond to robust changes in lead time and
randomness in demand. Other researchers have applied system dynamics modeling to
study the effects of transshipments on supply chain behavior (Hong-Minh et al., 2000) and
the effects of Vendor-Managed Inventory on transport operation (Disney et al., 2003).
Previous research on transportation using SD and our review of literature in section
2, have demonstrated the capability of this methodology within this rather complex field.
Although, SD modeling has been utilized for problem solving within the maritime
transportation field, limited research addresses the impact of managing limiting factors in
maritime transportation’s system and infrastructures has on multimodal system’s
efficiency and consequently, the system’s efficiency as well. In order to be able to
determine what will improve the MTS or how it can be improved, a thorough
understanding is needed in what is the impact these investments and restoration of the
infrastructure of the MTS has towards the system as a whole.
System dynamics focuses on the system’s internal mechanism and structure. It
stresses the relationship between units and information feedbacks, and also depicts the
non-linear logic functions and delay factors inside the system. This research proposes a
system dynamics mechanism for addressing issues of optimal transportation
19
infrastructures needed to maintain competitive advantage in the world.
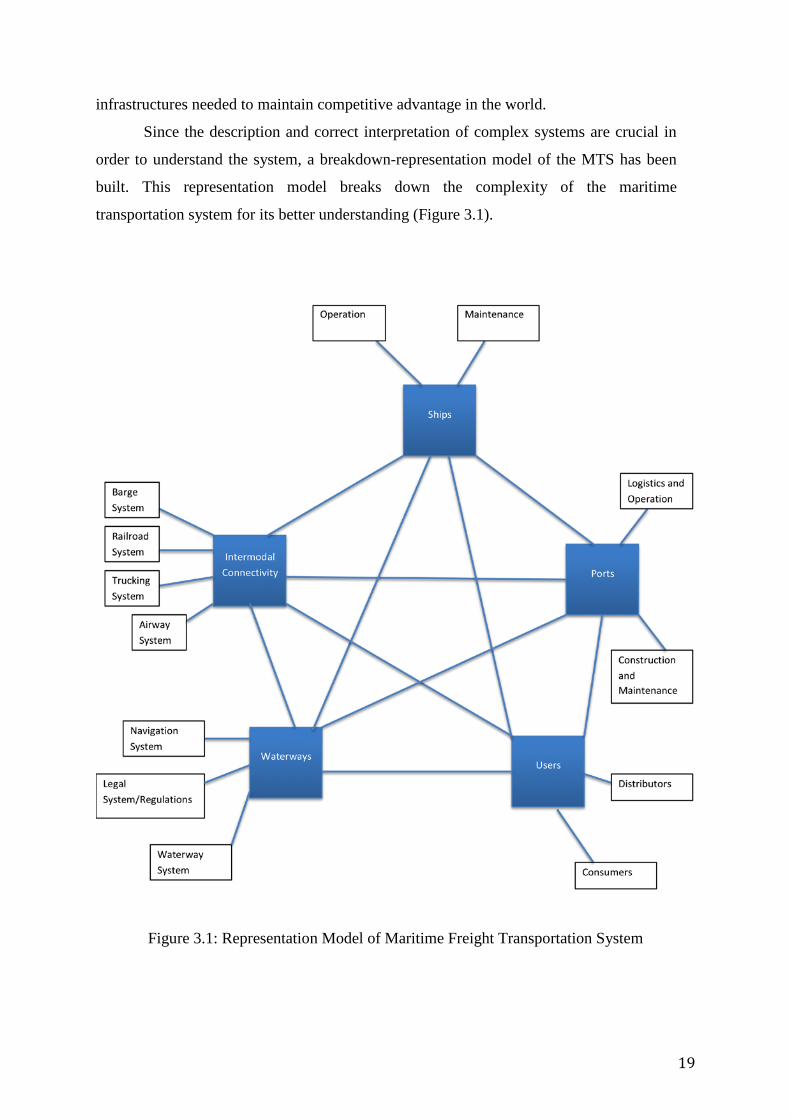
Since the description and correct interpretation of complex systems are crucial in
order to understand the system, a breakdown-representation model of the MTS has been
built. This representation model breaks down the complexity of the maritime
transportation system for its better understanding (Figure 3.1).
Figure 3.1: Representation Model of Maritime Freight Transportation System

20
3.1. INTRODUCTION TO THE SYSTEM DYNAMICS MODELING PROCESS
In an engineering environment models are made to better understand the real world
and real life. With the help of these models, problems can be simplified and the simplified
models provide an opportunity for the examination of these problems as well as for the
analysis of emerging ideas of solution to these problems. It is desired to mimic a system’s
structure and imitate its behavior as similar as possible to real life scenarios and captivate its
whole essence and functioning in order to simulate the system’s behavior. System Dynamic
is not the only simulation technique that is targeted at helping to learn about complexity.
Different types of models have been in use for decades in order to describe transportation
networks. Another example is the utilization of Agent Based Modeling (ABM), which has
helped in the representation and analyses of complex, non-linear or discrete behavior and the
interactions of its agents. These models, then make it possible to portray real systems using
qualitative and quantitative parameters, so further on they can be examined.
In order to use SD methodology, the system under study must be considered a
complex system. Maritime transportation systems are often complex with many different
types of parameters and their relationships. Most of the time, those parts are connected in
such complicated ways that they form a complex system whose property and behavior is not
simply defined. Other characteristics that can be found in maritime transportation systems
that make it a complex system are (Sterman, 2000):
1) Dynamic
2) Tightly coupled
3) Governed by feedback
4) Nonlinear (effect rarely proportional to cause)
5) Path-dependent
6) Counterintuitive (cause and effect are distant in time and space)
7) Policy Resistant (obvious solutions to problems fail or worsen the situation)
8) Characterized by trade-offs (time delays)
Hence, because MTS possesses those characteristics that make it a complex system,
conventional transportation simulation models are in some cases difficult to use since in
complex systems it is sometimes restricted or difficult to attain data or relationships, which
are necessary to describe the system. In certain cases, system dynamics is that strategic

21
approach used in modeling such systems and determining their behavior.
The description and correct interpretation of complex systems are crucial in order
to understand the system. A simulation framework model is built with the objective of
understanding the economic impact investing in infrastructure has on the efficiency of the
MTS. Before discussing the steps of modeling in systems dynamics in depth as described
by John Sterman in his book Business Dynamics, it is important to mention that modeling
is an iterative process. Models will go though constant iteration, continual questioning,
testing and refinement. Figure 3.2 demonstrates the modeling process as an iterative cycle.
Figure 3.2: SD Steps on the Modeling Process (Sterman, 2000)
The classic system dynamic modeling steps as described by Sterman are the 5 main
iterative steps as seen on Figure 3.2:
1) Problem Articulation (Boundary Selection)
2) Develop a Dynamic Hypothesis to explain the cause of the problem
3) Formulation of a Simulation Model
4) Testing
5) And, Policy Design and Evaluation.
But all those five (5) main steps are broken down into more steps in order to ensure that
the modeling process is as smooth and successful as possible. A detailed description of all
the SD modeling steps broken down into its simpler stages takes place ahead.
1) Problem Articulation
The most important step in modeling is problem articulation. That is supposed to
answer the questions: What problem are you trying to address? What is the real problem,

22
not just the symptom of difficulty? A clear purpose is essential for a successful modeling
study to take place. For example: In this research our objective is to identify the impact
addressing Maritime’s system limitations has on the other modes of transport taking part n
the supply chain along the effects of these impacts on the efficiency of MTS over time.
A model is said to be your mental representation of real-life. Although, one tries to
copy as close to real-life as possible, no model is perfect since it cannot include all the
causes of that problem in your model. That is why, within problem articulation, a model
boundary is selected by the definition of key variables and establishing a time horizon.
Example: for the purposes of this research, the time horizon selected was from year 2000
to year 2020 since the U.S. Department of Transportation data suggests significant
increase (70%) in freight traffic in that year; and the key variables, as those that studies
have proven to have a negative impact in maritime transportation industry.
Key variables can be divided in three categories that aid in the construction of the
model. The endogenous variables are those factors in a causal model or causal system
whose values are determined by the states of other variables in the system. Those variables
are said to be “arising from within” and one can control them within the problem and use
them to explain how the behavior changes if you alter the structure. In contrast, exist the
exogenous variables. These are described as “ arising from without” and are those factors
that cannot be controlled but are part of the problem and will explain the dynamics of
variables that are relevant and whose behavior over time is under study, in terms of other
variables that were assumed. And similar to any other model being built, a limit boundary
needs to be established. Therefore, the third category of key variable, the excluded
variables which are those who although might affect the problem, will not be looked upon.
2) Formulation of Dynamic Hypothesis
Once the problem has been defined over an appropriate time horizon, and
boundaries and key variables have also been established, the development of a theory,
better known as the dynamic hypothesis, should take place in order to model. The
hypothesis is dynamic because it must provide an explanation of the dynamics
characterizing the problem in terms of the underlying feedback and stock and flow
structure of the system. And it is a hypothesis, because it is always provisional, subject to
revision as you learn more from the modeling process and from the real world.
Fundamental modes and structures of dynamic behavior exist in order to explain the
behavior of the system that arises from its structure.

23
In order to define the dynamic hypothesis of your model, there is need in
understanding its behavior. Example: in this research, the dynamic hypothesis is defined to
follow a S-Shaped Growth with Overshoot and Oscillations Structure. It is desired that the
system counteract any disturbances that intent to move the state of the system away from
the desired goal. And since no state can grow or decline forever, in the beginning the
system is expected to grow exponentially because of the managing and improving of those
causing capacity shortages and congestion, will result beneficial to the efficiency of the
system, but then gradually will slow down until the state of the system reaches an
equilibrium level that might face some overshoot and oscillate around the desired goal due
to time delays amongst many other disruptive factors. The purpose of the model is to find
a way of ameliorating and addressing those negative impacts affecting the maritime
transportation’s efficiency in order to achieve an effective supply chain. This will result in
that in the case a discrepancy between the desired and actual state of the MTS exists, a
corrective action will be initiated to bring the state of the system back in line or close to
the desired goal.
Figure3.3. MTS’s Dynamic Hypothesis
3) Formulation of a Simulation Model
a) Causal-Loop Diagram
After the defining the Problem Articulation and Dynamic Hypothesis of the study,
the next step is the formulation. First, a causal loop diagram is developed in order to
understand the relationships among the various main variables in the MTS. Causal loop
24
diagrams are simply a map from the mental model one attains after doing research and
studying the MTS system, in order to simplify the building of the stock and flow
simulation. In the causal loop, variables are linked with arrows from cause to effect.
Later, with the use of a computer software, in this research Vensim PLE VEntana
Systems Software will be used, those relationships in the causal loop diagram are
converted into the stock and flow diagram, which is the simulation of the model. Stock
variables are those that accumulate over time and provide desired information under
study. These stock variables are the ones that characterize the state of the system and are
those we want to see how their variation behaves over time. These stocks variables are
represented in the model inside boxes. The flows are those variables that represent the
amount of change their corresponding stocks undergo during a particular unit of time. And
the rest of the variables that are not either flow or a stock, are known to be auxiliary
variables because aid in the model for variables to behave as desired or expected over the
same period of time.
4) Testing
After having built your model and input all the corresponding equations that
explain the relationship between the elements (variables) composing the system, the
correct data needs to be found and input into the model. Data finding can be one of the
challenges of this methodology, since it is crucial in order for the model to behave as close
to the real-life scenario as possible. This step is really important since is the one that will
help you validate your model. During this step is when you reassure that your model is a
representation of a real-life situation. Also, it is during testing that a serious of things
should take place to corroborate that the model is a real representation of the system that
wanted to be replicated.
a) Robustness under extreme conditions
During the testing test it is really important that the model is compared to real life
situations of that replicated system in order to corroborate that the model built behaves
adequately to the desired purpose. Therefore, different modifications are made to confirm
that the model behaves realistically when stressed by extreme conditions or scenarios.
b) Sensitivity
Also, during the testing it is essential to view and understand how the model behaves
given some uncertainty in some parameters, initial conditions, and delays, amongst other
25
variations. These will help with the coming up of decision-making solutions to the
problem at hand.
5) Policy Design and Evaluation
And, the last but not least important part of the modeling steps is the policy design
and evaluation of those policies. Is during this final step that new decision rules, strategies
and structures might be defined to try in the model because eventually want to be applied
into the real world. Before applying them into the real world, a series of what-if analysis
will be implemented into the model, to forecast and understand what the consequences of
those implementations will have on the whole system. This will aid in coming up with the
best of strategies to obtain the best of the desired outcomes.
One of the benefits of systems dynamics approach is that it can be modified in
order to attain a better insight and understanding of the behavior of a system’s structure
over a time period. As mentioned previously, this methodology of SD modeling goes
through constant iteration, continual questioning, testing and refinement, until the best is
achieved to solve the problem in question.
3.2. PRELIMINARY MODEL REPRESENTATION
In his paper, Containerization, inter-port competition, and port selection, Slack
claimed that a good maritime port, addressed: congestion, the networks for linking other
mode, the convenience of customs clearance, the capability of facility, port cost, scale and
safety. Therefore, in this report, the model built represents the maritime transportation
system and subsystems along with the modes of truck and rail. More specifically, the
model is structured to represent a container terminal along with its subsystems of
container yard and dock, connected to the modes of truck and rail. The operations of each
subsystem are determinant factors to the efficiency of the overall maritime-logistics,
supply chain operation. Because of the complexity of the container terminal operations,
the subsystems of yard and dock are executed separately.
A container terminal is that place where vessels arrive and anchor at a dock, and
containers are loaded and unloaded by cranes and stored in a yard to wait for later

26
transshipments: truck, rail, or vessel to retrieve them. As seen, the capacity and time
factors are vital for this operation to be as smooth as possible. By building a SD
simulation model that captures this whole system and its subsystems, it is possible to look
at the impact and the interactions amongst all of them and create a better understanding of
the big picture and make decisions on what can be done to improve as desired.
A causal loop diagram describing the operations between the maritime transportation
system (operations of: container terminal, and dock and yard) with those operations of
truck and rail transport systems was developed. Because a causal loop is capable of
capturing the dynamic processes of a system by demonstrating the chain effect through a
set of related variables and back to the original cause or effect, this model helped
understand the whole system and how our objective of maximizing service (throughput)
will be obtained. Figure 1.4 shows the model built in order to study the impacts of
addressing capacity shortages and congestion have on the overall performance of the
system.
The systems of the truck and rail modes are in more general operational terms than
the maritime transportation system, since our interest is to understand in depth the impact
maritime and addressing its limiting factors have on the other two modes and the
throughput of the system as a whole. The maritime transport system is broken down so
that the dynamics of dock operations, the dynamics of yard operations, and consequently
the dynamics of the container terminal operations can be exhibited profoundly, and
understand the impact each has on congestion and capacity.

27
Figure1.4. MTS’s Causal Loop Diagram
An explanation of the dock subsystem would be: an increase in vessel arrival will
increase the dock occupancy rate and therefore, will increase the number of vessel queuing
for dock. This will provoke the dock congestion problem, increases vessel waiting time and
therefore increase the vessel turnaround time. These increases in time, due to capacity
limitations and congestion, will have a decrease in throughput (efficiency) and therefore,
decrease the port attractiveness and result in operational and service costs increases due to
insufficient demand from vessels.
Since this is a feedback process and everything has an effect either directly or
indirectly towards everything else, due to the shortage in dock availability, congestion
resulted, and will have a long effect on the demand of truck and rail modes along with their
throughput shortage, hence, making their systems inefficient and incompetent.

28
Ultimately, the model built measures the total throughput of the system so that one
can see the impact of addressing the maritime issues of capacity shortages and congestion,
which are limiting factors in the maximizing of the freight service potential. By different
scenarios one can be able to determine, which is the best alternative in order to maximize
freight service (throughput)?

29
4. CONCLUSIONS AND FUTURE WORK
This final report presents a review of the MTS SD literature and illustrated the wide
variety of SD applications in MTS SD. The literature shows that SD models are successfully
utilized to describe the complexity of MTS. Our classification of the MTS SD literature
indicates that the existing body of knowledge primarily consists of port studies but there are a
few papers that study vessels. Several researchers integrated their SD model with other
models and conducted sensitivity analysis and scenario analysis to confirm the validity of
their SD modeling, Moreover, the literature review shows that the MTS SD literature
primarily face data-related and complexity-related modeling challenges.
This literature review is an initial step in understanding and demonstrating the causal
relations between the different components of the MTS. In the future, a SD model will be
built in order to further study the behavior of the MTS and understand the impacts on the
major elements of MTS performance. This will help with decision-making strategies that will
be beneficial for MTS stakeholders and can result in a competitive advantage for policy
makers.

30
ACKNOWLEDGEMENTS
The research presented in this final report was partially supported by the Center for
Transportation Infrastructure and Safety, a National University Transportation Center
(NUTC) at Missouri University of Science and Technology. We also acknowledge the match
funds provided by Missouri University of Science and Technology and University of
Arkansas. Their financial support is gratefully appreciated. In-kind support was provided by
the University of Arkansas in affliction with the Mack-Blackwell Rural Transportation
Center and Maritime Transportation Research and Education Center.

31
BIBLIOGRAPHY
American Association of Port Authorities. (2007). America’s Ports Today. Retrieved December 15, 2013, from http://aapa.files.cms- plus.com/PDFs/Campaign%20doc%20-%202-pg%20%20(Sept.%202007).pdf Cheng, J. K., Tahar, R. M., & Ang, C.-L. (2010). Understanding the Complexity of Container
Terminal Operation Through the Development of System Dynamics Model. International Journal of Shipping and Transport Logistics, 429-443.
Chopra, S. and Meindl, P. Supply chain management: strategy, planning, and operation, Pearson Prentice Hall, New Jersey, 2007. Clinton, W. J. (1996). Executive order 13010, establishing the president’s. Washington,
D.C.: U.S. Government Printing Office.
Corbett, James J. and Winebrake, James. (2008). The Impacts of Globalization on International Maritime Transport Activity. Energy and Environmental Research Associates, the United States. Global Forum on Transport and Environment in a Globalizing World 10-12, Guadalajara, Mexico. Croope, S. V., & McNeil, S. (2011). Improving Resilience of Critical Infrastructure Systems
Postdisaster. Transportation Research Record: Journal of the Transportation Research Board, No. 2234, pp. 3–13.
Dalziell, E. P., & McManus, S. T. (2004). Resilience, Vulnerability, and Adaptive Capacity: Implications for System Performance. International Forum for Engineering Decision Making (IFED). Stoos Switzerland.
Darabi, Hamid., Gorod, Alex., Mansouri, Mo., Wakeman, Thomas., Efatmaneshnik, Mahmoud. (2012). Using Hybrid Modeling to Simulate Maritime Transportation System of Systems (MTSoS). Annual IEEE Systems Conference. Dikos, G., Marcus, H. S., Papadatos, M. P., & Papakonstantinou, V. (2006). Niver Lines: A
System-Dynamics Approach to Tanker Freight Modeling. Interfaces 36 (4), 326-341.
Dimitrios Vlachos., Patroklos Georgiadis., Eleftherios Iakovou. (2007). A system dynamics model for dynamic capacity planning of remanufacturing in closed-loop supply chains. Computers & Operations Research. Vol. 34, Issue 2. Pp. 367-394. Disney, S.M., Naim, M.M., Towill, D.R., 1997. Dynamic simulation modelling for lean logistics. International Journal of Physical Distribution and Logistics Management 3–4 (27), 174–196. Disney, S.M., Potter, A.T., Gardner, B.M., 2003. The impact of vendor managed inventory on transport operations. Transportation Research Part E (39), 363–380. Dundovic, C., Bilic, M., & Dvornik, J. (2009). Contribution to the Development of a Simulation Model for a Seaport in Specfic Operating Conditions. Promet-Traffic & Transportation, Vol. 21, 331-340.

32
Dundovic, C., Bilic, M., & Dvornik, J. (2009). Contribution to the Development of a
Simulation Model for a Seaport in Specfic Operating Conditions. Promet – Traffic&Transportation, Vol. 21, 331-340.
Dvornik, J., Munitic, A., & Bilic, M. (2006). Simulation Modelling and Heuristics Optimization of Material Flow of the Port Cargo System. Promet- Traffic&Transportation, Vol. 18, 123-135.
Engelen, S., Dullaert, W., & Vernimmen, B. (2009). Market Efficiency within Dry Bulk Markets in the Short Run: a Multi-agent System Dynamics Nash Equilibrium. Maritime Policy and Management, 385-396.
Engelen, S., Meersman, H., & Voorde, E. V. (2006). Using System Dynamics in Maritime Economics: an Endogenous Decision Model for Shipowners in the Dry Bulk Sector. Maritime Policy and Management, 141-158.
Fiorello, D., Fermi, F., & Bielanska, D. (2010). The ASTRA Model for Strategic Assessment of transport Policies. System Dynamics Review vol 26, No 3, 283-290.
Forrester, J. W. (1961). Industrial Dynamics. Cambridge, MA: M.I.T. Press. Fu, M. (2011). Port and Economy Relationship Analysis by System Dynamics. International
Conference on Transportation Engineering (ICTE) (pp. 162-167). Chengdu, China: American Society of Civil Engineers.
Ho, K. H., Ho, M. W., & Hui, C. M. (2008). Structural Dynamics in the Policy Planning of Large Infrastructure Investment under the Competitive Environment: Context of Port Throughput and Capacity. Journal of Urban Planning and Development, 9-20.
Hong-Minh, S.M., Disney, S.M., Naim, M.M., 2000. The dynamics of emergency transshipment supply chains. International Journal of Physical Distribution and Logistics Management 9 (30), 788–815.
House of Representatives. House Hearing, 112 Congress. (April 18, 2012). Subcommittee on Water Resources and Environment of the Committee on Transportation and Infrastructure. How Reliability of the Inland Waterway System Impacts Economic Competitiveness. International Maritime Transportation (IMO). (2013). Sustainable Development: IMO's Contribution Beyond Rio +20. Islam, S., Olsen, T.L. (2013). Factors affecting seaport capacity: Managerial implications for a simulation framework. 22nd National Conference of the Australian Society for Operations Research. Koseler, S. (2008). Intermodal Logistics System Simulation Model & the Empty Container Flows.

33
Lattila, L., & Saranen, J. (2011). Multimodal Tansportation Rsk in Gulf of Finland Region. World Review of lntermodal Transportation Research, Vol. 3, No. 4, 376-394.
Lattila, O. L. (2008). Combining Advanced Forecasting Methods with System Dynamics – the Case of Finnish Seaports.
Li, D., & Wang, X. (2013). System Dynamics Simulation Model for Port Economy Analysis. Proceedings of the Sixth International Conference on Management Science and Engineering Management, Lecture Notes in Electrical Engineering 185 (pp. 475-482). Springer London.
Margreta, M., Ford, C. and Adhi Dipo, M. (2009). U.S. Freight on the Move: Highlights from the 2007 Commodity Flow Survey Preliminary Data. RITA Bureau of Transportation Statistics. U.S. Department of Transportation. Marine Highway Program. (2013). Marine Administration. U.S. Department of Transportation.http://www.marad.dot.gov/ships_shipping_landing_page/mhi_home/m hi_home.htm Mingming, F. (2011). Port and Economy Relationship Analysis by System Dynamics.
American Society of Civil Engineers, (pp. 162-167).
Munitic, A., Simundic, S., & Dvornik, J. (2003). System Dynamics Modelling of Material
Flow of the Port Cargo System. System Dynamics Conference. New York City, New York.
Nijkamp, P., Vleugel, J. M., Maggi, R., & Masser, I. (1994). Missing transport networks in Europe. Aldershot: Avebury. Omer, M., Mostashari, A., Nilchiani, R., & Mansouri, M. (2012). A Framework for
Assessing Resiliency of Maritime Transportation Systems. Maritime Policy & Management: The Flagship Journal of International Shipping and Port Research, 685-703.
Park, N.-K., Moon, D. S., & Lim, C.-K. (2012). Port Choice Model of Transhipment Cargo Using System Dynamics. In D.-W. Song, & P. Panayides, Maritime Logistics Contemporary Issues (pp. 69-90). Emerald Group Publishing Limited.
Randers, J., & Göluke, U. (2007). Forecasting Turning Points in Shipping Freight Rates: Lessons from 30 Years of Practical Effort. System Dynamics Review, 253-284.
Santella, N., Steinberg, L. J., & Parks, K. (2009). Decision Making for Extreme Events: Modeling Critical Infrastructure Interdependencies to Aid Mitigation and Response Planning. Review of Policy Research, Volume 26, Number 4, 409-422.

34
Schade, B., & Schade, W. (2005). Evaluating Economic Feasibility and Technical Progress of Environmentally Sustainable Transport Scenarios by a Backcasting Approach with ESCOT. Transport Reviews, Vol. 25, No. 6, 647-668.
Silva, V. M., Coelho, A. S., Novaes, A. G., & Lima Jr, O. F. (2011). Remarks on Collaborative Maritime Transportation's Problem Using System Dynamics and Agent Based Modeling and Simulation Approaches. IFIP Advances in Information and Communication Technology, 245-252.
Slack, B. (1985) Containerization, inter-port competition, and port selection. Maritime Pohcy and Management, Vol. 12, No. 4, pp 293-303 Sterman, John D., 2000. BusinessDynamics: Systems Thinking and Modeling of a Complex World. McGraw-Hill Companies, Inc. Stock, James., Lambert, Douglas. (2001). Strategic Logistics Management. The McGraw- Hill Companies, Inc. New York, NY. 4th Edition. Pp. 329. Towill, D.R., 1996. Industrial dynamics modeling of supply chains. International Journal of Physical Distribution and Logistics Management. Vol. 2. Issue 23. Pp. 23–42. U.S. Department of Transportation. (2002). Office of Freight Management and Operations. Freight News. “Freight Analysis Framework”. U.S. Maritime Administration. (2009). America’s Ports and Intermodal Transportation System. Videira, N., Lopes, R., Antunes, P., Santos, R., & Casanova, J. L. (2012). Mapping Maritime
Sustainability Issues with Stakeholder Groups. Systems Research and Behavioral Science Syst. Res. 29, 596–619.
Wijnolst, N. (1975). The Dynamics of National Fleet Development. Dynamica, 3-10.
Yeo, G.-T., Pak, J.-Y., & Yang, Z. (2013). Analysis of Dynamic Effects on Seaports Adopting Port Security. Transportation Research Part A 49, 285- 301.