fe simulation of the indentation deformation of sic...
TRANSCRIPT

1. IntroductionFor metallic materials a suitable correlation existsbetween the wear behaviour and the hardness. Forpolymeric materials such a general usable depend-ence wasn’t found yet. Though some correlationsbetween the wear performance and material proper-ties were already prepared, they are valid alwaysonly for special materials and circumstances [1–3].Especially under abrasive conditions the microscaled deformation behaviour plays an important
role in the wear process, because of the occurringmechanisms like ‘micro ploughing’ and ‘micro cut-ting’.Tribotechnical systems are characterised by aninterplay between contacting surfaces which are inrelative motion to one other. If the surfaces are notseparated by a lubricating film (for example suffi-cient lubricant is not available or its viscosity is toolow to produce an appropriate lubricating filmthickness) the surfaces are in direct contact. The
705
*Corresponding author, e-mail: [email protected]© BME-PT and GTE
FE simulation of the indentation deformation ofSiC modified vinylester composites in respect totheir abrasive wear performance
D. Felhõs1, R. Prehn1, K. Váradi2, A. K. Schlarb1
1Institut für Verbundwerkstoffe GmbH (Institute for Composite Materials), Kaiserslautern University of Technology, D-67663 Kaiserslautern, Erwin-Schrödinger-Straße, Germany
2Department of Machine and Product Design, Budapest University of Technology and Economics, H-1111 Budapest, Mûegyetem rkp. 3., Hungary
Received 10 June 2008; accepted in revised form 1 September 2008
Abstract. The abrasive sliding friction and wear behaviours of silicon carbide (SiC) filled vinylester (VE) composites wereinvestigated. The average grain size of the incorporated SiC particles was varied, holding the volume content of them inevery case at 16 vol%. Mechanical properties (hardness, compression modulus, yield stress) of the filled and neat VE weredetermined. The tribological properties were investigated in block (composite) – on – ring (steel) test configuration. Thesteel counter bodies were covered with abrasive papers of different graining. Coefficient of friction (COF) and specificwear rate of the VE + SiC composites were determined. It was observed that the wear resistance increases with increasingaverage filler grain size and with decreasing abrasiveness of the counter surface. The COF of the VE + SiC composites isindependent of the size of the incorporated particles, but it is strongly influenced by the abrasiveness of the counter body.The worn surfaces of the VE + SiC systems were analysed in scanning electron microscope (SEM) to deduce the typicalwear mechanisms. The size effect of the SiC filler particles onto the abrasive wear characteristics was investigated byassuming that the roughness peaks of the abrasive paper and the indenter of the microhardness test cause similar microscaled contact deformations in the composites. Therefore FE method was used to simulate the micro scaled deformationprocess in the VE + SiC systems during microindentation tests. The FE results provided valuable information on how toexplain the size effect of the incorporated SiC filler.
Keywords: polymer composites, reinforcements, thermosetting resins, modelling and simulation, abrasive wear
eXPRESS Polymer Letters Vol.2, No.10 (2008) 705–717Available online at www.expresspolymlett.comDOI: 10.3144/expresspolymlett.2008.84
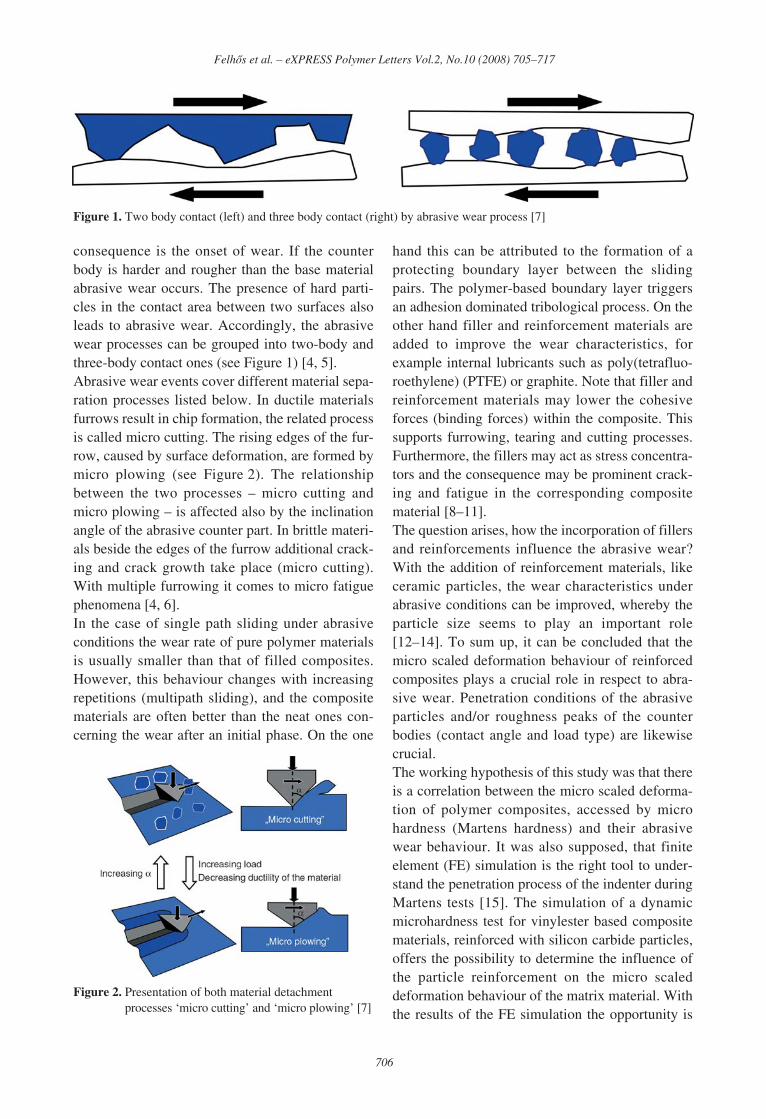
consequence is the onset of wear. If the counterbody is harder and rougher than the base materialabrasive wear occurs. The presence of hard parti-cles in the contact area between two surfaces alsoleads to abrasive wear. Accordingly, the abrasivewear processes can be grouped into two-body andthree-body contact ones (see Figure 1) [4, 5].Abrasive wear events cover different material sepa-ration processes listed below. In ductile materialsfurrows result in chip formation, the related processis called micro cutting. The rising edges of the fur-row, caused by surface deformation, are formed bymicro plowing (see Figure 2). The relationshipbetween the two processes – micro cutting andmicro plowing – is affected also by the inclinationangle of the abrasive counter part. In brittle materi-als beside the edges of the furrow additional crack-ing and crack growth take place (micro cutting).With multiple furrowing it comes to micro fatiguephenomena [4, 6].In the case of single path sliding under abrasiveconditions the wear rate of pure polymer materialsis usually smaller than that of filled composites.However, this behaviour changes with increasingrepetitions (multipath sliding), and the compositematerials are often better than the neat ones con-cerning the wear after an initial phase. On the one
hand this can be attributed to the formation of aprotecting boundary layer between the slidingpairs. The polymer-based boundary layer triggersan adhesion dominated tribological process. On theother hand filler and reinforcement materials areadded to improve the wear characteristics, forexample internal lubricants such as poly(tetrafluo-roethylene) (PTFE) or graphite. Note that filler andreinforcement materials may lower the cohesiveforces (binding forces) within the composite. Thissupports furrowing, tearing and cutting processes.Furthermore, the fillers may act as stress concentra-tors and the consequence may be prominent crack-ing and fatigue in the corresponding compositematerial [8–11].The question arises, how the incorporation of fillersand reinforcements influence the abrasive wear?With the addition of reinforcement materials, likeceramic particles, the wear characteristics underabrasive conditions can be improved, whereby theparticle size seems to play an important role[12–14]. To sum up, it can be concluded that themicro scaled deformation behaviour of reinforcedcomposites plays a crucial role in respect to abra-sive wear. Penetration conditions of the abrasiveparticles and/or roughness peaks of the counterbodies (contact angle and load type) are likewisecrucial.The working hypothesis of this study was that thereis a correlation between the micro scaled deforma-tion of polymer composites, accessed by microhardness (Martens hardness) and their abrasivewear behaviour. It was also supposed, that finiteelement (FE) simulation is the right tool to under-stand the penetration process of the indenter duringMartens tests [15]. The simulation of a dynamicmicrohardness test for vinylester based compositematerials, reinforced with silicon carbide particles,offers the possibility to determine the influence ofthe particle reinforcement on the micro scaleddeformation behaviour of the matrix material. Withthe results of the FE simulation the opportunity is
706
Felhõs et al. – eXPRESS Polymer Letters Vol.2, No.10 (2008) 705–717
Figure 1. Two body contact (left) and three body contact (right) by abrasive wear process [7]
Figure 2. Presentation of both material detachmentprocesses ‘micro cutting’ and ‘micro plowing’ [7]

given to draw conclusions about the wear behav-iour under abrasive conditions.
2. Materials and material production
For the modification of the base vinylester (VE)resin silicon-carbide (SiC) was selected as rein-forcement material. With the help of the SiC parti-cles both the material stiffness, especially thecompression strength, and wear characteristicsunder abrasive conditions were to be improved. Inorder to consider the influence of the particle size,SiC particles with a middle grain size of 3 and9 µm, respectively, were used. Moreover a compos-ite material was produced, which contained SiCparticles in both sizes (3 and 9 µm). In each case16 vol% SiC were incorporated into the VE matrix.Further on these materials will be referred as mate-rial A (pure VE resin), material B (VE + 16 vol%SiC (3 µm)), material C (VE + 8 vol% SiC (3 µm) +8 vol% SiC (9 µm)) and material D (VE + 16 vol%SiC (9 µm)). The exact material compositions aresummarized in Table 1.For the production of the VE composites a labora-tory dissolver was used (Dispermat AE3-M, VMAGetzmann GmbH). The used VE (Synthopan UPM,Synthopol Chemistry) contained styrene ascrosslinking agent. The styrene content of the VEwas 25 vol%. Methyl ethyl ketone based peroxideserved as initiator. To crosslink the resin already atambient temperature, Oldopal 64 (Büfa Reaktions-mittel) accelerator was used, which is based oncobalt and dimethyl aniline. The so called coldcrosslinking has the advantage that the sedimenta-tion of relatively large and heavy filler materialscan be prevented because the resin begins to gelpromptly.After the mixing process, the materials were pouredin forms (dimensions: 100×100×10 mm3) and hard-ened at ambient temperature. In order to harden thesamples completely, they were transferred into a
furnace and kept for 60 minutes at 120°C. Speci-mens for material characterisation were preparedfrom these plates.
3. Experimental
3.1. Mechanical properties
In order to be able to simulate the deformationbehaviour of the materials, it is necessary to knowthe elastic modulus (material stiffness) and theyield stress (load where that the plastic deformationbegins) of the matrix material under compression.The related tests were accomplished on the pure VEresin (matrix) in accordance with the DIN 604 stan-dard, using an universal test equipment (1474Zwick, Ulm, Germany). The results are summa-rized in Table 2.
3.2. Density measurement
The density of the composites was measured usingthe Archimedes principle (buoyancy method withwater) according to the ISO 1183 standard. Thedensity measurements were done at a MettlerAT261 (Giessen, Germany) micro balance.
3.3. Microhardness tests
Microhardness tests were carried out on all materi-als using a dynamic ultra microhardness testing set(Shimadzu – type DUH 202) following the DIN50359-1 norm. The measurements were performedat two different maximum loads, 100 and 1500 mNrespectively. On each material 10 measurementswere made with a test speed of 70 mN/sec. The uni-versal hardness values (HU) were derived from themeasured penetration force F [N] and penetrationdepth h [mm] values in accordance with Equa-tion (1):
[MPa] (1)
3.4. Abrasive wear testsThe tribological behaviour of the composites wasdetermined in block-on-ring abrasion tests. Thisset-up was selected because there is a good analogybetween it and the sliding bearings contact situation
2·43.26 h
FHU =
707
Felhõs et al. – eXPRESS Polymer Letters Vol.2, No.10 (2008) 705–717
Table 1. Material compositions of the vinylester-basedcomposites
Materialname
Basis-polymer
SiC content(middle grain size)
A VE 00 vol% (pure resin)B VE 16 vol% SiC (3 µm)
C VE08 vol% SiC (3 µm) +08 vol% SiC (9 µm)
D VE 16 vol% SiC (9 µm)
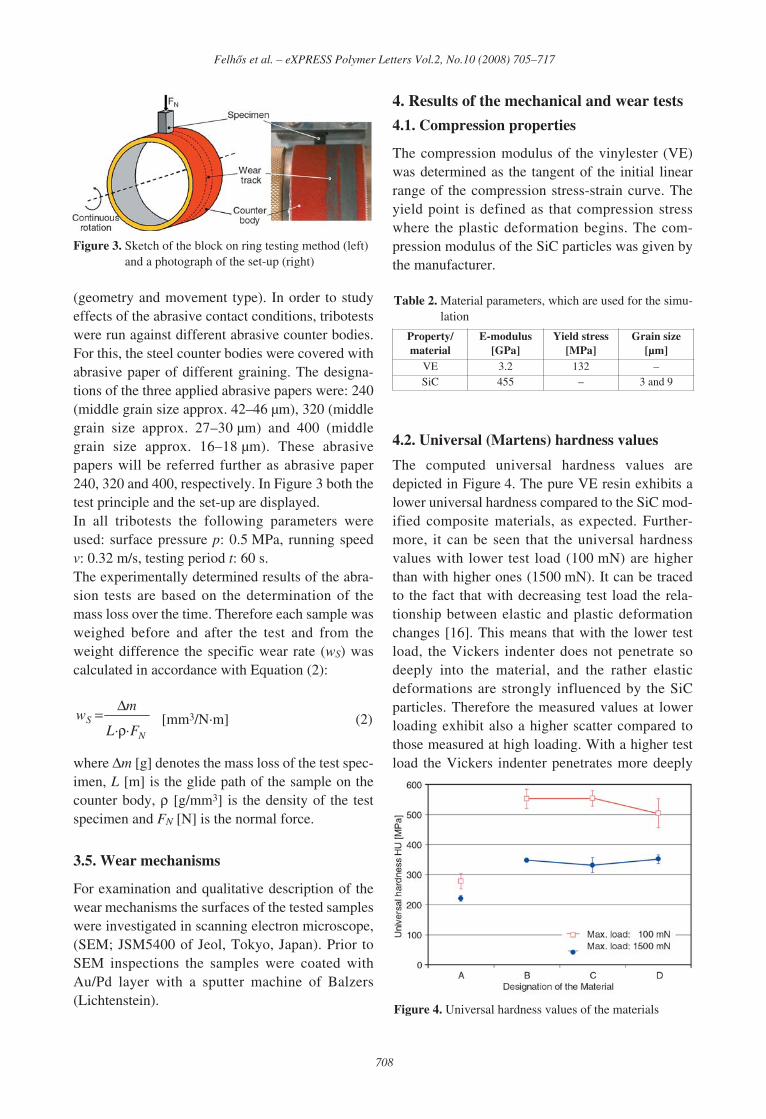
(geometry and movement type). In order to studyeffects of the abrasive contact conditions, tribotestswere run against different abrasive counter bodies.For this, the steel counter bodies were covered withabrasive paper of different graining. The designa-tions of the three applied abrasive papers were: 240(middle grain size approx. 42–46 µm), 320 (middlegrain size approx. 27–30 µm) and 400 (middlegrain size approx. 16–18 µm). These abrasivepapers will be referred further as abrasive paper240, 320 and 400, respectively. In Figure 3 both thetest principle and the set-up are displayed.In all tribotests the following parameters wereused: surface pressure p: 0.5 MPa, running speedv: 0.32 m/s, testing period t: 60 s.The experimentally determined results of the abra-sion tests are based on the determination of themass loss over the time. Therefore each sample wasweighed before and after the test and from theweight difference the specific wear rate (wS) wascalculated in accordance with Equation (2):
[mm3/N·m] (2)
where Δm [g] denotes the mass loss of the test spec-imen, L [m] is the glide path of the sample on thecounter body, ρ [g/mm3] is the density of the testspecimen and FN [N] is the normal force.
3.5. Wear mechanisms
For examination and qualitative description of thewear mechanisms the surfaces of the tested sampleswere investigated in scanning electron microscope,(SEM; JSM5400 of Jeol, Tokyo, Japan). Prior toSEM inspections the samples were coated withAu/Pd layer with a sputter machine of Balzers(Lichtenstein).
4. Results of the mechanical and wear tests
4.1. Compression properties
The compression modulus of the vinylester (VE)was determined as the tangent of the initial linearrange of the compression stress-strain curve. Theyield point is defined as that compression stresswhere the plastic deformation begins. The com-pression modulus of the SiC particles was given bythe manufacturer.
4.2. Universal (Martens) hardness values
The computed universal hardness values aredepicted in Figure 4. The pure VE resin exhibits alower universal hardness compared to the SiC mod-ified composite materials, as expected. Further-more, it can be seen that the universal hardnessvalues with lower test load (100 mN) are higherthan with higher ones (1500 mN). It can be tracedto the fact that with decreasing test load the rela-tionship between elastic and plastic deformationchanges [16]. This means that with the lower testload, the Vickers indenter does not penetrate sodeeply into the material, and the rather elasticdeformations are strongly influenced by the SiCparticles. Therefore the measured values at lowerloading exhibit also a higher scatter compared tothose measured at high loading. With a higher testload the Vickers indenter penetrates more deeply
N
SFL
mw
··ρ
Δ=
708
Felhõs et al. – eXPRESS Polymer Letters Vol.2, No.10 (2008) 705–717
Figure 3. Sketch of the block on ring testing method (left)and a photograph of the set-up (right)
Figure 4. Universal hardness values of the materials
Table 2. Material parameters, which are used for the simu-lation
Property/material
E-modulus[GPa]
Yield stress[MPa]
Grain size[µm]
VE 3.2 132 –SiC 455 – 3 and 9

into the material and an integral value for the hard-ness is determined, which is less influenced by localdifferences in the material. When higher test loadwas applied the scatter range was reduced and themeasured universal hardness values were very simi-lar to one another for the three different composites.It is recognizable that the two composite materials– B and C – exhibit the same universal hardness (at100 mN test load). However a lower average uni-versal hardness value was determined for the com-posite material D.
4.3. Specific wear rates
In Figure 5 the specific wear rates are representedas a function of the SiC particle size for the threeabrasive papers of different graining. As expected,the pure VE resin under these test conditionsexhibits very high wear rates hence these were notconsidered in the representation. The wear rate ofthe pure VE resin was at about 0.5 mm3/Nm againstabrasive paper 320.Figure 5 shows that the specific wear rate decreaseswhen the grain size of the used abrasive paperdecreases. It means that the wear also decreaseswith sinking abrasiveness of the counter body. Thecomposite material, which contains only 3 µm SiCparticles shows under all three conditions the high-est wear rates. Interestingly the same specific wearrate was found in the tests run against the two abra-sive papers 320 and 400. So it can be concludedthat the reduction of abrasiveness between thesetwo graining does not affect any more positivelythe wear characteristics.On the other hand the two materials C and D showpermanently decreasing wear rates with decreasing
abrasiveness of the counter body. Against theroughest abrasive paper 240 the material C showshigher wear values than material D. In case ofmaterials C and D the wear rate values practicallycoincide with decreasing abrasiveness of thecounter body (cf. results against the abrasive paper400 in Figure 5). The reason of this phenomenon isthat the smaller particles (3 µm) can be more easilybroken out if the abrasiveness of the counter bodyis high enough.
4.4. Coefficient of friction
During the wear tests the arising friction forceswere detected. From this the coefficients of friction(referred further as COF) can be determined as aquotient of the measured friction forces and theapplied normal force. The duration of tests was60 seconds. During the tests first an initial transienttribological process was observed. Due to this theaverage COF values were determined from the val-ues of the second half of the tests (from t = 30 tot = 60 seconds), see Figure 6. The COF values ofmaterial A aren’t considered in the representation.The COF value of material A against abrasivepaper 320 was about 0.7.Figure 6 shows that the three materials (B, C andD) have almost the same COF values independ-ently from the contained grain size of the SiC (atthe same abrasiveness of the counter body). More-over it can be clearly seen that the COF valuesincrease versus the decreasing abrasiveness of thecounter body. The rough abrasive paper and thecomposite glide more easily on each other becausethe large abrasive particles have small real contact
709
Felhõs et al. – eXPRESS Polymer Letters Vol.2, No.10 (2008) 705–717
Figure 5. Specific wear rates of the different composites
Figure 6. Detected coefficients of friction (COF) values(average values of the last 30 seconds of thetests)
area in the process zone. The real contact areaincreases with decreasing grain size of the abrasivepaper. This causes a more intensive contactbetween the counter body and the composite mate-rial and thus the COF increases. Fact is that the sizeratio of the particles in the abrasive paper and in thecomposites becomes even smaller with decreasingabrasiveness. Due to this the probability of colli-sions of filler and abrasive particles increases, caus-ing higher COF. This phenomenon is especiallydominant for material D.
4.5. Wear mechanisms
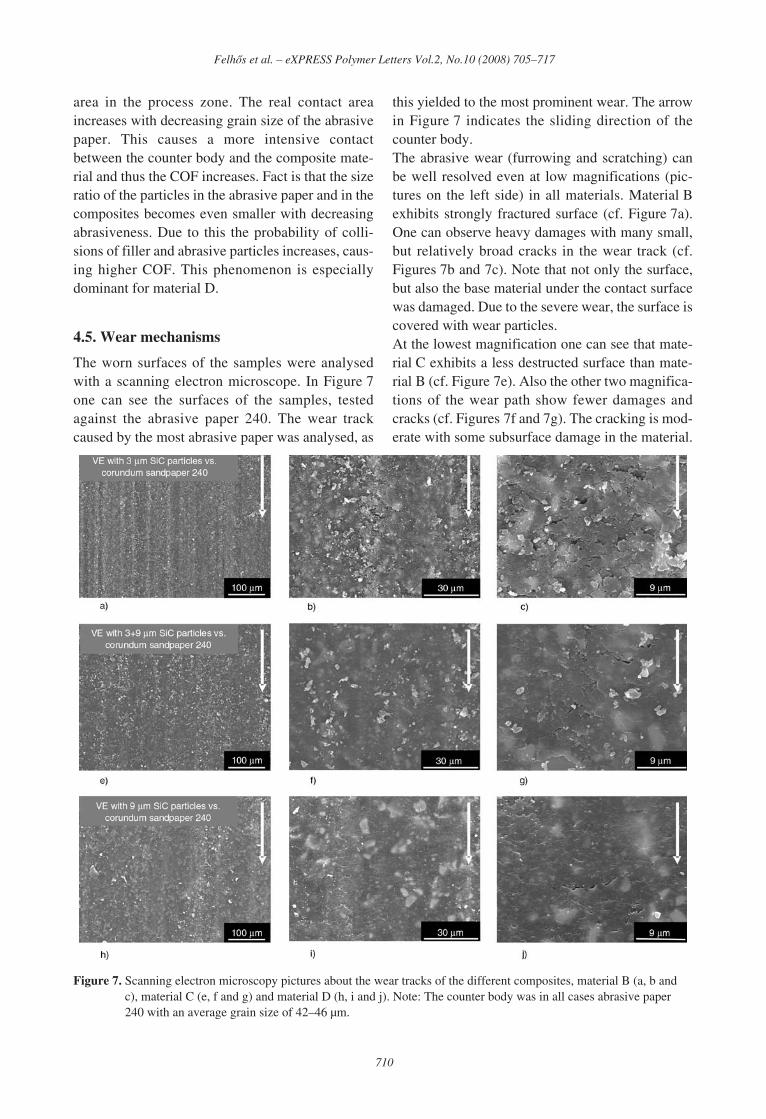
The worn surfaces of the samples were analysedwith a scanning electron microscope. In Figure 7one can see the surfaces of the samples, testedagainst the abrasive paper 240. The wear trackcaused by the most abrasive paper was analysed, as
this yielded to the most prominent wear. The arrowin Figure 7 indicates the sliding direction of thecounter body.The abrasive wear (furrowing and scratching) canbe well resolved even at low magnifications (pic-tures on the left side) in all materials. Material Bexhibits strongly fractured surface (cf. Figure 7a).One can observe heavy damages with many small,but relatively broad cracks in the wear track (cf.Figures 7b and 7c). Note that not only the surface,but also the base material under the contact surfacewas damaged. Due to the severe wear, the surface iscovered with wear particles.At the lowest magnification one can see that mate-rial C exhibits a less destructed surface than mate-rial B (cf. Figure 7e). Also the other two magnifica-tions of the wear path show fewer damages andcracks (cf. Figures 7f and 7g). The cracking is mod-erate with some subsurface damage in the material.
710
Felhõs et al. – eXPRESS Polymer Letters Vol.2, No.10 (2008) 705–717
Figure 7. Scanning electron microscopy pictures about the wear tracks of the different composites, material B (a, b andc), material C (e, f and g) and material D (h, i and j). Note: The counter body was in all cases abrasive paper240 with an average grain size of 42–46 µm.
Wear debris are less on the surface of C than ofmaterial B.The last composite, material D (cf. Figure 7h) suf-fered obviously the lowest damage and wear duringthe tribotests. The smallest enlargement shows araw surface without deep scratching or furrowing.The two other SEM pictures (cf. Figures 7i and 7j)confirm a moderately damaged surface structure.The cracks on the surface seem to be relativelyshort which are likely not deeply penetrating belowthe surface.The universal hardness values of the investigatedmaterials provide no interpretation related to theeffect of the filler particle size on the wear charac-teristics. Therefore we need to find another way toelucidate the mentioned size effect of the filler par-ticles.We assume that the abrasive roughness peaks andthe microindenter should cause similar deforma-tions in the composites, in spite of that the averagepenetration depth of the abrasive particles and thepenetration depth during the microhardness testsare probably different. Therefore to shed light onthe size effect of the SiC particles the FE methodwill be adopted to simulate the stress and strainbehaviour of the different composites duringmicroindentation tests.The micro scaled strain and stress distributions cal-culated by FE should be in correlation with theobserved wear performance of the different com-posites.
5. Simulation of the micro scaled stress andstrain behavior
The Cosmos/M Geostar FE software was used tosimulate the micro scaled deformation process dur-ing microindentation tests. Microhardness testswith a maximum load of 100 mN were FE mod-elled. The microhardness tests were carried outusing a Vickers diamond indenter. The Vickersindenter is pyramid shaped with a plane angle of136°. Due to the symmetrical shape of the indenter,one can assume that the loads are distributedequally at all four sides the diamond pyramid dur-ing the tests. This assumption makes it possible toreduce the simulation to a quarter model (see Fig-ure 8). Thus the available nodes (approx. 60 000)can be placed denser below the indenter.
The quarter models of the simulations correspondin all three cases to a volume of 200×200×200 µm3.The models contain in each case 50907 nodes and59357 elements (Solid elements with 8 nodes). Themodels are micro models, where the reinforcementparticles (SiC) are embedded in the matrix (VE).Both the VE matrix and the SiC particles exhibittheir own specific material properties. The materiallaw of the VE matrix is nonlinear. The characteris-tic values of the materials are summarized inTable 2.Because the models are built up from cubes of anedge length of 2 µm, the 3 µm SiC particles wereimplemented as cubes with an edge length of 4µm.The 9 µm SiC particles were modelled as cubes ofan edge length of 10 µm. The implementation ofthe fillers as cubes is probably right, because theSiC particles are of irregular form with sharp edges.A further assumption is that the SiC particles arepresent homogeneously in the matrix in macroscale, but nevertheless statistically distributed inmicro scale. This statistical distribution of the dif-ferent sized particles is to see in Figure 8, where theFE meshes of the three different materials (B, Cand D) are displayed. The SiC particles do notexhibit strictly given structure, but an irregular sta-tistic distribution. Further on we assumed that theSiC particles have perfect adhesion with the matrix.The penetration of the Vickers indenter into thematerial will be simulated using the considerationslisted above. The influence of the SiC particlesbeing present regarding the resulting stresses (vonMises stress) and strains (equivalent strains) will becalculated and demonstrated. The goal is to clarifythe influence of the reinforcement particle size ontothe micro scaled deformation behaviour of thematrix. Furthermore to find correlation between theFE calculated stress and strain distributions andbetween the wear characteristics of the differentcomposites.By the FE simulations the surface points of the per-fectly rigid Vickers indenter were fixed. Thesefixed points were linked to the surface of the com-posite materials by contact elements. The non-lin-ear FE calculations were force controlled. Thedriver force was introduced at the bottom of thequarter models, where a rigid plate was glued to thequarter model (see Figure 8). In the symmetryplanes of the quarter models the proper boundary
711
Felhõs et al. – eXPRESS Polymer Letters Vol.2, No.10 (2008) 705–717
conditions were applied and the modified Newton-Raphson method was used for the calculations [17].
6. Results of the simulations
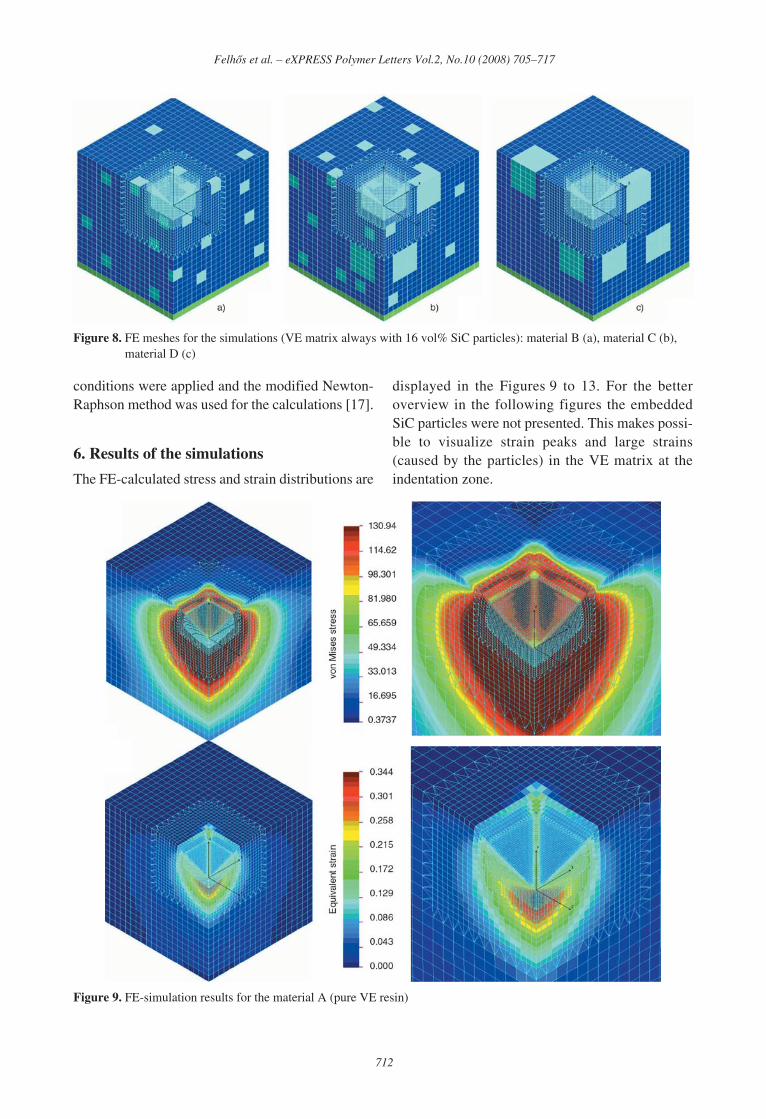
The FE-calculated stress and strain distributions are
displayed in the Figures 9 to 13. For the betteroverview in the following figures the embeddedSiC particles were not presented. This makes possi-ble to visualize strain peaks and large strains(caused by the particles) in the VE matrix at theindentation zone.
712
Felhõs et al. – eXPRESS Polymer Letters Vol.2, No.10 (2008) 705–717
Figure 9. FE-simulation results for the material A (pure VE resin)
Figure 8. FE meshes for the simulations (VE matrix always with 16 vol% SiC particles): material B (a), material C (b),material D (c)

6.1. Material A (pure VE resin)In Figure 9 the von Mises stress and the equivalentstrain distribution is displayed in the case of pureVE resin when the maximum normal load of100 mN is applied. It can be seen that both the aris-ing stresses and the strains concentrate immediatelybelow the indenter. With increasing distance to thecontact area, the value of the stress and strain per-manently decreases. Altogether a regular stress andstrain distribution can be observed in the matrix,similar to a regular Hertzian contact.
6.2. Material B (VE + 16 vol% SiC (3 µm))
Compared to the results of material A, material Bshows completely different stress and strain distri-butions. In Figure 10 one can see that both the vonMises stress- and the equivalent strain-distributionsare very strongly affected by the SiC particles in theindentation zone below the indenter. These distri-butions are not regular any more; they are stronglydisturbed by the incorporated particles. Local stress
peaks and large strains arise in the indentation zonebetween the individual particles and the matrix.The location with the highest equivalent strain of79.5% is hidden in Figure 10 therefore it is dis-played in Figure 12 (left) separately. It can be con-cluded that the small SiC particles change theirstarting position due to the applied load. Because ofit a strongly distorted zone with large strains will bedeveloped at their edges in the VE matrix. The aris-ing maximum equivalent strain is twice as high as itwas in the case of the pure VE resin.
6.3.Material C(VE + 8 vol% SiC (3 µm) +8 vol% SiC (9 µm))
In Figure 11 the simulation results of material C arerepresented. It can be clearly seen that both the aris-ing stresses and strains are affected considerably bythe incorporated particles. Because in Figure 11 theposition of the maximum equivalent strain value isnot visible, since this is at the corner of a small par-ticle below the surface, this position is separately
713
Felhõs et al. – eXPRESS Polymer Letters Vol.2, No.10 (2008) 705–717
Figure 10. FE-simulation results for the material B (3 µm SiC particles)
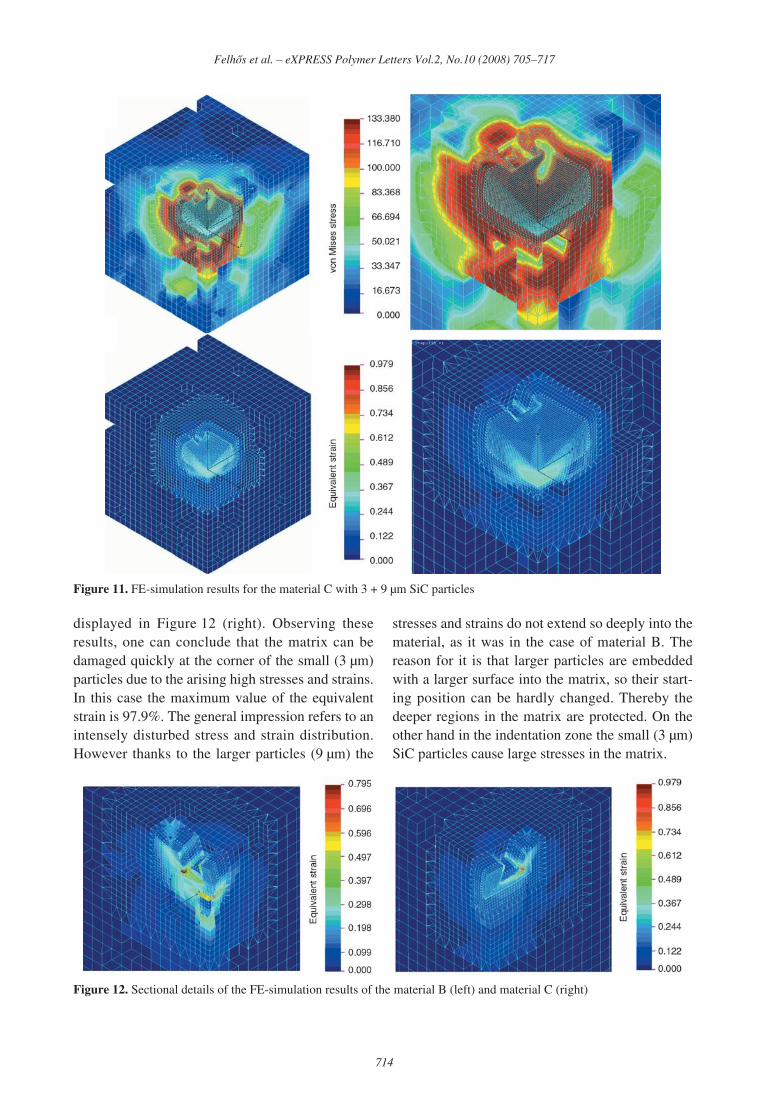
displayed in Figure 12 (right). Observing theseresults, one can conclude that the matrix can bedamaged quickly at the corner of the small (3 µm)particles due to the arising high stresses and strains.In this case the maximum value of the equivalentstrain is 97.9%. The general impression refers to anintensely disturbed stress and strain distribution.However thanks to the larger particles (9 µm) the
stresses and strains do not extend so deeply into thematerial, as it was in the case of material B. Thereason for it is that larger particles are embeddedwith a larger surface into the matrix, so their start-ing position can be hardly changed. Thereby thedeeper regions in the matrix are protected. On theother hand in the indentation zone the small (3 µm)SiC particles cause large stresses in the matrix.
714
Felhõs et al. – eXPRESS Polymer Letters Vol.2, No.10 (2008) 705–717
Figure 12. Sectional details of the FE-simulation results of the material B (left) and material C (right)
Figure 11. FE-simulation results for the material C with 3 + 9 µm SiC particles
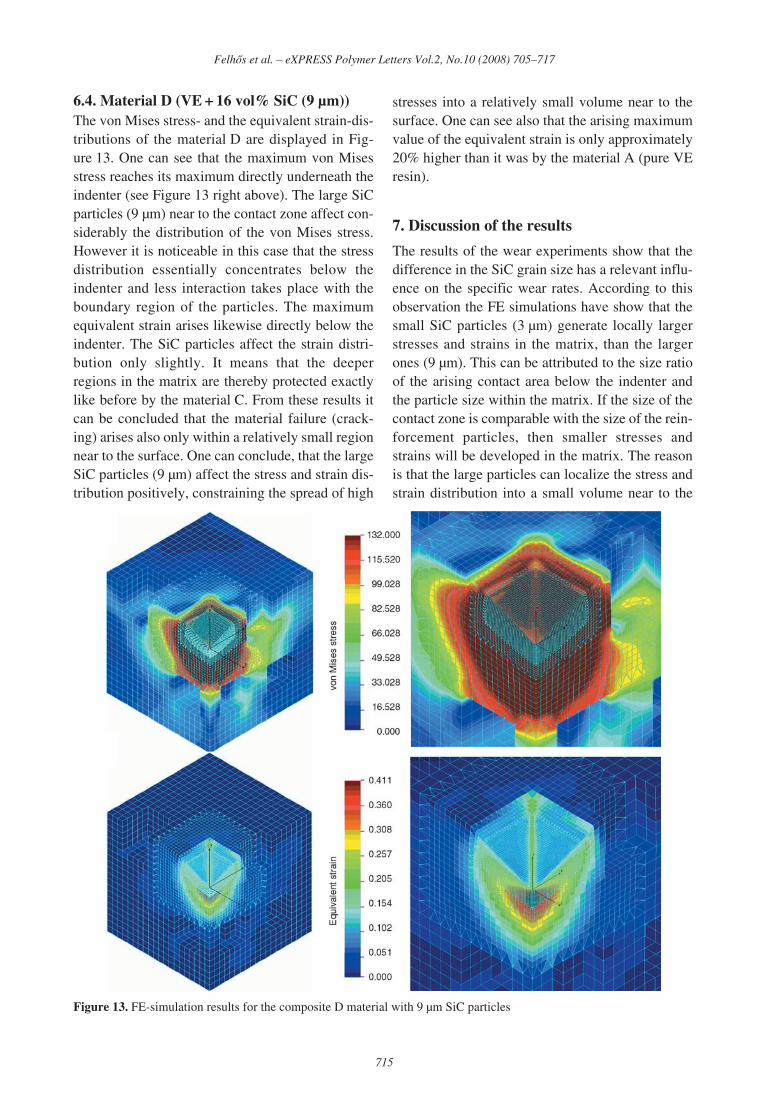
6.4. Material D (VE + 16 vol% SiC (9 µm))The von Mises stress- and the equivalent strain-dis-tributions of the material D are displayed in Fig-ure 13. One can see that the maximum von Misesstress reaches its maximum directly underneath theindenter (see Figure 13 right above). The large SiCparticles (9 µm) near to the contact zone affect con-siderably the distribution of the von Mises stress.However it is noticeable in this case that the stressdistribution essentially concentrates below theindenter and less interaction takes place with theboundary region of the particles. The maximumequivalent strain arises likewise directly below theindenter. The SiC particles affect the strain distri-bution only slightly. It means that the deeperregions in the matrix are thereby protected exactlylike before by the material C. From these results itcan be concluded that the material failure (crack-ing) arises also only within a relatively small regionnear to the surface. One can conclude, that the largeSiC particles (9 µm) affect the stress and strain dis-tribution positively, constraining the spread of high
stresses into a relatively small volume near to thesurface. One can see also that the arising maximumvalue of the equivalent strain is only approximately20% higher than it was by the material A (pure VEresin).
7. Discussion of the results
The results of the wear experiments show that thedifference in the SiC grain size has a relevant influ-ence on the specific wear rates. According to thisobservation the FE simulations have show that thesmall SiC particles (3 µm) generate locally largerstresses and strains in the matrix, than the largerones (9 µm). This can be attributed to the size ratioof the arising contact area below the indenter andthe particle size within the matrix. If the size of thecontact zone is comparable with the size of the rein-forcement particles, then smaller stresses andstrains will be developed in the matrix. The reasonis that the large particles can localize the stress andstrain distribution into a small volume near to the
715
Felhõs et al. – eXPRESS Polymer Letters Vol.2, No.10 (2008) 705–717
Figure 13. FE-simulation results for the composite D material with 9 µm SiC particles

surface. In contrast to it the small SiC particles inthe indentation zone will change strongly their geo-metrical position in the matrix due to the load of theindenter. Because of it the matrix in the environ-ment of the small particles is strongly stressed anddistorted which causes material damage. Thereforethe ideal composite material for abrasive wear con-ditions needs to contain an appropriate size distri-bution of the reinforcement materials.Further on based on the simulation results it can beexplained why the specific wear values of materialC and D will be nearly identical with decreasingabrasiveness. By the presence of large SiC particlesthe strain distribution is obstructed and the damageof the matrix below the indentation zone is moder-ated. Because proportionately less large particlesare present in the material C, the effect of these par-ticles comes only with decreasing abrasiveness tothe fore. Finally against abrasive paper 400 theabrasiveness of the counter body becomes so small(see chapter 3.4), that the tests provide nearly iden-tical wear values by both composite materials (Cand D).It can be noted that the experimentally determinedspecific wear rates and the FE simulation resultsshow the same tendencies. The FE results were cor-related also with the observed wear mechanisms ofthe composites, related to the density and depth ofthe surface cracking.As it was mentioned before the average depth of thepenetrations due to the abrasion and the penetrationdepth during the microhardness tests are not identi-cal. Even so the results and the tendencies showthat the above mentioned phenomenon (i.e. the sizeproportion of the reinforcement particles and theabrasive roughness peaks) is of basic importance.
8. Conclusions
This work has shown that there is no trivial connec-tion between the experimentally determined uni-versal hardness of the investigated materials andtheir wear performance. On the other hand the FEsimulations have highlighted that the arising stressand strain distributions in the VE matrix during themicroindentation process can be correlated with theabrasive wear characteristics.FE results indicated that the size of the reinforce-ment particles should be comparable with that of
the roughness peaks of the abrasive paper toachieve low wear.We can assume that the interfacial bonding strengthbetween the matrix and the SiC particles is similar,independently from the particle size. Accordinglythe resistance to change their geometrical positionincreases with increasing particle size. Thus largerreinforcement particles can withstand larger defor-mations, i.e. stronger roughness peaks, thereby pro-tecting the base material.Otherwise the wear resistance of a particle filledcomposite could be enhanced also by the improve-ment of the interfacial bonding strength betweenthe particles and the matrix [18]. Further on it isnecessary to note that the shape of the reinforce-ment particles is also extremely important in theview point of the material strength, which is influ-encing also the wear performance [19].Finally we think that the following observationscould refer to a connection between the universalhardness and measured COF values. It was foundthat the microindentation tests provide smaller uni-versal hardness values when higher loads areapplied as well as lower COF is to measure againststrongly abrasive surfaces. However, this assumedcorrelation was not checked within this study.
References[1] Tewari U. S., Bijwe J., Mathur J. N., Sharma I.: Stud-
ies on abrasive wear of carbon fibre (short) reinforcedpolyamide composites. Tribology International, 25,53–60 (1992).
[2] Harsha A. P., Tewari U. S.: The effect of fibre rein-forcement and solid lubricants on abrasive wearbehaviour of polyetherketone composites. Journal ofReinforced Plastics and Composites, 22, 751–767(2003).
[3] Briscoe B. J., Evanst P. D., Lancaster J. K.: Singlepoint deformation and abrasion of γ-irradiatedpoly(tetrafluoroethylene). Journal of Physics D:Applied Physics, 20, 346–353 (1987).
[4] Czichos H., Habig K-H.: Tribologie Handbuch- Rei-bung und Verschleiß. Vieweg, Braunschweig (1992).
[5] Friedrich K.: Friction and wear of polymer compos-ites. Elsevier, Amsterdam (1986).
[6] Fischer A.: Warmverschleiß durch körnige Medien. in‘Reibung und Verschleiß von Werkstoffen, Bauteilenund Konstruktionen; Tribologische Optimierung undSchadensbekämpfung. Kontakt und Studium’ (eds:Mettner M., Wippler E.) Expert Verlag, Renningen,141–153 (2004).
[7] Roberts S.: Surface engineering- Foliensammlung,http://www.surface-engineering.com (24.06.2006).
716
Felhõs et al. – eXPRESS Polymer Letters Vol.2, No.10 (2008) 705–717

[8] Uetz H., Wiedemeyer J.: Tribologie der Polymere.Hanser Verlag, München (1984).
[9] Oster F., Schlarb A. K.: HochtemperaturbeständigePolymer-Beschichtungen für tribologische Anwen-dungen. IVW GmbH, Kaiserslautern (2005).
[10] Váradi K., Felhõs D., Friedrich K., Tsotra P.: Experi-mental and FE analysis of the failure behaviour ofSIC/epoxy functionally graded rings under compres-sion load. in ‘1st Vienna International Conference ofMicro- and Nano-Technology, Vienna, Austria’ 431–440 (2005).
[11] Tsotra P., Friedrich K., Felhõs D., Váradi K.: Com-pression of homogeneous and graded sic/ep ringsexperimental results and FE modelling. Journal ofMaterials Science, 41, 3349–3355 (2006).
[12] Prehn R., Haupert F., Friedrich K.: Polymere Ver-bundwerkstoff-Gleitlager für aggressive und abrasiveMedien. Tribologie und Schmierungstechnik, 53, 10–15 (2006).
[13] Felhõs D., Váradi K., Friedrich K.: FE modeling of aroller with functionally graded material structure(inHungarian). Mûanyagipari Szemle, 4, 81–89 (2005).
[14] Felhõs D., Váradi K., Friedrich K.: Wear analysis offunctionally gradient composite materials by FE mod-eling of microhardness measurements and wear tests.Materials Science Forum, 537–538, 519–525 (2006).
[15] Felhõs D., Váradi K., Tsotra P., Friedrich K.: Micro-hardness test of graded SiC/EP rings: Experimentalresults and FE modelling. Journal of Computationaland Applied Mechanics, 6, 207–218 (2005).
[16] Domke W.: Werkstoffkunde und Werkstoffprüfung10. Cornelsen-Velhagen und Klasing, Bielefeld(1986).
[17] Lyness J. F., Owen D. R. J., Zienkiewicz O. C.: Thefinite element analysis of engineering systems gov-erned by a non-linear quasi-harmonic equation. Com-puters and Structures, 5, 65–79 (1975).
[18] Zhang X. R., Zhao P., Pei X. Q., Wang Q. H., Jia Q.:Flexural strength and tribological properties of rareearth treated short carbon fiber/polyimide composites.Express Polymer Letters, 1, 667–672 (2007).
[19] Vas L. M., Pölöskei K., Felhõs D., Deák T., CzigányT.: Theoretical and experimental study of the effect offiber heads on the mechanical properties of non-con-tinuous basalt fiber reinforced composites. ExpressPolymer Letters, 1, 109–121 (2007).
717
Felhõs et al. – eXPRESS Polymer Letters Vol.2, No.10 (2008) 705–717