fe model update - polytec
TRANSCRIPT

Advancing Measurements by Light · www.polytec.com
Introduction
The 3-D Scanning Laser Vibrometer avoids the seriouscomplication of traditional, contact accelerometers byeliminating sensor mass and stiffness that can load thestructure. Additionally, the laser vibrometer allows for more measurement points giving much higher spatial resolution at lower cost with no labor neededto attach accelerometers. For a typical measurement,a total of 500 points on the structure (1500 FRFs) areused for the validation.
Experimental SetupIn Figure 1, a freely suspended RAC is shown. The exci-tation is produced by a shaker attached to a cornerpoint on the structure and oriented such that all threeglobal directions x, y and z experienced approximate-ly the same degree of excitation. In this way, mostmodes of the structure could be properly excited withonly one excitation location. The shaker excited thestructure with a pseudo-random signal. The samplerate of the measurement was 2560 Hz and had a blocklength of 4096 samples. The excitation frequency bandwas set from 100 to 1000 Hz.
Experimental Results
The data obtained from the experiment was export-ed by the Polytec measurement software to the Matlab-based Structural Dynamics Toolbox (SDT) asa Universal File (UFF). Using the SDT, dynamic tool-box, dynamic analysis, including some advanced optimization algorithms, permit accurate modal par-ameter identification. A plot of the 500 nodes thatwere measured on the RAC with the vibrometer is shown in Figure 2. The model used to fit the datawas based on normal modes and contained lower and higher residual terms. With the proper settings chosen, the pole-residue model was calculated andthe poles and residues were optimized for the bestfit. In the SDT, this is done with a non-linear least-squares optimization (minimization) process. The fit obtained with the pole-residue model is shown in Figure 3 for a representative transfer function.
The fit accurately follows the measurement data, especially near the resonance peaks. Noise at the anti-resonances in the higher frequency range showsthe greatest departure from the fit.
Polytec GmbHOptical MeasurementSystemsApplication NoteVIB-C-05
June 2008
FE Model Update
The rear-axle-carrier (RAC) is the central part of the rear-axle construction on
rear-wheel-driven BMW vehicles and serves as a support and isolation for the wheels and
the differential. Finite Element Modeling (FEM) is used to optimize the design of the RAC
and to guaranty superior performance. The model was validated using experimental modal
analysis (EMA) and precision dynamic data measured with a 3-D Scanning Vibrometer.
A Aerospace
B Audio & Acoustics
C Automotive
D Data Storage
G General Vibrometry
M Microstructures & -systems
P Production Testing
S Scientific & Medical
T Structural Testing
U Ultrasonics
Field of Application
Application Note

2
Figure 4: The FE model mesh
Figure 1: Measurement setup with suspended RAC, the shaker, and the 3-D Scanning Vibrometer heads
Description of the Finite Element Model
The finite element model of the RAC was created inMedina Software. The geometry was imported froma CAD-model used in the design of the RAC. The mesh(Figure 4) consists of duplex tetrahedron elements and in total the model contained approximately 1.3 million degrees of freedom.
The modal analysis was performed on the finite element model in NASTRAN by a Lanczos iterative solver. Using the FEM calculation, seventeen eigen-frequencies were found when frequencies were examined up to 1000 Hz.
Validation of the FE ModelAt first, the eigenfrequencies from the experimentalmeasurement were found to deviate from the FEManalysis by 2 %. A more detailed and objective state-ment on the accuracy of the model can be made by a modal assurance criterion (MAC) analysis, which is addressed in the remainder of this section.
To be able to correlate the mode shapes found fromthe finite element calculation with the vibrometer measurements, it was important to obtain the modeshapes at the same nodes in both models. To this end, the UFF 2411 file from the measurement was imported into the FE model, so that the grid of test nodes was ”superimposed” on the FEM mesh. Byinspection, 124 nodes from the model correspondingwith measured nodes were then selected in such a way that the global shape of the RAC could be properly described. The MAC analysis in the StructuralDynamics Toolbox was redone and the results areshown in Figure 5.
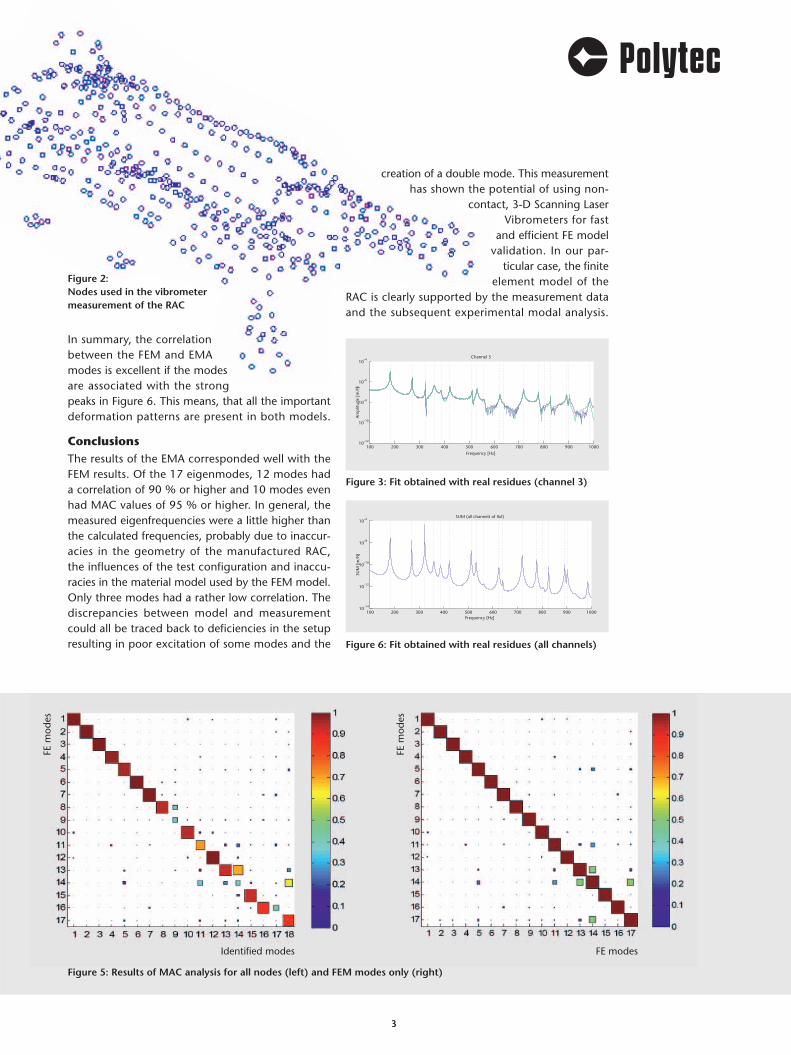
As can be seen, the MAC values for the first 8 modeswere excellent. Modes 10, 12, 13, 15, 16 and 18 alsoshowed correlations of 85 % or higher. However, theMAC values of modes 9, 11, 14 and 17 were foundto be rather low. It is suspected that this is due to a lack of excitation of mode 9, 11 and 14. This is supported by the small resonance response shown in Figure 5. Moreover, due to the limited spatial resolution, mode 13 and 14 have a high correlationalready, as can be seen in Figure 5 (right), where theFEM modes are projected on each other.
Finally, mode 17 appears to be an ”artificial“ modethat originates from the test configuration. It issuspected that modes 16 and 17 are actually a singlemode split into two modes due to a slightly asym-metric structure. This explanation is supported by the fact that the FE model predicts only one mode;this mode has a correlation of 85 % with mode 16 while the correlation with mode 17 is 50 %.
33
creation of a double mode. This measurementhas shown the potential of using non-
contact, 3-D Scanning LaserVibrometers for fast
and efficient FE modelvalidation. In our par-
ticular case, the finiteelement model of the
RAC is clearly supported by the measurement dataand the subsequent experimental modal analysis.
In summary, the correlation between the FEM and EMAmodes is excellent if the modesare associated with the strongpeaks in Figure 6. This means, that all the importantdeformation patterns are present in both models.
ConclusionsThe results of the EMA corresponded well with theFEM results. Of the 17 eigenmodes, 12 modes had a correlation of 90 % or higher and 10 modes evenhad MAC values of 95 % or higher. In general, the measured eigenfrequencies were a little higher thanthe calculated frequencies, probably due to inaccur-acies in the geometry of the manufactured RAC, the influences of the test configuration and inaccu-racies in the material model used by the FEM model.Only three modes had a rather low correlation. Thediscrepancies between model and measurement could all be traced back to deficiencies in the setupresulting in poor excitation of some modes and the
Channel 3
100 200 300 400 500 600 700 800 900 100010
−12
10−10
10−8
10−6
10−4
Channel 3
Frequency [Hz]
Am
plit
ude
[m/N
]
Figure 3: Fit obtained with real residues (channel 3)
100 200 300 400 500 600 700 800 900 100010
−14
10−12
10−10
10−8
10−6
SUM (all channels of IIxf)
Frequency [Hz]
SUM
[m
/N]
Figure 6: Fit obtained with real residues (all channels)
Figure 2: Nodes used in the vibrometermeasurement of the RAC
Figure 5: Results of MAC analysis for all nodes (left) and FEM modes only (right)
FE m
odes
FE m
odes
Identified modes FE modes

Tech
nica
l sp
ecifi
catio
ns a
re s
ubje
ct t
o ch
ange
with
out
notic
e. O
M_A
N_V
IB-C
-05_
200
8_06
_200
0_E
Advancing Measurements by Light · www.polytec.com
3-D Vibration Measurement Technology
For more information about the PSV-400-3D Scanning Vibrometer and automotive applications please contact your local Polytec sales engineer or visit our web pages www.polytec.com/psv3dand www.polytec.com/automotive
We gratefully acknowledge the support of D. de Klerk, M.Sc., and S. N. Vermeeren, B. Sc., both DelftUniversity of Technology, in providing this application report featured in Polytec InFocus issue 2/2007.
Automated, Non-contact Full-Body Vibration Mapping
RoboVib Structural Test StationRoboVib removes many of the limitations of tradi-tional contact transducer methods. By mountinga 3-D Scanning Vibrometer to a multi-axis indus-trial robot, RoboVib is engineered to be a stable,auto-configurable 3-D vibration measurement station for whole body vibration mapping of com-plex-shaped objects. This unique combination of productive technologies can reduce test timesfor experimental modal analysis (EMA) from weeksto days and from days to hours. The points to bemeasured can be derived from Finite Element (FE)Models, thus facilitating Model updating. Due tothe increased productivity, test fields and proto-types are used more efficiently, the results are faster available.
www.polytec.com/robovib
PSV-400-3D Scanning VibrometerThe PSV-400-3D Scanning Vibrometer is theperfect measurement instrument for gatheringthree-dimensional vibration data from bothsimple and complex structures. It features anintuitive 3-D animation of the measurementresults with separation of out-of-plane and in-plane vector components as well as a power-ful data interface to Modal Analysis and FEMSoftware.
www.polytec.com/psv3d
Polytec GmbH (Germany)Polytec-Platz 1-776337 Waldbronn Tel. + 49 (0) 7243 604-0Fax + 49 (0) 7243 [email protected]
Polytec France S.A.S.32 rue Delizy93694 Pantin CedexTel. + 33 (0) 1 48 10 39 30Fax + 33 (0) 1 48 10 09 [email protected]
Polytec Ltd.(Great Britain)Lambda House, Batford MillHarpenden, Herts AL5 5BZTel. + 44 (0)1582 711670Fax + 44 (0)1582 [email protected]
Polytec JapanHakusan High Tech Park1-18-2 Hakusan, Midori-kuYokohama-shi, 226-0006Kanagawa-kenTel. +81(0) 45 938-4960Fax +81(0) 45 [email protected]
Polytec, Inc. (USA) North American Headquarters1342 Bell Avenue, Suite 3-ATustin, CA 92780Tel. +1 714 850 1835Fax +1 714 850 [email protected]
Midwest Office3915 Research Park Dr.Suite A-12Ann Arbor, MI 48108Tel. +1 734 662 4900Fax +1 734 662 4451
East Coast Office25 South Street, Suite AHopkinton, MA 01748Tel. +1 508 544 1224Fax +1 508 544 1225