fdicbanksurvey report 204pjg - federal deposit … deposit products fdicbanksurvey_report_204pjg.doc...
TRANSCRIPT
201 Deposit Products FDICBankSurvey_Report_204pjg.doc
Deposit Products
This chapter examines the following topics:
Minimum Balance Required for Basic Accounts
Payment Options Available for Basic Accounts
NSF Fees and Options
These questions address aspects of the Congressional Question 4: transaction costs that may prevent un/underbanked individuals from establishing accounts.
S u m m a r y
Most banks offer low-cost accounts with low minimum balance requirements. The survey shows that the majority of banks (an estimated 62 percent) do not require a minimum balance for their most basic checking accounts, and that an additional 8 percent of banks waive minimum balance requirements with direct deposit.
Most banks include free check writing and debit card use in their most basic checking accounts. Most banks (90 percent) include free check writing, and 84 percent include free debit card transactions. Online bill payment is included at no additional cost at 64.8 percent of banks.
Nearly all (99 percent) banks charge NSF fees on their most basic transaction accounts, with a mean fee of $25.89. Over half of the banks surveyed offer programs to cover or waive the NSF items and alerts to notify customers of low balances or NSF transactions.
Banks policies for closing accounts are inconsistent. Many banks will automatically close the account once a threshold number of NSF items are reached or if a persistent negative balance remains for a bank-determined time period, which can range from 10 to 180 days.
Chapter
8

202 Deposit Products FDICBankSurvey_Report_204pjg.doc
M i n i m u m B a l a n c e R e q u i r e m e n t f o r B a n k A c c o u n t s
Question VI A. Does the bank’s most basic or entry-level checking account have a minimum balance requirement?
Yes No, but only with direct deposit No
A majority (61.6 percent) of banks do not require a minimum balance for their basic checking account product. An additional 8.1 percent of banks waive the minimum balance requirement if customers use direct deposit.
QVIA. Figure 1. Does the most entry level checking account have a minimum balance?
Frequency Weighted Frequency
Weighted Percent
Valid No 434 4523 61.6 Yes 186 2222 30.3 No, but only with
direct deposit 56 593 8.1
Total 676 7337 100.0Missing System 9 103 Total 685 7440
There are no differences among regions for banks with minimum balance requirements.
There is a difference between tiers for banks that have minimum balance requirements. A smaller percentage of banks require a minimum balance in Tier 2 (18.5 percent) than in Tier 3 (31.3 percent). Tier 1 and Tier 2 have a higher percent of banks that do not require a minimum balance (75.0 percent and 73.9 percent, respectively), compared with 60.6 percent of Tier 3.
QVIA. Figure 2. Tier
Does the most entry level checking account have a minimum balance?
Tier 1 Tier 2 Tier 3
No Count 19 402 4102 % 75.0% 73.9% 60.6%Yes Count 2 101 2119 % 8.3% 18.5% 31.3%No, but only with direct deposit
Count 4 42 547
% 16.7% 7.6% 8.1%Total Count 25 544 6768 % 100.0% 100.0% 100.0%
There is little difference between urban and rural banks for banks with minimum balance requirements.

203 Deposit Products FDICBankSurvey_Report_204pjg.doc
Question VI A-1. If minimum balance is required, what is the minimum balance?
$___ with direct deposit / $___ without direct deposit
Question VI A-2. If minimum balance is not required, what other fees apply?
$___ with direct deposit / $___ without direct deposit
The estimated mean minimum balance requirements and fees for checking accounts without direct deposit are slightly higher than for those with direct deposit ($185.80 vs. $161.93).
However, both the median and mode minimum balance for accounts with or without direct deposit are $100.00. Without direct deposit or a minimum balance, monthly fees range from $0.00 to $250.00.
QVIA-1. Figure 1. Statistics
Weighted
Minimum balance with direct deposit
Minimum balance without direct deposit
Fees with direct deposit
Fees without direct deposit
Valid 1773 2179 1002 1125 N
Missing 5667 5261 6438 6315 Mean $161.92 $185.80 $10.38 $11.16 Median $100.00 $100.00 $.00 $.00 Mode $100.00 $100.00 $.00 $.00 Minimum $.00 $.00 $.00 $.00 Maximum $1,500.00 $1,500.00 $250.00 $250.00
There are no differences among tiers or regions for minimum balance amounts with direct deposit.
There is no difference between urban and rural banks for minimum balance amounts with direct deposit.
There is no difference between tiers for minimum balance amounts without direct deposit.
There is no difference between urban and rural banks for minimum balance amounts without direct deposit.

204 Deposit Products FDICBankSurvey_Report_204pjg.doc
There are differences among regions for minimum balance amounts for accounts without direct deposit. The minimum balance for the Pacific region is higher than that of all other regions, with a median of $300.00, compared with a median of $100.00 in all regions except New England ($10.00) and the South Atlantic ($75.00).
QVIA-1. Figure 2. Minimum Balance (if required) Without Direct Deposit on an Entry-Level Checking Account
Region Median Minimum Balance without Direct Deposit
Sample Size
New England $10.00 5
Mid Atlantic $100.00 15
South Atlantic $75.00 16
East South Central $100.00 18
West South Central $100.00 43
East North Central $100.00 26
West North Central $100.00 29
Mountain $100.00 10
Pacific $300.00 19
There is no difference among tiers or regions for fees on basic checking accounts without a minimum balance requirement.
There is no difference between urban and rural banks for fees on basic checking accounts without a minimum balance requirement.

205 Deposit Products FDICBankSurvey_Report_204pjg.doc
P a y m e n t O p t i o n s A v a i l a b l e f o r B a s i c A c c o u n t s
Question VI B. For the most basic transaction deposit account, what payment options are included/available?
Product Included
at No Cost Available for a Fee
Not Offered
Monthly Fee (if applicable)
Per-Transaction Fee
(if applicable)
Check writing 90.0% 9.5% 0.4% $5.43 $0.29
ATM card (PIN-only) 80.6% 10.2% 9.2% $1.08 $0.75
Debit card signature (Visa/MasterCard)
84.2% 11.0% 4.8% $1.48 $0.36
Online bill payment 64.8% 21.5% 13.7% $5.50 $0.27
Ninety-percent (90 percent) of banks include free check writing in their most basic transaction account product.
Online bill payment is the most common fee-based product offered (21.5 percent), but the majority of banks still provide this feature at no cost (64.8 percent). If there is a fee associated with online bill payment, it is typically about $5.50 per month or $0.27 per transaction. Online bill payment is also the most common product not offered by banks (13.7 percent).
QVIB. Figure 1. Is check writing available for the most basic transaction account?
Frequency Weighted Frequency
Weighted Percent
Valid Not offered 4 32 .4 Included at no cost 595 6413 90.0 Available for a fee 59 677 9.5 Total 658 7122 100.0Missing System 27 318 Total 685 7440
There are no differences among between regions or tiers in check writing availability.
The median monthly fee for check writing, if banks charge a fee, is $3.00. In addition, the median per transaction fee for writing a check is $0.20.
QVIB. Figure 2 Statistics
Weighted Check Writing Monthly Fee
Check Writing Transaction
Fee Valid 357 464N
Missing 320 213Mean $5.43 $.29Median $3.00 $.20Mode $5.00 $.25Minimum $.00 $.00Maximum $50.15 $2.00

206 Deposit Products FDICBankSurvey_Report_204pjg.doc
There are no differences among tiers or regions in monthly or per-item check writing fees.
Most (80.6 percent) banks include ATM cards at no cost with their most basic accounts, and 10.2 percent offer an ATM card with a fee.
QVIB. Figure 3. Is an ATM card available for the most basic transaction account?
Frequency Weighted Frequency
Weighted Percent
Valid Not offered 51 634 9.2 Included at no cost 525 5553 80.6 Available for a fee 61 699 10.2 Total 637 6886 100.0Missing System 48 554 Total 685 7440
There is a difference between regions in ATM card availability. A larger percentage of West North Central banks (19.4 percent) offer ATM cards for a fee, than in the Pacific (0 percent).
QVIB. Figure 4. Is an ATM card available for the most basic transaction account?
Is an ATM card available for the most basic transaction account?
New England
Mid- Atlantic
South Atlantic
East South
Central
West South
Central
East North
Central
West North
Central Mountain Pacific Not offered
Count 27 41 76 14 99 137 96 68 75
% 6.3% 8.2% 9.6% 2.2% 9.3% 10.9% 7.1% 15.3% 18.4%Included at no cost
Count 374 427 677 580 811 1007 996 347 335
% 86.5% 85.6% 85.6% 92.4% 76.0% 80.1% 73.5% 77.7% 81.6%Available for a fee
Count 31 31 38 34 157 114 263 31 0
% 7.1% 6.2% 4.8% 5.5% 14.7% 9.1% 19.4% 6.9% .0%Total Count 432 498 791 628 1068 1257 1355 446 410 % 100.0% 100.0% 100.0% 100.0% 100.0% 100.0% 100.0% 100.0% 100.0%
There is no difference between tiers in ATM card availability.
Of the banks that offer an ATM card for a fee, the mean monthly fee is $1.08, and the mean transaction fee is $0.75.
QVIB. Figure 5. Statistics
Weighted ATM Monthly
Fee ATM
Transaction Fee N Valid 422 195 Missing 277 504Mean $1.08 $.75Median $1.00 $1.00Mode $1.00 $1.00Minimum $.00 $.00Maximum $2.00 $2.00
207 Deposit Products FDICBankSurvey_Report_204pjg.doc
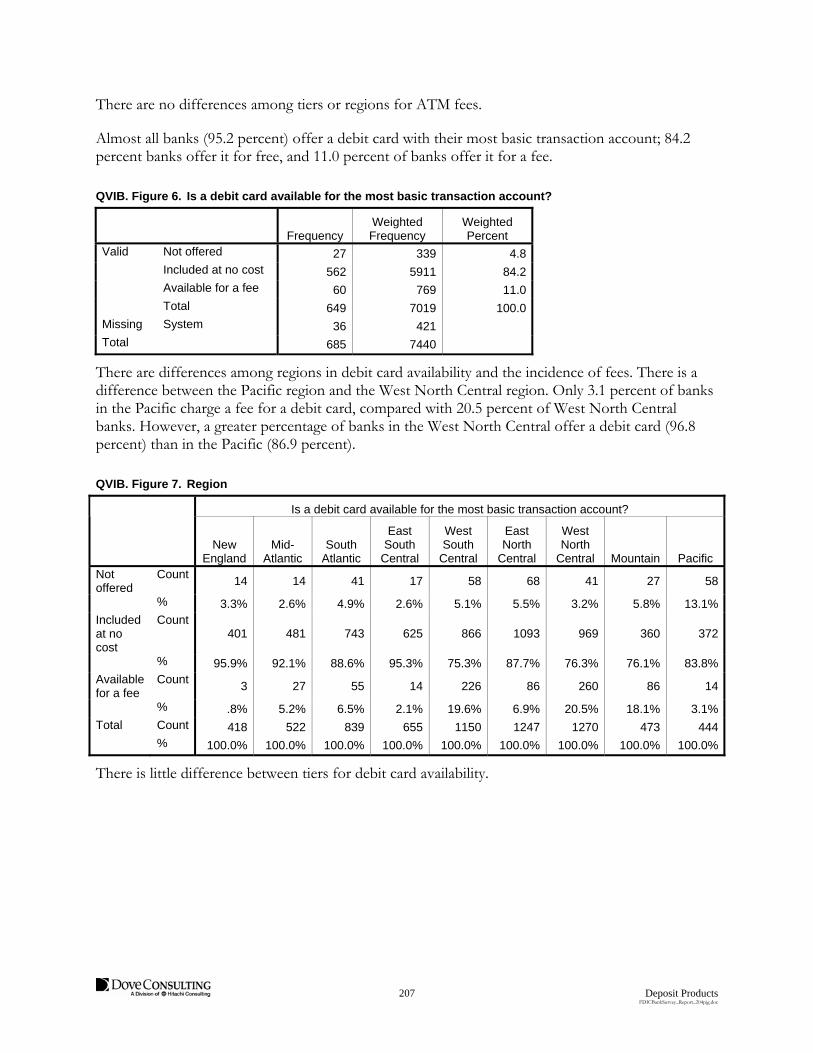
There are no differences among tiers or regions for ATM fees.
Almost all banks (95.2 percent) offer a debit card with their most basic transaction account; 84.2 percent banks offer it for free, and 11.0 percent of banks offer it for a fee.
QVIB. Figure 6. Is a debit card available for the most basic transaction account?
Frequency Weighted Frequency
Weighted Percent
Valid Not offered 27 339 4.8 Included at no cost 562 5911 84.2 Available for a fee 60 769 11.0 Total 649 7019 100.0Missing System 36 421 Total 685 7440
There are differences among regions in debit card availability and the incidence of fees. There is a difference between the Pacific region and the West North Central region. Only 3.1 percent of banks in the Pacific charge a fee for a debit card, compared with 20.5 percent of West North Central banks. However, a greater percentage of banks in the West North Central offer a debit card (96.8 percent) than in the Pacific (86.9 percent).
QVIB. Figure 7. Region
Is a debit card available for the most basic transaction account?
New England
Mid- Atlantic
South Atlantic
East South
Central
West South
Central
East North
Central
West North
Central Mountain Pacific Not offered
Count 14 14 41 17 58 68 41 27 58
% 3.3% 2.6% 4.9% 2.6% 5.1% 5.5% 3.2% 5.8% 13.1%Included at no cost
Count 401 481 743 625 866 1093 969 360 372
% 95.9% 92.1% 88.6% 95.3% 75.3% 87.7% 76.3% 76.1% 83.8%Available for a fee
Count 3 27 55 14 226 86 260 86 14
% .8% 5.2% 6.5% 2.1% 19.6% 6.9% 20.5% 18.1% 3.1%Total Count 418 522 839 655 1150 1247 1270 473 444 % 100.0% 100.0% 100.0% 100.0% 100.0% 100.0% 100.0% 100.0% 100.0%
There is little difference between tiers for debit card availability.

208 Deposit Products FDICBankSurvey_Report_204pjg.doc
The median monthly fee for banks charging a fee for debit cards is $1.00, while the median per-item transaction fee is $0.12. Less than 2 percent of banks report having per item fees for debit card usage.
QVIB. Figure 8. Statistics
Weighted Debit Card
Monthly Fee
Debit Card Transaction
Fee Valid 520 113N
Missing 250 656Mean $1.48 $.36Median $1.00 $.12Mode $1.00 $.00Minimum $.00 $.00Maximum $5.00 $1.25
There are few differences among tiers or regions for debit card fees.
Online bill payment is not offered by 13.7 percent banks, but it is available at no additional cost at 64.8 percent of banks.
QVIB. Figure 9. Is online bill pay available for the most basic transaction account?
Frequency Weighted Frequency
Weighted Percent
Valid Not offered 71 950 13.7 Included at no cost 445 4502 64.8 Available for a fee 130 1495 21.5 Total 646 6947 100.0Missing System 39 492 Total 685 7440
There are no differences among regions or tiers for bill pay availability.
Among banks that charge a fee, the median monthly fee for bill payment services is $5.00, and the median per-item transaction fee is $0.35. These are the highest and most commonly charged fees among the payment options listed in the survey.
QVIB. Figure 10. Statistics
Weighted Bill pay
Monthly Fee
Bill pay Transaction
Fee Valid 1093 154N
Missing 401 1341Mean $5.50 $.27Median $5.00 $.35Mode $5.95 $.00Minimum $.00 $.00Maximum $10.00 $.55

209 Deposit Products FDICBankSurvey_Report_204pjg.doc
There is a difference between tiers in monthly fees charged for bill payment, but not in per-transaction fees, among banks that charge a fee for online bill payment services. Fees for Tier 1 (mean: $6.95) are higher than for Tier 2 (mean: $4.86). The Tier 3 mean ($5.54) and median ($5.00) monthly fees fall between those for Tiers 1 and 2.
QVIB. Figure 11. Tier 1
Bill Pay
Monthly Fee
Bill Pay Transaction
Fee N Valid 2 0 Missing 1 3Mean $6.95 Median $6.95 Mode $6.95 Minimum $6.95 Maximum $6.95
QVIB. Figure 12. Tier 2
Bill pay
Monthly Fee
Bill pay Transaction
Fee N Valid 66 17 Missing 17 66Mean $4.86 $.36Median $4.95 $.40Mode $4.95 $.00(a)Minimum $.00 $.00Maximum $6.95 $.55
Multiple modes exist. The smallest value is shown.
QVIB. Figure 13. Tier 3
Bill pay
Monthly Fee
Bill pay Transaction
Fee N Valid 1025 137 Missing 383 1271Mean $5.54 $.26Median $5.00 $.25Mode $5.95 $.00Minimum $.55 $.00Maximum $10.00 $.55
There are no differences among regions in bill payment fees for banks that charge fees.

210 Deposit Products FDICBankSurvey_Report_204pjg.doc
There are differences between urban and rural banks for the availability of ATM cards, debit cards, and online bill payment. A larger percentage of rural banks (14.2 percent) charge fees for ATM card access than urban banks (5.6 percent). Fourteen-percent (14.1 percent) of rural banks charge fees for debit card access, compared with 7.4 percent of urban banks; and 20.0 percent of rural banks do not offer online bill payment, compared with 6.8 percent of urban banks.
QVIB. Figure 14. Urban and Rural
Availability of Payment Options in Most Basic Transaction Account
Rural HQ Urban HQ
Check Writing
ATM Card
Debit Card
Online Bill Pay
Check Writing ATM Card Debit Card
Online Bill Pay
Not offered Count
27 342 154 725 5 292 185 226
% .7% 9.4% 4.1% 20.0% .1% 9.0% 5.6% 6.8%Included at no cost
Count
3323 2770 3033 2120 3089 2783 2878 2382
% 87.6% 76.3% 81.8% 58.4% 92.8% 85.4% 87.0% 71.8%Available for a fee
Count
441 516 523 786 236 183 246 708
% 11.6% 14.2% 14.1% 21.7% 7.1% 5.6% 7.4% 21.4%Total Co
unt 3792 3628 3710 3631 3330 3258 3309 3316
% 100.0% 100.0% 100.0% 100.0% 100.0% 100.0% 100.0% 100.0%
N S F F e e s a n d O p t i o n s
Question VI C. Does the bank charge a per-item NSF fee on its most basic (lowest cost) transaction account?
Yes No
Nearly all (99.2 percent) banks charge NSF fees on their most basic account, and less than 1 percent of banks do not charge an NSF fee.
QVIC. Figure 1. Does the bank charge a NSF fee on its most basic account?
Frequency Weighted Frequency
Weighted Percent
Valid No 5 58 .8 Yes 667 7234 99.2 Total 672 7293 100.0Missing System 13 147 Total 685 7440
There are minimal differences among regions or tiers in the share of banks that charge NSF fees.
There is no difference between urban and rural banks for banks that charge NSF fees.

211 Deposit Products FDICBankSurvey_Report_204pjg.doc
Question VI C-1. If yes, what is the standard or typical NSF fee for this account?
NSF fees range from $8.00 to $38.00, with a median of $25.00 and a mean of mean of $25.89.
QVIC-1. Figure 1. Standard NSF Fee
Valid 7206 N
Missing 28 Mean $25.89 Median $25.00 Mode $25 Minimum $8 Maximum $38
There are differences among regions for NSF fee amounts. Banks in the West North Central (mean of $23.05) and Pacific ($24.37) regions charge lower fees than those in the East North Central ($25.82), which charge lower fees than in the Mid Atlantic ($29.74) and South Atlantic ($30.64) regions.
QVIC-1. Figure 2. New England: Standard NSF Fee
N Valid 405 Missing 14 Mean $25.81 Median $25.00 Mode $25 Minimum $16 Maximum $30
QVIC-1. Figure 3. Mid Atlantic: Standard NSF Fee
N Valid 560 Missing 0 Mean $29.74 Median $30.00 Mode $30 Minimum $15 Maximum $38
QVIC-1. Figure 4. South Atlantic: Standard NSF Fee
N Valid 860 Missing 0 Mean $30.64 Median $30.00 Mode $30 Minimum $20 Maximum $37
QVIC-1. Figure 5. East South Central: Standard NSF Fee
N Valid 669 Missing 0 Mean $27.82 Median $28.00 Mode $25 Minimum $20 Maximum $36
QVIC-1. Figure 6. West South Central: Standard NSF Fee
N Valid 1136 Missing 14 Mean $24.16 Median $25.00 Mode $25 Minimum $10 Maximum $35
QVIC-1. Figure 7. East North Central: Standard NSF Fee
N Valid 1273 Missing 1 Mean $25.82 Median $25.00 Mode $25 Minimum $10 Maximum $38

212 Deposit Products FDICBankSurvey_Report_204pjg.doc
QVIC-1. Figure 8. West North Central: Standard NSF Fee
Valid 1383 N
Missing 0 Mean $23.05 Median $25.00 Mode $25 Minimum $8 Maximum $35
QVIC-1. Figure 9. Mountain: Standard NSF Fee
N Valid 476 Missing 0 Mean $24.95 Median $25.00 Mode $25 Minimum $18 Maximum $34
QVIC-1. Figure 10. Pacific: Standard NSF Fee
Valid 444 N
Missing 0 Mean $24.37 Median $25.00 Mode $25 Minimum $15 Maximum $30
There are differences among tiers in NSF fee amounts. Fees for Tier 3 (mean of $25.61) are lower than for Tier 2 ($29.10) and Tier 1 ($30.55).
QVIC-1. Figure 11. Tiers: Standard NSF Fee
Tier 1 N Valid 24 Missing 1 Mean $30.55 Median $31.50 Mode $35 Minimum $18 Maximum $38
Tier 2 N Valid 538 Missing 0 Mean $29.10 Median $30.00 Mode $30 Minimum $15 Maximum $38Tier 3 N Valid 6645 Missing 27 Mean $25.61 Median $25.00 Mode $25 Minimum $8 Maximum $37

213 Deposit Products FDICBankSurvey_Report_204pjg.doc
There is a difference between urban and rural banks in NSF fees charged. This may correlate with differences associated with asset size, since more banks in Tier 3 tend to be rural banks and all Tier 1 banks are urban banks. The median for rural banks is $25.00, and the median for urban banks is $28.00.
QVIC-1. Figure 12. Rural: Standard NSF Fee
N Valid 3864 Missing 96 Mean $24.92 Median $25.00 Mode $25 Minimum $8 Maximum $37
QVIC-1. Figure 13. Urban: Standard NSF Fee
N Valid 3390 Missing 90 Mean $27.48 Median $28.00 Mode $25 Minimum $15 Maximum $38
Question VI C-2. Does the bank offer any programs to cover or waive NSF items on this account? Yes No
Over half (59.4 percent) of banks that charge NSF fees offer some type of program that will cover or waive the fee.
QVIC-2. Figure 1. Does the bank offer programs to waive the NSF fee?
Frequency Weighted Frequency
Weighted Percent
Valid No 243 2882 40.6 Yes 412 4209 59.4 Total 655 7091 100.0Missing System 12 144 Total 667 7234
There are minimal differences between regions in the share of banks that had programs to cover or waive NSF fees.
There is a difference between tiers for programs to cover or waive NSF fees. A higher percentage of banks in Tier 2 offer programs to cover or waive NSF fees (75.8 percent) than banks in Tier 3 (57.9 percent).
QVIC-2. Figure 2. Tier
Does the bank offer programs to cover or waive the NSF fee?
Tier 1 Tier 2 Tier 3
No Count 5 128 2748 % 20.8% 24.2% 42.1%Yes Count 20 402 3787 % 79.2% 75.8% 57.9%Total Count 25 531 6535 % 100.0% 100.0% 100.0%

214 Deposit Products FDICBankSurvey_Report_204pjg.doc
There is a difference between urban and rural banks for banks that offer programs to cover or waive NSF fees. About two-thirds (62.8 percent) of urban banks offer programs to cover or waive the fees, compared with 56.4 percent of rural banks.
QVIC-2. Figure 3. Urban/Rural
Does the bank offer programs to cover or waive
the NSF fee?
Rural HQ Urban HQ No Count 1672 1210 % 43.6% 37.2%Yes Count 2164 2045 % 56.4% 62.8%Total Count 3836 3255 % 100.0% 100.0%
Question VI C-2. a) If yes, please describe:
Of the surveyed banks, 410 described their programs to waive NSF fees.
Respondents reported two main ways to cover or waive NSF items: a line of credit or an automatic transfer from one account to another to cover NSF items. Banks typically offer automatic transfers at a lower fee than a line of credit, but this option may not be available for un/underbanked individuals who do not have either an additional account or sufficient money in other accounts to cover the NSF item(s). In this case, banks may offer customers a line of credit requiring them to pay off the balance and interest within a 30 to 90 day period.
A majority (313) of respondents indicated that they offer Overdraft Protection (ODP), ODP Lines of Credit, or Bounce Protection.
A total of 184 respondents reported offering an automatic sweep transfer from a separate account to cover NSF items. Of these 184 banks, 19 describe a transfer fee, which can range from $1.00 to $10.00, in order to move money from another account into the overdrawn account. Three banks offer free transfer sweeps.
Seventy-two banks indicated that fees are charged with their NSF programs. Four banks offer a line of credit with no initial fees attached, aside from the interest to be paid on the loan.
Nineteen banks reported either waving the first NSF fee completely or giving officers authority to waive some or all of the fees.
Sixty-three respondents described an overdraft limit up to which they will cover NSF items. These limits range from $100 to $50,000, which was cited by one bank. The mean overdraft limit, excluding two extreme instances of $25,000 and $50,000, is $551.

215 Deposit Products FDICBankSurvey_Report_204pjg.doc
Question VIC-3. Does the bank offer “alerts” to notify customers with these accounts of low balances or NSF transactions on this account?
Yes No
Over half (54.4 percent) of banks that charge NSF fees offer alerts to notify customers of low balances or NSF transactions.
QVIC-3. Figure 1. Does the bank offer alerts to notify customers of low balances or NSF fees?
Frequency Weighted Frequency
Weighted Percent
Valid No 296 3280 45.6 Yes 365 3913 54.4 Total 661 7193 100.0Missing System 6 41 Total 667 7234
There are no differences among regions or tiers in the provision of alerts to notify customers of NSF fees.
There is little difference between urban and rural banks regarding alerts that notify customers of NSF fees.
Question VI C-4. Will the bank automatically close this account if a threshold number of NSF items are reached or there is a persistent negative balance?
Yes No
Over half (56.7 percent) of banks that charge NSF fees will automatically close an account after a customer has reached a certain number of NSF items or a certain period of time with a negative balance.
QVIC-4. Figure 1. Will the bank automatically close the account due to NSF fees or a negative balance?
Frequency Weighted Frequency
Weighted Percent
Valid No 280 3087 43.3 Yes 378 4045 56.7 Total 658 7132 100.0Missing System 9 103 Total 667 7234
216 Deposit Products FDICBankSurvey_Report_204pjg.doc
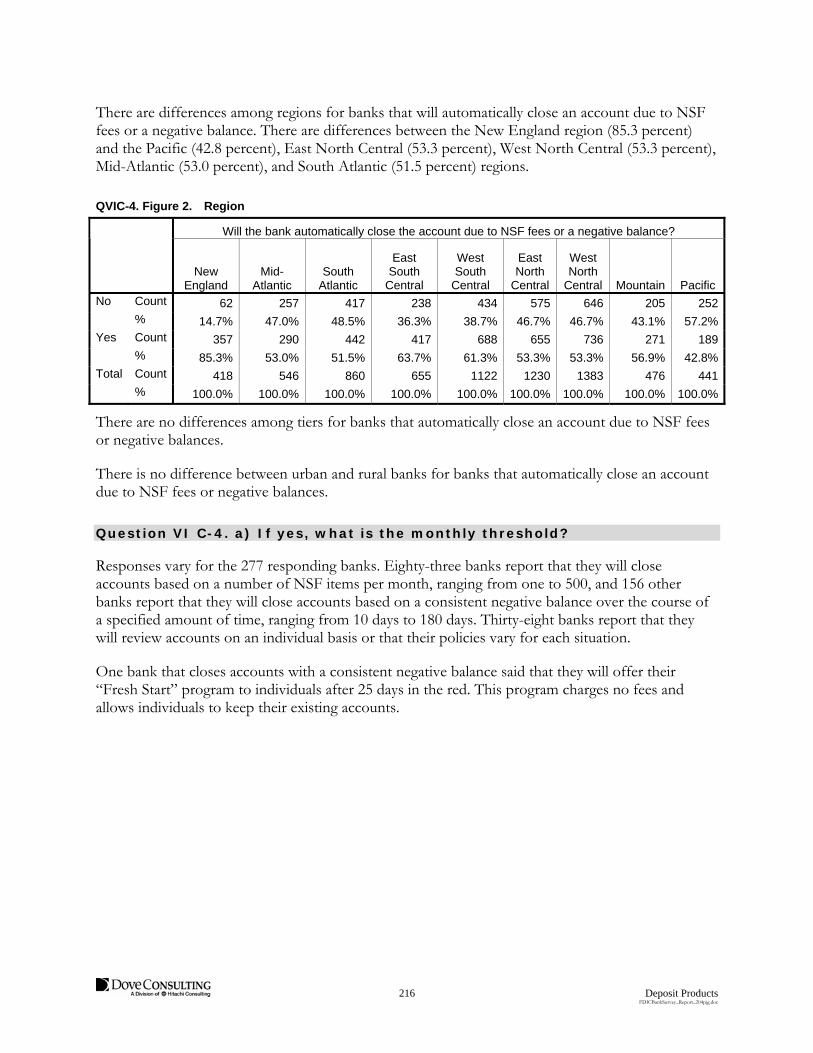
There are differences among regions for banks that will automatically close an account due to NSF fees or a negative balance. There are differences between the New England region (85.3 percent) and the Pacific (42.8 percent), East North Central (53.3 percent), West North Central (53.3 percent), Mid-Atlantic (53.0 percent), and South Atlantic (51.5 percent) regions.
QVIC-4. Figure 2. Region
Will the bank automatically close the account due to NSF fees or a negative balance?
New England
Mid- Atlantic
South Atlantic
East South
Central
West South
Central
East North
Central
West North
Central Mountain Pacific No Count 62 257 417 238 434 575 646 205 252 % 14.7% 47.0% 48.5% 36.3% 38.7% 46.7% 46.7% 43.1% 57.2%Yes Count 357 290 442 417 688 655 736 271 189 % 85.3% 53.0% 51.5% 63.7% 61.3% 53.3% 53.3% 56.9% 42.8%Total Count 418 546 860 655 1122 1230 1383 476 441 % 100.0% 100.0% 100.0% 100.0% 100.0% 100.0% 100.0% 100.0% 100.0%
There are no differences among tiers for banks that automatically close an account due to NSF fees or negative balances.
There is no difference between urban and rural banks for banks that automatically close an account due to NSF fees or negative balances.
Question VI C-4. a) If yes, what is the monthly threshold?
Responses vary for the 277 responding banks. Eighty-three banks report that they will close accounts based on a number of NSF items per month, ranging from one to 500, and 156 other banks report that they will close accounts based on a consistent negative balance over the course of a specified amount of time, ranging from 10 days to 180 days. Thirty-eight banks report that they will review accounts on an individual basis or that their policies vary for each situation.
One bank that closes accounts with a consistent negative balance said that they will offer their “Fresh Start” program to individuals after 25 days in the red. This program charges no fees and allows individuals to keep their existing accounts.

217 Savings Accounts FDICBankSurvey_Report_204pjg.doc
Savings Accounts
This chapter examines the following topics:
Basic Savings Accounts
Individual Development Accounts
IRS VITA Program
Money Market Accounts
Specialized Savings Clubs
Workplace and School-Based Savings Accounts
Interest Rates
These questions address aspects of the Congressional Question 4: barriers which may prevent un/underbanked individuals from establishing a savings account.
S u m m a r y
Most banks offer basic savings and money market deposit accounts for balances of $500 or less. While basic savings accounts are nearly universal and are offered by an estimated 97 percent of banks, money market deposit accounts are offered by fewer than three-quarters (70 percent) of banks. Half (50 percent) of banks offer specialized savings clubs.
A minority of banks offer workplace-based programs, individual deposit accounts (IDAs), and IRS VITA programs. Only 7 percent of banks offer existing savings accounts through workplace-based programs, 8 percent offer IDAs, and 3 percent offer IRS VITA site programs that facilitate savings. These accounts and programs are important for outreach into the community to attract un/underbanked individuals into the conventional banking system through savings products.
Interest rates are typically very low for savings accounts. The mean rate is about 1 percent or less for all savings accounts except for individual development accounts, which is 1.2 percent.
Less than a quarter (22 percent) of the banks work with organizations to promote any kind of savings products. Banks partner with schools to attract youth and partner with local business to increase comfort with the banking system for the un/underbanked.
Chapter
9
218 Savings Accounts FDICBankSurvey_Report_204pjg.doc
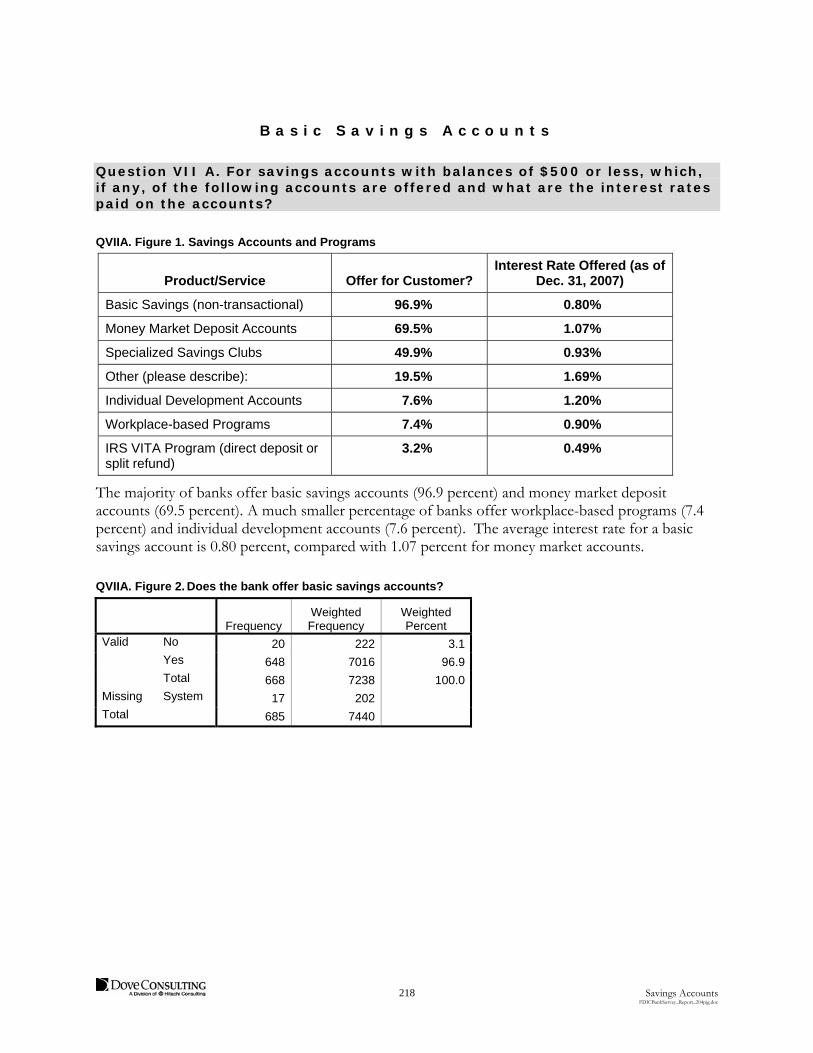
B a s i c S a v i n g s A c c o u n t s
Question VII A. For savings accounts with balances of $500 or less, which, if any, of the following accounts are offered and what are the interest rates paid on the accounts?
QVIIA. Figure 1. Savings Accounts and Programs
Product/Service Offer for Customer? Interest Rate Offered (as of
Dec. 31, 2007)
Basic Savings (non-transactional) 96.9% 0.80%
Money Market Deposit Accounts 69.5% 1.07%
Specialized Savings Clubs 49.9% 0.93%
Other (please describe): 19.5% 1.69%
Individual Development Accounts 7.6% 1.20%
Workplace-based Programs 7.4% 0.90%
IRS VITA Program (direct deposit or split refund)
3.2% 0.49%
The majority of banks offer basic savings accounts (96.9 percent) and money market deposit accounts (69.5 percent). A much smaller percentage of banks offer workplace-based programs (7.4 percent) and individual development accounts (7.6 percent). The average interest rate for a basic savings account is 0.80 percent, compared with 1.07 percent for money market accounts.
QVIIA. Figure 2. Does the bank offer basic savings accounts?
Frequency Weighted Frequency
Weighted Percent
Valid No 20 222 3.1 Yes 648 7016 96.9 Total 668 7238 100.0Missing System 17 202 Total 685 7440

219 Savings Accounts FDICBankSurvey_Report_204pjg.doc
There are minimal differences among regions or tiers for banks that offer a basic savings account.
QVIIA. Figure 3. Basic Savings Interest Rate
Valid 6507 N
Missing 933 Mean .7993 Median .7000 Mode .50 Minimum .00 Maximum 4.51
There is a difference between tiers for basic savings account interest rates. Tier 1 banks offer the lowest median interest rate of 0.25 percent, compared with 0.50 percent for Tier 2 and 0.75 percent for Tier 3.
QVIIA. Figure 4. Tier: Basic Savings Interest Rate
Tier 1 N Valid 23 Missing 2 Mean .3136 Median .2500 Mode .10(a) Minimum .05 Maximum 1.00Tier 2 N Valid 468 Missing 83 Mean .6622 Median .5000 Mode .50 Minimum .05 Maximum 4.51Tier 3 N Valid 6016 Missing 848 Mean .8118 Median .7500 Mode .50 Minimum .00 Maximum 3.25
Multiple modes exist. The smallest value is shown.

220 Savings Accounts FDICBankSurvey_Report_204pjg.doc
There are differences among regions for interest rates offered on basic savings accounts. The median rate in the New England, Mid-Atlantic, Pacific, and East North Central regions (0.50 percent) are lower than rates offered by banks in the South Atlantic (0.85 percent) and Mountain (0.95 percent) regions.
QVIIA. Figure 5. New England: Basic Savings Interest Rate
N Valid 405
Missing 41
Mean .6889
Median .5000
Mode .50
Minimum .10
Maximum 2.00
QVIIA. Figure 6. Mid-Atlantic: Basic Savings Interest Rate
N Valid 512
Missing 69
Mean .7609
Median .5000
Mode .50
Minimum .00
Maximum 3.20
QVIIA. Figure 7. South Atlantic: Basic Savings Interest Rate
N Valid 702
Missing 157
Mean .9633
Median .8500
Mode .50
Minimum .05
Maximum 4.51
QVIIA. Figure 8. East South Central: Basic Savings Interest Rate
N Valid 577 Missing 106 Mean .7732 Median .7500 Mode 1.00 Minimum .10
Maximum 3.93
QVIIA. Figure 9. West South Central: Basic Savings Interest Rate
N Valid 1047
Missing 130
Mean .8681
Median .7500
Mode .50
Minimum .00
Maximum 2.50
QVIIA. Figure 10. East North Central: Basic Savings Interest Rate
N Valid 1196 Missing 120 Mean .6899 Median .5000 Mode .50 Minimum .00 Maximum 3.25
QVIIA. Figure 11. West North Central: Basic Savings Interest Rate
N Valid 1221
Missing 189
Mean .7545
Median .6800
Mode .50
Minimum .00
Maximum 2.50
QVIIA. Figure 12. Mountain: Basic Savings Interest Rate
N Valid 463 Missing 44 Mean .9625
Median .9500
Mode .50 Minimum .00
Maximum 2.75
QVIIA. Figure 13. Pacific: Basic Savings Interest Rate
N Valid 385 Missing 76 Mean .8047
Median .5000 Mode .25 Minimum .10 Maximum 2.25

221 Savings Accounts FDICBankSurvey_Report_204pjg.doc
I n d i v i d u a l D e v e l o p m e n t A c c o u n t s
Overall, 7.6 percent of the banks offer IDAs.
QVIIA. Figure 14. Does the bank offer Individual Development Accounts?
Frequency Weighted Frequency
Weighted Percent
Valid No 517 5876 92.4 Yes 68 482 7.6 Total 585 6358 100.0Missing System 100 1081 Total 685 7440
There are minimal differences among regions for banks that offer Individual Development Accounts.
There is a difference among tiers for banks that offer IDAs. Each tier is different from the others, with the highest percentage of banks offering IDAs in Tier 1 (50.0 percent), followed by Tier 2 (22.1 percent) and Tier 3 (6.3 percent).
QVIIA. Figure 15. Rate by Tier
Does the bank offer Individual Development Accounts?
Tier 1 Tier 2 Tier 3
No Count 13 354 5510 % 50.0% 77.9% 93.7%Yes Count 13 101 369 % 50.0% 22.1% 6.3%Total Count 25 454 5879 % 100.0% 100.0% 100.0%
Overall, the median interest rate for IDAs is 0.75 percent, and the mean is 1.20 percent.
QVIIA. Figure 16. Individual Development Account Interest Rate
Valid 416 N
Missing 7024 Mean 1.1960 Median .7500 Mode .50 Minimum .00 Maximum 4.75

222 Savings Accounts FDICBankSurvey_Report_204pjg.doc
There is a difference between tiers for IDA interest rates. Smaller banks tend to offer a higher interest rate; Tier 3 banks have a median of 1.0 percent, compared with 0.40 percent in Tier 2 and 0.20 percent in Tier 1.
QVIIA. Figure 17. Tier 1: Individual Development Account Interest Rate
N Valid 8 Missing 17 Mean .2306 Median .2000 Mode .20 Minimum .01 Maximum .55
QVIIA. Figure 18. Tier 2: Individual Development Account Interest Rate
N Valid 80 Missing 472 Mean .6153 Median .4000 Mode .50 Minimum .00 Maximum 4.25
QVIIA. Figure 19. Tier 3: Individual Development Account Interest Rate
N Valid 328 Missing 6535 Mean 1.3617 Median 1.0000 Mode 1.00 Minimum .00 Maximum 4.75
a Multiple modes exist. The smallest value is shown
There are no differences among regions for individual development account interest rates.

223 Savings Accounts FDICBankSurvey_Report_204pjg.doc
I R S V I T A P r o g r a m s
Very few banks (3.2 percent) participate in IRS VITA programs. These programs help banks offer existing savings accounts to VITA customers.
QVIIA. Figure 20. Does the bank offer IRS VITA programs?
Frequency Weighted Frequency
Weighted Percent
Valid No 537 5921 96.8 Yes 26 195 3.2 Total 563 6116 100.0Missing System 122 1324 Total 685 7440
There are no differences among regions for banks that participate in IRS VITA programs.
There is a difference between tiers for banks that participate in IRS VITA programs. A higher percentage of Tier 1 banks (14.3 percent) participate in IRS VITA programs than Tier 3 banks (2.7 percent).
QVIIA. Figure 21. Tier
Does the bank offer IRS VITA programs?
Tier 1 Tier 2 Tier 3
No Count 19 406 5496 % 85.7% 90.7% 97.3%Yes Count 3 42 150 % 14.3% 9.3% 2.7%Total Count 22 447 5647 % 100.0% 100.0% 100.0%
The overall median interest rate for IRS VITA programs is 0.25 percent, and the mean is 0.49 percent.
QVIIA. Figure 22. Weighted Statistics: IRS VITA Interest Rate
There are minimal differences between tiers or regions in IRS VITA program interest rates.
Valid 167 N
Missing 7273 Mean .4905 Median .2500 Mode .50 Minimum .00 Maximum 4.50

224 Savings Accounts FDICBankSurvey_Report_204pjg.doc
M o n e y M a r k e t A c c o u n t s
Over two-thirds (69.5 percent) of banks offer Money Market Accounts (MMA).
QVIIA. Figure 23. Does the bank offer Money Market accounts?
Frequency Weighted Frequency
Weighted Percent
Valid No 189 2085 30.5 Yes 440 4755 69.5 Total 629 6840 100.0Missing System 56 600 Total 685 7440
There are minimal differences among regions and tiers in the percent of banks that offer Money Market Accounts.
The overall median interest rate for an MMA is 1.00 percent, and the mean is 1.07 percent.
QVIIA. Figure 24. Weighted Statistics: MMA Interest Rate
Valid 3922 N
Missing 3518 Mean 1.0678 Median 1.0000 Mode 1.00 Minimum .00 Maximum 4.25
There are no differences among tiers or regions for MMA interest rates.
S p e c i a l i z e d S a v i n g s A c c o u n t s
About half (49.9 percent) of banks offer specialized savings clubs.
QVIIA. Figure 25. Does the bank offer specialized savings clubs?
Frequency Weighted Percent
Weighted Percent
Valid No 303 3305 50.1 Yes 301 3298 49.9 Total 604 6602 100.0Missing System 81 837 Total 685 7440
225 Savings Accounts FDICBankSurvey_Report_204pjg.doc
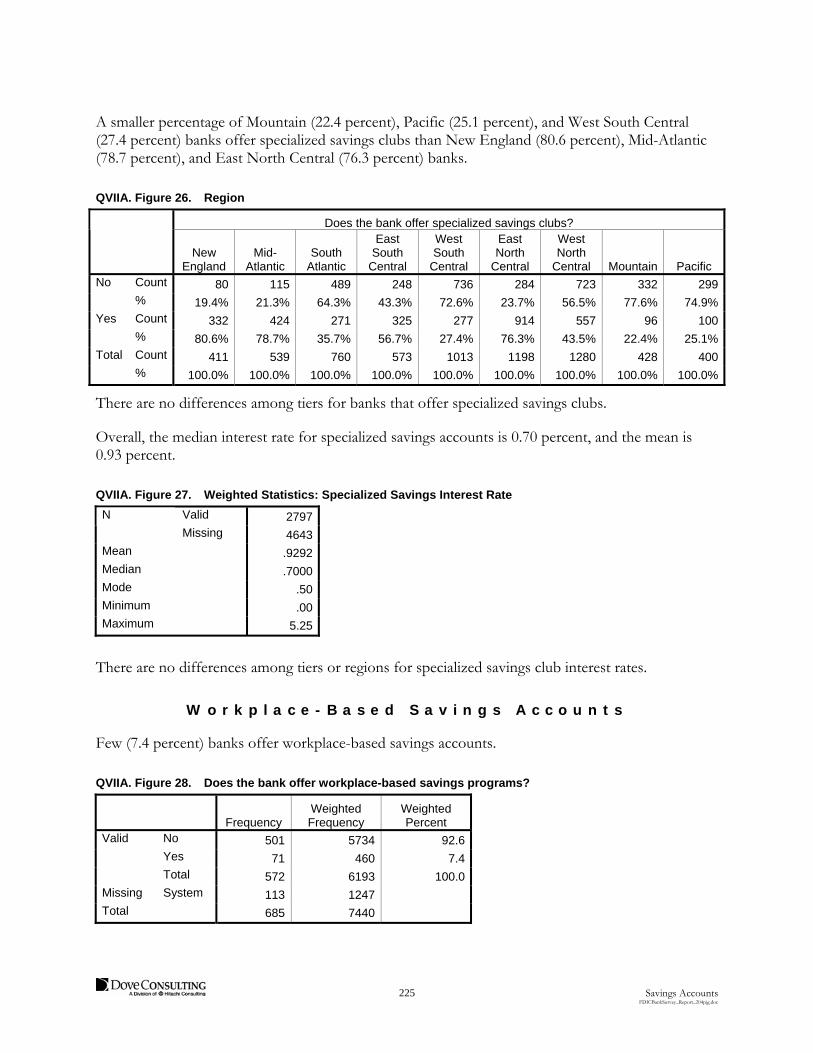
A smaller percentage of Mountain (22.4 percent), Pacific (25.1 percent), and West South Central (27.4 percent) banks offer specialized savings clubs than New England (80.6 percent), Mid-Atlantic (78.7 percent), and East North Central (76.3 percent) banks.
QVIIA. Figure 26. Region
Does the bank offer specialized savings clubs?
New England
Mid- Atlantic
South Atlantic
East South
Central
West South
Central
East North
Central
West North
Central Mountain Pacific No Count 80 115 489 248 736 284 723 332 299 % 19.4% 21.3% 64.3% 43.3% 72.6% 23.7% 56.5% 77.6% 74.9%Yes Count 332 424 271 325 277 914 557 96 100 % 80.6% 78.7% 35.7% 56.7% 27.4% 76.3% 43.5% 22.4% 25.1%Total Count 411 539 760 573 1013 1198 1280 428 400 % 100.0% 100.0% 100.0% 100.0% 100.0% 100.0% 100.0% 100.0% 100.0%
There are no differences among tiers for banks that offer specialized savings clubs.
Overall, the median interest rate for specialized savings accounts is 0.70 percent, and the mean is 0.93 percent.
QVIIA. Figure 27. Weighted Statistics: Specialized Savings Interest Rate
Valid 2797 N
Missing 4643 Mean .9292 Median .7000 Mode .50 Minimum .00 Maximum 5.25
There are no differences among tiers or regions for specialized savings club interest rates.
W o r k p l a c e - B a s e d S a v i n g s A c c o u n t s
Few (7.4 percent) banks offer workplace-based savings accounts.
QVIIA. Figure 28. Does the bank offer workplace-based savings programs?
Frequency Weighted Frequency
Weighted Percent
Valid No 501 5734 92.6 Yes 71 460 7.4 Total 572 6193 100.0Missing System 113 1247 Total 685 7440

226 Savings Accounts FDICBankSurvey_Report_204pjg.doc
There are differences among regions for banks that offer workplace-based savings accounts. A smaller percentage of banks in the West South Central region (1.8 percent) offer workplace-based savings accounts than banks in the New England region (21.4 percent).
QVIIA. Figure 29. Region
Does the bank offer workplace-based savings programs?
New England
Mid- Atlantic
South Atlantic
East South
Central
West South
Central
East North
Central
West North
Central Mountain Pacific No Count 302 384 655 518 965 987 1145 407 370 % 78.6% 86.6% 92.9% 95.4% 98.2% 88.1% 95.6% 94.9% 95.3%Yes Count 82 59 50 25 17 133 52 22 18 % 21.4% 13.4% 7.1% 4.6% 1.8% 11.9% 4.4% 5.1% 4.7%Total Count 384 444 706 543 982 1120 1198 429 388 % 100.0% 100.0% 100.0% 100.0% 100.0% 100.0% 100.0% 100.0% 100.0%
There are differences among tiers for banks that offer workplace-based savings accounts. About half (56.5 percent) of Tier 1, 26.0 percent of Tier 2, and 5.7 percent of Tier 3 banks offer workplace-based savings accounts.
QVIIA. Figure 30. Tier
Does the bank offer workplace-based savings programs?
Tier 1 Tier 2 Tier 3
No Count 10 336 5387 % 43.5% 74.0% 94.3%Yes Count 14 118 328 % 56.5% 26.0% 5.7%Total Count 24 454 5715 % 100.0% 100.0% 100.0%
Overall, the median interest rate for workplace-based accounts is 0.50 percent, and the mean is 0.90 percent.
QVIIA. Figure 31. Workplace Interest Rate
Valid 353 N
Missing 7086 Mean .8976 Median .5000 Mode .00 Minimum .00 Maximum 7.50
There are no differences among tiers or regions for workplace-based savings account interest rates.

227 Savings Accounts FDICBankSurvey_Report_204pjg.doc
Sixty-five banks offer other savings products. Respondent comments most frequently mention: accounts for minors (13), Christmas/holiday clubs (7), health savings (6), individual retirement accounts (IRAs) (5), and certificates of deposit (CDs) (4).
QVIIA. Figure 32. Does the bank offer other savings accounts?
Frequency Weighted Frequency
Weighted Percent
Valid No 195 2269 80.5 Yes 65 551 19.5 Total 260 2819 100.0Missing System 425 4621 Total 685 7440
There are differences among regions for banks that offer other types of savings accounts. No banks in the Mountain region offer other accounts, compared with 32.4 percent of banks in the East North Central region.
QVIIA. Figure 33. Region
Does the bank offer other savings accounts?
New England
Mid- Atlantic
South Atlantic
East South
Central
West South
Central
East North
Central
West North
Central Mountain Pacific No Count 114 183 311 237 315 386 390 168 164 % 73.5% 78.9% 81.3% 81.3% 86.0% 67.6% 85.1% 100.0% 85.2%Yes Count 41 49 72 55 51 186 68 29 % 26.5% 21.1% 18.7% 18.7% 14.0% 32.4% 14.9% 14.8%Total Count 155 233 383 292 366 572 458 168 193 % 100.0% 100.0% 100.0% 100.0% 100.0% 100.0% 100.0% 100.0% 100.0%
There are differences among tiers for banks that offer other types of savings accounts. Over two-thirds (69.2 percent) of Tier 1 banks and 39.3 percent of Tier 2 banks offer other savings accounts, compared with 17.8 percent of Tier 3 banks.
QVIIA. Figure 34. Tier
Does the bank offer other savings accounts?
Tier 1 Tier 2 Tier 3 No Count 4 118 2147 % 30.8% 60.7% 82.2%Yes Count 9 76 465 % 69.2% 39.3% 17.8%Total Count 14 194 2611 % 100.0% 100.0% 100.0%

228 Savings Accounts FDICBankSurvey_Report_204pjg.doc
The overall median interest rate for other types of savings accounts is 1.29 percent, and the mean is 1.69 percent.
QVIIA. Figure 35. Other Account Interest Rate
Valid 497 N
Missing 6943 Mean 1.6905 Median 1.2900 Mode .50 Minimum .00 5.00
The differences among tiers or regions for other types of savings account interest rates are minimal.
There are differences between urban and rural banks for certain types of savings accounts offered, including IDAs, workplace-based, and other types of savings accounts. Overall, a larger percentage of urban banks offer these savings programs than rural banks.
QVIIA. Figure 36. Rural
Types of Savings Accounts Offered
Rural HQ
Basic Savings
Accounts
Individual Development
Accounts IRS VITA Program
Money Market
Accounts
Specialized Savings Clubs
Workplace-Based Savings
Programs Other Savings
Accounts No Count 99 3128 3193 1176 1703 3132 1231 % 2.6% 94.1% 97.7% 32.1% 48.5% 95.0% 85.9%Yes Count 3744 195 75 2493 1809 164 202 % 97.4% 5.9% 2.3% 67.9% 51.5% 5.0% 14.1%Total Count 3843 3323 3269 3669 3511 3296 1432 % 100.0% 100.0% 100.0% 100.0% 100.0% 100.0% 100.0%
QVIIA. Figure 37. Urban
Types of Savings Accounts Offered
Urban HQ
Basic Savings
Accounts
Individual Development
Accounts IRS VITA Program
Money Market
Accounts
Specialized Savings Clubs
Workplace-Based Savings
Programs Other Savings
Accounts No Count 123 2748 2727 908 1602 2602 1038 % 3.6% 90.5% 95.8% 28.6% 51.8% 89.8% 74.9%Yes Count 3272 287 120 2263 1489 295 349 % 96.4% 9.5% 4.2% 71.4% 48.2% 10.2% 25.1%Total Count 3395 3035 2847 3171 3091 2897 1387 % 100.0% 100.0% 100.0% 100.0% 100.0% 100.0% 100.0%

229 Savings Accounts FDICBankSurvey_Report_204pjg.doc
There is also a difference between urban and rural banks in the interest rates banks offer for IDAs and workplace-based accounts. The median interest rate for rural bank IDAs is 1.25 percent, and the median for urban IDAs is 0.53 percent. The median for rural workplace accounts is 1.10 percent, and the median for urban workplace accounts is 0.40 percent.
QVIIA. Figure 38. Rural
Basic Savings Interest
Rate
Individual Development Interest Rate
IRS VITA Interest
Rate
MMA Interest
Rate
Specialized Savings Interest
Rate
Workplace Interest
Rate
Other Account Interest
Rate N Valid 3511 133 34 2110 1521 103 198 Missing 448 3826 3925 1850 2438 3857 3761Mean .8132 1.7933 .4839 1.0982 1.0007 2.0004 1.8469Median .7500 1.2500 .1500 1.0000 .7500 1.1000 1.6450Mode .50 .15 .15 1.00 .50 1.00 .50Minimum .00 .15 .10 .00 .00 .00 .00Maximum 3.00 4.75 1.00 4.25 5.00 7.50 5.00
QVIIA. Figure 39. Urban
Basic Savings Interest
Rate
Individual Development Interest Rate
IRS VITA Interest
Rate
MMA Interest
Rate
Specialized Savings Interest
Rate
Workplace Interest
Rate
Other Account Interest
Rate N Valid 2996 283 132 1812 1275 251 299 Missing 485 3198 3348 1668 2205 3230 3182Mean .7830 .9141 .4922 1.0323 .8438 .4462 1.5866Median .6000 .5271 .3750 .8646 .6000 .4000 1.0000Mode .50 .50 .50 .50 .25 .50 .00Minimum .00 .00 .00 .00 .00 .00 .00Maximum 4.51 4.25 4.50 3.93 5.25 3.00 4.34

230 Savings Accounts FDICBankSurvey_Report_204pjg.doc
W o r k p l a c e a n d S c h o o l - B a s e d S a v i n g s P r o g r a m s
Question VII B. Does the bank partner with organizations (e.g., by operating a high school branch or employer location) to promote savings products?
Yes No
Less than a quarter (22.1 percent) of banks partner with other organizations to promote savings products.
QVIIB. Figure 1. Does the bank partner with organizations to promote savings products?
Frequency Weighted Frequency
Weighted Percent
Valid No 480 5703 77.9 Yes 194 1616 22.1 Total 674 7320 100.0Missing System 11 120 Total 685 7440
A smaller percentage of banks in the West North Central region (12.8 percent) partner with organizations to promote savings products compared with banks in the East North Central (27.0 percent), East South Central (27.2 percent), and New England (43.0 percent) regions.
QVIIB. Figure 2. Region
Does the bank partner with organizations to promote savings products?
New England
Mid- Atlantic
South Atlantic
East South
Central
West South
Central
East North
Central
West North
Central Mountain Pacific No Count 254 463 685 497 876 928 1217 424 360 % 57.0% 82.2% 79.7% 72.8% 76.2% 73.0% 87.2% 83.6% 81.0%Yes Count 192 100 175 186 274 343 179 83 85 % 43.0% 17.8% 20.3% 27.2% 23.8% 27.0% 12.8% 16.4% 19.0%Total Count 446 563 860 683 1150 1271 1396 507 444 % 100.0% 100.0% 100.0% 100.0% 100.0% 100.0% 100.0% 100.0% 100.0%
There is a difference between tiers for banks that partner with organizations to promote savings products. Over three-quarters (79.2 percent) of Tier 1 banks, 50.0 percent of Tier 2 banks, and 19.6 percent of Tier 3 banks partner with other organizations.

231 Savings Accounts FDICBankSurvey_Report_204pjg.doc
QVIIB. Figure 3. Tier
Does the bank partner with organizations to promote savings products?
Tier 1 Tier 2 Tier 3
No Count 5 271 5428 % 20.8% 50.0% 80.4%Yes Count 20 271 1326 % 79.2% 50.0% 19.6%Total Count 25 541 6754 % 100.0% 100.0% 100.0%
There is a difference between urban and rural banks for banks that partner with organizations to promote savings products. About a fifth (18.9 percent) of rural banks partner, compared with 25.8 percent of urban banks.
QVIIB. Figure 4. Urban/Rural
Does the bank partner with organizations to promote savings products?
Rural HQ Urban HQ
No Count 3176 2528 % 81.1% 74.2%Yes Count 739 878 % 18.9% 25.8%Total Count 3915 3405 % 100.0% 100.0%
Question VII B-1.If yes, please describe.
Of the 194 respondents that reported partnering with organizations to promote savings products, 176 described the organizations with which they partner.
Respondents reported viewing partnering as an opportunity to develop relationships with local employers and their employees and to gain exposure with youth in the community through school partnerships. Comments indicated attempts to reach out to minors at a young age and show them the benefits offered by banks. Banks also view partnering with local businesses and giving presentations to employees as a means of attracting more business. Partnering with a trusted source, such as an employer, is viewed by respondents as a way of gaining credibility and building trust with unbanked and underbanked employees.
About two-thirds (118 of 176) of responding banks partner with educational institutions from elementary schools through colleges. They use the ABA Teach Children to Save Day, Junior Achievement, Saving Makes Cents, FDIC Money Smart, and Bank-at-School programs.
The second most common type of organization with which banks partner is local employers. A third (57 of 176) of respondents either offer Bank-at-Work programs or visit workplaces to provide informational sessions.
A fifth (37 of 176) of banks reported working with community or non-profit organizations to promote savings products. IDAs are one of the most frequently identified products offered to organizations’ unbanked and underbanked clientele.

232 Savings Accounts FDICBankSurvey_Report_204pjg.doc
233 Payments Products FDICBankSurvey_Report_204pjg.doc
Payments Products
This chapter examines the following topics:
Availability of Funds for Established Customers
Advance Loans These questions address aspects of the Congressional Question 4: barriers which may prevent un/underbanked individuals from cashing checks.
S u m m a r y
On-us checks drawn on the bank receive the fastest funds availability for established customers when cashing checks (beyond the $100 specified by Reg. CC). The majority of banks provide customers presenting on-us checks current day funds availability, with universal funds availability by the second business day. On-us business checks receive current business day availability at an estimated 63 percent of banks and next business day availability at 36 percent of banks. Customers presenting on-us personal checks receive current business day funds availability at 64 percent of banks and next business day availability at 36 percent of banks. Funds from government checks are available on the same day that the check is deposited at 50 percent of banks, and double-endorsed checks have the slowest funds availability, with 24 percent of banks providing same business day availability and 35 percent with next business day availability.
Banks provide relatively slow funds availability when cashing payroll checks, which can limit the attractiveness of maintaining an account for some individuals relative to using a nonbank check cashing service. A majority of banks will not provide same day availability for local payroll checks not drawn on the bank for established customers. Fifty percent make funds available the next day, and 17 percent will make funds available on the second business day.
Only about 6 percent of banks provide an advance loan on funds that are due to arrive from a deposited check or a regularly scheduled direct deposit. Typically, banks that provide an advance loan only provide it on regularly scheduled direct deposit funds and government checks.
A v a i l a b i l i t y o f F u n d s f o r E s t a b l i s h e d C u s t o m e r s
Banks’ funds availability policies are most favorable for on-us checks, where over 62 percent of banks provide same day availability. Checks drawn on other banks are more likely to have next business day availability than same day availability. For example, about half (49.6 percent) of banks have next day availability for local payroll checks, compared with 32 percent that have current business day availability.
Chapter
10

234 Payments Products FDICBankSurvey_Report_204pjg.doc
Question VIII A. How soon (in terms of number of business days), beyond the $100 specified by Reg. CC, are funds ordinarily available for an established customer who presents the following items?
QVIIIA. Figure 1. Funds Availability
Check value is $2,500 or less
Current Business Day
Next Business Day
Second Business Day
Three or More Business Days
Business check drawn on your bank (On-us) 62.9% 36.4% 0.8% 0%
Personal check drawn on your bank (On-us) 64.0% 35.5% 0.6% 0%
Payroll check not drawn on your bank (Local) 32.1% 49.6% 16.5% 1.8%
Business check not drawn on your bank (Local) 27.8% 48.0% 21.0% 3.2%
Personal check not drawn on your bank (Local) 26.6% 47.0% 21.2% 5.2%
Government check 50.4% 48.0% 0.6% 1.0%
Double endorsed check from a third-party 23.7% 35.2% 8.4% 32.6%
QVIIIA. Figure 2. How soon are funds available for a business check drawn on your bank?
Frequency Weighted Frequency
Weighted Percent
Valid Current day 392 4560 62.9 Next day 273 2637 36.4 Second day 4 55 .8 Total 669 7252 100.0Missing System 16 188 Total 685 7440
There are differences among regions in terms of how soon funds are available for on-us business checks. Banks in the New England region make funds available sooner (85.2 percent available same day) than banks in the Mid-Atlantic (46.4 percent same day) and Mountain (47.5 percent same day) regions.
QVIIIA. Figure 3. Region
How soon are funds available for a business check drawn on your bank?
New England
Mid- Atlantic
South Atlantic
East South
Central
West South
Central
East North
Central
West North
Central Mountain Pacific Current day
Count 380 249 525 359 595 894 1008 220 329
% 85.2% 46.4% 61.1% 54.8% 51.1% 69.4% 72.2% 47.5% 74.0%Next day
Count 66 274 307 296 568 380 388 243 115
% 14.8% 51.1% 35.7% 45.2% 48.9% 29.5% 27.8% 52.5% 26.0%Second day
Count 14 27 14
% 2.6% 3.2% 1.1% Total Count 446 536 860 655 1163 1288 1396 463 444 % 100.0% 100.0% 100.0% 100.0% 100.0% 100.0% 100.0% 100.0% 100.0%

235 Payments Products FDICBankSurvey_Report_204pjg.doc
There is a difference between tiers in terms of how soon funds are made available for a business check cashed on the bank. Tier 3 banks make funds available more quickly (64.6 percent with same day availability) than banks in Tier 2 (42.3 percent with same day availability) or Tier 1 (41.7 percent with same day availability).
QVIIIA. Figure 4. Tier
How soon are funds available for a business check drawn on your bank?
New Tier Tier 1 Tier 2 Tier 3 Current day
Count 10 229 4320
% 41.7% 42.3% 64.6%Next day Count 15 312 2311 % 58.3% 57.7% 34.6%Second day
Count 55
% .8%Total Count 25 541 6686 % 100.0% 100.0% 100.0%
There is no difference between urban and rural banks in how soon funds are available for a business check cashed on the bank.
QVIIIA. Figure 4. How soon are funds available for a personal check drawn on your bank?
Frequency Weighted Frequency
Weighted Percent
Valid Current day 401 4642 64.0 Next day 266 2572 35.5 Second day 3 41 .6 Total 670 7255 100.0Missing System 15 185 Total 685 7440
There are differences among regions in funds availability for on-us personal checks. New England banks make funds availability sooner than banks in West South Central and Mid Atlantic, which is similar to funds availability for on-us business checks. In this case, 85.2 percent of banks in New England offer same day funds availability for on-us personal checks, compared with 48.0 percent of Mid Atlantic and 48.3 percent of Mountain banks.

236 Payments Products FDICBankSurvey_Report_204pjg.doc
QVIIIA. Figure 5. Region
How soon are funds available for a personal check drawn on your bank?
New England
Mid Atlantic
South Atlantic
East South
Central
West South
Central
East North
Central
West North
Central Mountain Pacific Current day
Count 380 266 512 376 609 912 1036 223 329
% 85.2% 48.0% 60.5% 57.4% 52.3% 70.8% 74.2% 48.3% 74.0%Next day
Count 66 274 320 279 555 363 360 239 115
% 14.8% 49.5% 37.9% 42.6% 47.7% 28.2% 25.8% 51.7% 26.0%Second day
Count 14 14 14
% 2.5% 1.6% 1.1% Total Count 446 553 846 655 1163 1288 1396 463 444 % 100.0% 100.0% 100.0% 100.0% 100.0% 100.0% 100.0% 100.0% 100.0%
There is a difference between tiers in funds availability of on-us personal checks. Funds are made available sooner by Tier 3 banks (65.6 percent same day) than for either Tier 1 (41.7 percent same day) or Tier 2 (44.6 percent same day), which mirrors on-us business checks.
QVIIIA. Figure 6. Tier
How soon are funds available for a personal check drawn on your bank?
New Tier Tier 1 Tier 2 Tier 3 Current day
Count 10 243 4389
% 41.7% 44.6% 65.6%Next day Count 15 302 2256 % 58.3% 55.4% 33.7%Second day
Count 41
% .6%Total Count 25 544 6686 % 100.0% 100.0% 100.0%
There is not a difference between urban and rural banks for funds availability of on-us personal checks.
QVIIIA. Figure 7. How soon are funds available for a payroll check not drawn on your bank?
Frequency Weighted Frequency
Weighted Percent
Valid Current day 194 2323 32.1 Next day 345 3594 49.6 Second day 119 1194 16.5 Three or more days 11 130 1.8 Total 669 7241 100.0Missing System 16 198 Total 685 7440

237 Payments Products FDICBankSurvey_Report_204pjg.doc
There are differences among regions in funds availability for local payroll checks. Banks in West North Central (41.4 percent same day) and East North Central (40.9 percent same day) regions make funds available more quickly for local payroll checks than banks in the Mid-Atlantic region (18.7 percent same day).
QVIIIA. Figure 8. Region
How soon are funds available for a payroll check not drawn on your bank?
New England
Mid- Atlantic
South Atlantic
East South
Central
West South
Central
East North
Central
West North
Central Mountain Pacific Current day
Count 137 106 202 236 314 521 578 130 100
% 30.7% 18.7% 23.5% 36.8% 27.0% 40.9% 41.4% 28.1% 23.1%Next day Count 261 246 434 286 715 480 682 270 219 % 58.6% 43.5% 50.5% 44.6% 61.5% 37.6% 48.8% 58.4% 50.9%Second day
Count 48 201 210 120 120 243 109 63 81
% 10.8% 35.4% 24.4% 18.7% 10.3% 19.1% 7.8% 13.5% 18.8%Three or more days
Count 14 14 14 31 27 31
% 2.4% 1.6% 1.2% 2.4% 2.0% 7.2%Total Count 446 567 860 642 1163 1274 1396 463 431 % 100.0% 100.0% 100.0% 100.0% 100.0% 100.0% 100.0% 100.0% 100.0%
There are differences among tiers in funds availability for local payroll checks. Funds are made available sooner by Tier 3 banks (33.2 percent same day) than by Tier 2 banks (19.7 percent same day).
QVIIIA. Figure 9. Tier
How soon are funds available for a payroll check not drawn on your bank?
New Tier Tier 1 Tier 2 Tier 3
Current day Count 1 108 2215 % 4.2% 19.7% 33.2%Next day Count 18 309 3268 % 70.8% 56.7% 49.0%Second day Count 6 121 1066 % 25.0% 22.3% 16.0%Three or more days
Count 7 123
% 1.3% 1.8%Total Count 25 544 6672 % 100.0% 100.0% 100.0%
238 Payments Products FDICBankSurvey_Report_204pjg.doc
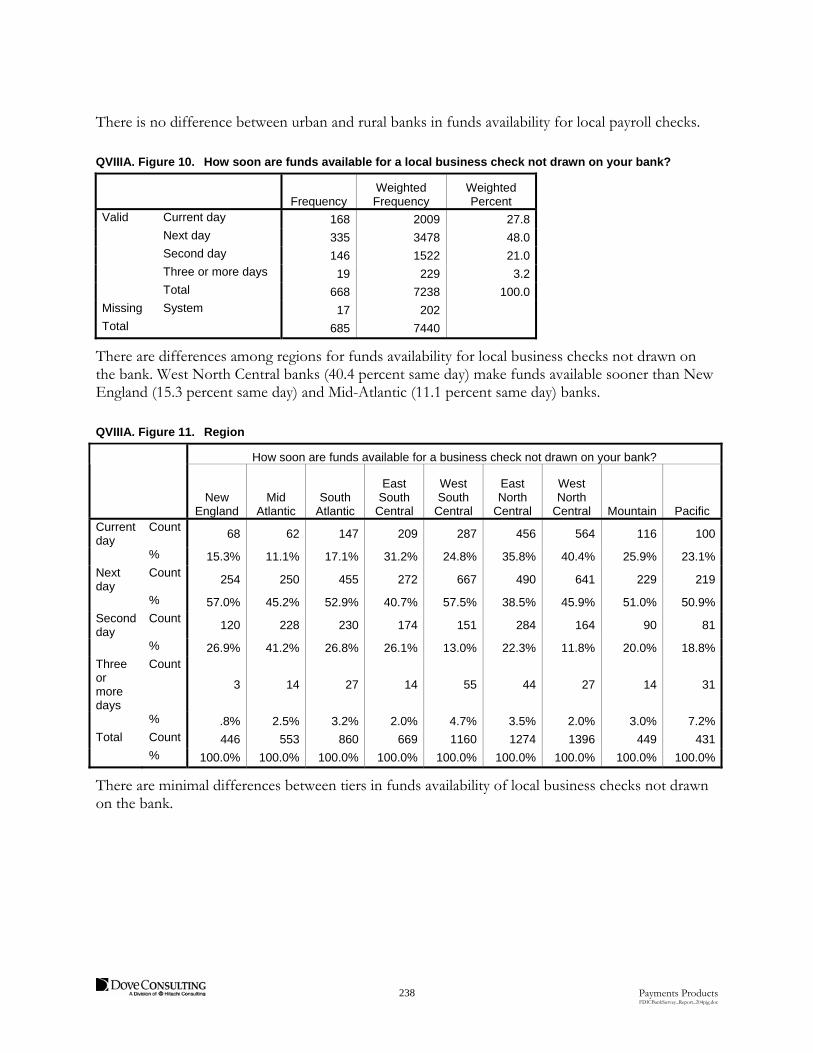
There is no difference between urban and rural banks in funds availability for local payroll checks.
QVIIIA. Figure 10. How soon are funds available for a local business check not drawn on your bank?
Frequency Weighted Frequency
Weighted Percent
Valid Current day 168 2009 27.8 Next day 335 3478 48.0 Second day 146 1522 21.0 Three or more days 19 229 3.2 Total 668 7238 100.0Missing System 17 202 Total 685 7440
There are differences among regions for funds availability for local business checks not drawn on the bank. West North Central banks (40.4 percent same day) make funds available sooner than New England (15.3 percent same day) and Mid-Atlantic (11.1 percent same day) banks.
QVIIIA. Figure 11. Region
How soon are funds available for a business check not drawn on your bank?
New England
Mid Atlantic
South Atlantic
East South
Central
West South
Central
East North
Central
West North
Central Mountain Pacific Current day
Count 68 62 147 209 287 456 564 116 100
% 15.3% 11.1% 17.1% 31.2% 24.8% 35.8% 40.4% 25.9% 23.1%Next day
Count 254 250 455 272 667 490 641 229 219
% 57.0% 45.2% 52.9% 40.7% 57.5% 38.5% 45.9% 51.0% 50.9%Second day
Count 120 228 230 174 151 284 164 90 81
% 26.9% 41.2% 26.8% 26.1% 13.0% 22.3% 11.8% 20.0% 18.8%Three or more days
Count
3 14 27 14 55 44 27 14 31
% .8% 2.5% 3.2% 2.0% 4.7% 3.5% 2.0% 3.0% 7.2%Total Count 446 553 860 669 1160 1274 1396 449 431 % 100.0% 100.0% 100.0% 100.0% 100.0% 100.0% 100.0% 100.0% 100.0%
There are minimal differences between tiers in funds availability of local business checks not drawn on the bank.

239 Payments Products FDICBankSurvey_Report_204pjg.doc
There is little difference between urban and rural banks in funds availability of local business checks that were not drawn on the bank.
QVIIIA. Figure 12. How soon are funds available for a personal check not drawn on your bank?
Frequency Weighted Frequency
Weighted Percent
Valid Current day 161 1913 26.6 Next day 326 3383 47.0 Second day 147 1528 21.2 Three or more days 31 373 5.2 Total 665 7197 100.0Missing System 20 243 Total 685 7440
There are differences among regions in funds availability for local personal checks that are not drawn on the bank. West North Central banks (40.4 percent same day) make funds available sooner than New England (15.3 percent same day) and Mid Atlantic (11.1 percent same day) banks.
QVIIIA. Figure 13. Region
How soon are funds available for a personal check not drawn on your bank?
New England
Mid- Atlantic
South Atlantic
East South
Central
West South
Central
East North
Central
West North
Central Mountain Pacific Current day
Count 68 62 147 209 273 388 564 103 100
% 15.3% 11.1% 17.4% 31.2% 23.6% 30.7% 40.4% 22.9% 23.9%Next day
Count 213 251 424 259 661 476 641 243 216
% 47.8% 45.3% 50.1% 38.6% 56.9% 37.8% 45.9% 54.1% 51.8%Second day
Count 147 224 244 147 171 284 137 104 71
% 33.0% 40.4% 28.9% 22.0% 14.8% 22.5% 9.8% 23.1% 16.9%Three or more days
Count
17 17 31 55 55 113 55 31
% 3.8% 3.1% 3.6% 8.2% 4.7% 9.0% 3.9% 7.4%Total Count 446 553 846 669 1160 1261 1396 449 417 % 100.0% 100.0% 100.0% 100.0% 100.0% 100.0% 100.0% 100.0% 100.0%
There is little difference between tiers in funds availability for local personal checks not drawn on the bank.

240 Payments Products FDICBankSurvey_Report_204pjg.doc
There is little difference between urban and rural banks in funds availability for local personal checks not drawn on the bank.
QVIIIA. Figure 14. How soon are funds available for a government check?
Frequency Weighted Frequency
Weighted Percent
Valid Current day 305 3640 50.4 Next day 351 3465 48.0 Second day 4 44 .6 Three or more days 7 75 1.0 Total 667 7224 100.0Missing System 18 215 Total 685 7440
A greater percentage of West North Central (65.1 percent same day) and New England (57.2 percent same day) banks provide faster funds availability for government checks than Mid-Atlantic banks (27.2 percent same day).
QVIIIA. Figure 15. Region
How soon are funds available for a government check?
New England
Mid- Atlantic
South Atlantic
East South
Central
West South
Central
East North
Central
West North
Central Mountain Pacific Current day
Count 253 151 320 315 605 719 909 169 199
% 57.2% 27.2% 39.1% 47.1% 52.0% 56.4% 65.1% 36.5% 44.7%Next day
Count 189 403 471 354 555 511 487 267 228
% 42.8% 72.8% 57.5% 52.9% 47.7% 40.1% 34.9% 57.6% 51.4%Second day
Count 27 3 14
% 3.3% .3% 3.0% Three or more days
Count
3 41 14 17
% .3% 3.2% 3.0% 3.9%Total Count 442 553 819 669 1163 1274 1396 463 444 % 100.0% 100.0% 100.0% 100.0% 100.0% 100.0% 100.0% 100.0% 100.0%

241 Payments Products FDICBankSurvey_Report_204pjg.doc
There are differences among tiers in funds availability for government checks. Government check funds are made available sooner by Tier 3 banks (52.2 percent same day) than by both Tier 1 (16.7 percent same day) and Tier 2 banks (30.1 percent same day).
QVIIIA. Figure 16. Tier
How soon are funds available for a government check?
New Tier Tier 1 Tier 2 Tier 3 Current day Count 4 163 3473 % 16.7% 30.1% 52.2%Next day Count 21 368 3076 % 83.3% 67.9% 46.2%Second day Count 3 41 % .6% .6%Three or more days
Count 7 68
% 1.3% 1.0%Total Count 25 541 6658 % 100.0% 100.0% 100.0%
There is no difference between urban and rural banks in funds availability for government checks.
Over half (58.9 percent) of banks make funds available for double endorsed checks by the next day, with 23.7 percent providing current day availability and 35.2 percent providing next day availability.
QVIIIA. Figure 17. How soon are funds available for a double endorsed check?
Frequency Weighted Frequency
Weighted Percent
Valid Current day 127 1560 23.7 Next day 219 2317 35.2 Second day 54 552 8.4 Three or more days 193 2145 32.6 Total 593 6574 100.0Missing System 92 866 Total 685 7440
242 Payments Products FDICBankSurvey_Report_204pjg.doc
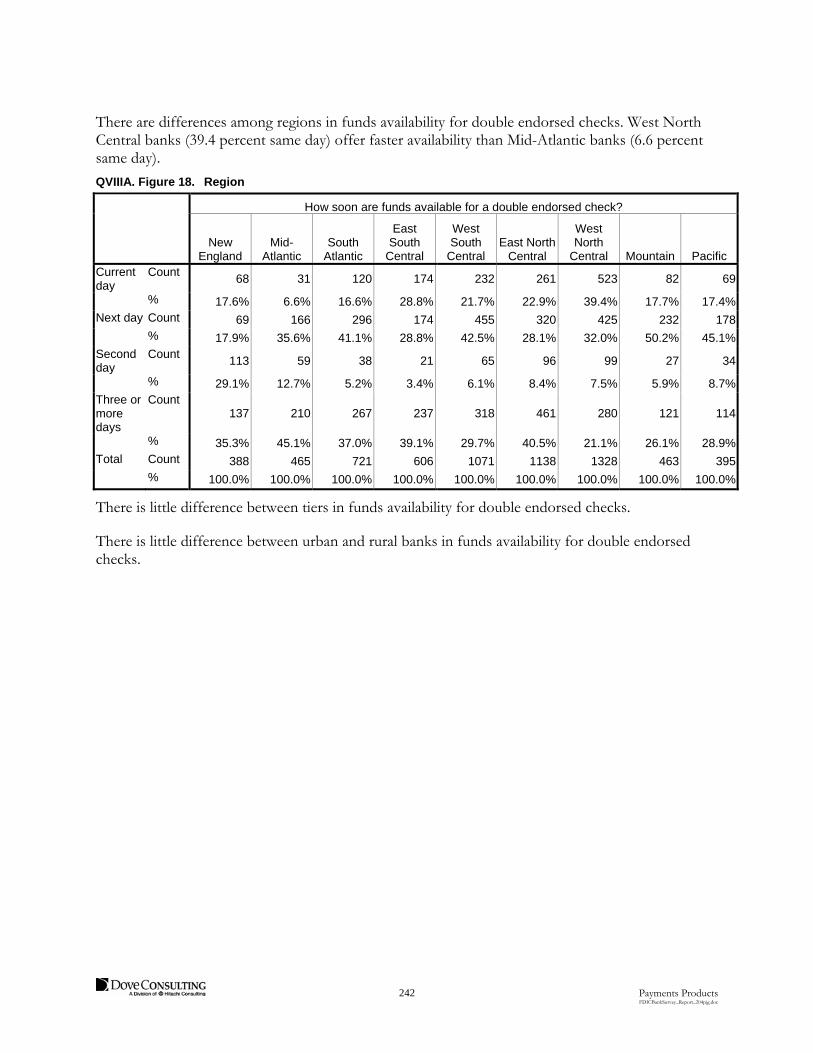
There are differences among regions in funds availability for double endorsed checks. West North Central banks (39.4 percent same day) offer faster availability than Mid-Atlantic banks (6.6 percent same day).
QVIIIA. Figure 18. Region
How soon are funds available for a double endorsed check?
New England
Mid- Atlantic
South Atlantic
East South
Central
West South
Central East North
Central
West North
Central Mountain Pacific Current day
Count 68 31 120 174 232 261 523 82 69
% 17.6% 6.6% 16.6% 28.8% 21.7% 22.9% 39.4% 17.7% 17.4%Next day Count 69 166 296 174 455 320 425 232 178 % 17.9% 35.6% 41.1% 28.8% 42.5% 28.1% 32.0% 50.2% 45.1%Second day
Count 113 59 38 21 65 96 99 27 34
% 29.1% 12.7% 5.2% 3.4% 6.1% 8.4% 7.5% 5.9% 8.7%Three or more days
Count 137 210 267 237 318 461 280 121 114
% 35.3% 45.1% 37.0% 39.1% 29.7% 40.5% 21.1% 26.1% 28.9%Total Count 388 465 721 606 1071 1138 1328 463 395 % 100.0% 100.0% 100.0% 100.0% 100.0% 100.0% 100.0% 100.0% 100.0%
There is little difference between tiers in funds availability for double endorsed checks.
There is little difference between urban and rural banks in funds availability for double endorsed checks.

243 Payments Products FDICBankSurvey_Report_204pjg.doc
A d v a n c e L o a n s
Few (5.5 percent) banks provide an advance on funds that are due to arrive. Advances are more often available on direct deposits than on checks.
Question VIII B. Can a customer get an “advance loan” on the funds from a deposited check or a regularly scheduled direct deposit (excluding all programs to cover overdrafts and NSF transactions)?
Yes, accelerated availability of deposited check
Yes, advance for a scheduled direct deposit
No
QVIIIB. Figure 1. Can a customer get an advance loan on the funds from a deposited check or direct deposit?
Frequency Weighted Frequency
Weighted Percent
Valid No 626 6786 94.5 Yes, accelerated
availability of check 18 172 2.4
Yes, advanced direct deposit 20 225 3.1
Total 664 7183 100.0Missing System 21 257 Total 685 7440
There is little difference between regions in the offering of advance loans on funds due to arrive.
A greater percentage of Tier 1 banks (16.7 percent) offer advance loans on funds due to arrive than Tier 2 (4.4 percent) and Tier 3 (5.6 percent) banks.
QVIIIB. Figure 2. Tier
Can a customer get an advance loan on the funds from a deposited check or direct deposit?
New Tier Tier 1 Tier 2 Tier 3 No Count 21 517 6248 % 83.3% 95.5% 94.4%Yes, accelerated availability of check
Count 1 21 150
% 4.2% 3.8% 2.3%Yes, advanced direct deposit
Count 3 3 219
% 12.5% .6% 3.3%Total Count 25 541 6617 % 100.0% 100.0% 100.0%
There is no difference between urban and rural banks in the proportion of banks offering advance loans on funds due to arrive.

244 Payments Products FDICBankSurvey_Report_204pjg.doc
Question VIII B-1. Up to what dollar or percentage amount will the bank typically advance? $___ or ___%
Question VIII B-2. What fee is charged for the advance? $___ flat advance fee or %___ of the amount advanced.
Customers can get an advance of up to $5,000.00 or 100 percent of funds that are due to arrive and are charged $0.00 to $40.00 or 0.0 percent to 18.0 percent in fees.
QVIIIB-2. Figure 1. Statistics
Weighted Advance $ Advance % Fee $ Fee % N Valid 91 219 247 75 Missing 307 179 150 323Mean $547.24 89.83 $13.87 9.36Median $500.00 100.00 $10.00 10.00Mode $500.00 100.00 $.00 .00Minimum $.00 50.00 $.00 .00Maximum $5,000.00 100.00 $40.00 18.00
There is little difference between tiers in advance loan amounts and fees.
There are differences among regions for advance loan amounts, but there are too few responses to develop any conclusions.
There is little difference between urban and rural banks for advance loan amounts and fees.

245 Payments Products FDICBankSurvey_Report_204pjg.doc
Question VIII B-3. What types of checks/deposits qualify for advances?
All checks Business checks, but not personal checks
Government checks Payroll checks only
Regularly scheduled direct Other: ___ deposits
Based on the survey responses, fewer than half (40.7 percent) of the banks that offer advance loans on funds from a deposited check or a regularly scheduled deposit will provide an advance for all types of checks. Nearly one-third (30.8 percent) of such banks will provide an advance for a government check. About 8 percent (7.7 percent) will make an advance loan for payroll checks. However, nearly half (49.2 percent) will offer an advance loan on a regularly scheduled direct deposit.
QVIIIB-3. Figure 1. All Checks
Frequency Weighted Frequency
Weighted Percent
Valid No 22 220 59.3 Yes 14 151 40.7 Total 36 370 100.0Missing System 2 27Total 38 398
QVIIIB-3. Figure 2. Business Checks, but Not Personal Checks
Frequency Weighted Frequency
Weighted Percent
Valid No 35 369 99.7 Yes 1 1 .3 Total 36 370 100.0Missing System 2 27Total 38 398
QVIIIB-3. Figure 3. Government Checks
Frequency Weighted Frequency
Weighted Percent
Valid No 26 256 69.2 Yes 10 114 30.8 Total 36 370 100.0Missing System 2 27Total 38 398
QVIIIB-3. Figure 4. Payroll Checks Only
Frequency Weighted Frequency
Weighted Percent
Valid No 33 342 92.3 Yes 3 28 7.7 Total 36 370 100.0Missing System 2 27Total 38 398
QVIIIB-3. Figure 5. Regularly Scheduled Direct Deposits
Frequency Weighted Frequency
Weighted Percent
Valid No 21 188 50.8 Yes 15 182 49.2 Total 36 370 100.0Missing System 2 27Total 38 398
QVIIIB-3. Figure 6. Other
Frequency Weighted Frequency
Weighted Percent
Valid No 34 356 96.0 Yes 2 15 4.0 Total 36 370 100.0Missing System 2 27Total 38 398
246 Payments Products FDICBankSurvey_Report_204pjg.doc
Banks that indicate “other” state the following:
ACH deposits qualify for advances ($500 or 50 percent of monthly ACH payments can be accessed, whichever is less).
Deposit accounts must be in good standing to qualify for an advance loan.
“We are a ‘Pay All Bank’ that will also permit ATM and debit card ODs for satisfactory accounts opened over 60 days.”
There are minimal differences among regions or tiers for types of checks that qualify for advance loans.
There is little difference between urban and rural banks in the types of checks that qualify for advance loans.

247 Credit Products FDICBankSurvey_Report_204pjg.doc
Credit Products
This chapter examines the following topics:
Closed-End Unsecured Loans
Small Dollar Loans
Tax Refund Anticipation Loans
Consumer Credit Cards
These questions address aspects of the Congressional Question 4: transaction costs and policies for credit accounts for the un/underbanked.
S u m m a r y
The most commonly offered credit product is an unsecured closed-end personal loan of up to $5,000. Other credit products are offered by fewer than half of the banks. The majority (an estimated 69 percent) of banks offer closed-end personal loans, 36 percent offer consumer credit cards, and 11 percent offer tax refund anticipation loans. When assessing eligibility for a closed-end personal loan, 94 percent of banks require a review of an individual’s credit history, 76 percent of banks look at proof of income, and 50 percent have a minimum credit score requirement. The median minimum loan size for an unsecured closed-end loan is $1,000, and the median maximum term is 36 months. Eighty percent of banks are able to originate these loans in less than 24 hours.
To qualify for a credit card, an estimated 78 percent of banks require a social security number, 77 percent require a review of an individual’s credit history, 52 percent set a minimum credit score requirement, and 48 percent require a proof of income. Of the banks that offer credit cards, 42 percent indicate that having a deposit relationship with the bank improves an individual’s ability to obtain a credit card, typically through a review of a the individual’s account history to asses their ability to repay. Of the banks that offer credit cards, one-fourth offer secured cards, and of these, 96 percent allow customers to graduate from the secured card to a traditional card once customers establish an acceptable credit history after 12 to 24 months.
Chapter
11

248 Credit Products FDICBankSurvey_Report_204pjg.doc
C l o s e d - E n d U n s e c u r e d L o a n s
Question IX A. Does the bank typically offer unsecured closed-end personal loans up to $5,000? Yes No
Over two-thirds (69.3 percent) of banks offer closed-end unsecured personal loans for amounts up to $5,000.00. Fewer than half of the banks offer small dollar loans of less than $1,000.00 with at least a 90-day repayment term and low fees (43.5 percent) or credit cards (35.7 percent). One in ten banks offer tax refund anticipation loans (10.6 percent).
QIXA. Figure 1. Percent of Banks Offering Credit Cards and Loans
Type of Loan Percent of
Banks Offering
Closed-end Unsecured Loans 69.3%
Small Dollar Loans 43.5%
Consumer Credit Cards 35.7%
Secured Credit Cards (if offer credit cards) 25.3%
Tax Refund Anticipation Loans 10.6%
QIXA. Figure 2. Does the bank offer unsecured loans up to $5000?
Frequency Weighted Frequency
Weighted Percent
Valid No 196 2256 30.7 Yes 478 5094 69.3 Total 674 7351 100.0Missing System 11 89 Total 685 7440
There are differences among regions for banks that offer unsecured consumer loans of up to $5,000. The Pacific and Mountain regions (53.2 percent and 56.9 percent, respectively) have lower shares of banks that make these unsecured loans than banks in other regions, specifically East South Central and New England (83.1 percent and 87.7 percent, respectively).

249 Credit Products FDICBankSurvey_Report_204pjg.doc
QIXA. Figure 3. Region
Does the bank offer unsecured loans up to $5000?
New England
Mid- Atlantic
South Atlantic
East South
Central
West South
Central
East North
Central
West North
Central Mountain Pacific No Count 55 206 265 113 308 376 503 215 216 % 12.3% 35.5% 30.9% 16.9% 27.1% 28.8% 36.0% 43.1% 46.8%Yes Count 391 374 591 556 828 929 894 285 246 % 87.7% 64.5% 69.1% 83.1% 72.9% 71.2% 64.0% 56.9% 53.2%Total Count 446 581 856 669 1136 1305 1396 500 461 % 100.0% 100.0% 100.0% 100.0% 100.0% 100.0% 100.0% 100.0% 100.0%
A higher percentage of Tier 1 banks (91.7 percent) offer unsecured loans of up to $5,000 than Tier 3 (68.8 percent) banks. A greater percentage of Tier 2 banks (74.5 percent) offer unsecured loans than Tier 3 banks.
QIXA. Figure 4. Tier
Does the bank offer unsecured loans up to $5000 New Tier
Tier 1 Tier 2 Tier 3 No Count 2 135 2119 % 8.3% 25.5% 31.2% Yes Count 23 395 4676 % 91.7% 74.5% 68.8% Total Count 25 531 6795 % 100.0% 100.0% 100.0%
There is a difference between urban and rural banks that offer unsecured loans of up to $5,000.00. A smaller percentage of urban banks (64.2 percent) offer these loans than rural banks (73.8 percent).
QIXA. Figure 5. Urban/Rural
Does the bank offer unsecured loans up to $5000?
Rural HQ Urban HQ No Count 1032 1224 % 26.2% 35.8%Yes Count 2903 2191 % 73.8% 64.2%Total Count 3935 3415 % 100.0% 100.0%

250 Credit Products FDICBankSurvey_Report_204pjg.doc
Question IX A-1. If yes, what are the eligibility requirements?
Deposit relationship with the bank Direct deposit
Proof of income Minimum credit score
Review credit history Other
Nearly all (93.6 percent) banks require a review of an individual’s credit history when determining eligibility for an unsecured loan. Proof of income is required by 75.7 percent of banks. An unspecified minimum credit score requirement is set by 50.0 percent of banks, 40.5 percent require a deposit relationship, but only 3.4 percent require direct deposit.
QIXA-1. Figure 1. Eligibility Requirements for Obtaining an Unsecured Closed-End Personal Loan
Eligibility Requirements Percentage of
Banks Requiring
Review Credit History 93.6%
Proof of Income 75.7%
Minimum Credit Score 50.0%
Deposit Relationship 40.5%
Other 16.3%
Direct Deposit 3.4%
QIXA-1. Figure 2. Review of Credit History
Frequency Weighted Frequency
Weighted Percent
Valid No 28 322 6.4 Yes 447 4731 93.6 Total 475 5053 100.0Missing System 3 41 Total 478 5094
QIXA-1. Figure 3. Proof of Income
Frequency Weighted Frequency
Weighted Percent
Valid No 123 1226 24.3 Yes 352 3827 75.7 Total 475 5053 100.0Missing System 3 41 Total 478 5094
QIXA-1. Figure 4. Minimum Credit Score
Frequency Weighted Frequency
Weighted Percent
Valid No 220 2529 50.0 Yes 255 2524 50.0 Total 475 5053 100.0Missing System 3 41Total 478 5094
QIXA-1. Figure 5 Deposit Relationship
Frequency Weighted Frequency
Weighted Percent
Valid No 305 3007 59.5 Yes 170 2046 40.5 Total 475 5053 100.0Missing System 3 41Total 478 5094

251 Credit Products FDICBankSurvey_Report_204pjg.doc
QIXA-1. Figure 6. Direct Deposit
Frequency Weighted Frequency
Weighted Percent
Valid No 460 4868 96.6 Yes 14 171 3.4 Total 474 5039 100.0Missing System 4 55 Total 478 5094
QIXA-1. Figure 7. Other
Frequency Weighted Frequency
Weighted Percent
Valid No 385 4205 83.7 Yes 88 821 16.3 Total 473 5026 100.0Missing System 5 68Total 478 5094
For closed-end personal loans of up to $5,000.00, other eligibility requirements reported by respondents include: sufficient debt-to-income ratio (22), source of income and ability to repay (19), and a previous relationship with the bank (10).
There are differences among regions for banks that require a deposit relationship and proof of income to obtain an unsecured personal loan. Smaller percentages of New England (21.0 percent), Mid-Atlantic (21.0 percent), and Pacific (26.6 percent) banks require a deposit relationship than banks in the West North Central (54.4 percent) and West South Central (54.6 percent) regions.
QIXA-1. Figure 8. Region
Deposit Relationship
New England
Mid- Atlantic
South Atlantic
East South
Central
West South
Central
East North
Central
West North
Central Mountain Pacific No Count 309 296 393 344 370 583 407 134 170 % 79.0% 79.0% 66.5% 63.4% 45.4% 62.8% 45.6% 47.2% 73.4%Yes Count 82 79 198 198 445 345 486 150 62 % 21.0% 21.0% 33.5% 36.6% 54.6% 37.2% 54.4% 52.8% 26.6%Total Count 391 374 591 543 815 929 894 285 232 % 100.0% 100.0% 100.0% 100.0% 100.0% 100.0% 100.0% 100.0% 100.0%
A smaller percentage of East South Central (62.6 percent) and West South Central (66.0 percent) banks require proof of income than Mid-Atlantic (89.6 percent), New England (98.8 percent), and Mountain (98.8 percent) banks.
QIXA-1. Figure 9. Region
Proof of Income
New England
Mid- Atlantic
South Atlantic
East South
Central
West South
Central
East North
Central
West North
Central Mountain Pacific No Count 5 39 79 203 277 280 280 3 59 % 1.2% 10.4% 13.3% 37.4% 34.0% 30.2% 31.4% 1.2% 25.6%Yes Count 386 336 513 340 537 648 613 281 172 % 98.8% 89.6% 86.7% 62.6% 66.0% 69.8% 68.6% 98.8% 74.4%Total Count 391 374 591 543 815 929 894 285 232 % 100.0% 100.0% 100.0% 100.0% 100.0% 100.0% 100.0% 100.0% 100.0%

252 Credit Products FDICBankSurvey_Report_204pjg.doc
There are differences between tiers for banks that require a deposit relationship, set a minimum credit score, and have other requirements to obtain an unsecured personal loan. Banks in Tier 1 (4.5 percent) are less likely to require a deposit relationship than banks in Tier 2 (22.8 percent) and Tier 3 (42.2 percent).
QIXA-1. Figure 10. Tier
Deposit Relationship
Tier 1 Tier 2 Tier 3 No Count 22 305 2680 % 95.5% 77.2% 57.8%Yes Count 1 90 1955 % 4.5% 22.8% 42.2%Total Count 23 395 4635 % 100.0% 100.0% 100.0%
Tier 1 (81.8 percent) banks have minimum credit score requirements more often than Tier 2 (63.2 percent) and Tier 3 (48.7 percent) banks.
QIXA-1. Figure 11. Tier
Minimum Credit Score
Tier 1 Tier 2 Tier 3 No Count 4 146 2379 % 18.2% 36.8% 51.3%Yes Count 19 250 2256 % 81.8% 63.2% 48.7%Total Count 23 395 4635 % 100.0% 100.0% 100.0%
QIXA-1. Figure 12. Tier
Other
Tier 1 Tier 2 Tier 3 No Count 17 291 3897 % 72.7% 73.7% 84.6%Yes Count 6 104 711 % 27.3% 26.3% 15.4%Total Count 23 395 4607 % 100.0% 100.0% 100.0%
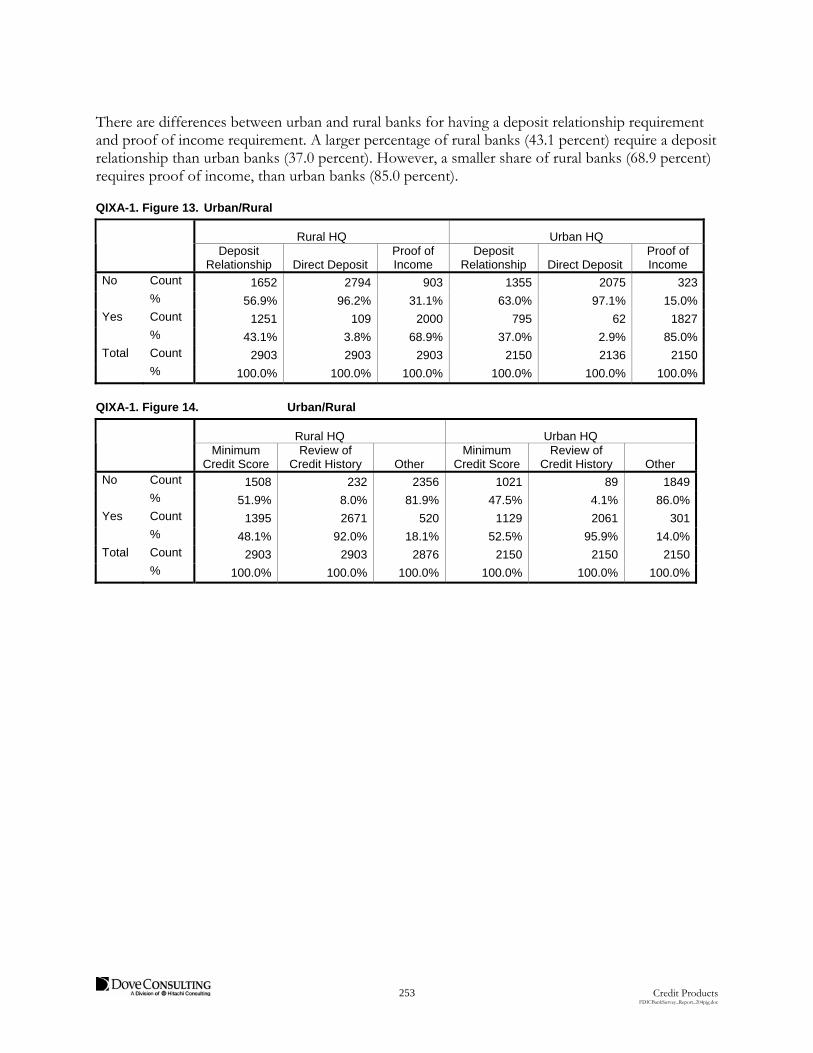
253 Credit Products FDICBankSurvey_Report_204pjg.doc
There are differences between urban and rural banks for having a deposit relationship requirement and proof of income requirement. A larger percentage of rural banks (43.1 percent) require a deposit relationship than urban banks (37.0 percent). However, a smaller share of rural banks (68.9 percent) requires proof of income, than urban banks (85.0 percent).
QIXA-1. Figure 13. Urban/Rural
Rural HQ Urban HQ
Deposit Relationship Direct Deposit
Proof of Income
Deposit Relationship Direct Deposit
Proof of Income
No Count 1652 2794 903 1355 2075 323 % 56.9% 96.2% 31.1% 63.0% 97.1% 15.0%Yes Count 1251 109 2000 795 62 1827 % 43.1% 3.8% 68.9% 37.0% 2.9% 85.0%Total Count 2903 2903 2903 2150 2136 2150 % 100.0% 100.0% 100.0% 100.0% 100.0% 100.0%
QIXA-1. Figure 14. Urban/Rural
Rural HQ Urban HQ
Minimum Credit Score
Review of Credit History Other
Minimum Credit Score
Review of Credit History Other
No Count 1508 232 2356 1021 89 1849 % 51.9% 8.0% 81.9% 47.5% 4.1% 86.0%Yes Count 1395 2671 520 1129 2061 301 % 48.1% 92.0% 18.1% 52.5% 95.9% 14.0%Total Count 2903 2903 2876 2150 2150 2150 % 100.0% 100.0% 100.0% 100.0% 100.0% 100.0%

254 Credit Products FDICBankSurvey_Report_204pjg.doc
Question IX A-2. If yes, please indicate the following:
Minimum Loan Size
Maximum Loan Size
Origination Fee
Acct. Maintenance
Fee Minimum
APR Maximum
APR Typical
APR
Maximum Term (Mos)
The average maximum size of close-end personal loans is $13,876. The median loan maximum size is $5,000, and the median loan minimum size is $1,000. Although the question asked for loans up to $5,000, some banks reported loans greater than $5,000. Most banks do not charge an account maintenance fee. The median maximum term is 36 months. With regard to annual percentage rate (APR), banks report their rates either as percentages or as “prime plus” a percentage.
QIXA-2. Figure 1. Statistics: Weighted
Weighted Minimum Loan Size
Maximum Loan Size
Account Maintenance Fee
Maximum Term (in months)
N Valid 4003 3094 2788 4272 Missing 1091 2000 2306 822Mean $1,043.75 $13,876.07 $1.83 34.90Median $1,000.00 $5,000.00 $.00 36.00Mode $1,000.00 $5,000.00 $.00 36Minimum $.00 $.00 $.00 0Maximum $10,000.00 $2,500,000.00 $100.00 120
There is a difference between tiers for minimum sizes and maximum term unsecured personal loans. The maximum term is longer for larger banks in Tier 1 (median of 60 months) than for banks in Tier 3 (median of 36 months). Larger banks also require a larger minimum loan size (median of $2,000) than Tier 3 banks (median of $1,000).
QIXA-2. Figure 2. Tier 1
Minimum Loan Size
Maximum Loan Size
Account Maintenance Fee
Maximum Term (in months)
N Valid 23 21 16 22 Missing 0 2 7 1Mean $1,943.18 $41,125.00 $.00 54.38Median $2,000.00 $25,000.00 $.00 60.00Mode $2,000.00 $25,000.00 $.00 60Minimum $250.00 $.00 $.00 26Maximum $5,000.00 $200,000.00 $.00 84

255 Credit Products FDICBankSurvey_Report_204pjg.doc
QIXA-2. Figure 3. Tier 2
Minimum Loan Size
Maximum Loan Size
Account Maintenance Fee
Maximum Term (in months)
N Valid 343 243 257 354 Missing 52 153 139 42Mean $1,555.56 $58,478.57 $1.63 40.75
Median $1,500.00 $10,000.00 $.00 36.00Mode $1,000.00 $5,000.00 $.00 36Minimum $.00 $.00 $.00 0Maximum $5,000.00 $2,500,000.00 $75.00 120
QIXA-2. Figure 4. Tier 3
Minimum Loan Size
Maximum Loan Size
Account Maintenance Fee
Maximum Term (in months)
N Valid 3637 2830 2516 3897 Missing 1039 1846 2160 779Mean $989.76 $9,849.51 $1.86 34.26Median $1,000.00 $5,000.00 $.00 36.00Mode $1,000.00 $5,000.00 $.00 36Minimum $.00 $.00 $.00 0Maximum $10,000.00 $250,000.00 $100.00 120
There are differences among regions for minimum loan sizes and maximum term limits of unsecured personal loans. The Mid-Atlantic region has a maximum term of 60 months, which is longer than the term for other regions. Minimum loan sizes in the West North Central, East South Central, Mountain, and Pacific regions have a median of $500 which is less than the other regions ($1,000 median).
QIXA-2. Figure 5. New England
Minimum Loan Size
Maximum Loan Size
Account Maintenance Fee
Maximum Term (in months)
N Valid 364 374 244 364 Missing 27 17 147 27Mean $1,012.68 $6,426.86 $.00 37.37Median $1,000.00 $5,000.00 $.00 36.00Mode $1,000.00 $5,000.00 $.00 36Minimum $.00 $.00 $.00 0Maximum $2,500.00 $25,000.00 $.00 60

256 Credit Products FDICBankSurvey_Report_204pjg.doc
QIXA-2. Figure 6. Mid-Atlantic
Minimum Loan Size
Maximum Loan Size
Account Maintenance Fee
Maximum Term (in months)
N Valid 326 319 265 370 Missing 48 55 110 5Mean $1,518.31 $21,374.65 $.00 49.33Median $1,000.00 $5,000.00 $.00 60.00Mode $1,000.00 $5,000.00 $.00 60Minimum $.00 $.00 $.00 24Maximum $5,000.00 $250,000.00 $.00 72
QIXA-2. Figure 7. South Atlantic
Minimum Loan Size
Maximum Loan Size
Account Maintenance Fee
Maximum Term (in months)
N Valid 516 303 321 523 Missing 75 288 270 68Mean $1,520.31 $11,942.42 $4.34 35.08Median $1,000.00 $5,000.00 $.00 36.00Mode $1,000.00 $5,000.00 $.00 36Minimum $.00 $.00 $.00 12Maximum $10,000.00 $50,000.00 $75.00 60
QIXA-2. Figure 8. East South Central
Minimum Loan Size
Maximum Loan Size
Account Maintenance Fee
Maximum Term (in months)
N Valid 420 283 300 433 Missing 137 274 257 123Mean $1,105.05 $13,203.09 $4.56 33.55Median $1,000.00 $5,000.00 $.00 36.00Mode $500.00 $5,000.00 $.00 36Minimum $.00 $.00 $.00 3Maximum $3,500.00 $100,000.00 $75.00 72
a Multiple modes exist. The smallest value is shown

257 Credit Products FDICBankSurvey_Report_204pjg.doc
QIXA-2. Figure 9. West South Central
Minimum
Loan Size Maximum Loan Size
Account Maintenance Fee
Maximum Term (in months)
N Valid 633 441 612 712 Missing 195 387 216 117Mean $889.23 $7,966.15 $2.68 29.98Median $500.00 $5,000.00 $.00 24.00Mode $1,000.00 $5,000.00 $.00 36Minimum $.00 $.00 $.00 3Maximum $5,000.00 $50,000.00 $100.00 60
QIXA-2. Figure 10. East North Central
Minimum Loan Size
Maximum Loan Size
Account Maintenance Fee
Maximum Term (in months)
N Valid 659 606 448 751 Missing 270 323 481 178Mean $956.88 $24,497.29 $.35 40.33Median $1,000.00 $5,000.00 $.00 36.00Mode $1,000.00 $5,000.00 $.00 60Minimum $.00 $.00 $.00 0Maximum $5,000.00 $2,500,000.00 $32.00 120
QIXA-2. Figure 11. West North Central
Minimum Loan Size
Maximum Loan Size
Account Maintenance Fee
Maximum Term (in months)
N Valid 658 452 388 702 Missing 236 441 506 191Mean $678.49 $6,109.14 $.35 26.75Median $500.00 $5,000.00 $.00 24.00Mode $1,000.00 $5,000.00 $.00 12Minimum $.00 $.00 $.00 12Maximum $3,500.00 $100,000.00 $10.00 60
QIXA-2. Figure 12. Mountain
Minimum Loan Size
Maximum Loan Size
Account Maintenance Fee
Maximum Term (in months)
N Valid 244 158 92 244 Missing 41 127 192 41Mean $1,003.88 $21,142.55 $.00 27.36Median $500.00 $5,000.00 $.00 24.00Mode $500.00 $5,000.00 $.00 36Minimum $.00 $.00 $.00 0Maximum $3,000.00 $100,000.00 $.00 60

258 Credit Products FDICBankSurvey_Report_204pjg.doc
QIXA-2. Figure 13. Pacific
Minimum Loan Size
Maximum Loan Size
Account Maintenance Fee
Maximum Term (in months)
N Valid 184 156 118 174 Missing 62 89 128 72Mean $987.94 $11,950.76 $3.48 42.04Median $500.00 $10,000.00 $.00 36.00Mode $500.00 $.00 $.00 36Minimum $.00 $.00 $.00 15Maximum $3,000.00 $100,000.00 $30.00 60
There are differences between rural and urban banks for minimum loan size and maximum term of unsecured closed-end personal loans. The median minimum loan size for rural banks is $500, compared with $1,000 for urban banks. The median maximum term for urban and rural banks is 36 months and 24 months, respectively.
QIXA-2. Figure 14. Urban
Minimum Loan Size
Maximum Loan Size
Account Maintenance Fee
Maximum Term (in months)
N Valid 1821 1377 1355 1889 Missing 370 814 836 302Mean $1,274.45 $19,756.36 $.91 39.66Median $1,000.00 $5,000.00 $.00 36.00Mode $1,000.00 $5,000.00 $.00 36Minimum $.00 $.00 $.00 0Maximum $10,000.00 $2,500,000.00 $75.00 120Sum $2,321,307.90 $27,207,833.33 $1,238.21 74900
QIXA-2. Figure 15. Rural
Minimum Loan Size
Maximum Loan Size
Account Maintenance Fee
Maximum Term (in months)
N Valid 2182 1717 1433 2383 Missing 721 1186 1470 520Mean $851.13 $9,158.34 $2.70 31.13Median $500.00 $5,000.00 $.00 24.00Mode $500.00 $5,000.00 $.00 36Minimum $.00 $.00 $.00 0Maximum $5,000.00 $100,000.00 $100.00 72Sum $1,856,819.07 $15,720,613.20 $3,869.18 74196

259 Credit Products FDICBankSurvey_Report_204pjg.doc
Question IX A-3. How long does it typically take to originate an unsecured closed-end personal loan?
Less than 30 minutes Less than 24 hours
Less than 48 hours More than 48 hours
Nearly all (97.2 percent) banks report that they can originate an unsecured personal loan in less than 48 hours, and 80.3 percent of banks are able to originate an unsecured loan in less than 24 hours.
QIXA-3. Figure 1. How long does it take to originate an unsecured loan?
Frequency Weighted Frequency
Weighted Percent
Valid Less than 30 minutes 102 1219 24.4 Less than 24 hours 260 2793 55.9 Less than 48 hours 90 849 17.0 More than 48 hours 19 138 2.8 Total 471 4998 100.0Missing System 7 96 Total 478 5094
There are differences among regions for the time needed to originate an unsecured loan. A larger share of banks in the West North Central (36 percent) and West South Central (36.5 percent) regions are able to originate an unsecured loan in less than 30 minutes compared with New England (0 percent in less than 30 minutes) and Pacific (1.5 percent in less than 30 minutes) region banks.
QIXA-3. Figure 2. Region
How long does it take to originate an unsecured loan?
New England
Mid- Atlantic
South Atlantic
East South
Central
West South
Central
East North
Central
West North
Central Mountain Pacific Less than 30 minutes
Count 55 145 154 298 212 312 41 3
% 14.6% 25.0% 28.4% 36.5% 23.1% 36.0% 14.4% 1.5%Less than 24 hours
Count 250 105 276 343 449 563 510 185 113
% 63.8% 28.1% 47.7% 63.3% 55.1% 61.6% 58.8% 64.8% 48.8%Less than 48 hours
Count 138 156 157 46 51 137 44 55 64
% 35.3% 41.8% 27.2% 8.4% 6.3% 15.0% 5.1% 19.2% 27.6%More than 48 hours
Count 3 58 17 3 5 51
% .9% 15.5% 2.1% .3% 1.6% 22.2%Total Count 391 374 578 543 815 915 866 285 232 % 100.0% 100.0% 100.0% 100.0% 100.0% 100.0% 100.0% 100.0% 100.0%

260 Credit Products FDICBankSurvey_Report_204pjg.doc
There is a difference between tiers for the time it takes to originate an unsecured loan; it takes less time for banks in Tier 3 to originate a loan than banks in Tiers 1 and 2.
QIXA-3. Figure 3. Tier
How long does it take to originate an unsecured loan?
Tier 1 Tier 2 Tier 3 Less than 30 minutes
Count 5 38 1176
% 22.7% 9.6% 25.7% Less than 24 hours
Count 7 229 2557
% 31.8% 57.9% 55.8% Less than 48 hours
Count 6 104 738
% 27.3% 26.3% 16.1% More than 48 hours
Count 4 24 109
% 18.2% 6.1% 2.4% Total Count 23 395 4580 % 100.0% 100.0% 100.0%
There is a difference between urban and rural banks for the amount of time needed to originate an unsecured closed-end personal loan. A larger percentage of urban banks take more time than rural banks.
QIXA-3. Figure 4. Urban/Rural
How long does it take to originate an unsecured loan?
Rural HQ Urban HQ
Less than 30 minutes
Count 964 255
% 34.0% 11.8%Less than 24 hours
Count 1614 1179
% 56.9% 54.5%Less than 48 hours
Count 243 606
% 8.6% 28.0%More than 48 hours
Count 14 124
% .5% 5.7%Total Count 2835 2164 % 100.0% 100.0%

261 Credit Products FDICBankSurvey_Report_204pjg.doc
S m a l l e r D o l l a r L o a n s
Question IX B. Does the bank offer affordable small dollar loans (i.e., less than $1,000/at least a 90-day repayment term/less than 36 percent APR/no or low fees)? Yes No
Fewer than half (43.5 percent) of banks offer small-size unsecured personal loans. These banks identify loans including overdraft lines of credit in their descriptions of small dollar loan products, which was not the original intention of the question. Consequently, the percentages of banks that offer affordable small dollar loans that meet the FDIC program guidelines will be lower than the estimated percentages of the survey results.7
QIXB. Figure 1. Does the bank offer small dollar loans?
Frequency Weighted Frequency
Weighted Percent
Valid No 396 4011 56.5 Yes 260 3094 43.5 Total 656 7105 100.0Missing System 29 335 Total 685 7440
There is a difference among regions for banks that offer small dollar loans. A greater percentage of West South Central (56.8 percent) and West North Central (56.3 percent) banks offer small dollar loans than other regions, specifically New England (21.5 percent) and Mid-Atlantic (21.8 percent) banks.
QIXB. Figure 2. Region
Does the bank offer small dollar loans?
New England
Mid- Atlantic
South Atlantic
East South
Central
West South
Central
East North
Central
West North
Central Mountain Pacific No Count 350 444 517 354 473 674 585 304 310 % 78.5% 78.2% 63.5% 54.1% 43.2% 53.2% 43.7% 62.1% 71.9%Yes Count 96 123 298 301 622 594 753 186 121 % 21.5% 21.8% 36.5% 45.9% 56.8% 46.8% 56.3% 37.9% 28.1%Total Count 446 567 815 655 1095 1268 1338 490 431 % 100.0% 100.0% 100.0% 100.0% 100.0% 100.0% 100.0% 100.0% 100.0%
7 Key features of the FDIC Small Dollar Loan Pilot Program may include: loan amounts up to $1,000, amortization periods longer than a single pay cycle and up to 36 months for closed-end credit or minimum payments that reduce principle (that do not result in negative amortization) for open-end credit, no prepayment penalties, origination and/or maintenance fees limited to the amount necessary to cover actual costs, and an automatic savings component. (See: http://www.fdic.gov/smalldollarloans/index.html.)

262 Credit Products FDICBankSurvey_Report_204pjg.doc
There is a difference between tiers for banks that offer small dollar loans. Banks in Tier 3 (45.1 percent) are more likely to offer small dollar loans than banks in Tiers 1 (20.8 percent) and 2 (25.5 percent).
QIXB. Figure 3. Tier
Does the bank offer small dollar loans?
Tier 1 Tier 2 Tier 3 No Count 20 395 3596 % 79.2% 74.5% 54.9%Yes Count 5 135 2953 % 20.8% 25.5% 45.1%Total Count 25 531 6549 % 100.0% 100.0% 100.0%
There is a difference between urban and rural banks for banks that offer small dollar loans. More than half of rural banks (58.6 percent) offer small dollar loans, compared with 26.2 percent of urban banks.
QIXB. Figure 4. Urban/Rural
Does the bank offer small dollar loans?
Rural HQ Urban HQ No Count 1573 2438 % 41.4% 73.8%Yes Count 2229 865 % 58.6% 26.2%Total Count 3802 3302 % 100.0% 100.0%
Question IX B-1. Please describe any innovative products the bank has developed to provide small dollar loans to customers (for example, applying for a six-month loan at an ATM).
Of the surveyed banks, 260 reported that they offer small dollar loans. Of these banks, 80 described their products. Only some of the products described were new and innovative. Also, the descriptions often included overdraft programs with a line of credit. Among the programs and products that banks described:
Three banks identified an innovative new product that included the ability to apply for a personal loan online.
Forty-four banks reported offering loans of under $1,000. The five most commonly mentioned situations in which banks offer these small dollar loans include: Holiday/Christmas loans, loans for college students, early tax refund loans, credit development loans, and loans to military personnel.
Thirty banks reported offering some form of credit line as a smaller dollar loan, including 19 banks that reported overdraft lines of credit.

263 Credit Products FDICBankSurvey_Report_204pjg.doc
Two banks described credit development loans. For example, a savings or CD secured loan could help customers establish or re-establish credit history. The customer borrows money and the proceeds are deposited to a savings or CD account.
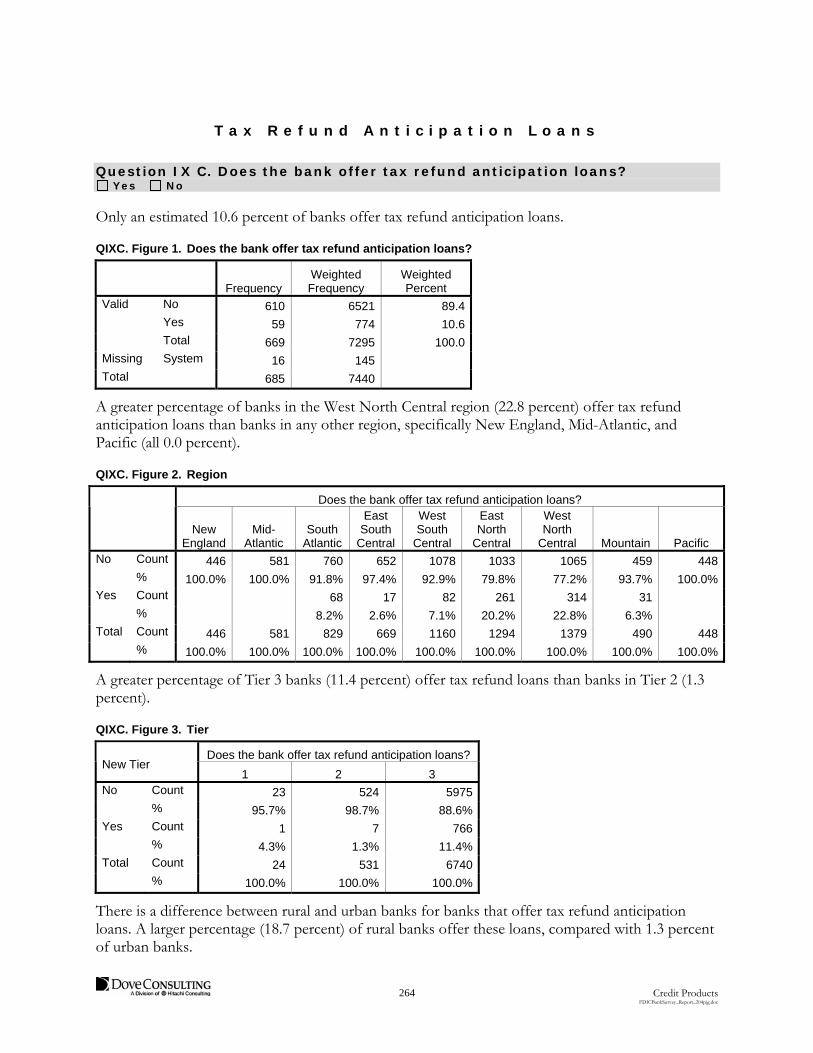
264 Credit Products FDICBankSurvey_Report_204pjg.doc
T a x R e f u n d A n t i c i p a t i o n L o a n s
Question IX C. Does the bank offer tax refund anticipation loans? Yes No
Only an estimated 10.6 percent of banks offer tax refund anticipation loans.
QIXC. Figure 1. Does the bank offer tax refund anticipation loans?
Frequency Weighted Frequency
Weighted Percent
Valid No 610 6521 89.4 Yes 59 774 10.6 Total 669 7295 100.0Missing System 16 145 Total 685 7440
A greater percentage of banks in the West North Central region (22.8 percent) offer tax refund anticipation loans than banks in any other region, specifically New England, Mid-Atlantic, and Pacific (all 0.0 percent).
QIXC. Figure 2. Region
Does the bank offer tax refund anticipation loans?
New England
Mid- Atlantic
South Atlantic
East South
Central
West South
Central
East North
Central
West North
Central Mountain Pacific No Count 446 581 760 652 1078 1033 1065 459 448 % 100.0% 100.0% 91.8% 97.4% 92.9% 79.8% 77.2% 93.7% 100.0%Yes Count 68 17 82 261 314 31 % 8.2% 2.6% 7.1% 20.2% 22.8% 6.3% Total Count 446 581 829 669 1160 1294 1379 490 448 % 100.0% 100.0% 100.0% 100.0% 100.0% 100.0% 100.0% 100.0% 100.0%
A greater percentage of Tier 3 banks (11.4 percent) offer tax refund loans than banks in Tier 2 (1.3 percent).
QIXC. Figure 3. Tier
Does the bank offer tax refund anticipation loans? New Tier
1 2 3 No Count 23 524 5975 % 95.7% 98.7% 88.6%Yes Count 1 7 766 % 4.3% 1.3% 11.4%Total Count 24 531 6740 % 100.0% 100.0% 100.0%
There is a difference between rural and urban banks for banks that offer tax refund anticipation loans. A larger percentage (18.7 percent) of rural banks offer these loans, compared with 1.3 percent of urban banks.

265 Credit Products FDICBankSurvey_Report_204pjg.doc
QIXC. Figure 4. Urban/Rural
Does the bank offer tax refund anticipation loans?
Rural HQ Urban HQ
No Count 3170 3352 % 81.3% 98.7%Yes Count 728 46 % 18.7% 1.3%Total Count 3898 3397 % 100.0% 100.0%
Question IX C-1. If yes, please indicate the following:
Minimum Loan Size
Maximum Loan Size
Origination Fee
Acct. Maintenance
Fee Minimum
APR Maximum
APR Typical
APR
Maximum Term (Mos)
Based on the survey results, the fees for tax refund loans vary from $0 to $129 and can be outstanding from one to 60 months.
QIXC-1. Figure 1. Statistics
Weighted Minimum
Size Maximum
Size Origination fee
Account Maintenance
Fee Maximum Term
(in months) N Valid 456 346 524 360 605 Missing 318 427 250 414 169Mean $414.93 $7,552.30 $29.73 $3.13 8.09Median $250.00 $5,000.00 $25.00 $.00 6.00Mode $500.00 $5,000.00 $.00 $.00 6Minimum $.00 $1,000.00 $.00 $.00 1Maximum $2,500.00 $50,000.00 $129.00 $50.00 60
Because only 59 banks in the sample reported offering tax refund loans, it is difficult to draw meaningful inferences to the bank population. However, the sample data suggest that there may be substantial differences among regions and tiers, and between urban and rural locations, for loan fees and restrictions.

266 Credit Products FDICBankSurvey_Report_204pjg.doc
C o n s u m e r C r e d i t C a r d s
Question IX D. Does the bank offer consumer credit cards (e.g., Visa, MasterCard)?
Yes No
Over a third (35.7 percent) of banks offer consumer credit cards, either issued by the bank or by a third party.
QIXD. Figure 1. Does the bank offer consumer credit cards?
Frequency Weighted Frequency
Weighted Percent
Valid No 405 4673 64.3 Yes 262 2597 35.7 Total 667 7270 100.0Missing System 18 170 Total 685 7440
A smaller percentage of New England banks (13.3 percent) offer consumer credit cards than banks in the East North Central region (45.8 percent) and the Pacific region (52.2 percent).
QIXD. Figure 2. Region
Does the bank offer consumer credit cards?
New England
Mid- Atlantic
South Atlantic
East South
Central
West South
Central
East North
Central
West North
Central Mountain Pacific No Count 386 409 574 412 811 701 879 280 220 % 86.7% 72.1% 68.2% 62.8% 70.7% 54.2% 63.6% 59.0% 47.8%Yes Count 59 158 268 244 335 593 504 195 241 % 13.3% 27.9% 31.8% 37.2% 29.3% 45.8% 36.4% 41.0% 52.2%Total Count 446 567 842 655 1146 1294 1383 475 461 % 100.0% 100.0% 100.0% 100.0% 100.0% 100.0% 100.0% 100.0% 100.0%

267 Credit Products FDICBankSurvey_Report_204pjg.doc
A greater percentage of banks in Tier 1 (86.4 percent) offer consumer credit cards than smaller banks in Tier 2 (47.4 percent) and Tier 3 (34.6 percent).
QIXD. Figure 3. Tier
Does the bank offer consumer credit cards?
Tier 1 Tier 2 Tier 3 No Count 3 281 4389 % 13.6% 52.6% 65.4%Yes Count 20 253 2324 % 86.4% 47.4% 34.6%Total Count 23 534 6713 % 100.0% 100.0% 100.0%
There is a difference between urban and rural banks that offer consumer credit cards. About a third (33.9 percent) of rural banks offer credit cards, compared with 37.8 percent of urban banks.
QIXD. Figure 4. Urban/Rural
Does the bank offer consumer credit cards?
Rural HQ Urban HQ
No Count 2557 2115 % 66.1% 62.2%Yes Count 1313 1284 % 33.9% 37.8%Total Count 3870 3400 % 100.0% 100.0%

268 Credit Products FDICBankSurvey_Report_204pjg.doc
Question IX D-1. If yes, what is required for someone to qualify for a traditional credit card? (Check all that apply)
Social Security number Minimum credit score
Review of credit history Proof of income Other
The majority of banks require a Social Security number, credit history review and/or minimum credit scores in order for individuals to qualify for a traditional credit card.
QIXD-1. Figure 1. Summary of Bank Requirements for Credit Cards
Eligibility Requirements Percent of Banks Requiring
Social Security Number 77.5%
Review of Credit History 77.4%
Minimum Credit Score 52.1%
Proof of Income 48.1%
Other 29.6%
QIXD-1. Figure 2. Social Security Number
Frequency Weighted Frequency
Weighted Percent
Valid No 55 576 22.5 Yes 202 1983 77.5 Total 257 2559 100.0Missing System 5 38 Total 262 2597
QIXD-1. Figure 3. Minimum Credit Score
Frequency Weighted Frequency
Weighted Percent
Valid No 114 1220 47.9 Yes 143 1329 52.1 Total 257 2549 100.0Missing System 5 48 Total 262 2597
QIXD-1. Figure 4. Review of Credit History
Frequency Weighted Frequency
Weighted Percent
Valid No 55 576 22.6 Yes 202 1973 77.4 Total 257 2549 100.0Missing System 5 48 Total 262 2597
QIXD-1. Figure 5. Proof of Income
Frequency Weighted Frequency
Weighted Percent
Valid No 134 1323 51.9 Yes 123 1226 48.1 Total 257 2549 100.0Missing System 5 48Total 262 2597
QIXD-1. Figure 6. Other
Frequency Weighted Frequency
Weighted Percent
Valid No 183 1777 70.4 Yes 72 745 29.6 Total 255 2522 100.0Missing System 7 75Total 262 2597

269 Credit Products FDICBankSurvey_Report_204pjg.doc
The most frequently mentioned categories under “other” are: credit card offered through a third party (46), source of income and ability to repay (8), debt-to-income ratio (5), and proof of residency (5).
There are few differences among regions or tiers for eligibility requirements to qualify for a consumer credit card.
There are few differences between urban and rural banks for requirements to qualify for a consumer credit card.
Question IX D-2. If yes, for your “basic” credit card, please indicate the following:
Initiation Fee
Annual Fee
Acct. Maintenance
Fee
Late Payment
Fee Over the Limit Fee
Typical Credit Limit
Min. APR
Max. APR
Typical APR
Maximum Term
(Months)
For banks that offer credit cards, both the median and mode for initiation fees, annual fee, and account maintenance fees are $0.00. Late payment and over-the-limit fees are much more common, with a mean of $22.17 for late payment and $25.37 for over-the-limit (OTL) fees.
QIXD-2. Figure 1. Statistics
Weighted Initiation Fee Annual Fee
Account Maintenance
Fee Late Payment
fee Over-the- limit Fee
Valid 1120 1305 1096 1617 1582N
Missing 1477 1293 1501 980 1016Mean $.37 $8.42 $.04 $21.54 $23.45Median $.00 $.00 $.00 $20.00 $25.00Mode $.00 $.00 $.00 $25.00 $25.00Minimum $.00 $.00 $.00 $.00 $.00Maximum $30.00 $55.00 $6.00 $39.00 $50.00

270 Credit Products FDICBankSurvey_Report_204pjg.doc
There is a difference between tiers for OTL fees on credit cards. Larger banks have higher OTL fees, with Tier 1 banks charging an average of $34.44, compared with $27.43 in Tier 2 and $22.74 in Tier 3.
QIXD-2. Figure 2. Tier 1
Initiation Fee Annual Fee
Account Maintenance
Fee Late Payment
Fee Over-the-limit Fee
N Valid 14 14 14 15 17 Missing 6 6 6 5 3Mean $.00 $1.15 $.00 $22.64 $34.44Median $.00 $.00 $.00 $24.00 $37.00Mode $.00 $.00 $.00 $19.00(a) $39.00Minimum $.00 $.00 $.00 $.00 $15.00Maximum $.00 $15.00 $.00 $39.00 $39.00
Multiple modes exist. The smallest value is shown.
QIXD-2. Figure 3. Tier 2
Initiation Fee Annual Fee
Account Maintenance
Fee Late Payment
Fee Over-the- limit Fee
N Valid 163 170 166 194 198 Missing 90 83 87 59 55Mean $.00 $6.57 $.15 $23.81 $27.43Median $.00 $.00 $.00 $23.50 $29.00Mode $.00 $.00 $.00 $15.00 $39.00Minimum $.00 $.00 $.00 $.00 $.00Maximum $.00 $45.00 $6.00 $39.00 $39.00
QIXD-2. Figure 4. Tier 3
Initiation Fee Annual Fee
Account Maintenance
Fee Late Payment
Fee Over-the- limit Fee
N Valid 943 1121 916 1408 1367 Missing 1381 1203 1408 916 957Mean $.43 $8.79 $.03 $21.22 $22.74Median $.00 $.00 $.00 $20.00 $25.00Mode $.00 $.00 $.00 $25.00 $25.00Minimum $.00 $.00 $.00 $.00 $.00Maximum $30.00 $55.00 $1.75 $39.00 $50.00

271 Credit Products FDICBankSurvey_Report_204pjg.doc
There is a difference among regions for OTL fees on credit cards. The East North Central ($27.09) and Mountain ($27.04) regions have higher OTL fees than the West South Central ($18.25), West North Central ($20.58), and New England ($20.92) regions.
QIXD-2. Figure 5. New England
Initiation Fee Annual Fee
Account Maintenance
Fee Late Payment
Fee Over-the- limit Fee
N Valid 18 32 18 32 32 Missing 41 27 41 27 27Mean $.00 $23.36 $.00 $14.48 $20.92Median $.00 $25.00 $.00 $10.00 $15.00Mode $.00 $18.00(a) $.00 $29.00 $29.00Minimum $.00 $.00 $.00 $.00 $10.00Maximum $.00 $45.00 $.00 $29.00 $29.00
a Multiple modes exist. The smallest value is shown.
QIXD-2. Figure 6. Mid-Atlantic
Initiation Fee Annual Fee
Account Maintenance
Fee Late Payment
Fee Over-the- limit Fee
N Valid 82 85 82 111 112 Missing 76 73 76 48 47Mean $.00 $14.85 $.00 $20.78 $21.57Median $.00 $20.00 $.00 $20.00 $20.00Mode $.00 $.00 $.00 $35.00 $35.00Minimum $.00 $.00 $.00 $.00 $.00Maximum $.00 $35.00 $.00 $35.00 $39.00
QIXD-2. Figure 7. South Atlantic
Initiation Fee Annual Fee
Account Maintenance
Fee Late Payment
Fee Over-the-limit Fee
N Valid 109 137 109 143 116 Missing 159 131 159 125 152Mean $.00 $6.71 $.00 $19.44 $24.69Median $.00 $.00 $.00 $19.00 $29.00Mode $.00 $.00 $.00 $19.00 $29.00Minimum $.00 $.00 $.00 $.01 $.00Maximum $.00 $34.00 $.00 $39.00 $39.00

272 Credit Products FDICBankSurvey_Report_204pjg.doc
QIXD-2. Figure 8. East South Central
Initiation Fee Annual Fee
Account Maintenance
Fee Late Payment
Fee Over-the- limit Fee
N Valid 113 116 113 172 158 Missing 131 128 131 72 86Mean $.00 $1.77 $.00 $24.81 $25.59Median $.00 $.00 $.00 $25.00 $29.00Mode $.00 $.00 $.00 $19.00 $29.00Minimum $.00 $.00 $.00 $10.00 $10.00Maximum $.00 $12.00 $.00 $39.00 $35.00
a Multiple modes exist. The smallest value is shown.
QIXD-2. Figure 9. West South Central
Initiation Fee Annual Fee
Account Maintenance
Fee Late Payment
Fee Over-the-limit Fee
N Valid 178 202 164 202 229 Missing 157 133 171 133 106Mean $.00 $7.41 $.00 $19.14 $18.25Median $.00 $.20 $.00 $15.00 $15.00Mode $.00 $.00 $.00 $15.00 $10.00Minimum $.00 $.00 $.00 $.00 $.00Maximum $.00 $25.00 $.00 $39.00 $39.00
QIXD-2. Figure 10. East North Central
Initiation Fee Annual Fee
Account Maintenance
Fee Late Payment
Fee Over-the-limit Fee
N Valid 244 299 271 391 394 Missing 349 294 321 202 198Mean $.00 $6.57 $.00 $23.19 $27.09Median $.00 $.00 $.00 $19.00 $29.00Mode $.00 $.00 $.00 $15.00 $39.00Minimum $.00 $.00 $.00 $.00 $5.00Maximum $.00 $55.00 $.00 $39.00 $39.00

273 Credit Products FDICBankSurvey_Report_204pjg.doc
QIXD-2. Figure 11. West North Central
Initiation Fee Annual Fee
Account Maintenance
Fee Late Payment
Fee Over-the-limit Fee
N Valid 189 206 148 329 292 Missing 315 298 356 174 212Mean $.00 $7.48 $.00 $19.49 $20.58Median $.00 $.00 $.00 $20.00 $20.00Mode $.00 $.00 $.00 $10.00 $10.00Minimum $.00 $.00 $.00 $1.00 $.00Maximum $.00 $55.00 $.00 $39.00 $50.00
QIXD-2. Figure 12. Mountain
Initiation Fee Annual Fee
Account Maintenance
Fee Late Payment
Fee Over-the-limit Fee
N Valid 69 82 82 110 110 Missing 127 113 113 86 86Mean $.00 $7.48 $.04 $27.96 $27.04Median $.00 $.00 $.00 $29.00 $29.00Mode $.00 $.00 $.00 $25.00 $25.00Minimum $.00 $.00 $.00 $10.00 $.00Maximum $.00 $35.00 $1.00 $39.00 $39.00
a Multiple modes exist. The smallest value is shown.
QIXD-2. Figure 13. Pacific
Initiation fee Annual Fee
Account maintenance
fee Late payment
fee Over the limit fee
N Valid 118 145 108 128 138 Missing 123 96 133 113 103Mean $3.48 $15.39 $.42 $20.49 $23.51Median $.00 $15.00 $.00 $19.00 $25.00Mode $.00 $.00 $.00 $10.00 $25.00Minimum $.00 $.00 $.00 $7.00 $10.00Maximum $30.00 $50.00 $6.00 $39.00 $39.00
There is no difference between urban and rural banks for over-the-limit fees on credit cards.

274 Credit Products FDICBankSurvey_Report_204pjg.doc
Question IX D-3. Does having a deposit account with the bank improve a customer’s ability to receive a credit card?
Yes No
Forty-two percent (42.0 percent) of banks that offer credit cards improve a customer’s ability to receive a credit card if they have a deposit account with the bank.
QIXD-3. Figure 1. Does having a deposit account improve a customer's ability to receive a credit card?
Frequency Weighted Frequency
Weighted Percent
Valid No 138 1388 58.0 Yes 102 1003 42.0 Total 240 2391 100.0Missing System 22 207 Total 262 2597
There is no difference among regions or tiers for a customer’s ability to receive a credit card.
There is no difference between urban and rural banks for a customer’s ability to receive a credit card.
Question IX D-3a. If yes, how?
Ninety banks explained how having a deposit account improves a customer’s ability to receive a credit card.
The comments indicate that it is beneficial for customers who are looking to open a credit card account to have a deposit account with the bank. Respondents reported that having a deposit account improves a customer’s ability to obtain credit because it shows that the customer already has a banking relationship and allows the bank to review account history. Through this account history, banks can determine the customer’s “stability” and assess their ability to repay. Some sample banks reported that they do not offer unsecured loans because their policies require a banking relationship in order to receive a credit card. Therefore, non-customers will not be approved for credit cards at these banks.
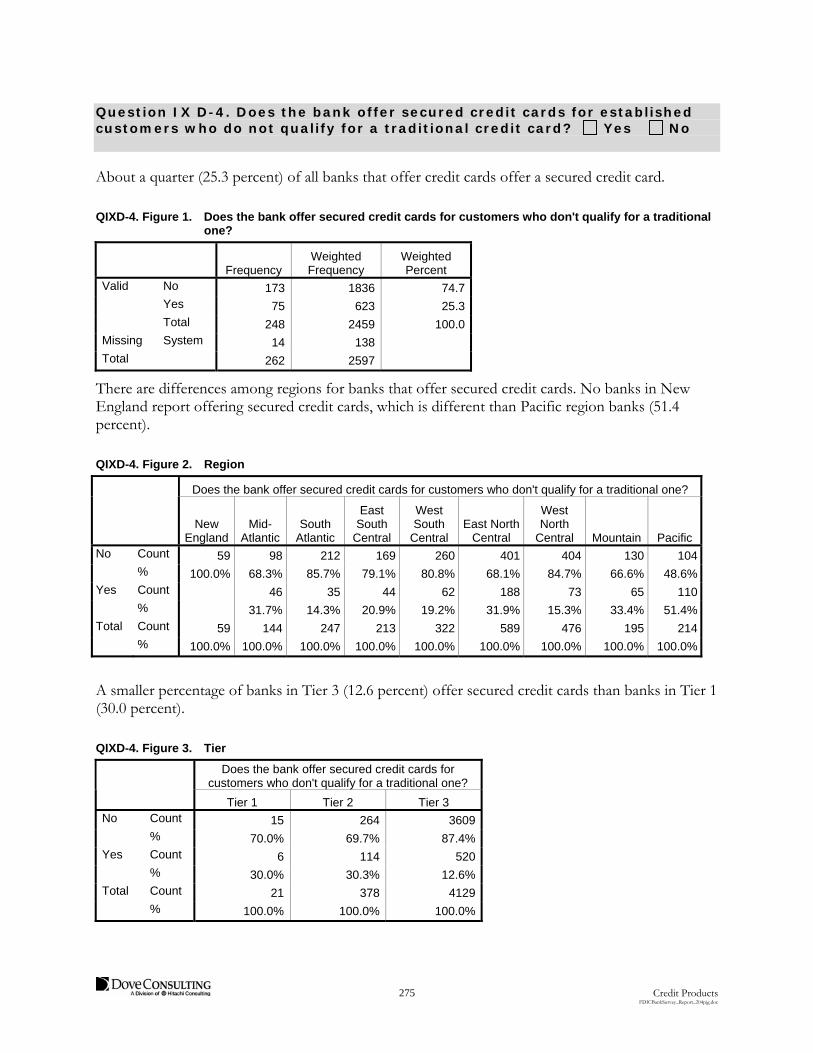
275 Credit Products FDICBankSurvey_Report_204pjg.doc
Question IX D-4. Does the bank offer secured credit cards for established customers who do not qualify for a traditional credit card? Yes No
About a quarter (25.3 percent) of all banks that offer credit cards offer a secured credit card.
QIXD-4. Figure 1. Does the bank offer secured credit cards for customers who don't qualify for a traditional one?
Frequency Weighted Frequency
Weighted Percent
Valid No 173 1836 74.7 Yes 75 623 25.3 Total 248 2459 100.0Missing System 14 138 Total 262 2597
There are differences among regions for banks that offer secured credit cards. No banks in New England report offering secured credit cards, which is different than Pacific region banks (51.4 percent).
QIXD-4. Figure 2. Region
Does the bank offer secured credit cards for customers who don't qualify for a traditional one?
New England
Mid- Atlantic
South Atlantic
East South
Central
West South
Central East North
Central
West North
Central Mountain Pacific No Count 59 98 212 169 260 401 404 130 104 % 100.0% 68.3% 85.7% 79.1% 80.8% 68.1% 84.7% 66.6% 48.6%Yes Count 46 35 44 62 188 73 65 110 % 31.7% 14.3% 20.9% 19.2% 31.9% 15.3% 33.4% 51.4%Total Count 59 144 247 213 322 589 476 195 214 % 100.0% 100.0% 100.0% 100.0% 100.0% 100.0% 100.0% 100.0% 100.0%
A smaller percentage of banks in Tier 3 (12.6 percent) offer secured credit cards than banks in Tier 1 (30.0 percent).
QIXD-4. Figure 3. Tier
Does the bank offer secured credit cards for customers who don't qualify for a traditional one?
Tier 1 Tier 2 Tier 3
No Count 15 264 3609 % 70.0% 69.7% 87.4%Yes Count 6 114 520 % 30.0% 30.3% 12.6%Total Count 21 378 4129 % 100.0% 100.0% 100.0%

276 Credit Products FDICBankSurvey_Report_204pjg.doc
There is a difference between urban and rural banks for banks that offer secured credit cards. A lower percentage (12.5 percent) of rural banks offer secured cards, compared with16.0 percent of urban banks.
QIXD-4. Figure 4. Urban/Rural
Does the bank offer secured credit cards for customers who don't qualify for a
traditional one?
Rural HQ Urban HQ No Count 2110 1778 % 87.5% 84.0%Yes Count 301 339 % 12.5% 16.0%Total Count 2411 2117 % 100.0% 100.0%
Question IX D-4a. If yes, please indicate the following:
Minimum Credit Score
Initiation Fee
Annual Fee
Acct. Maintenance
Fee
Late Paymen
t Fee Over the Limit Fee
Typical Credit Limit
Min. APR
Max. APR
Typical APR
Most banks that offer secured credit cards charge annual fees and over-the-limit fees. The median annual fee is $20, and the median over-the-limit fee is $29.
QIXD-4a. Figure 1. Statistics
Weighted Minimum
Credit Score Initiation Fee Annual fee
Account Maintenance
Fee Over-the- limit Fee
Valid 144 286 367 249 377N
Missing 479 338 257 374 246Mean 263.90 $14.73 $20.14 $1.11 $25.45Median .00 $.00 $20.00 $.00 $29.00Mode 0 $.00 $.00 $.00 $39.00Minimum 0 $.00 $.00 $.00 $.00Maximum 700 $300.00 $65.00 $17.00 $39.99
There are minimal differences among regions or tiers for secured credit card fees and requirements.
There are no differences between urban and rural banks for secured credit card fees and requirements.
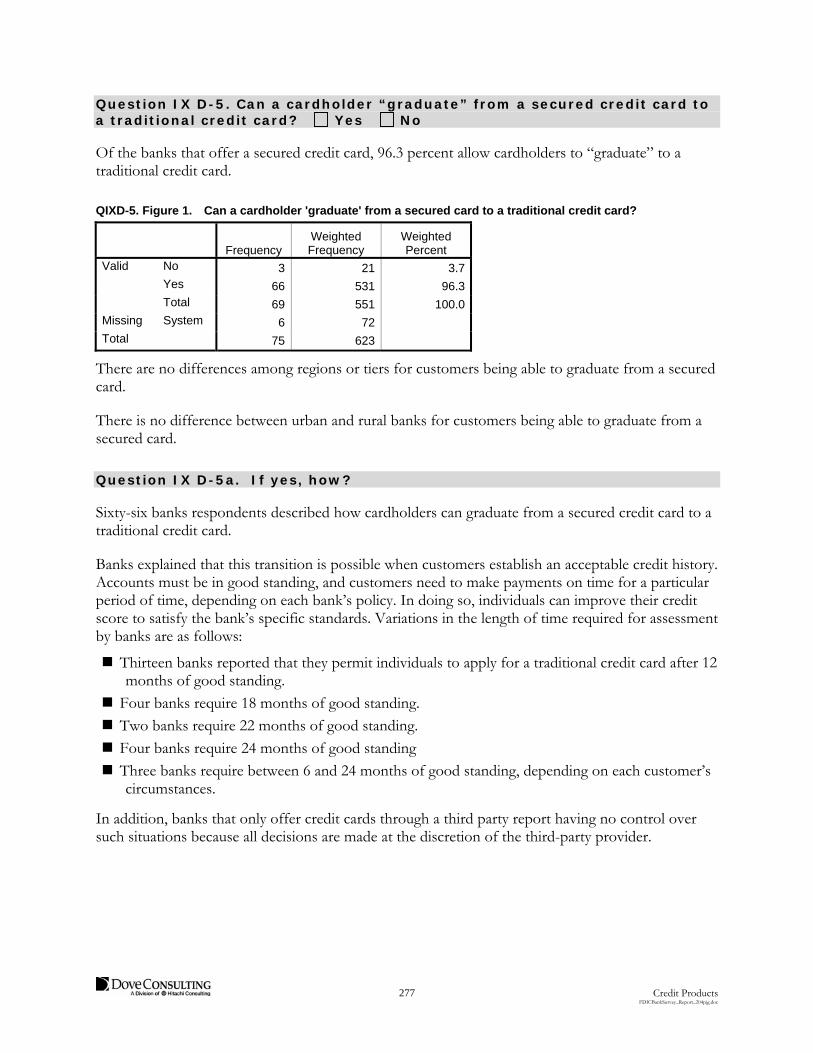
277 Credit Products FDICBankSurvey_Report_204pjg.doc
Question IX D-5. Can a cardholder “graduate” from a secured credit card to a traditional credit card? Yes No
Of the banks that offer a secured credit card, 96.3 percent allow cardholders to “graduate” to a traditional credit card.
QIXD-5. Figure 1. Can a cardholder 'graduate' from a secured card to a traditional credit card?
Frequency Weighted Frequency
Weighted Percent
Valid No 3 21 3.7 Yes 66 531 96.3 Total 69 551 100.0Missing System 6 72 Total 75 623
There are no differences among regions or tiers for customers being able to graduate from a secured card.
There is no difference between urban and rural banks for customers being able to graduate from a secured card.
Question IX D-5a. If yes, how?
Sixty-six banks respondents described how cardholders can graduate from a secured credit card to a traditional credit card.
Banks explained that this transition is possible when customers establish an acceptable credit history. Accounts must be in good standing, and customers need to make payments on time for a particular period of time, depending on each bank’s policy. In doing so, individuals can improve their credit score to satisfy the bank’s specific standards. Variations in the length of time required for assessment by banks are as follows:
Thirteen banks reported that they permit individuals to apply for a traditional credit card after 12 months of good standing.
Four banks require 18 months of good standing.
Two banks require 22 months of good standing.
Four banks require 24 months of good standing
Three banks require between 6 and 24 months of good standing, depending on each customer’s circumstances.
In addition, banks that only offer credit cards through a third party report having no control over such situations because all decisions are made at the discretion of the third-party provider.

278 Credit Products FDICBankSurvey_Report_204pjg.doc